the Creative Commons Attribution 4.0 License.
the Creative Commons Attribution 4.0 License.
 | 01 Mar 2022
Assessing tropical cyclone compound flood risk using hydrodynamic modelling: a case study in Haikou City, China
Qing Liu
Hanqing Xu
Jun Wang
The co-occurrence of storm tide and rainstorm during tropical cyclones (TCs) can lead to compound flooding in low-lying coastal regions. The assessment of TC compound flood risk can provide vital insight for research on coastal flooding prevention. This study investigates TC compound flooding by constructing a storm surge model and overland flooding model using Delft3D Flexible Mesh (DFM), illustrating the serious consequences from the perspective of storm tide. Based on the probability distribution of storm tide, this study regards TC1415 as the 100-year event, TC6311 as the 50-year event, TC8616 as the 25-year event, TC8007 as the 10-year event, and TC7109 as the 5-year event. The results indicate that the coastal area is a major floodplain, primarily due to storm tide, with the inundation severity positively correlated with the height of the storm tide. For 100-year TC event, the inundation area with a depth above 1.0 m increases by approximately 2.5 times when compared with 5-year TC event. Comparing single-driven flood (storm tide flooding and rainstorm inundation) and compound flood hazards shows that simply accumulating every single-driven flood hazard to define the compound flood hazard may cause underestimation.
- Article
(7563 KB) - Full-text XML
- BibTeX
- EndNote


Flood hazards, especially those happening during tropical cyclones (TCs), have become the most devastating and expensive natural hazards in coastal cities (Patricola and Wehner, 2018; van Oldenborgh et al., 2017; Hallegatte et al., 2013; Adelekan, 2011). Storm tides brought on by TCs can lead to coastal flooding, and rainstorms occurring during TCs can lead to urban inundation. The simultaneous or consecutive occurrence of storm tide and rainstorm in time and/or space can lead to compound flooding (Gori et al., 2020b; Wahl et al., 2015; Leonard et al., 2014). In the past decade, many compound flood hazards occurred in coastal regions worldwide due to TCs, such as Typhoon Irma (2017) in Jacksonville and Typhoon Lekima on the southeast coast of China. An extremely destructive flood event in Houston–Galveston during Hurricane Harvey (2017) was confirmed to be a compound flood hazard (Huang et al., 2021). It was caused by land-derived runoff (mainly considered to be rainfall) and ocean-derived forcing (mainly considered to be storm tide) (Valle-Levinson et al., 2020). The coastal region suffered a major economic loss of more than USD 125 billion from Harvey. Thus, it is important to investigate the compound flood risk during TCs to comprehend flood hazards in coastal cities better.
The projection of future climate change indicates that TCs will occur more frequently with greater intensity. Accordingly, the likelihood of the co-occurrence of storm tide and rainstorm will increase drastically (Keellings and Hernández Ayala, 2019; Marsooli et al., 2019; Emanuel, 2017; Lin et al., 2012), which may cause more extreme compound flood hazards (Bevacqua et al., 2019; Rasmussen et al., 2018; Wahl et al., 2015; Milly et al., 2002). Due to global warming, sea-level rise, land subsidence, and urban expansion, coastal cities are confronted with the critical threat of TC compound flooding (Yin et al., 2021, 2020; Wang and Tan, 2021; Hsiao et al., 2021; Wang et al., 2018). Recent studies evaluated compound flood risk at the regional scale (Fang et al., 2021; Bevacqua et al., 2019; Hendry et al., 2019; Budiyono et al., 2016; Wahl et al., 2015). Wahl et al. (2015) assessed the risk of compound flooding from rainfall and storm surge in major US cities. Bevacqua et al. (2019) estimated the probability of compound flooding from precipitation and storm surge in Europe. Both studies showed that there would be an increase in compound flood risk in coastal cities in the future. A study conducted by Fang et al. (2021) investigated the compound flood potential from precipitation and storm surge in coastal China, indicating that low-latitude (<30∘ N) coastal areas in southeast China are more prone to compound flood hazards from storm tide and rainfall during TCs.
Only several urban-scale studies on compound flooding have been carried out in China (He et al., 2020; Wang et al., 2018; Xu et al., 2018; Yin et al., 2016). Lian et al. (2013) investigated the joint impact of rainfall and tidal level on flood risk in Fuzhou City. Xu et al. (2014) analysed the joint probability of rainfall and storm tide under changing environment, concluding that the probability of compound flooding would increase by more than 300 % in Fuzhou. Lian et al. (2017) identified the major hazard-causing factors of compound flooding and classified the floodplains into tidal, hydrological, and transition zones in Haikou City. Although studies such as these have investigated the joint risk of hazard-causing factors in compound floods, they seldom pay attention to the compound flooding that occurs during TCs.
Most studies concerned with compound flooding rely on historical data, which contains information on hourly storm tide and daily rainfall (Yum et al., 2021; Fang et al., 2021; Zellou and Rahali, 2019; Wu et al., 2018; Lian et al., 2017). The recorded data are often used to investigate the statistical correlation between flood drivers (Xu et al., 2019, 2014, 2018; Lian et al., 2013). For example, based on the recorded storm tide from 49 tide gauges and daily precipitation from 4890 rainfall stations in Australia, Zheng et al. (2013) quantified the dependence between rainfall and storm surge to investigate flood risk in coastal zones. However, for many coastal regions in the world, it is difficult to obtain sufficient recorded data that can be used to analyse the mechanism of TC compound flooding from storm tide and rainfall. An alternative approach is applying a hydrodynamic model to simulate storm tides (Gori et al., 2020a). For example, Yin et al. (2021) constructed a storm surge model to simulate the storm tide derived from 5000 synthetic TCs to estimate TC-induced coastal flood inundation.
Hydrodynamic models can also be employed to simulate flood events (Bevacqua et al., 2019; Zellou and Rahali, 2019; Kumbier et al., 2018). It is an effective method to model the flood extent and inundation depth, and this method has generally been applied in research on single-driven flood hazards (Wang et al., 2018, 2012; Yin et al., 2013). Recently, many studies have used hydrodynamic models to simulate compound flood events driven by historical TC events or synthetic TC scenarios (Bilskie et al., 2021; Orton et al., 2020; Santiago-Collazo et al., 2019; Shen et al., 2019). Gori et al. (2020b) constructed a coupled framework of three models to simulate storm surges and compound flood events. This method has the advantage of observing the spatiotemporal dynamics of rainfall and storm surges during TCs (Gori et al., 2020b; Orton et al., 2020). However, assessing the compound flood risk by constructing a coupled model is not commonly used in current studies on compound flood hazards, mainly because the simulation of compound flooding involves multiple driving condition settings and requires combining multiple physics-based models.
Delft3D Flexible Mesh (DFM), developed by Deltares, the Netherlands, has been widely applied to build storm-surge numerical models for research on storm surge because of its capability of simulating 2D and 3D shallow water flow (De Goede, 2020). It integrates Delft3D-FLOW model suites and uses flexible unstructured grids, convenient for partial grid refinement (Deltares, 2018). A recent study on compound flooding utilized this model to simulate storm surges for characterizing extreme sea levels, investigating the probability of compound floods from precipitation and storm surge in Europe (Bevacqua et al., 2019). Meijer and Hutten (2018) developed a 2D urban model with DFM for the downtown area of Shanghai. The results indicated that DFM was capable of modelling rainfall–runoff and could be used to construct urban flood models. Therefore, it is feasible to simulate storm surge and rainfall–runoff based on DFM to assess compound flooding.
This study investigates the compound effect of flooding from storm tide and rainstorm during TCs in Haikou. We set up a storm surge model and overland flooding model based on the DFM model to simulate the floodplain under TC events. We select 66 TC events that influenced Haikou to explore the probability distribution of storm tide, further selecting 5 TC events that correspond to the 5-, 10-, 25-, 50-, and 100-year return periods, respectively. The risks of rainstorm inundation, storm tide flooding, and compound flooding are quantitatively assessed and compared based on the simulation results under different return periods. The conclusions drawn from this study can provide insight into mitigating compound flood risk in coastal areas.
To the best of our knowledge, this is the first study that applies a coupled model by DFM to assess TC compound flood risk in Haikou. The objectives of this study include (1) investigating the probability of storm tide during TCs by modelling TCs influenced Haikou; (2) quantifying the compound effects of rainfall and storm surge under TC events of different return periods; (3) assessing and comparing the flood severity of rainstorm inundation, storm tide flooding, and compound flooding.
This paper is organized as follows: Sect. 2 presents the background information about the study area and data requirements. Section 3 describes the model configuration and explains how TCs that influenced Haikou were selected. The method of how to assess the compound flood risk is also in this section. Model verification and the analysis of probability distribution of storm tide are reported and discussed in Sect. 4. The assessment and comparison of rainstorm inundation, storm tide flooding, and compound flooding are also discussed in this section. Finally, conclusions are given in Sect. 5.
2.1 Study area
Haikou is located in the north of Hainan Island, China, where the geographical position is relatively independent (Fig. 1). The coastal area of Haikou is low and flat. In particular, the elevation of downstream plain and areas along Nandu River (in Fig. 1) is less than 3.0 m. Haikou is frequently affected by TCs and rainstorms from June to October. The annual rainfall is around 1660 mm. Storm tide flooding caused by TCs is one of the main natural hazards in Haikou, roughly three storm surges have occurred in Haikou every year in recent decades. The combination of storm tide and rainstorm will increase the probability of extreme compound flooding, posing a threat to social infrastructure and urban traffic in Haikou. For example, during Typhoon Kalmaegi (2014), a total of 219.8 mm (24 h) of precipitation was produced and the highest tide level reached 4.3 m in Haikou. The occurrence of heavy rainfall and strong storm tide caused serious compound flooding with an economic loss of USD 220 million. Under the changing environment, Haikou will face greater compound flooding risks and challenges from TCs, storm surges, and rainstorms in the future.
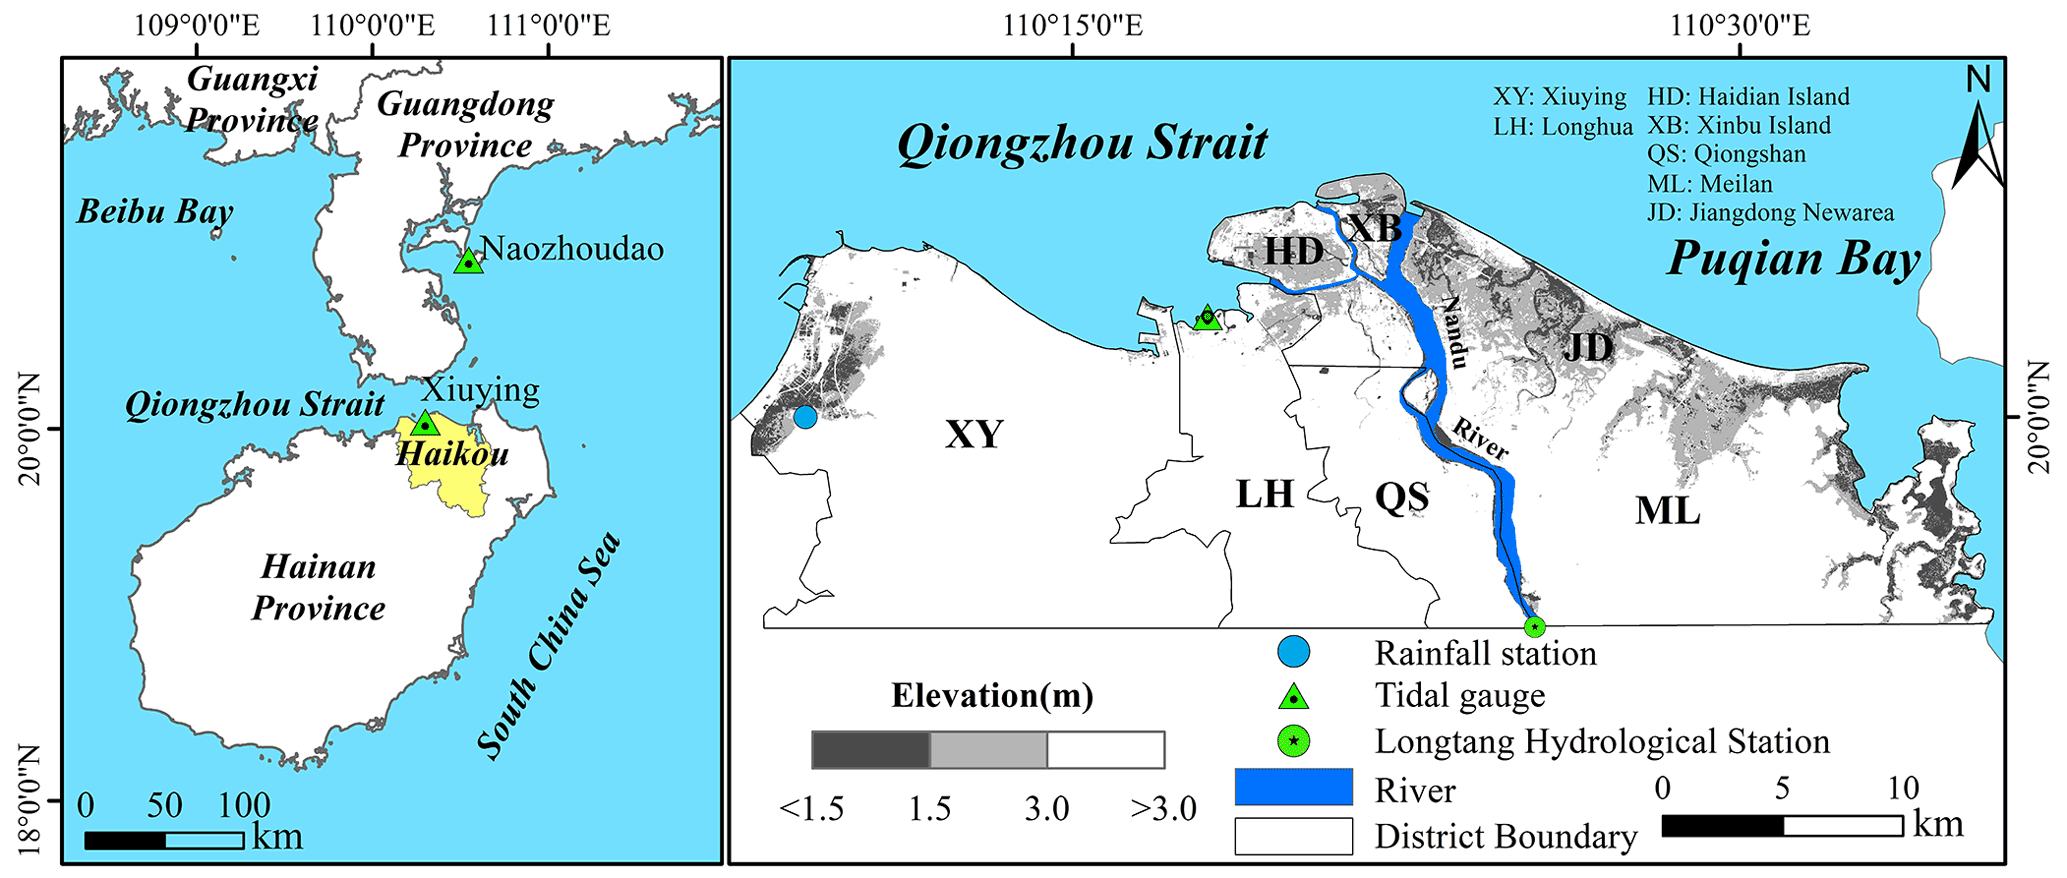
Figure 1The geographic location of tide stations and Nandu River in Haikou and the basic geographic information of Haikou.
2.2 Data
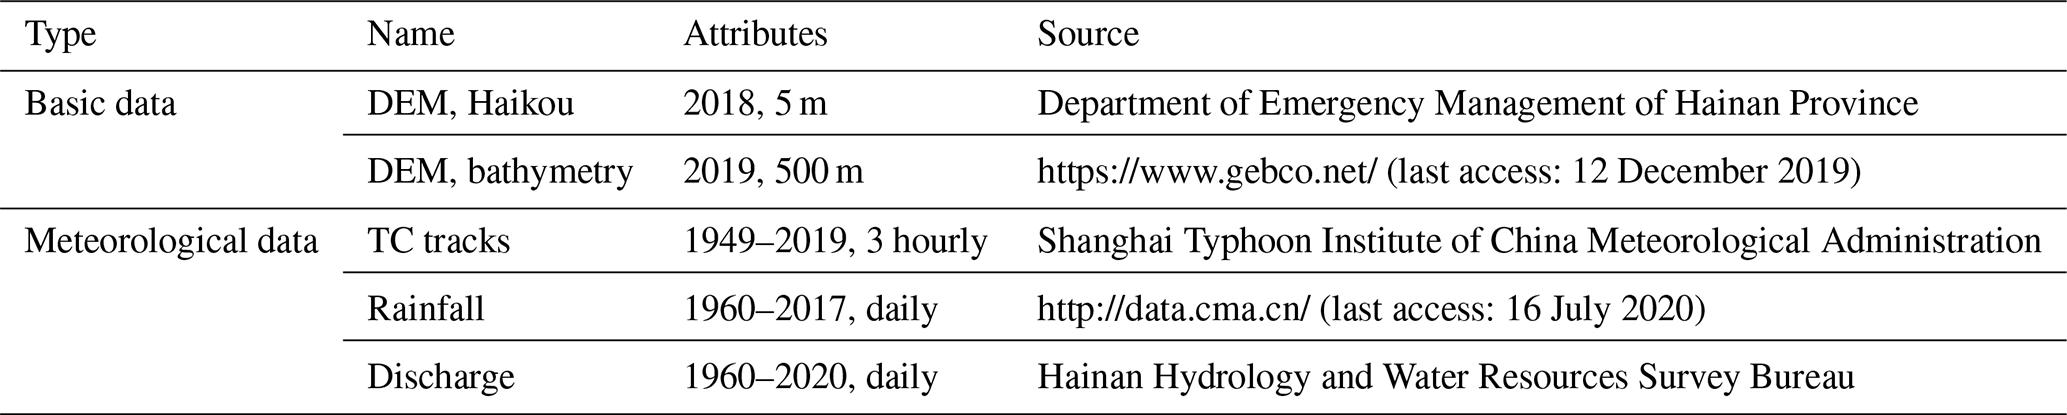
The geographic and meteorological data of the study area were systematically collected in this study (Table 1). The topographic map of the study area was provided by Hainan Emergency Management Department, and the bathymetry data of South China Sea and Beibu Bay were obtained from General Bathymetric Chart of the Oceans (GEBCO). The spatial resolution of the topographic map is 5 m, and the bathymetry data are 500 m. The meteorological data include historical TC track data and daily rainfall data from 1960 to 2017. The historical TC track data containing the TCs location (latitude and longitude), 2 min mean maximum sustained wind (MSW; m s−1), and minimum pressure (hPa) near the TC centre were provided by Shanghai Typhoon Institute of China Meteorological Administration. The daily rainfall data of Haikou were downloaded from the CMA website (http://data.cma.cn/, last access: 16 July 2020) and can be transferred to hourly rainfall by interpolation for inundation simulation (Ye et al., 2018; Yang et al., 2013). The annual river discharges at Longtang hydrological station from 1960 to 2020 were provided by Hainan Hydrology and Water Resources Survey Bureau.
3.1 Model configuration and validation methods
Delft3D Flexible Mesh (DFM), developed by Deltares in 2011, is a practical unstructured shallow water flow calculation model (De Goede, 2020). It can be used for ocean hydrodynamic and surface runoff numerical simulations (Kumbier et al., 2018; Meijer and Hutten, 2018). In this study, the DFM model was established to calculate the hydraulic boundary conditions needed to estimate the overland flow boundary and simulate the overland inundation during the TC period (Gori et al., 2020b).
3.1.1 Storm surge model
The calculation domain of the storm surge model covers Hainan Province, the South East Sea, and Beibu Bay and roughly ranges from 15 to 24.5∘ N and 105.5 to 118.5∘ E (Fig. 1). The minimum mesh grid size is 100 m, and the maximum mesh grid size is 12 000 m. The astronomical tide is simulated by importing the phase and amplitude of tidal constituents (Q1, P1, O1, K1, N2, M2, S2, and K2) extracted from the global tidal model (TPXO8.0). A built-in module in Delft3D WES (Wind Enhance Scheme) module is employed to calculate the TC wind field according to Holland's formula (Holland, 1980). We use the statistical measures RMSE (root mean square error) and R2 to evaluate the model performance of simulated tide (Kumbier et al., 2018; Skinner et al., 2015). The storm surge model is validated against measured astronomical tides and storm tides (astronomical tide plus storm surge). Storm tide series (TC1415, “Kalmaegi”) at Xiuying gauge station were collected from Haikou Municipal Water Authority to validate this model. For the validation of astronomical tide, we also collected astronomical tide for TC1415 from Xiuying and Naozhoudao tide gauge station. All tide levels were recorded every hour (from 00:00 on 15 September 2014 to 00:00 on 17 September 2014).
3.1.2 Overland flooding model
The overland flooding model combines regular and irregular triangular mesh. This model is a surface runoff numerical model, and the mesh grid resolution is set as 50 m. The high-resolution topography of study area is imported in the model, and it can roughly reflect the effect of seawall. The average annual discharge (165.81 m3 s−1) at Longtang hydrological station is calculated as the upstream boundary condition. In this model, the storm tide series extracted from the storm surge model serve as the coastal boundary conditions. This model is validated against the measured inundation area and depth. We collect the inundation data of TC1415 and conduct fieldwork in Haikou to validate this model. The overland inundation model can be approximately validated by comparing the inundation map of TC1415 with measured inundation area and depth.
3.2 TCs influencing Haikou
The TCs that pass through the region (18–22∘ N, 109–113∘ E) and stay over 24 h have an apparent effect on Haikou (Ding, 1999; Wang et al., 1998; He, 1988). According to this, we analyse historical TC tracks and give the priority to the TC passing between latitudes 18 and 22∘ N and longitudes 109 and 113∘ E. TC tracks lasting less than 24 h in this region are removed in this study. Therefore, 66 TCs from 1960 to 2017 are selected in this study (Fig. 2), and we construct typhoon wind fields and simulate the storm tide of these TCs. Each TC event has a code; for example, the ninth typhoon in 1963 is coded as TC6309.
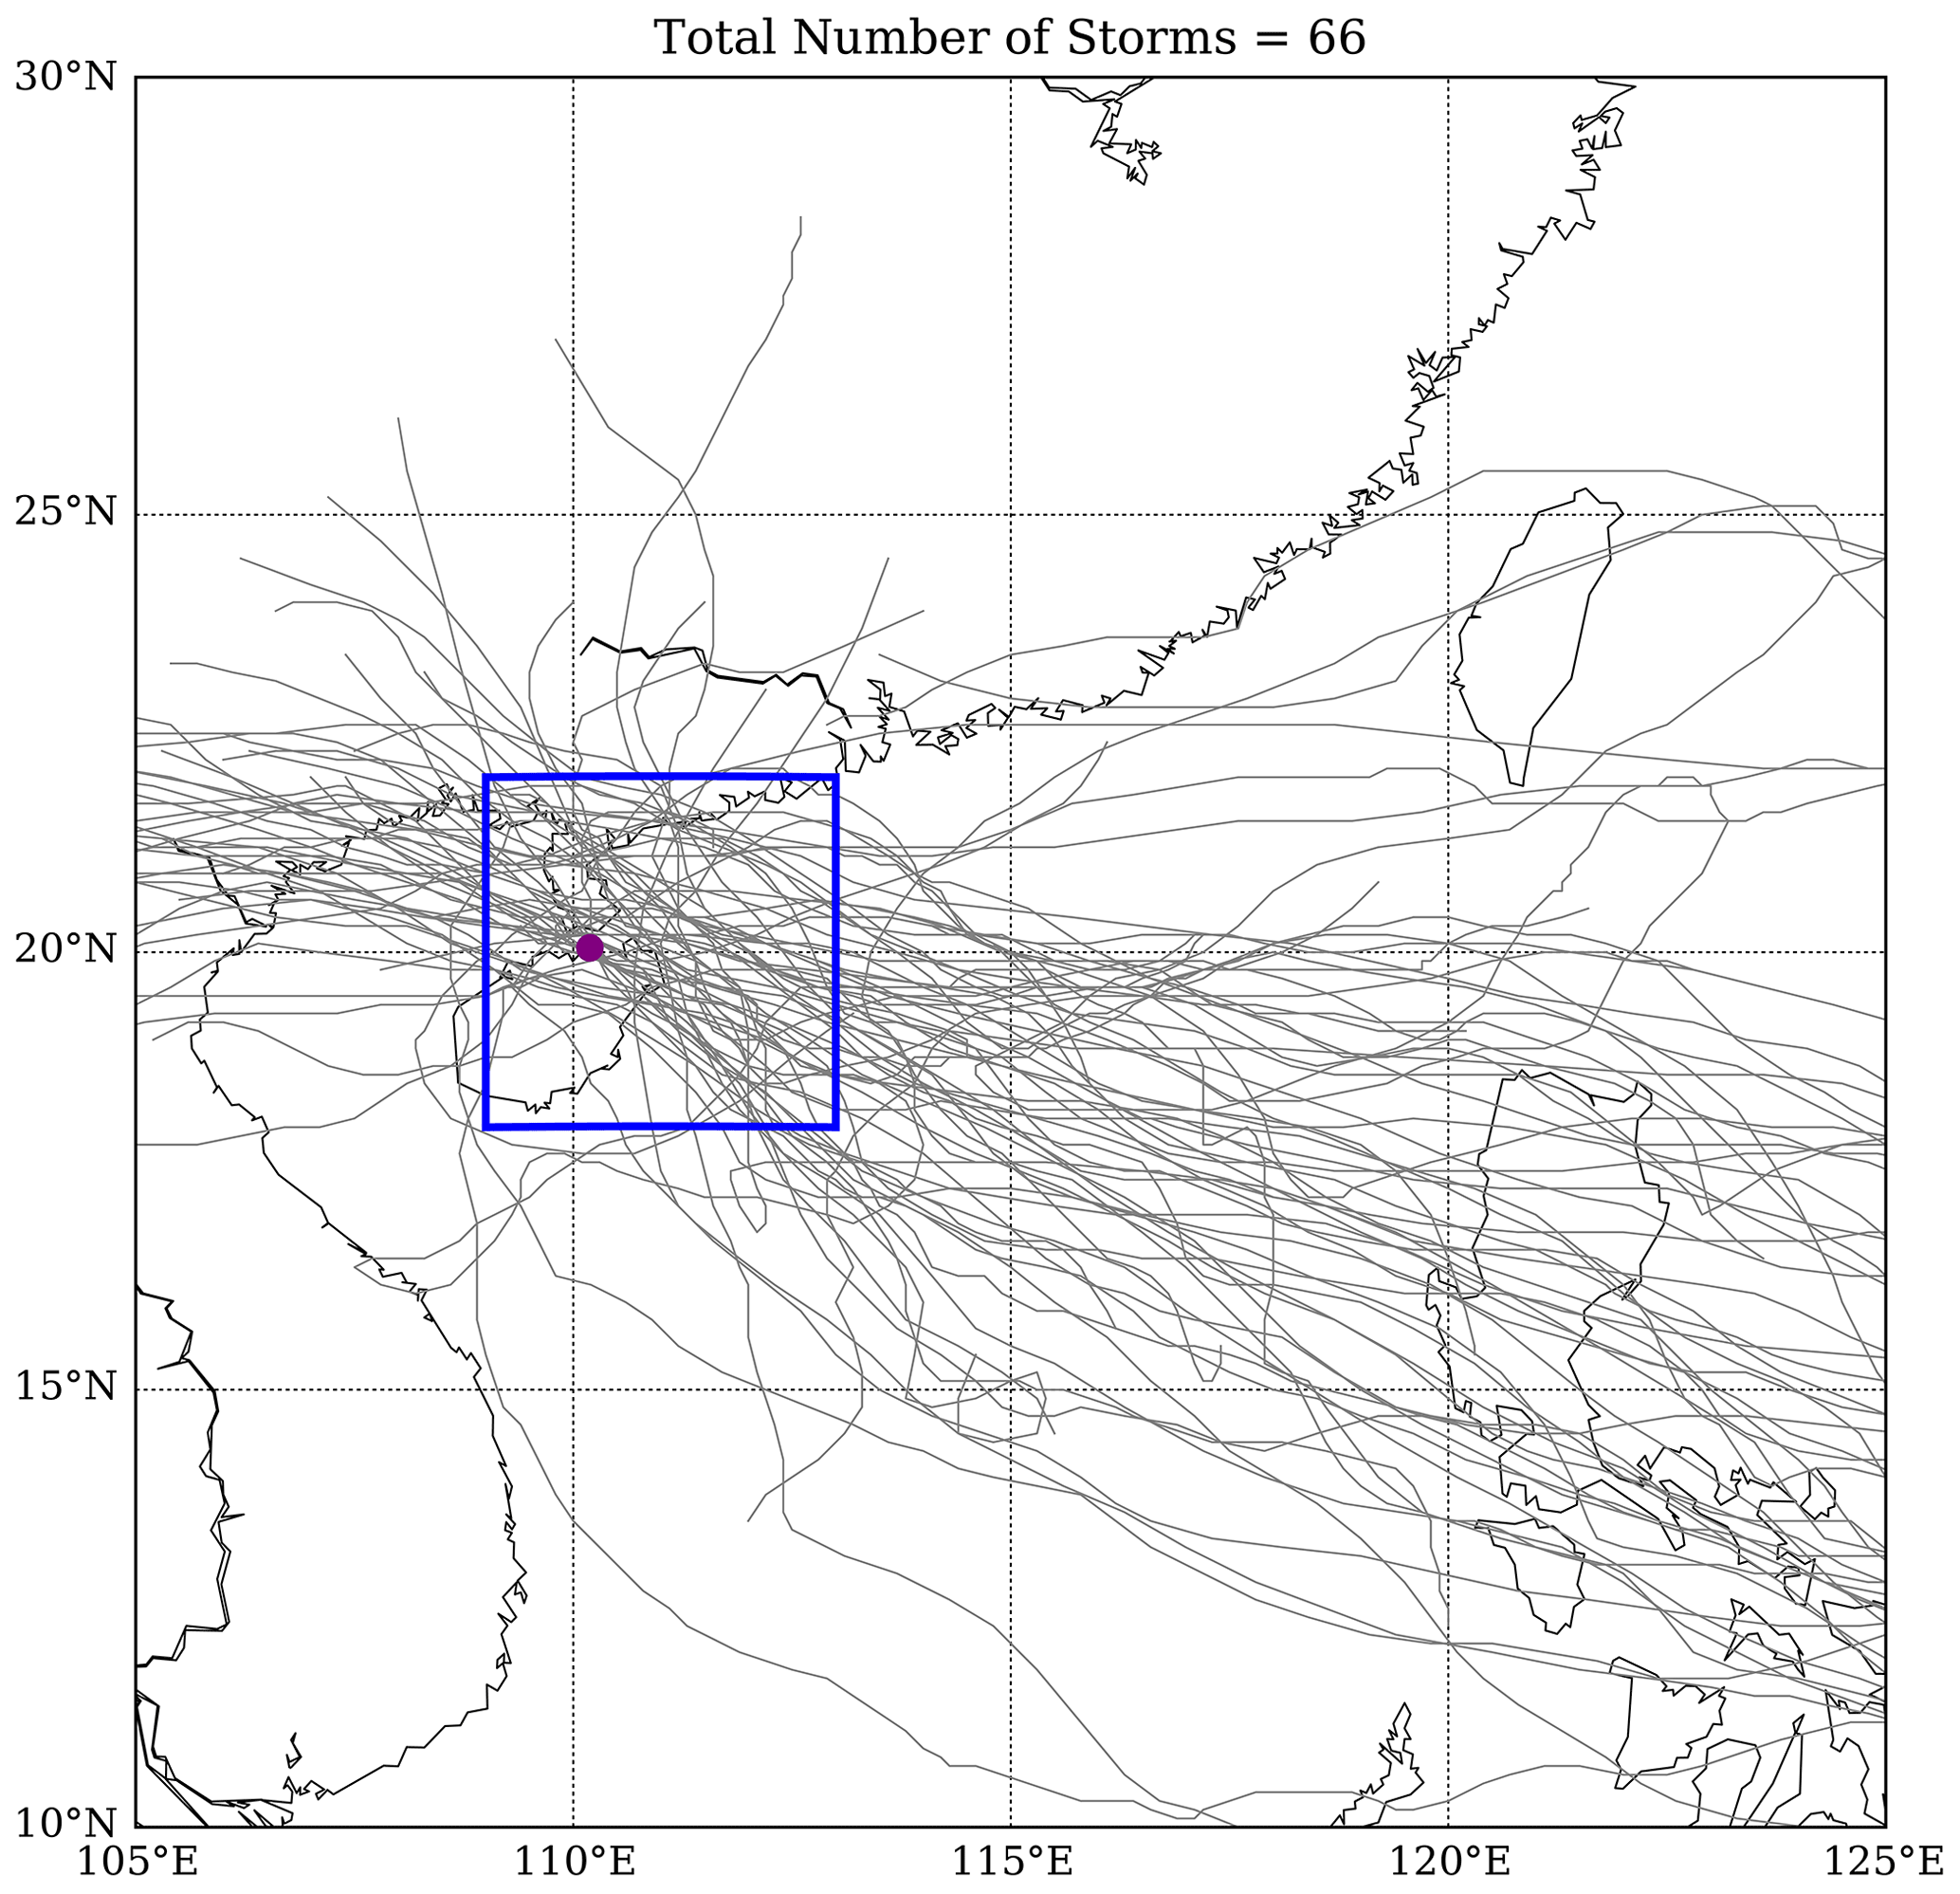
Figure 2Location map for the study area. Purple dot indicates the location of Haikou. Grey coloured lines indicate major historical TC tracks within the region. Blue box indicates the selection region (18–22∘ N, 109–113∘ E).
3.3 Compound flooding assessment
In this study, we investigate the probability distribution of storm tides to assess compound flood hazards. Based on the storm surge model, the storm tide series of 66 TCs are simulated. The highest storm tides during TCs are used to calculate the probability distribution function at Xiuying tide gauge station.
Exploring the storm tide distribution can offer comprehension of the probability of compound flood hazards from storm surge. Extreme value distribution (EVD) is widely applied to investigate storm tide probability distribution (Yum et al., 2021). We assume that the storm tide fits either Gumbel or Weibull extreme value functions, then calculate their function fitting parameters. We compare the goodness of fit of two distribution functions (Gumbel, Weibull) with Kolmogorov–Smirnov (K–S) test. K–S test is an appropriate method to explore the distribution of continuous random variables and can be used to select the best fitting distribution function. According to the storm tide distribution, we can achieve tide levels at different probabilities (P). We replace P with storm tide return periods (T), which is equal to , to investigate the possibility of an extreme storm tide. The corresponding TC events in 5-, 10-, 25-, 50-, and 100-year return periods can be found to compare the compound flood hazards with different storm tides.
4.1 Model validation
We use TC1415 to verify the astronomical tide and storm tide of the storm surge model. In the validation of astronomical tide, we use the predicted astronomical tide at two gauge stations: Naozhoudao (Zhanjiang, Guangdong) and Xiuying (Haikou, Hainan). The calculation results show that the RMSE is 0.18 and 0.14 m for Naozhoudao and Xiuying gauge station; the R2 values of both Naozhoudao and Xiuying gauge station are 0.91. Figure 3a and b depict simulated and predicted water level at Xiuying and Naozhoudao gauge station. The curves of simulated astronomical tide at the two stations fit observed tide level points well. Thus, this model has a good ability to simulate astronomical tides. In the validation of storm tide, we add the wind field of TC1415 in the model and only use the observed tide level at Xiuying gauge station for validation (Fig. 3c). The calculation of RMSE is 0.34 and R2 is 0.83. It can be seen from Fig. 3c that the curve of simulated storm tide is consistent with the observation, and the highest storm tide is well simulated.
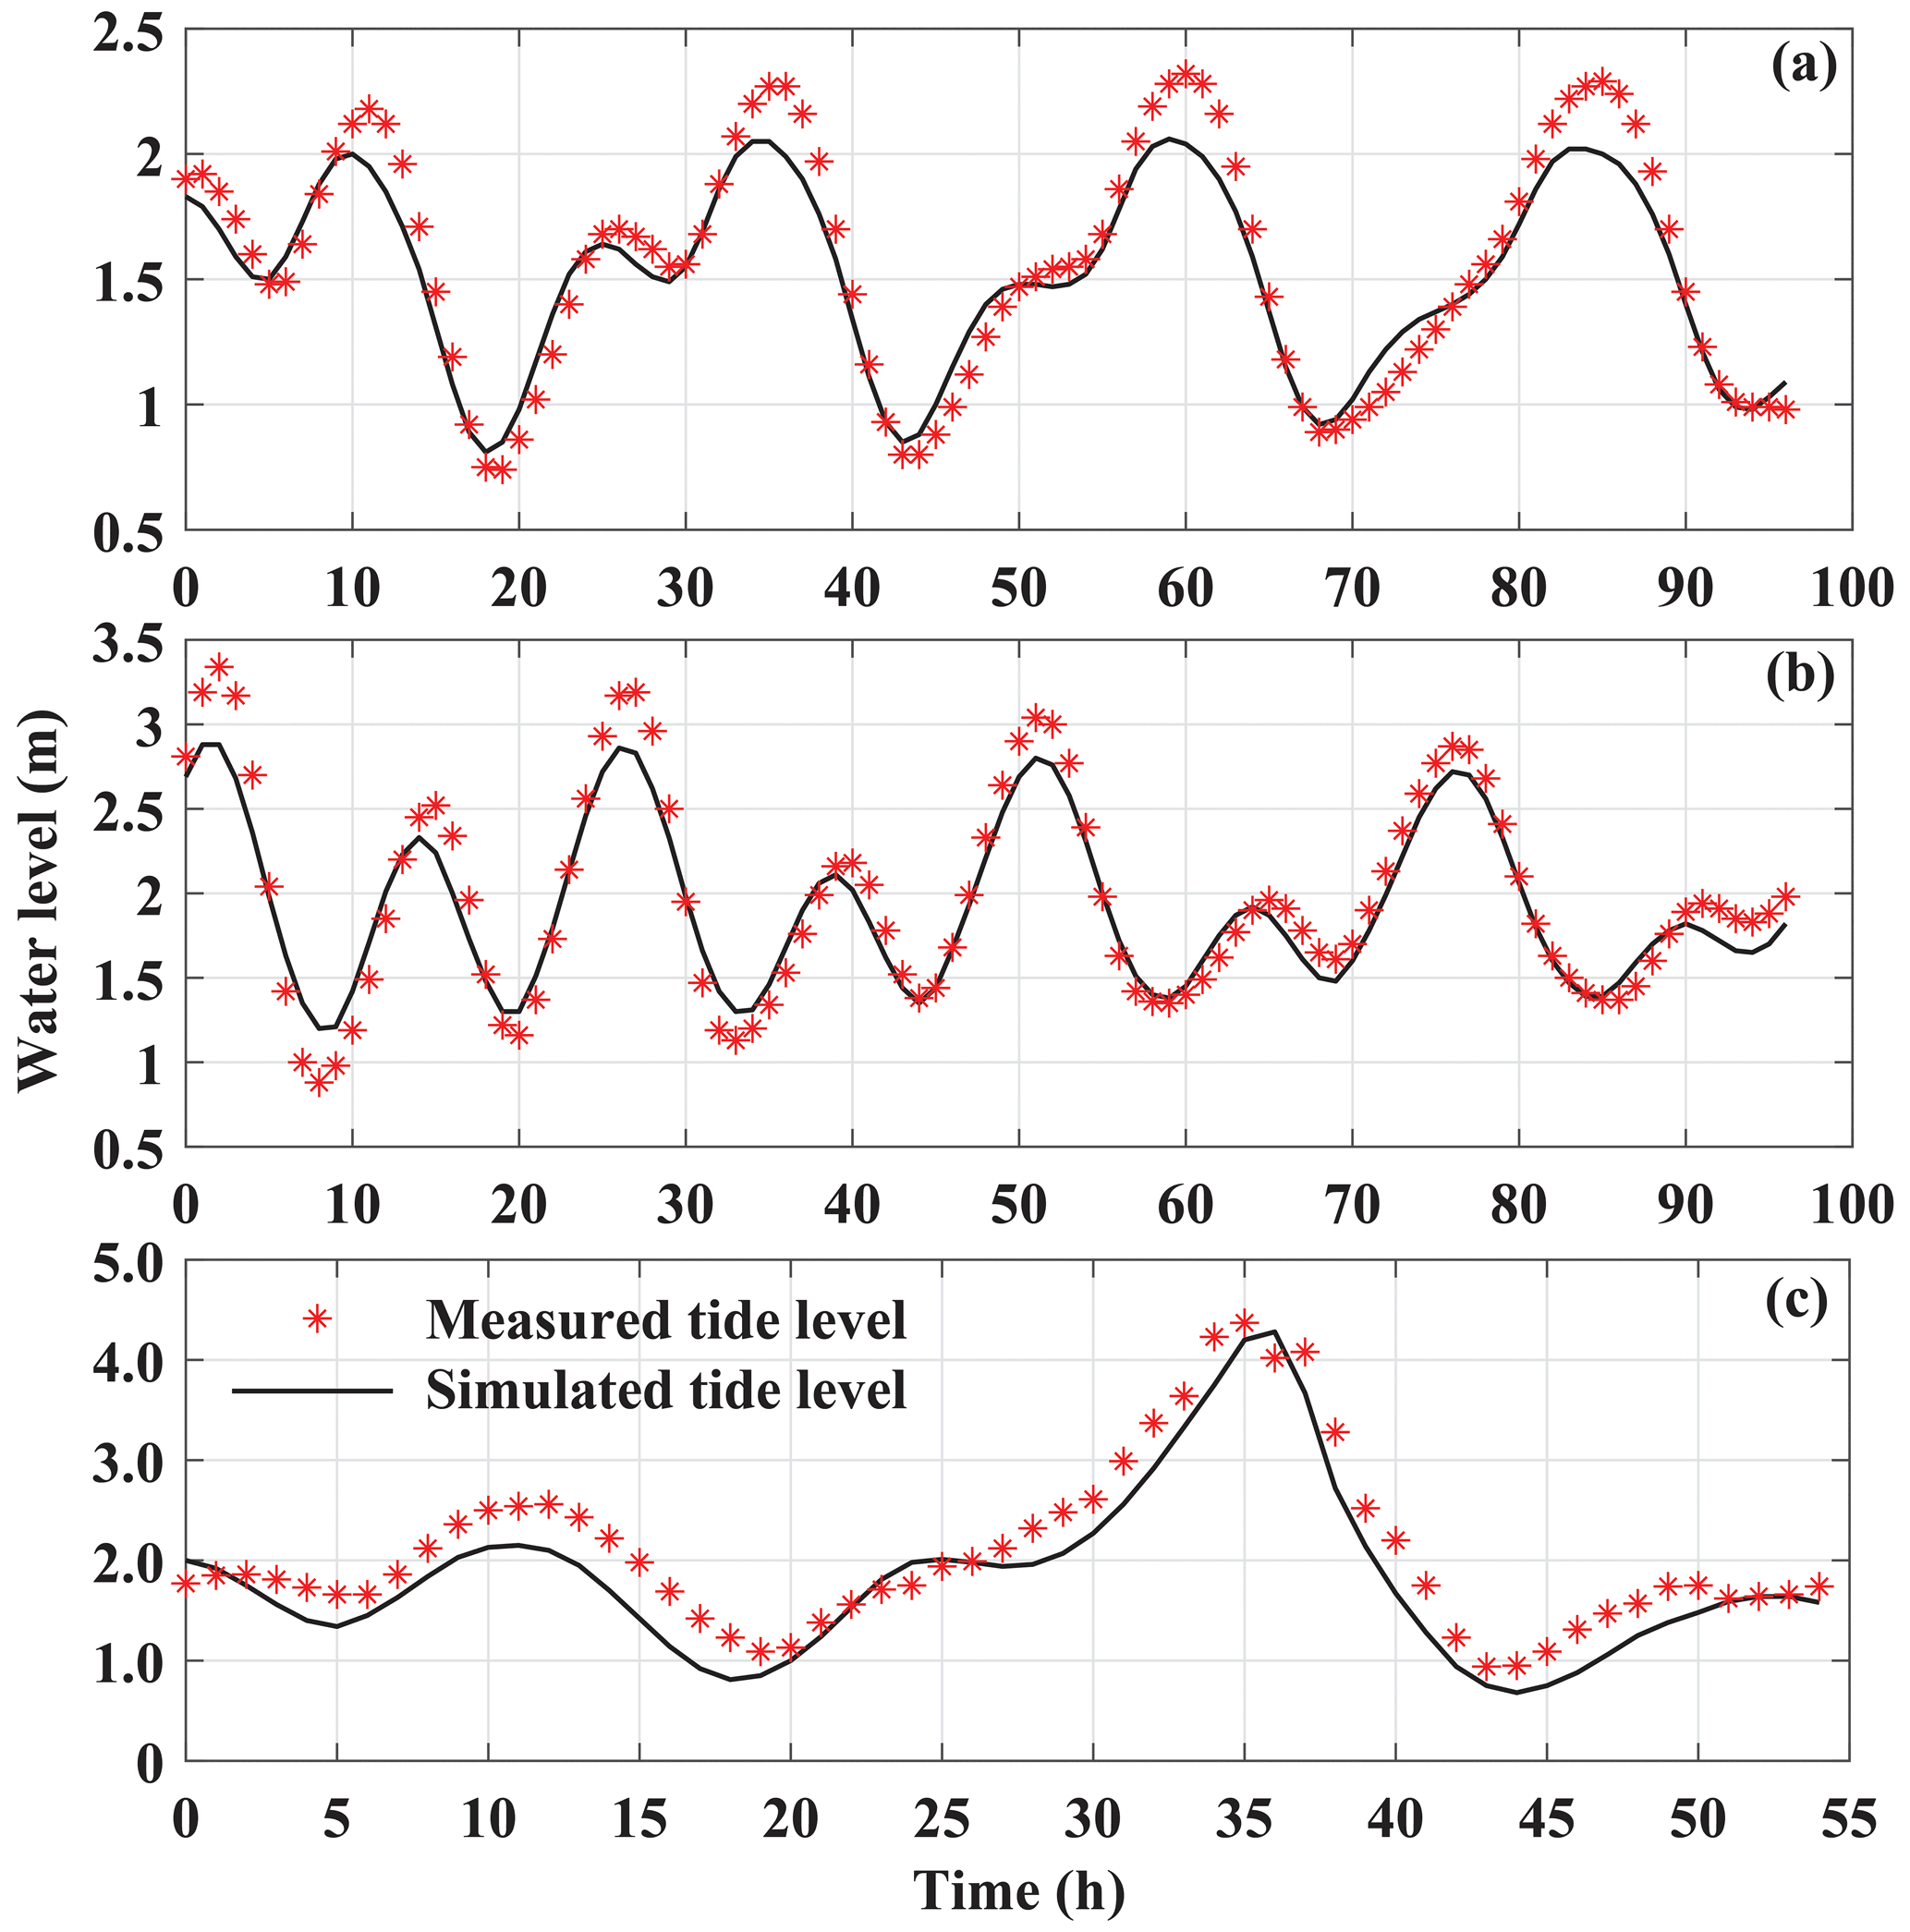
Figure 3The simulation results of astronomical tide and storm tide compared to measured tide levels. (a) Astronomical tide at Xiuying gauge station. (b) Astronomical tide at Naozhoudao gauge station. (c) Storm tide at Xiuying gauge station. Black lines indicate the simulated tide level; red asterisk points indicate measured tide level.
Tide levels along the coastline extracted from the storm surge model serve as coastal boundary conditions for the overland flooding model. We utilize the TC1415 event also to validate the overland flooding model. Comparing the simulation of compound flooding with the measured inundation of roads during TC1415 (Kuang and Zhang, 2014), the main inundation area in the simulation is coincident with the flooded roads (Fig. 4). Furthermore, the distribution of simulated inundation area is also consistent with the actual flood distribution. Hence this overland flooding model has a good capacity for modelling and demonstrating TC flood hazards.
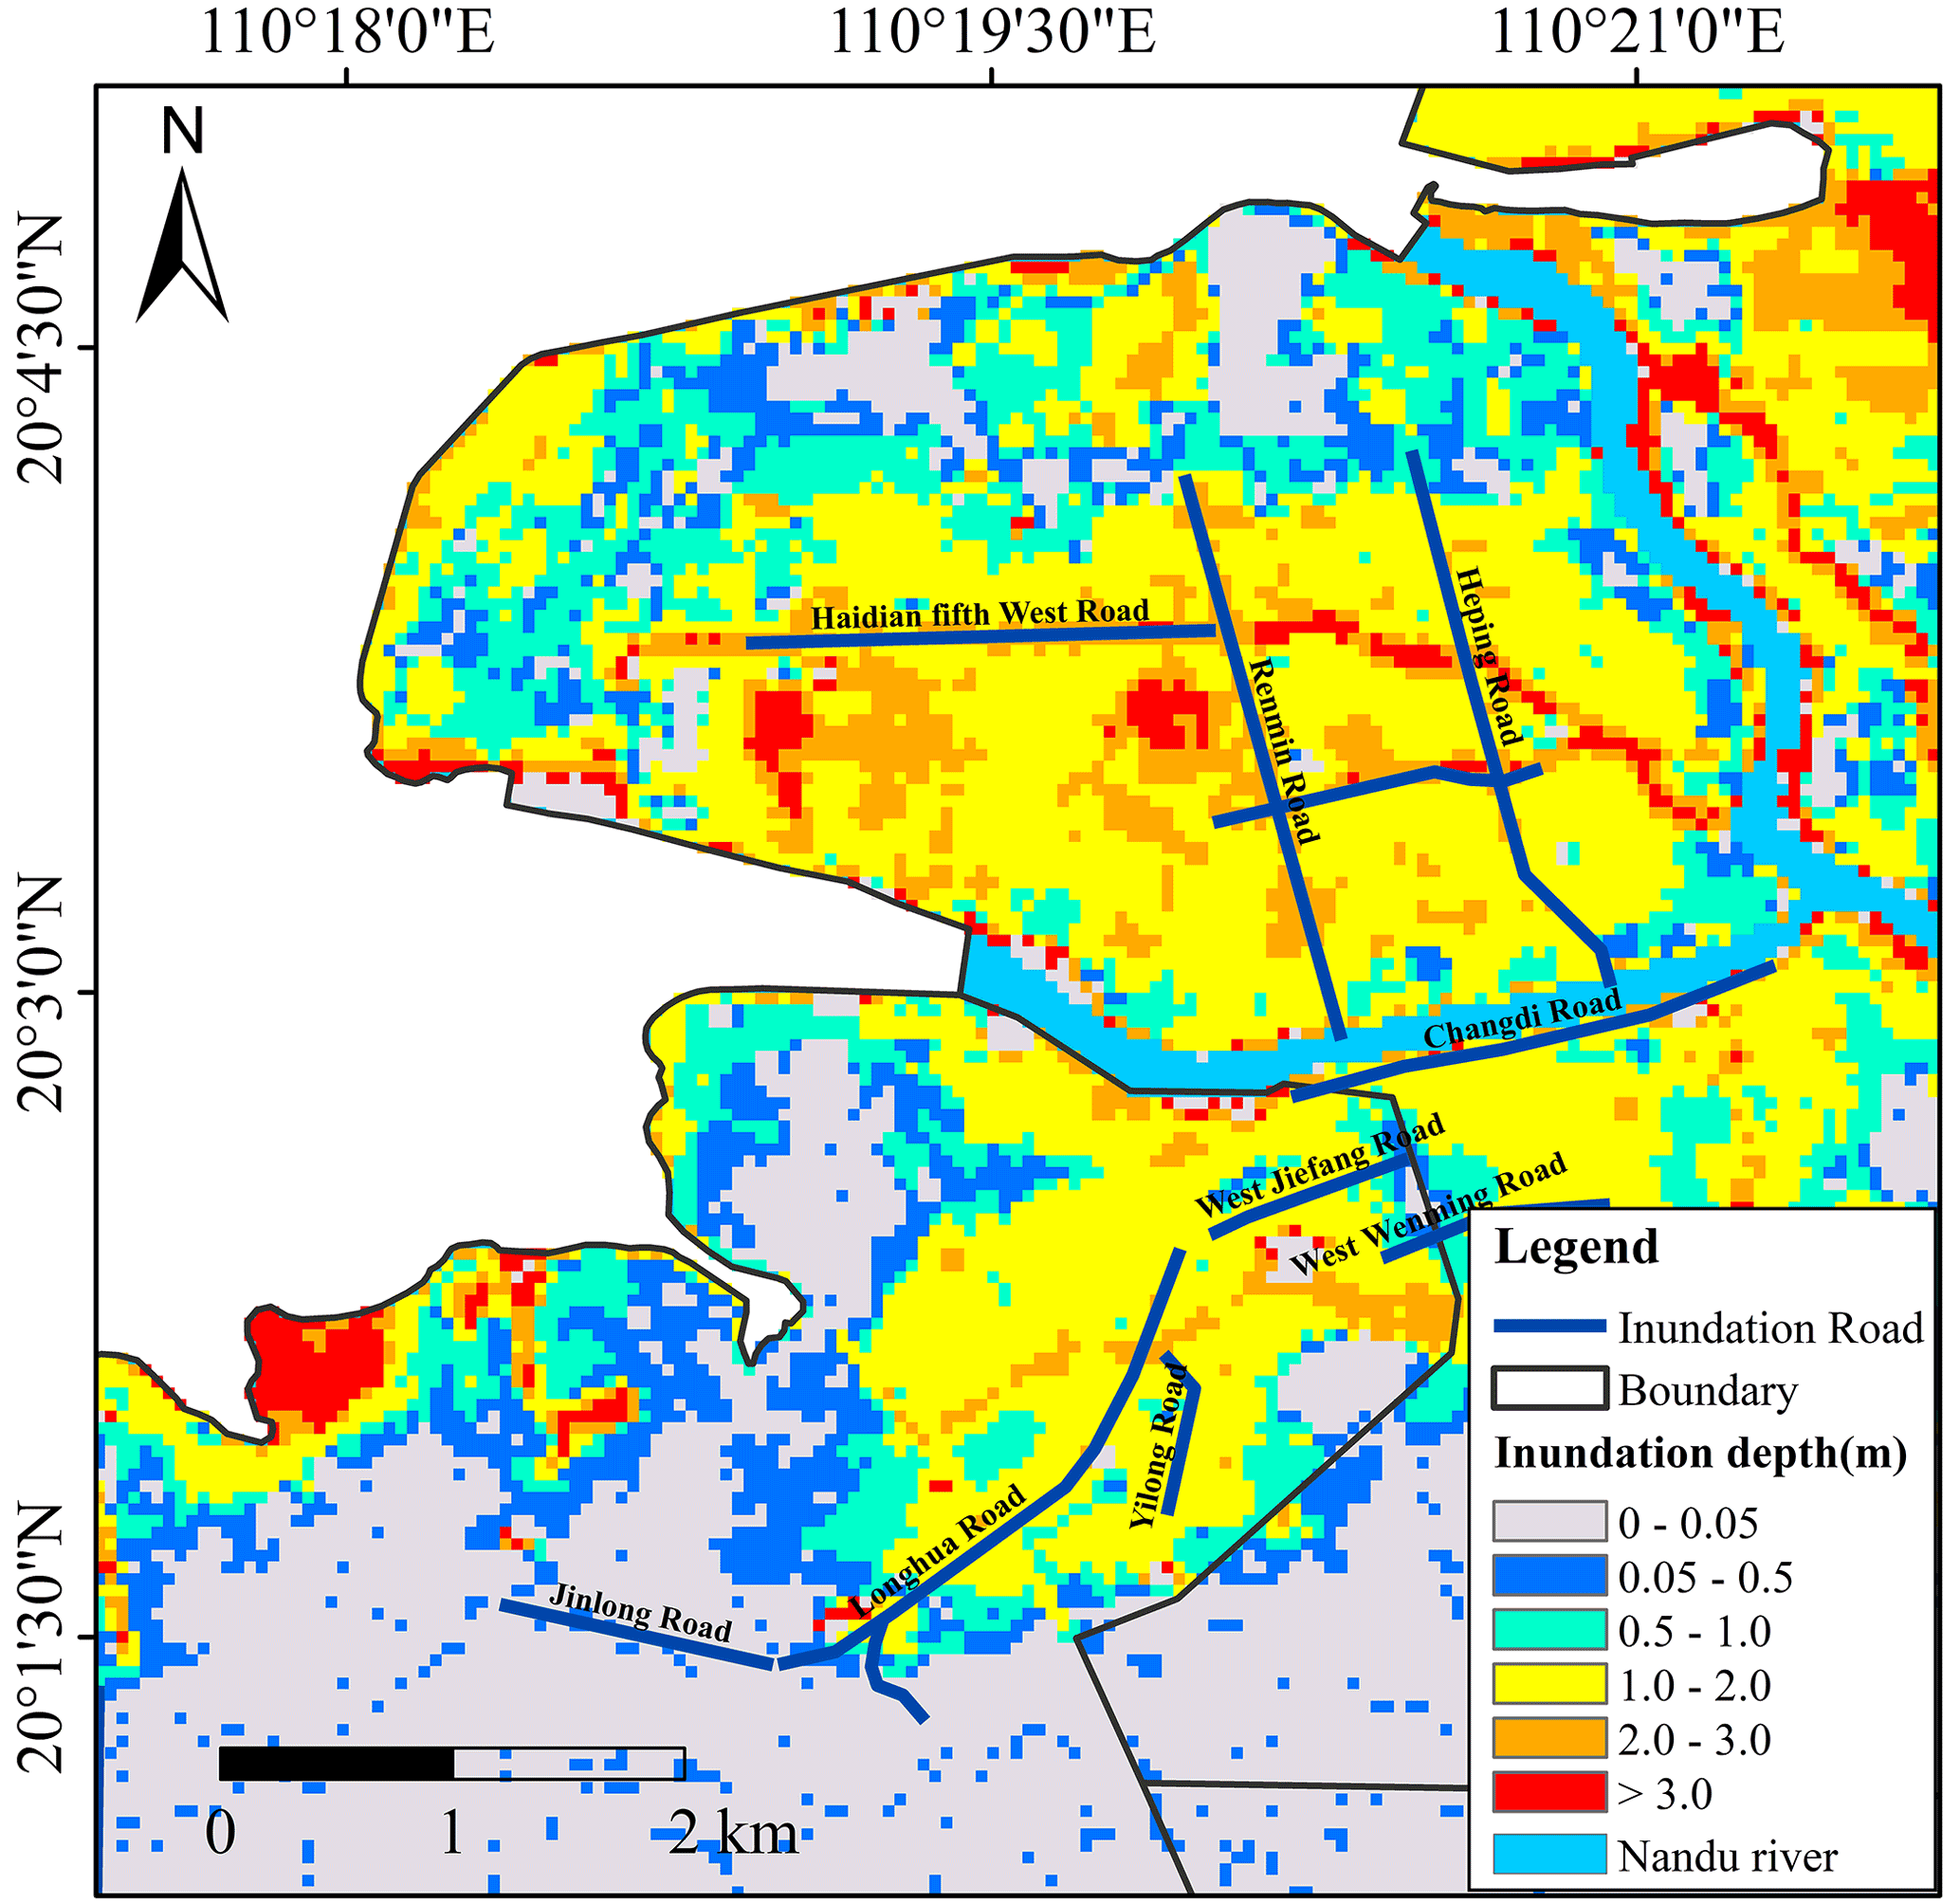
Figure 4Spatial extent of simulated and measured inundation area and depth during TC1415.
4.2 Storm tide probability distribution
Xiuying gauge station is selected as a representative location to examine the probability exceedance of TC storm tide. Storm tide return period is calculated based on the maximum storm tide in the past 58 years simulated for 66 TCs. The results of K–S test show that the D value and P value of GUM are 0.0615 and 0.9995, while the D value and P value of WEI are 0.0769 and 0.9876. Thus, the Gumbel extreme value (GEV) distribution function can fit TC storm tide better. Figure 5 shows that GEV fits storm tide well, presenting the corresponding TCs under different return periods. Red circles represent the maximum storm tide from the 66 TCs in the past. The solid line represents estimation of the GEV fitting.

Figure 5Storm tide at Xiuying gauge station as a function of return period based on GEV fitting (solid line).
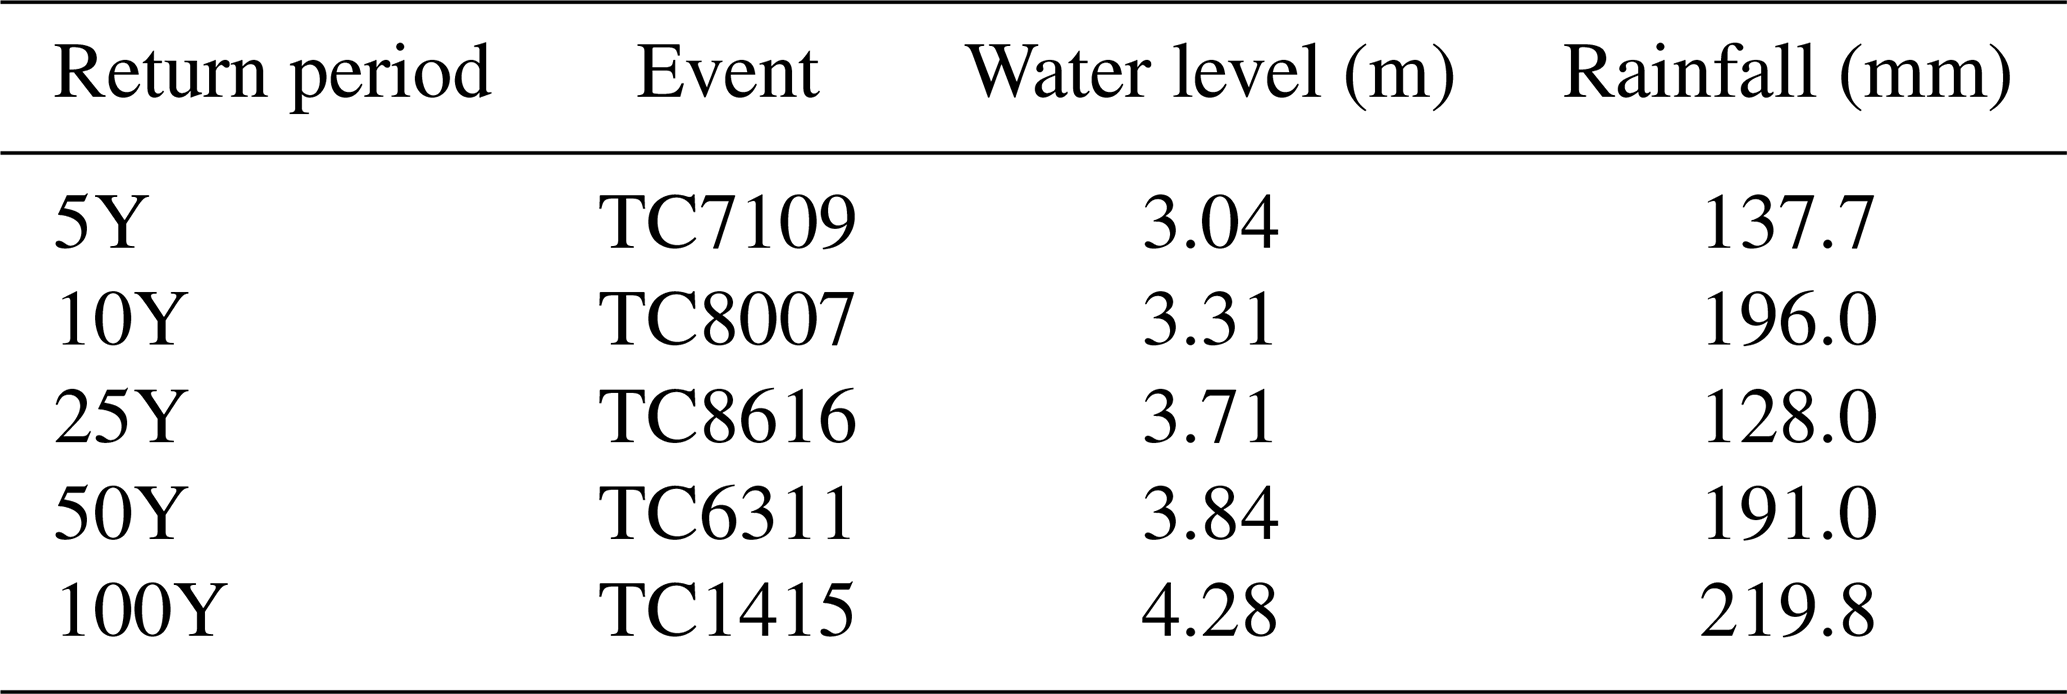
Table 2 shows the corresponding TC events and their highest storm tide and accumulated rainfall under different return periods. TC1415, with the highest storm tide, is considered a 100-year event. In order to investigate the compound effects of storm tide and rainstorm on the overland inundation, TCs with higher accumulated rainfall are selected. As a result, TC6311, TC8616, TC8007, and TC7109 are assigned to 50, 25, 10, and 5 years based on GEV fitting, respectively.
Table 2The different return periods of TC storm tide and the related TC events.
4.3 Compound flooding assessment in different storm tide return periods
Figure 6 presents the compound flood inundation maps under 5-, 10-, 25-, 50-, and 100-year return period. For the 5-year inundation map, the major inundation area is distributed along the Jiangdong New Area and Xinbu Island on the northeast coast. The inundation area with sporadic distribution is caused by rainfall in the inland urban area. As return periods increase, Haidian Island, north Longhua district, and northwest Xiuying district begin to have serious flood extents, and the compound flooding severity of Jiangdong New Area and Xinbu Island increases. For 100-year return period, the inundation depth regions are above 1.0 m, and the floodplain depth is above 3.0 m in most of Jiangdong New Area. Regions with inundation depth below 0.05 m are not evaluated in this study due to their low risk.
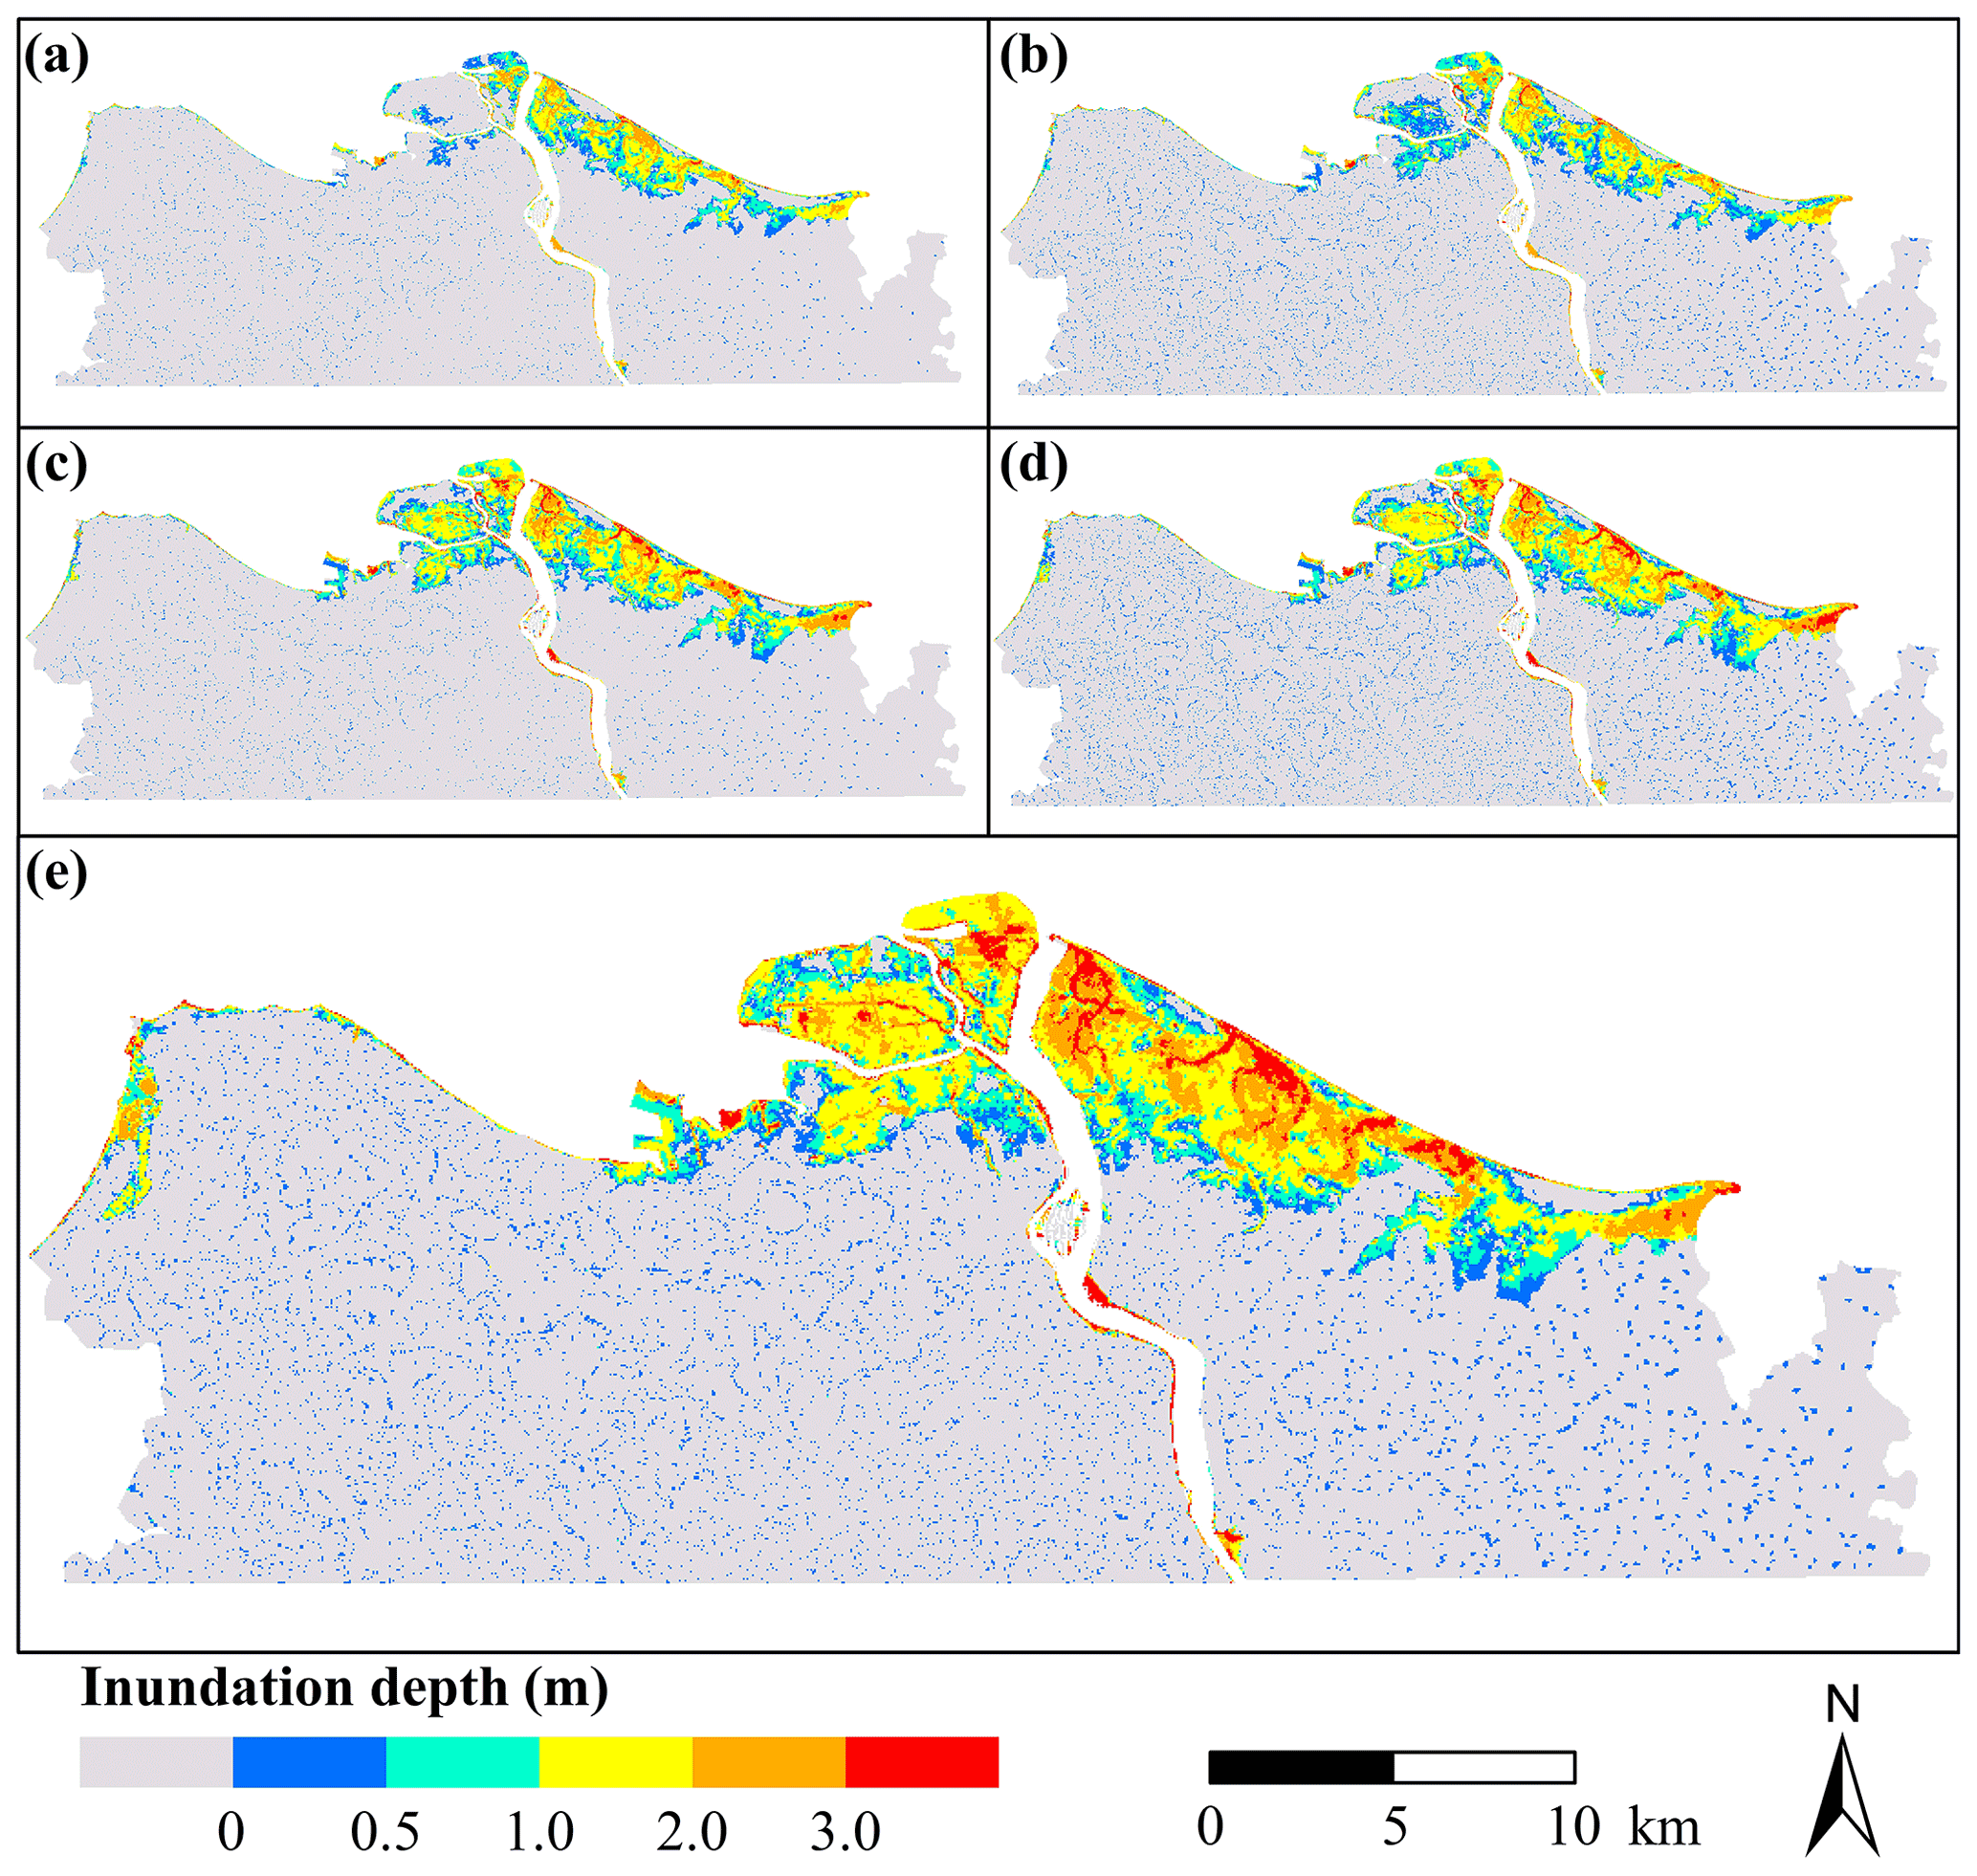
Figure 6The compound flood inundation maps under different return period: (a) 5-year event, (b) 10-year event, (c) 25-year event, (d) 50-year event, and (e) 100-year event.
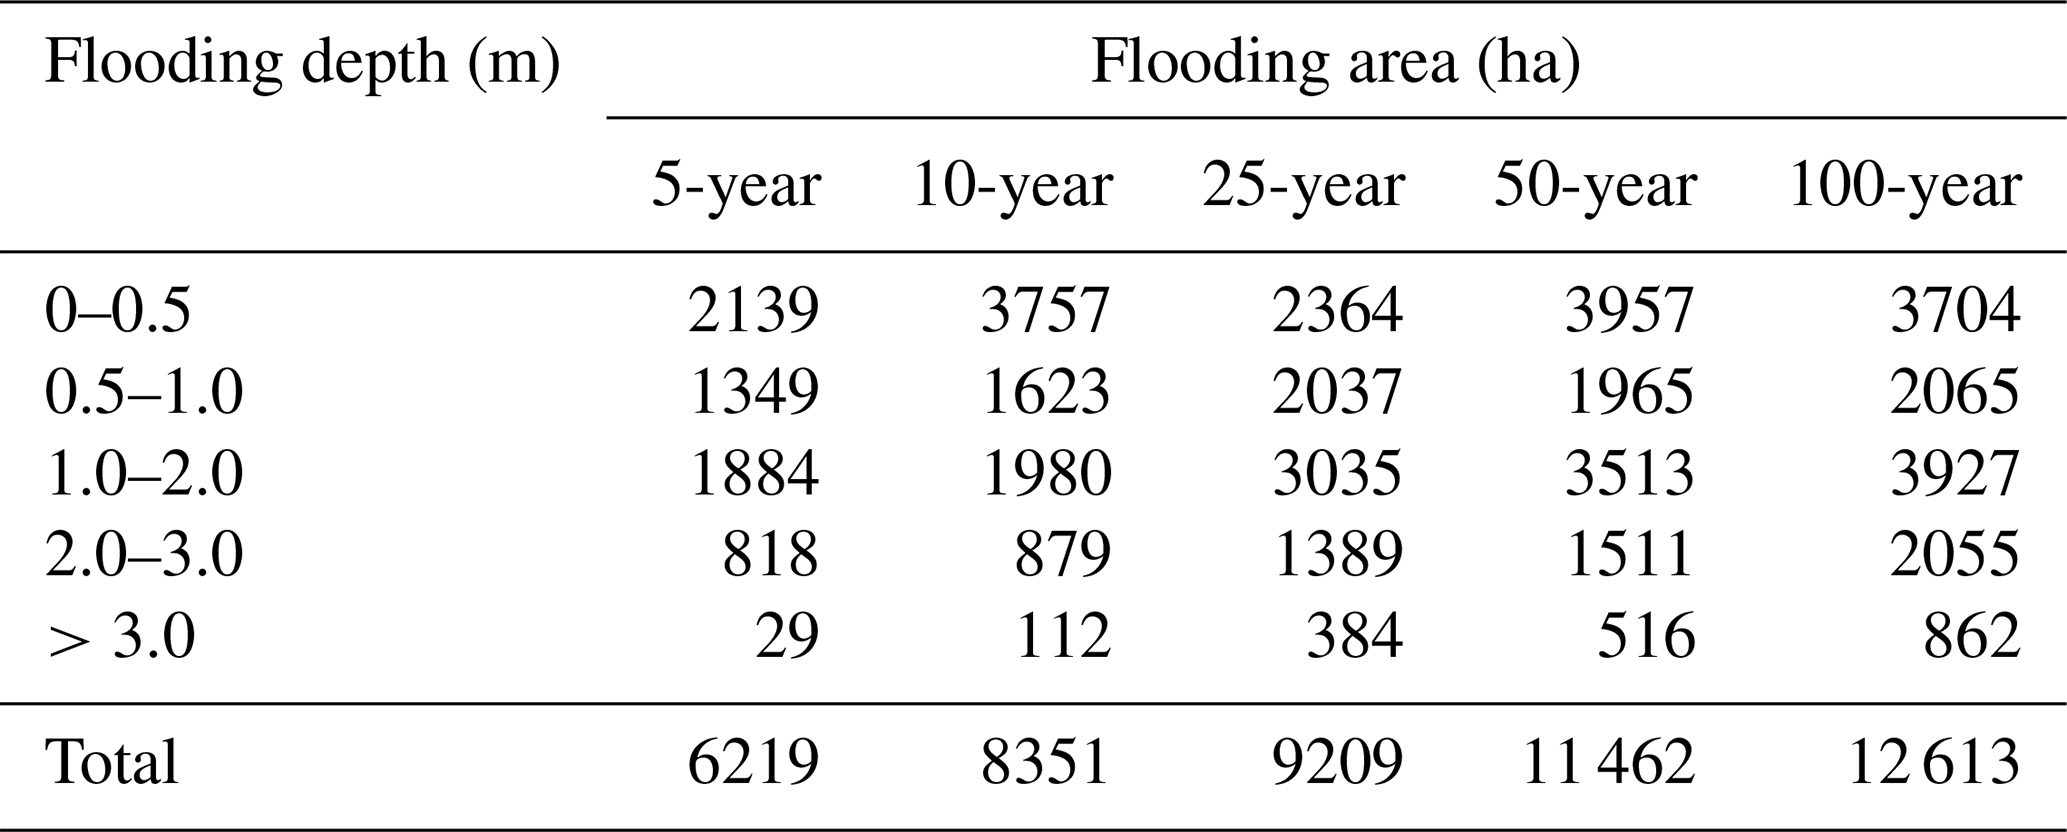
Table 3 indicates the inundation depth and area under different return periods. In 100-year TC event, the total inundation area is 12613 ha, and the inundation area between 0–0.5 and 1.0–2.0 m accounts for 29.4 % and 31.1 %, respectively. The inundation area between 0.5–1.0 m and 2.0–3.0 m accounts for a total of 32.7 %. For the other TC events, the inundation depth at a range of 0–0.5 and 1.0–2.0 m has the most inundation area. For a 100-year TC event, the inundation area with a depth above 1.0 m increases by approximately 2.5 times compared with a 5-year TC event.
Table 3Inundation depth and area under different return periods.
4.4 Quantitative comparison single-driven flood hazard and compound flood hazard
Figure 7 illustrates the maps of rainstorm inundation and storm tide flooding under different return periods. In each rainfall scenario, the overall inundation depth is below 1.0 m, while in each storm tide scenario, the overall inundation depth is above 1.0 m. When comparing the rainstorm inundation map and storm tide flooding map in the same TC event, it is obvious that the storm tide flooding is significantly worse than rainstorm inundation.
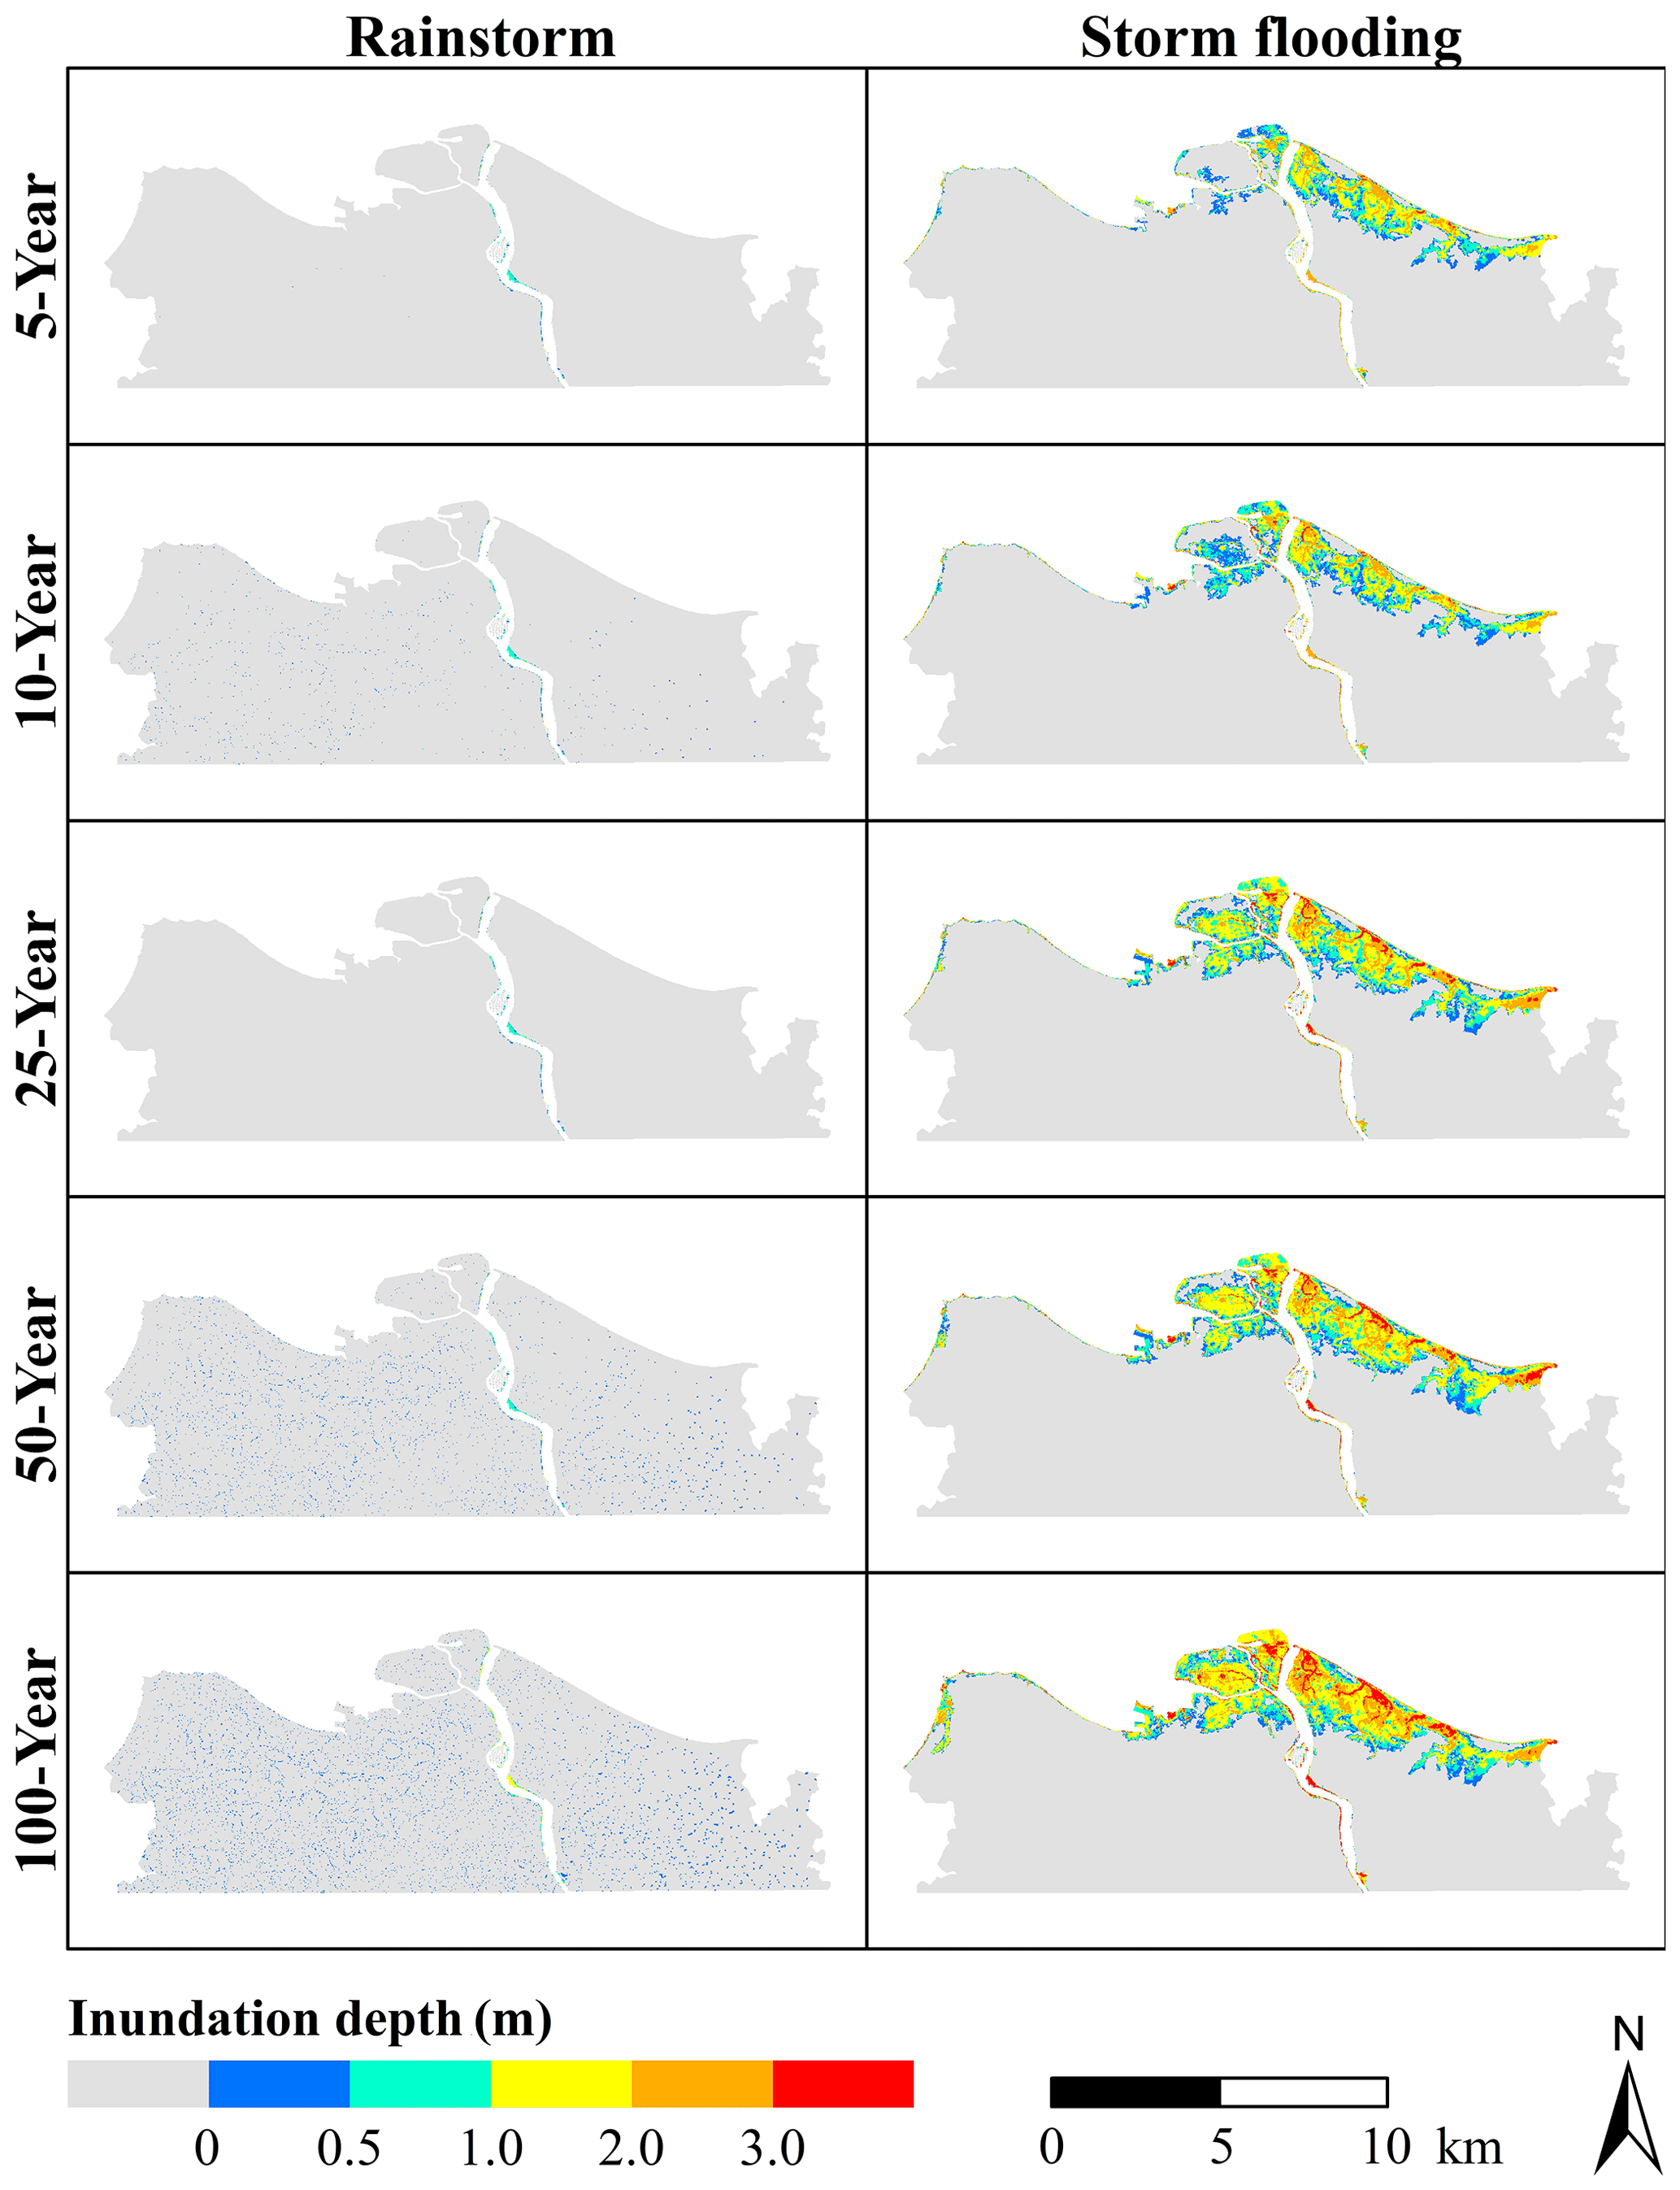
Figure 7The inundation maps of rainstorm and storm flooding under different return periods.
Figure 8 compares the overall inundation area of rainstorm, storm tide, and compound flooding under different return periods. The inundation area of compound flooding exceeds the inundation area of rainstorm inundation and storm tide flooding in each TC event. Thus, compound flood hazards can have more serious consequences than rainstorm and storm flooding (Bevacqua et al., 2019; Wahl et al., 2015; Zscheischler et al., 2018). Moreover, it can be seen from Fig. 8 that compound flooding has more inundation area than the accumulation of rainstorm and storm tide flooding under different return periods. For example, in the TC6311 scenario, the total inundation area of compound flooding is 11 462 ha, exceeding the sum of rainstorm inundation and storm tide flooding, which is 10 616 ha. Therefore, compound flood hazards are more destructive than the combination of single-driven flood hazards and have a certain amplification effect (Fang et al., 2021; Xu et al., 2019).
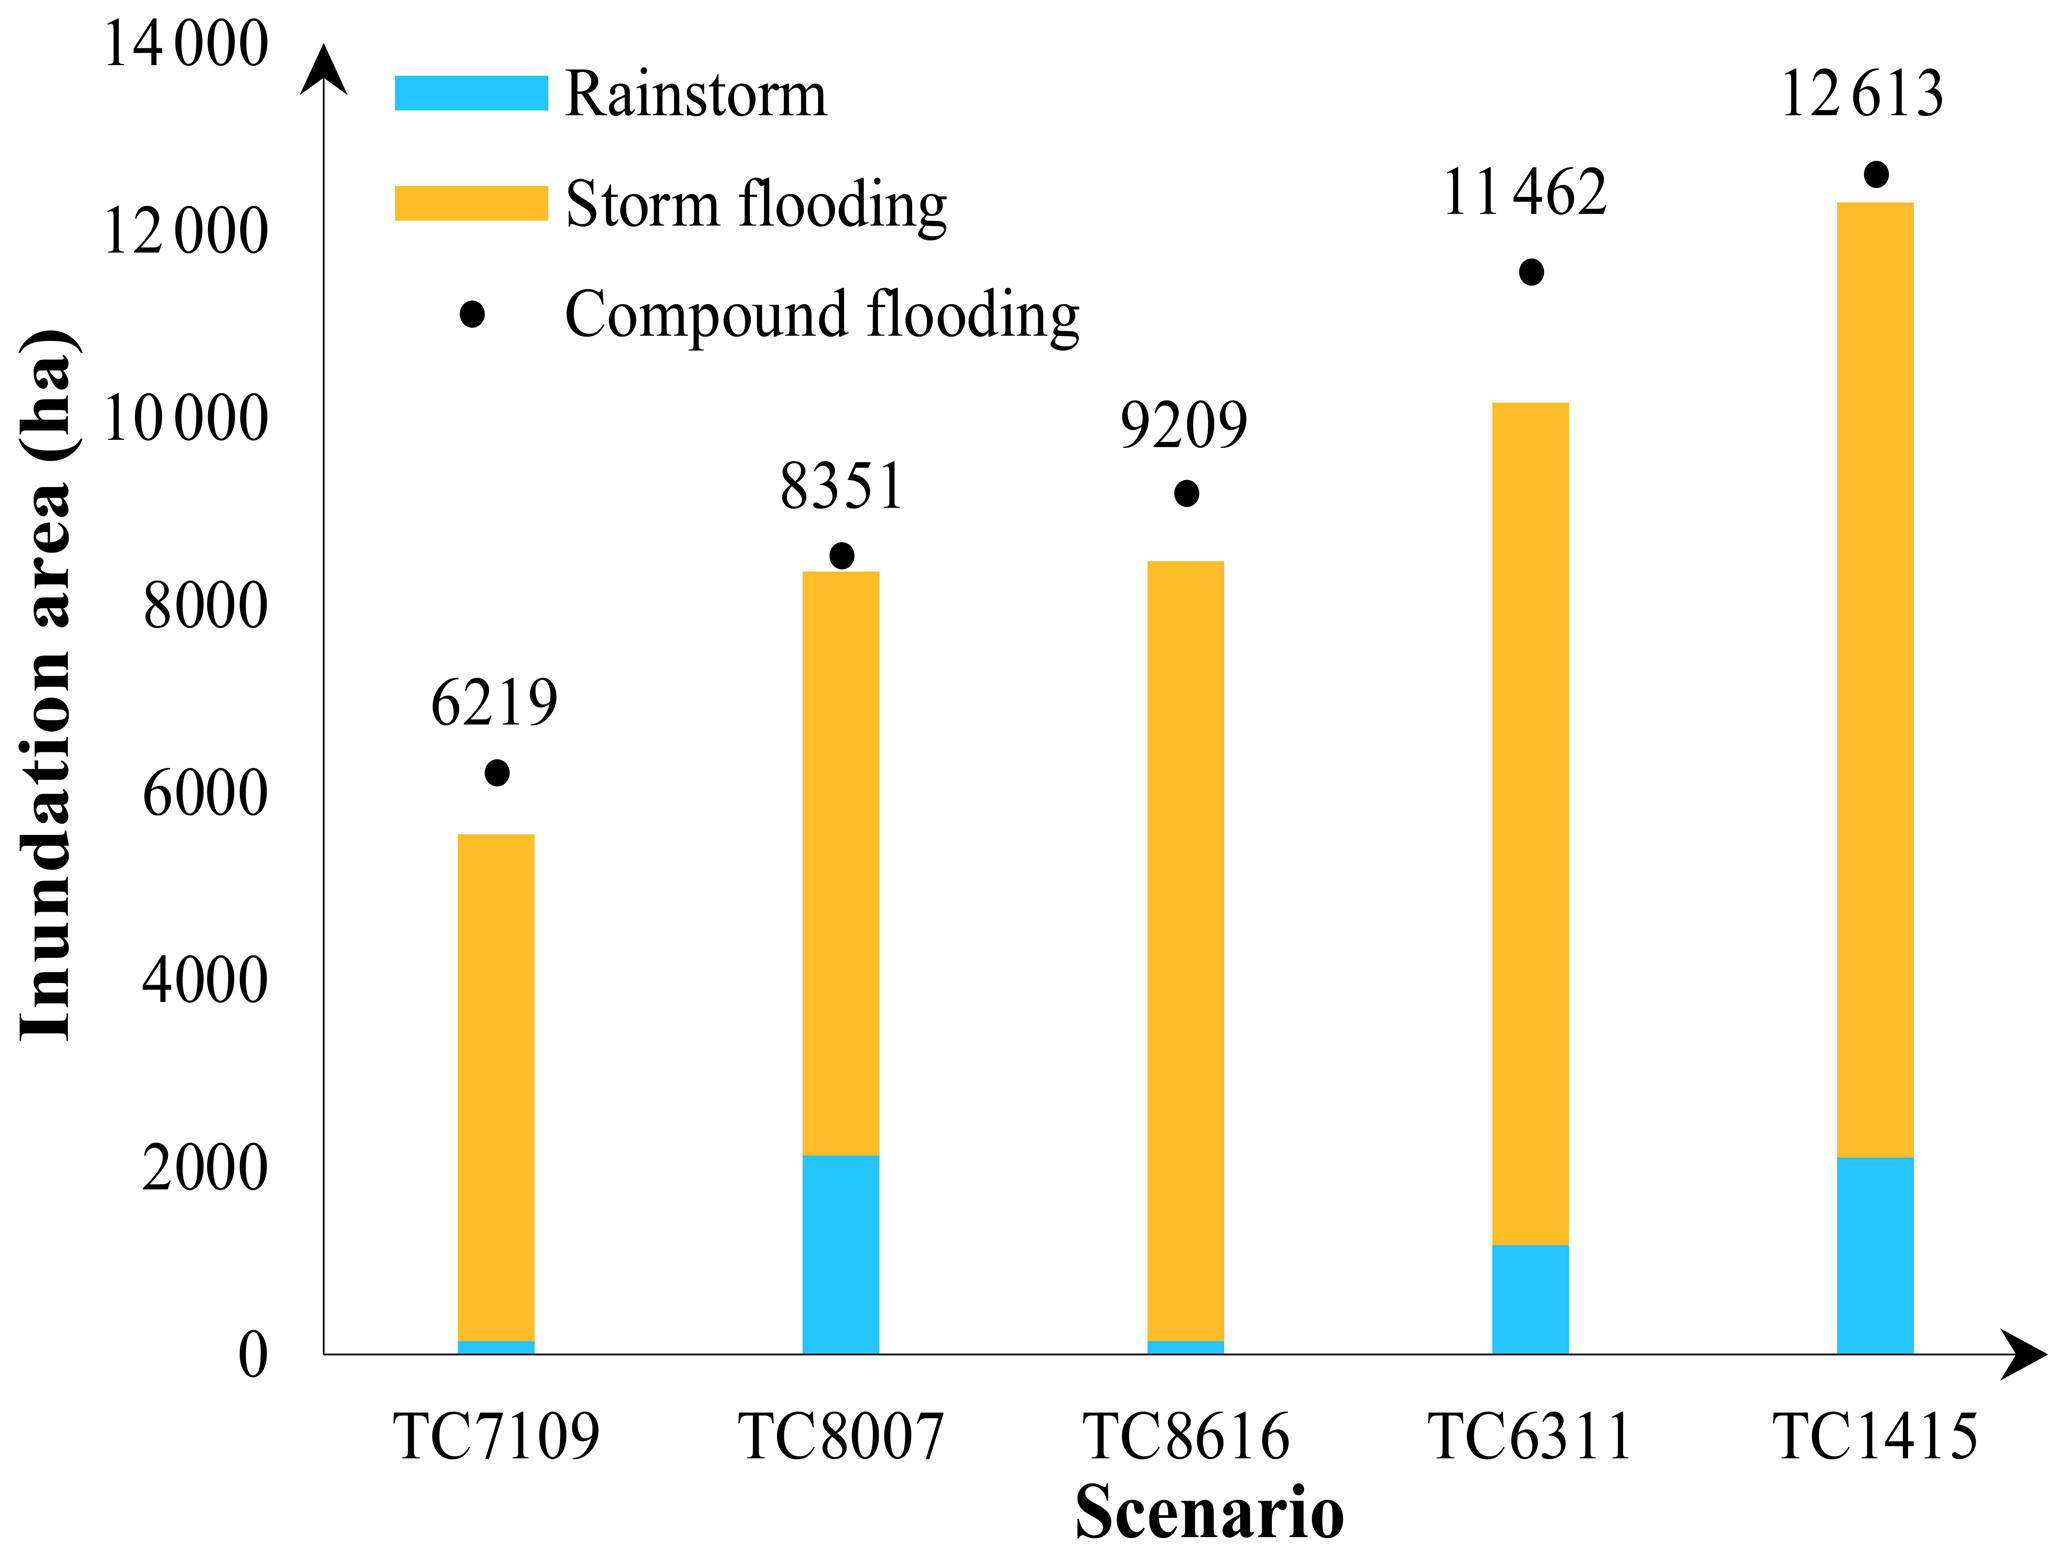
Figure 8The comparison of the overall inundation area of rainstorm, storm flooding, and compound flooding in each TC event.
However, storm tide and rainstorm are the driving factors in a compound flood hazard (Hsiao et al., 2021; Fang et al., 2021; Bevacqua et al., 2019). This study investigates the compound effect of flood hazards by studying the probability distribution of highest storm tides during TCs. Many studies have confirmed that rainfall and storm surge have statistically positive dependence (Wu et al., 2018; Wahl et al., 2015; Xu et al., 2014; Zheng et al., 2014; Lian et al., 2013). Hence, it is of practical significance to reveal compound flood risk considering the statistical dependence of rainfall and storm surge. Copula is a kind of function connecting joint distributions and marginal distributions (Lin-Ye et al., 2016). Zhang et al. (2021) calculated the overtopping occurrence by determining the correlations between tidal levels and wave heights based on copula function. In recent years, the copula function has been confirmed to model and describe the dependence between flood variables and express compound flood risk (Zellou and Rahali, 2019). Xu et al. (2019) employed the copula function to investigate the bivariate return period of compounding rainfall and storm tide events, finding that the joint probability analysis can reveal more adequate and comprehensive risk about compound events than univariate analysis. Therefore, in future works, we will adopt the copula function to investigate the joint occurrence of rainfall and storm surge during TCs, further assessing extreme compound flooding severity.
This study applies a coupled methodology of combining storm surge model and overland flooding model to investigate the compound effect of flood hazards during TCs. We simulate and assess compound floods under different return periods of storm tides. The results show that storm tide is the key driving factor of compound flood inundation in Haikou, and tide level decides the inundation extent. When quantitatively comparing compound flooding with rainstorm inundation and storm flooding, we find that it is more destructive than single-driven flood hazards, and the compound effect exceeds the accumulated effects of single-driven floods. The co-occurrence of heavy rainfall and strong storm surge in extreme TCs could intensify compound flood inundation. Simply accumulating every single-driven flood hazard to define compound flooding may cause underestimation.
In this study, we selected the typical TC scenarios based on storm tide probability distribution. The high storm tide has been confirmed to be the main driving factor of flooding. Considering that rainfall is also the driving factor of TC compound flooding, we will focus on the joint probability distribution of rainfall and storm tide in future research. Although this study is limited to Haikou City, we confirmed that it is available for other coastal cities to adopt the methodology of coupling two hydrodynamic models to quantitatively assessing compound flooding risks. It can conveniently capture the dynamic of rainfall and storm surge and directly observe the change of inundation area to display the effect of rainfall and storm surge in compound events. For future research on extreme TC compound flooding, climate change factors should be taken into consideration, such as sea level rise and land subsidence, and the copula function can be applied to study the statistical dependence between heavy rainfall and strong storm surge under the changing environment to reveal extreme flood risk in coastal cities.
Some of the used data such as the typhoon tracks in this study are freely available. The web links are presented in Sect. 2. However, some data such as the topology map of the study area and river discharges were provided on the request from the departments and agencies of Haikou.
QL, HX, and JW designed the study. QL constructed and validated the models and ran all the simulations. QL and HX analysed and interpreted the results. QL wrote, reviewed, and edited the manuscript. HX and JW reviewed the manuscript.
The contact author has declared that neither they nor their co-authors have any competing interests.
Publisher's note: Copernicus Publications remains neutral with regard to jurisdictional claims in published maps and institutional affiliations.
This article is part of the special issue “Advances in flood forecasting and early warning”. It is not associated with a conference.
We express out sincere gratitude to the Department of Emergency Management of Hainan Province and Hainan Hydrology of Water Resource Survey Bureau for supporting the geographic information of the study area. Special thanks are owed to Jinkai Tan, Xinmeng Shan, and Rui Li, whose support in field collection and data preprocessing is acknowledged. We thank the two anonymous reviewers for providing useful suggestions for paper improvement. We are also grateful to the editor Jie Yin.
This research has been supported by the National Key Research and Development Program of China (grant no. 2018YFC1508803), the National Social Science Foundation of China (grant no. 18ZDA105), the special project of Shanghai Philosophy and Social Science planning (grant no. 2021XRM005), and the ECNU Academic Innovation Promotion Program for Excellent Doctoral Students (grant no. YBNLTS2020035). Hanqing Xu is thankful for financial support from the China Scholarships Council (grant no. 202006140040).
This paper was edited by Jie Yin and reviewed by two anonymous referees.
Adelekan, I. O.: Vulnerability assessment of an urban flood in Nigeria: Abeokuta flood 2007, Nat. Hazards, 56, 215–231, https://doi.org/10.1007/s11069-010-9564-z, 2011.
Bevacqua, E., Maraun, D., Vousdoukas, M., Voukouvalas, E., Vrac, M., Mentaschi, L., and Widmann, M.: Higher probability of compound flooding from precipitation and storm surge in Europe under anthropogenic climate change, Sci. Adv., 5, eaaw5531, https://doi.org/10.1126/sciadv.aaw5531, 2019.
Bilskie, M. V., Zhao, H., Resio, D., Resio, D., Atkinson, J., Cobell, Z., and Hagen, S. C.: Enhancing Flood Hazard Assessments in Coastal Louisiana Through Coupled Hydrologic and Surge Processes, Frontiers in Water, 3, 609231, https://doi.org/10.3389/frwa.2021.609231, 2021.
Budiyono, Y., Aerts, J. C. J. H., Tollenaar, D., and Ward, P. J.: River flood risk in Jakarta under scenarios of future change, Nat. Hazards Earth Syst. Sci., 16, 757–774, https://doi.org/10.5194/nhess-16-757-2016, 2016.
De Goede, E.: Historical overview of 2D and 3D hydrodynamic modelling of shallow water flows in the Netherlands, Ocean Dynam., 70, 521–539, https://doi.org/10.1007/s10236-019-01336-5, 2020.
Deltares: 1D/2D/3D Modelling suite for integral water solutions, Delft3D Flexible Mesh Suite (RGFGRID), version: 5.0, Deltares, 2019.
Ding, Q.: Analysis and forecast of storm surges in Haikou harbor, Marine Forecasts, 16, 41–47, 1999 (in Chinese).
Emanuel, K.: Assessing the present and future probability of Hurricane Harvey's rainfall, P. Natl. Acad. Sci. USA, 114, 12681–12684, https://doi.org/10.1073/pnas.1716222114, 2017.
Fang, J., Wahl, T., Fang, J., Sun, X., Kong, F., and Liu, M.: Compound flood potential from storm surge and heavy precipitation in coastal China: dependence, drivers, and impacts, Hydrol. Earth Syst. Sci., 25, 4403–4416, https://doi.org/10.5194/hess-25-4403-2021, 2021.
Gori, A., Lin, N., and Smith, J.: Assessing compound flooding from landfalling tropical cyclones on the North Carolina coast, Water Resour. Res., 56, e2019WR026788, https://doi.org/10.1029/2019WR026788, 2020a.
Gori, A., Lin, N., and Xi, D.: Tropical cyclone compound flood hazard assessment: from investigating drivers to quantifying extreme water levels, Earths Future, 8, e2020EF001660, https://doi.org/10.1029/2020EF001660, 2020b.
Hallegatte, S., Green, C., Nicholls, R., and Corfee-Morlot, J.: Future flood losses in major coastal cities, Nat. Clim. Change, 3, 802–806, https://doi.org/10.1038/nclimate1979, 2013.
He, F., Hu, H., Dong, G., and Xu, H.: Compound flooding simulation and prediction of future recurrence in Shanghai downtown area, Journal of Catastrophology, 35, 93–98, 134, 2020 (in Chinese).
He, H.: Storm surges along the coast of Guangdong and Hainan, Tropical Oceanology, 2, 39–46, 1988 (in Chinese).
Hendry, A., Haigh, I. D., Nicholls, R. J., Winter, H., Neal, R., Wahl, T., Joly-Laugel, A., and Darby, S. E.: Assessing the characteristics and drivers of compound flooding events around the UK coast, Hydrol. Earth Syst. Sci., 23, 3117–3139, https://doi.org/10.5194/hess-23-3117-2019, 2019.
Holland, G.: An Analytic Model of the Wind and Pressure Profiles in Hurricanes, Mon. Weather Rev., 108, 1218–1218, 1980.
Hsiao, S., Chiang, W., Jang, J., Wu, H.-L., Lu, W.-S., Chen, W.-B., and Wu, Y.-T.: Flood risk influenced by the compound effect of storm surge and rainfall under climate change for low-lying coastal areas, Sci. Total Environ., 764, 144439, https://doi.org/10.1016/j.scitotenv.2020.144439, 2021.
Huang, W., Ye, F., Zhang, Y., Park, K., Du, J., Moghimi, S., Myers, E., Pe’eri, S., Calzada, J. R., Yu, H. C., Nunez, K., and Liu, Z.: Compounding factors for extreme flooding around Galveston Bay during Hurricane Harvey. Ocean Model., 158, 101735, https://doi.org/10.1016/j.ocemod.2020.101735, 2021.
Keellings, D. and Hernández Ayala, J.: Extreme Rainfall Associated with Hurricane Maria Over Puerto Rico and Its Connections to Climate Variability and Change, Geophys. Res. Lett., 46, 2964–2973, https://doi.org/10.1029/2019GL082077, 2019.
Kumbier, K., Carvalho, R. C., Vafeidis, A. T., and Woodroffe, C. D.: Investigating compound flooding in an estuary using hydrodynamic modelling: a case study from the Shoalhaven River, Australia, Nat. Hazards Earth Syst. Sci., 18, 463–477, https://doi.org/10.5194/nhess-18-463-2018, 2018.
Kuang, C. and Zhang, G.: How can cities practice to have a great drainage system? Daily Hainan, A04, 2014 (in Chinese).
Leonard, M., Westra, S., Phatak, A., Lambert, M., Hurk, B., Mclnnes, K., Risbey, J., Schuster, S., Jakob, D., and Stafford-Smith, M.: A compound event framework for understanding extreme impacts, WIREs Clim. Change., 5, 113–128, https://doi.org/10.1002/wcc.252, 2014.
Lian, J., Xu, H., Xu, K., and Ma, C.: Optimal management of the flooding risk caused by the joint occurrence of extreme rainfall and high tide level in a coastal city, Nat. Hazards, 89, 183–200, https://doi.org/10.1007/s11069-017-2958-4, 2017.
Lian, J. J., Xu, K., and Ma, C.: Joint impact of rainfall and tidal level on flood risk in a coastal city with a complex river network: a case study of Fuzhou City, China, Hydrol. Earth Syst. Sci., 17, 679–689, https://doi.org/10.5194/hess-17-679-2013, 2013.
Lin, N., Emanuel, K., and Oppenheimer, M.: Physically based assessment of hurricane surge threat under climate change, Nat. Clim. Change, 2, 462–467, https://doi.org/10.1038/nclimate1389, 2012.
Lin-Ye, J., Garcia-Leon, M., Gracia, V., and Sanchez-Arcilla, A.: A multivariate statistical model of extreme events: an application to the Catalan coast, Coast. Eng., 117, 138–156, https://doi.org/10.1016/j.coastaleng.2016.08.002, 2016.
Marsooli, R., Lin, N., and Emanuel, K.: Climate change exacerbates hurricane flood hazards along US Atlantic and Gulf Coasts in spatially varying patterns, Nat Commun., 10, 3785, https://doi.org/10.1038/s41467-019-11755-z, 2019.
Meijer, D. and Hutten, R.: 2D urban modelling using Delft3D FM, Deltares, 2018.
Milly, P., Wetherald, R., Dunne, K., and Delworth, T. L.: Increasing risk of great floods in a changing climate, Nature, 415, 514–517, https://doi.org/10.1038/415514a, 2002.
Orton, P., Conticello, F., Cioffi, F., Hall, T. M., Georgas, N., Lall, U., Blumberg, A. F., and MacManus, K.: Flood hazard assessment from storm tides, rain and sea level rise for a tidal river estuary, Nat. Hazards, 102, 729–757, https://doi.org/10.1007/s11069-018-3251-x, 2020.
Patricola, C. and Wehner, M.: Anthropogenic influences on major tropical cyclone events, Nature, 563, 339–346, https://doi.org/10.1038/s41586-018-0673-2, 2018.
Rasmussen, D. J. Bittermann, K., Buchanan, M. K., Kulp, S., Strauss, B. H., Kopp, R. E., and Oppenheimer, M.: Extreme sea level implications of 1.5 ∘C, 2.0 ∘C, and 2.5 ∘C temperature stabilization targets in the 21st and 22nd centuries, Environ. Res. Lett., 13, 034040, https://doi.org/10.1088/1748-9326/aaac87, 2018.
Santiago-Collazo, F., Bilskie, M., and Hagen, S.: A comprehensive review of compound inundation models in low-gradient coastal watersheds, Environ. Modell. Softw., 119, 166–181, https://doi.org/10.1016/j.envsoft.2019.06.002, 2019.
Shen, Y., Morsy, M., Huxley, C., Tahvildari, N., and Goodall, J. L.: Flood risk assessment and increased resilience for coastal urban watersheds under the combined impact of storm tide and heavy rainfall, J. Hydrol., 579, 124159, https://doi.org/10.1016/j.jhydrol.2019.124159, 2019.
Skinner, C. J., Coulthard, T. J., Parsons, D. R., Ramirez, J. A., Mullen, L., and Manson, S.: Simulating tidal and storm surge hydraulics with a simple 2D inertia based model, in the Humber Estuary, U.K., Estuar. Coast. Shelf Sci., 155, 126–136, https://doi.org/10.1016/j.ecss.2015.01.019, 2015.
Valle-Levinson, A., Olabarrieta, M., and Heilman, L.: Compound flooding in Houston-Galveston Bay during Hurricane Harvey, Sci. Total Environ., 747, 141272, https://doi.org/10.1016/j.scitotenv.2020.141272, 2020.
van Oldenborgh, G., van der Wiel, K., Sebastian, A., Singh, R., Arrighi, J., Otto, F., Haustein, K., Li, S., Vecchi, G., and Cullen, H.: Attribution of extreme rainfall from Hurricane Harvey, August 2017, Environ. Res. Lett., 12, 124009, https://doi.org/10.1088/1748-9326/aa9ef2, 2017.
Wahl, T., Jain, S., Bender, J., Meyers, S. D., and Luther, M. E.: Increasing risk of compound flooding from storm surge and rainfall for major US cities, Nat. Clim. Change, 5, 1093–1097, https://doi.org/10.1038/nclimate2736, 2015.
Wang, H., Lu, H., Yu, X., and Liang, H.: Analysis storm surge's characteristics along the coast of Hainan Island, Marine Forecasts, 15, 34–42, 1998 (in Chinese).
Wang, J. and Tan, J.: Understanding the climate change and disaster risks in coastal areas of China to develop coping strategies, Prog. Geogr., 40, 870–882, 2021 (in Chinese).
Wang, J., Gao, W., Xu, S., and Yu, L.: Evaluation of the combined risk of sea level rise, land subsidence, and storm surges on the coastal areas of Shanghai, China, Clim. Change, 115, 537–558, https://doi.org/10.1007/s10584-012-0468-7, 2012.
Wang, J., Yi, S., Li, M., Wang, L., and Song, C.: Effects of sea level rise, land subsidence, bathymetric change and typhoon tracks on storm flooding in the coastal areas of Shanghai, Sci. Total Environ., 621, 228–234, https://doi.org/10.1016/j.scitotenv.2017.11.224, 2018.
Wang, L., Zhang, M., Wen, J., Chong, Z., Ye, Q., and Ke, Q.: Simulation of extreme compound coastal flooding in Shanghai, Advance in Water Science, 30, 546–555, 2020 (in Chinese).
Wu, W., McInnes, K., O'Grady, J., Hoeke, R., Leonard, M., and Westra, S.: Mapping Dependence Between Extreme Rainfall and Storm Surge. J. Geophys. Res.-Oceans, 123, 2461–2474, https://doi.org/10.1002/2017JC013472, 2018.
Xu, H., Xu, K., Bin, L., Lian, J., and Ma, C.: Joint Risk of Rainfall and Storm Surges during Typhoons in a Coastal City of Haidian Island, China, Int. J. Env. Res. Pub. He., 15, 1377, https://doi.org/10.3390/ijerph15071377, 2018.
Xu, H., Xu, K., Lian, J., and Ma, C.: Compound effects of rainfall and storm tides on coastal flooding risk, Stoch. Env. Res. Risk A., 33, 1249–1261, https://doi.org/10.1007/s00477-019-01695-x, 2019.
Xu, K., Ma, C., Lian, J., and Bin, L.: Joint Probability Analysis of Extreme Precipitation and Storm Tide in a Coastal City under Changing Environment, PLoS ONE, 9, e109341. https://doi.org/10.1371/journal.pone.0109341, 2014.
Yang, X., Zhua, D., Li, C., and Liu, Z.: Establishment of design hyetographs based on risk probability models, Journal of Hydraulic Engineering, 44, 542–548, 2013 (in Chinese).
Ye, S., Ye, X., Wang, Y., Zhu, C., and Liu, J.: Research on design rainstorm pattern based on Copula function, Journal of Water Resources & Water Engineering, 29, 63–68, 2018 (in Chinese).
Yin, J., Yu, D., Yin, Z., Wang, J., and Xu, S.: Modelling the combined impacts of sea-level rise and land subsidence on storm tides induced flooding of the Huangpu River in Shanghai, China, Clim. Change, 119, 919–932, https://doi.org/10.1007/s10584-013-0749-9, 2013.
Yin, J., Yu, D., Yin, Z., Liu, M., and He, Q.: Evaluating the impact and risk of pluvial flash flood on intra-urban road network: A case study in the city center of Shanghai, China, J. Hydrol., 537, 138–145, https://doi.org/10.1016/j.jhydrol.2016.03.037, 2016.
Yin, J., Jonkman, S., Lin, N., Yu, D., Aerts, J., Wilby, R., Pan, M., Wood, E., Bricker, J., Ke, Q., Zeng, Z., Zhao, Q., Ge, J., and Wang, J.: Flood risks in sinking delta cities: Time for a reevaluation?, Earth's Future, 8, e2020EF001614, https://doi.org/10.1029/2020EF001614, 2020.
Yin, J., Lin, N., Yang, Y., Pringle, W. J., Tan, J., Westerink, J. J., and Yu, D.: Hazard Assessment for Typhoon-Induced Coastal Flooding and Inundation in Shanghai, China, J. Geophys. Res.-Oceans, 126, e2021JC017319, https://doi.org/10.1029/2021JC017319, 2021.
Yum, S.-G., Wei, H.-H., and Jang, S.-H.: Estimation of the non-exceedance probability of extreme storm surges in South Korea using tidal-gauge data, Nat. Hazards Earth Syst. Sci., 21, 2611–2631, https://doi.org/10.5194/nhess-21-2611-2021, 2021.
Zhang, M., Dai, Z., Bouma, J., Bricker, J., Townend, I., Wen, J., Zhao, T., and Cai, Huayang: Tidal-flat reclamation aggravates potential risk from storm impacts, Coast. Eng., 166, 103868, https://doi.org/10.1016/j.coastaleng.2021.103868, 2021.
Zellou, B. and Rahali, H.: Assessment of the joint impact of extreme rainfall and storm surge on the risk of flooding in a coastal area, J. Hydrol., 569, 647–665, https://doi.org/10.1016/j.jhydrol.2018.12.028, 2019.
Zheng, F., Westra, S., and Sisson, S. A.: Quantifying the dependence between extreme rainfall and storm surge in the coastal zone, J. Hydrol., 505, 172–187, https://doi.org/10.1016/j.jhydrol.2013.09.054, 2013.
Zscheischler, J., Westra, S., van den Hurk, B. J. J. M., Seneviratne, S. I., Ward, P. J., Pitman, A., AghaKouchak, A., Bresch, D. N., Leonard, M., Wahl, T., and Zhang, X.: Future climate risk from compound events, Nat. Clim. Change, 8, 469–477, https://doi.org/10.1038/s41558-018-0156-3, 2018.