the Creative Commons Attribution 4.0 License.
the Creative Commons Attribution 4.0 License.
 | 28 Feb 2022
Multiscale effects caused by the fracturing and fragmentation of rock blocks during rock mass movement: implications for rock avalanche propagation
Qiwen Lin
Yufeng Wang
Yu Xie
Qiangong Cheng
Kaifeng Deng
The fracturing and fragmentation of rock blocks are important phenomena that occur ubiquitously during the propagation of rock avalanches. Here, the movement of a rectangular rock block characterized by different joint sets along an upper sloped and lower horizontal plane is simulated using discrete element method (DEM) models. The pattern of the joint set allows the block to break along weak joint planes at the onset of fragmentation. With this design, the fracturing and fragmentation of the sliding rock block and their influences on the conversion and transmission of energy within the system are investigated. The results show that rock fragmentation can significantly alter the horizontal velocities and kinetic energies of fragments in the block system, accelerating the front sub-block while decelerating the rear sub-block. Such energy conversion and transmission between the front and rear sub-blocks are attributed to the accumulation and release of elastic strain energy caused by fragmentation. The energy transfer induced by fragmentation is more efficient than that induced by collision. Furthermore, positive relationships between the kinetic energy increase in the front sub-block induced by joint fracturing and the joint strength can be reliably fitted with linear functions, indicating that a rock mass with a higher joint strength experiences more-energetic fragmentation effects.
- Article
(3772 KB) - Full-text XML
- BibTeX
- EndNote


Rock avalanches are characterized by extremely rapid, massive, flow-like motions of fragmented rock pieces originating from large rockslides or rockfalls that intensely experience disintegration and fragmentation during propagation (McSaveney and Davies, 2006; Hungr et al., 2014; Knapp and Krautblater, 2020). Due to their extremely high mobility and destructiveness, these events, which are powerful enough to effectively shape mountainous landscapes (Lucas et al., 2014; Crosta et al., 2018; Francioni et al., 2019; von Wartburg et al., 2020), have caused severe casualties and economic losses in recent decades (Evans et al., 2007, 2009; Fan et al., 2017; Zhang et al., 2021; Shugar et al., 2021). For example, the 2006 Leyte Island rock avalanche in the Philippines caused the death of over 1100 people and completely overwhelmed the village of Guinsaugon downstream (Evans et al., 2007). The 2019 Shuicheng rock avalanche that struck Guizhou, China, affected over 1600 people, leaving 43 people dead and 9 people missing (Fan et al., 2020). The hypermobility of rock avalanches, i.e. their exceptionally long run-out distance, is usually quantified by the apparent friction coefficient (, where H and L represent the vertical and horizontal distances, respectively, between the crest of the failure mass and the distal point of deposition) (Heim, 1932). When the volume of the failure mass is > 106 m3, shows a decrease with volume, leading to hypermobility in mega rock avalanches (Scheidegger, 1973; Nicoletti and Sorriso-Valvo, 1991; Strom et al., 2019). At present, the hypermobility of rock avalanches continues to draw substantial scientific interest because it cannot be solved simply by a Coulomb frictional model of a sliding rock block (Legros, 2002).
Many dynamic mechanisms have been proposed to explain the hypermobility of rock avalanches. Some mechanisms involve fluid media, such as air (Kent, 1966), water (Wang et al., 2002; Hungr and Evans, 2004), a fluid-like fine grain matrix (Hsü, 1975), melted rock or vapour (Habib, 1975; Goguel, 1978; Hu et al., 2018), and thermal pressurization and thermal moisture fluidization (Wang et al., 2017, 2018a). Others invoke the interactions of materials in rock avalanche systems, such as shearing and impacting between a sliding mass and undulate path-generated acoustic fluidization (Melosh, 1979; Collins and Melosh, 2003), shearing between a rock mass and the ground (Foda, 1994; Wang et al., 2015), shearing between particles in the basal layer (Preuth et al., 2010), momentum transfer caused by the collisions of particles or different parts of the rock mass (Heim, 1932; Van Gassen et al., 1989; Miao et al., 2001), and dispersive pressure caused by dynamic fragmentation (Davies et al., 1999; Davies and McSaveney, 2009). Nevertheless, a universal consensus is still far out of reach (Weidinger et al., 2014). For a rigorous mechanism apt to explain the hypermobility, geological evidences coming from their depositions must be considered, with many field observations suggesting that the following phenomena commonly occur in large rock avalanches (Nicoletti et al., 1993; Weidinger et al., 2014; Dufresne et al., 2016):
-
“volume effect”, where the apparent friction coefficient () decreases as the volume of the rock mass increases (Scheidegger, 1973);
-
intense fragmentation in the deposit (McSaveney and Davies, 2006);
-
close packing of grains during movement (dense grain flows) (Pudasaini and Hutter, 2007);
-
“inverse grading” at depth in the deposit (Heim, 1932; Cruden and Hungr, 1986);
-
shear stress concentrated in basal facies (Dufresne et al., 2016);
-
“jigsaw puzzle” structures and local shear bands in the deposit (Shreve, 1968);
-
preservation of the host rock massif structure in the rock avalanche deposit (Heim, 1932; Strom, 2006).
Unfortunately, few mechanisms can account for the hypermobility of rock avalanches and explain the formation of the main features listed above. Some mechanisms even contradict geological evidence (McSaveney and Davies, 2006). Among these mechanisms, dynamic fragmentation, first proposed by Davies et al. (1999), has been extensively investigated and augmented (McSaveney and Davies, 2006; Davies and McSaveney, 2009; Zhao et al., 2017). This run-out-enhanced mechanism is based on solid geological evidence that intense fragmentation occurs universally in the deposits of rock avalanches; additionally, this mechanism does not conflict with the main structural features in the deposits of rock avalanches. Moreover, special deposit structures, including inverse grading, jigsaw structures and local shear bands, are closely related to the fragmentation process of avalanches (McSavaney and Davies, 2006; Dufresne et al., 2016; Wang et al., 2018b).
Recently, fragmentation and its effects on the emplacement of rock avalanches have been widely investigated by means of field evidence (Pollet and Schneider, 2004; Locat et al., 2006; Crosta et al., 2007; Perinotto et al., 2015; Wang et al., 2019, 2020), laboratory experiments (Imre et al., 2010; Bowman et al., 2012; Haug et al., 2016) and numerical simulations (Rait et al., 2012; De Blasio and Crosta, 2015; Langlois et al., 2015; Zhao et al., 2017, 2018). On the one hand, fragmentation is considered to consume some proportion of kinetic energy. Specifically, according to many scholars, the fragmentation process is estimated to dissipate 1 %–30 % of the total potential energy in a rock avalanche (Locat et al., 2006; Crosta et al., 2007; De Blasio et al., 2018), although some studies unrealistically truncated their rock avalanche particle-size distributions (as stated by Davies et al., 2019). Upon incorporating the existence of submicron particles in this estimate, the amount of energy supposedly dissipated by fragmentation rises to substantially exceed 100 % of the initially available energy (Davies et al., 2020). On the other hand, some studies have shown that fragmentation may enhance the distal travel distance of the sliding mass (Bowman et al., 2012; De Blasio and Crosta, 2015; Haug et al., 2016). The flow structure of fine particles created by intense fragmentation also facilitates the flow mobility of the fragmented mass (Langlois et al., 2015; Lai et al., 2017).
For those who support the mobility-enhanced effects of dynamic fragmentation, the release of elastic strain energy caused by fragmentation is considered to be a key dynamic process accounting for hypermobility (Davies and McSaveney, 2009; De Blasio and Crosta, 2015; Zhao et al., 2017). Based on the theories of rock dynamics and fracture mechanics, rocks fragment when the peak of the stress wave exceeds the strength of the rock itself; then, while part of the strain energy is consumed by cracking or the so-called generation of new surfaces, the remaining elastic strain energy may be released outward as elastic stress waves or may be transferred to the kinetic energy of the fragments (Grady and Kipp, 1987; Zhang et al., 2000; Ghaffari et al., 2019). McSaveney and Davies (2006) proposed that the release of elastic energy induced by dynamic fragmentation may generate the universal outward dispersion of stress, which can offset part of the overburden pressure and reduce shear resistance. Perinotto et al. (2015) examined the fractal dimension and circularity variation with the deposit distance travelled of the La Reunion volcanic debris avalanche and indicated that the exceptional mobility of the debris avalanche was caused by the comprehensive effect of the dynamic disintegration-induced release of elastic energy of larger clasts and the reduction in friction due to the interactions between fragmentation-formed fine particles. Davies et al. (2019) stated that the main fraction of the energy acting on fragmented rock radiates to the surrounding material as elastic body waves when a rock is fragmented, while only a small fraction of the energy is dissipated by newly created fragment surfaces. Haug et al. (2021) indicated that the run-out of a rock avalanche is largely dependent on fragmentation, controlled by the competition between mobility-enhancing spreading and energy-consuming internal friction. Pervasive grain fragmentation was observed in the high-speed rotary shear tests conducted by Hu et al. (2020), who hypothesized the occurrence of shear-thinning thixotropy due to grain fragmentation and a special grain-crushing-induced grain structure primarily to explain the great reduction in shear resistance; however, the underlying mechanism for this hypothesis remains unknown.
As mentioned above, many core issues of fragmentation dynamics and related fragmentation effects are still controversial (Davies and McSaveney, 2009; Haug et al., 2016, 2021). For example, how does the elastic strain energy related to fragmentation transform during the propagation of a rock mass, and what are the effects on the surrounding rock mass? Do the run-out-enhancing effects of elastic strain energy release via fragmentation offset and even surpass the run-out-hindering effects of energy consumption caused by fragmentation? To further understand these questions, studies on the energy conversion processes of rock avalanches caused by rock fragmentation and their effects on the fragmenting block system are conducted herein. In this study, we reproduce the fragmentation process of a sliding rock mass with different joint sets using a discrete element method (DEM) model, aiming to investigate the microscopic energy conversion processes caused by dynamic fragmentation. Then, the dynamic fragmentation effects in real rock avalanches are discussed based on the numerical simulation results. Section 2 provides details about the DEM set-up. In Sect. 3, the results derived from numerical simulations are presented. Section 4 focuses mainly on discussing the implications of the results regarding the fragmentation effects in natural rock avalanches.
Previous studies have proven that DEM models can successfully simulate the dynamic behaviour of dry granular flows (Silbert et al., 2001; Bi et al., 2005; Morgan and McGovern, 2005; Utili et al., 2015; Kermani et al., 2015; Lai et al., 2017), the crack nucleation and propagation of rock blocks under different loading rates (Yoon, 2007; Wang and Tonon, 2011; Shen et al., 2017; Ma et al., 2018), and the fragmentation processes of rock avalanches (Thompson et al., 2010; Lo et al., 2011; Li et al., 2012; Deng et al., 2016; Zhao and Crosta, 2018). Therefore, commercial Particle Flow Code in Two Dimensions (PFC2D) DEM software is employed here to run all of the simulations (Cundall, 1971; Cundall and Strack, 1979).
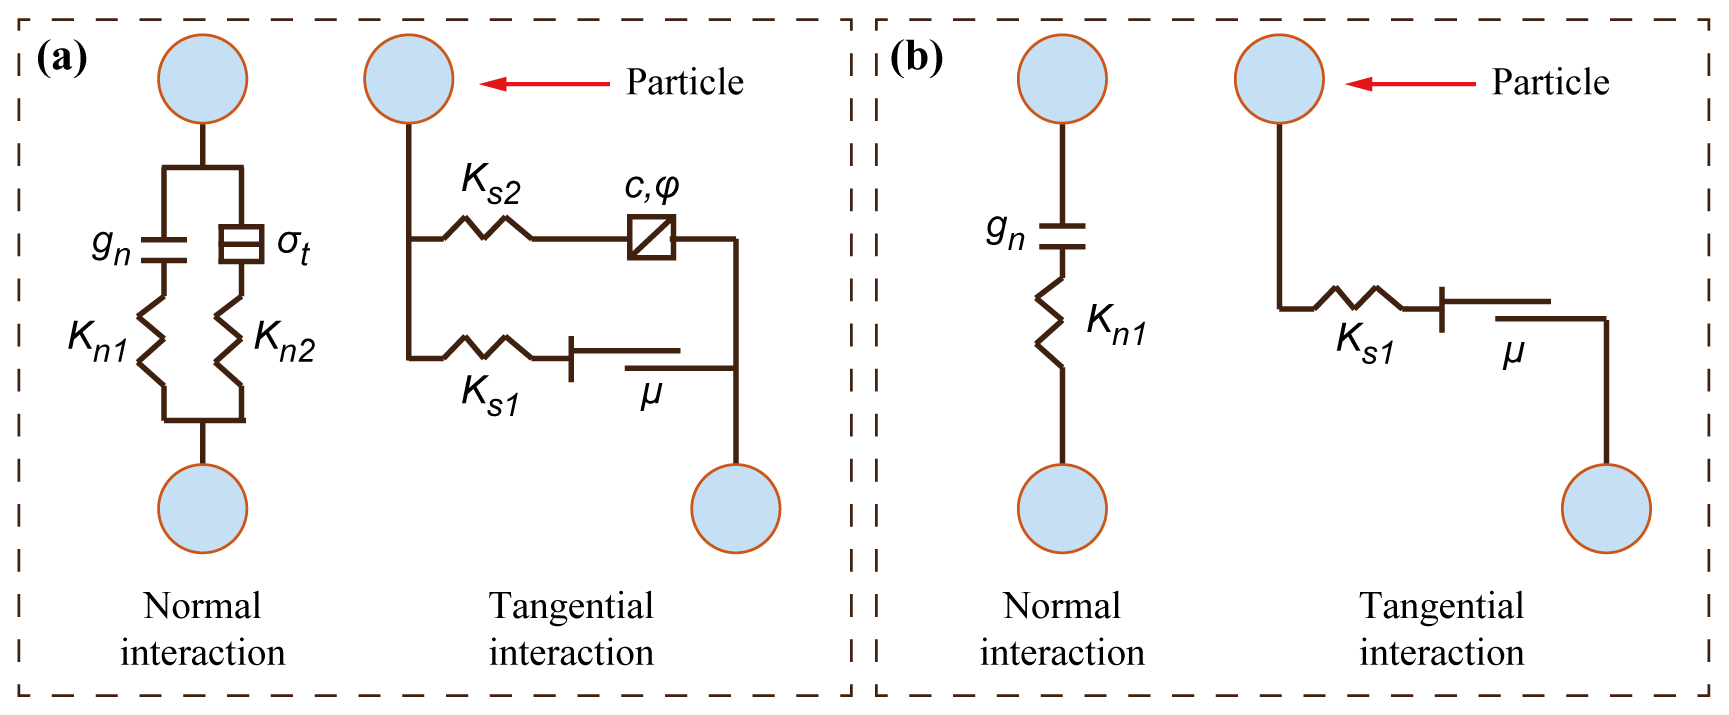
In PFC2D, the basic element is a disc, and granular material is simulated as an assembly of discs. By using the force-displacement law to update the position and force of each particle (disc) and using Newton's second law to determine the motion of each particle, the behaviour of a granular flow can be simulated according to the motion and interaction of particle aggregates. The code employs a time-step algorithm to update the position and force of each particle, and the macroscopic kinetics of particle aggregates are determined based on the continuous accumulation of force and displacement at each time step (Lin et al., 2021). In general, a rock block is modelled as numerous tightly packed discs (particles) cemented together through a linear parallel bond model (i.e. consisting of a linear model and a parallel bond model, as shown in Fig. 1a), which presents brittle fracture characteristics as bonds instantly break and disappear when the force acting on those bonds reaches the failure criterion (Potyondy and Cundall, 2004). After a bond breaks, the interaction between dispersed particles is replaced by a linear model (i.e. the parallel bond model vanishes, while the linear model is sustained; Fig. 1b), in which the motions of particles and blocks are controlled by Newton's second law of motion. Using this model, the dynamic fragmentation of blocks can be accurately simulated (Zhao et al., 2017, 2018). With the generation of macrocracks during fragmentation, the elastic strain energy carried by bonds vanishes; meanwhile, the elastic strain energy stored in unbroken bonds and the overleap deformation of particles will continue to transform, accumulate and release. This process provides exceptional opportunities to observe and analyse the conversion of elastic strain energy for the movement of breakable blocks during the fragmentation process (Potyondy and Cundall, 2004; Timar et al., 2012; Shen et al., 2017; Gao et al., 2020, 2021). In the linear parallel bond model, the interaction of two discs can be described as follows (Potyondy and Cundall, 2004):
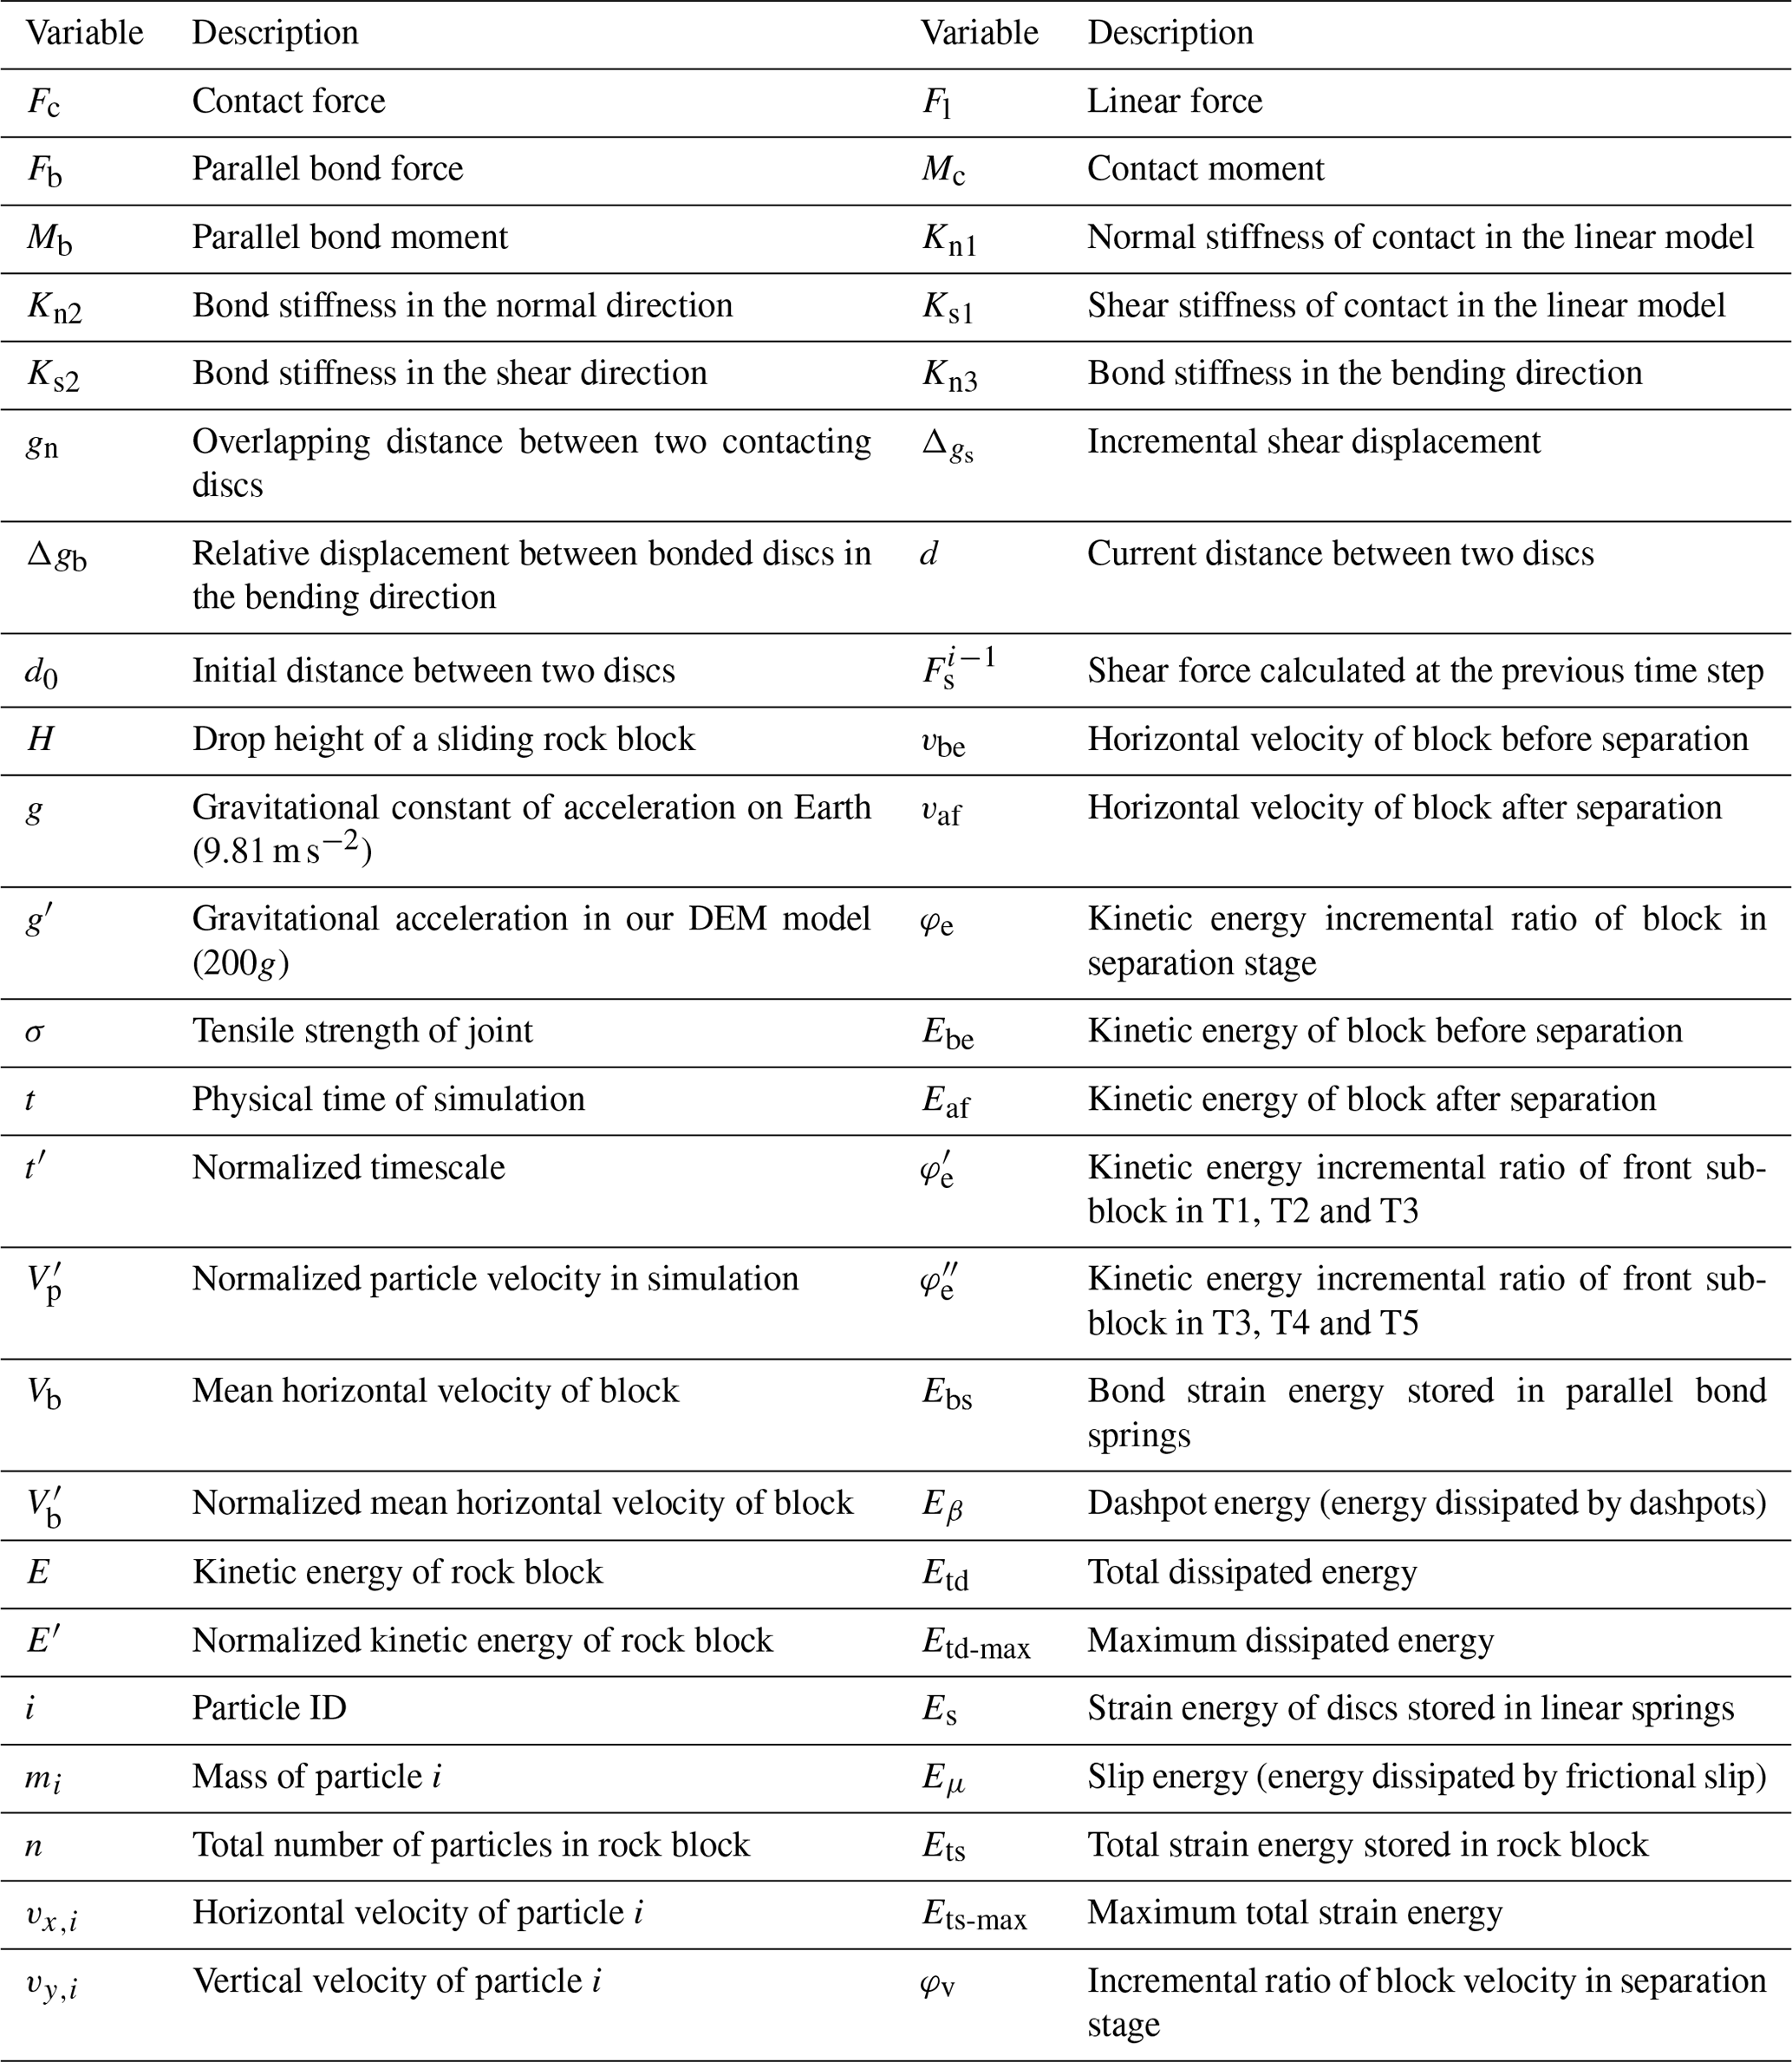
where Fc is the contact force, Fl is the linear force in the linear model, and Fb is the parallel bond force. Mc and Mb are the contact moment and parallel bond moment, respectively. As the linear model does not resist relative rotation, Mc is always equal to the moment carried by the parallel bond model (Mb). Fl consists of the normal force and the shear force in the linear model, where the normal force is calculated as the normal stiffness of contact in the linear model (Kn1) times the overlapping distance between two contacting discs (gn), and the shear force is calculated as the shear stiffness of contact in the linear model (Ks1) times the incremental shear displacement (Δgs) added to the shear force calculated at the previous time step (). Likewise, Fb consists of the normal force and the shear force in the parallel bond model. Kn2 and Ks2 are the corresponding bond stiffnesses in the normal and shear directions, respectively, and d and d0 are the current and initial distances, respectively, between the two discs. Mb is resolved into a twisting moment and a bending moment, while the former is equal to 0 in the linear model. Thus, Mc is always equal to the bending moment carried by the parallel bond model, expressed as the bond stiffness in the bending direction (Kn3) times the relative displacement between bonded discs in the bending direction (Δgb). More details related to these contact models and the basic theories of the DEM model can be found in Itasca Consulting Group (2014).
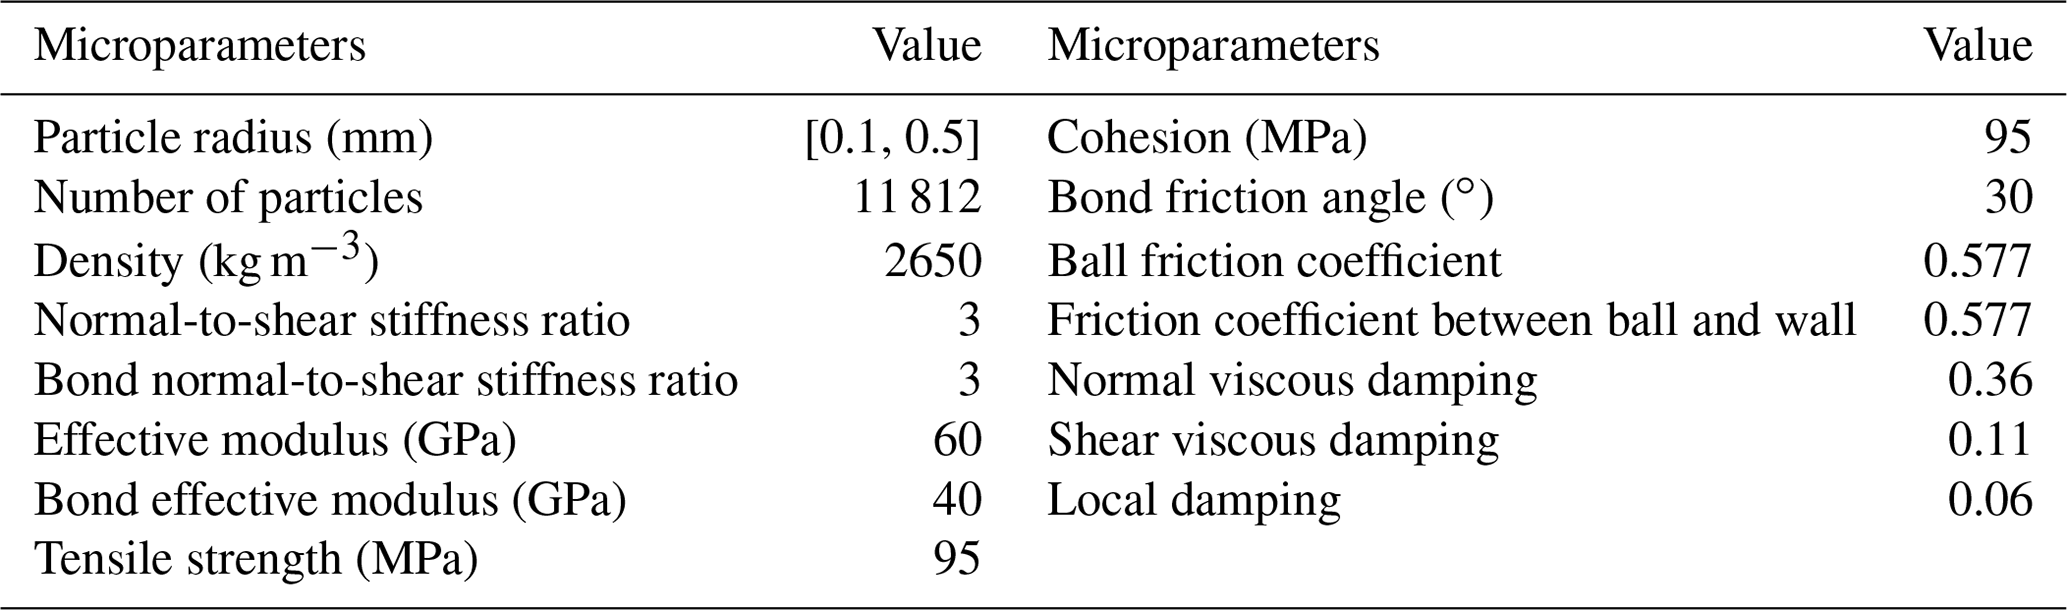
Based on the linear parallel bond model and related theories, a schematic view of the simulated model configuration used herein to analyse the fragmentation of a propagating rock mass is shown in Fig. 2. The travel path is composed mainly of an inclined slope and a horizontal plane connected by an arc with a radius of curvature of 0.1 m. The inclined plane is a frictionless rigid plane with a slope angle of 30∘, while the friction angle of both the arc and the horizontal plane is 30∘ to dissipate kinetic energy. Referring to Zhao et al. (2017, 2018) and Bowman et al. (2012), the size of each rock block used here is 94 mm × 45 mm, which consists of 11 812 particle aggregates cemented by the parallel bond model. The microparameters of each rock block in the DEM model are based on the numerical procedure applied in Potyondy and Cundall (2004), in which the macroproperties of Lac Du Bonnet granite (Martin, 1993) are used. Uniaxial compressive tests and uniaxial tensile tests are employed to calibrate the microparameters of the rock blocks in the simulation. The input values of the microscopic parameters in the DEM model are selected by trial and error to ensure that the mechanical characteristics of the rock block in the simulation match those of real Lac Du Bonnet granite. Table 1 lists the input microparameter values of the DEM model. The uniaxial compressive strength, Young's modulus, Poisson's ratio and tensile strength of the rock block in the simulation are 200.4 MPa, 67.6 GPa, 0.259 and 40.97 MPa, respectively. The drop height of the rock block (H) in this simulation is 0.12 m. The gravitational constant of acceleration (g′) is enhanced to 1962 m s−2 (200g) to approximate the real stress field of a rock avalanche (Zhao et al., 2017, 2018).
Different from the traditional plane strain or plane stress situation, no results of laboratory experiments can be directly used to calibrate the damping values in 2D DEM simulations (i.e. the energy dissipation caused by particle–particle and particle–boundary interactions). Based on our previous 3D DEM simulation and other similar simulations (Giani et al., 2004; Lo et al., 2014; Murugaratnam et al., 2015; Lin et al., 2020), the local, normal and shear viscous damping terms are set to 0.06, 0.36 and 0.11, respectively. Note that viscous damping affects only the efficiency of energy dissipation and the eventual run-out distance of sliding blocks (Johnson et al., 2016), whereas the dynamics of the block system and the fragmentation mechanism of the rock blocks do not change. Each simulation shows the typical processes of rock fracturing and emplacement, which validates the applicability of these microparameters for the DEM model.
As the inset table in Fig. 2 shows, joints with different strengths and numbers that equally divide each block are predesigned in the rock blocks, yielding a total of six testing conditions. T1, T2 and T3 represent simulated rock blocks with one joint featuring different tensile strengths, while T4, T5 and T6 represent rock blocks with two joints featuring the same varying tensile strengths. The tensile strengths of the joints (σ) are 0 MPa (T1 and T4), 4.39 MPa (T2 and T5) and 8.61 MPa (T3 and T6). The joints with different tensile strengths are defined by reducing the bond cohesion within the joint planes. The joint planes have a width of 1.5 mm (3 times the mean particle size) and a length of 45 mm (the height of the rock block). The joints with no tensile strength are defined simply by debonding the particles within the joint plane. Furthermore, the block strength remains unchanged (200.4 MPa) under all simulated conditions. With the design of pre-existing planes of weakness (joints), the rock blocks break mainly along these weak joint planes at the initial stage of fragmentation during motion. Then, the energy conversion processes within the block system and the variation in the motion of sub-blocks can be clearly recorded and analysed (here, a sub-block represents an intact block cut by a pre-existing joint). The blocks with a joint tensile strength of 0 (T1 and T4) aim to represent the separation of blocks that have been fractured, while the blocks containing joints with nonzero tensile strengths are intended to represent the effects of joint fracturing on blocks. Note that the cracking of a rock block along a specific direction or plane of weakness does not change the nature of rock fragmentation (Ghaffari et al., 2019). Instead of trying to replicate the complicated fragmentation processes that occur in real rock avalanches, this simplified configuration is intended only to provide an opportunity to investigate the detailed microprocesses of fragmentation and the effects of fragmentation on a sliding and fragmenting rock mass system. Table A1 in the Appendix shows the main variables used in this study.
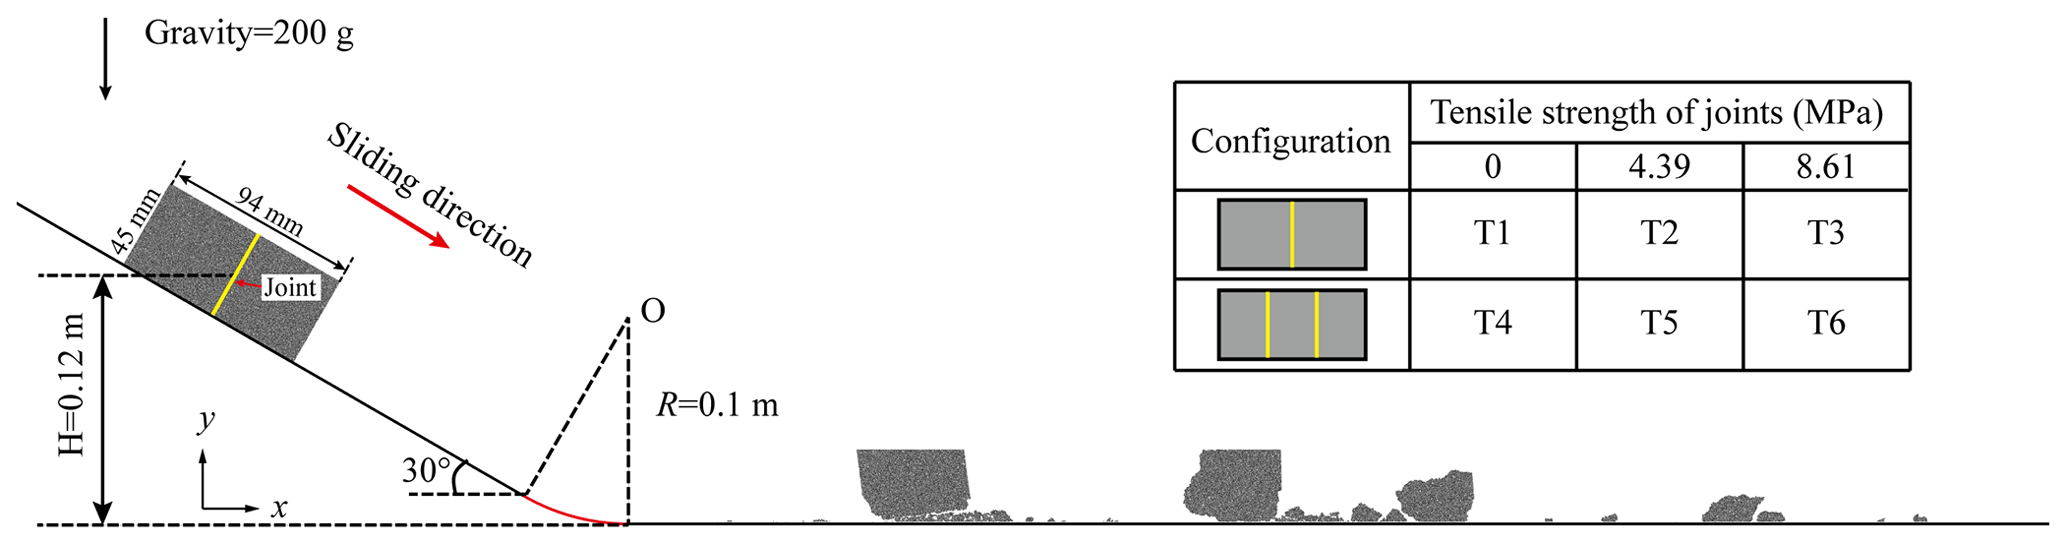
Figure 2Schematic view of the model configuration. The detailed configurations of jointed rock blocks are shown in the inset table, where the yellow lines in the grey blocks represent the positions of joints. The joints, which are 3 mm wide and 45 mm long, equally divide each block.
3.1 Fragmentation of rock blocks
In this section, the cracking along pre-existing joints and the fragmentation of sliding masses are examined. Considering that all of the tests experience a similar process, only the evolutions of T1 and T3 are presented in Fig. 3; these evolutions are described in detail to illustrate the fragmentation processes of rock blocks. For T1, local fragmentation (S1T1) first occurred at the frontal bottom as it reached the arcuate segment of the travel path (Fig. 3a). Next, further local fragmentation occurred in the same part of the block due to the impact, and fracturing began along the pre-existing joint; this is called the separation stage (S2T1). In this stage, the joint fractured completely from the bottom surface to the top surface of the block within a short time. In the following stage (S3T1), the front sub-block was pushed forwards by the rear sub-block, and local fragmentation occurred at the middle top surface. Finally, both of the sub-blocks were deposited along the horizontal plane with different degrees of further fragmentation. For T3, characterized by a higher tensile strength, similar processes of fragmentation and separation were observed (Fig. 3b). Similar to T1, T3 also showed local fragmentation at the frontal bottom of the block as it slid onto the arcuate path (S1T3). Subsequently, more intense local fragmentation occurred (S2T3). Due to the high tensile strength, however, no fracture occurred along the predesigned joint at this stage. Rather, fracturing along the pre-existing joint occurred in a later stage, called the cracking stage (S3T3).
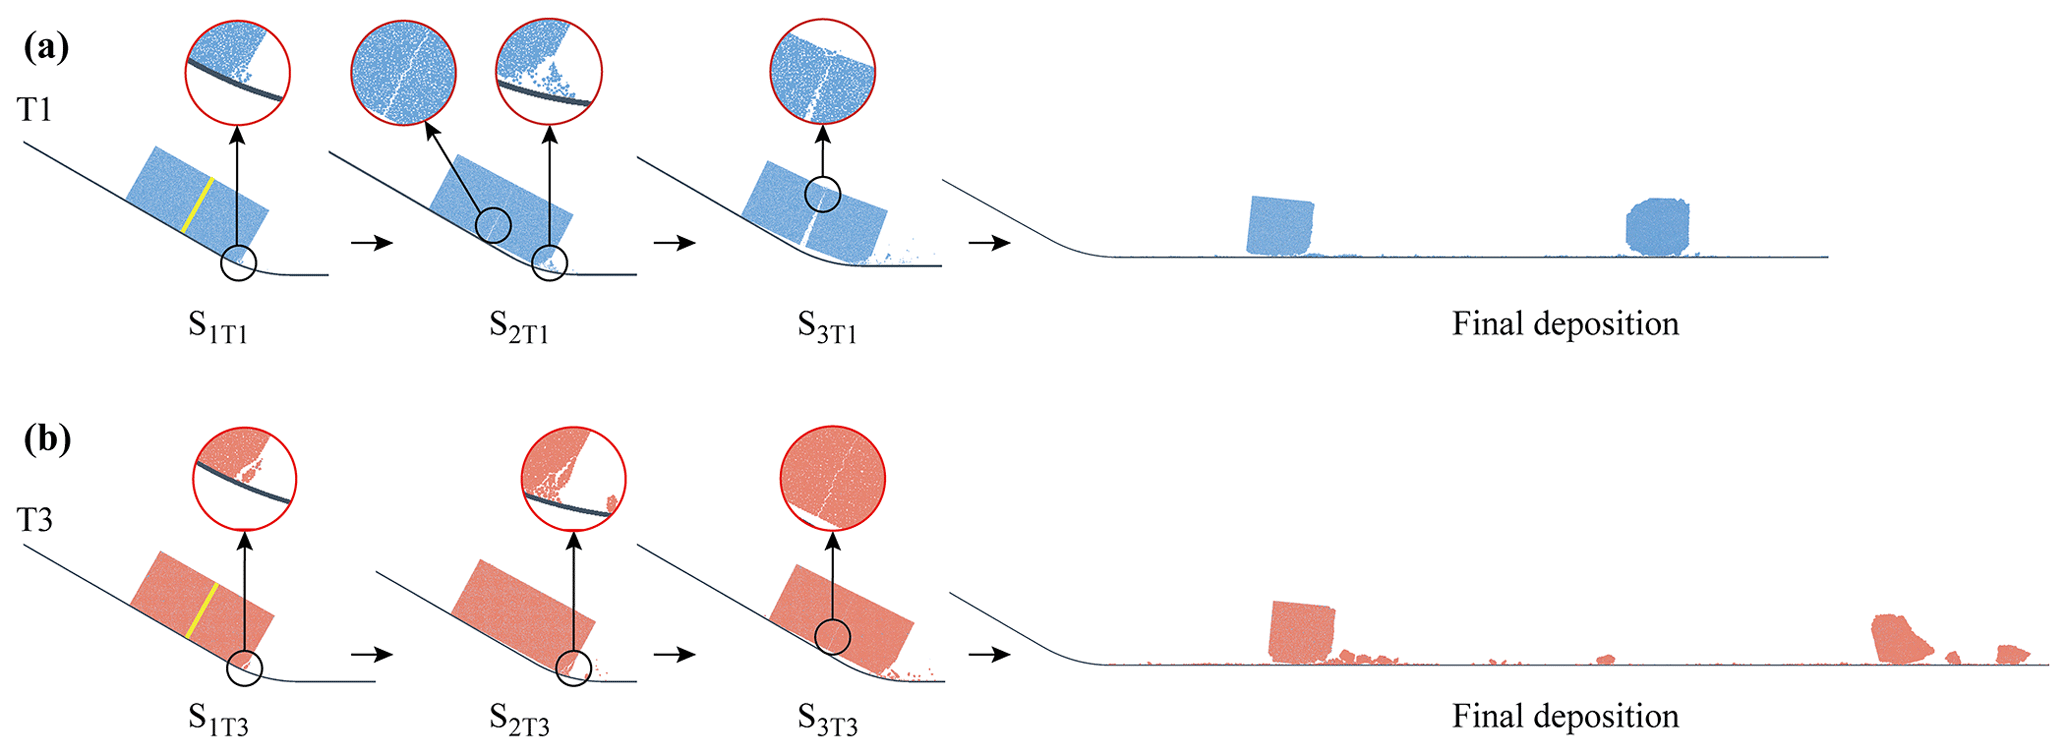
Figure 3(a) Evolution of T1 in the initial stage of fragmentation and its depositional characteristics and (b) evolution of T3 in the initial stage of fragmentation and its depositional characteristics (S1T1, S2T1, S3T1, S1T3, S2T3 and S3T3 represent three specific stages and times for T1 and T3 that are described and analysed later). The light-blue sub-block in the final deposition stage represents the rear sub-block, while the dark-blue sub-block represents the front sub-block.
The separation stage for T1 (S2T1) is represented by two tightly packed rock blocks disintegrating and separating along a specific orientation, which may be any type of discontinuity (rock blocks do not fragment but separate). In contrast, the cracking stage for T3 (S3T3) is represented by the rock block experiencing dynamic cracking and “fragmentation” along a specific orientation (rock blocks separate due to fragmentation). Accordingly, we directly compare these two stages to examine the dynamic mesoscale fragmentation of rock blocks and the rock fragment system dynamics. Note that the travel distance of the centre of mass for T1 is slightly shorter than that for T3.
To determine the exact times when these fragmentation processes occurred, especially the times when the blocks separated along the joints, six monitoring particles near the joint are selected to record their velocity variations. The monitoring particles are symmetrically distributed along both sides of the joint and are equally spaced in the vertical direction, as shown in the inset diagram in Fig. 4a. The distance between the joint and monitoring particles is approximately twice the mean particle size. Following Zhao et al. (2017), nondimensional parameters are employed. The sliding time (t) is normalized by , and the normalized particle velocity () is defined as . The variations in the velocities of the monitoring particles in T1 and T3 are plotted in Fig. 4a and b, respectively. To highlight the fracturing effects along the joints, only the stage when the block reached and travelled along the arcuate path was plotted (–1.808 s). In general, the velocity curves continuously fluctuate due to the interaction between the rock block and sliding path, which leads to the propagation of stress waves and a minuscule velocity difference inside the block (Zhao et al., 2017), as shown in Fig. 4a. At the very beginning, the velocity of each monitoring particle was the same. When the rock block reached the arcuate section of the path, the velocities of the monitored particles at different positions began to diverge. The first local fragmentation time (S1T1) corresponds to the time when the velocities of all monitoring particles began to exhibit vigorous fluctuations, i.e. s. S2T1 is the time when the velocities of particles P3 and P6 bifurcated, i.e. 1.585 s. Then, the joint entered the transient cracking stage (with a duration time of 0.00257 s) and completely fractured at 1.587 s. After 1.617 s, the three monitored particles in the front sub-block maintained their velocity differences and continued to move, while the velocities of the three particles in the rear sub-block gradually converged. As time passed, further fragmentation, i.e. S3T1, occurred at 1.750 s, when the velocities of the monitored particles abruptly fluctuated once again. Figure 4b shows the variations in the velocities of the monitored particles of T3. Two velocity variations were recorded at 1.519 and 1.589 s, corresponding to the local fragmentation stages S1T3 and S2T3. After that, the velocities of particles P3 and P6 separated at 1.627 s, i.e. the S3T3 stage, which is similar to S2T1. The duration time of cracking stage S3T3 (0.00154 s) is significantly shorter than that of the separation stage of T1 (S2T1).
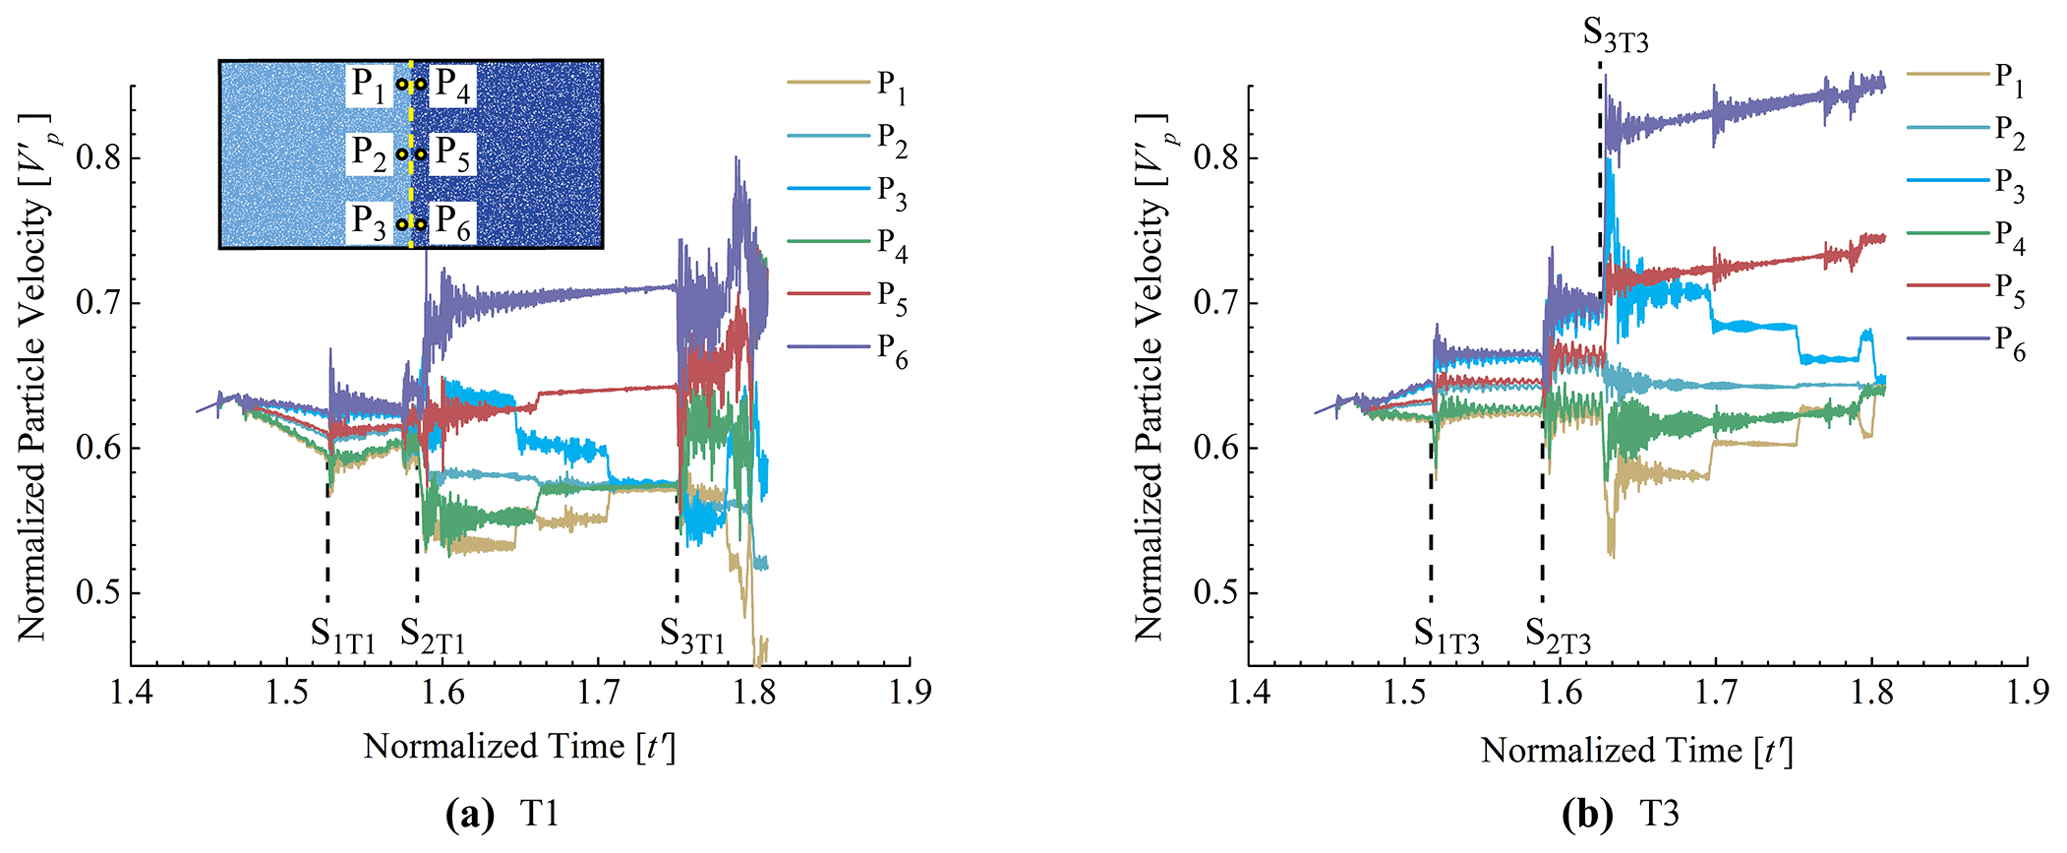
Figure 4(a) Normalized particle velocities of monitoring particles in T1 versus time (the inset diagram shows the relative positions of the six monitoring particles, where and ). (b) Normalized particle velocities of monitoring particles in T3 versus time.
The velocity increases in P5 and P6 at S3T3 were larger and more transient than those at S2T1 during the separation stage. In addition, the velocities of P1 and P3 at S3T3 experienced energetic increases and decreases at the very beginning of the cracking stage, which did not occur during S2T1. As revealed by Fig. 4, the variations in the velocities between the block separation stage (S2T1) and block cracking stage (S3T3) display different characteristics, which may indicate different kinetics and energy conversion styles between block interactions and collisions and the dynamic fragmentation of the rock mass (which is discussed in the following section).
The variations in the velocities of the monitoring particles show a certain difference between the separation (S2T1) and cracking (S3T3) stages of the blocks. To quantify the influences of microscopic differences in the separation and cracking processes on the movement of the block system, the mean horizontal velocities (Vb) of the entire block and the rear and front sub-blocks are calculated. Vb is defined as
where n is the total number of particles in the calculated region, and vx,i and mi are the horizontal velocity and mass of particle i, respectively. Here, Vb is normalized as for analysis. Figure 5a plots the normalized mean horizontal velocities () of T1 and T3 versus time. Corresponding to Fig. 4, the different times when the blocks locally fragmented and separated along joints, i.e. S1T1, S2T1, S3T1, S1T3, S2T3 and S3T3, are also marked in Fig. 5a. obviously fluctuates at the marked times, effectively matching the times when the velocities of the monitored particles abruptly changed (Fig. 4). At the local fragmentation stages (S1T1, S1T3 and S2T3), of the front sub-block increased rapidly when a collision occurred, while of the rear sub-block first presented a rapid decrease and then recovered in a short time. Additionally, of the T3 rear sub-block recovered to higher levels than before after rapid decreases at S1T3 and S2T3. of the T1 rear sub-block recovered to its precollision value only after a rapid decrease at S1T1. Moreover, of the entire T3 block increased significantly at the local fragmentation stages (i.e. S1T3 and S2T3), while that of T1 presented only a minor increase at its local fragmentation stage (S1T1). This contrast may be due to the local fragmentation at the frontal bottom of the front sub-block causing the horizontal ejection of some fragments that achieved a high velocity from the release of strain energy (Fig. 3).
At the separation stage (S2T1), of the T1 front sub-block rapidly increased, while of the T1 rear sub-block inversely decreased. of the entire T1 block first experienced a slight decrease, and then part of the lost velocity recovered in a short time. Similar to S2T1, of the T3 front sub-block and rear sub-block experienced the same increasing and decreasing phases at the cracking stage (S3T3), respectively. However, the increase in of the T3 front sub-block was more energetic than that of the T1 front sub-block at this stage. Moreover, as illustrated in Fig. 5a, the of the entire T3 block shows a slight increase at S3T3, which is different from that of the entire T1 block at S2T1. Particularly, in S3T1, of the entire T1 block and the T1 rear and front sub-blocks all decreased when both sub-blocks collided at the middle top point, and then, of the entire T1 block recovered to its value before collision or was slightly higher than before. Notably, the values of T3 are generally higher than those of T1 after the blocks slid onto the arcuate path (1.48–1.78 s).
To analyse the energy variations in the fragmentation process, the kinetic energy of the entire block, the rear sub-block and the front sub-block is calculated for both T1 and T3. Here, the kinetic energy of the block is calculated as
where n is the total number of particles in the calculated region; vx,i and vy,i are the horizontal and vertical velocities of particle i, respectively; and mi is the mass of particle i. Figure 5b shows the variations in the normalized kinetic energies () of T1 and T3 versus the travel time. It should be noted that only of the entire block (half of the normalized kinetic energy of the entire block) is plotted in Fig. 5b for clarity.
Similar to the variation in the mean horizontal velocity of the rock block (Fig. 5a), in the local fragmentation stages of T1 and T3 (S1T1, S1T3 and S2T3), the kinetic energy of the rear sub-block significantly decreased, while that of the front sub-block obviously increased. Corresponding to such variations, small fragments were ejected from the frontal bottom part of the block after impact, as shown in Fig. 3. This local impact-generated fragmentation was accompanied by a sudden decrease in the total kinetic energy of the entire block, which indicates that the impact–fragmentation process consumes energy. However, although E′ of the entire T3 block shows a decreasing trend at the local fragmentation stage, the mean horizontal velocity () of the entire T3 block presents an increasing trend at this stage, as described above (Fig. 5a). Thus, this increase in the mean velocity of the entire T3 block may be derived from the conversion of energy due to an increase in the vertical velocity loss.
At the separation stage, S2T1, the kinetic energies of the entire T1 block, rear sub-block and front sub-block all suddenly decreased, while E′ of the front sub-block rapidly recovered and increased after the sudden decrease. The characteristics of the variation in the E′ of T3 are different from those at S3T3, with E′ of the T3 front sub-block increasing more than that of T1. More interestingly, E′ of the entire block for T3 quickly rebounded after a transient slight decrease. The magnitudes of the variations in E′ for the rear and front sub-blocks of T3 at S3T3 are much larger than those at S2T1.
Moreover, after the separation of sub-blocks for T1, the rear sub-block impacted and pushed the front sub-block at the middle top part (S3T1). At S3T1, E′ of the entire T1 block and the rear and front sub-blocks all decreased. After this point, E′ of the T1 front sub-block gradually recovered, but E′ of the entire T1 block and rear sub-block continuously decreased. This phenomenon illustrates a typical collision-induced momentum transfer process (Heim, 1932; Van Gassen & Cruden, 1990; Miao et al., 2001).
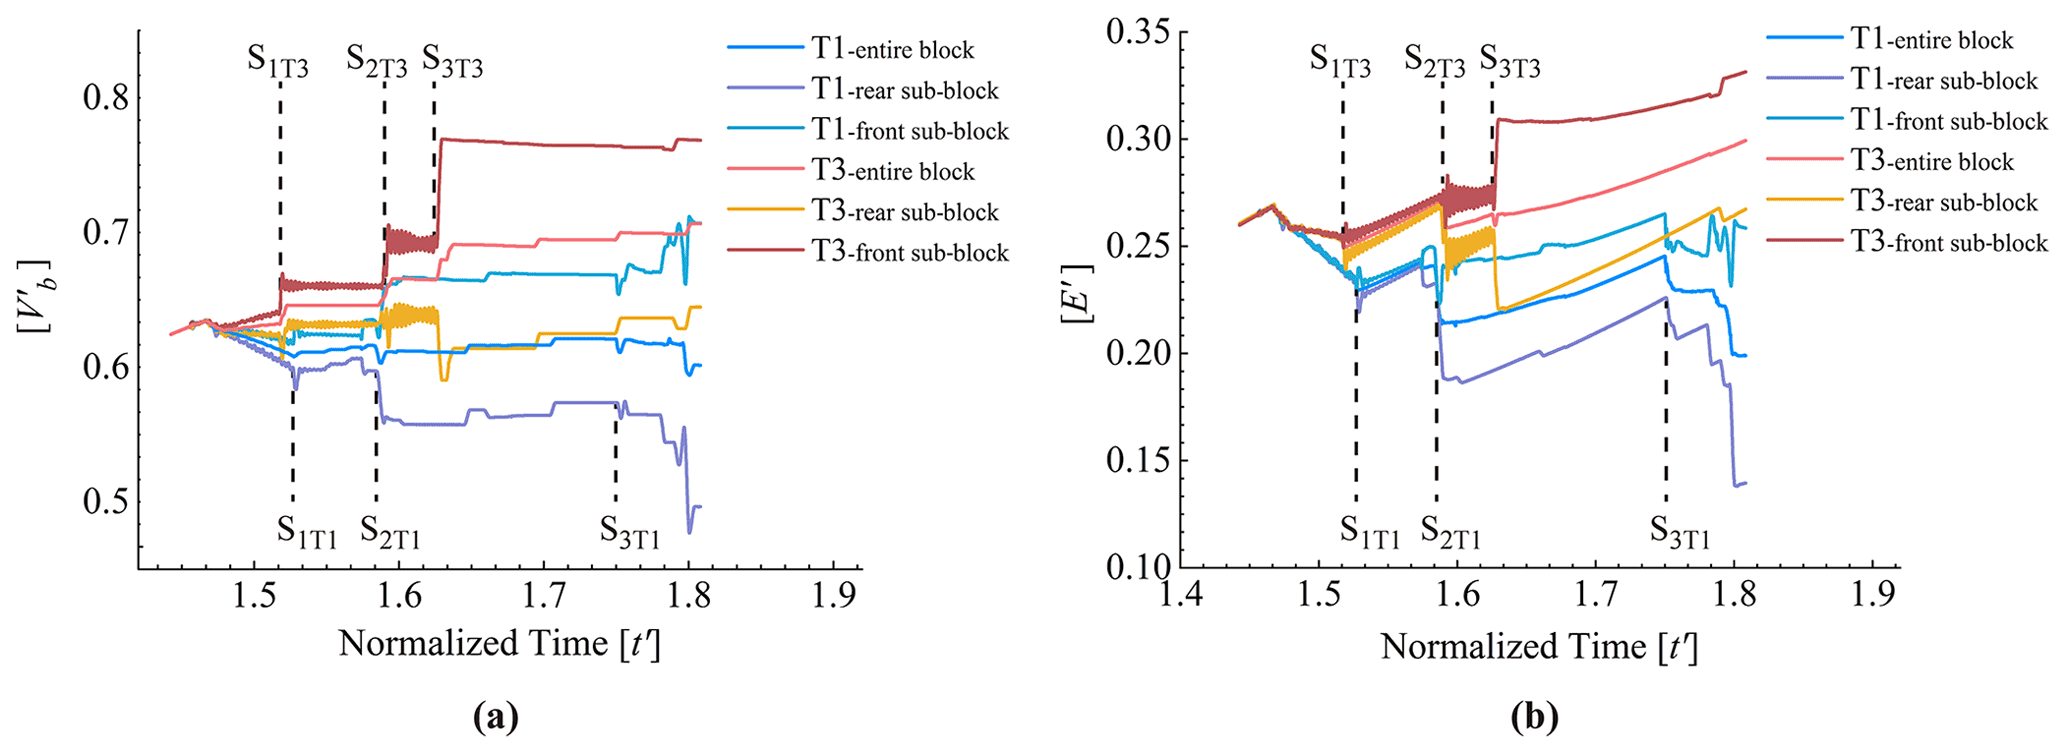
Figure 5(a) Normalized horizontal velocities of the blocks in T1 and T3 versus time (). (b) Normalized kinetic energy evolutions of the blocks in T1 and T3 versus time (). Note that of the entire block is plotted.
3.2 Energy variation
At the local fragmentation stage (S1T1, S1T3 and S2T3), the velocity and kinetic energy for the front part of the block exhibit a clearly increasing trend, while the opposite trend can be observed for the rear part of the block. More importantly, the variations in the block velocities and the kinetic energies of the entire blocks are very different between S2T1 and S3T3. In this section, the effects of joint fracturing and block fragmenting on the redistribution of energy are quantified. For this analysis, the mean horizontal velocity before and after sub-block separation in each test (vbe and vaf) is calculated; then, the incremental ratio in the separation stage of each test is calculated (); φv of the entire block and of the rear and front sub-blocks is obtained in the tests. For the two-joint conditions (T4, T5 and T6) (Fig. 2), sub-blocks usually separated along the frontal joint first. Then, separation occurred along the other joint, accompanied by the concomitant impacting, fragmenting, rolling (usually at the surface of the rock avalanche but not inside the rock mass in real events) and sliding of fragments, resulting in very complicated monitoring curves. Thus, only the incremental velocity ratio of the front joint separation under such conditions is presented and analysed here. The same method is used to calculate the incremental kinetic energy ratios of the blocks (, where Ebe and Eaf are the kinetic energies of the rock block before and after joint separation). Figure 6 depicts the calculated values of φv and φe.

Figure 6(a) Mean horizontal velocity increment expressed as a percentage (φv) and (b) kinetic energy increment expressed as a percentage (φe) in the block separation stage for all tests.
As shown in Fig. 6, the φv and φe values of the rear sub-block in each test are all less than 0, indicating that the rear sub-block lost its horizontal velocity and kinetic energy in the joint cracking stage. In the tests with the same joint set, φv and φe of the entire blocks show increasing trends versus the joint strength. For φv under different joint sets, the values for both blocks increase from nearly 0 to higher values, and the rates of increase in the tests with both joint sets are higher than those characterized by one joint set. Different from φv, the φe values of the entire blocks under both joint set conditions are entirely negative, and both display increasing trends versus the joint strength, with their values tending to 0. The φv values of the front sub-blocks in both joint sets present increasing trends versus increasing joint strength, with all values positive. The highest incremental ratio of φv reaches 15 %. The φe values of the front sub-blocks also show increasing trends versus joint strength, with the highest incremental percentage exceeding 15 %. Different from the regular increasing variations in φv and φe of the entire block and front sub-block, those of the rear sub-blocks present a different feature versus joint strength, namely, an increasing part and a following decreasing trend.
According to the curves shown in Fig. 6b, the relationship between the kinetic energy incremental ratio (φe) of the front sub-block and the tensile strength of the joints (σ, which represents the general strength of the rock mass) can be described by a linear fitting function:
The linear fitting function (Eq. 8) shows that the energy of the front sub-block is greatly enhanced after joint fracturing (which represents the cracking process or the simplest fragmentation process) as the rock mass strength increases. Note that the linear fitting function (Eq. 8) is presented here to describe only the increasing trend of φe with rock strength but is not enough to be considered the real relationship between φe and σ because of insufficient data.
3.3 Deposition characteristics
Figure 7 presents the final deposit features of the rock blocks under all simulated conditions. All of the rock masses cracked mainly along joints. Furthermore, intense fragmentation occurred within the sub-blocks and contributed to the generation of fine particles in the deposits. The frontal sub-blocks clearly present higher degrees of fragmentation than the middle and rear sub-blocks, and the rock masses with two joint sets show higher degrees of fragmentation in the deposits than the rock masses with one joint. Moreover, the deposits of all tests show good preservation of the initial rock mass sequences, which has also been reported in many natural rock avalanches (Heim, 1932; Strom, 2006; Hewitt et al., 2008; Dufresne et al., 2009).
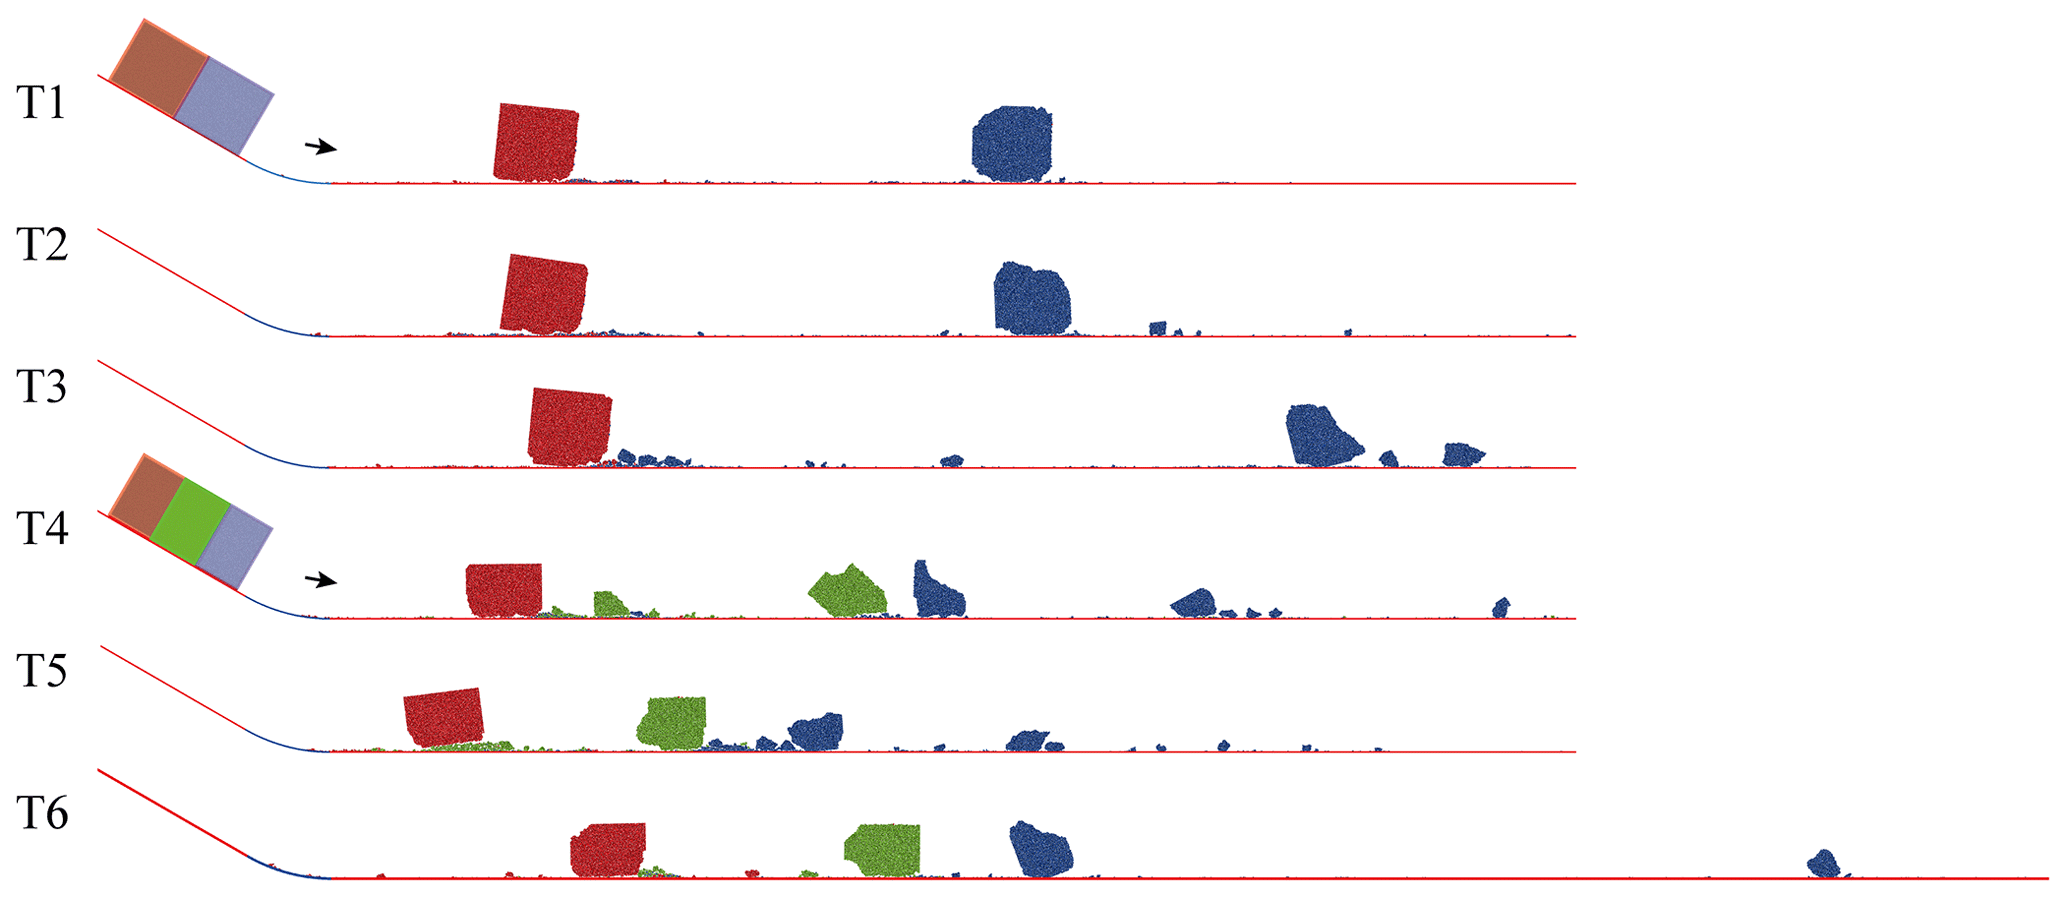
Figure 8 plots the travel distances and degrees of fragmentation of the rock masses. Here, the run-out of the distal edge (Lt) and the run-out of the centre of mass (Lcm) are used to describe the travel distances of the rock masses (Lin et al., 2020). The relative breakage ratio (Fd) is used to describe the degree of fragmentation (Hardin, 1985; Bowman et al., 2012). For the rock masses with one joint (T1, T2 and T3), both Lt and Lcm increase with increasing joint strength, as does the degree of fragmentation (Fd). For the rock masses with two joints (T4, T5 and T6), both Lt and Lcm first display a decreasing trend and then increase versus the joint strength, and the variation in Lt is obviously greater than that in Lcm. Correspondingly, the degree of fragmentation of the deposits first displays an increasing trend and then decreases with the joint strength, indicating the highest degree of fragmentation for T5. Furthermore, the degree of fragmentation of the rock masses with two joints is obviously higher than that of the corresponding rock masses with one joint, although the run-outs of their centres of mass are similar. As shown, T5 has a shorter travel distance (for both the distal edge and the centre of mass) and achieved a higher degree of fragmentation. This difference may be due to the different interactions of the fragments after the initial fragmentation of T5.
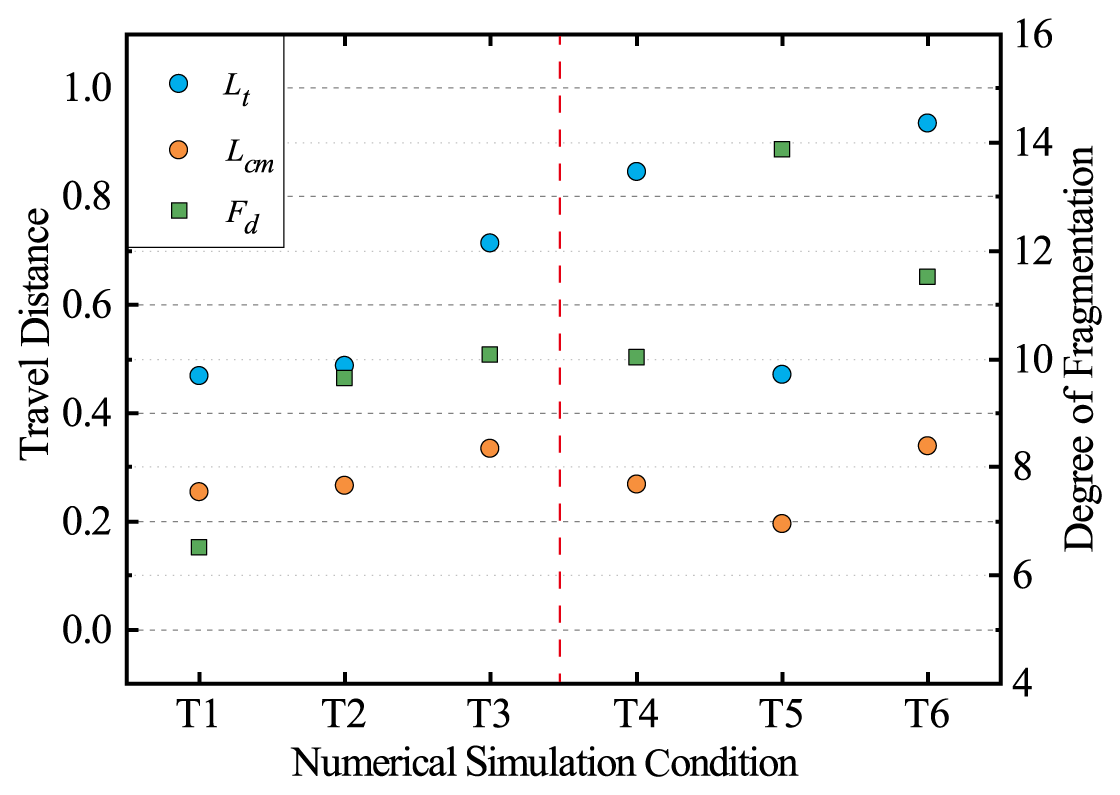
Figure 8Travel distance and degree of fragmentation of all simulations (Lt represents the travel distance of the distal edge, Lcm represents the travel distance of the centre of mass, and Fd represents the degree of fragmentation).
4.1 Variations in energy accumulation and dissipation
Here, the conversion and transformation of energy within the sliding mass during joint fracturing and fragmentation are discussed. McSaveney and Davies (2006) indicated that the remaining strain energy stored in fragmented rock pieces after cracking may be converted into kinetic energy, allowing fragments to be ejected during dynamic fragmentation in an avalanche. However, few direct experiments or numerical simulations have illustrated the energy variation related to the fragmentation of a rock mass during movement (Haug et al., 2016; Zhao et al., 2017). Hence, in this study, the conversion of elastic strain energy during rock mass fragmentation and sliding is analysed.
In the linear parallel bond model, both linear and bond springs can bear stress and generate elastic strain when loaded by a force, although part of the energy may be consumed by dashpots (Potyondy and Cundall, 2004). Thus, the strain energies carried by both linear (Es) and bond (Ebs) springs are calculated, where the total strain energy () is obtained by PFC2D. The elastic strain energy variations in T1 and T3 over time are shown in Fig. 9a, in which the normalized elastic strain energy is normalized by the maximum total strain energy (Ets-max) for better comparison. As shown in Fig. 9a, Ebs is larger than Es most of the time, indicating that parallel bonds carry more strain energy than linear springs between discs when pressurized. The variations in these two strain energy components are synchronized. Furthermore, compared with Figs. 4 and 5, the time when the total strain energy peaks is consistent with the time when the particle velocity, block velocity and kinetic energy abruptly fluctuate. In addition, the value of the elastic strain energy in the cracking stage of T3 (S3T3) is much larger than that in the separation stage of T1 (S2T1), indicating that a rock block with a higher joint strength accumulates more strain energy before fracturing.
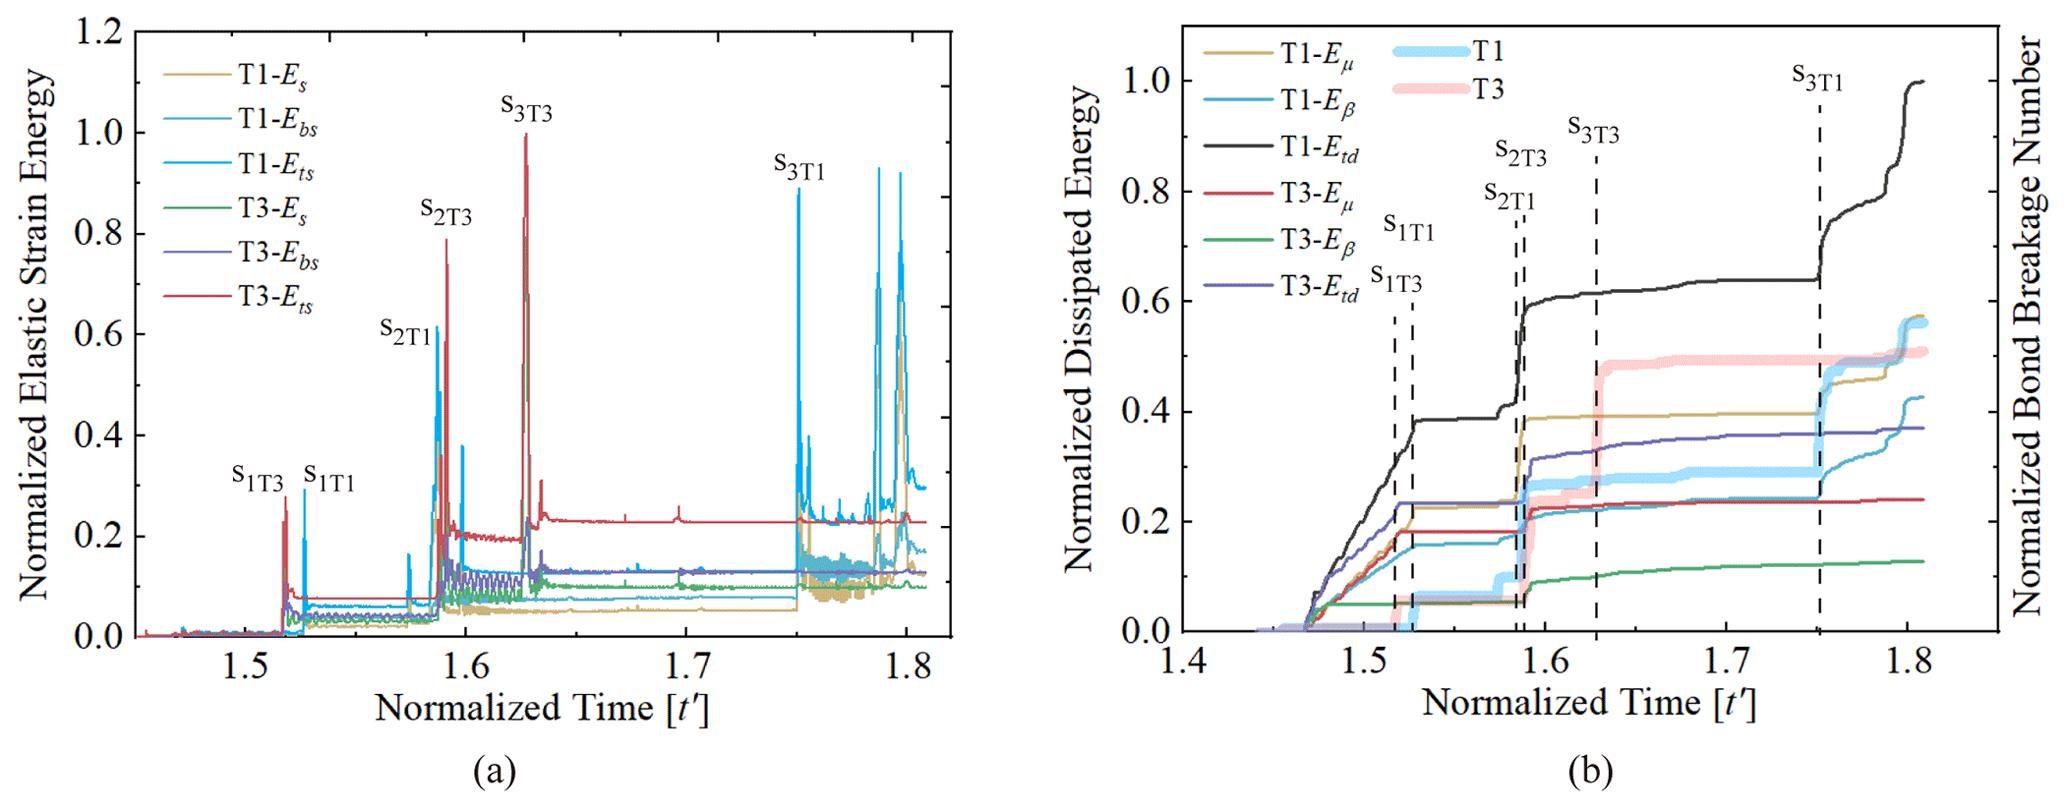
Figure 9(a) Normalized elastic strain energy variation in the sliding blocks in T1 and T3 (normalized by the maximum total strain energy, Ets-max) versus time. (b) Normalized dissipated energy variation in the sliding blocks in T1 and T3 (normalized by the maximum total dissipated energy, Etd-max) versus time. The two bold curves represent the variations in the number of broken bonds (also normalized by the maximum number of broken bonds) in T1 and T3 versus time.
Figure 9b shows the variation in energy dissipation during the rock mass movements of T1 and T3. The energy dissipation is composed of energy dissipated by frictional slip (Eμ, slip energy) and by dashpots (Eβ; dashpot energy represents the energy loss by the collision of clasts). The total dissipated energy () is also calculated. The total dissipated energy is simply normalized by the maximum value of the total dissipated energy (Etd-max) during the recorded stage. Figure 9b also shows the variations in the numbers of broken bonds in T1 and T3 over time, where the value is normalized by the total number of broken bonds during the recorded stage. The evolution of the number of bonds broken and the trend of dissipated energy are synchronized, which is consistent with the variations in the strain energy shown in Fig. 9a. In general, the dashpot energy is lower than the slip energy, but both increase with time. The total energy dissipation of T1 is always larger than that of T3, and their difference increases over time. Correspondingly, the slip energy and dashpot energy of T1 are also larger than those of T3; in particular, the slip energy of T1 greatly increases at S2T1 due to frictional slip along the joint. The fragmentation energy caused by joint fracturing and sub-block breaking can also be reached, albeit with values obviously lower than Eμ and Eβ. In addition, the fragmentation energy of T3 is higher than that of T1, which is consistent with the variations in their numbers of broken bonds. Combined with the variations in the kinetic energy shown in Fig. 5b, the energy conversion of the sliding mass in the recorded time can be deduced. First, when the rock block slides along the arcuate path and interacts with the path surface, part of the kinetic energy is transformed into elastic strain energy stored in bonds and linear springs. Second, bonds break once the impact force is locally greater than the bond strength, and the elastic strain energy stored in those broken bonds vanishes. As the number of broken bonds increases, a crack forms; during this period, the number of broken bonds increases. Third, as the crack continues to develop and the block rebounds, the impact force gradually decreases. At the same time, the remainder of the strain energy stored in the entire block is released, which is eventually converted into the kinetic energy of fragments. The high consistency between the variations in the dissipated energies and the block propagation stages indicates that the energy dissipation due to joint fracturing and sub-block fragmentation is minimal, whereas most energy dissipates due to friction. The existence of joint planes with no initial tensile strength greatly contributes to the dissipation of energy due to the high-frequency interaction between the front and rear sub-blocks along the joint, for example, during the S2T1 stage.
4.2 Energy transfer induced by rock fragmentation
As described above, in T1, we set a joint without tensile strength. With this design, the motion and separation of two closely packed blocks are simulated and reproduced. During the separation stage (i.e. S2T1), the horizontal velocity of the T1 front sub-block increases (↑ 3.72 %), with the rear sub-block losing part of its horizontal velocity (↓ 5.30 %) (Fig. 6a). Moreover, the kinetic energy of the front sub-block increases slightly after a sharp decrease during separation (↓ 2.90 % in total), while that of the rear sub-block shows a continuous decrease (↓ 16.45 %) (Fig. 6b). This process constitutes a typical momentum transfer phenomenon caused by unrelenting collisions between the rear and front sub-blocks, which is very common in granular flows (Heim, 1932; Manzella and Labiouse, 2009; Lai et al., 2017). Considering that the tensile strength of the joint in T1 is 0, collisions are how the front and rear sub-blocks interact during the joint separation process. Hence, we describe this phenomenon as collision-induced energy transfer.
Different from T1, a joint with tensile strength is designed in T3, and the fracturing process of a rock block along a weak joint is simulated. As revealed in Fig. 6, the horizontal velocity and kinetic energy of the T3 front sub-block also increase (↑ 12.56 % and ↑ 15.23 %, respectively), with those of the rear sub-block decreasing (↓ 5.30 % and ↓ 8.89 %, respectively). Considering that the tensile strength of the joint in T3 is not 0, we describe this phenomenon (S3T3) as fragmentation-induced energy transfer. According to Figs. 5, 6 and 8, the fragmentation-induced energy transfer from the rear sub-block to the front sub-block in T3 is due to the release of elastic strain energy and its conversion into kinetic energy, which is also inferred in the literature (Zhang et al., 2000; Li et al., 2005; Davies and McSaveney, 2009; De Blasio and Crosta, 2015). Through a comparison of the kinetic energy evolutions of the entire T1 and T3 blocks (Figs. 5b and 6b), it is concluded that fragmentation-induced energy transfer can clearly lead to a greater increase in kinetic energy (E′) of the frontal sub-block and less energy lost for the entire block (↓ 0.07 %) than can collision-induced energy transfer (resulting in an overall energy loss of 10.76 % for the entire block). Since the efficiency of fragmentation-induced energy transfer is higher than that of collision-induced energy transfer and because fragmentation is a ubiquitous phenomenon in natural rock avalanches, we suggest that dynamic fragmentation may play a more efficient run-out-enhanced role in the spreading of rock masses than particle interactions within unbreakable granular flows during the emplacement of rock avalanches. Indeed, field investigations show that many rock avalanches with high degrees of fragmentation have unpredicted thin deposits (Crosta et al., 2017; Wang et al., 2018b, 2018c), which may be related to fragmentation-induced energy transfer, as indicated by our results.
4.3 Multiscale effects caused by rock fragmentation in rock avalanches
With the design of joints characterized by different strengths and numbers, this study simulates a simplified fragmentation process of rock masses, thereby providing insights into the contribution of fragmentation to rock mass propagation. Although this simplified simulation cannot reproduce the real fragmentation processes of natural rock avalanches, some of the results can still shed light on the details of rock avalanche propagation. Therefore, the following discussion focuses primarily on the multiscale effects of rock fragmentation based on the simulated results and natural rock avalanches to better understand the fragmentation and emplacement of natural rock avalanches.
This study indicates that the release of elastic strain energy is caused predominantly by fragmentation. Energy is transferred between the front and rear sub-blocks due to fragmentation, which promotes the forward movement of the front sub-block and hinders the movement of the rear sub-block (Figs. 5 and 6). Such energy conversion and transfer processes as a result of fragmentation have also been discussed in previous studies (Zhang et al., 2000; Lin et al., 2021; Haug et al., 2016; Bowman et al., 2012). As shown in Fig. 10a and b, the rock blocks along the surface of a sliding rock mass (carapace facies) may experience this kind of dynamic fragmentation (thus, fragments after block fragmentation carry a considerable amount of kinetic energy).
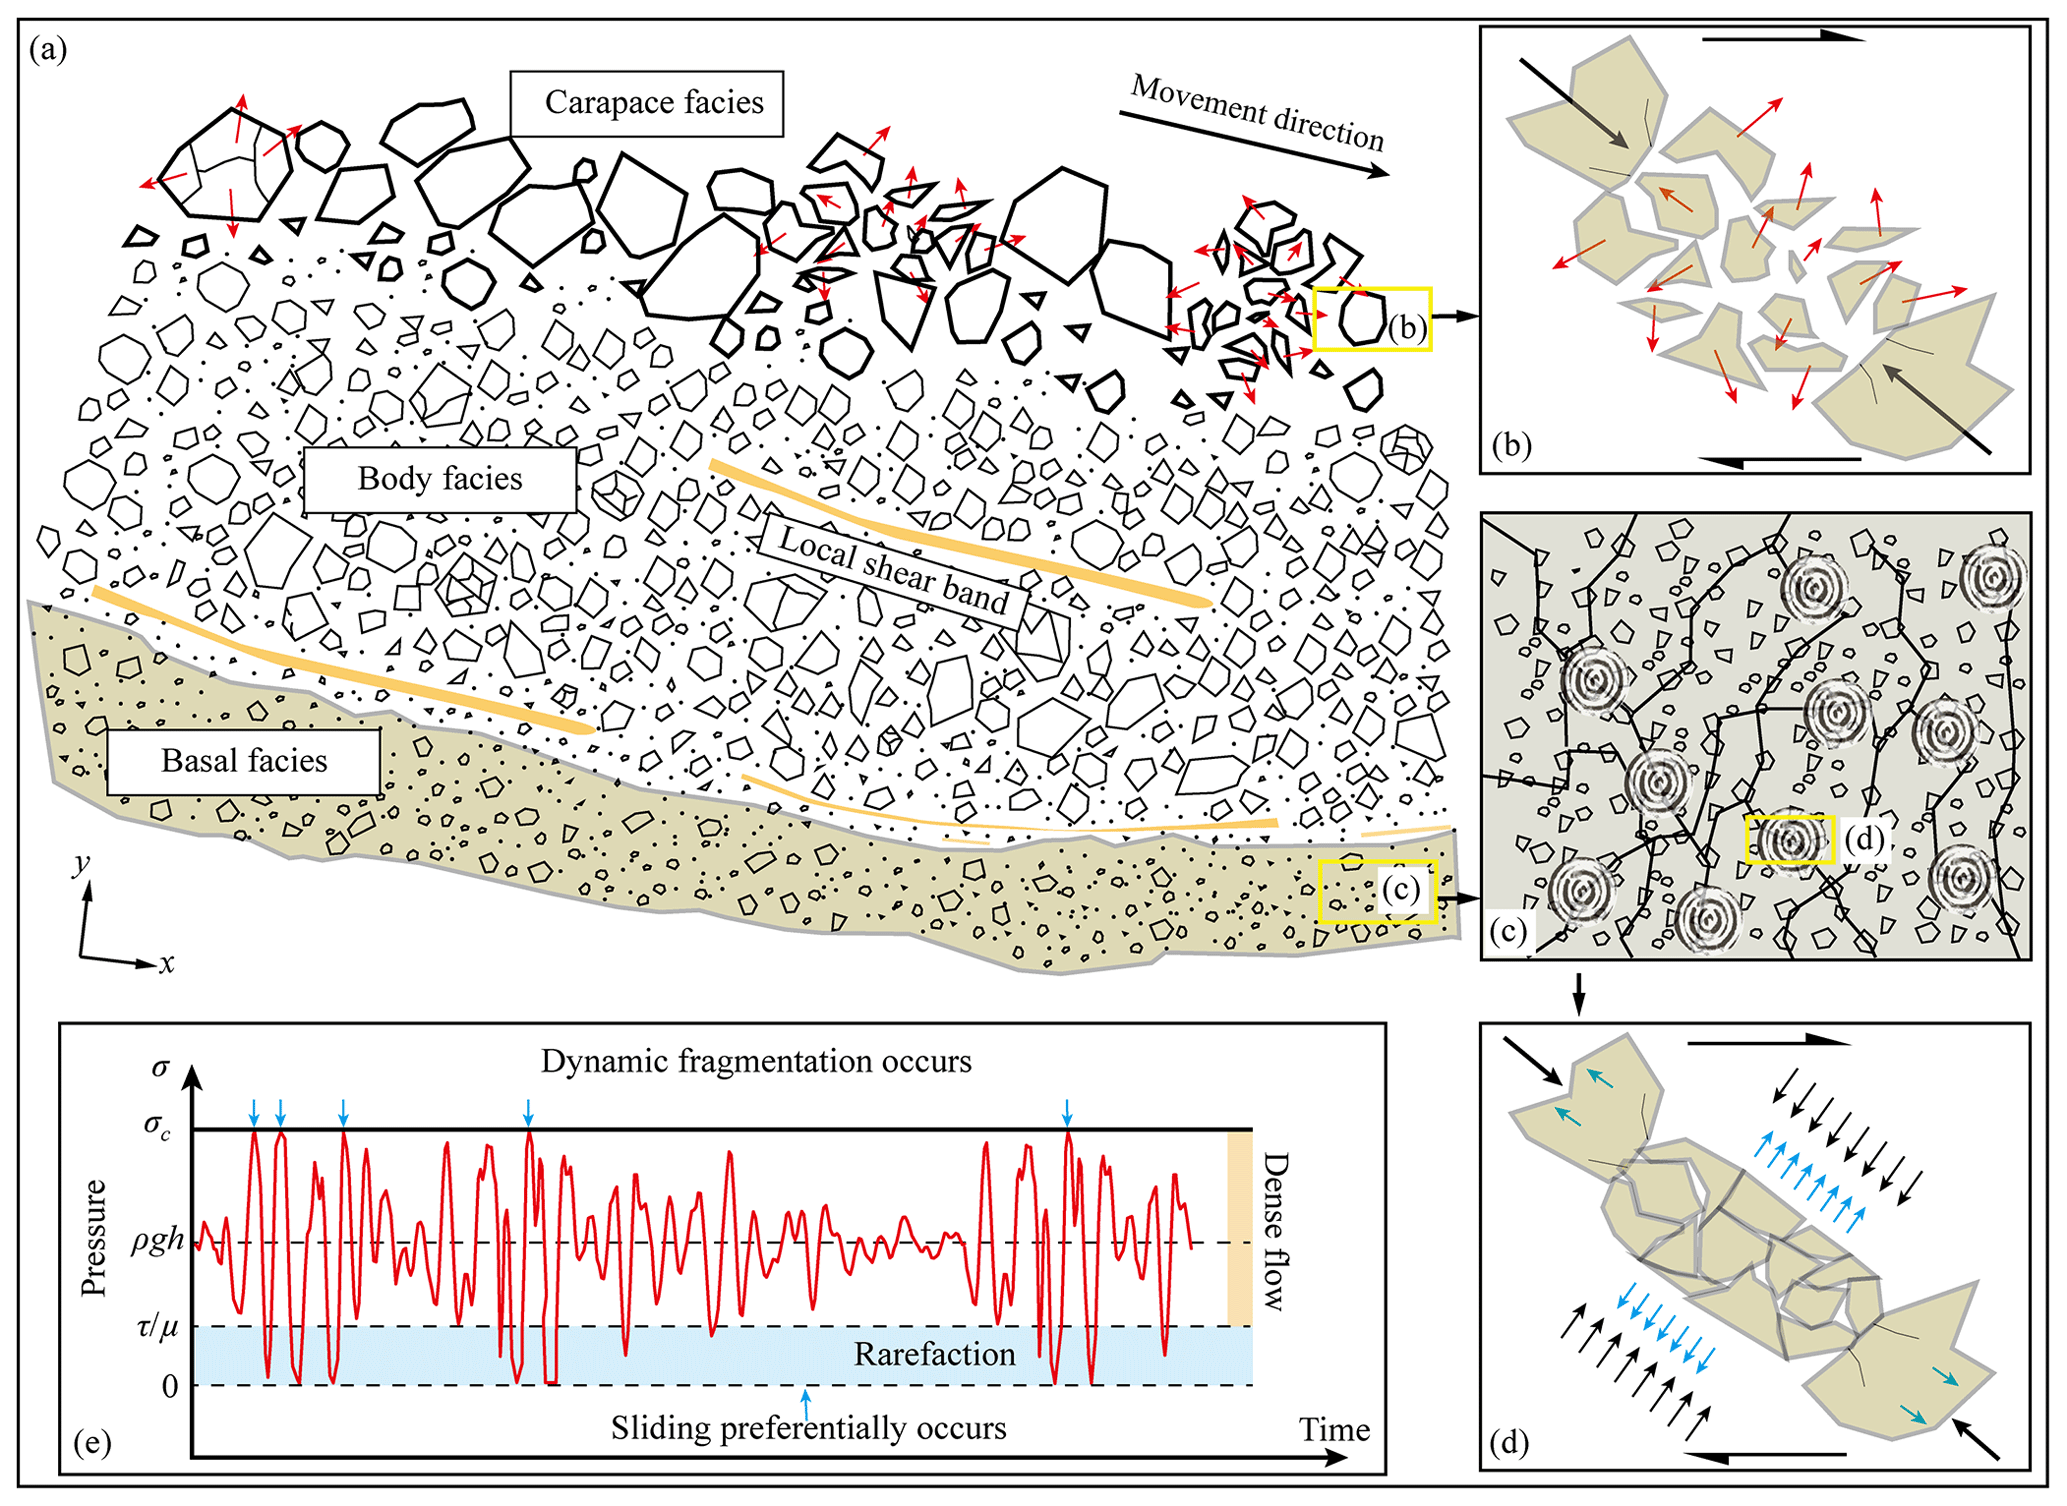
Figure 10(a) Schematic illustration of the fragmentation of countless grains during the propagation of a rock avalanche. (b) Dynamic fragmentation of a rock block without confining pressure (in the carapace facies). (c) Force chain in the shear layer (basal facies) and local fragmentation points (grey–white rings represent the fragmentation points and related radiating stress waves). (d) Schematic illustration of the dynamic fragmentation of a rock block in a force chain with confining pressure (small black arrows represent the confining pressure, and small blue arrows represent the outward stress caused by fragmentation that develops into a stress wave propagating through the entire sliding rock mass) (modified from Melosh, 1979). (e) Pressure variation (red curve) at a point inside a rock mass caused by rock fragmentation during an avalanche (modified from Melosh, 1979). Blue arrows represent the times at which dynamic fragmentation occurs; σc is the critical stress for the rock to fracture.
Generally, normal-stress- and shear-stress-induced fragmentation processes are concentrated under the carapace facies in natural rock avalanches (Estep and Dufek, 2013; De Blasio and Crosta, 2015; Zhang and McSaveney, 2017). For dense granular flows (e.g. rock avalanches), force chains commonly occur. Grains in the force chain experience a higher stress than the surrounding grains (Fig. 10c); thus, they break first when the stress in the force chain is equal to the failure strength of the grains. The entire conversion and transfer process of one rock block observed in our simulation may also reproduce one episode of dynamic rock fragmentation in this force chain for real rock avalanches (Fig. 10c). Note that within a force chain, the strain rate, confining pressure and fracture form do not change the nature of energy conversion during the fragmentation of the rock block (Ghaffari et al., 2019). However, the occurrence of confining pressure in a force chain may alter the mechanism by which elastic strain energy is released. Based on our simulation results, rock fragments spread out with some kinetic energy when there is no confining pressure, as mentioned above (Fig. 10b) (Zhang et al., 2000; Davies and McSaveney, 2009), causing part of the elastic strain energy to transform into the kinetic energy of fragments (fragmentation-induced energy transfer). However, since the grains in the force chains of natural rock avalanches are closely packed under high confining pressure, there is not enough space for the elastic strain energy stored inside the broken grains to be released in the form of the kinetic energy of fragments. For this reason, elastic strain energy is released in the form of outward elastic stress (pressure), also called an elastic body wave by Davies et al. (2019) (Fig. 10d). Thus, as indicated by our simulations, the energy transfer caused by dynamic rock fragmentation in a natural rock avalanche still occurs by means of outward elastic body waves, which eventually affects the movement of the avalanche. Based on the physics of elastic stress wave propagation, the release of elastic stress waves from rock fragmentation during an entire rock avalanche has three effects:
-
Sliding preferentially occurs in the local grain region of dynamic fragmentation in a force chain. As shown in Figs. 3 and 4, fragmented clasts separate because elastic strain energy is released outward. In a natural rock avalanche, these outward elastic stress waves introduced by dynamic rock fragmentation eventually cause the release of pressure carried by other grains within the force chain and their surrounding grains (stress drop after dynamic fragmentation; Fig. 10e). Then, sliding may occur as the shear stress remains unaltered, and the normal stress carried by the force chain suddenly decreases (de Arcangelis et al., 2018).
-
The propagation of elastic stress rarefaction waves superimposed on the stress field of the sliding mass causes the local normal stress to decrease and allows sliding to preferentially occur at locations where fragmentation does not occur (Fig. 10e) (Melosh, 1979; Johnson et al., 2016; Davies and McSaveney, 2016).
-
The elastic stress wave superimposed on the stress field of the sliding mass strengthens the local normal stress and allows fragmentation to subsequently occur at another location.
Note that all three of these effects are based on elastic stress wave fluctuations caused by fragmentation. For the entire basal layer or the main body in a rock avalanche, each fragmentation event may cause an elastic stress wave to be released according to our simulation results. Additionally, rarefaction-stress-wave-induced local sliding (Johnson et al., 2016) can occur within the entire sliding mass and become more concentrated near the bottom of the sliding mass (Fig. 10e). Rarefaction-stress-induced local sliding is controlled by the propagation and interaction of stress waves, the rock strength in the force chain, the overburden pressure, the local shear rate and so on. Therefore, the shear layer in the rock avalanche may thicken due to the random occurrence of local sliding. Moreover, the concentration of rarefaction-stress-induced local sliding in the body facies may lead to the formation of local shear bands despite the low shear rate in the main sliding mass. In contrast, rock breaks when the local superimposed stress exceeds the grain strength in the body facies (Fig. 9e); then, a jigsaw structure forms, and the main part of the strain energy is released as an elastic stress wave once again (Davies and McSaveney, 2009). Such a jigsaw structure may remain in the deposit due to the tight consolidation of the rock mass during the propagation of the rock avalanche and the persistence of grain fragmentation until the rock avalanche stops.
The fracturing and fragmentation processes of a sliding rock block and their influences on the conversion and transmission of energy within the rock mass system are investigated using 2D DEM simulations. Accordingly, the temporal evolutions of the particle velocities and of the velocities and kinetic energies of sub-blocks and the variations in the energy and degree of fragmentation of the entire rock mass system are examined in detail. With these observations, we present the multiscale effects of rock fragmentation on rock mass movement, which should shed light on the dynamics of fragmenting rock masses, such as rock avalanches.
The results show that rock fragmentation can greatly affect the energy variations in different parts of the rock mass. When a rock block cracks, the front sub-block gains additional kinetic energy, while the rear sub-block loses part of its kinetic energy, enabling the front sub-block to travel long distances. These kinetic energy variations are closely related to the release of elastic strain energy during the process of rock fragmentation, which has the same effect as the momentum transfer caused by collisions in a multiblock system. In particular, the energy transfer induced by rock fragmentation more efficiently induces energy transmission in a rock mass system than that induced by collision. Moreover, the increase in kinetic energy of the front sub-block is enhanced with increasing rock strength. This variation in kinetic energy indicates that a rock mass with a higher strength experiences a more energetic fragmentation effect.
Furthermore, the effects of dynamic rock fragmentation on the propagation of rock avalanches and the formation of some deposit structures are qualitatively examined based on our simulation results. Three possible effects of rock fragmentation on an entire rock avalanche are addressed: (1) sliding preferentially occurs at the points of fragmentation, and (2) sliding and (3) fragmentation both preferentially occur at locations that have not yet been fragmented as a result of the superposition of stress waves.
The codes and datasets supporting this research are open-access and available on Zenodo (https://doi.org/10.5281/zenodo.3729541, Lin et al., 2019).
All authors contributed to the data analysis, discussion and improvement of the test. The manuscript was written mostly by QL and YW. Each author contributed in different roles. QL, QC and YW were responsible for conceptualization; QC and YW handled funding acquisition; and YX and KD performed numerical simulations.
The contact author has declared that neither they nor their co-authors have any competing interests.
Publisher's note: Copernicus Publications remains neutral with regard to jurisdictional claims in published maps and institutional affiliations.
We are grateful to Fengshou Zhang, Yuanyuan Zhou, Xiaolong Lin, Zhanqiang Ren and Shitao Liu for their assistance with the DEM simulation and data processing. We would like to thank American Journal Experts (https://www.aje.com/, last access: 24 February 2022) for their English language editing services.
This research has been supported by the National Natural Science Foundation of China (grant nos. 41941017, 41877226 and 41877237) and the Second Tibetan Plateau Scientific Expedition and Research (STEP) programme (grant no. 2019QZKK0906).
This paper was edited by Mario Parise and reviewed by two anonymous referees.
Bi, W., Delannay, R., Richard, P., Taberlet, N., and Valance, A.: Two- and three-dimensional confined granular chute flows: Experimental and numerical results, J. Phys.-Condens. Mat., 17, 2457–2480, https://doi.org/10.1088/0953-8984/17/24/006, 2005.
Bowman, E. T., Take, W. A., Rait, K. L., and Hann, C.: Physical models of rock avalanche spreading behaviour with dynamic fragmentation, Can. Geotech. J., 49, 460–476, https://doi.org/10.1139/t2012-007, 2012.
Collins, G. S. and Melosh, H. J.: Acoustic fluidization and the extraordinary mobility of sturzstroms, J. Geophys. Res., 108, 2473, https://doi.org/10.1029/2003JB002465, 2003.
Crosta, G. B., Franttini, P., and Fusi, N.: Fragmentation in the Val Pola rock avalanche, Italian Alps, J. Geophys. Res., 112, 290–303, https://doi.org/10.1029/2005jf000455, 2007.
Crosta, G. B., Hermanns, R. L., Dehls, J., Lari, S., and Sepulveda, S.: Rock avalanches clusters along the northern Chile coastal scarp, Geomorphology, 289, 27–43, https://doi.org/10.1016/j.geomorph.2016.11.024, 2017.
Crosta, G. B., Frattini, P., Valbuzzi, E., and De Blasio, F. V.: Introducing a new inventory of large Martian landslides, Earth Space Sci., 5, 89–119, https://doi.org/10.1002/2017EA000324, 2018.
Cruden, D. M. and Hungr, O.: The debris of the Frank slide and theories of rockslide-avalanche mobility, Can J. Earth Sci., 23, 425–432, https://doi.org/10.1139/e86-044, 1986.
Cundall, P. A.: A computer model for simulating progressive large scale movement in blocky rock systems, Proc. Sym. Int. Soc. Rock. Mech., Nancy France 1, II-8, October, 1971.
Cundall, P. A. and Strack, O. D. L.: A discrete numerical model for granular assemblies, Géotechnique, 29, 47–65, https://doi.org/10.1680/geot.1980.30.3.331, 1979.
Davies, T. R. and McSaveney, M. J.: A fragmentation spreading model for long-runout avalanches, Can. Geotech. J., 36, 1096–1110, https://doi.org/10.1139/t99-067, 1999.
Davies, T. R. and McSaveney, M. J.: The role of rock fragmentation in the motion of large landslides, Eng. Geol., 109, 67–79, https://doi.org/10.1016/j.enggeo.2008.11.004, 2009.
Davies, T. R. H. and Mcsaveney, M. J.: Comment on “The Reduction of Friction in Long-Runout Landslides as an Emergent Phenomenon” by Brandon C. Johnson, Charles S. Campbell, and H. Jay Melosh, J. Geophy. Res.-Earth, 121, 718–1720, https://doi.org/10.1002/2016JF003954, 2016.
Davies, T. R. H., McSaveney, M. J., and Reznichenko, N. V.: What happens to fracture energy in brittle fracture? Revisiting the Griffith assumption, Solid Earth, 10, 1385–1395, https://doi.org/10.5194/se-10-1385-2019, 2019.
Davies, T. R. H., Reznichenko, N. V., and McSaveney, M. J.: Energy budget for a rock avalanche: fate of fracture-surface energy, Landslides, 17, 3–13, https://doi.org/10.1007/s10346-019-01224-5, 2020.
de Arcangelis, L., Lippiello, E., Ciamarra, M., and Sarracino, A.: Induced and endogenous acoustic oscillations in granular faults, Philos. T. R. Soc. A, 377, 20170389, https://doi.org/10.1098/rsta.2017.0389, 2018.
De Blasio, F. V. and Crosta, G. B.: Fragmentation and boosting of rock falls and rock avalanches, Geophys. Res. Lett., 42, 8463–8470, https://doi.org/10.1002/2015GL064723, 2015.
De Blasio, F. V., Dattola, G., and Crosta, G. B.: Extremely Energetic Rockfalls, J. Geophy. Res.-Earth, 123, 2392–2421, https://doi.org/10.1029/2017JF004327, 2018.
Deng, Q. H., Gong, L. X., Zhang, L. P., Yuan, R. M., Xue, Y. Q., Geng, X. K., and Hu, S. X.: Simulating dynamic processes and hypermobility mechanisms of the wenjiagou rock avalanche triggered by the 2008 wenchuan earthquake using discrete element modelling, B. Eng. Geol. Environ., 76, 923–936, https://doi.org/10.1007/s10064-016-0914-2, 2016.
Dufresne, A., Davies, T. R., and McSaveney, M. J.: Influence of runout-path material on emplacement of the Round Top rock avalanche, New Zealand, Earth Surf. Proc. Land, 35, 190–201, https://doi.org/10.1002/esp.1900, 2009.
Dufresne, A., Bösmeier, A., and Prager, C.: Sedimentology of rock avalanche deposits – Case study and review, Earth-Sci. Rev., 163, 234–259, https://doi.org/10.1016/j.earscirev.2016.10.002, 2016.
Estep, J. and Dufek, J.: Discrete element simulations of bed force anomalies due to force chains in dense granular flows, J. Volcanol. Geoth. Res., 254, 108–117, https://doi.org/10.1016/j.jvolgeores.2012.12.023, 2013.
Evans, S. G., Guthrie, R. H., Roberts, N. J., and Bishop, N. F.: The disastrous 17 February 2006 rockslide-debris avalanche on Leyte Island, Philippines: a catastrophic landslide in tropical mountain terrain, Nat. Hazards Earth Syst. Sci., 7, 89–101, https://doi.org/10.5194/nhess-7-89-2007, 2007.
Evans, S. G., Bishop, N. F., Fidel Smoll, L., Valderrama Murillo, P., Delaney, K. B., and Oliver-Smith, A.: A re-examination of the mechanism and human impact of catastrophic mass flows originating on Nevado Huascarán, Cordillera Blanca, Peru in 1962 and 1970, Eng. Geol., 108, 96–118, https://10.1016/j.enggeo.2009.06.020, 2009.
Fan, X. M., Xu, Q., Scaringi, G., Dai, L., Li, W., and Dong, X.: Failure mechanism and kinematics of the deadly June 24th 2017 Xinmo landslide, Maoxian, Sichuan, China, Landslides, 14, 2129–2146, https://doi.org/10.1007/s10346-017-0907-7, 2017.
Fan, X. Y., Tang, J. J., Tian, S. J., and Jiang, Y. Z.: Rainfall-induced rapid and long-runout catastrophic landslide on 23 July 2019 in Shuicheng, Guizhou, China, Landslides, 17, 2161–2171, https://10.1007/s10346-020-01454-y, 2020.
Foda, M. A.: Landslides riding on basal pressure waves, Continuum Mech. Therm., 6, 61–79, https://doi.org/10.1007/bf01138307, 1994.
Francioni, M., Calamita, F., Coggan, J., De Nardis, A., Eyre, M., Miccadei, E., Piacentini, T., Stead, D., and Sciarra, N.: A Multi-Disciplinary Approach to the Study of Large Rock Avalanches Combining Remote Sensing, GIS and Field Surveys: The Case of the Scanno Landslide, Italy, Remote Sens., 11, 1570, https://doi.org/10.3390/rs11131570, 2019.
Gao, G., Meguid, M. A., Chouinard, L. E., and Xu, C.: Insights into the Transport and Fragmentation Characteristics of Earthquake-Induced Rock Avalanche: A Numerical Study, Int. J. Geomech., 20, 04020157, https://doi.org/10.1061/(ASCE)GM.1943-5622.0001800, 2020.
Gao, G., Meguid, M. A., Chouinard, L. E., and Zhan, W. W.: Dynamic disintegration processes accompanying transport of an earthquake- induced landslide, Landslides, 18, 909–933, https://doi.org/10.1007/s10346-020-01508-1, 2021.
Ghaffari, H. O., Griffith, W. A., and Barber, T. J.: Energy delocalization during dynamic rock fragmentation, Geophys. J. Int., 217, 1034–1046, https://doi.org/10.1093/gji/ggz064, 2019.
Giani, G., Migliazza, M., and Segalini, A.: Experimental and theoretical studies to improve rock fall analysis and protection work design, Rock Mech. Rock Eng., 37, 369–389, https://doi.org/10.1007/s00603-004-0027-2, 2004.
Goguel, J.: Scale-dependent rockslide mechanisms, with emphasis on the role of pore fluid vaporization, Rockslides and Avalanches, 14, 693–705, https://doi.org/10.1016/B978-0-444-41507-3.50028-3, 1978.
Grady, M. E. and Kipp, D. E.: Dynamic rock fragmentation, in: Fracture mechanics of rock, edited by: Atkinson, B. K., Academic Press, 429–475, https://doi.org/10.1016/B978-0-12-066266-1.50006-5, 1987.
Habib, P.: Production of gaseous pore pressure during rock slides, Rock Mech. Rock Eng., 7, 193–197, https://doi.org/10.1007/BF01246865, 1975.
Haug, Ø. T., Rosenau, M., Leever, K., and Oncken, O.: On the Energy Budgets of Fragmenting Rockfalls and Rockslides: Insights from Experiments, J. Geophys. Res.-Earth, 121, 1310–1327, https://doi.org/10.1002/2014JF003406, 2016.
Haug, Ø. T., Rosenau, M., Rudolf, M., Leever, K., and Oncken, O.: Short communication: Runout of rock avalanches limited by basal friction but controlled by fragmentation, Earth Surf. Dynam., 9, 665–672, https://doi.org/10.5194/esurf-9-665-2021, 2021.
Hewitt, K., Clague, J. J., and Orwin, J. F.: Legacies of catastrophic rock slope failures in mountain landscapes, Earth-Sci. Rev., 87, 1–38, https://doi.org/10.1016/j.earscirev.2007.10.002, 2008.
Heim, A.: Landslides and human lives, Vancouver, Bitech Publishers, ISBN 0-921095-06-6, 1932.
Hsü, K. J.: Catastrophic Debris Streams generated by Rockfalls, Geol. Soc. Am. Bull., 86, 129–140, 1975.
Hu, W., Huang, R., and Mcsaveney, M.: Mineral changes quantify frictional heating during a large low-friction landslide, Geology, 46, 223–226, https://doi.org/10.1130/G39662.1, 2018.
Hu, W., Chang, C. S., McSaveney, M., Huang, R., Xu, Q., Zheng, Y., and Yu, J.: A weakening rheology of dry granular flows with extensive brittle grain damage in high‐speed rotary shear experiments, Geophys. Res. Lett., 46, e2020GL087763, https://doi.org/10.1029/2020GL087763, 2020.
Hungr, O. and Evans, S. G.: Entrainment of debris in rock avalanches: An analysis of a long run-out mechanism, Geol. Soc. Am. Bull., 116, 1240–1252, https://doi.org/10.1130/B25362.1, 2004.
Hungr, O., Leroueil, S., and Picarelli, L.: The Varnes classification of landslide types, an update, Landslides, 11, 167–194, https://doi.org/10.1007/s10346-013-0436-y, 2014.
Imre, B., Laue, J., and Springman, S. M.: Fractal fragmentation of rocks within sturzstroms: insight derived from physical experiments within the ETH geotechnical drum centrifuge, Granul. Matter., 12, 267–285, https://doi.org/10.1007/s10035-009-0163-1, 2010.
Itasca Consulting Group: Particle flow code in three dimensions (PFC2D 5.0), Minneapolis, USA, Itasca Consulting Group, 2014.
Johnson, B. C., Campbell, C. S., and Melosh, H. J.: The reduction of friction in long runout landslides as an emergent phenomenon, J. Geophys. Res.-Earth, 121, 881–889, https://doi.org/10.1002/2015JF003751, 2016.
Kent, P. E.: The transport mechanism in catastrophic rock falls, J. Geol., 74, 79–83, 1966.
Kermani, E., Qiu, T., and Li, T.: Simulation of collapse of granular columns using the discrete element method, Int. J. Geomech., 15, 04015004, https://doi.org/10.1061/(asce)gm.1943-5622.0000467, 2015.
Knapp, S. and Krautblatter, M.: Conceptual framework of energy dissipation during Disintegration in rock avalanches, Front. Earth Sci., 8, 263, https://doi.org/10.3389/feart.2020.00263, 2020.
Lai, Z. Q., Vallejo, L. E., Zhou, W., Ma, G., Espitia, J. M., and Caicedo, B.: Collapse of granular columns with fractal particle size distribution: Implications for understanding the role of small particles in granular flows, Geophys. Res. Lett., 44, 12181–12189, https://doi.org/10.1002/2017GL075689, 2017.
Langlois, V. J., Quiquerez, A., and Allemand, P.: Collapse of a two-dimensional brittle granular column: Implications for understanding dynamic rock fragmentation in a landslide, J. Geophys. Res.-Earth, 120, 1866–1880, https://doi.org/10.1002/2014jf003330, 2015.
Legros, F.: The mobility of long runout landslides, Eng. Geol., 63, 301–331, https://doi.org/10.1016/S0013-7952(01)00090-4, 2002.
Li, X. B., Lok, T. S., and Zhao, J.: Dynamic characteristics of granite subjected to intermediate loading rate, Rock Mech. Rock Eng., 38, 21–39, https://doi.org/10.1007/s00603-004-0030-7, 2005.
Li, W. C., Li, H. J., and Dai, F. C.: Discrete element modeling of a rainfall-induced flowslide, Eng. Geol., 149–150, 22–34, https://doi.org/10.1016/j.enggeo.2012.08.006, 2012.
Lin, Q. W., Cheng, Q. G., Xie, Y., Deng, K. F., and Wang, Y. F.: Synthetic dataset used in “Elastic strain energy transmission caused by fragmentation in rock avalanche”, Zenodo [data set and code], https://doi.org/10.5281/zenodo.3729541, 2019.
Lin, Q. W., Cheng, Q. G., Li, K., Xie, Y., and Wang, Y. F.: Contributions of rock mass structure to the emplacement of fragmenting rockfalls and rockslides: insights from laboratory experiments, J. Geophys. Res.-Sol. Ea., 125, e2019JB019296, https://doi.org/10.1029/2019jb019296, 2020.
Lin, Q. W., Cheng, Q. G., Xie, Y., Zhang, F. S., Li, K., Wang, Y. F., and Zhou, Y. Y.: Simulation of the fragmentation and propagation of jointed rock masses in rockslides: DEM modeling and physical experimental verification, Landslides, 18, 993–1009, https://doi.org/10.1007/s10346-020-01542-z, 2021.
Lo, C. M., Lin, M. L., Tang, C. L., and Hu, J. C.: A kinematic model of the Hsiaolin landslide calibrated to the morphology of the landslide deposit, Eng. Geol., 123, 22–39, https://doi.org/10.1016/j.enggeo.2011.07.002, 2011.
Lo, C. M., Lee, C. F., Chou, H. T., and Lin, M. L.: Landslide at su-hua highway 115.9k triggered by typhoon megi in taiwan, Landslides, 11, 293–304, https://doi.org/10.1007/s10346-013-0435-z, 2014.
Locat, P., Couture, R., Leroueil, S., Locat, J., and Jaboyedoff, M.: Fragmentation energy in rock avalanches, Can. Geotech. J., 43, 830–851, https://doi.org/10.1139/t06-045, 2006.
Lucas, A., Mangeney, A., and Ampuero, J. P.: Frictional velocity-weakening in landslides on Earth and on other planetary bodies, Nat. Commun., 5, 3417, https://doi.org/10.1038/ncomms4417, 2014.
Ma, G., Zhang, Y., and Zhou, W.: The effect of different fracture mechanisms on impact fragmentation of brittle heterogeneous solid, Int. J. Impact. Eng., 113, 132–143, https://doi.org/10.1016/j.ijimpeng.2017.11.016, 2018.
Manzella, I. and Labiouse, V.: Flow experiments with gravel and blocks at small scale to investigate parameters and mechanisms involved in rock avalanches, Eng. Geol., 109, 146–158, https://doi.org/10.1016/j.enggeo.2008.11.006, 2009.
Martin, C. D.: The strength of massive Lac Du Bonnet granite around underground openings, PhD thesis, University of Manitoba, Winnipeg, Canada, June, 1993.
McSaveney, M. J. and Davies, T. R. H.: Rapid rock mass flow with dynamic fragmentation: inferences from the morphology and internal structure of rockslides and rock avalanches, edited by: vans, S. G., Mugnozza, G. S., Strom, A., and Hermanns, R. L., Landslides from Massive Rock Slope Failure, the Netherlands, 285–304, https://doi.org/10.1007/978-1-4020-4037-5_16, 2006.
Melosh, H. J.: Acoustic fluidization: A new geology process?, J. Geophys. Res., 84, 7513–7520, https://doi.org/10.1029/JB084iB13p07513, 1979.
Miao, T. D., Liu, Z. Y., Niu, Y. D., and Ma, C. W.: A sliding block model for the runout prediction of high-speed landslides, Can. Geotech. J., 38, 217–226, https://doi.org/10.1139/cgj-38-2-217, 2001.
Morgan, J. and McGovern, P.: Discrete element simulations of gravitational volcanic deformation: 1. Deformation structures and geometries, J. Geophys. Res., 110, B05402, https://doi.org/10.1029/2004JB003252, 2005.
Murugaratnam, K., Utili, S., and Petrinic, N.: A combined DEM-FEM numerical method for Shot Peening parameter optimization, Adv. Eng. Softw., 79, 13–26, https://doi.org/10.1016/j.advengsoft.2014.09.001, 2015.
Nicoletti, P. G. and Sorriso-Valvo, M.: Geomorphic Control of the Shape and Mobility of Rock Avalanches, Geol. Soc. Am. Bull., 103, 1365–1373, https://doi.org/10.1130/0016-7606(1991)103<1365:GCOTSA>2.3.CO;2, 1991.
Nicoletti, P. G., Parise, M., and Miccadei, E., The Scanno rock avalanche (Abruzzi, south-central Italy), Boll. Soc. Geol. Ital., 112, 523–535, 1993.
Perinotto, H., Schneider, J. L., Bachelery, P., Le Bourdonnec, F. X., Famin, V., and Michon, L.: The extreme mobility of debris avalanches: A new model of transport mechanism, J. Geophys. Res.-Sol. Ea., 120, 8110–8119, https://doi.org/10.1002/2015JB011994, 2015.
Pollet, N. and Schneider, J. L. M.: Dynamic disintegration processes accompanying transport of the Holocene Flims sturzstrom (Swiss Alps), Earth Planet. Sc. Lett., 221, 433–448, https://doi.org/10.1016/s0012-821x(04)00071-8, 2004.
Potyondy, D. O. and Cundall, P. A.: A bonded-particle model for rock, Int. J. Rock Mech. Min., 41, 1329–1364, https://doi.org/10.1016/j.ijrmms.2004.09.011, 2004.
Preuth, T., Bartelt, P., Korup, O., and McArdell, B. W.: A random kinetic energy model for rock avalanches: Eight case studies, J. Geophys. Res.-Earth, 115, F03036, https://doi.org/10.1029/2009jf001640, 2010.
Pudasaini, S. P. and Hutter, K.: Avalanche dynamics: dynamics of rapid flows of dense granular avalanches, Springer Berlin, New York, https://doi.org/10.1007/978-3-540-32687-8, 2007.
Rait, K. L., Bowman, E. T., and Lambert, C.: Dynamic fragmentation of rock clasts under normal compression in sturzstrom, Geotech. Lett., 2, 167–172, https://doi.org/10.1680/geolett.12.00038, 2012.
Scheidegger, A. E.: On the Prediction of the Reach and Velocity of Catastrophic Landslides, Rock Mech. Rock Eng., 5, 231–236, https://doi.org/10.1007/BF01301796, 1973.
Shen, W., Zhao, T., and Crosta, G.: Analysis of impact-induced rock fragmentation using a discrete element approach, Int. J. Rock Mech. Min., 98, 33–38, https://doi.org/10.1016/j.ijrmms.2017.07.014, 2017.
Shreve, R. L.: The Blackhawk landslide, Geological Society of America Special Paper, 108, https://doi.org/10.1130/SPE108-p1, 1968.
Shugar, D. H., Jacquemart, M., Shean, D., et al.: A massive rock and ice avalanche caused the 2021 disaster at Chamoli, Indian Himalaya, Science, 373, eabh4455, https://doi.org/10.1126/science.abh4455, 2021.
Silbert, L., Ertas, D., Grest, G., and Halsey, T.: Granular flow down an inclined plane: Bagnold scaling and rheology, Phys. Rev. E, 64, 051302, https://doi.org/10.1103/PhysRevE.64.051302, 2001.
Strom, A. L.: Morphology and internal structure of rockslides and rock avalanches; grounds and constraints for their modelling, in: Landslides from Massive Rock Slope Failure, edited by: Evans, S. G., Scarascia-Mugnozza, G., Strom, A. L., and Hermanns, R. L., NATO Science Series: IV, Earth and Environmental Sciences, Springer, Dordrecht, 305–326, https://doi.org/10.1007/978-1-4020-4037-5_17, 2006.
Strom, A. L., Li, L., and Lan, H.: Rock avalanche mobility: optimal characterization and the effects of confinement, Landslides, 16, 1437–1452, https://doi.org/10.1007/s10346-019-01181-z, 2019.
Thompson, N., Bennett, M. R., and Petford, N.: Development of characteristic volcanic debris avalanche deposit structures: New insight from distinct element simulations, J. Volcanol. Geoth. Res., 192, 191–200, https://doi.org/10.1016/j.jvolgeores.2010.02.021, 2010.
Timar, G., Kun, F., Carmona, H. A., and Herrmann, H. J.: Scaling laws for impact fragmentation of spherical solids, Phys. Rev. E, 86, 016113, https://doi.org/10.1103/PhysRevE.86.016113, 2012.
Utili, S., Zhao, T., and Houlsby, G. T.: 3D DEM investigation of granular column collapse: Evaluation of debris motion and its destructive power, Eng. Geol., 186, 3–16, https://doi.org/10.1016/j.enggeo.2014.08.018, 2015.
Van Gassen, W. and Cruden, D. M.: Momentum transfer and friction in the debris of rock avalanches, Can. Geotech. J., 26, 623–628, https://doi.org/10.1139/t89-075, 1989.
von Wartburg, J., Ivy-Ochs, S., Aaron, J., Martin, S., Leith, K., Rigo, M., Vockenhuber, C., Campedel, P., and Viganò, A.: Constraining the age and source area of the Molveno landslide deposits in the Brenta Group, Trentino Dolomites (Italy), Front. Earth Sci., 8, 164, https://doi.org/10.3389/feart.2020.00164, 2020.
Wang, F. W., Sassa, K., and Wang, G. H.: Mechanism of a long-runout landslide triggered by the August 1998 heavy rainfall in Fukushima Prefecture, Japan, Eng. Geol., 63, 169–185, https://doi.org/10.1016/s0013-7952(01)00080-1, 2002.
Wang, Y. and Tonon, F.: Dynamic validation of a discrete element code in modeling rock fragmentation, Int. J. Rock Mech. Min., 48, 535–545, https://doi.org/10.1016/j.ijrmms.2011.02.003, 2011.
Wang, Y. F., Cheng, Q. G., and Zhu, Q.: Surface microscopic examination of quartz grains from rock avalanche basal facies, Can. Geotech. J., 52, 167–181, https://doi.org/10.1139/cgj-2013-0284, 2015.
Wang, Y. F., Dong, J. J., and Cheng, Q. G.: Velocity-dependent frictional weakening of large rock avalanche basal facies: Implications for rock avalanche hypermobility?, J. Geophys. Res.-Sol. Ea., 122, 1648–1676, https://doi.org/10.1002/2016JB013624, 2017.
Wang, Y. F., Dong, J. J., and Cheng, Q. G.: Normal Stress-Dependent Frictional Weakening of Large Rock Avalanche Basal Facies: Implications for the Rock Avalanche Volume Effect, J. Geophys. Res.-Sol. Ea., 123, 3270–3282, https://doi.org/10.1002/2018JB015602, 2018a.
Wang, Y. F., Cheng, Q. G., Shi, A. W., Yuan, Y. Q., Yin, B. M., and Qiu, Y. H.: Sedimentary deformation structures in the Nyixoi Chongco rock avalanche: Implications on rock avalanche transport mechanisms, Landslides, 16, 523–532, https://doi.org/10.1007/s10346-018-1117-7, 2018b.
Wang, Y. F., Cheng, Q. G., Lin, Q. W., Li, K., and, Yang, H. F.: Insights into the kinematics and dynamics of the Luanshibao rock avalanche (Tibetan Plateau, China) based on its complex surface landforms, Geomorphology, 317, 170–183, https://doi.org/10.1016/j.geomorph.2018.05.025, 2018c.
Wang, Y. F., Cheng, Q. G., Shi, A. W., Yuan, Y. Q., Qiu, Y. H., and Yin, B. M.: Characteristics and transport mechanism of the Nyixoi Chongco rock avalanche on the Tibetan Plateau, China, Geomorphology, 343, 92–105, https://doi.org/10.1016/j.geomorph.2019.07.002, 2019.
Wang, Y. F., Cheng, Q. G., Yuan, Y. Q., Qiu, Y. H., and Yin, B. M.: Emplacement mechanisms of the Tagarma rock avalanche on the Pamir-western Himalayan syntaxis of the Tibetan Plateau, China, Landslides, 17, 527–542, https://doi.org/10.1007/s10346-019-01298-1, 2020.
Weidinger, J. T., Korup, O., Munack, H., Altenberger, U., Dunning, S. A., and Tippelt, G.: Giant rockslides from the inside, Earth Planet. Sc. Lett., 389, 62–73, https://doi.org/10.1016/j.epsl.2013.12.017, 2014.
Yoon, J.: Application of experimental design and optimization to PFC model calibration in uniaxial compression simulation, Int. J. Rock Mech. Min., 44, 871–889, https://doi.org/10.1016/j.ijrmms.2007.01.004, 2007.
Zhang, Z. X., Kou, S. Q., Jiang, L. G., and Lindqvist, P. A.: Effects of loading rate on rock fracture, Int. J. Rock Mech. Min., 37, 745–762, https://doi.org/10.1016/S1365-1609(00)00008-3, 2000.
Zhang, M. and McSaveney, M. J.: Rock-avalanche deposits store quantitative evidence on internal shear during runout, Geophys. Res. Lett., 44, 8814–8821, https://doi.org/10.1002/2017GL073774, 2017.
Zhang, S. L., Yin, Y. P., Hu, X. W., Wang, W. P., Li, Z. L., Wu, X. M., Luo, G., and Zhu, S. N.: Geo-structures and deformation-failure characteristics of rockslide areas near the Baige landslide scar in the Jinsha River tectonic suture zone, Landslides, 18, 1–21, https://doi.org/10.1007/s10346-021-01741-2, 2021.
Zhao, T. and Crosta, G. B.: On the dynamic fragmentation and lubrication of coseismic landslides, J. Geophys. Res.-Sol. Ea., 123, 9914–9932, https://doi.org/10.1029/2018JB016378, 2018.
Zhao, T., Crosta, G. B., Utili, S., and De Blasio, F. V.: Investigation of rock fragmentation during rockfalls and rock avalanches via 3-D discrete element analyses, J. Geophys. Res.-Sol. Ea., 122, 678–695, https://doi.org/10.1002/2016JF004060, 2017.
Zhao, T., Crosta, G. B., Dattola, G., and Utili, S.: Dynamic fragmentation of jointed rock blocks during rockslide-avalanches: Insights from discrete element analyses, J. Geophys. Res.-Sol. Ea., 123, 3250–3269, https://doi.org/10.1002/2017JB015210, 2018.