the Creative Commons Attribution 4.0 License.
the Creative Commons Attribution 4.0 License.
 | 21 Dec 2022
A global open-source database of flood-protection levees on river deltas (openDELvE)
Jana R. Cox
Joey O'Dell
Douglas A. Edmonds
Paolo Scussolini
Flood-protection levees have been built along rivers and coastlines globally. Current datasets, however, are generally confined to territorial boundaries (national datasets) and are not always easily accessible, posing limitations for hydrologic models and assessments of flood hazard. Here, we bridge this knowledge gap by collecting and standardizing global flood-protection levee data for river deltas into the open-source global river delta levee data environment, openDELvE. In openDELvE, we aggregate levee data from national databases, reports, maps, and satellite imagery. The database identifies the river delta land areas that the levees have been designed to protect. Where data are available, we record the extent and design specifications of the levees themselves (e.g., levee height, crest width, construction material) in a harmonized format. The 1657 polygons of openDELvE contain 19 248 km of levees and 44 733.505 km2 of leveed area. For the 153 deltas included in openDELvE, 17 % of the land area is confined by flood-protection levees. Around 26 % of delta population lives within the 17 % of delta area that is protected, making leveed areas densely populated. openDELvE data can help improve flood exposure assessments, many of which currently do not account for flood-protection levees. We find that current flood hazard assessments that do not include levees may exaggerate the delta flood exposure by 33 % on average, but up to 100 % for some deltas. The openDELvE is made public on an interactive platform (https://www.opendelve.eu/, 1 October 2022), which includes a community-driven revision tool to encourage inclusion of new levee data and continuous improvement and refinement of open-source levee data.
- Article
(8008 KB) - Full-text XML
-
Supplement
(542 KB) - BibTeX
- EndNote


1.1 What are levees and what do they do?
Levees are banks of sediment or artificial material that prevent water from entering areas where it is not desirable. They are common in delta plains and protect the populations and assets from water level fluctuations of rivers and seas. Levees have been constructed to mitigate flood risk and direct water flows throughout human civilization. Recorded building of levees along the River Nile in Egypt began around 4600 BP (Westermann, 1919), which indicates the innate link between the settlement of coastal populations and the development of levees. Modern materials and engineering concepts have altered the overall appearance and effectiveness of levees, but the basic principle has remained the same for millennia.
Levees can also have negative environmental consequences. They alter sediment transport and sedimentation patterns as sediment deposition behind levees is usually reduced. Areas protected by levees can subside relative to the surroundings (Middelkoop et al., 2010), resulting in increased risk of coastal and river flooding in the longer term (Pinter et al., 2008; Criss and Shock, 2001; Pinter, 2005; Munoz et al., 2018). In particular, leveed deltas are at risk to be locked in (Santos and Dekker, 2020) as areas become sediment-starved and cease to keep up with sea level rise (Pinter et al., 2016). Another example of the negative effect of levees is in Australia, where undocumented private levees, intended to protect land, resulted in degradation of the floodplain ecosystem, and contributed to flash flood risk by disconnecting floodplains and channels (Steinfeld et al., 2013).
Because of the negative consequences, contemporary river and flood management projects often prioritize nature-based solutions that limit the need for levees (Esteves, 2014; Cohen-Shacham et al., 2016; Van Wesenbeeck et al., 2014). In deltas in particular, levees are sometimes removed to pursue sedimentation-enhancing strategies (Cox et al., 2022) that restore natural delta functions, but this may not always be possible.
1.2 Why (data of) levees matter
Data on levees are important, especially for river deltas. People living in river deltas face mounting threats: they are disproportionately affected by coastal flooding and relative sea level rise (Edmonds et al., 2020) and rely on river sediment supply that is diminishing in many places (Dunn et al., 2019). Data on levees can help to assess these threats.
Mapping the presence of levees is useful for hydrologic and hydrodynamic modeling. Such models are used to predict inundation during high water levels in rivers or in the sea, and help active management of risk and hazard to life. Models are also used to design levees by simulating a specific flood return period or flood scenario. Levees can be incorporated into detailed models (e.g., HEC-RAS, US Army Corps of Engineers, 2020; or Delft3D, Lesser et al., 2004) as a geometric feature within an initial surface topography. For models on larger scales, levees are too small to be included directly and are sometimes presented as a sub-grid feature or through a flood-attenuation proxy (Sampson et al., 2015).
Data on levees can help to better understand human-landscape interactions (Werner and McNamara, 2007; Wang et al., 2021). One of these interactions is the so-called levee effect, defined by Gilbert White in 1947, whereby levee building creates an excessive sense of security, which leads to increased development and increased flood exposure (Hutton et al., 2019). This effect of levees is thought to contribute to larger exposure to low-probability floods in delta cities. New Orleans after Hurricane Katrina is an example (Kates et al., 2006). Data on levees can help to assess the co-evolution of levees and development prior to, and in response to disasters both present and future, and better understand the levee effect (Di Baldassarre et al., 2018).
Levee data can also help studies on levee failures, which are a globally significant source of flood risk. Özer et al. (2019) have developed the International Levee Performance Database (ILPD), presenting data on levee testing and failure events in an interactive and searchable interface. Levee data for hazard assessment purposes are additionally useful outside the realm of geophysical modeling, and are the core of civil engineering and emergency response management for levee performance, such as during the safety and risk calculation of hurricanes (Mitchell et al., 2013). Data can also be relevant for large-scale studies into the effects and costs of levees, and in their comparison with alternative flood risk reduction strategies in these areas (Ibáñez et al., 2014; Scussolini et al., 2017; Vuik et al., 2019; Cox et al., 2022). The insurance industry, local residents, and homeowners are additional users of levee data and modeling outputs that may help with their hazard and risk assessments (National Research Council, 2013).
1.3 A (data) gap in levees
Despite the potential use of levee data, locations and characteristics of levees are often poorly documented (Scussolini et al., 2016; Özer et al., 2019), resulting in inaccuracies and challenges for flood risk modeling (Sampson et al., 2015; Trigg et al., 2016; Winsemius et al., 2016; Dullaart et al., 2021), hazard modeling (Di Baldassarre et al., 2009), and sea level rise impact modeling (Nienhuis and van de Wal, 2021). Accurate models require data input about levees including their spatial extent, protected area, and basic attributes, which currently do not exist in a coherent and harmonized single geospatial data format.
Levees themselves are not new creations, and so most data that references the locations and standards are historical and recorded in paper form (maps, plans etc.). It is typically governments and municipal organizations who plan and construct levees. These institutions (e.g., USACE) also maintain them as part of their daily operations and produce maps and datasets about their design, operation, and failure. This gives a plethora of data, such as reports and design specifications, which enable accurate data gathering and collection processes without the need for in-person observation (e.g., USACE National Levee Database, https://levees.sec.usace.army.mil/, last access: 1 October 2022). Generally, this results in good quality central national databases, sometimes complemented by higher resolution regional variants (e.g., New South Wales Distinctive Land Surface Dataset, Australia), but they rarely extend past administrative borders. Data availability can also be publicly restricted.
Poor data on levee existence and levee properties have made it such that their presence is often disregarded in global flood modeling (Trigg et al., 2016) and global delta modeling (Nienhuis et al., 2020). The lack of levee data results in suboptimal modeling results (Fleischmann et al., 2019). The WRI AQUEDUCT Global Flood Analyzer is an example (https://www.wri.org/data/aqueduct-global-flood-analyzer, last access: 1 October 2022). It provides exceptional global level flood hazard data but does not include levees and results in overpredicted flood exposure for heavily leveed areas such as the Netherlands.
While specific aspects of levee failure have been documented and aggregated globally (i.e., Özer et al., 2019), we are not aware of any open-source approaches that collect, harmonize and attribute information on levee extent. The lack of global registration of levees complicates flood management efforts. As an alternative, FLOPROS (Scussolini et al., 2016) presents a global dataset on existing and policy level flood-protection standards. This implicitly includes the flood protection offered by levees, but does not include data on levees. Other approaches exist that use (semi-)automated algorithms to locate and specify levees from LIDAR data (e.g., Steinfeld et al., 2013; Wing et al., 2019) but this is restricted by data availability and is not yet globally possible. A levee database can help provide information to those algorithms and provide validation and calibration data. Besides the registration of their existence of levees, communication and awareness of this information is important to enable the above-listed uses of levee information.
1.4 Objective
The objective of openDELvE is to provide a source of delta levee protection data, for both primary use in flood and hazard modeling, as well as secondary community use through increased data availability by publishing the data on a public website (http://www.opendelve.eu, last access: 1 October 2022) following standardized data types. The openDELvE includes links to original data sources, as well as a user-led amendment reporting function. Examples are also given of openDELvE use for hazard modeling and delta modeling improvements.
2.1 Overview
The openDELvE is a collection of existing data on levees and protection features on deltas. We have collected data from vector, raster, and documentary sources. This resulted in two geospatial layers – one for levees, and one for leveed areas – and a supporting index dataset linked to the respective delta by a unique identifier and cross-mapped to the river delta dataset of Edmonds et al. (2020). Our methods allow replicable tracing, processing, assimilation, and display of the data. By storing individual level references and assessing data quality, we aim to provide data that are open and transparent. Our work is underpinned by the principles of FAIR science to support reuse by producing data that is Findable, Accessible, Interoperable, and Reusable (Wilkinson et al., 2016). The openDELvE development followed these steps: data definition (Sect. 2.2), data collection (Sect. 2.3), data processing (Sect. 2.4), data attribution (Sect. 2.5), data management (Sect. 2.6), and data assurance (Sect. 2.7).
2.2 Data definition
We followed our definition of levees from Sect. 1.1. Levees globally exist along coasts and rivers, but the scope of openDELvE is limited to river deltas (Sect. 2.4.1). We made use of a database of deltaic locations and deltaic area extent by Caldwell et al. (2019) and Edmonds et al. (2020). We further limited ourselves to only storing information on defenses that are permanent features, and not temporary/reactive measures. Sandbags and hoardings deployed for flash flooding or imminent but irregular flood issues are temporary, and so are usually not mapped and were not considered for inclusion in this database.
The openDELvE is designed to represent levees as geospatially explicit vector data, i.e., lines and polygons. For source data that exist in reports on maps and technical drawings, levee presence is often reduced to a raster map element, and so needed to be sufficiently georeferenced and assessed for quality. However, we still consider this a valid data source and have included it in our process. We consider the age, source document, and data quality as we recognize that data may be reworked and requoted a number of times in its lifespan.
The openDELvE consists of three data elements: an index table and two vector layers (Table 1), each with a set of standardized attributes (Table 2). The data include a data quality class and a direct link to the source dataset. We devised the data quality criteria included in Table 3.
Table 1Data entities in the live viewing environment and their exported file types as in the research data store.

Table 2openDELvE attributes for the three data elements (as per Table 1). Conversion factors and mapping of fields are given in Table S2 (in the Supplement).
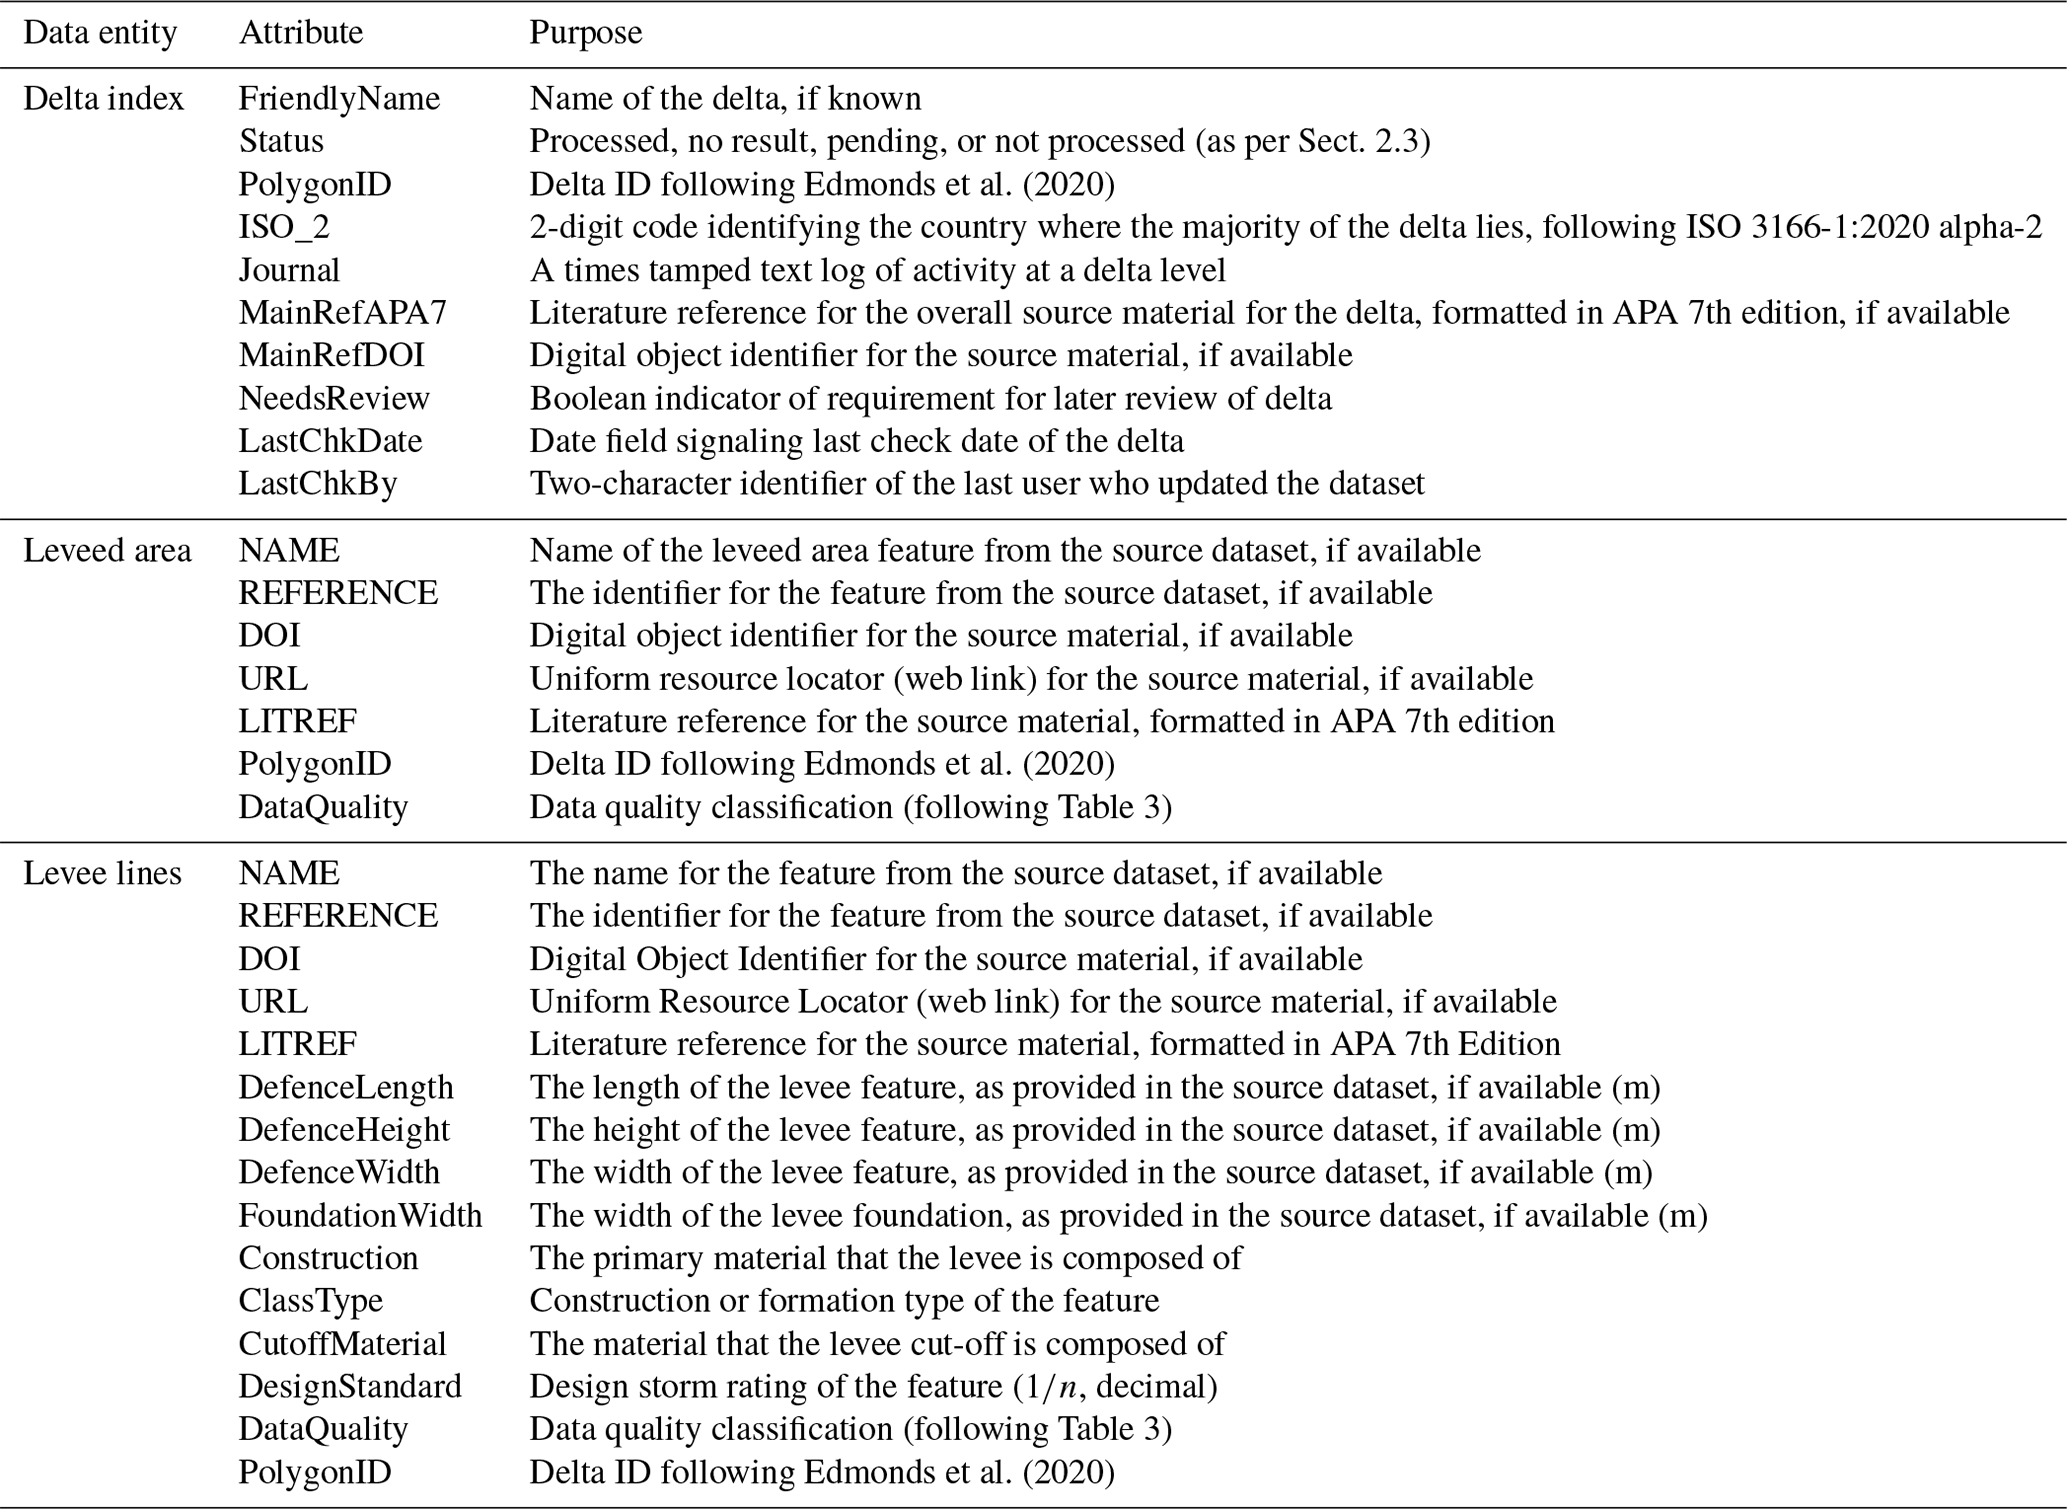
Table 3Data quality definition for levees based on data provenance, both for use in initial data classification and ongoing maintenance. Criteria are exclusively applied: all categories must be met to meet a certain classification.
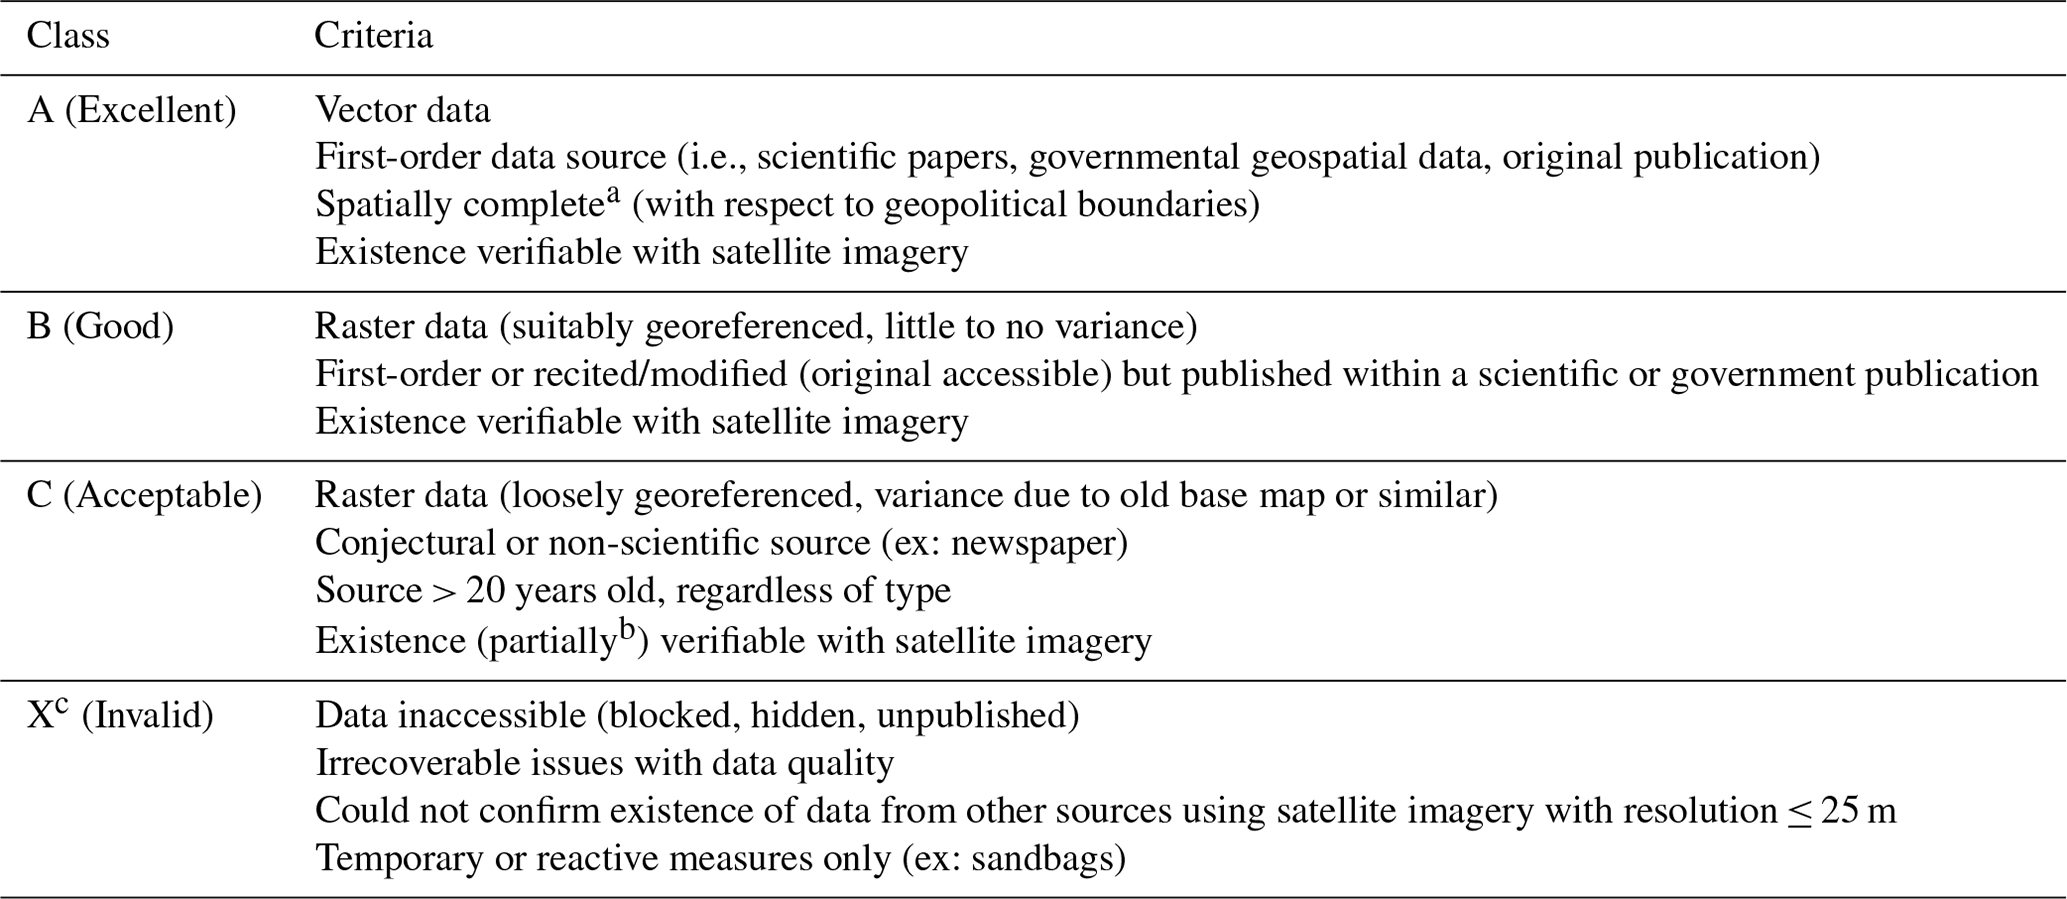
a Data that were attributable to class X have not been included in the published dataset but are documented in the delta index. b We included “partially verifiable” due to incident patchy local coverage of openly accessible satellite data, as there are instances where sufficient high-resolution imagery was not accessible, but standard resolution imagery indicated the presence of the feature that was published elsewhere. c Spatially complete was defined as being of the entire levee run, which may be comprised of several subsection maps.
2.3 Data collection
We conducted extensive literature searches using a variety of web searching platforms (i.e., Clarivate Web of Science, Google Search, Google Scholar, OCLC WorldCat) as well as data aggregation platforms (e.g., re3data.org, DataCite, data.gov.uk, data.gov, data.gov.au). Data were collected in a search process that is documented as a log with diary style entries in the Delta index table (see Table 1) and recorded at a delta level. Sources for each individual levee are stored at the feature level. This allowed us to record rationale and decision-making process so that both viewers and onward developers of the dataset are aware of the steps taken and of the underlying decisions.
With an international scope, searching often required country or location-specific terms (e.g., tanggul meaning levee or embankment in Indonesian) to aid data discovery, and these were regionally supplemented along with a vocabulary of common delta and levee terms when using academic paper and internet indexing services.
Funding reports from the World Bank projects on flood defense activities have also contributed to the database. Financing documents often contain maps and so we include data from the World Bank where it was discovered in our searches, released publicly, had been reviewed, and contained levee feature level data.
When it was not possible to find data in areas where levees were expected, the place was identified by name using the address search (gazetteer) function in ArcGIS and then basic internet searching was performed to find reports of floods or sea level rise-related damage. Finally, we made use of the world satellite imagery layer within ArcGIS to review areas where levee source data were inaccessible, and assess by visual means whether it was likely levees were present. We verified areas that we believe may be uninhabited using this imagery and classified them accordingly, where satellite imagery confirmed no visible levees, the delta was set to “No Result”. If levees were visible but we could not verify them with alternative data sources, we set the delta to “Pending” where external enquiries were taking place and the relevant note was entered in the ArcGIS journal (see Table 2). We identify deltas as “Not Processed” if we have yet to manually review available sources, and no national vector dataset was discoverable for processing via our automated tool.
Many deltas in the delta dataset may be small and uninhabited (Edmonds et al., 2020), have inaccessible data, or have data that we were unable to convert into a format that we could add to the database. We collectively group these deltas as having “No Result” in terms of data collection. Note that this does not always mean there are no data. For example, data from the Database nazionale della AgriNature in TErra (DANTE, formerly known as: ItaliaN LEvee Database [INLED]) (Barbetta et al., 2015) was not suitable for processing because it only contains levee start and end point coordinates. We classified these deltas under “No Result” because they requires access to a detailed regional level watercourse database and high-resolution elevation map so that an interpretational algorithm could be trained to infer the levee course.
Where available, we included levee attributes (e.g., design storm, wall height, levee material, see Table 2). This can inform about modeling and therefore work as a stand-alone spatial tool for investigating river delta dynamics. Additionally, the data layers can be used for verification of deductive models for the detection of levees by other means, including LIDAR and remotely sensed data as well as corroborating other data sources, such as OpenStreetMap. As we intend the database to be globally comparable, we set up a cross-matching list (Table S2) within the project documentation to ensure that the attributes of the levee lines layer were consistent between sources and languages. This was then used for both manual and automated input so that different units of measure, classifications of levee and construction types, and key engineering data were harmonious.
2.4 Data processing
2.4.1 Vector data processing
Where data were sourced in vector format, we defined a data processing algorithm in the ArcGIS® Model Builder (Fig. S1 in the Supplement) to clip the imported data to the extent of river deltas from Edmonds et al. (2020) with a 100 km buffer zone. This buffer zone is included to maximize OpenDELvE data usability, but it does not affect reported statistics on delta coverage: all reported data statistics in this paper are for levees strictly within delta boundaries (Fig. 1), although these can include shallow marine portions of the delta front as well as upland areas (Fig. 2, Edmonds et al., 2020). The buffer zone is included to allow extended use of the dataset for upstream fluvial and sediment transport modeling and additionally, should the dataset of Edmonds et al. (2020) be updated, reduces the likelihood that levees are missed from the layer.
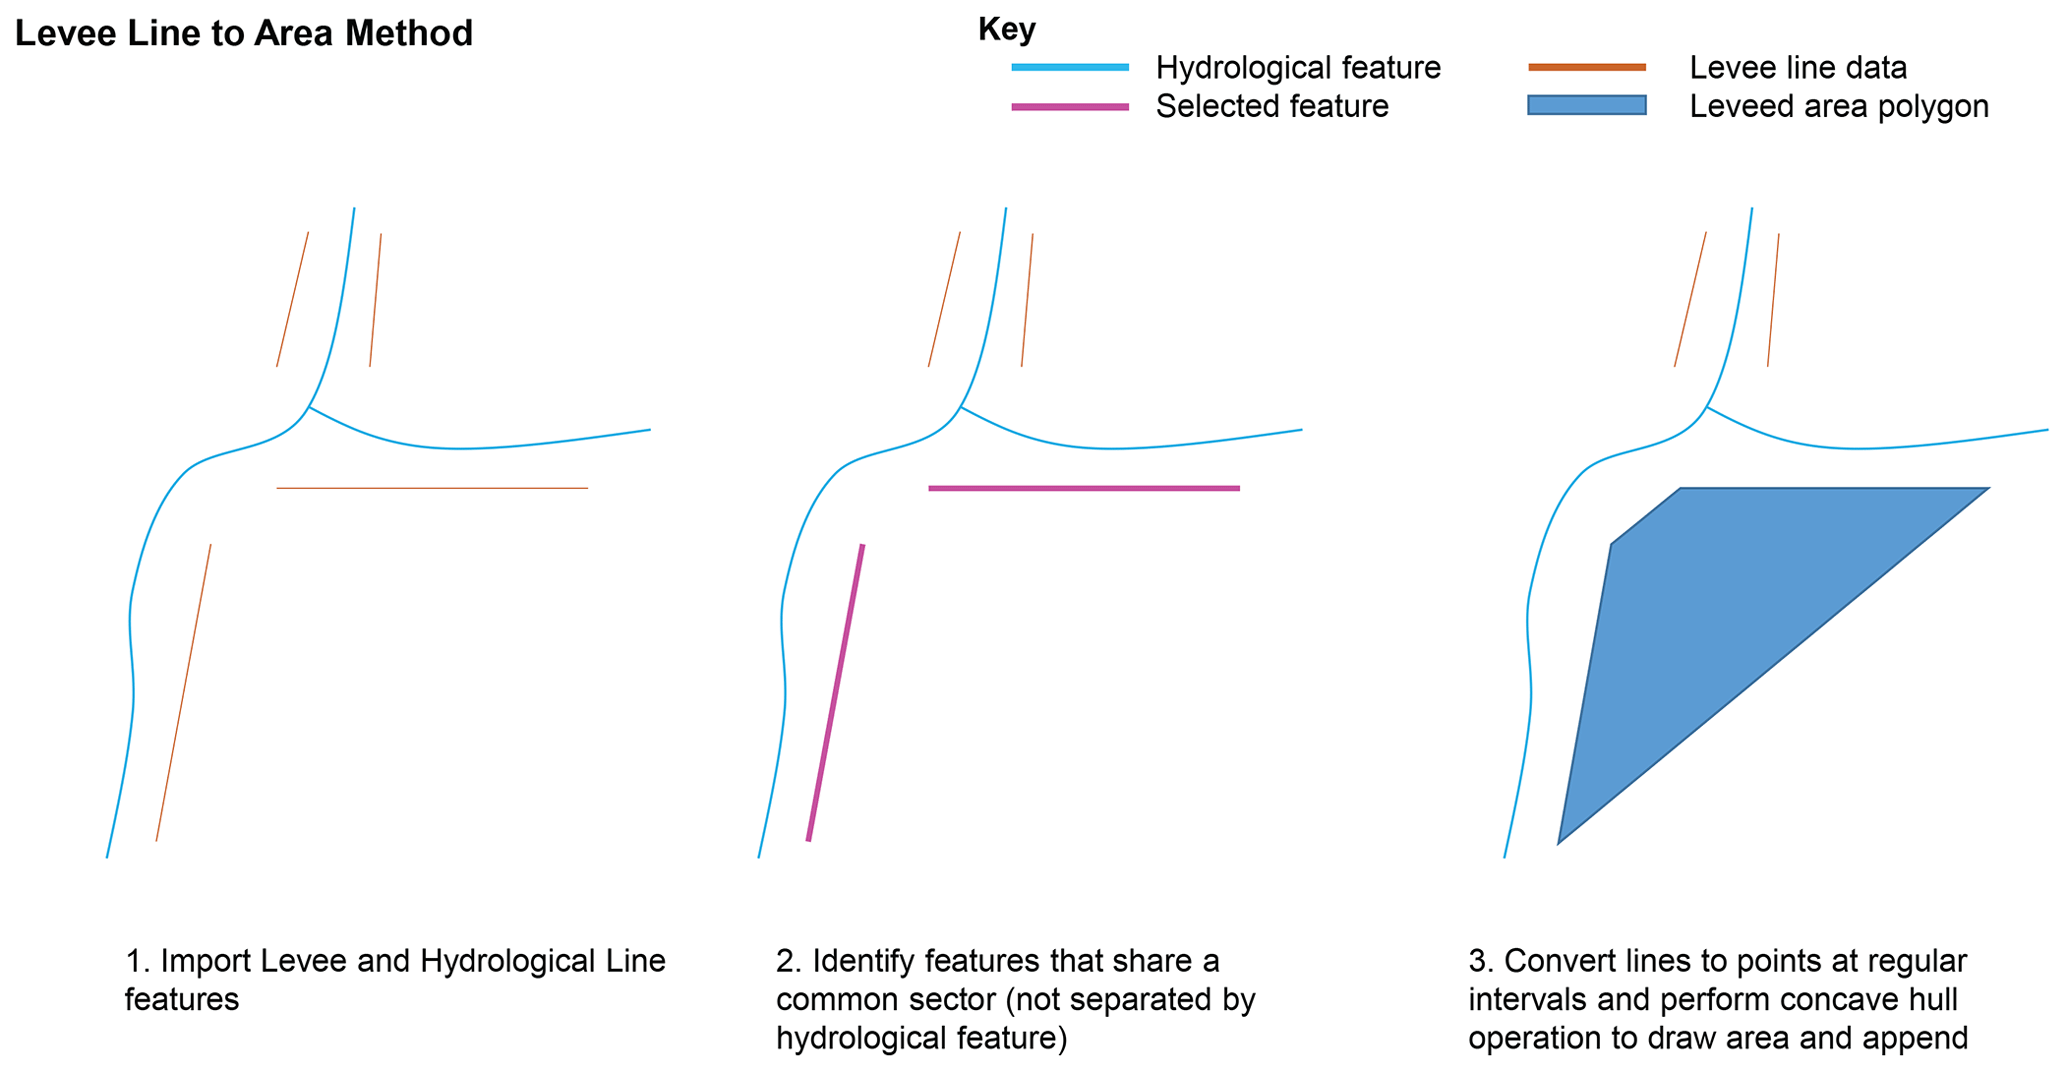
Figure 1Extraction of leveed areas from levee line information (visual representation of process outline in Fig. S3).
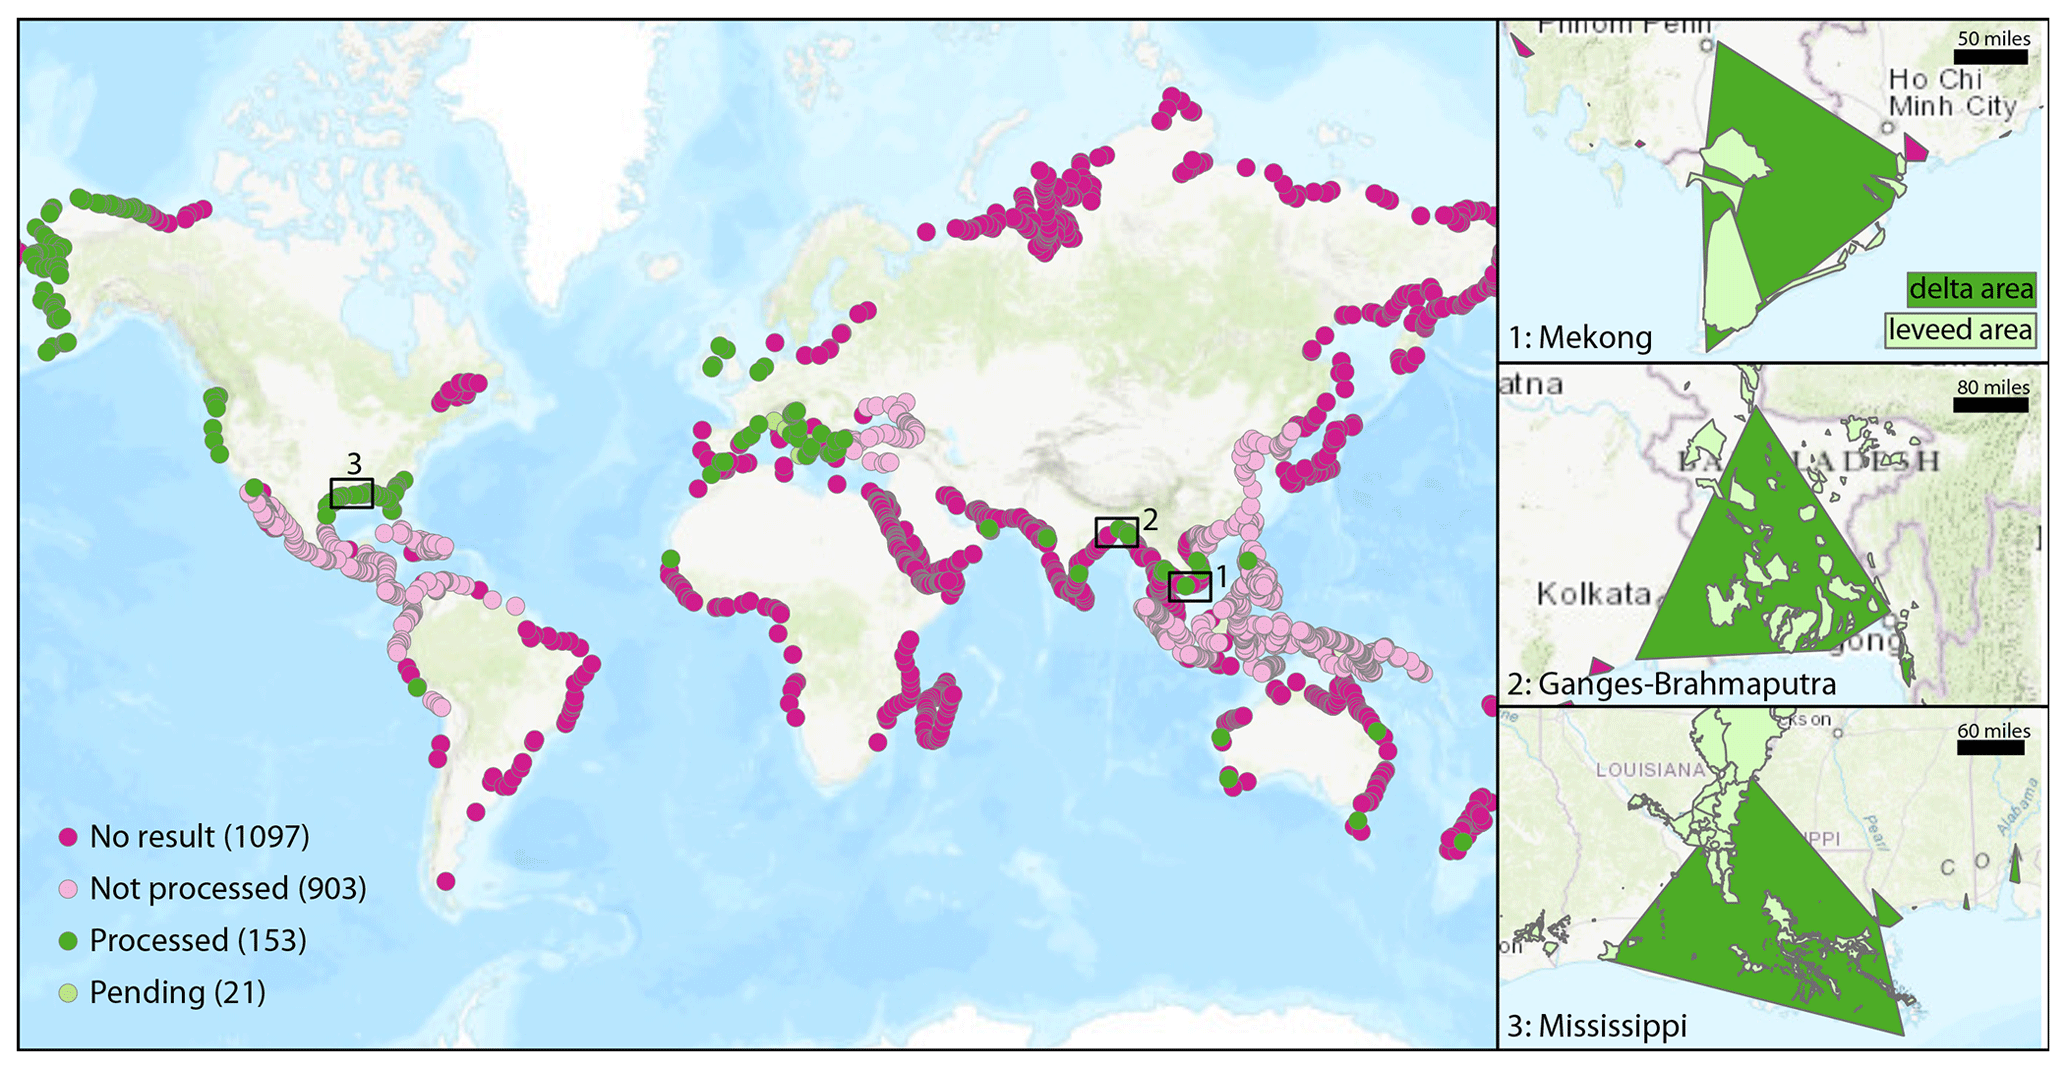
Figure 2Distribution of delta levee dataset completeness and data availability in release of openDELvE (v1.0). Polygons encompass the four-point deltaic extent as defined by Edmonds et al. (2020).
The ArcGIS® Model Builder automated import process is distributed with the dataset so that data can be repeatedly processed and added to the database both now and in the future. We supplemented this by the creation of conversion tables (Table S2) so that levee attributes, where available, are comparable at a global scale.
2.4.2 Non-vector data processing
We performed georeferencing of levee maps where the location was visible using a second georeferenced map and the map could be referenced in fewer than 5 reference points. This ensured that we were not extensively distorting the source map and therefore it was possible for us to trace in the features as accurately as possible. Where no georeferencing within 5 reference points was possible, or where the map had too few defining features to be georeferenced at all (e.g., map created with too few topographical features, substantial engineered or geological changes resulted in differences between the map and the modern situation) then the appropriate data quality class (X) was assigned. The data source was set aside and the process was documented in the log. Furthermore, where aerial photography was analyzed, we defined a set protocol for the inference of the leveed area (Fig. S3).
Data in the levee lines layer is currently limited to vector levee data sources and do not exist for raster data sources. Ongoing work includes manual review and development of (semi)automated processing steps to retrieve levee lines from raster sources.
2.4.3 Extraction of leveed areas from levee line information
Several data sources were processed where only levee lines are available, and not levee-protected areas (polygons). In these cases, we estimated levee-protected areas from levees by: (1) manually selecting levees that are not separated by bodies of water and (2) constructing an area confined by these levees (Fig. 1). We manually reviewed this process using datasets that have both levee lines and leveed areas (e.g., USACE National Levee Database) and did not result in a large overestimation or underestimation of the leveed areas (Fig. S3). Leveed areas generated from this process instead of original data are indicated in the data quality label.
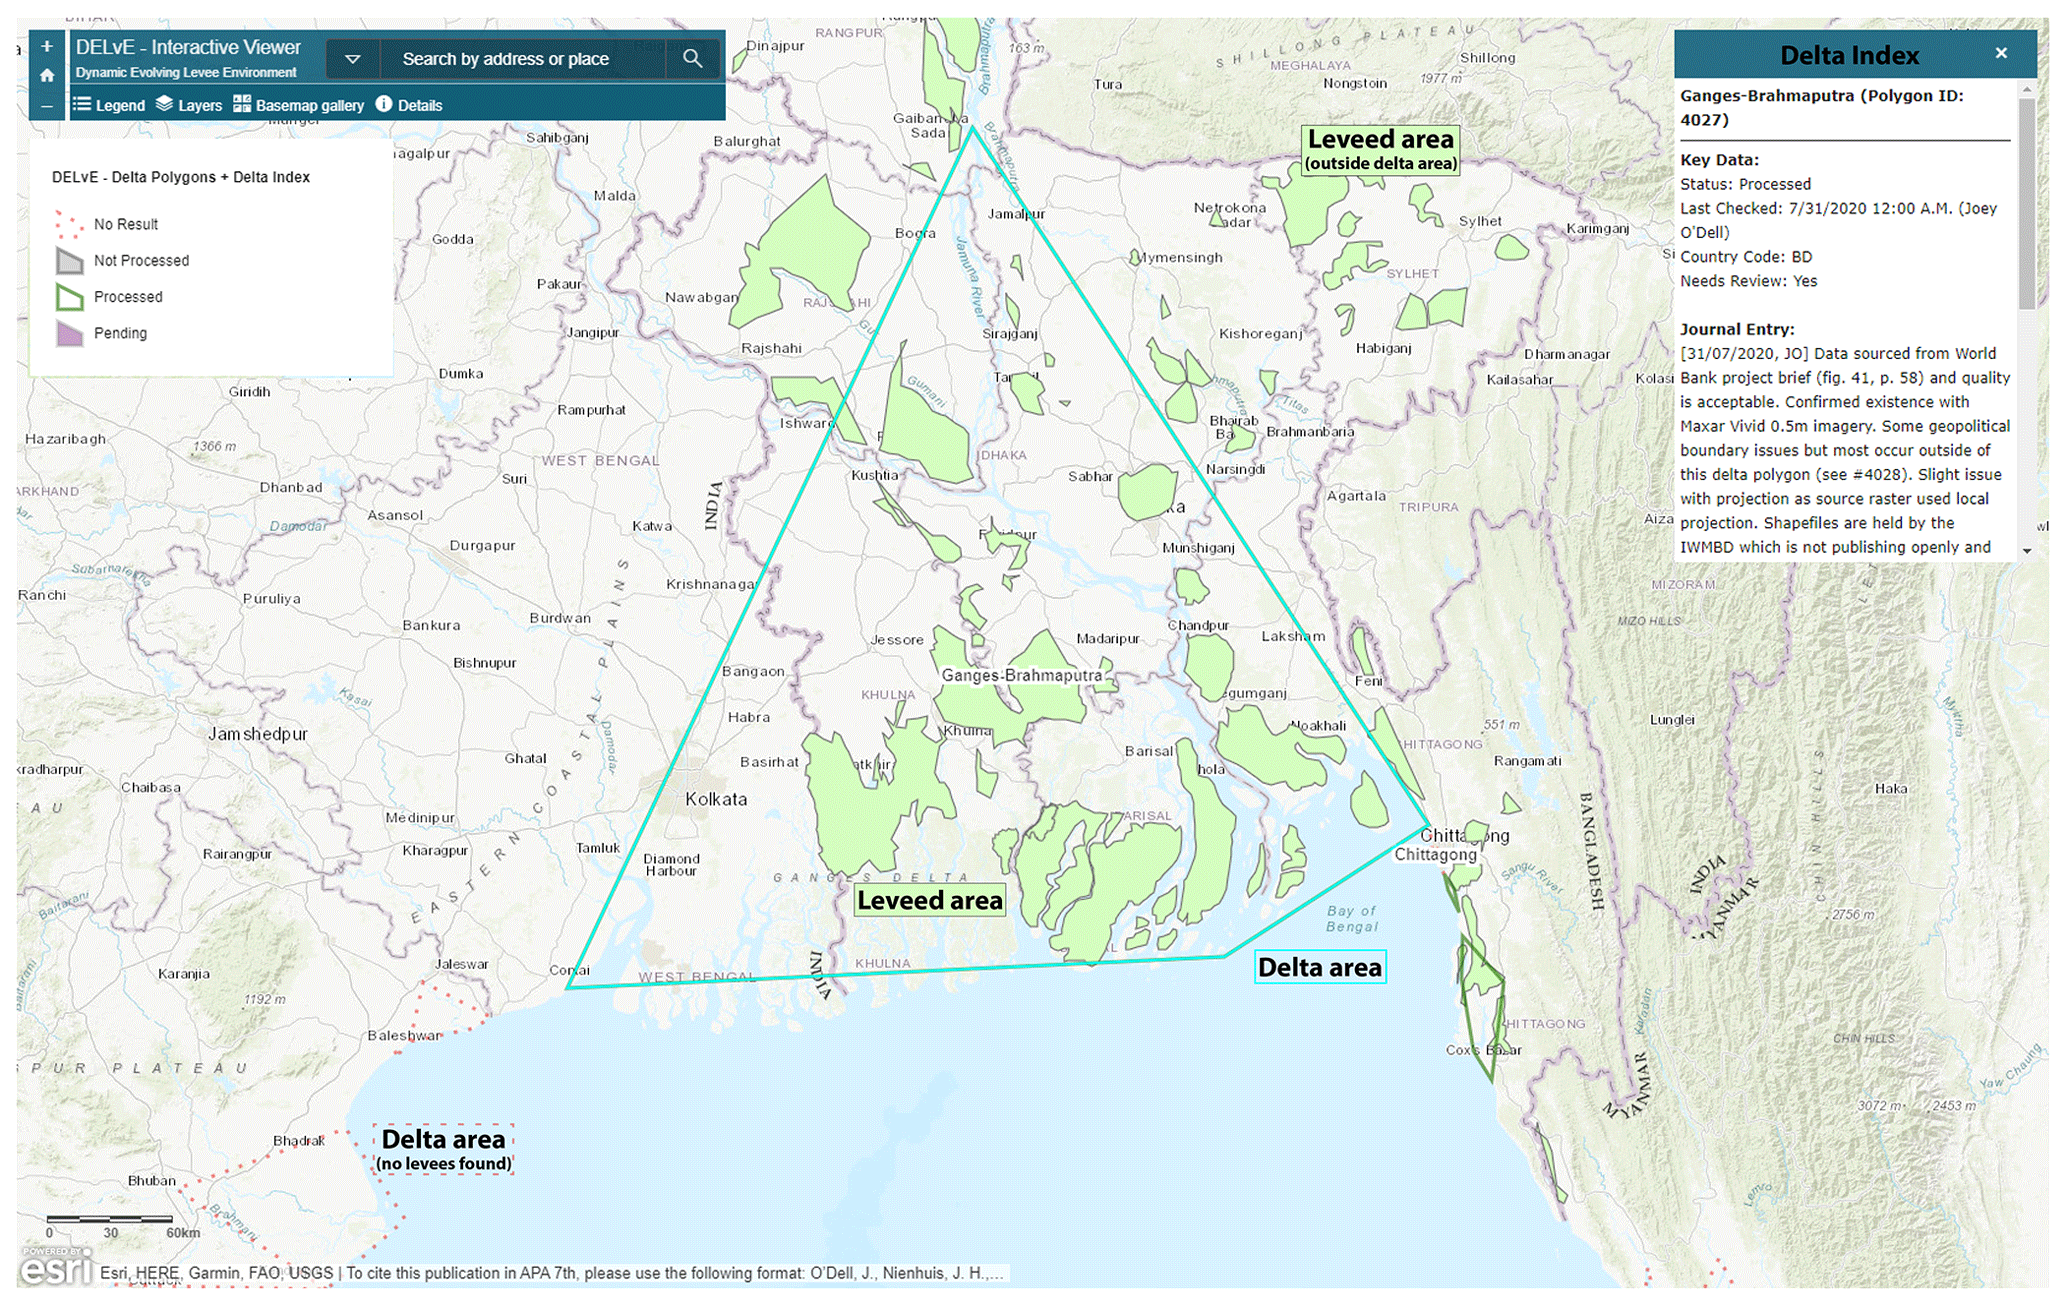
Figure 3Interactive browsing interface to openDELvE built using the ArcGIS Online platform. Area of focus is the Ganges-Brahmaputra delta, Bangladesh. Data content as per openDELvE version 1.0. available publicly at: http://opendelve.eu (last access: 1 October 2022).
2.5 Data attribution
Every task performed was recorded in the openDELvE metadata (Delta Index, field: Journal, Table 2) for audit purposes, and each entry is attributed to the data source, including a full literature reference, the source URL, and a DOI (where available). This ensures that we can display these data interactively and that the original source remains permanently available. We also included any digital identifiers from vector datasets so that the individual feature can be tracked and mapped over subsequent data revisions.
We linked each entry into openDELvE to a delta using the PolygonID from Edmonds et al. (2020), and additionally flagged deltas that need manual review in the future. It ensures that there is a robust process in the future to signal amendments needed or entries for which sources are undocumented or inaccessible. This supports maintenance and prevents repetition of previous search activities.
2.6 Data management
The resulting data layers for levee area and levee line features were created in ArcGIS Pro and hosted on an ArcGIS Online data hub (http://www.opendelve.eu, last access: 1 October 2022, Fig. 3). Additionally, we maintained ongoing research data exports into the DataverseNL environment as the database develops, which also assigns permanent identifiers (DOIs) to the research dataset. Data are stored in three defined entities as per Table 1, and we stored each layer within their own container in the public ArcGIS Online® environment. These layers were then published to be used as part of the ArcGIS Online Directory and through modern GIS clients via a Web Feature Service (WFS).
The openDELvE platform facilitates an interactive and community driven maintenance of the dataset through an amendment form and additional messages in all metadata files. Suitable new data will be added to openDELvE by the authors at Utrecht University, and made public on the openDELvE webpage and the DataverseNL environment.
Table 4Categories and criteria for the data validation performed on the dataset.
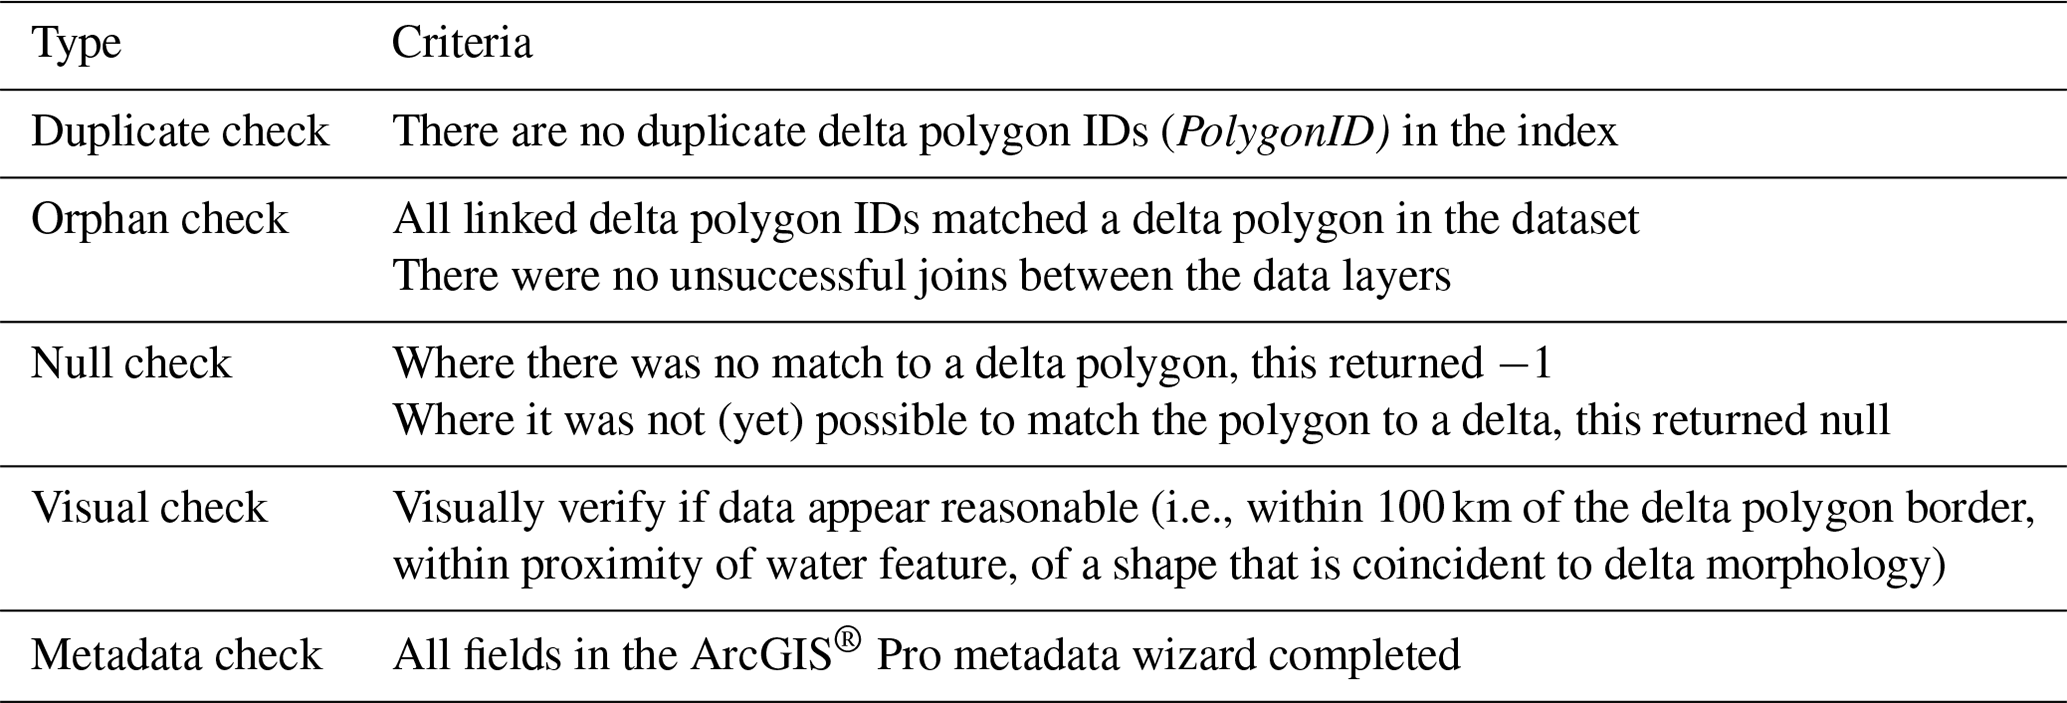
2.7 Data assurance
Before releasing the dataset, we performed several checks on the data and metadata (Table 4). We then generated metadata compliant with the EU INSPIRE geospatial metadata standard (European Parliament, 2007) using the built-in ArcGIS® Pro wizard for each data element (Table 2), and for the dataset in its entirety. This included interactive help text for the model builder. We checked the metadata files for completeness using the metadata wizard in the ArcGIS® Pro system.
2.8 Applications of openDELvE
2.8.1 Land use assessment with Copernicus global land cover layers
We used the Copernicus global land cover dataset (Buchhorn et al., 2020) to identify land use types and patterns within deltas and within leveed areas on deltas. Copernicus land cover data separate 16 natural vegetation classes, 4 non vegetated classes, and 2 human-influenced land cover classes, on a global 100 m grid. We selected the land cover data from 2019 and calculated for each land use and for each delta the area that is either protected from or exposed to flooding.
2.8.2 Population density with LandScanTM
The Oak Ridge National Laboratory's LandScanTM population data (https://landscan.ornl.gov/, last access: 1 October 2022) were used to calculate population density within levees and outside of levees. LandScan provides globally yearly gridded data at a 30 arcsec (∼1 km) resolution, counting resident and transitory populations. We used data from 2020 and calculated the delta population within and outside leveed areas for each processed delta polygon.
2.8.3 Coastal flooding analysis with COAST-RP
The COAST-RP dataset (COastal dAtaset of Storm Tide Return Periods) of Dullaart et al. (2021) provides the spatial extent of coastal floods from storms at 30 arcsec resolution for storm return periods from 1 to 1000 years. This is based on a global hydrodynamic model of the ocean that provides coastal water levels. COAST-RP then propagates these water levels in land using a static inundation model on top of a state of the art global elevation dataset and assuming a water level attenuation factor based on distance. COAST-RP does not include levee data. Here we intersected openDELvE data with COAST-RP to estimate simulated flood extents that might, in reality, be protected from coastal flooding by levees. We assessed storm return periods of 10, 100, and 1000 years, but, because of limited levee height data and levee quality data, we have not assessed actual protection but rather potential protection.
3.1 openDELvE extent and summary
The current release of openDELvE contains 11 188 levees with a combined length of 19 248 km. These levees protect 1657 separate areas that collectively span 44 734 km2, of which 41 399 km2 are on a delta (following definition in Sect. 2.4) (Table 5). Most of the data in openDELvE (97 % of the leveed area) are derived from vector or high-resolution raster sources and are of good quality (Fig. 4). We have processed levee information for 153 of the 2174 deltas identified by Caldwell et al. (2019), representing 28 % of the global delta area (246 885 km2 of 874 142 km2) (Fig. 2). Another 1097 deltas (59 % of global delta area) are pristine. Levees are unlikely and we did not find information on levee presence, or could identify levees visually (No Result category). This includes deltas, such as the Amazon and Lena. A further 924 deltas remain unprocessed, largely because data are unavailable. These are also small and collectively represent 12 % of the global delta area. We have processed the largest deltas and the remaining deltas are less likely to have levees.
Table 5Summary of processed features and deltaic areas at openDELvE (current release) per geographic region and area totalled, rounded to nearest integer.
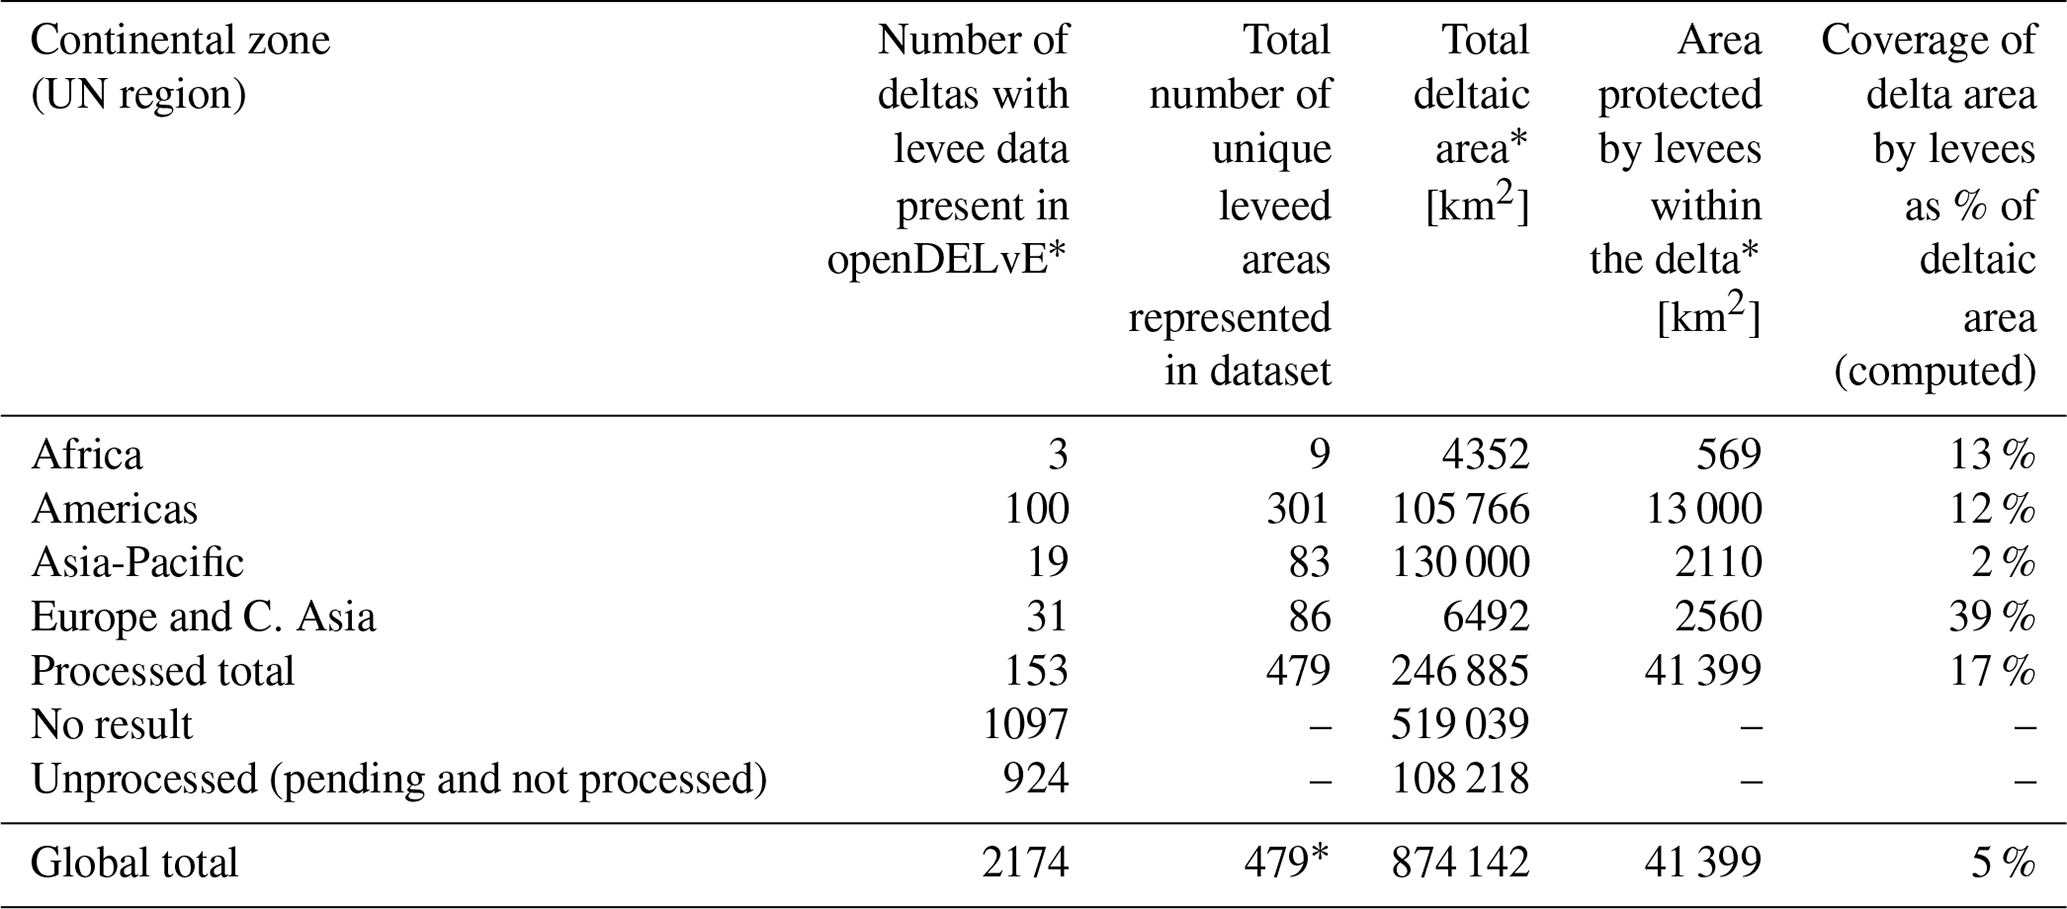
* openDELvE contains 1601 leveed area polygons but they are partially overlapping due to the structure of administrative units in the USACE NLD. Overlapping sections are only counted once for the purpose of this table.
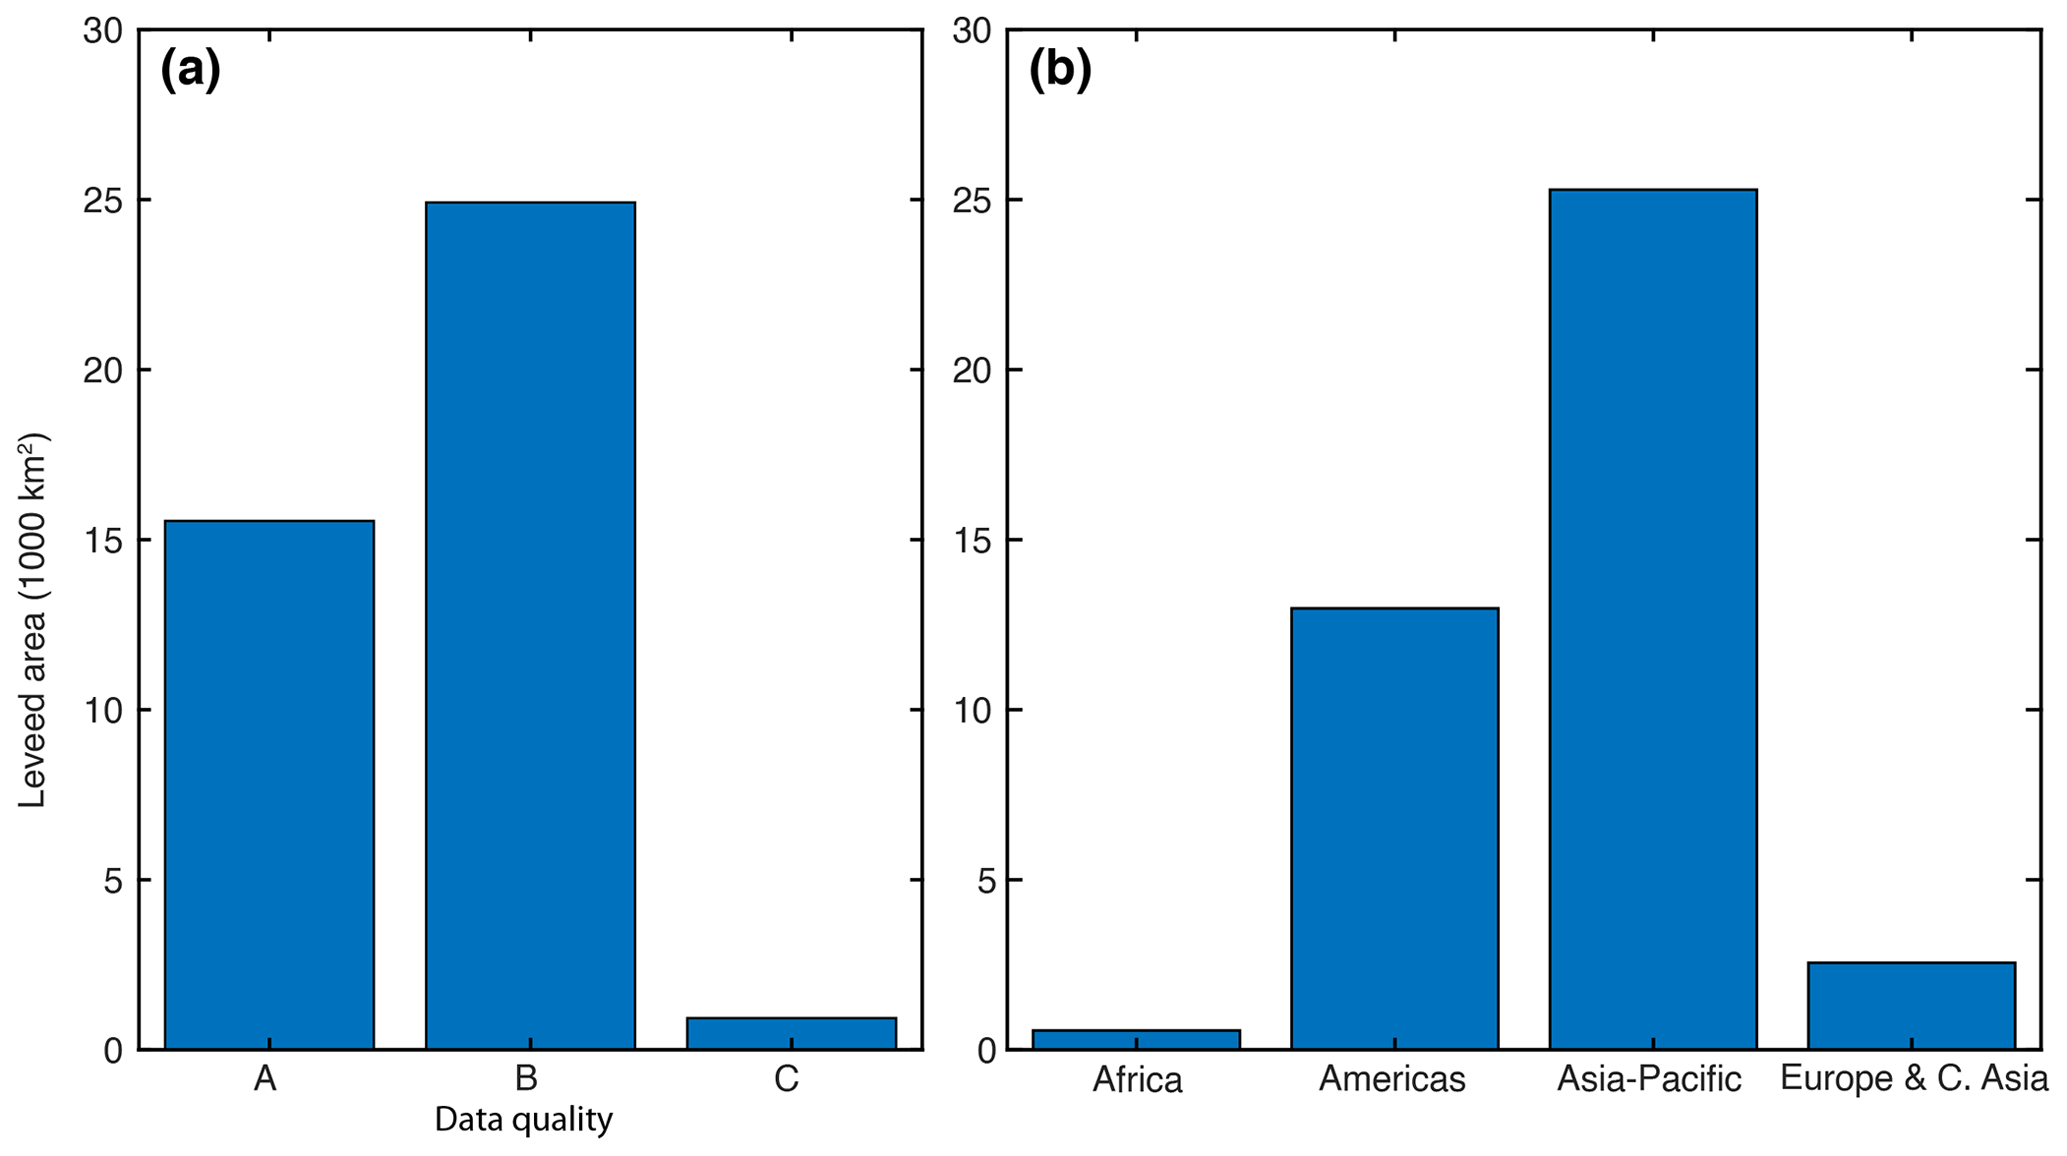
Figure 4(a) Distribution of data quality classification in openDELvE given for each individual leveed area feature, classified according to the data quality matrix (Table 3). (b) Distribution of leveed area data in openDELvE by UN Region.
Levees protect 17 % (41 399 km2) of the delta area for the 153 deltas included in openDELvE, but protection varies regionally. It is 2 % in Asia-Pacific but 39 % in Europe and C. Asia, and this broadly reflects levee presence but also data availability and data publishing policies between different regions (Fig. 4). The protected delta area also varies per delta, from fully unprotected deltas, such as the Colville (0 %, USA) to mostly protected deltas such as the Rhine-Meuse (70 %, NL). Our delta areas also include (coastal) surface water, which is 20 % of the Rhine-Meuse land area, therefore the protection percentages will be higher if only land is considered.
3.2 Demonstrative applications of openDELvE
Data on levees can bring important insights and more accurate predictions into delta studies. Levees are sometimes included in small-scale studies, but not yet in large-scale or global studies (e.g., Dullaart et al., 2021, Nienhuis and van de Wal, 2021). Global studies are becoming more common, in part because of global challenges such as climate change (IPCC, 2021).
Here we showcase uses of openDELvE, including flood protection of land use (what type of land is protected and what will be at risk), flood protection of delta population (how many people live in flood-protected vs. flood-prone areas), and potential improvements of flood hazard models in deltas (Fig. 5).
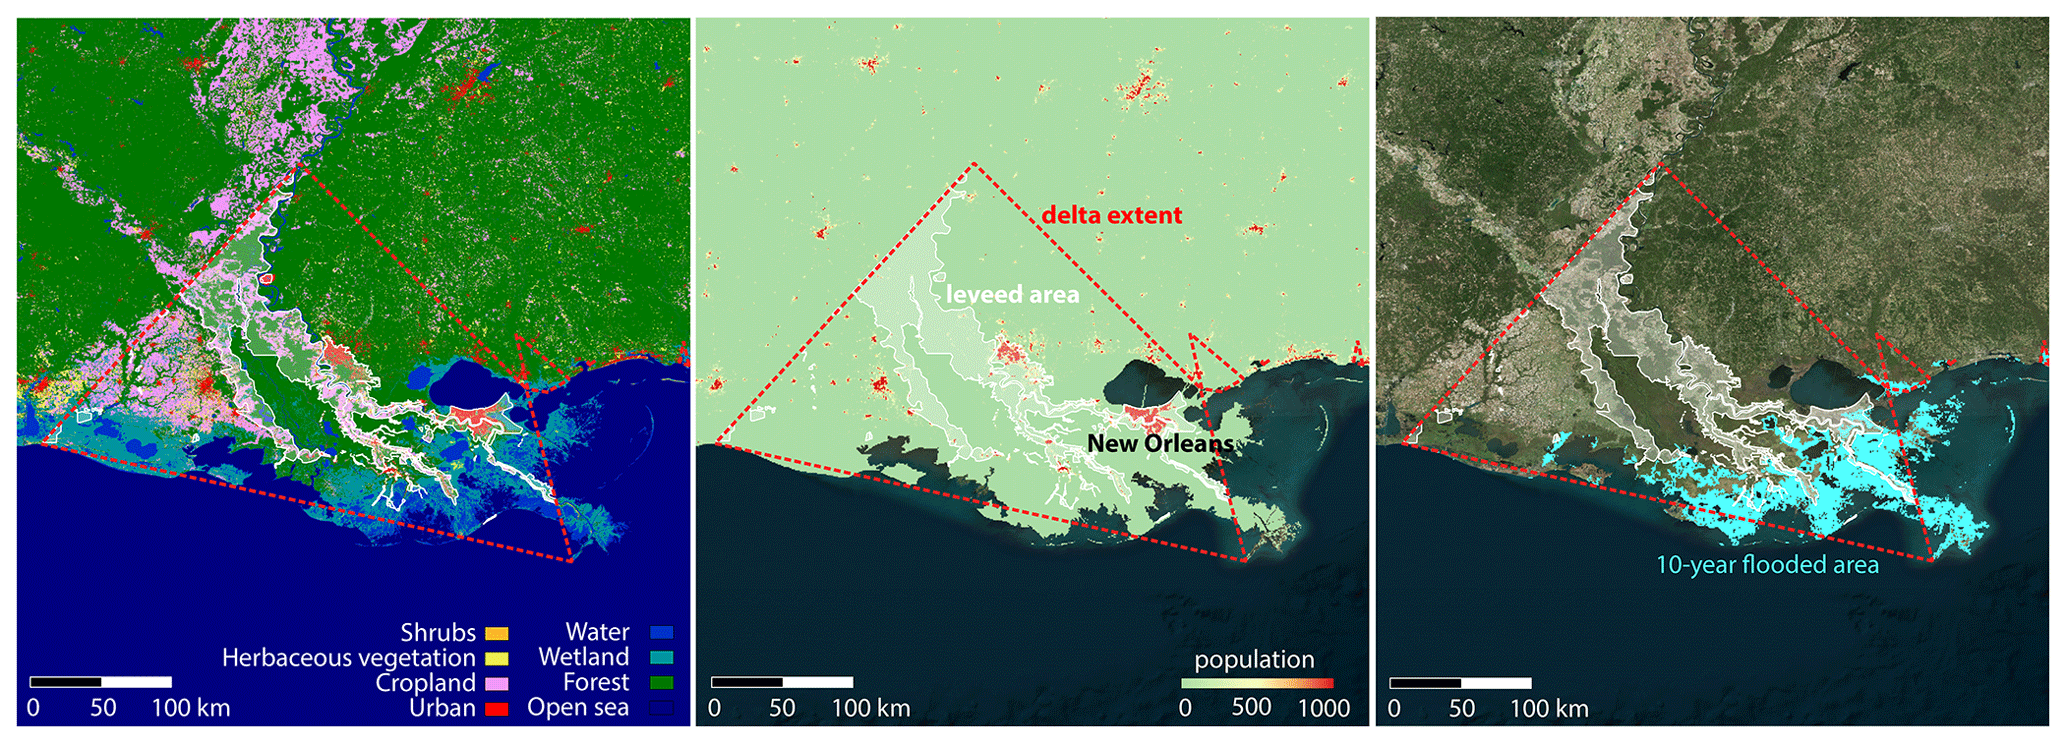
Figure 5Examples of land use (Copernicus Global Land Service, Buchhorn et al., 2020), population (LandScan, https://landscan.ornl.gov/, last access: 1 October 2022), and flooded area (Dullaart et al., 2021) within and outside levees in the Mississippi Delta.
First, an intersection between openDELvE and land use data shows that land use patterns differ significantly inside leveed areas compared to the rest of the delta (Figs. 5 and 6). Urban and built-up land are concentrated within leveed areas, whereas wetlands and water bodies are more likely to be found outside levees. For example, 48 % of flood-protected delta area is used as cropland, compared to 31 % of the non-flood-protected delta area (Fig. 6). Overrepresentation and underrepresentation of different land use classes are likely because levees are constructed to protect land with higher value, such as urban, built-up areas and croplands. Levees are therefore important for food availability and access (Islam and Al Mamun, 2020), protection of urban centers and urban infrastructures (Jongman et al., 2012), and for reducing exposure to flooding (Lumbroso et al., 2017). There is a second effect that can also play a role. The existence of levees could lead to greater investment and development of urban and agricultural land compared to areas outside levees (Hutton et al., 2019), the so-called levee effect. openDELvE does not include the year of construction for levees, so that it is not possible to separate these two effects.
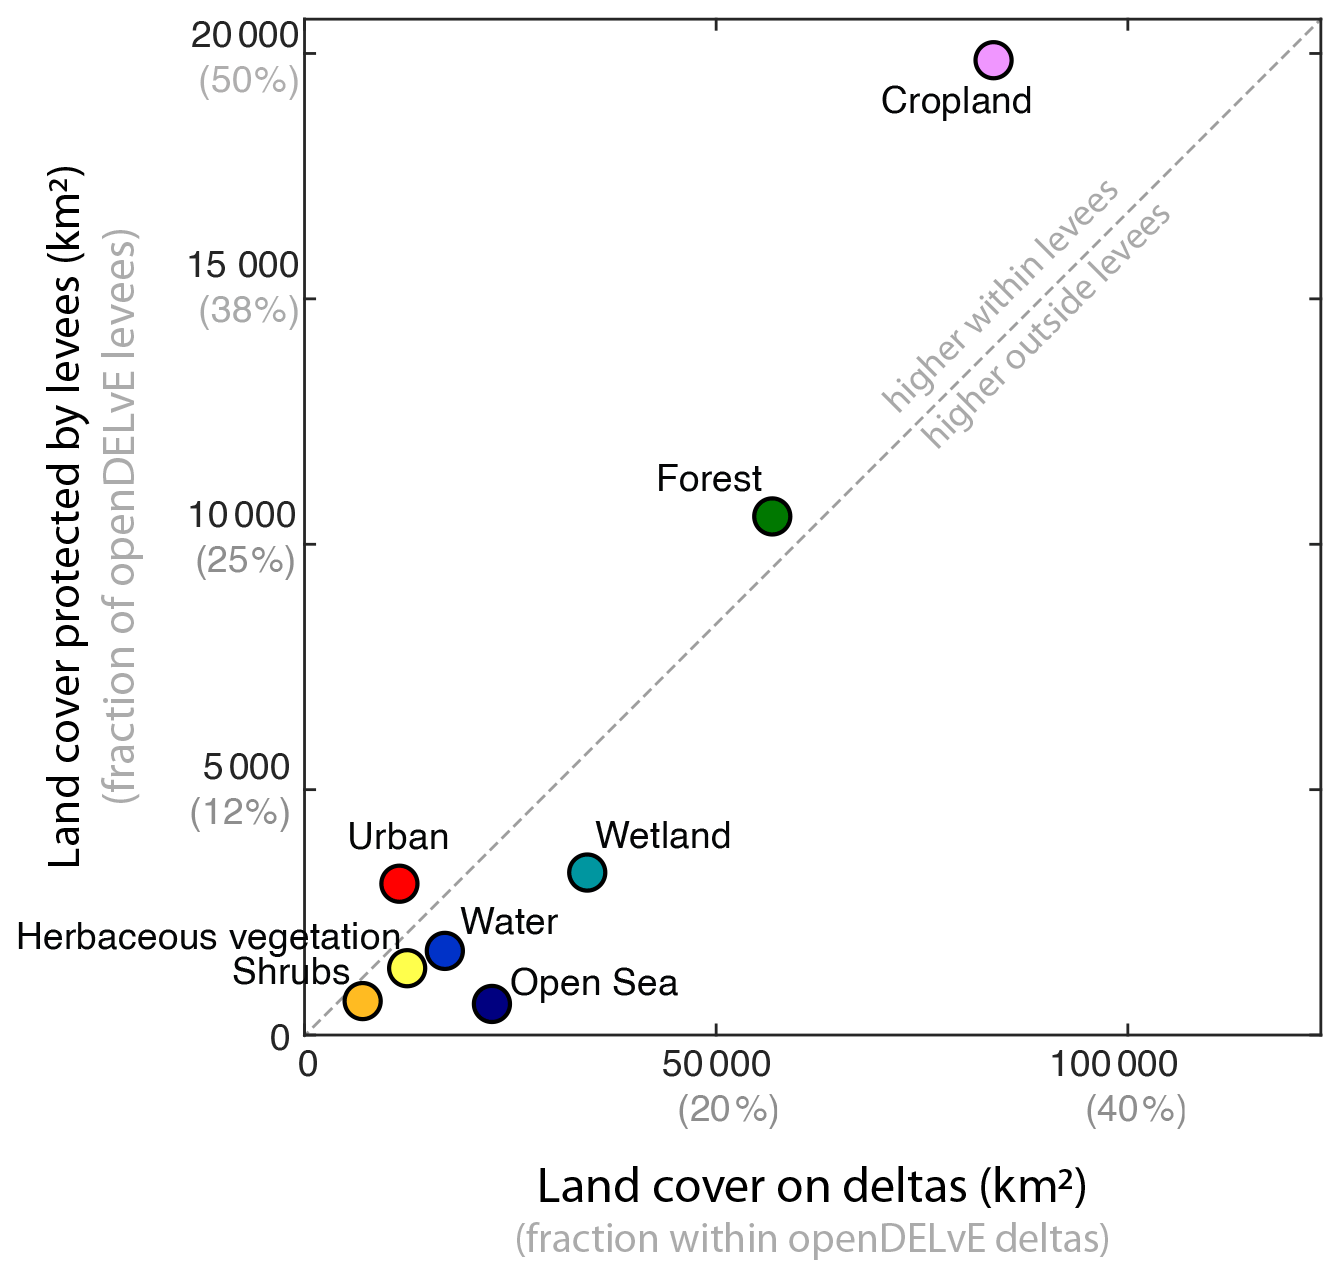
Figure 6Average land cover for 153 deltas within flood-protection levees compared to deltas as a whole.
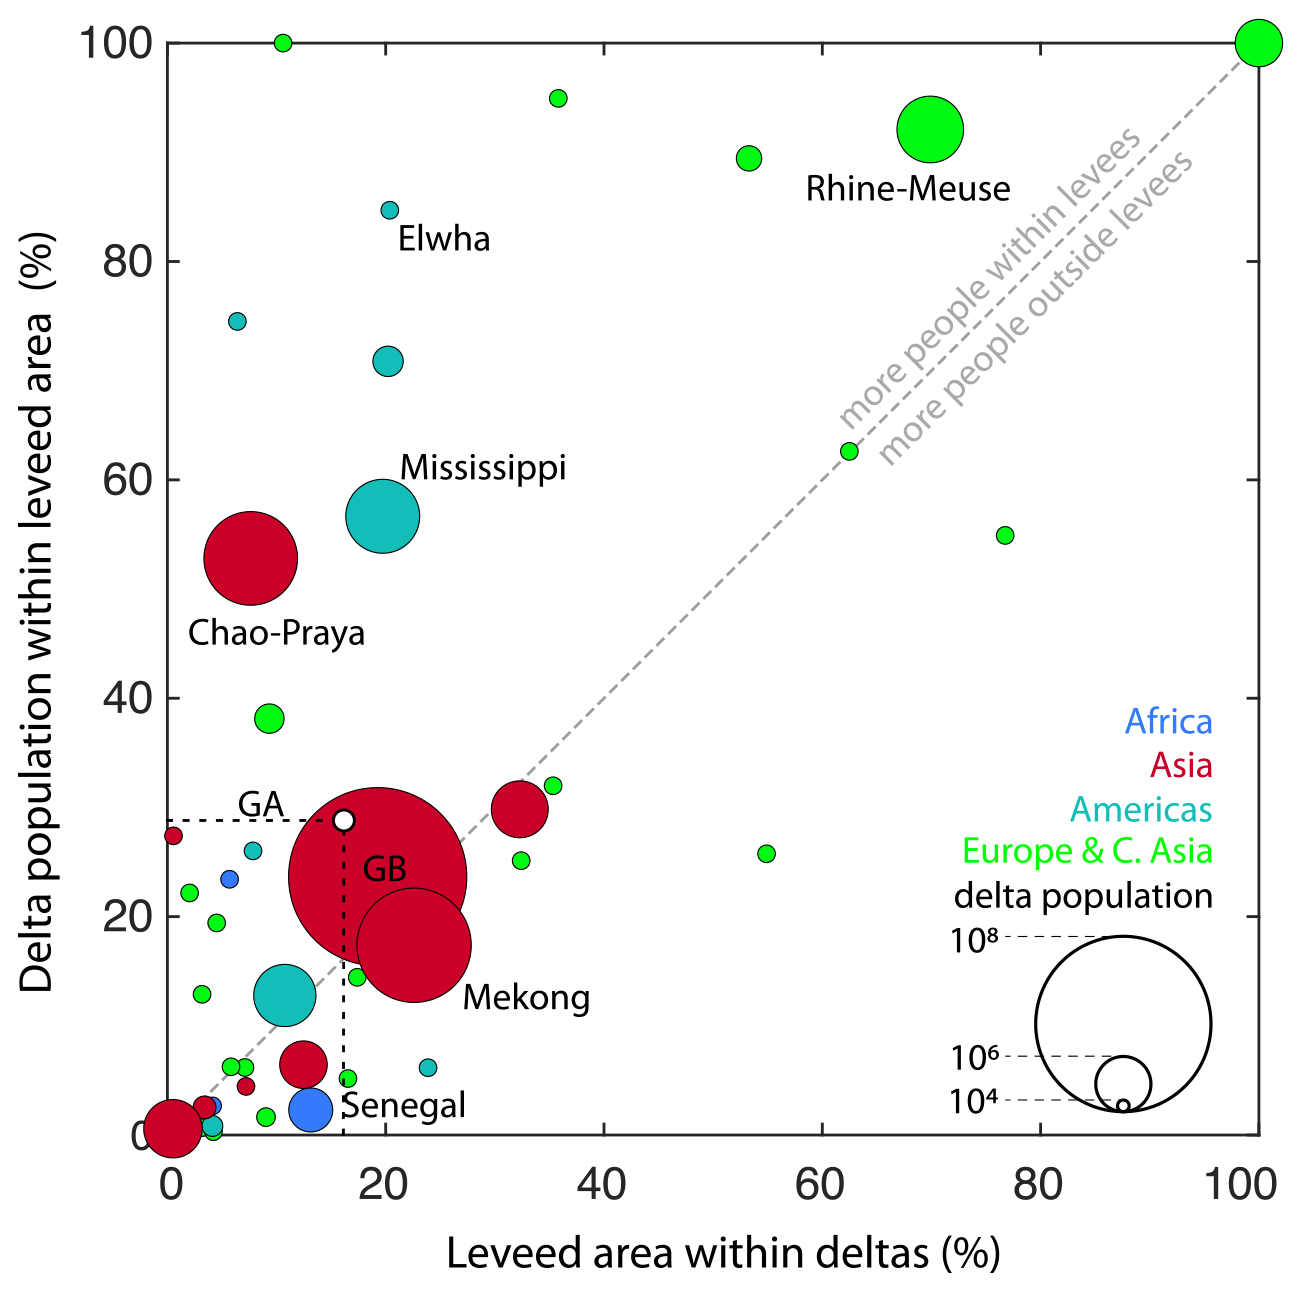
Figure 7Flood-protected delta area vs. flood-protected delta population, both as a fraction of the delta total. GB is the Ganges-Brahmaputra. The dotted line indicates the global average (GA).
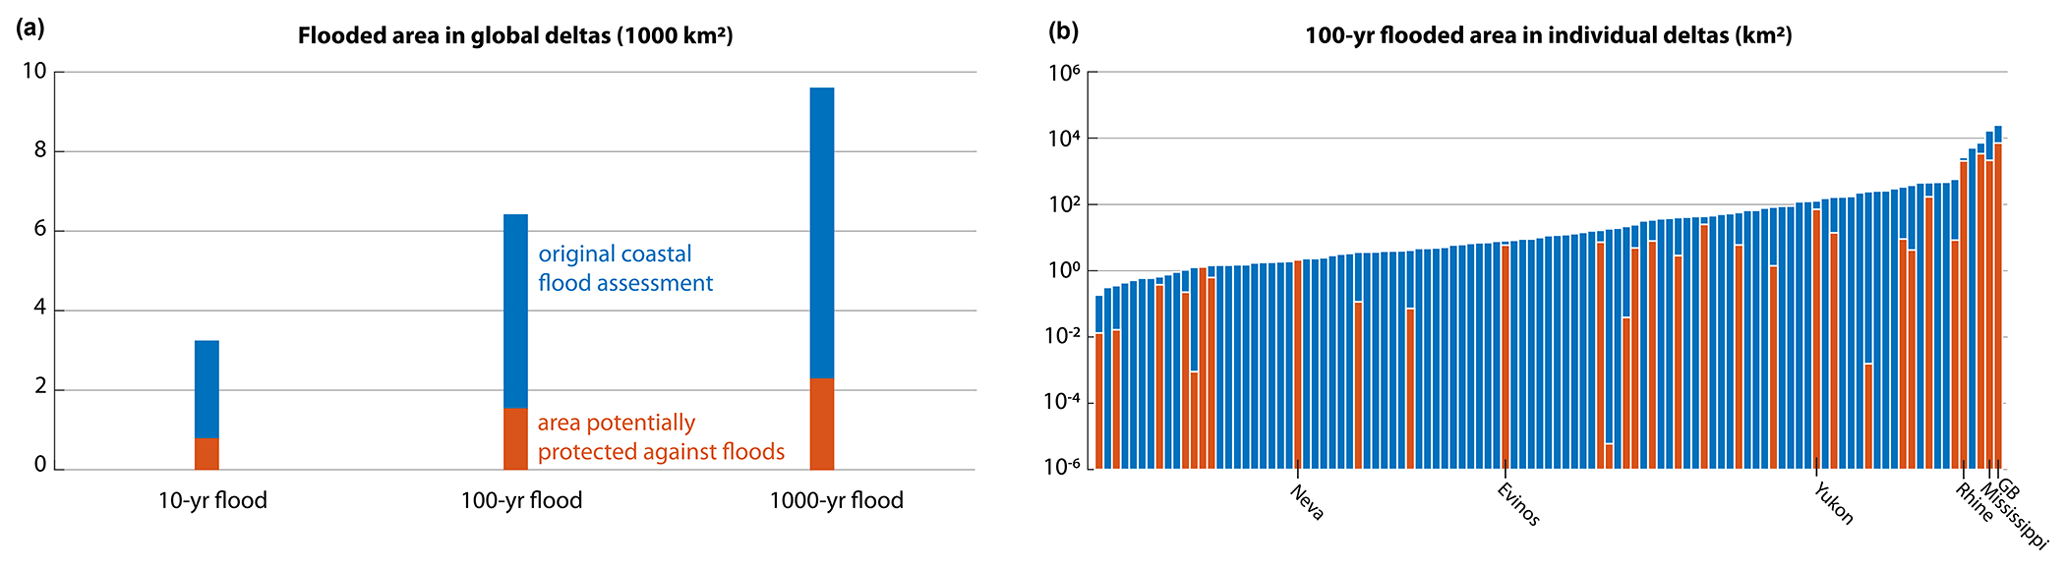
Figure 8Delta area potentially protected against coastal floods (in red), compared to all exposed delta area (in blue), for all deltas (a) and individual deltas (b). GB in the Ganges-Brahmaputra.
Second, our analysis with openDELvE and population data suggests that for the 153 deltas in openDELvE, 74 % of the delta population lives outside flood-protected areas. Population densities are higher inside flood-protected areas: leveed areas occupy on average 17 % of the delta area but protect 26 % of delta inhabitants. However, these global averages hide large differences between deltas and regions (Fig. 7). In Europe (85 %) and the Americas (41 %) we find a large fraction of the delta population to be protected, e.g., the Rhine-Meuse Delta in the Netherlands (92 %), and the Mississippi in the USA (57 %, Fig. 5). This is not the case across Africa (3 %) and Asia-Pacific (24 %). Looking at population densities the pattern is different. In Asian deltas, 800 people per km2 live outside flood-protected areas, compared to 15 000 people per km2 inside. In contrast, in Europe and the Americas there is only a fivefold and ninefold increase in population densities within flood-protected areas, respectively. The different patterns could be the result of competing factors in the co-evolution of levees and cities. Although levees are constructed to protect people and are therefore expected to protect the most populated areas, they are also constructed in vulnerable delta locations, away from likely locations of major cities in regions that historically did not build levees (e.g., Bangladesh).
In a third demonstration of openDELvE use, we assess the intersection of levees with global coastal flood assessments (Fig. 5, Dullaart et al., 2021). When neglecting the presence of levees it would seem that 13 % (32 261 km2) of the combined area of the 153 deltas is exposed to coastal floods with a return period of 10 years (Fig. 8). This increases to 26 % (63 179 km2) and 39 % (95 879 km2) for 100-year and 1000-year floods, respectively. However, when accounting for levees in openDELvE, we find that these could reduce flood exposure by 25 % (8206 km2) in the case of 10-year floods, and by 24 % (22 744 km2) in the case of 1000-year floods (Fig. 8). Protection against floods varies greatly between deltas. For the Rhine Delta it is 78 %, in the Ganges-Brahmaputra Delta it is 29 %, and in the Mississippi Delta it is 13 % (Figs. 5 and 8). As openDELvE does not include data on levee heights and levee protection standards, we cannot associate each levee with a magnitude of flooding; therefore, these numbers represent an approximation of the best-case protection offered by levees.
4.1 How representative is openDELvE?
As summarized in Table 5, we found that 17 % of the delta area processed in openDELvE is protected by levees. This should be considered a rough estimate and it is difficult to assign a global uncertainty. Delta area is notoriously difficult to define: data on delta area from two studies (Edmonds et al., 2020; Syvitksi and Saito, 2007) vary on average by 30 % per delta. For levees registered by nationally maintained databases (e.g., Mississippi, Rhine-Meuse) the data quality is good. There is rich metadata and a lower (but not zero, see Knox et al., 2022) chance of false negatives (openDELvE missing existing levees). Data quality and coverage in other deltas (e.g., Ganges-Brahmaputra, Mekong) is poorer, and this appears to be linked to the lack of a nationally or regionally coordinated platform for levee data sharing. There, the chance of false negatives and undercounting of leveed areas is higher.
Trying to assess global leveed area for all 2174 global deltas, including the unprocessed and no result categories, the fraction of delta area that is flood protected is likely to be lower than 17 %. Many of the “No Result” deltas are in sparsely populated areas (the Amazon, the Arctic). We expect those to have fewer levees compared to the 153 deltas within openDELvE. The global delta levee area is probably higher than 5 %, given that this would mean openDELvE currently includes all levees on deltas. The fraction of delta area that is protected can also be somewhat greater than 17 % because of limited levee data availability in openDELvE, particularly in Asia.
4.2 Global barriers to data availability
Data sovereignty is an emerging topic within global modeling that revolves around the value, sharing, and ownership of data in a global context. Whilst we acknowledge that breakthroughs have been made in the academic world of data sharing, through the formation of data initiatives (e.g., FAIR) and for standardized data sharing (e.g., INSPIRE, European Parliament, 2007), data in the private and governmental sectors can still be considered as an internal asset. Tang et al. (2020) defined the term “data sovereign” to identify someone with the capabilities, skill set and hierarchical position to facilitate data sharing across borders.
In our search for information, we realized that countries and governmental organizations which have core values supporting open data tend to treat levee information as a “product” and therefore appoint a central data repository or facilitated ordering process to be “data sovereign”. Some repositories may not themselves hold the actual data but act as centrally maintained indices of national data. Examples of national repositories are the US https://data.gov/ (last access: 1 October 2022) platform, which holds record locators for the US Army Corps of Engineers National Levee Database, the UK https://www.data.gov.uk/ (last access: 1 October 2022) Open Data platform, which holds record locators for the UK Environment Agency Asset Information Management System, the Dutch https://data.overheid.nl/ (last access: 1 October 2022), which holds record locators for the Rijkswaterstaat (Dutch Ministry of Infrastructure and Water Management) Dataregister, and the Australian https://data.gov.au/ (last access: 1 October 2022), which holds record locators for the various state-led systems in place across the country.
Other countries and institutions treat data differently, which can act as a roadblock to progress towards a harmonized global database. We found fewer data for deltas in Africa, China, Southeast Asia, the Southern and Central Americas as well as those in the Russian Federation and late accession members to the EU. Data are often stored in archives that we were unable to access, and as such this is only a partially complete dataset.
4.3 Uncertainties in openDELvE applications
Our example applications using openDELvE data are uncertain. Global data resolutions vary, which can result in inaccuracies when overlaying grids. Land cover (Buchhorn et al., 2020), population (https://landscan.ornl.gov/, last access: 1 October 2022), and coastal flooding (Dullaart et al., 2021) data are available at 100 m, 1 km, and 1 km resolution, respectively. Vectorized leveed area data are generally available at a higher resolution (∼1 m, e.g., https://levees.sec.usace.army.mil/, last access: 1 October 2022) and can therefore dissect coarser gridded data. In addition, there are other uncertainties inherent to the source itself that need to be taken into consideration when using the data, but some remain unquantified. For example, the coastal flood maps that we use (Dullaart et al., 2021) have not been validated because flood observation data remain too sparse for a detailed analysis of the uncertainty.
These data uncertainties affect our results. The 26 % reduction of the 100-year flood exposure by delta levees that we report (Sect. 3.2) could be lower or higher. The reduction could be higher because we miss levees in openDELvE (Knox et al., 2022), but it could also be lower because the delta area is poorly defined. Land cover and population statistics (Sect. 3.2) could be similarly affected by data uncertainties. The large reported fraction of a delta population that is protected (e.g., Europe: 85 %, Americas: 41 %) could be even higher. Some of the remaining populations could accidentally be included but not live in the delta proper and therefore not reside in a flood zone. It could be also lower because some populations might be outside the delta area and outside the leveed area. Quantifying these uncertainties is challenging.
4.4 Future outlook
By publishing our data as openly as possible (following FAIR principles) we intend to encourage not only external inspection but also suggestions for changes and further data additions. For this reason, we developed a webpage (https://www.opendelve.eu/, last access: 1 October 2022) and a new data submission system. We encourage users to refer us to levee data that we missed, and seek partnerships with local experts of countries for additional data inclusion. Additional crowdsourced or “volunteer geographic information” (VGI, Young et al., 2020) projects such as 510, an initiative of the Netherlands Red Cross, and https://www.openstreetmap.org (last access: 1 October 2022) may be able to further expand data on levees. We recognize the work of Young et al. (2020) in documenting the deployment of, and challenges associated with, a globally diverse data collection project; however, including crowdsourced data was out of the scope of our research.
Levee data can also be expanded using different means. There is the possibility of openDELvE to function as a training dataset for statistical (machine learning) models for levee and flood detection (Wing et al., 2019). By publishing our data with an open license (Creative Commons Attribution) we encourage its reworking and reuse.
openDELvE is a global delta levee database. We have standardized levee attributes and features from disparate data sources to allow global comparability and obtained a database of 11 188 levees with a combined length of 19 248 km. For the deltas in openDELvE we find that 41 399 km2 of their area is contained within levees. This represents 17 % of their area and 5 % of the global delta area. Levees predominantly protect delta cropland, which comprises 48 % of the protected delta area. Only 26 % of the delta population is protected by levees, but this varies greatly across deltas, from 3 % in some deltas in Africa to 92 % in the Rhine Delta. Levees potentially protect up to 8206 km2 (10-year floods) or 22 744 km2 (1000-year floods) of delta land against flooding.
openDELvE can improve delta flood hazard modeling, global delta hazard assessment, and studies of sustainable delta management in the face of sea level rise and other anthropogenic pressures. Our database is biased due to data availability, with more data available for Europe, Central Asia, and the Americas than for Africa and Asia-Pacific. openDELvE is FAIR, openly available, and we encourage contributions from other researchers and experts via http://www.opendelve.eu (last access: 1 October 2022).
The ArcGIS® Model Builder template used to process vector data is published within the research dataset, available on DataverseNL at https://doi.org/10.34894/2WZ0S9 (O'Dell, 2021).
The research dataset is publicly available on DataverseNL at https://doi.org/10.34894/2WZ0S9 (O'Dell, 2021). The layers and viewing interface are publicly consultable at http://www.opendelve.eu (last access: 1 October 2022) and are additionally hosted in the ArcGIS Online Portal for use with ArcGIS® and other OGC-compatible GIS packages. Additional data used in the applications section (population, land use, flooded area) are available through original sources, with findings per delta summarized in Table S1 in the Supplement.
The supplement related to this article is available online at: https://doi.org/10.5194/nhess-22-4087-2022-supplement.
JO curated and maintained the data, performed the investigation, and prepared the draft manuscript with contributions from the co-authors. JHN conceptualized, validated, and supervised the project, visualized the results, and edited the manuscript. JRC supervised the project, visualized the results and edited the manuscript. DAE and PS provided key digital resources and edited the manuscript.
The contact author has declared that none of the authors has any competing interests.
Publisher's note: Copernicus Publications remains neutral with regard to jurisdictional claims in published maps and institutional affiliations.
Figures 1, 2 and S1 were created using
ArcGIS® software by Esri (ArcGIS® Pro [ver. 2.6.2] and ArcGIS® Online). Figures 4–8 were created using Matlab. Cartographic data displayed in the images were supplied by Esri under license from HERE, Garmin, FAO, NOAA, EPA, NPS, and the USGS.
The authors wish to thank the many organizations who have actively chosen to embrace open data standards and share such rich datasets as this is a crucial part of the database. We are grateful to Ece Özer (TNO) and Alex Curran (formerly of TU Delft) whose work on the SAFElevee project and the ILPD, and their detailed publications as a result, were instrumental in the discovery of closed datasets. We further thank Silvia Barbetta, Albert Kettner, Yoshiki Saito, and Dhruvesh Patel for their help in gaining access to international data. We would additionally like to thank Fergus Miller Kerins for his help in testing and exploring deployment possibilities for the dataset. We thank Job Dullaart and Sanne Muis for providing access to the COAST-RP flood return dataset. Finally, we are very appreciative of the support from Maarten Zeylmans van Emmichoven that allowed the data processing to continue remotely during the pandemic. Joey O'Dell is supported by funding from the WCFD at UU. Jaap H. Nienhuis is supported by NWO vi.veni.192.132. Jana R. Cox is supported by Rivers2morrow.
This research has been supported by the NWO (grant no. vi.veni.192.123), the UU Water Climate Future Delta Hub (delta sedimentation strategies grant), and the Dutch Ministry of Infrastructure and Water Management (Rivers2Morrow).
This paper was edited by Lindsay Beevers and reviewed by Hamed Moftakhari, Oliver Wing, and one anonymous referee.
Barbetta, S., Camici, S., Maccioni, P., and Moramarco, T.: National Levee Database: monitoring, vulnerability assessment and management in Italy, in: Geophysical Research Abstracts, 12–17 April 2015, Vienna, Austria, EGU2015-10170, 2015.
Buchhorn, M.; Lesiv, M., Tsendbazar, N.-E., Herold, M., Bertels, L., Smets, B.: Copernicus Global Land Cover Layers-Collection 2, Remote Sens., 12, 1044, https://doi.org/10.3390/rs12061044, 2020.
Caldwell, R. L., Edmonds, D. A., Baumgardner, S., Paola, C., Roy, S., and Nienhuis, J. H.: A global delta dataset and the environmental variables that predict delta formation on marine coastlines, Earth Surf. Dynam., 7, 773–787, https://doi.org/10.5194/esurf-7-773-2019, 2019.
Cohen-Shacham, E., Walters, G., Janzen, C., and Maginnis, S.: Nature-based solutions to address global societal challenges, edited by: Cohen-Shacham, E., Walters, G., Janzen, C., and Maginnis, S., IUCN International Union for Conservation of Nature, https://doi.org/10.2305/IUCN.CH.2016.13.en, 2016.
Cox, J. R., Paauw, M., Nienhuis, J. H., Dunn, F. E., van der Deijl, E., Esposito, C., Goichot, M., Leuven, J. R. F. W., van Maren, D. S., Middelkoop, H., Naffaa, S., Rahman, M., Schwarz, C., Sieben, E., Triyanti, A., and Yuill, B.: A global synthesis of the effectiveness of sedimentation-enhancing strategies for river deltas and estuaries, Global Planet. Change, 103796, https://doi.org/10.1016/j.gloplacha.2022.103796, 2022.
Criss, R. E. and Shock, E. L.: Flood enhancement through flood control, Geology, 29, 875, https://doi.org/10.1130/0091-7613(2001)029<0875:FETFC>2.0.CO;2, 2001.
Di Baldassarre, G., Castellarin, A., Montanari, A., and Brath, A.: Probability-weighted hazard maps for comparing different flood risk management strategies: a case study, Nat. Hazards, 50, 479–496, https://doi.org/10.1007/s11069-009-9355-6, 2009.
Di Baldassarre, G., Kreibich, H., Vorogushyn, S., Aerts, J., Arnbjerg-Nielsen, K., Barendrecht, M., Bates, P., Borga, M., Botzen, W., Bubeck, P., De Marchi, B., Llasat, C., Mazzoleni, M., Molinari, D., Mondino, E., Mård, J., Petrucci, O., Scolobig, A., Viglione, A., and Ward, P. J.: Hess Opinions: An interdisciplinary research agenda to explore the unintended consequences of structural flood protection, Hydrol. Earth Syst. Sci., 22, 5629–5637, https://doi.org/10.5194/hess-22-5629-2018, 2018.
Dullaart, J. C. M., Muis, S., Bloemendaal, N., Chertova, M. V., Couasnon, A., and Aerts, J. C. J. H.: Accounting for tropical cyclones more than doubles the global population exposed to low-probability coastal flooding, Commun. Earth Environ., 2, 1–11, https://doi.org/10.1038/s43247-021-00204-9, 2021.
Dunn, F. E., Darby, S. E., Nicholls, R. J., Cohen, S., Zarfl, C., and Fekete, B. M.: Projections of declining fluvial sediment delivery to major deltas worldwide in response to climate change and anthropogenic stress, Environ. Res. Lett., 14, 084034, https://doi.org/10.1088/1748-9326/ab304e, 2019.
Edmonds, D. A., Caldwell, R. L., Brondizio, E. S., Siani, S. M. O., and Siani, E.: Coastal flooding will disproportionately impact people on river deltas, Nat. Commun., 11, 4741, https://doi.org/10.1038/s41467-020-18531-4, 2020.
Esteves, L. S.: What is Managed Realignment?, Springer, Dordrecht, 19–31, https://doi.org/10.1007/978-94-017-9029-1_2, 2014.
European Parliament: Directive 2007/2/EC of the European Parliament and of the Council of 14 March 2007 establishing an Infrastructure for Spatial Information in the European Community (INSPIRE), http://data.europa.eu/eli/dir/2007/2/oj (last access: 6 December 2022), 2007.
Fleischmann, A., Paiva, R., and Collischonn, W.: Can regional to continental river hydrodynamic models be locally relevant? A cross-scale comparison, J. Hydrol. X, 3, 100027, https://doi.org/10.1016/j.hydroa.2019.100027, 2019.
Hutton, N. S., Tobin, G. A., and Montz, B. E.: The levee effect revisited: Processes and policies enabling development in Yuba County, California, J. Flood Risk Manage., 12, e12469, https://doi.org/10.1111/jfr3.12469, 2019.
Ibáñez, C., Day, J. W., and Reyes, E.: The response of deltas to sea-level rise: Natural mechanisms and management options to adapt to high-end scenarios, Ecol. Eng., 65, 122–130, https://doi.org/10.1016/j.ecoleng.2013.08.002, 2014.
IPCC: Climate Change 2021: The Physical Science Basis, Contribution of Working Group I to the Sixth Assessment Report of the Intergovernmental Panel on Climate Change, edited by: Masson-Delmotte, V., Zhai, P., Pirani, A., Connors, S. L., Péan, C., Berger, S., Caud, N., Chen, Y., Goldfarb, L., Gomis, M. I., Huang, M., Leitzell, K., Lonnoy, E., Matthews, J. B. R., Maycock, T. K., Waterfield, T., Yelekçi, O., Yu, R., and Zhou, B., Cambridge University Press, Cambridge, United Kingdom and New York, NY, USA, 2021, https://doi.org/10.1017/9781009157896, 2021.
Islam, M. M. and Al Mamun, M. A.: Beyond the risks to food availability – linking climatic hazard vulnerability with the food access of delta-dwelling households, Food Secur., 12, 37–58, https://doi.org/10.1007/s12571-019-00995-y, 2020.
Jongman, B., Ward, P. J., and Aerts, J. C. J. H.: Global exposure to river and coastal flooding: Long term trends and changes, Global Environ. Change, 22, 823–835, https://doi.org/10.1016/j.gloenvcha.2012.07.004, 2012.
Kates, R. W., Colten, C. E., Laska, S., and Leatherman, S. P.: Reconstruction of New Orleans after Hurricane Katrina: A research perspective, P. Natl. Acad. Sci. USA, 103, 14653–14660, https://doi.org/10.1073/pnas.0605726103, 2006.
Knox, R. L., Morrison, R. R., and Wohl, E. E.: Identification of artificial levees in the contiguous United States, Water Resour. Res., 58, e2021WR031308, https://doi.org/10.1029/2021WR031308, 2022.
Lesser, G. R., Roelvink, J. A., van Kester, J. A. T. M., and Stelling, G. S.: Development and validation of a three-dimensional morphological model, Coast. Eng., 51, 883–915, https://doi.org/10.1016/j.coastaleng.2004.07.014, 2004.
Lumbroso, D. M., Suckall, N. R., Nicholls, R. J., and White, K. D.: Enhancing resilience to coastal flooding from severe storms in the USA: international lessons, Nat. Hazards Earth Syst. Sci., 17, 1357–1373, https://doi.org/10.5194/nhess-17-1357-2017, 2017.
Middelkoop, H., Erkens, G., and van der Perk, M.: The Rhine delta-a record of sediment trapping over time scales from millennia to decades, J. Soils Sediments, 10, 1–12, https://doi.org/10.1007/s11368-010-0237-z, 2010.
Mitchell, T., Kluskens, R., Woldringh, B., Van Der Meer, M. T., Kamp, R. G., De Gooijer, C., and Hillen, M. M.: Integrating Levee Performance Assessments into Complex Flood Protection Systems, in: US Society of Dams Annual Conference, 11–15 February 2013, Phoenix, Arizona, USA, 11–13, 2013.
Munoz, S. E., Giosan, L., Therrell, M. D., Remo, J. W. F., Shen, Z., Sullivan, R. M., Wiman, C., O'Donnell, M., and Donnelly, J. P.: Climatic control of Mississippi River flood hazard amplified by river engineering, Nature, 556, 95–98, https://doi.org/10.1038/nature26145, 2018.
National Research Council: Levees and the National Flood Insurance Program, National Academies Press, Washington, DC, 63–96, https://doi.org/10.17226/18309, 2013.
Nienhuis, J. H. and van de Wal, R. S. W.: Projections of Global Delta Land Loss From Sea-Level Rise in the 21st Century, Geophys. Res. Lett., 48, e2021GL093368, https://doi.org/10.1029/2021GL093368, 2021.
Nienhuis, J. H., Ashton, A. D., Edmonds, D. A., Hoitink, A. J. F., Kettner, A. J., Rowland, J. C., and Törnqvist, T. E.: Global-scale human impact on delta morphology has led to net land area gain, Nature, 577, 514–518, https://doi.org/10.1038/s41586-019-1905-9, 2020.
O'Dell, J.: Open-source Dynamic Evolving Levee Environment (openDELvE), DataverseNL [code and data set], https://doi.org/10.34894/2WZ0S9, 2021.
Özer, I. E., van Damme, M., and Jonkman, S. N.: Towards an International Levee Performance Database (ILPD) and Its Use for Macro-Scale Analysis of Levee Breaches and Failures, Water, 12, 119, https://doi.org/10.3390/w12010119, 2019.
Pinter, N.: One Step Forward, Two Steps Back on U.S. Floodplains, Science, 308, 207–208, https://doi.org/10.1126/science.1108411, 2005.
Pinter, N., Jemberie, A. A., Remo, J. W. F., Heine, R. A., and Ickes, B. S.: Flood trends and river engineering on the Mississippi River system, Geophys. Res. Lett, 35, 23404, https://doi.org/10.1029/2008GL035987, 2008.
Pinter, N., Huthoff, F., Dierauer, J., Remo, J. W. F., and Damptz, A.: Modeling residual flood risk behind levees, Upper Mississippi River, USA, Environ. Sci. Policy, 58, 131–140, https://doi.org/10.1016/j.envsci.2016.01.003, 2016.
Sampson, C. C., Smith, A. M., Bates, P. D., Neal, J. C., Alfieri, L., and Freer, J. E.: A high-resolution global flood hazard model, Water Resour. Res., 51, 7358–7381, https://doi.org/10.1002/2015WR016954, 2015.
Santos, M. J. and Dekker, S. C.: Locked-in and living delta pathways in the Anthropocene, Sci. Rep., 10, 1–10, https://doi.org/10.1038/s41598-020-76304-x, 2020.
Scussolini, P., Aerts, J. C. J. H., Jongman, B., Bouwer, L. M., Winsemius, H. C., de Moel, H., and Ward, P. J.: FLOPROS: an evolving global database of flood protection standards, Nat. Hazards Earth Syst. Sci., 16, 1049–1061, https://doi.org/10.5194/nhess-16-1049-2016, 2016.
Scussolini, P., Tran, T. V. T., Koks, E., Diaz-Loaiza, A., Ho, P. L., and Lasage, R.: Adaptation to sea level rise: A multidisciplinary analysis for Ho Chi Minh City, Vietnam, Water Res. Res., 53, 10841–10857, https://doi.org/10.1002/2017WR021344, 2017.
Steinfeld, C. M. M. M., Kingsford, R. T., and Laffan, S. W.: Semi-automated GIS techniques for detecting floodplain earthworks, Hydrol. Process., 27, 579–591, https://doi.org/10.1002/hyp.9244, 2013.
Syvitski, J. P. and Saito, Y.: Morphodynamics of deltas under the influence of humans, Global Planet. Change, 57, 261–282, https://doi.org/10.1016/j.gloplacha.2006.12.001, 2007.
Tang, C., Plasek, J. M., Zhu, Y., and Huang, Y.: Data sovereigns for the world economy, Humanit. Soc. Sci. Commun., 7, 184, https://doi.org/10.1057/s41599-020-00664-y, 2020.
Trigg, M. A., Birch, C. E., Neal, J. C., Bates, P. D., Smith, A., Sampson, C. C., Yamazaki, D., Hirabayashi, Y., Pappenberger, F., Dutra, E., Ward, P. J., Winsemius, H. C., Salamon, P., Dottori, F., Rudari, R., Kappes, M. S., Simpson, A. L., Hadzilacos, G., and Fewtrell, T. J.: The credibility challenge for global fluvial flood risk analysis, Environ. Res. Lett., 11, 094014, https://doi.org/10.1088/1748-9326/11/9/094014, 2016.
US Army Corps of Engineers: River Analysis System (HEC-RAS), https://www.hec.usace.army.mil/software/hec-ras/ (last access: 1 October 2022), 2020.
Van Wesenbeeck, B. K., Mulder, J. P. M., Marchand, M., Reed, D. J., De Vries, M. B., De Vriend, H. J., and Herman, P. M. J.: Damming deltas: A practice of the past? Towards nature-based flood defenses, Estuar. Coast. Shelf Sci., 140, 1–6, https://doi.org/10.1016/j.ecss.2013.12.031, 2014.
Vuik, V., Borsje, B. W., Willemsen, P. W. J. M., and Jonkman, S. N.: Salt marshes for flood risk reduction: Quantifying long-term effectiveness and life-cycle costs, Ocean Coast. Manage., 171, 96–110, https://doi.org/10.1016/j.ocecoaman.2019.01.010, 2019.
Wang, D., Scussolini, P., and Du, S.: Assessing Chinese flood protection and its social divergence, Nat. Hazards Earth Syst. Sci., 21, 743–755, https://doi.org/10.5194/nhess-21-743-2021, 2021.
Werner, B. T. and McNamara, D. E.: Dynamics of coupled human-landscape systems, Geomorphology, 91, 393–407, https://doi.org/10.1016/j.geomorph.2007.04.020, 2007.
Westermann, W. L.: The Development of the Irrigation System of Egypt, Class. Philol., 14, 158–164, https://doi.org/10.1086/360222, 1919.
Wilkinson, M. D., Dumontier, M., Aalbersberg, Ij. J., Appleton, G., Axton, M., Baak, A., Blomberg, N., Boiten, J. W., da Silva Santos, L. B., Bourne, P. E., Bouwman, J., Brookes, A. J., Clark, T., Crosas, M., Dillo, I., Dumon, O., Edmunds, S., Evelo, C. T., Finkers, R., Gonzalez-Beltran, A., Gray, A. J. G., Groth, P., Goble, C., Grethe, J. S., Heringa, J., t Hoen, P. A. C., Hooft, R., Kuhn, T., Kok, R., Kok, J., Lusher, S. J., Martone, M. E., Mons, A., Packer, A. L., Persson, B., Rocca-Serra, P., Roos, M., van Schaik, R., Sansone, S. A., Schultes, E., Sengstag, T., Slater, T., Strawn, G., Swertz, M. A., Thompson, M., Van Der Lei, J., Van Mulligen, E., Velterop, J., Waagmeester, A., Wittenburg, P., Wolstencroft, K., Zhao, J., and Mons, B.: Comment: The FAIR Guiding Principles for scientific data management and stewardship, Sci. Data, 3, 1–9, https://doi.org/10.1038/sdata.2016.18, 2016.
Wing, O. E. J., Bates, P. D., Neal, J. C., Sampson, C. C., Smith, A. M., Quinn, N., Shustikova, I., Domeneghetti, A., Gilles, D. W., Goska, R., and Krajewski, W. F.: A New Automated Method for Improved Flood Defense Representation in Large-Scale Hydraulic Models, Water Resour. Res., 55, 11007–11034, https://doi.org/10.1029/2019WR025957, 2019.
Winsemius, H. C., Aerts, J. C. J. H., Van Beek, L. P. H., Bierkens, M. F. P., Bouwman, A., Jongman, B., Kwadijk, J. C. J., Ligtvoet, W., Lucas, P. L., Van Vuuren, D. P., and Ward, P. J.: Global drivers of future river flood risk, Nat. Clim. Change, 6, 381–385, https://doi.org/10.1038/nclimate2893, 2016.
Young, J. C., Lynch, R., Boakye-Achampong, S., Jowaisas, C., Sam, J., and Norlander, B.: Volunteer geographic information in the Global South: barriers to local implementation of mapping projects across Africa, Geo J., 86, 2227–2243, https://doi.org/10.1007/s10708-020-10184-6, 2020.