the Creative Commons Attribution 4.0 License.
the Creative Commons Attribution 4.0 License.
 | 19 Dec 2022
Drivers of extreme burnt area in Portugal: fire weather and vegetation
Akli Benali
Mário Pereira
João Silva
João Nunes
Fire weather indices are used to assess the effect of weather on wildfire behaviour and to support fire management. Previous studies identified the high daily severity rating percentile (DSRp) as being strongly related to the total burnt area (BA) in Portugal, but it is still poorly understood how this knowledge can support fire management at a smaller spatial scale. The aims of this study were to (1) assess whether the 90th DSRp (DSR90p) threshold is adequate for estimating most of the BA in mainland Portugal; (2) analyse the spatial variability of the DSRp threshold that explains a large part of BA, at higher resolution; and, (3) analyse whether vegetation cover can justify the DSRp spatial variability.
We used weather reanalysis data from ERA5-Land, wildfire and land use data from Portuguese land management departments for an extended summer period (15 May to 31 October) from 2001 to 2019. We computed and related DSRp to large wildfires (BA > 100 ha) and land use to clarify the effectiveness of the DSRp for estimating BA in Portugal and assess how vegetation influences it.
Results revealed that the DSR90p is an adequate indicator of extreme fire weather days and BA in Portugal. In addition, the spatial pattern of the DSRp associated with most of the total BA shows variability at the municipality scale. Municipalities where large wildfires occur with more extreme weather conditions have most of the BAs in forests and are in coastal areas. By contrast, municipalities where large wildfires occur with less extreme weather conditions are predominantly covered by shrublands and are situated in eastern and inland regions. These findings are a novelty for fire science in Portugal and should be considered by fire managers and fire risk assessors.
- Article
(13866 KB) - Full-text XML
- BibTeX
- EndNote


Wildfire incidence is defined as the number of fire events and/or burnt areas (BAs) and strongly depends on the weather and climate, especially in regions with a Mediterranean type of climate, i.e. Csa and Csb in the Köppen–Geiger climate classification (Beck et al., 2018). This climate is characterized by mild and rainy winters and springs, favouring vegetation growth, while dry and hot summers promote thermal and hydric stress of live fuels and dryness of dead fuels (Romano and Ursino, 2020). In the western Mediterranean, the influence of climate variability on wildfire incidence became increasingly evident after the 1970s, following a fire regime change, from fuel-limited to drought-driven regimes (Pausas and Fernández-Muñoz, 2012). The main factor for this change was the increase in fuel load and continuity due to rural depopulation and land abandonment (Moreira et al., 2011; Moreno et al., 2014). These changes in landscape and population favoured the occurrence of large wildfires (Ferreira-Leite et al., 2016), which can also modify the landscape in the Mediterranean region (e.g. Stamou et al., 2016) influenced by regeneration patterns, topography and local fire histories. However, large wildfires tend to occur with severe fire weather conditions, which are rare in other meteorological conditions (Telesca and Pereira, 2010).
Heatwaves and droughts have a strong influence on fire incidence, as shown by several studies in the past few years in Mediterranean Europe (e.g. Duane and Brotons, 2018; Sutanto et al., 2020). The impact of droughts on vegetation creates favourable conditions for the ignition and spread of wildfires, especially during summer (Pausas and Fernández-Muñoz, 2012; Russo et al., 2017), but also in winter (Amraoui et al., 2015; Calheiros et al., 2020). In addition, fire incidence increased dramatically with the combined effect of prolonged drought and heatwaves on vegetation (water and heat stress), as pointed out by Ruffault et al. (2018). Wildfire incidence in Mediterranean Europe is expected to increase in the future because of climate change, especially due to global warming and changes in the precipitation regime (Sousa et al., 2015; Turco et al., 2018).
The Iberian Peninsula is the European region with the highest wildfire incidence, which results in large property damage and fatalities (San-Miguel-Ayanz et al., 2020). In particular, Portugal has been severely affected by wildfires in the last decades, especially in 2003, 2005 and 2017, mainly as a consequence of anomalous atmospheric synoptic patterns and extreme weather conditions (Gouveia et al., 2012; Trigo et al., 2006; Turco et al., 2019). Other studies identified weather types, most of them connected with heatwaves or droughts in the western Iberian Peninsula, associated with the occurrence of large wildfires (Rodrigues et al., 2020; Vieira et al., 2020).
Fire weather danger indices are commonly used to assess the current and/or cumulative effect of atmospheric conditions on fuel moisture and fire behaviour. The Canadian Forest Fire Weather Index (FWI) System (CFFWIS) consists of six components that account for those effects (Van Wagner, 1987), including the daily severity rating (DSR). The CFFWIS is extensively used in Portugal, both for research and operational purposes, having the best results when compared with other fire indices (Viegas et al., 1999; IPMA, 2022). The 90th percentile of the DSR (DSR90p) is often used as the threshold for severe fire weather that is associated with large fires (Bedia et al., 2012; Carvalho et al., 2008; Fernandes, 2019; Silva et al., 2019). More recently, the 95th percentile of DSR (DSR95p) was also identified as a good indicator of extreme fire weather and was strongly related to the BA in the Iberian Peninsula (Calheiros et al., 2020, 2021).
The fire regime can be defined, in a strict sense, by the spatial and temporal patterns of wildfire characteristics (e.g. occurrence, frequency, size, seasonality, etc.), as well as, in a broad sense, by vegetation characteristics, fire effects and fire weather in a given area or ecosystem, based on fire histories at individual sites over long periods, generally resulting from the cumulative interaction of fire, vegetation, climate, humans, and topography over time (Krebs et al., 2010; Whitlock et al., 2010; NCWG, 2011).
An essential element for fire incidence is the vegetation and land use type. There have been important changes in land use since the 1960s in Portugal, which are related to wildfire occurrence. Arable cropland decreased from 40 % to only 12 % of the total area in 2006, at the national level; and forests have declined since the 1980s, as a result of forest fires, in central Portugal (Jones et al., 2011). The contribution of landscape-level fuel connectivity to wildfire size was evident in the period 1998–2008 (Fernandes et al., 2016). The analysis of Corine Land Cover maps for 2000 and 2006 and European Forest Fire Information System (EFFIS) BA perimeters, from 2000 to 2013 in Portugal, revealed that an increase in the area of shrublands and a decrease in forest areas, along with socioeconomic changes, impact the fire regime (Pereira et al., 2014; Parente and Pereira, 2016; Parente et al., 2018b). In Portugal, eucalyptus expansion has not modified the fire regime, but the rising undermanaged and abandoned forest plantations, especially after large-fire seasons, are a concern for the future (Fernandes et al., 2019).
Shrublands are more susceptible to wildfires, whereas agricultural areas and agroforestry systems are less likely to burn, as revealed by several studies (Carmo et al., 2011; Nunes, 2012; Meneses et al., 2018a). Barros and Pereira (2014) identified shrublands as the most wildfire-prone land cover, followed by pine forests; by contrast, annual crops and evergreen oak woodlands tend to be avoided by wildfires. Ferreira-Leite et al. (2016) concluded that uncultivated land (shrublands, grasslands, and other sparse vegetation) was the most important factor affecting BA, considering large wildfires, greater than 100 ha. Topography and uncultivated land were significant factors determining BA in a study of the period 1980–2014 conducted at the municipal level (Nunes et al., 2016). Additionally, there is evidence of an extending urban–rural interface in Portugal, due to an increase in the urban area since 1990, which contributes to a rise in fire incidence (Silva et al., 2019), especially in these regions (Tonini et al., 2018).
Land use interfaces, in particular those between forests and other land use types (shrublands, agricultural and urban areas), have a significant effect on human-caused wildfire occurrence in Mediterranean Europe, increasing fire risk due to human causes (Vilar et al., 2016). In the Iberian Peninsula, shrublands and pine forests have registered larger BA (Barros and Pereira, 2014; Pausas and Vallejo, 1999). This fact can be explained by the increasing landscape homogenization, due to shrubland expansion and agricultural abandonment, as observed by Lloret et al. (2002).
Wildfires in Portugal were the subject of several studies that developed zoning approaches to identify regions with similar fire regimes using BA data alone (Kanevski and Pereira, 2017; Scotto et al., 2014; Silva et al., 2019) or in combination with fire weather indices (Calheiros et al., 2020, 2021; Jimenez-Ruano et al., 2018), large fire-weather typologies (Rodrigues et al., 2020), population density, topography, land cover changes (Oliveira et al., 2017) and net primary production (Fernandes, 2019). Their results indicate that Portugal can be divided into two (dividing the north and south of Tajo River) or three main clusters (the north part further divided into western and eastern parts). The spatial and temporal distribution of wildfires presents clustering patterns, suggesting that small fires are more dependent on local topographic or human conditions, while large fires are a consequence of infrequent causes or with shorter periods such as extreme weather events (Pereira et al., 2015). The temporal pattern is characterized by periodicities and scaling regimes (Telesca and Pereira, 2010) including a main summer fire season and a secondary spring peak, both driven by the type of climate and the occurrence of extreme weather conditions (Amraoui et al., 2015; Trigo et al., 2016; Calheiros et al., 2020).
A previous study assessed the recent evolution of spatial and temporal patterns of BA and fire weather risk in the Iberian Peninsula and concluded that the DSR95p is a good indicator of extreme fire weather and is strongly related to the BA, noticeable in the similar intra-annual variability pattern in four pyro-regions (Calheiros et al., 2020). This robust link was used to anticipate fire regime changes caused by future climate change, revealing the potential displacement of fire regimes to the north (Calheiros et al., 2021). However, previous studies did not look at additional factors, for example: whether the high percentiles of DSR are also linked to high values of BA in Portugal or Spain; whether the high percentiles of DSR are similarly spatially distributed in all of Iberia; or, if there is some spatial variability, what are the main reasons that can explain it. These knowledge gaps drove us to investigate whether the DSRp value identified for the entire Iberian Peninsula is equally adequate to estimate BA in mainland Portugal, given its characteristics. Furthermore, we intended to study the variability of the relationship between DSRp and BA, together with the main factors of this variability. Accordingly, the objectives of this work were:
-
to assess whether the DSR90p threshold is adequate to estimate most of the BA in mainland Portugal;
-
to analyse the regional variations of the DSRp threshold that explains a large part of BA, at higher resolution, and;
-
to analyse whether vegetation cover can explain the spatial variability of the DSRp.
In summary, this study aims to clarify the effectiveness of the DSRp for estimating BA in Portugal and how this relationship is influenced, namely by vegetation.
2.1 Study area: Portugal
This study focuses on mainland Portugal topographically characterized by mountainous ranges in the north and central regions and vast plains in the south, divided into 23 NUTS 3 regions which, in turn, are subdivided into 278 municipalities (Fig. 1). The BA variability is mainly influenced by the precipitation anomaly in spring and the occurrence of abnormal atmospheric patterns that generate very hot and dry days in the western Iberian Peninsula during summer (Pereira et al., 2005). Most (97 %) of the total number of extreme wildfires (with BA ≥ 5000 ha) were active during heatwaves (Parente et al., 2018a) while almost 90 % of extreme wildfires during the period 1981–2017 occurred within a region affected by drought (Parente et al., 2019).
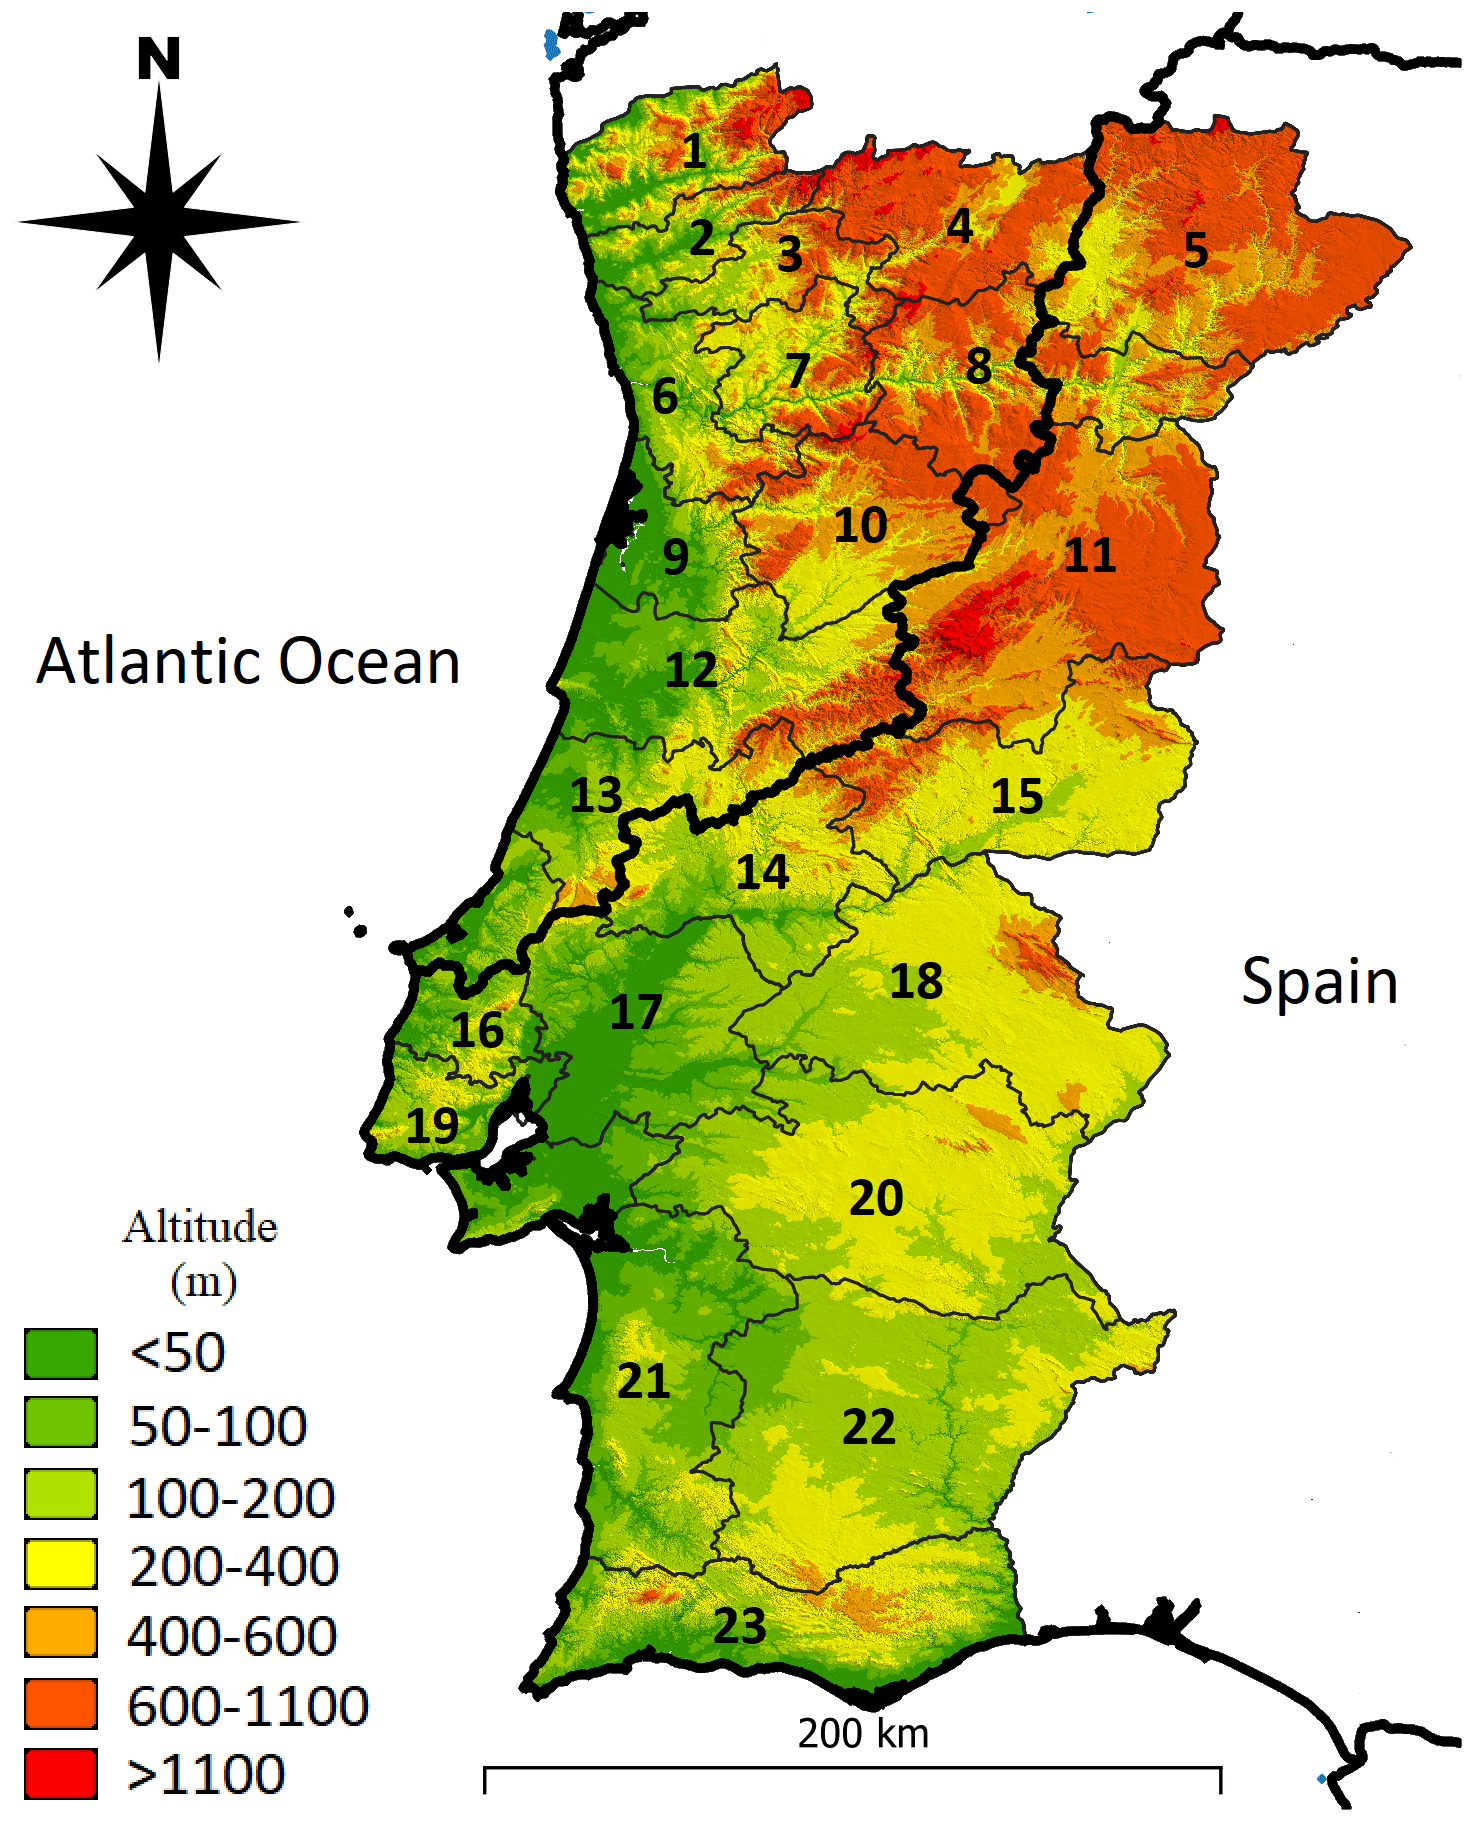
Figure 1Mainland Portugal topography and administrative division based on NUTS 3 provinces: Alto Minho (1), Cávado (2), Ave (3), Alto Tâmega (4), Terras de Trás-os-Montes (5), Área Metropolitana do Porto (6), Tâmega e Sousa (7), Douro (8), Região de Aveiro (9), Viseu Dão-Lafões (10), Beiras e Serra da Estrela (11), Região de Coimbra (12), Região de Leiria (13), Médio-Tejo (14), Beira Baixa (15), Oeste (16), Lezíria do Tejo (17), Alto Alentejo (18), Área Metropolitana de Lisboa (19), Alentejo Central (20), Alentejo Litoral (21), Baixo Alentejo (22) and Algarve (23). NUTS 3 frontiers were loaded from the European Environment Agency (EEA, 2021) and altitude data from Direção Geral do Território (DGT, 2010). For comparison purposes, the borders (thick black line) of the pyro-regions found by Calheiros et al. (2020) were also added: the NW pyro-region is located in northwestern Portugal and the SW pyro-region in the southwestern and eastern parts of the country.
The territory of Continental Portugal is mostly covered by forests (39 %), agricultural lands (26 %), shrublands (12 %) and agroforestry systems (8 %), according to data from Direção Geral do Território (DGT, 2019a). The most common tree species are Eucalyptus globulus (26 % of all forests), Pinus pinaster (22 %), both prevalent in the north and centre; and Quercus suber (22 %), with larger areas in the south, using forest data from Instituto Nacional da Conservação da Natureza e das Florestas (ICNF, 2019). Pyro-regions shown in Fig. 1 are both characterized by a high peak of BA centred in August and a much smaller one in March. The main difference between the NW and SW pyro-region is the larger values of BA in the NW pyro-region, compared with the SW, especially in August (Calheiros et al., 2020).
2.2 Burnt area
Wildfire data used in this study are BA polygons derived from satellite data provided for the period 2001–2019 by Portuguese national authorities (ICNF, 2020). This dataset was successfully used in many other studies, by a large number of authors for a wide variety of purposes (Bergonse et al., 2021; Tarín-Carrasco et al., 2021). Only wildfires with BA > 100 ha that occurred during the extended summer season, here defined between 15 May and 31 October, were considered in this study. It is important to explain these methodological options.
The focus on relatively large wildfires (here defined as wildfires with BA > 100 ha) is based on two main reasons. First, mainland Portugal registers a huge number of small wildfires but they account only for a small portion of total BA (TBA). For example wildfires with BA > 100 ha are only about 1 % of all wildfires but account for 75 % of TBA (Pereira et al., 2011). Second, wildfires in Portugal are mainly (99.4 %) caused by humans, either by negligence (about one-quarter of the total number of wildfires with known cause) or intentionally (about three-quarters), associated with the use of fire, accidents and structural/land use (Parente et al., 2018b), which means that small wildfires can occur with relatively low DSR.
Table 1Data sources and types, variables and methodology where it is used.
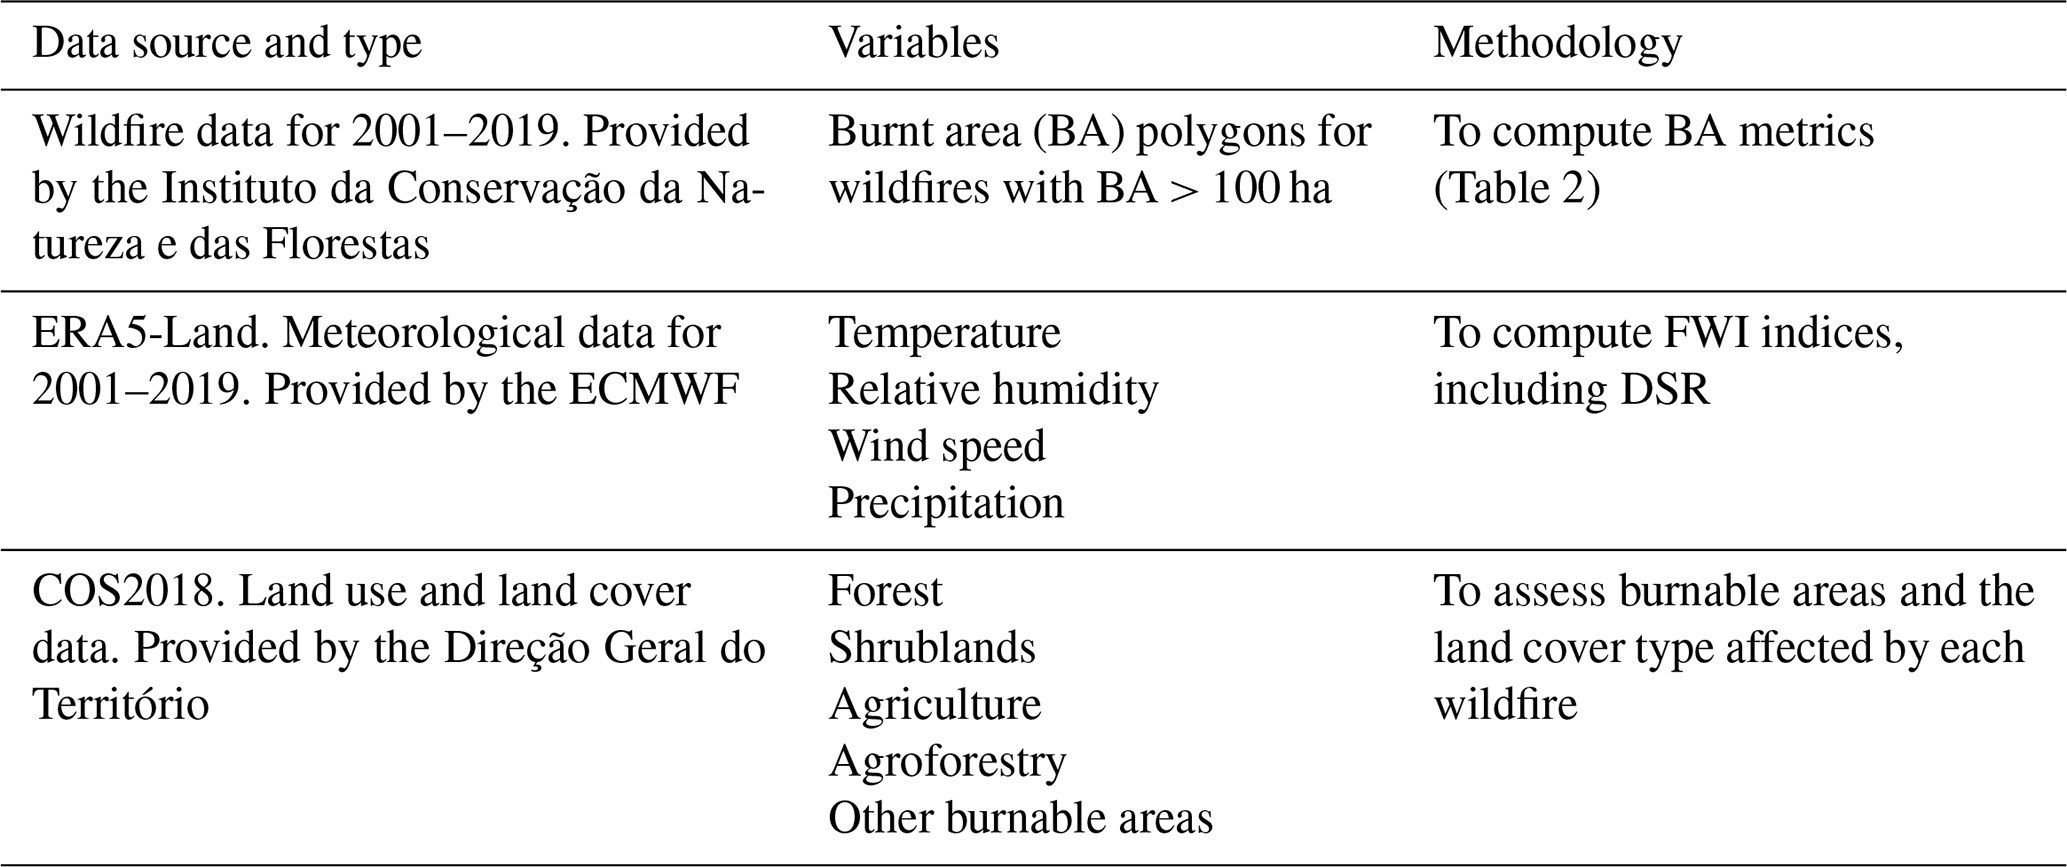
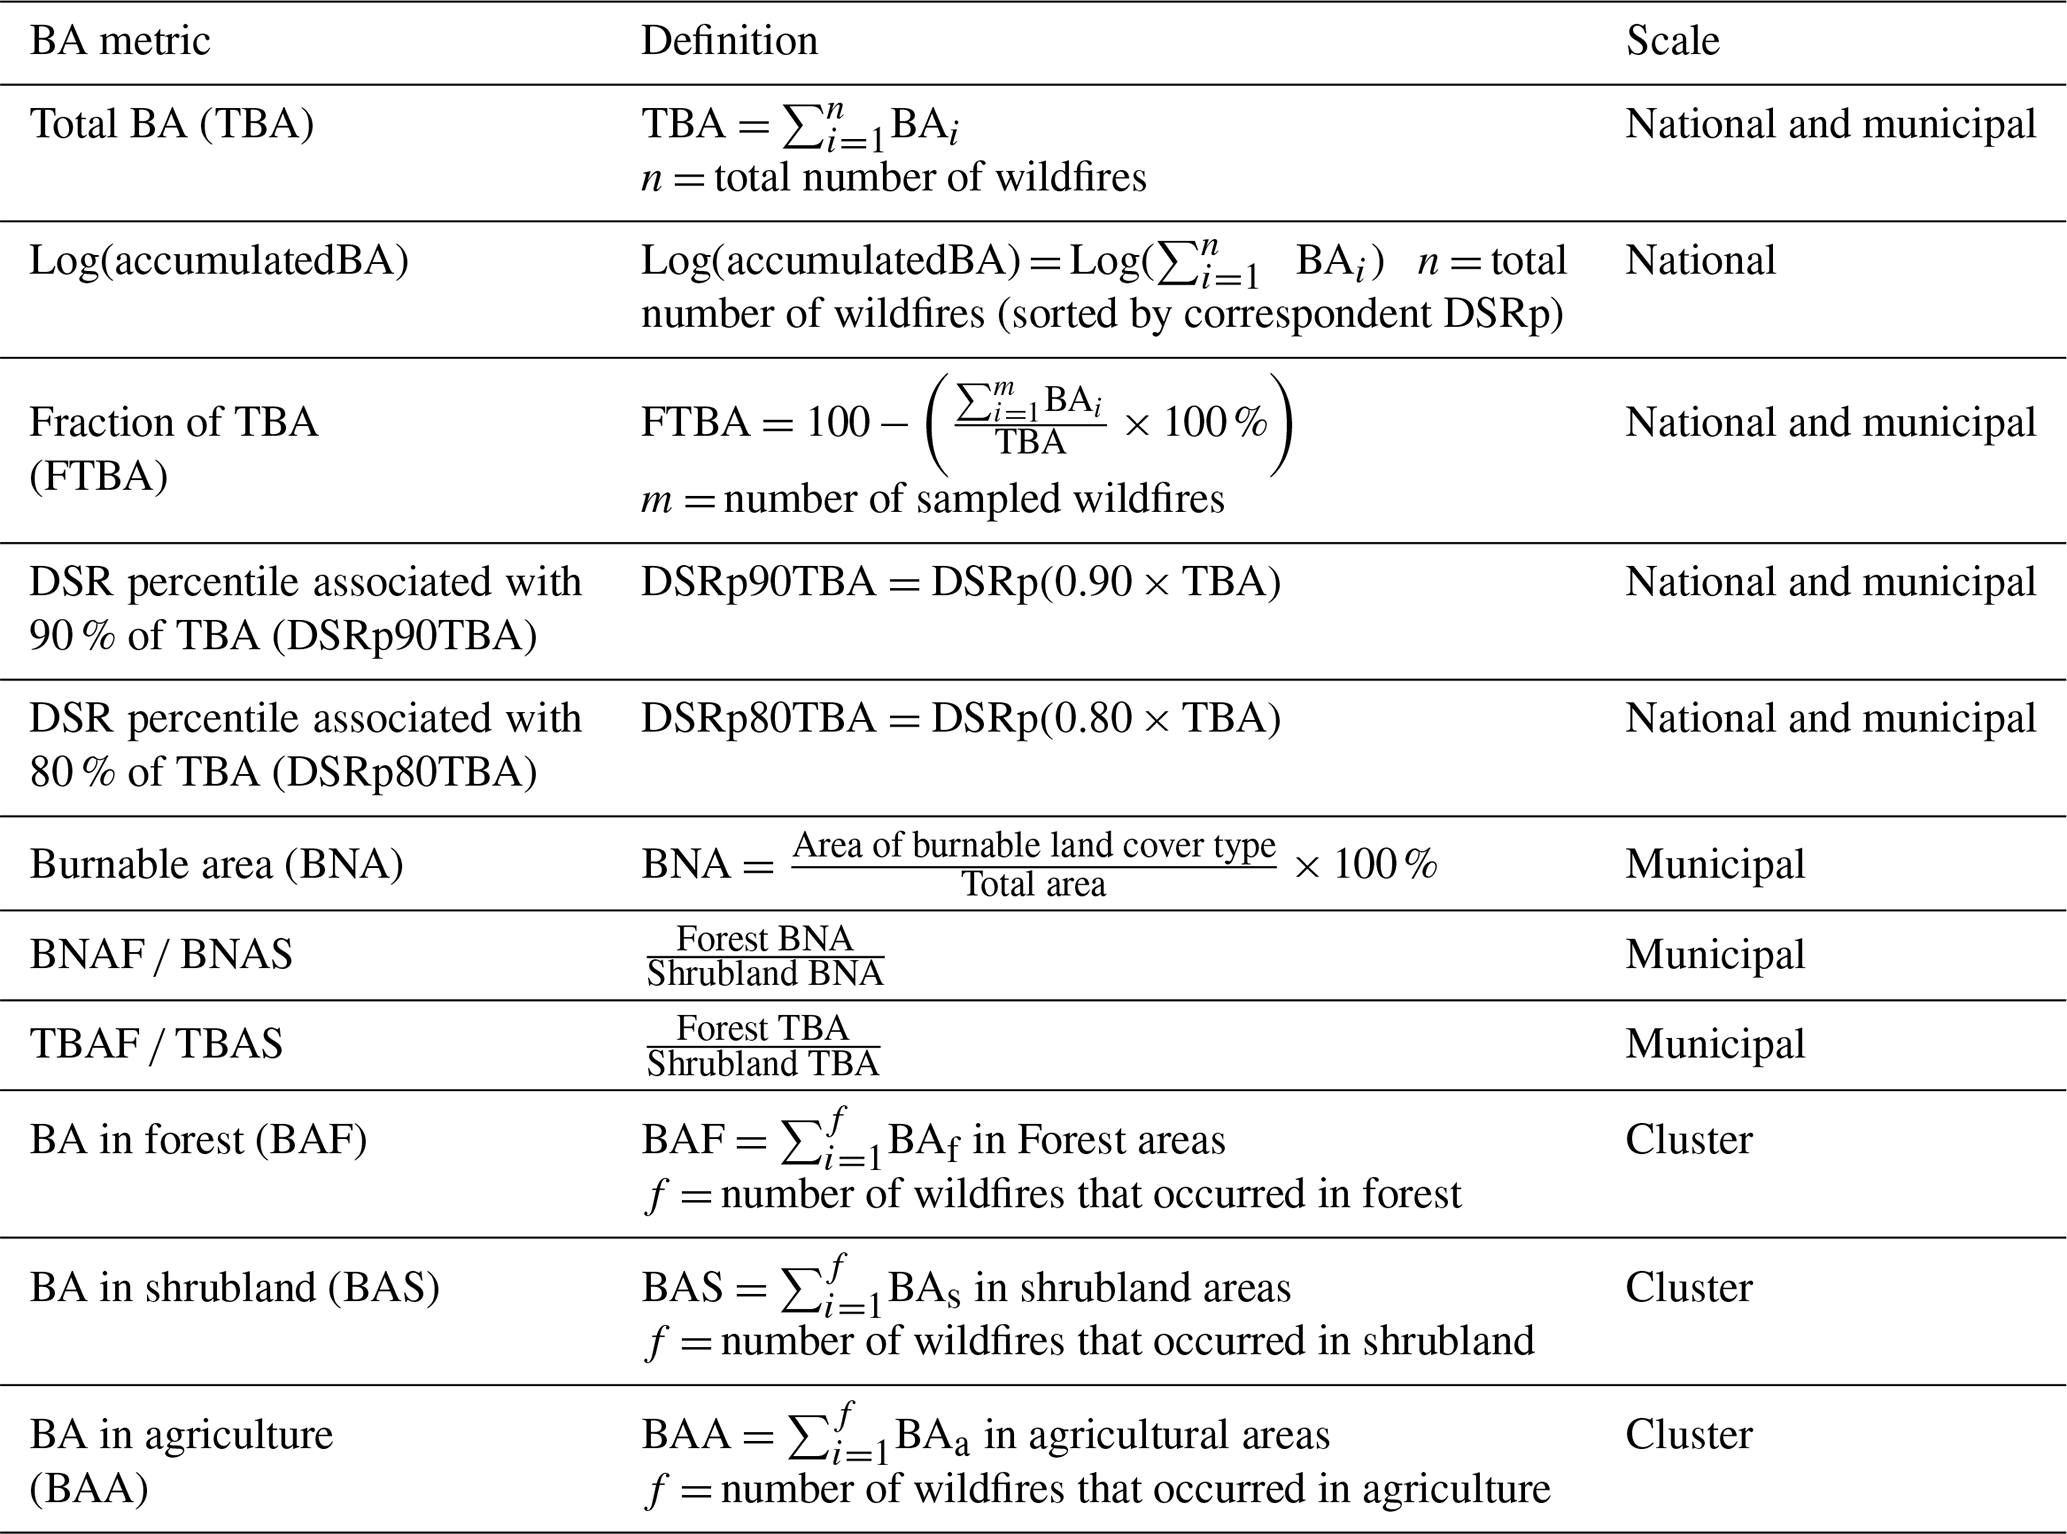
Table 2Burnt area (BA) metrics used in the paper, including acronym, definition and spatial scale of application/use.
The study only considered wildfires that occurred during the period from 15 May to 31 October because of also two main reasons: (i) BA caused by large wildfires during this period accounts for 97.5 % of TBA; and, (ii) the secondary peak of fire incidence in Portugal occurs in late winter/early spring when DSR is lower and depends much more on drought than high air temperature (Amraoui et al., 2015; Calheiros, et al., 2020). The datasets and wildfire metrics used in this study are summarized in Tables 1 and 2, respectively.
2.3 Meteorological data and fire weather indices
We used the DSR, which is more accurate, to rate the expected efforts required to suppress or control a wildfire, being an additional component of the FWI system (De Groot, 1987; Van Wagner, 1987). The indices of the FWI system were computed for the study period 2001–2019 with the equations provided by Van Wagner and Pickett (1975) and daily values at 12:00 UTC of air temperature and relative humidity (at 2 m), wind speed (at 10 m), and accumulated total precipitation (Table 1).
Data on the meteorological variables were obtained from the latest (fifth) generation of European Centre for Medium-Range Weather Forecasts (ECMWF) atmospheric reanalyses of the global climate (ERA5-Land). The ERA5-Land dataset was loaded from the Copernicus Climate Change Service (C3S, 2020), with a much higher spatial resolution (0.1∘ lat × 0.1∘ long; the native resolution is 9 km) and temporal (hourly) resolution than the previous reanalysis data service, which was widely used and with good performance for various purposes, including FWI calculation in Portugal (Bedia et al., 2012). ERA5 and ERA5-Land agree well with observations and present smaller biases than the other reanalysis datasets (Pelosi et al., 2020; Guo et al., 2021; Hassler and Lauer, 2021; Nogueira, 2020), being recognized as the best or one of the best global atmospheric reanalysis datasets (Huai et al., 2021; Muñoz-Sabater et al., 2021; Urban et al., 2021) and used worldwide (Chinita et al., 2021; Sianturi et al., 2020; Sun et al., 2021; Araújo et al., 2022).
2.4 Vegetation and land use data
The land use and land cover (LULC) map for 2018 (COS2018) was provided by Portuguese national authorities (DGT, 2019a). This map has 83 land use or land cover classes clustered into nine major classes: artificialized territories, agriculture, pastures, agroforestry, forests, shrublands, open spaces or areas with sparse vegetation, wetlands and bodies of water (Caetano et al., 2017). The burnable areas considered in this study were forests, shrublands, agriculture (which includes pastures and areas of agricultural species highly susceptible to wildfires), agroforestry and other burnable areas (areas with sparse vegetation, peatlands and coastal marshes). COS2018 was produced using aerial photographs from the same year, with 35 more classes than the previous versions. The dataset is available in shapefile format, composed of polygons with a spatial resolution of 1 ha (DGT, 2019b). In particular, we organized the data into five major land use types: forest, shrublands, agriculture, agroforestry and other burnable areas (Table 1). It is important to note that we did not aim to analyse any shrub- or forest-specific type.
2.5 Analysing burnt areas and fire–weather relationship
The relationship between wildfires and weather was based on derived data, processed as described below. The start and end dates of each wildfire were fundamental to attributing the DSR to each BA. The dating process of the BA polygons relied on MODIS satellite data and the methodology of Benali et al. (2016). It was possible to estimate the start and end dates as well as ignition locations for 2016 wildfire events, corresponding to 92 % of the initial total BA.
Daily DSR was computed for the study period and all ERA5-Land grid points within the territory of Continental Portugal. In the case of the analysis carried out for all of mainland Portugal, the value of the DSRp associated with each wildfire was the maximum value of DSR registered in the area affected during the duration of the wildfire. When the analysis is carried out based on the municipalities, the procedure is similar with one exception: when a wildfire affected more than one municipality, the BA in each municipality was allocated to each municipality and analysed separately as a single wildfire event. The division of the BA between affected municipalities can introduce noise in the data since it artificially generates BA which can be relatively small but associated with high or very high DSRp. To circumvent this potential problem, we decided to analyse BA percentages, relative to the TBA that occurred in a municipality during the study period, which reduces the influence of small wildfires on the final results.
We only selected (175) municipalities (from 278) affected by more than three wildfires and TBA > 500 ha. Restricting the analysis to the administrative units with sufficient data aims to increase the robustness of the results and prevent potential interpretation errors. The selection of the maximum value of DSR to be associated with wildfires is justified by the low spatial variability of the DSR, the small size of administrative units and the native reanalysis data resolution (C3S, 2020).
For the first objective, we start by making and analysing plots of BA metrics vs DSRp (Table 2) for all the 2016 large wildfires that occurred in mainland Portugal during the study period, in the following order:
-
We first compared the BA values with DSRp and analysed them.
-
Those results lead us to sort BA data by the respective DSRp, compute accumulated values of BA, normalize it using the natural logarithm and plot against DSRp to assess whether this relationship is linear.
-
Subsequently, we analysed whether a fixed threshold of DSR for extreme days – DSR90p – is adequate to estimate extreme fire weather and is strongly related to a large fraction of TBA (FTBA), for the entire territory. It is important to note that FTBA was calculated as the difference between 100 and the percentage of TBA corresponding to a certain DSRp (Table 2). This methodology was made with the purpose of visualizing the TBA that burns above a DSRp threshold. We considered the correspondent 80 % and 90 % of FTBA as sufficient to classify DSRp as the extreme threshold, justified by the results of Pereira et al. (2005), which showed that 80 % of TBA occurs in 10 % of summer days.
2.6 Analysing clusters of burnt areas
Potential clustering was assessed using the curves of FTBA vs DSRp for all of the selected municipalities. The high number (175) of these administrative regions make it difficult to interpret the results. Therefore, cluster analysis was performed to identify the major macro-scale spatial patterns and to objectively and statistically assess the significant differences between the results obtained for different municipalities.
The following notation was adopted to describe the linkages (the distance between two clusters) used in the complete clustering method (The MathWorks Inc, 2021):
-
Cluster r is formed from two clusters.
-
nr is the number of objects in cluster r.
-
xri is the ith object in cluster r.
-
Complete linkage (d), also called the farthest neighbour, which uses the largest distance between objects in the two clusters (Eq. 1).
A distance metric is a function that defines the distance between two observations. The MATLAB function pdist used in this study can compute the pairwise distance between pairs of observations with different metrics. We applied the correlation distance because it provides a more easily interpretable dendrogram.
Given an m-by-n data matrix X, which is treated as m (1-by-n) row vectors x1, x2, …, xm, in this case m being the number of analysed municipalities and n the number of equidistant sampling points in the DSRp scale, the correlation distance between the vector xs and xt is defined in Eq. (2):
where is described in Eq. (3):
and
The selected threshold means that the coefficient of determination in the municipalities within the same cluster is higher than 0.65. This value was selected after a benchmarking analysis of the obtained dendrograms and results from an intended balance within the correlation between municipalities and the total number of clusters. For example, on the one hand, if we had fixed five clusters, the correspondent correlation between municipalities within the same cluster will only be larger than 0.5, a value that we considered too low for this analysis. On the other hand, for a higher correlation, for example 0.75, which corresponds to , the number of clusters will be much higher, increasing the difficulty of interpreting the maps and dendrograms.
2.7 Analysing the influence of vegetation on the fire–weather relationship
The LULC was related to BA to accomplish the third objective of the study by computing several metrics (Table 2), namely: (i) the burnable area (BNA) in each municipality; (ii) the TBA in forests (BAF), shrublands (BAS), agriculture (BAA), agroforestry and other vegetation types; (iii) the ratio between forest and shrublands BNA (BNAF BNAS) and TBA (TBAF TBAS). Computations were made for each analysed municipality and cluster. Moreover, the spatial distribution of prevailing land use types that were most affected by wildfires was investigated to identify which municipalities have a BA in forests larger than 50 % or BA in shrublands larger than 40 % of TBA. The adoption of different thresholds for BA in forests and shrublands is due to a much lower area of shrublands (12 %) than of forests (39 %) in Continental Portugal (DGT, 2019a).
A contingency table, accuracy metrics and statistical measures of association were used to analyse the influence of the type of vegetation cover on the relationship between DSRp and TBA. The contingency table contains the number of municipalities that belong to a different group of clusters, i.e. different DSRp thresholds at 90 % of TBA (DSRp90TBA), and is characterized by BAF > 50 % or BAS + BAA > 40 %. The objective was to relate the municipalities (within groups of clusters) to TBA in diverse vegetation cover types. Statistical measures of association were used for classification accuracy against a reference since, for example municipalities with higher DSRp90TBA will have the largest TBA in forested areas compared with other land use types; and accuracy metrics were computed according to this initial classification.
The list of accuracy metrics includes: (i) the overall accuracy (OA), which represents the samples that were correctly classified and are the diagonal elements in the contingency table, from top-left to bottom-right (Alberg et al., 2004); (ii) the user's accuracy (UA), or reliability, that is indicative of the probability of a sample that was classified in one category belonging to that category; and, (iii) the producer's accuracy (PA), which represents the probability of a sample being correctly classified (Congalton, 2001). Statistical measures are: the chi-squared (χ2) test (Greenwood and Nikulin, 1996), which tests the independence of two categorical variables; the phi test (Φ) or phi coefficient (David and Cramer, 1947), which is related to the chi-squared statistic for a 2 × 2 contingency table, and the two variables are associated if Φ>0. Lastly, we computed Cohen's kappa coefficient, first presented by Cohen (1960) and recently analysed by McHugh (2012), which measures the interrater agreement of the two nominal variables. This coefficient ranges from −1 to 1 and is interpreted as < 0 indicating no agreement to 1 indicating almost perfect agreement.
3.1 Burnt area and fire–weather relationship at the national and municipality level
The scatter plot of BA as a function of DSRp (Fig. 2) reveals that most large wildfires, including those with the largest BA, were registered with the highest values of DSRp. For low DSR values, e.g. below the 80th percentile, the vast majority of BA is the lowest in the 2016 sample values. In addition, the scatter plot of the natural logarithm of the accumulated BA vs DSRp (Fig. 3) presents a linear relationship, with a very high coefficient of determination (R2=0.94) and a p value lower than the significance level. Furthermore, the logarithm of accumulated BA increases exponentially (R2=0.92) for DSRp extreme values (DSR > DSR90p), meaning that BA increases suddenly with extreme meteorological conditions. In summary, the results of these analyses reveal that: (i) wildfires can occur with a large spectrum of DSRp values during the extended summer period; and (ii) very large wildfires only occur with high DSRp.
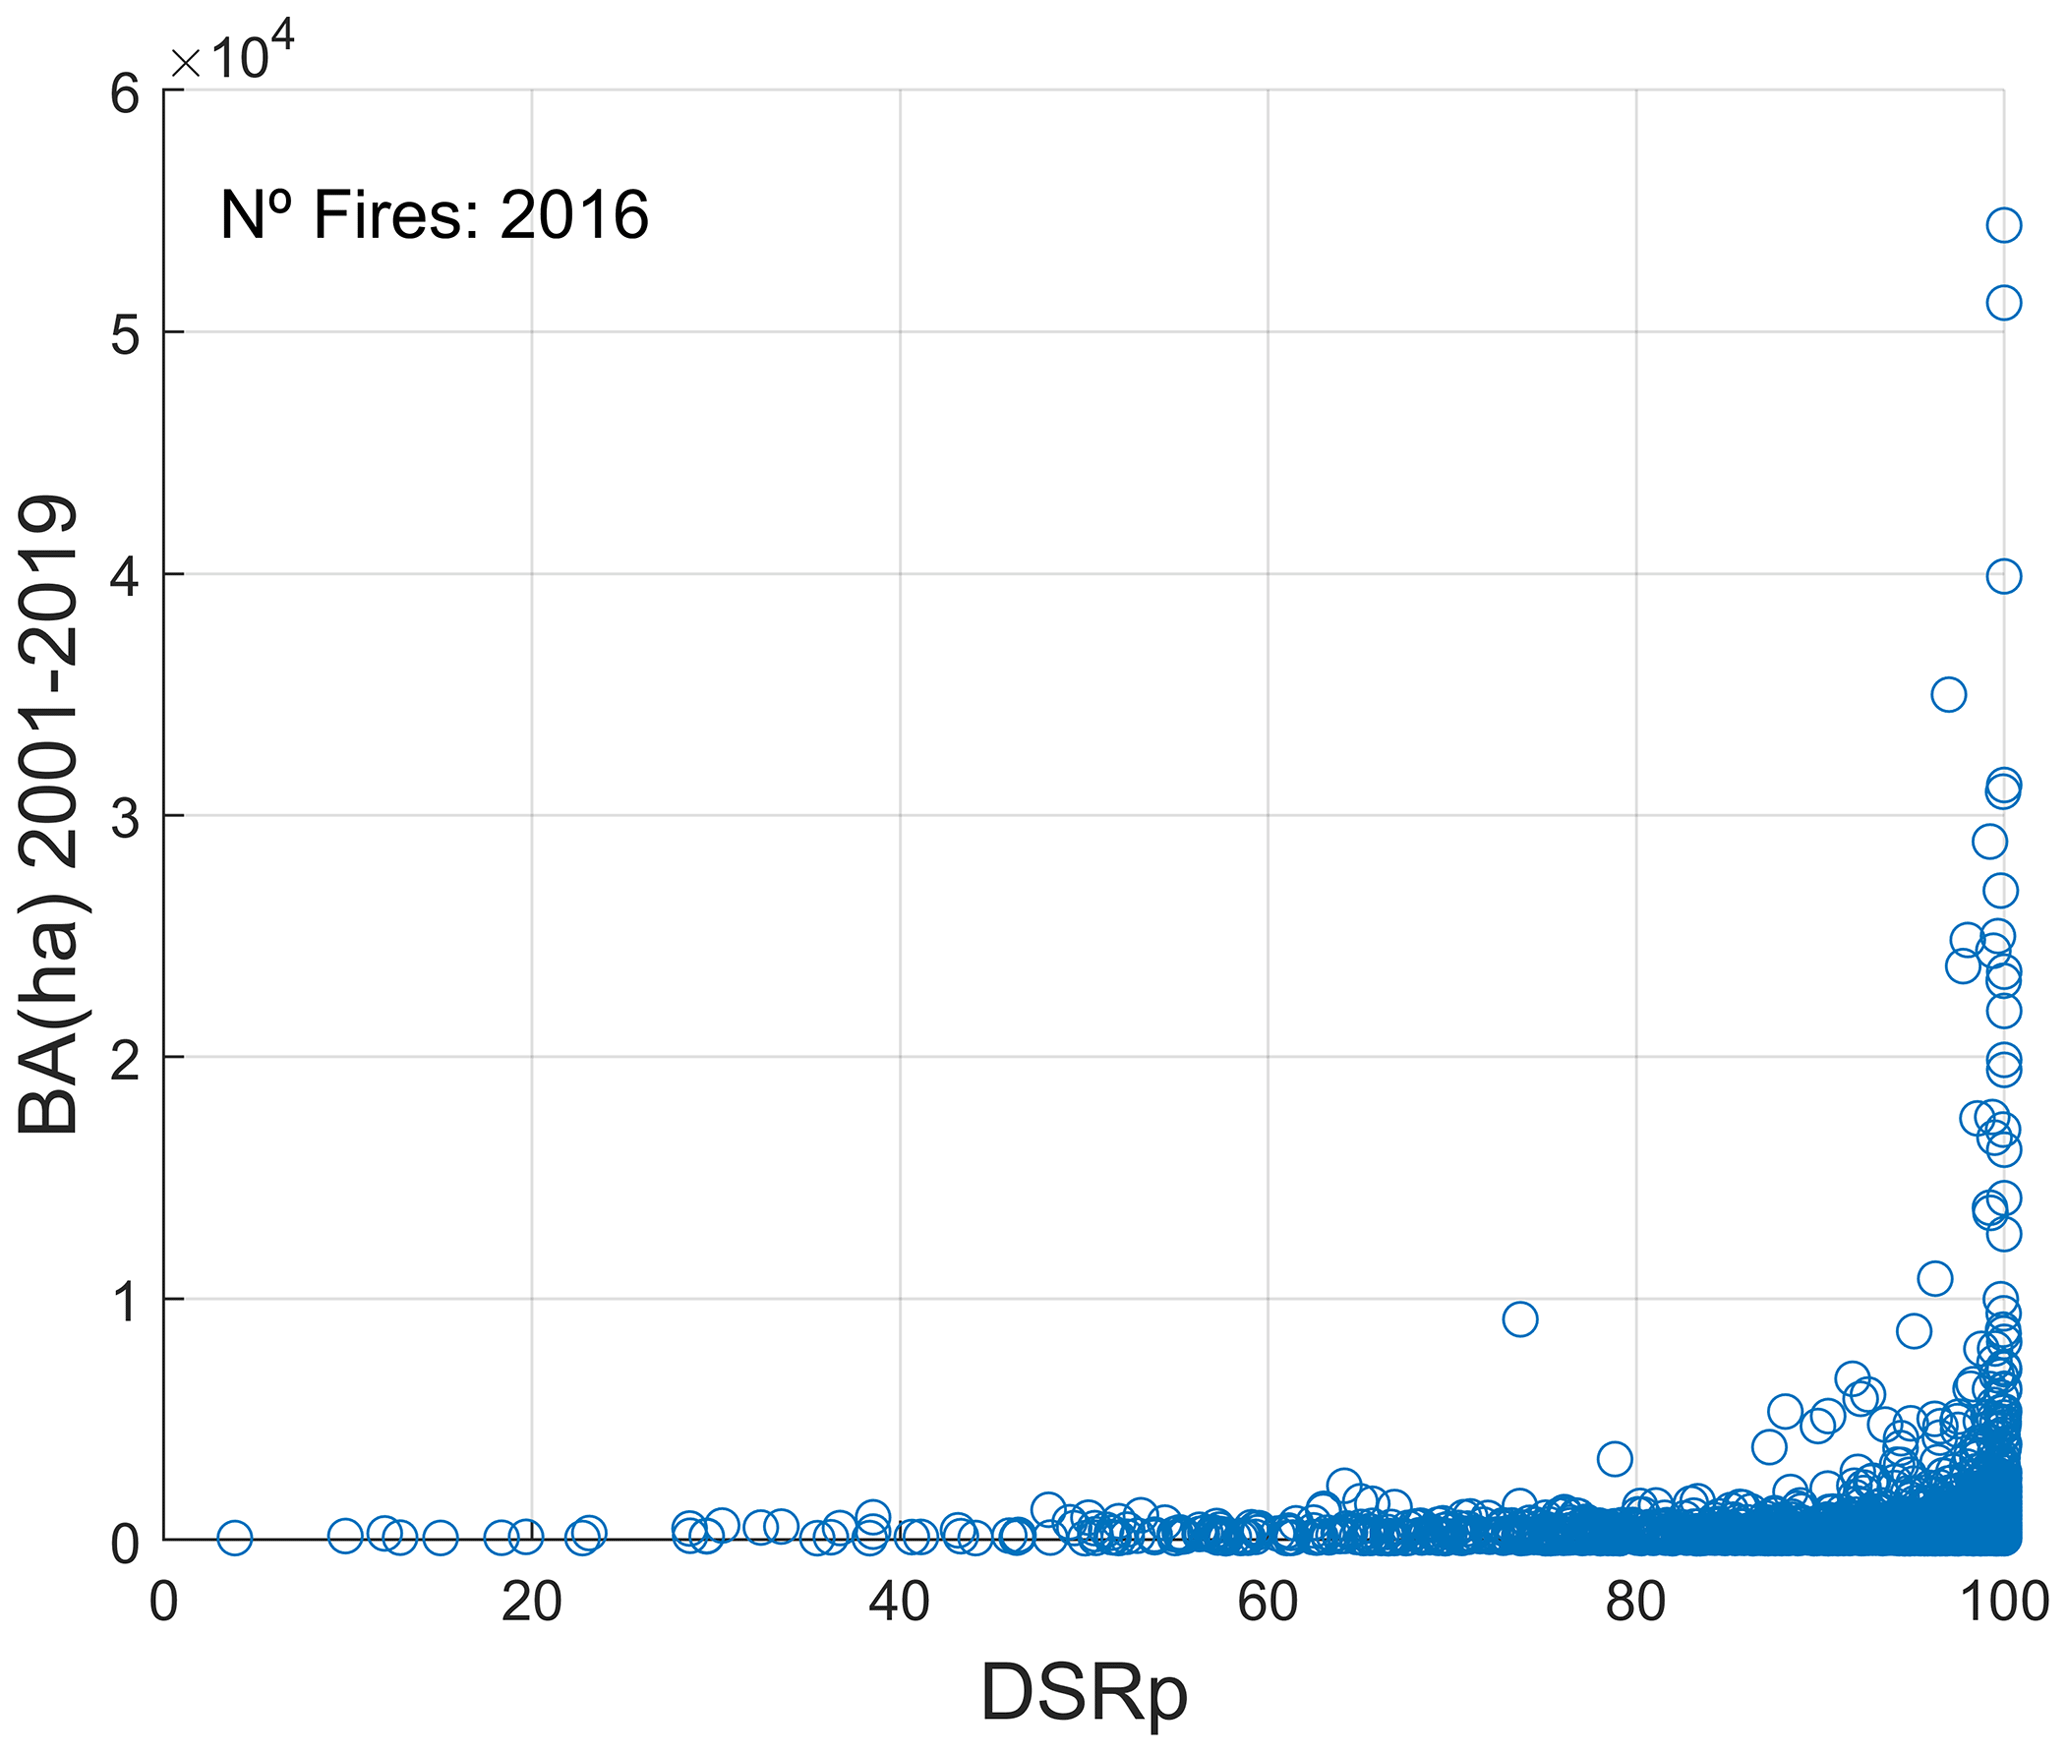
Figure 2Scatterplot of the burnt area (BA) vs DSR percentile (DSRp) for wildfires (blue circles) with BA > 100 ha that occurred between 15 May and 31 October during the period 2001–2019.
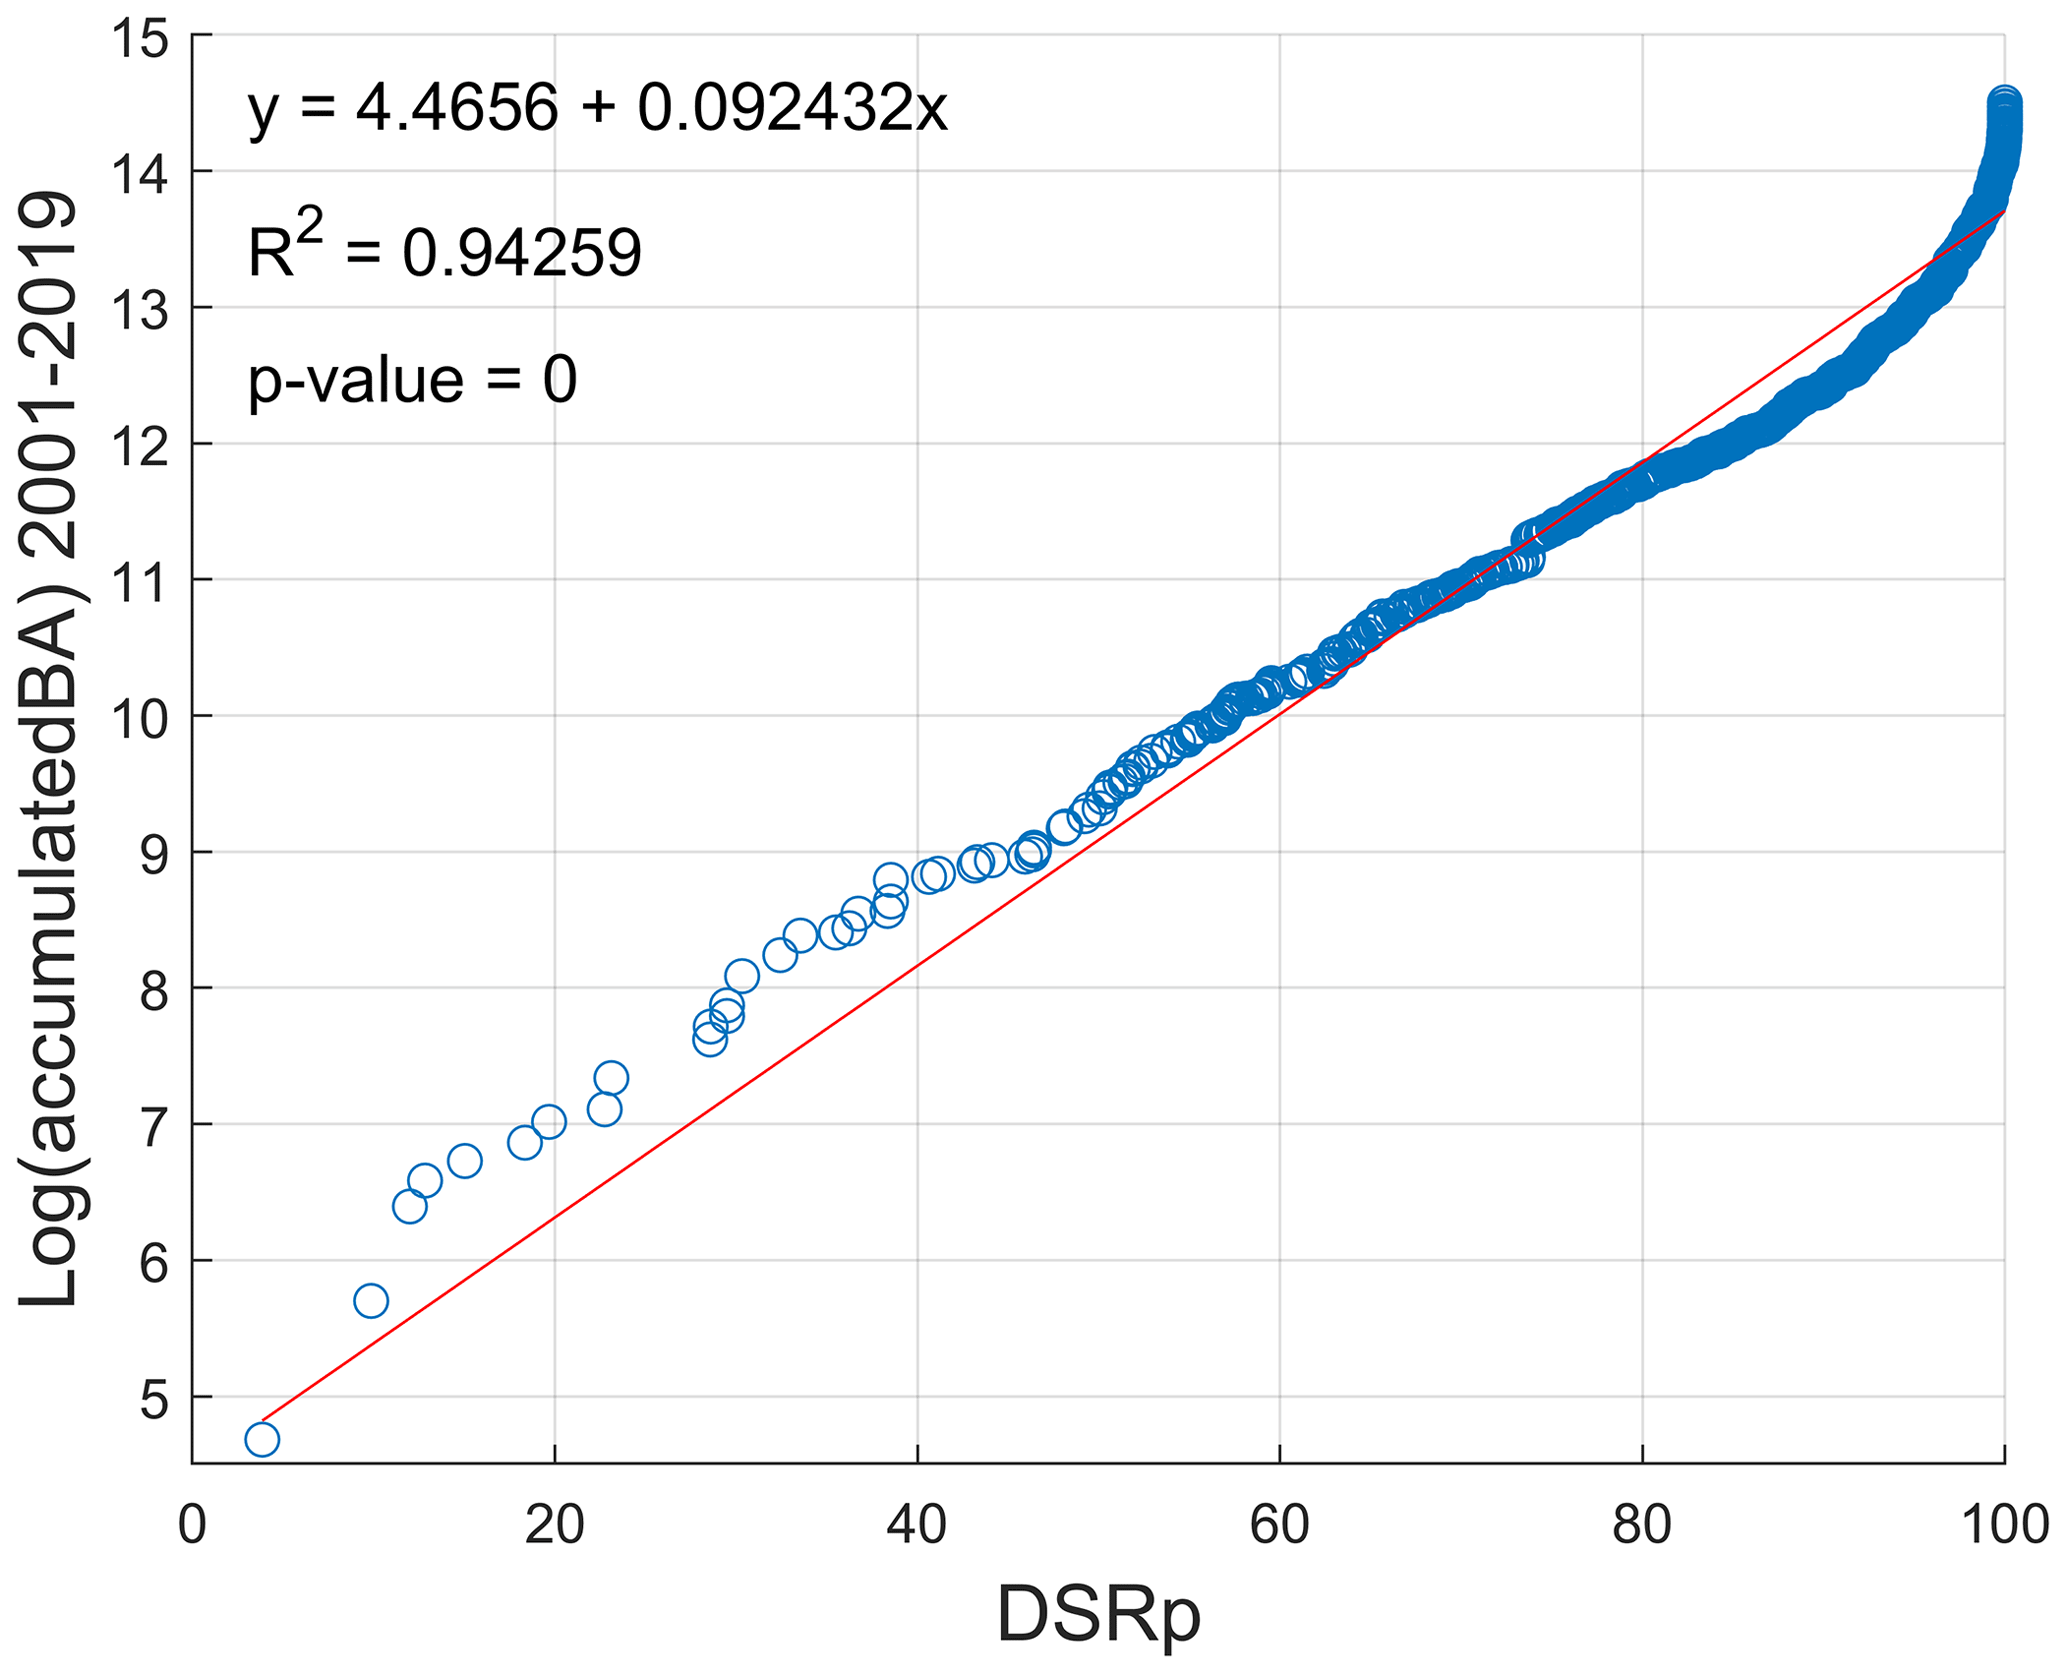
Figure 3Scatterplot of the decimal logarithm of the accumulated burnt area (Log(accumulatedBA)) vs DSR percentile (DSRp), considering the fires with an area larger than 100 ha that occurred between 15 May and 31 October during the period 2001–2019. The blue circles represent each wildfire, with respective accumulated BA, after being sorted by the assigned DSRp. Best fit (red line), respective equation, R2 and p value are also presented.
The analysis of the dependence of FTBA with DSRp in the entire mainland Portugal territory (Fig. 4) revealed that most of the TBA occurred with very high DSRp values. For example for days with DSR > 50th DSRp (DSR50p) the FTBA is almost 100 %, meaning that fires on days with lower DSR have a negligible impact on TBA (please see Sect. 2.5). Fires on days with DSRp between 85 and 95 were responsible for more than 80 % of TBA in the period 2001–2019, making this a good DSRp threshold for extreme days. This result justifies using the DSR90p at the national scale, which is widely used for a threshold of extreme values (Bedia et al., 2012; Carvalho et al., 2008; Fernandes, 2019; Silva et al., 2019).
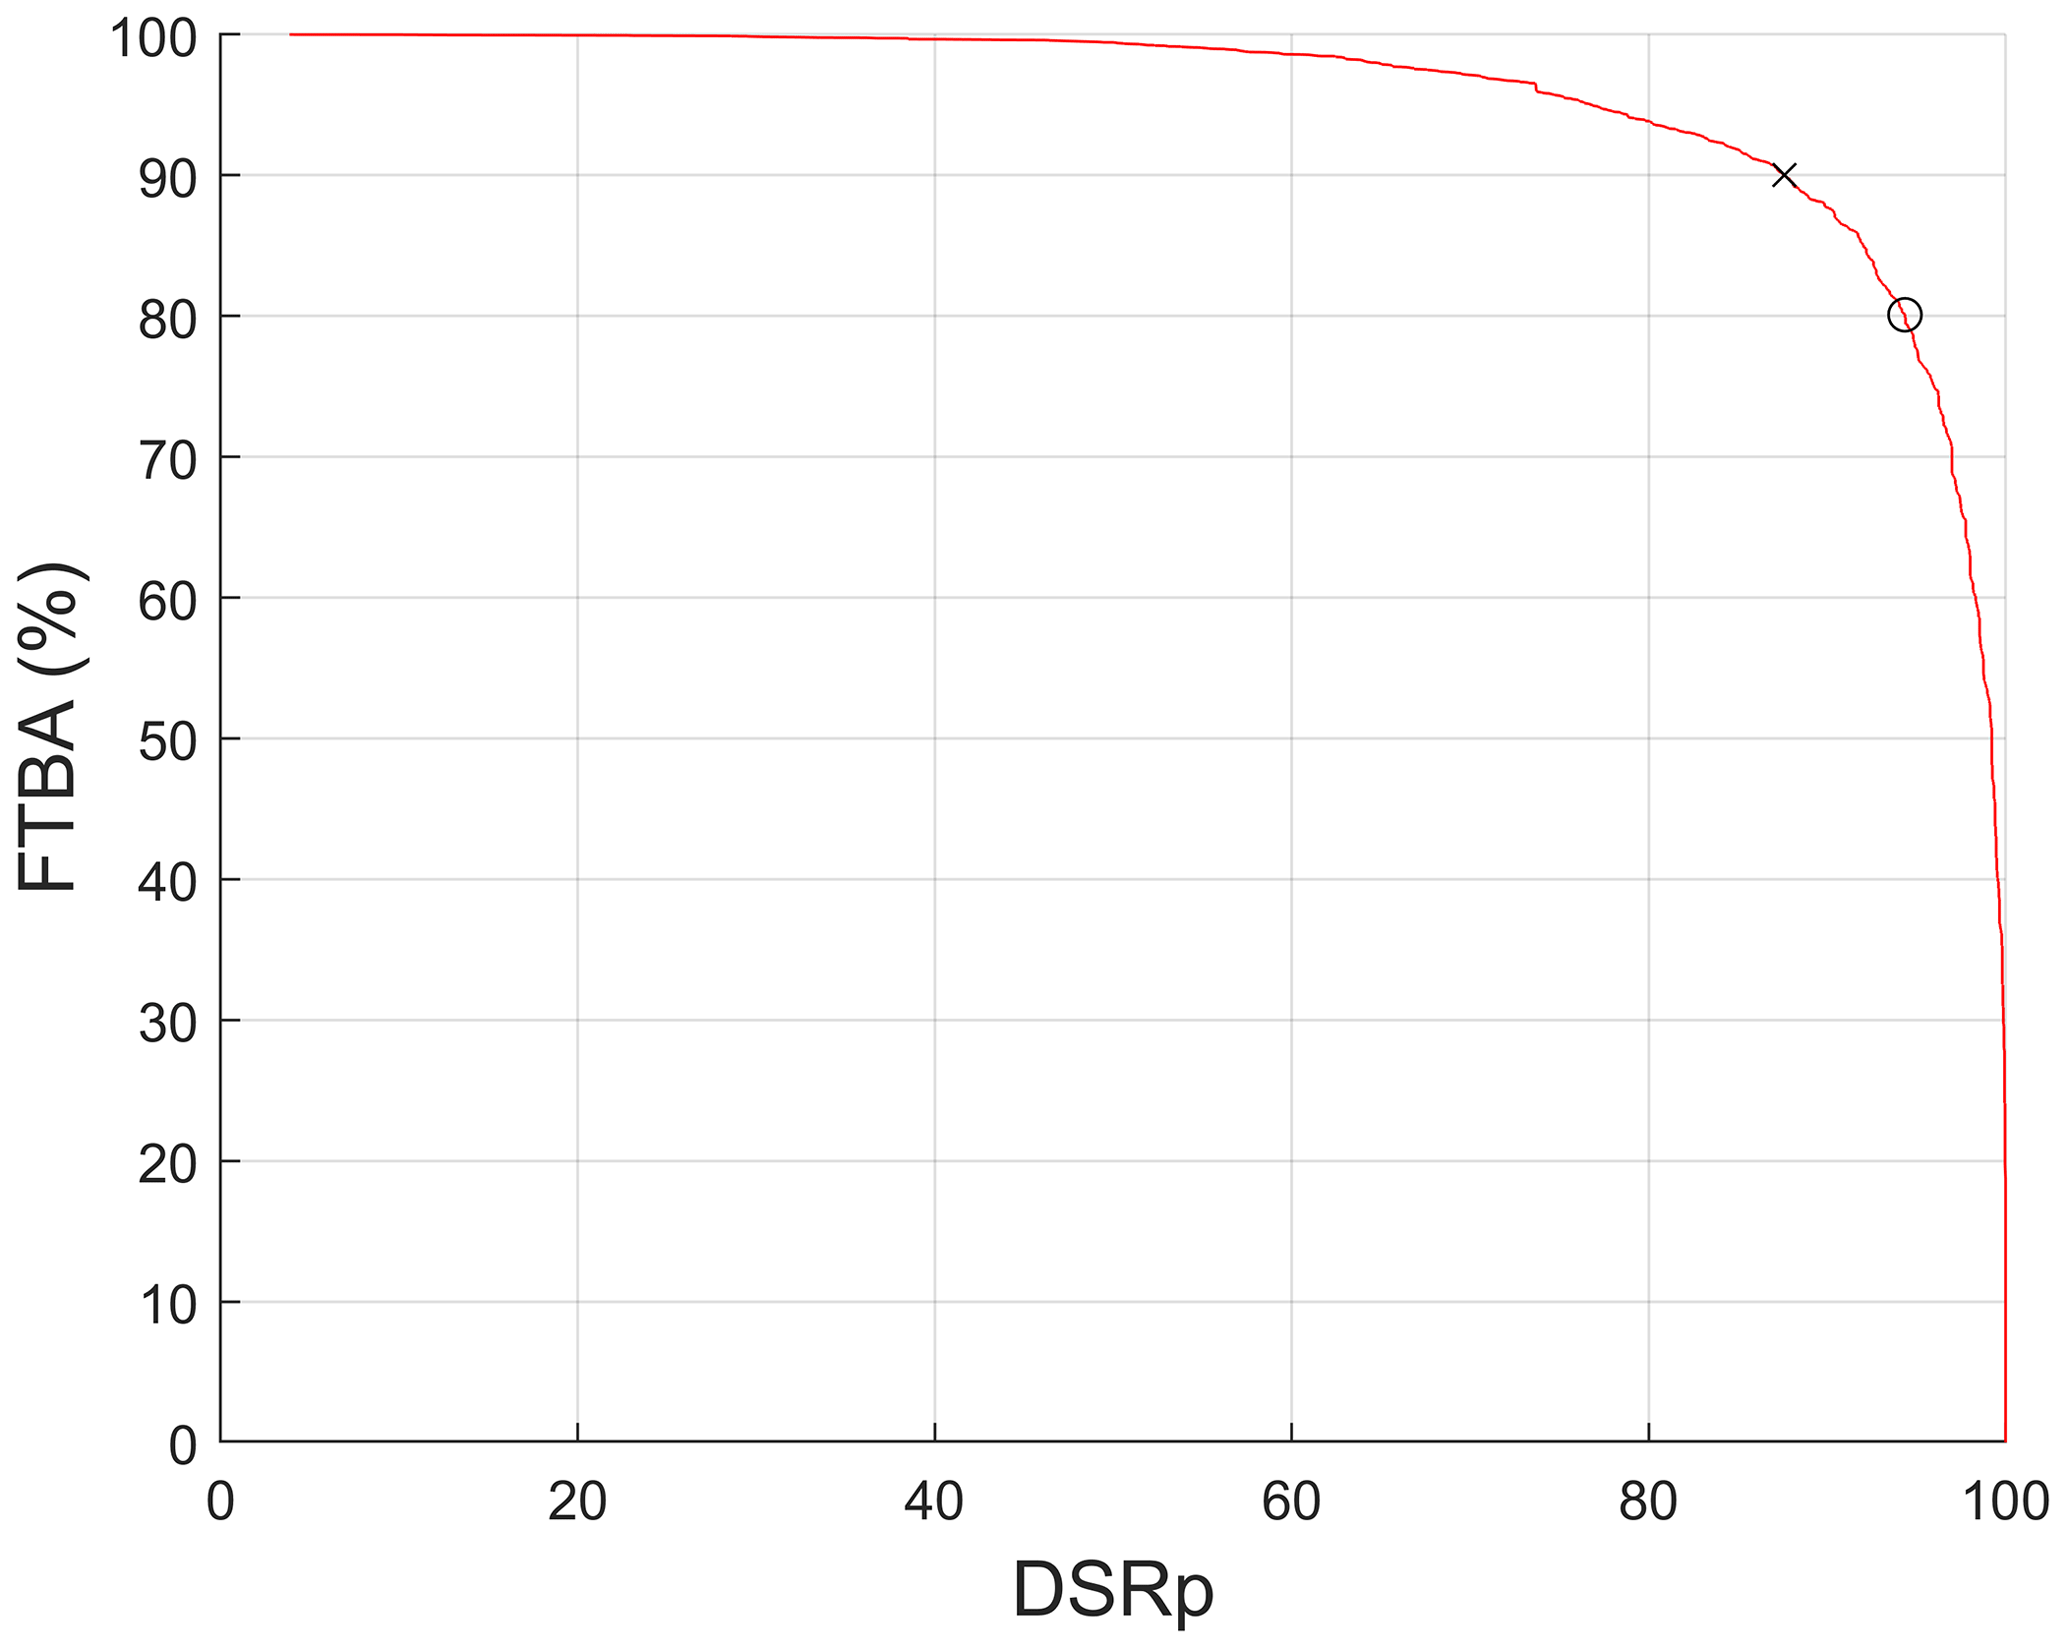
Figure 4Fraction of total burnt area (FTBA) vs DSR percentile (DSRp), computed for mainland Portugal during the period 2001–2019. The circle (cross) is the DSRp when the FTBA reaches 80 % (90 %).
However, if the analysis is performed at a higher spatial resolution, namely at the municipality level, some differences become apparent (Fig. 5). The spatial distribution of DSRp for FTBA = 80 % (DSRp80TBA) or FTBA = 90 % (DSRp90TBA) in each municipality presents important differences between regions, together with more visible contrasts in DSRp90TBA than in DSRp80TBA. The much lower values of DSRp in the north-eastern (Alto Tâmega, Terras de Trás-os-Montes, Douro and northern Beiras e Serra da Estrela) and in the southern interior regions (Alentejo Central and Baixo Alentejo) should be highlighted. DSRp90TBA is higher in most of the coastal and some central hinterland municipalities (portions of Área Metropolitana do Porto, Viseu Dão-Lafões, Região de Coimbra, Beira Baixa and Região de Leiria), reaching values similar to the mean country-level value (85 < DSRp90TBA < 95). In some municipalities of the northern and central hinterland, DSRp90TBA is between 60 and 70, particularly in Douro and Terras de Trás-os-Montes. It is important to underline that DSRp80TBA > DSRp90TBA, which is a consequence of the methodology adopted to perform this analysis (please see Sect. 2.5). This also helps understand why DSRp = 50 is associated with FTBA = 100 % (Fig. 4). The spatial distribution of DSRp80TBA and DSRp90TBA suggests the existence of clustering.
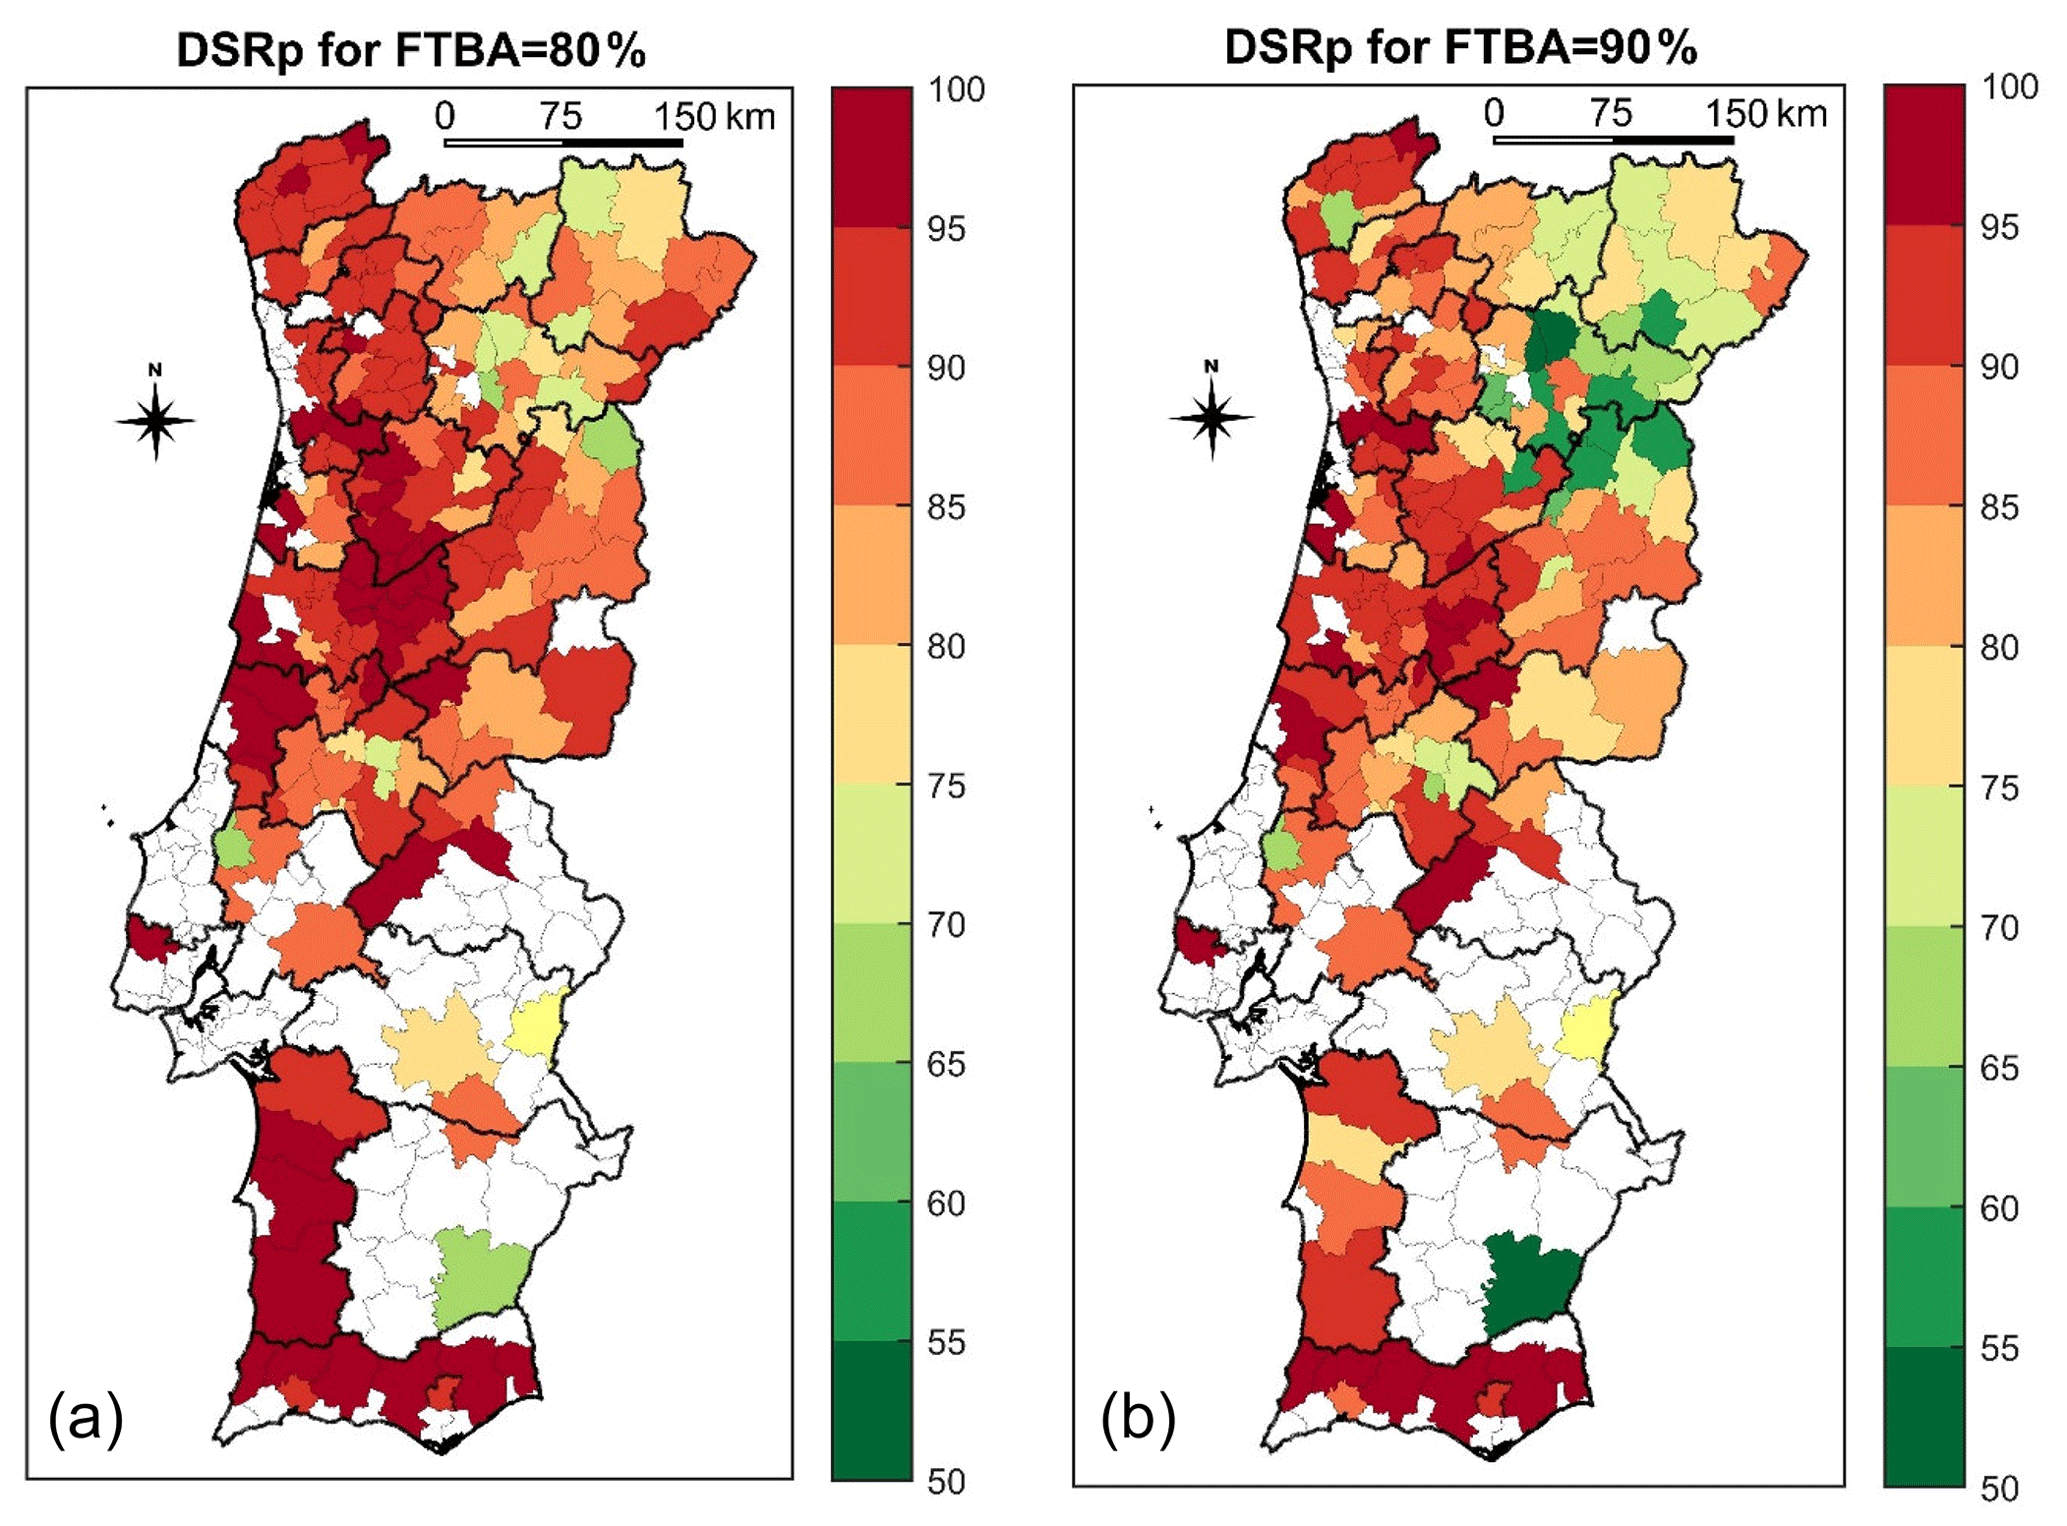
Figure 5DSR percentile (DSRp) for 80 % (a) and 90 % (b) of the fraction of total burnt area (FTBA) in each municipality.
3.2 Burnt area clusters
The spatial distribution of DSRp80TBA and DSRp90TBA suggests the existence of clustering, which should also help explain the similarities or differences in feature between municipalities. Therefore, the municipalities were grouped into 10 clusters based on the relationship between TBA and DSRp. Results disclose that cluster 10 is composed of just one municipality and, consequently, was excluded from the dendrogram (Fig. 6) and further analysis.
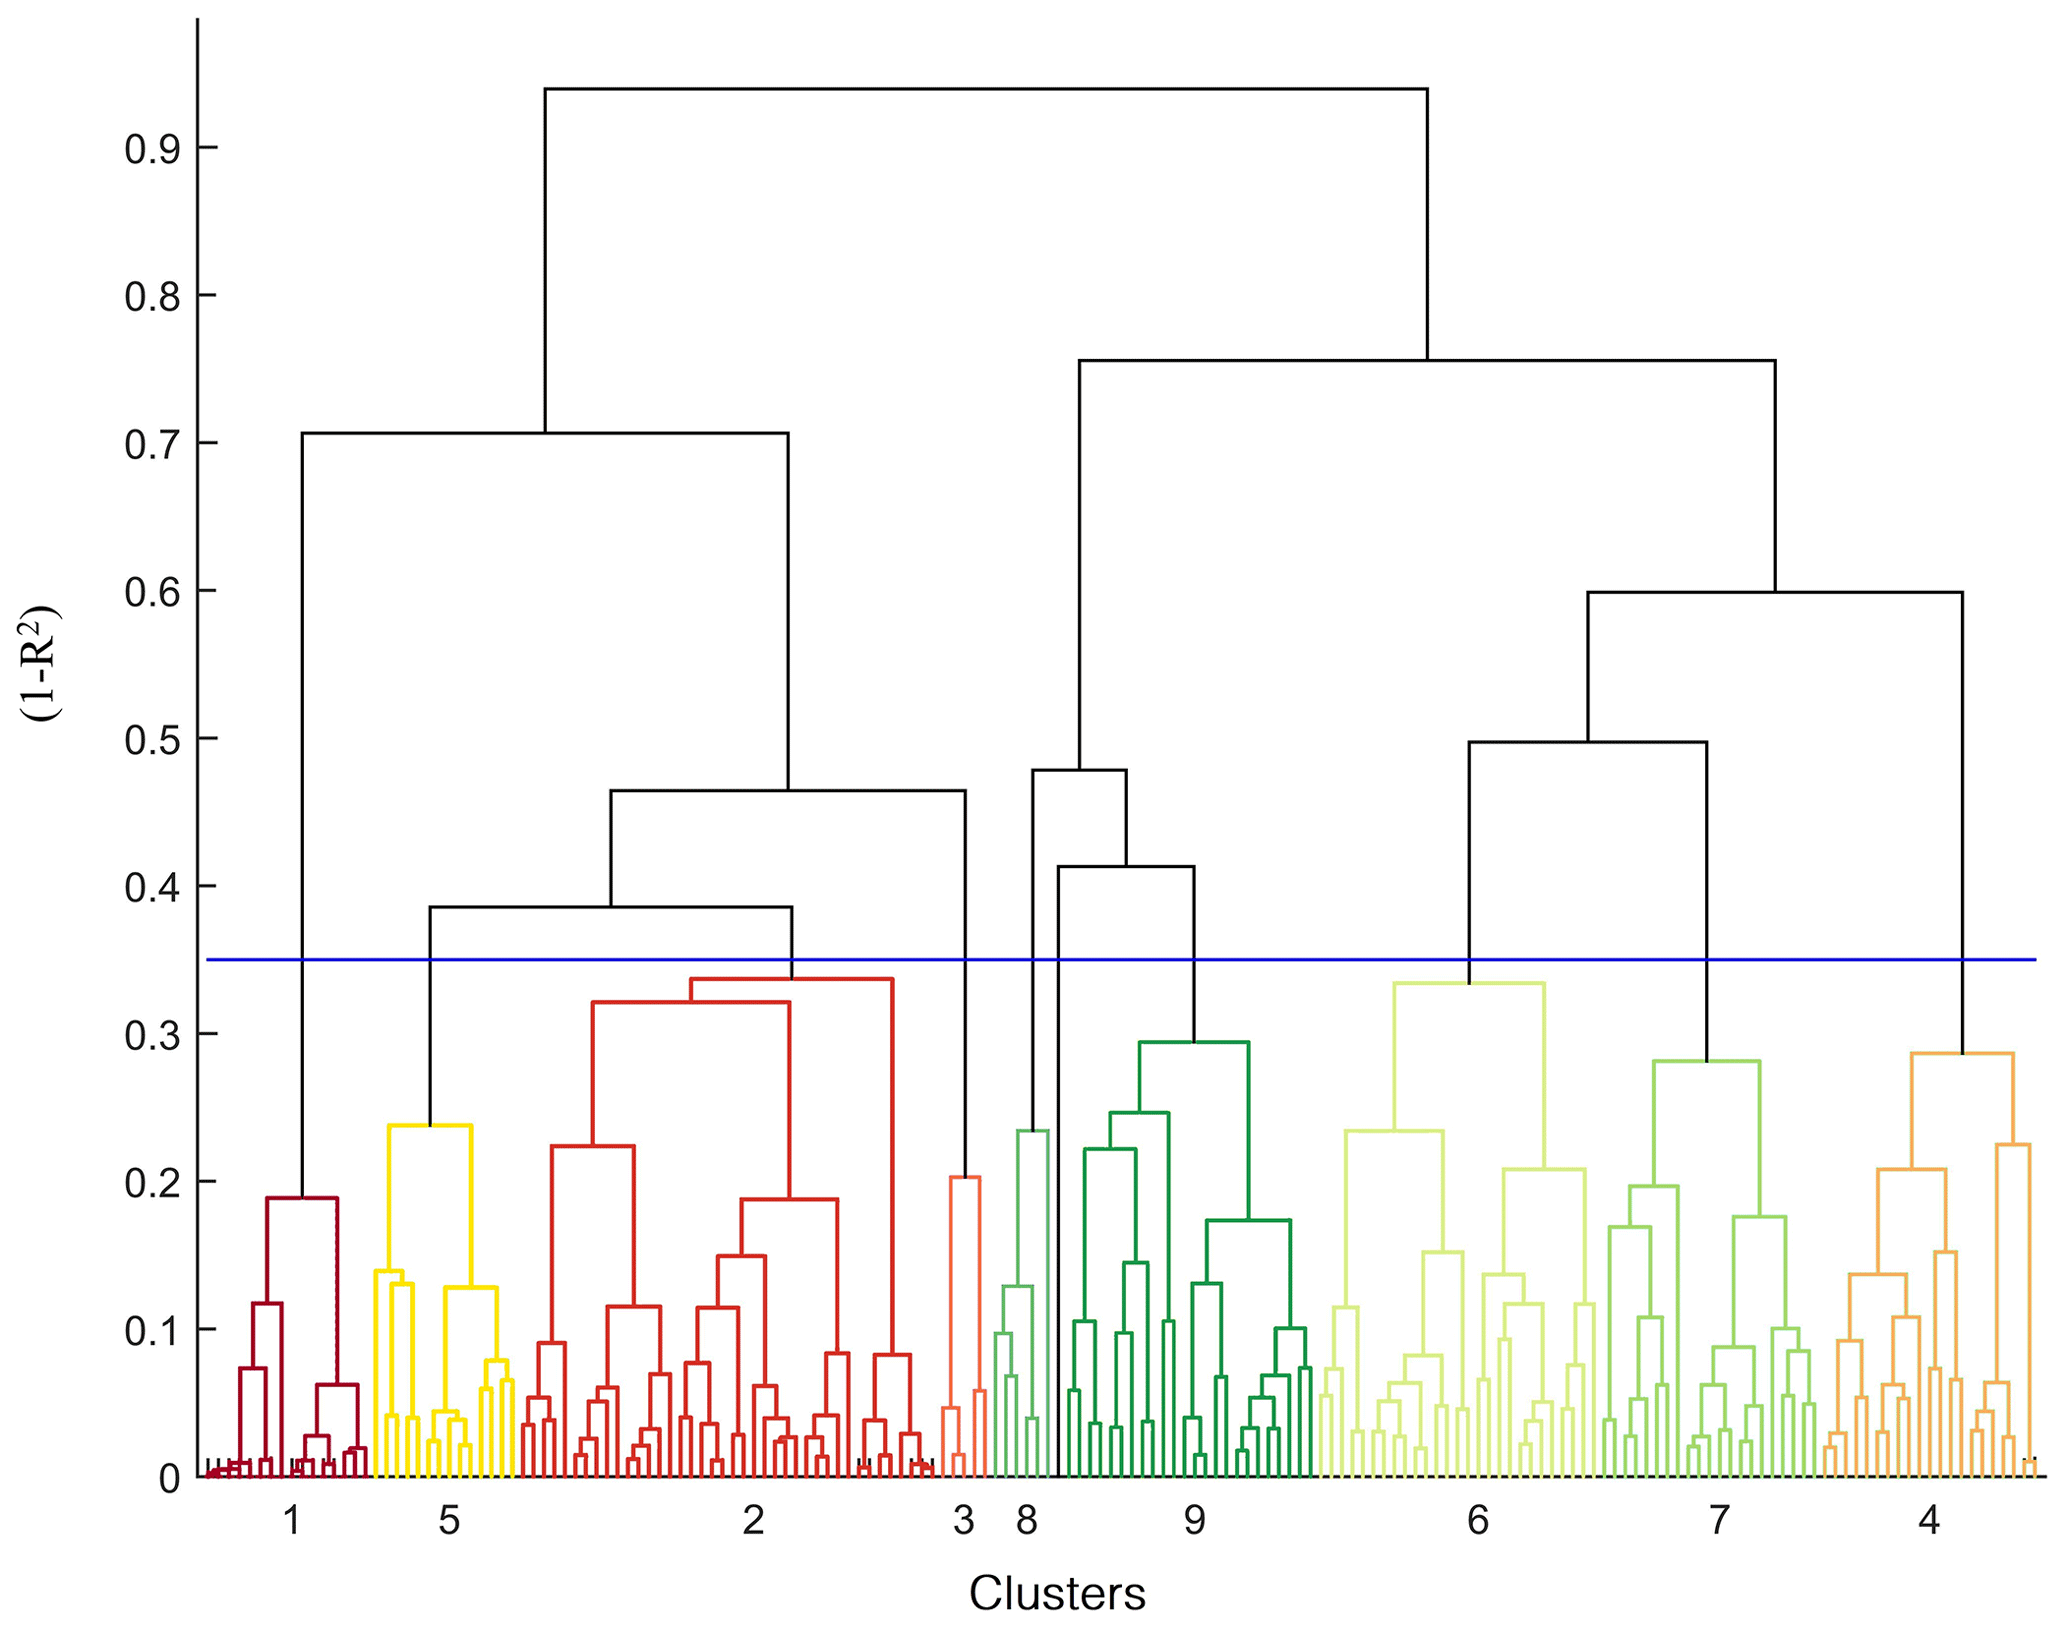
Figure 6Dendrogram results: cluster colours are the same as in Fig. 7, for better identification. The numbers on the x axis are the cluster numbers. The y axis is (1−R2), where r is the correlation coefficient between FTBA and DSRp. The blue line is the clustering threshold at 0.35. Each vertical line is a municipality.
The spatial pattern of Fig. 7 reveals a relatively homogeneous distribution of the municipalities of equivalent clusters and patches of municipalities belonging to consecutive clusters, meaning that municipalities with similar DSRp are often neighbours.
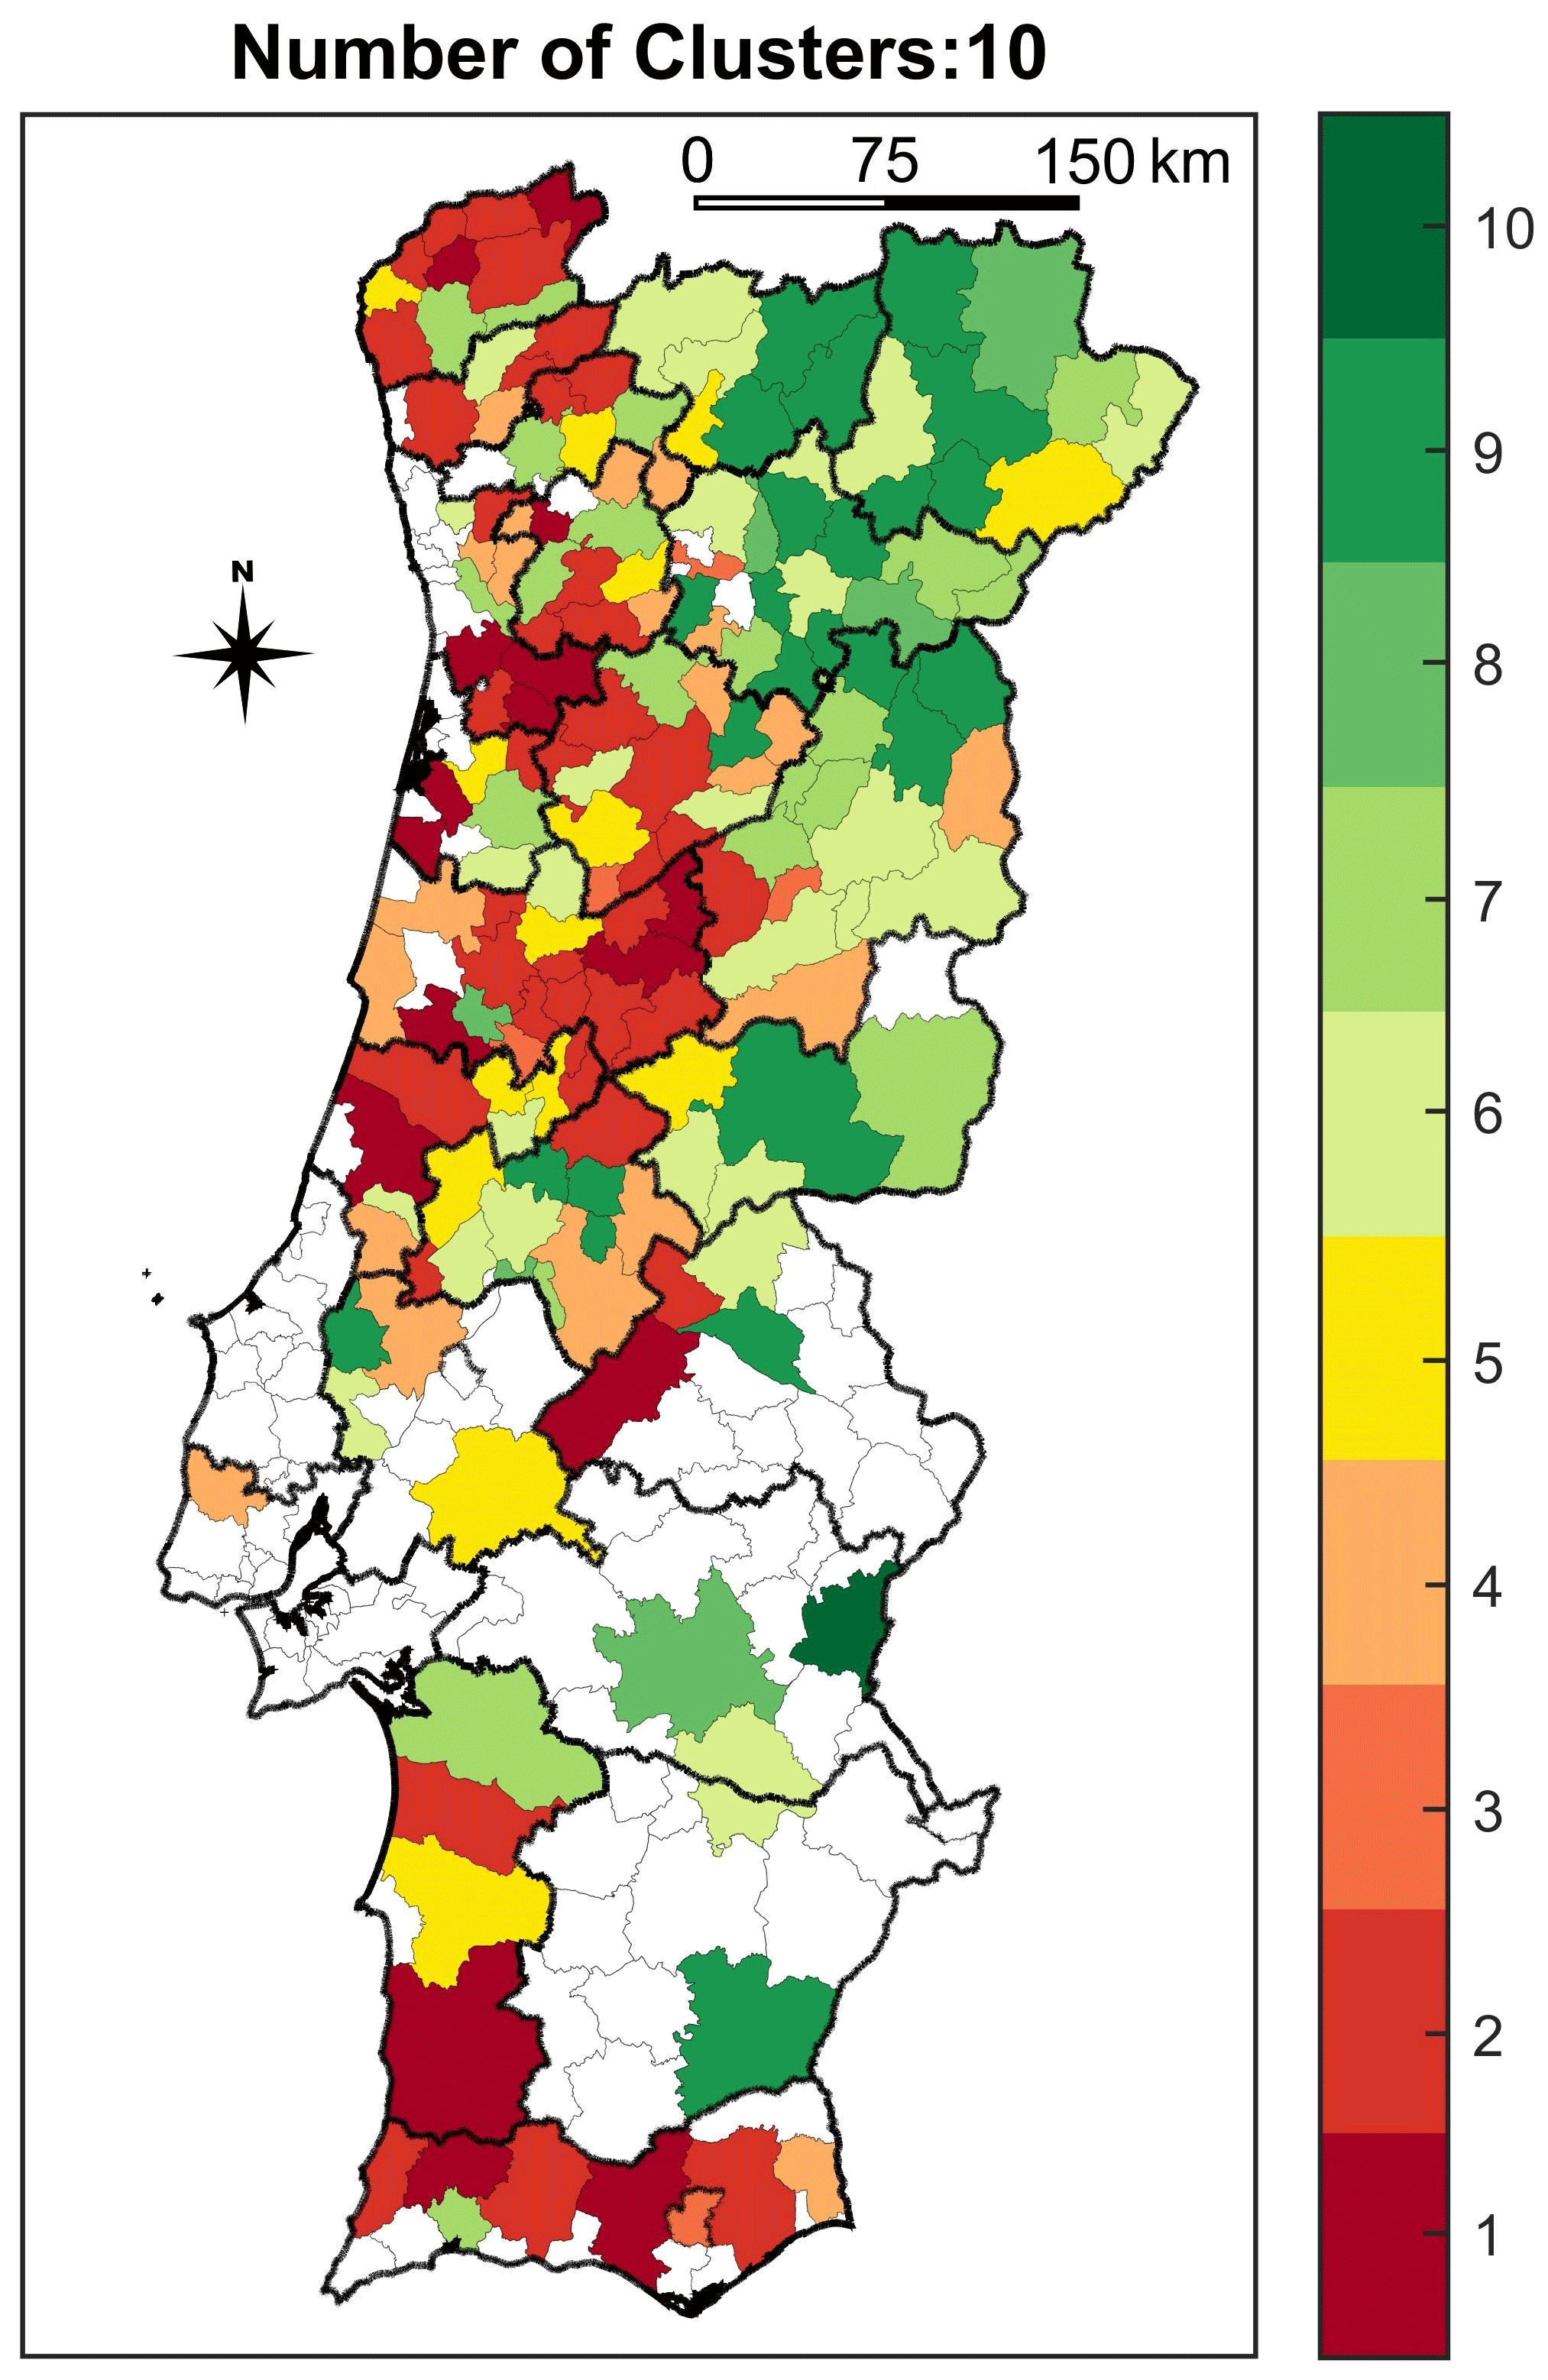
Figure 7Spatial distribution of clusters. Cluster colours are the same as in Fig. 6. Municipalities without colour were excluded from the cluster analysis, justifying only 5.2 % of TBA.
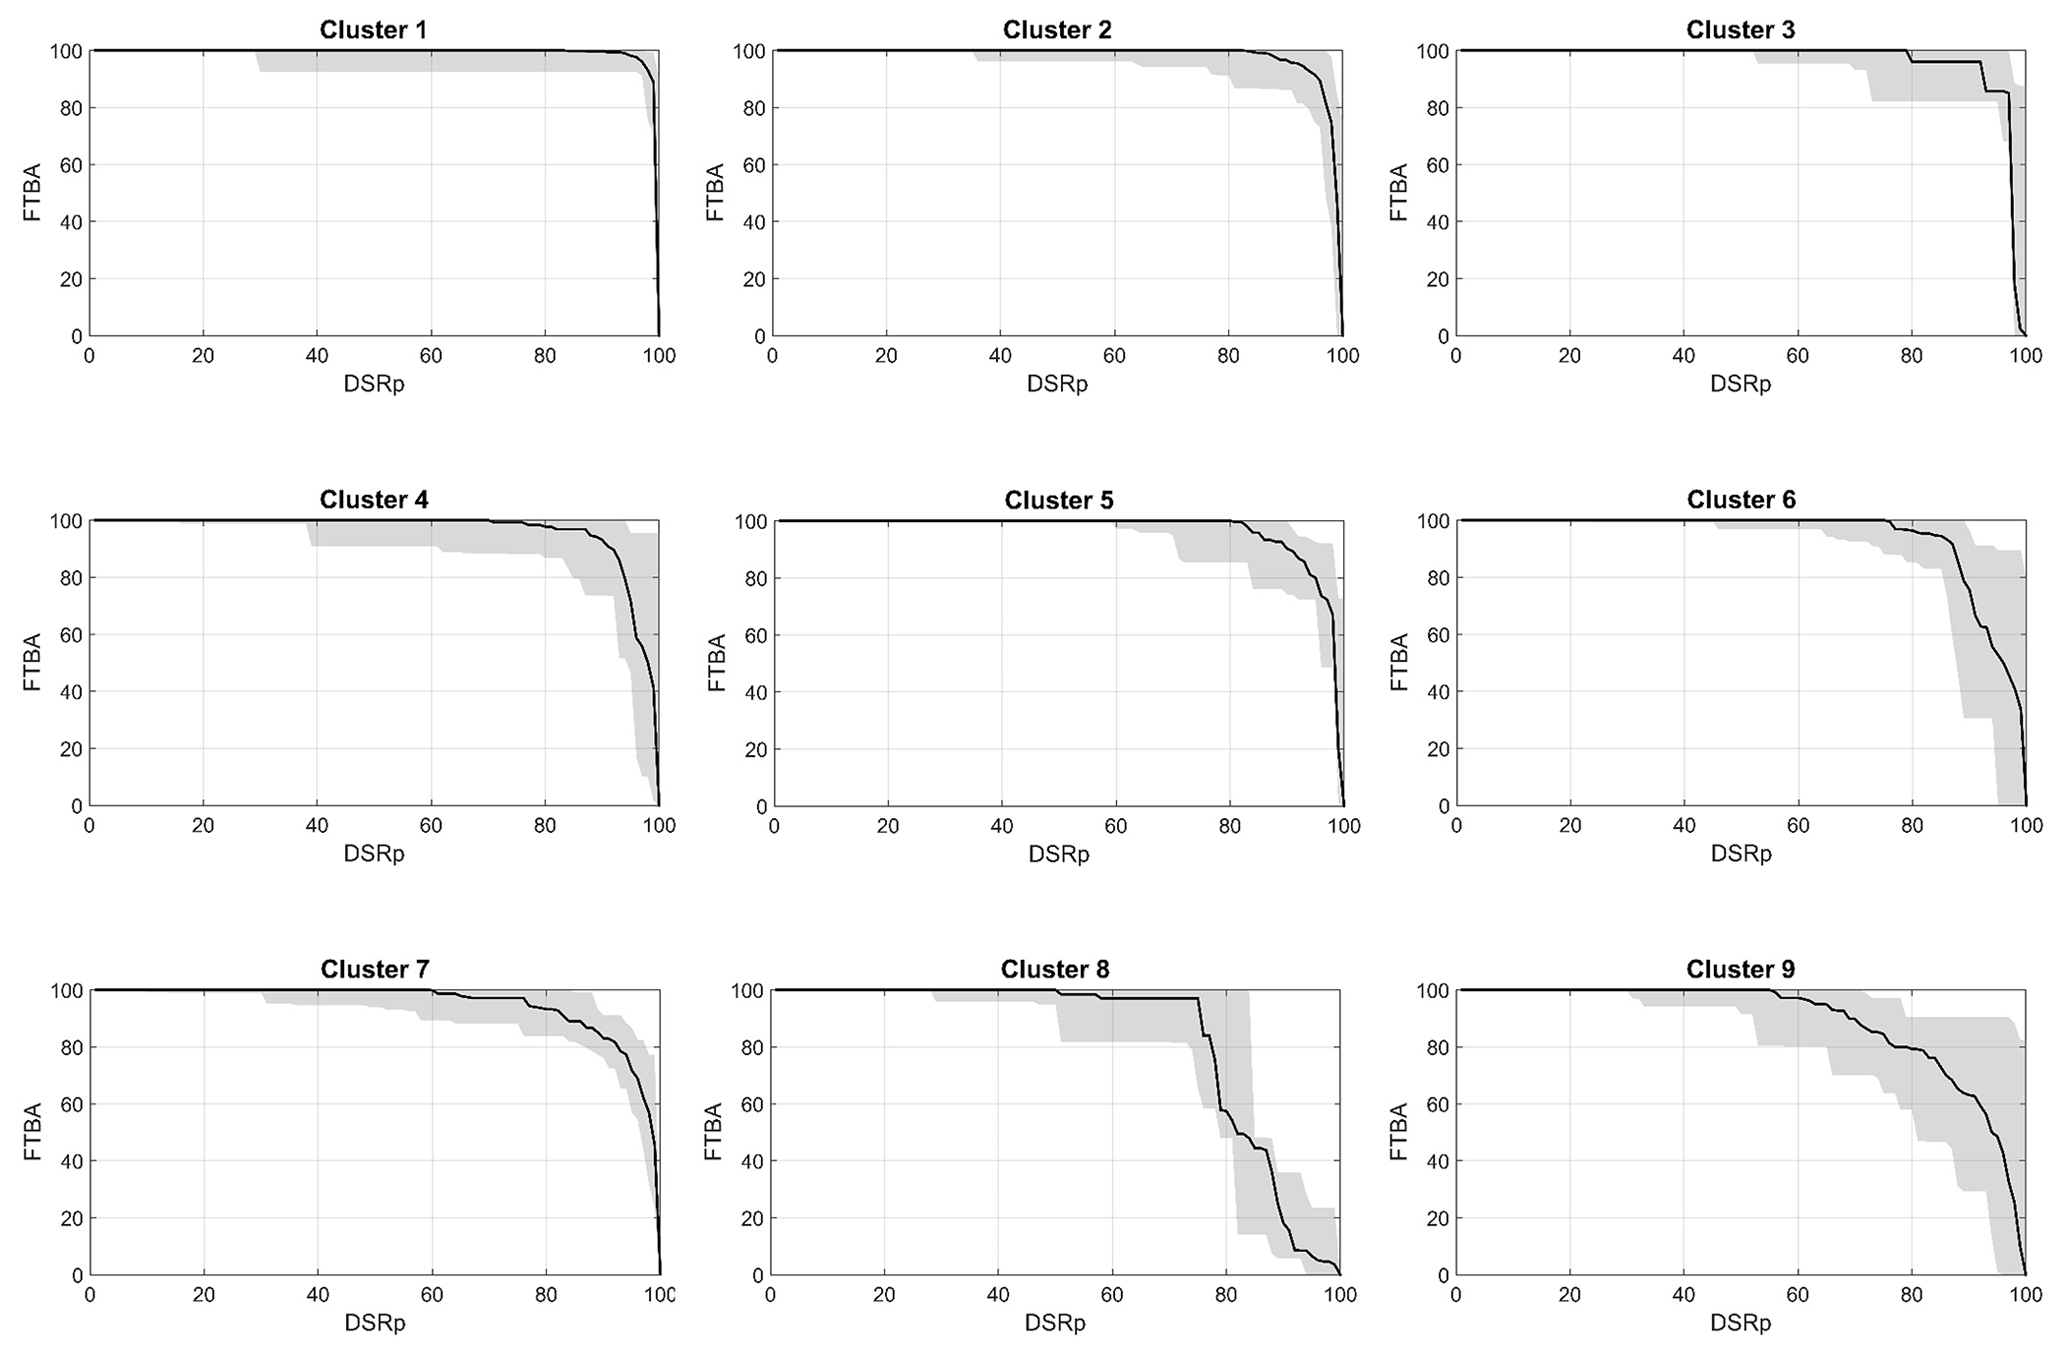
Figure 8Fraction of total burnt area (FTBA) vs DSR percentile (DSRp) for the municipalities of each of the nine clusters. The black line is the median of all curves in each cluster. The shaded area is defined by the maximum and minimum curves in each cluster.
The FTBA vs DSRp plots were produced for each cluster to illustrate and interpret the clustering results (Fig. 8). FTBA = 100 % occurs for DSR90p in cluster 1, confirming that large wildfires in these municipalities only occurred with very extreme meteorological conditions. The FTBA vs DSRp curves for the first three clusters present a very steep slope for the highest DSRp values, revealing that large wildfires take place in the municipalities of these clusters on days with high DSRp (above 90). Moreover, the FTBA vs DSRp plots for these clusters present very low dispersion suggesting that the curves for the municipalities of each of these clusters are very similar. These municipalities are located in the north and central western coastal areas, and also include mountain ranges (predominantly in Alto Minho, Cávado, Área Metropolitana do Porto, Tâmega e Sousa, Região de Aveiro, Região de Coimbra and Alentejo Litoral), within some central and south hinterland regions (parts of Viseu Dão-Lafões, Beiras e Serra da Estrela, Médio-Tejo and Alto Alentejo) and in the south coast (almost all of Algarve).
Clusters 4, 5 and 6 are prone to burning with less extreme conditions, where the median of DSR90p corresponds to 85 %–90 % of TBA. The slope of FTBA-vs-DSRp curves is less steep but the dispersion is higher than in the previous clusters, meaning that large wildfires can occur with lower values of DSRp. Both features suggest that in these clusters, wildfires tend to occur in a wider range of meteorological conditions. These clusters are spread throughout the country and can be viewed as a transition between the group of clusters with extreme (1, 2 and 3) and less extreme (7, 8 and 9) DSRp80TBA or DSRp90TBA.
Clusters 7, 8 and 9 can be considered as the group of lower DSRp clusters, due to the relatively lower values of the DSRp80TBA or DSRp90TBA, which range from 70 % to 80 %. Higher dispersion is also apparent, especially in cluster 9, which integrates municipalities where large wildfires can occur with lower values of DSRp (in some cases, below DSR50p). In this group of clusters, the slope of the FTBA-vs-DSRp curves, at higher values of DSRp, is the lowest, especially in clusters 8 and 9. Nevertheless, the median curve of cluster 8 has a different behaviour compared to the other two clusters: the steeper interval is between the 70th and 80th percentile, meaning that a larger BA occurs in less extreme conditions. The municipalities within these clusters are mostly located in the northern and central hinterland, particularly in Alto-Tâmega, Terras de Trás-os-Montes, Douro, Beiras e Serra da Estrela and Beira Baixa. Additionally, a few municipalities within these clusters belong to Alentejo Central and Baixo Alentejo, two provinces with a very low number of fires and BA.
Boxplots of the DSRp80TBA and DSRp90TBA for the municipalities of each cluster (Fig. 9) are consistent with the previous results. Dispersion is considerably much higher in the latter than in the former case, especially in clusters 3, 7 and 8. In some municipalities of clusters 7 and 8, large wildfires, with the ability to exceed FTBA = 10 % (Fig. 8), start to occur with relatively low values of DSRp. Another notable difference is the boxplot medians: for DSRp90TBA they decrease with the ascending number of clusters as expected, but not for DSRp80TBA, where they increase between clusters 4 and 5, between 6 and 7, and between 8 and 9.
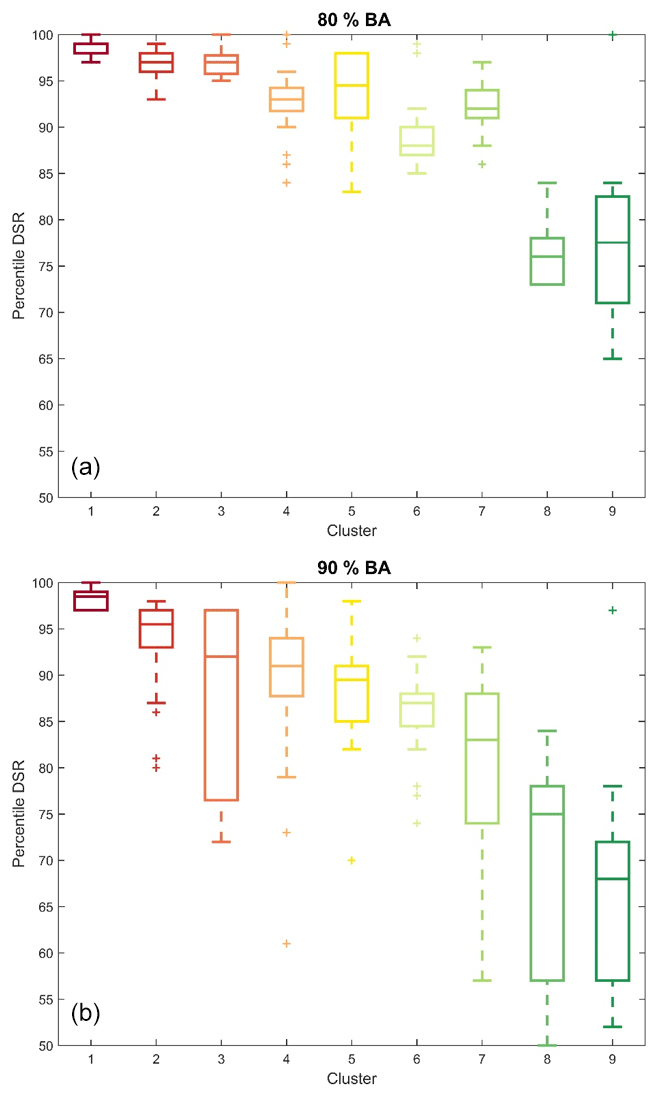
Figure 9Boxplots of DSRp80TBA (a) and DSRp90TBA (b), i.e. the DSRp associated with 80 % and 90 % of TBA, respectively, for the nine clusters. The central line is the median; the edges of the box are the 25th and 75th percentiles; and, the plus signs represent outliers, defined as a value that is more than 3 scaled median absolute deviations away from the median.
3.3 Influence of vegetation on the fire–weather relationship
Therefore, we explored other features of the fire regime in mainland Portugal, namely BA metrics (Table 2), linked to vegetation, which could explain the similarities and differences observed in their patterns at the municipality level. The BNA and the BNAF BNAS and TBAF TBAS ratios in each municipality were assessed and analysed (Fig. 10). Additionally, the number of wildfires in each municipality was also evaluated (see Appendix).

Figure 10(a) Burnable area (BNA) in percentage; (b) forest shrubland burnable area (BNAF BNAS) and (c) forest shrubland total burnt area (TBAF TBAS); all during the period 2001–2019 for the selected municipalities.
The BNA (Fig. 10a) is much lower in coastal municipalities (except in Algarve) and in most of the northern and central hinterland, particularly in Terras de Trás-os-Montes, Douro and portions of Beiras e Serra da Estrela. These relatively low values are explained by the high population density and urban areas near the coastline or by agricultural patches in the countryside. On the other hand, a higher BNA is found in the mountain ranges, especially in the northwest (some municipalities located in Alto Minho, Cávado and Alto Tâmega) as well as in some specific highly forested regions in the central hinterland (within Área Metropolitana do Porto, Viseu Dão-Lafões, Região de Coimbra, Região de Leiria, Médio Tejo and Beira Baixa) and one municipality in Algarve. These patterns are justified by low population density, low availability of land suitable for agriculture, and, in some regions, extensive forest plantations.
The BNAF BNAS (Fig. 10b) shows that forest cover is prevalent in most of the municipalities analysed, especially near the west coast. Conversely, shrublands BNA is only dominant in a few municipalities located in the northern hinterland, particularly in Alto Minho, Alto Tâmega, Douro and Beiras e Serra da Estrela. However, the spatial distribution of the TBAF TBAS (Fig. 10c) presents some considerable differences, namely an extensive number of municipalities in the north, coastal area and inland that have larger TBA in shrublands, i.e. a large number of municipalities located in Alto Tâmega, Tâmega e Sousa, Douro, Viseu Dão-Lafões and Beiras e Serra da Estrela). Nevertheless, the municipalities with higher BNAF BNAS correspond to those with larger TBAF TBAS. Results of both maps are similar when analysing the southern provinces of the country (Alto Alentejo, Alentejo Central, Alentejo Litoral, Baixo Alentejo and Algarve), where almost all municipalities are characterized by higher forest BNA and TBA.
The spatial distribution of the clusters resembles the general pattern of LULC in Portugal (Fig. 11, bottom panel). In general, municipalities with high DSRp90TBA are located in regions of forests while municipalities with lower DSRp90TBA are located in regions where shrublands tend to be predominant. The analysis of BA in LULC type, made for each cluster, indicates that BA in forests (BAF) is notably higher than in shrublands (BAS), for the first five clusters than for the last four clusters (Fig. 11, top panel). This means that BAF is higher for clusters with higher DSRp90TBA while BAS is higher for clusters with lower DSRp90TBA. In addition, there is an increase in the fraction of BA in agricultural land associated with the decrease of DSRp90TBA. This amount is higher and about 10 %–20 % in clusters 6–9, but lower in clusters 1–5.
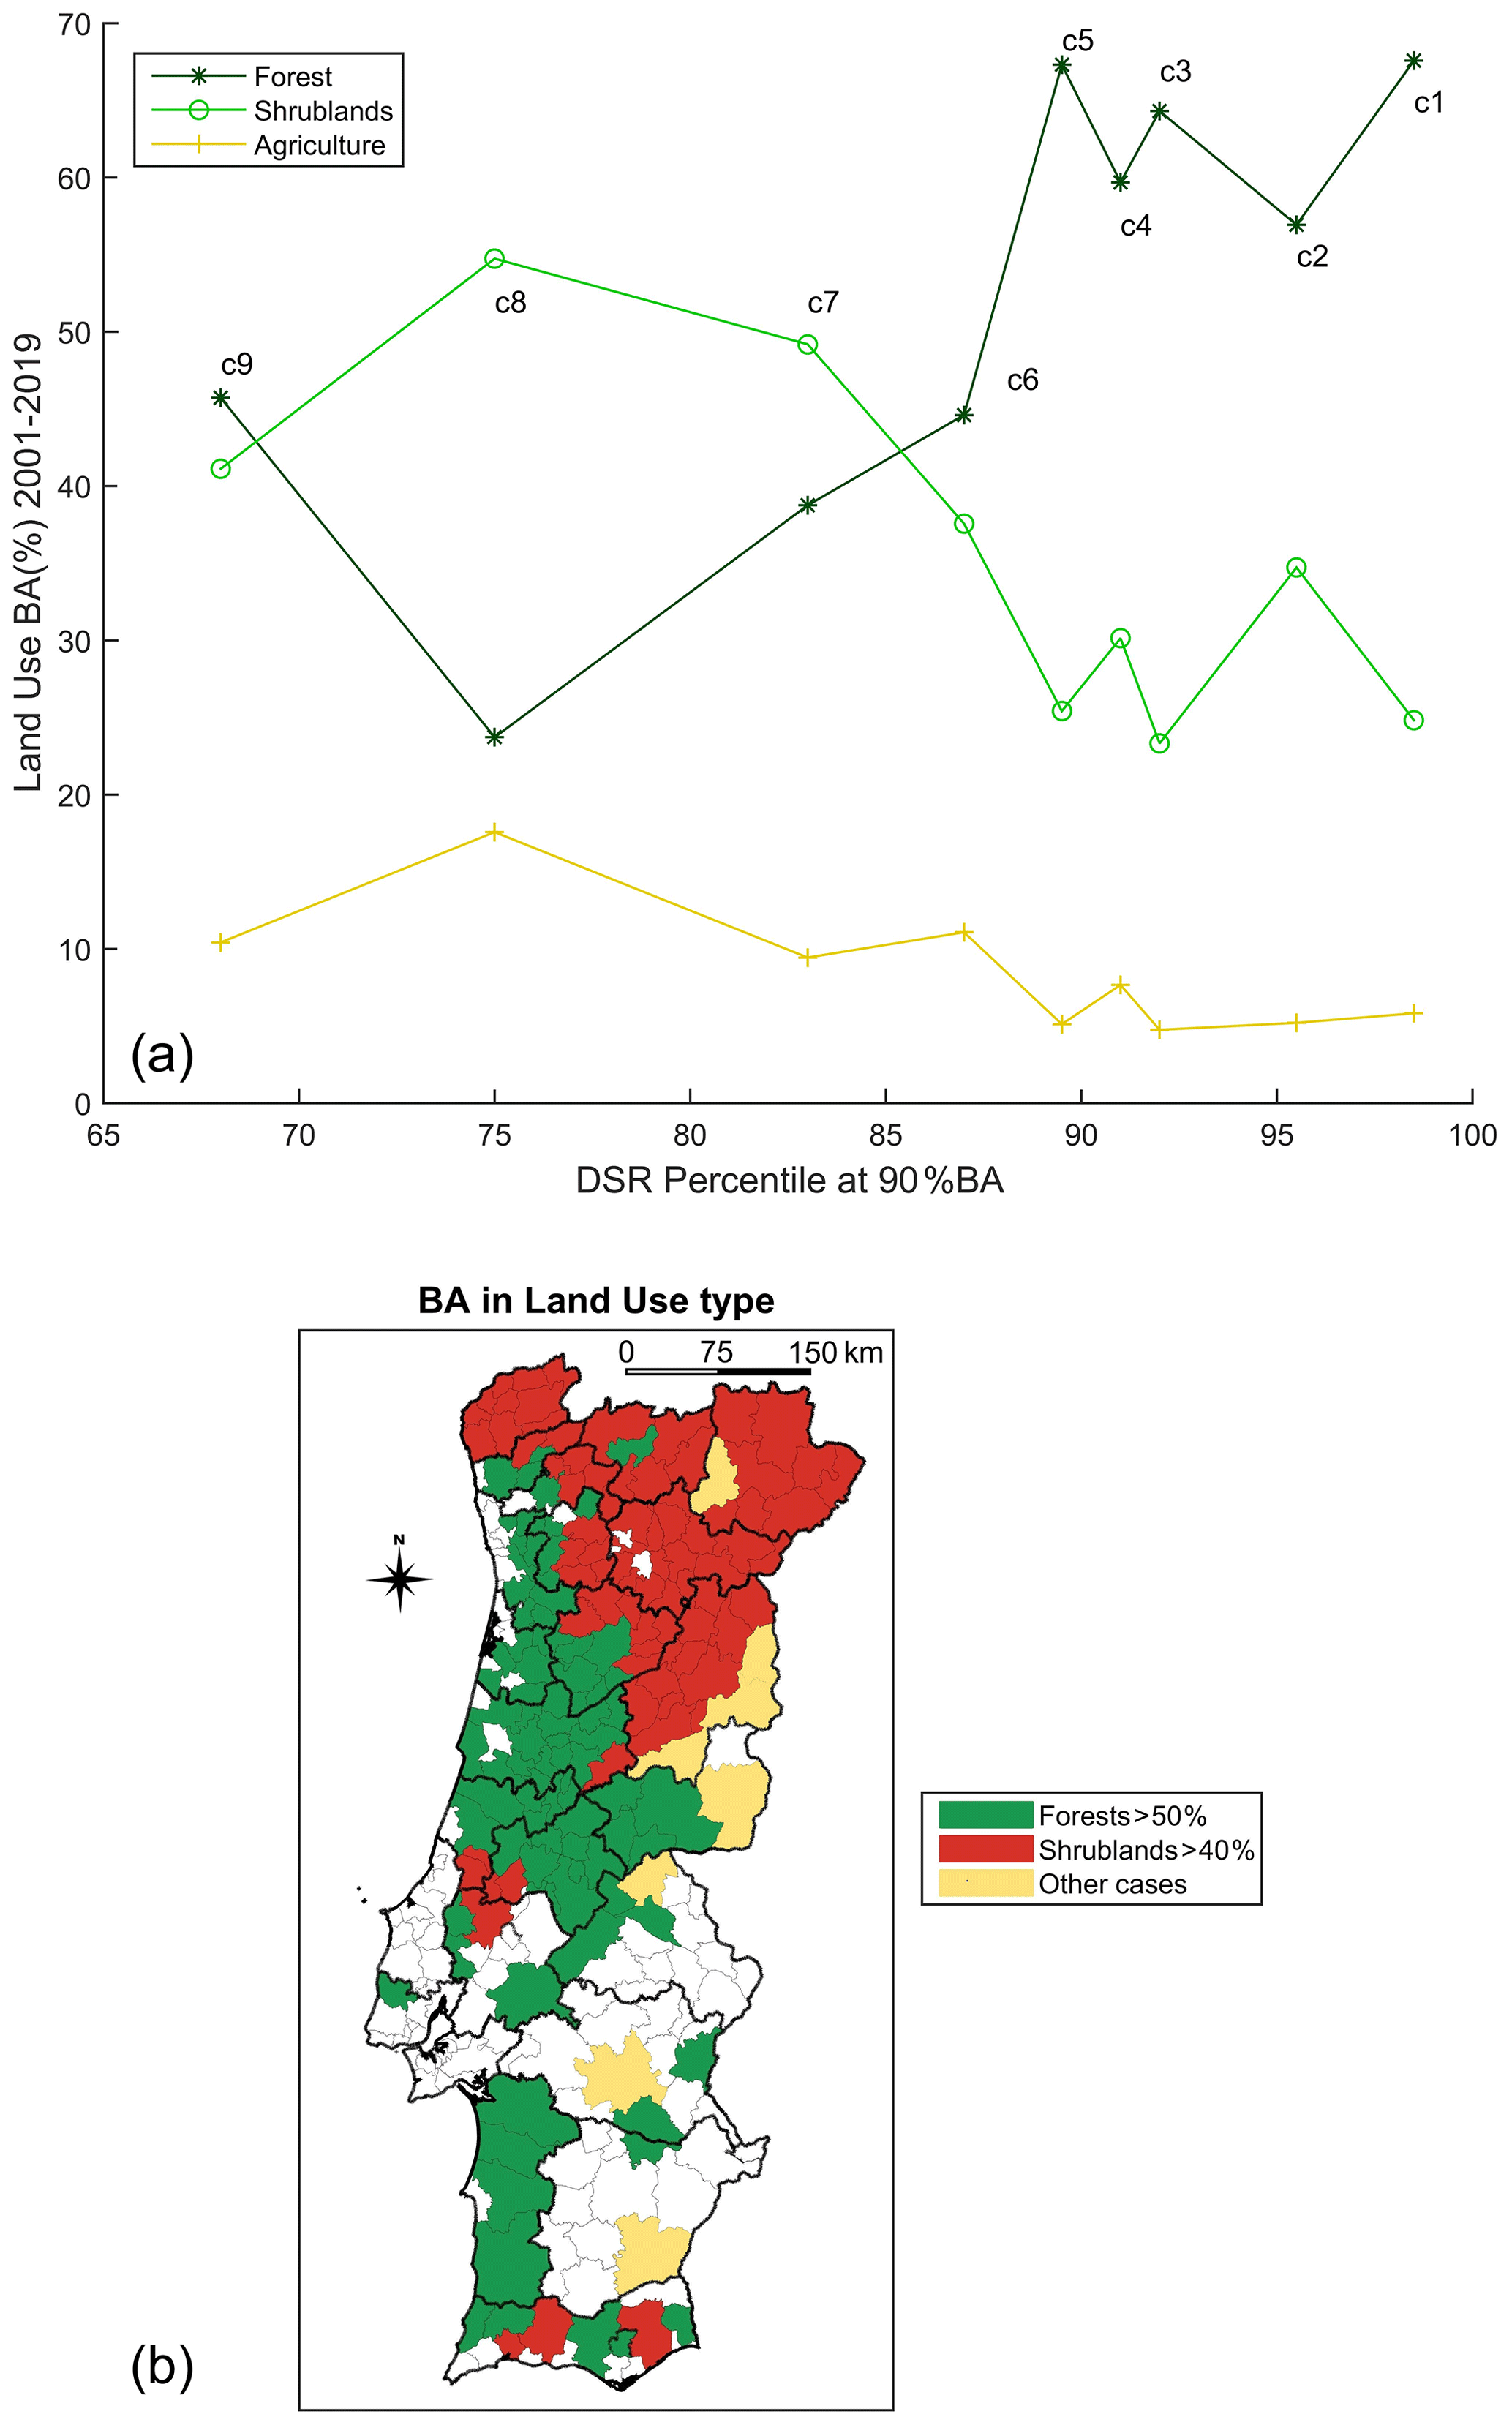
Figure 11(a) Burnt area (BA) in three land use types: forest, shrublands and agriculture; represented for each cluster, identified by the respective DSRp and also by the letter c. (b) Municipalities with burnt area in forest > 50 %, shrublands > 40 % or other cases. Municipalities without colour were excluded from the cluster analysis.
Results show marked pieces of evidence between most coastal and northern/north-eastern hinterland municipalities, which present similar DSRp90TBA and, therefore, similar cluster distribution. Highest BAF characterizes the majority of the municipalities with the highest DSRp observed at 90 % of TBA (generally above 85) while the territory with higher BAS is also characterized by lower DSRp90TBA (below 85). These clusters (7–9) also present relatively high percentages of BA in agriculture (mostly between 10 % and 20 %). It is also worth mentioning that some municipalities present similar BAF and BAS, despite being located in the coastal regions, usually characterized by higher forest cover.
The land cover also helps to understand the DSRp80TBA and DSRp90TBA boxplots for each cluster, especially the higher dispersion in the latter in comparison with the former (Fig. 10). These dissimilarities are especially evident in cluster 8, which is the cluster with the highest BAS and BAA (twice the value of clusters 1–5) and less BAF (half the value of clusters 1–5). Additionally, cluster 8 is the one with less BNA (not shown).
The combination of these factors could explain the high dispersion: high BAS can occur with low DSRp, high BAA is much more likely to occur with high DSRp; and, finally, low BNA prevents very large wildfires from occurring, even with extreme DSRp.
A contingency table enables an objective and quantitative assessment of the influence of vegetation cover on the spatial distribution of the clusters and, therefore, also on DSRp90TBA. Table 3 is based on the results illustrated in Fig. 11 and aims to assess whether the differences in groups of clusters or DSRp90TBA can be explained by the BA prevailing in forested areas or shrubland+agricultural zones. Specifically, it intends to assess whether municipalities of clusters 1–5, with DSRp90TBA > 90, have higher BAF (BAF > 50 %), and, on the contrary, clusters 7–9, with DSRp90TBA < 90, present higher BAS+BAA (BAS + BAA > 50 %).
Table 3Contingency tables and accuracy metrics to assess the role of vegetation burnt area (BA) assessed with DSRp90BA thresholds, for the municipalities used in cluster analysis. The contingency tables computed the number of municipalities (NM) for the following criteria: CLUST 1–5 (CLUST 7–9) and BAF > 50 % (BAS + BAA > 50 %). Overall accuracy (OA), user's accuracy (UA) and producer's accuracy (PA) were the calculated accuracy metrics, together with the statistical tests chi-squared (χ2) test (with p value), phi coefficient (Φ), contingency coefficient (C) and the Cohen's kappa coefficient (κ).
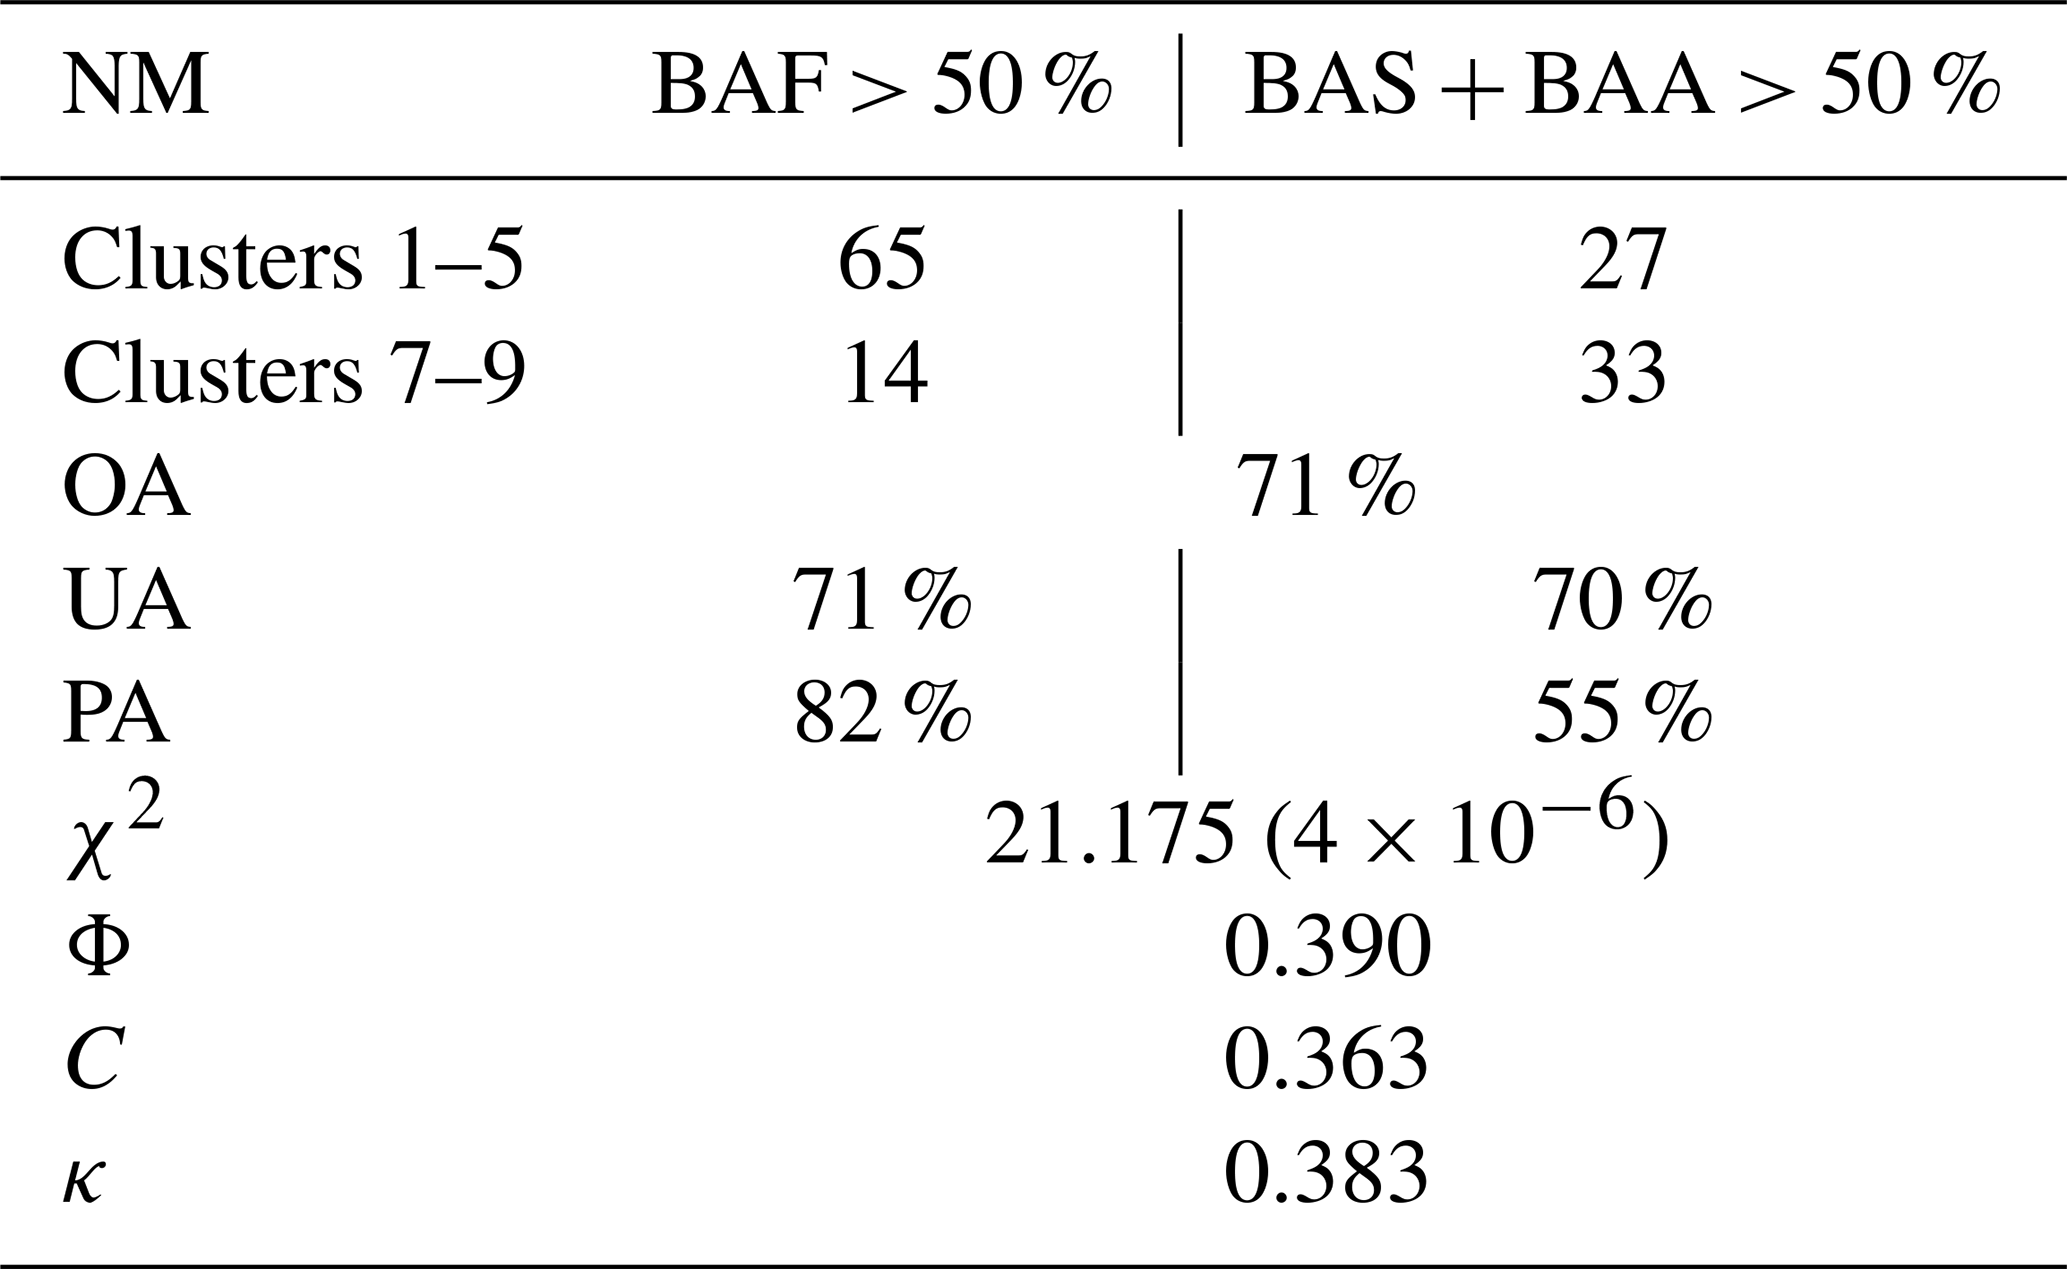
Results reveal that the number of municipalities in clusters 1–5 and BAF > 50 % is 4.6 times higher than the number of municipalities in clusters 7–9 and BAF > 50 %. However, the number of municipalities in clusters 7–9 and BAS + BAA > 50 % is 1.3 higher than the number of municipalities in clusters 1–5 and BAS + BAA > 50 %. Consequently, the OA (71 %), UA (71 %–70 %) and PA (82 %–55 %) have moderate to high accuracy. The BAS + BAA > 50 % threshold is probably a too-demanding criterion for the DSRp90TBA = 90 limit, as shrublands and agricultural land cover will also burn with higher DSRp in a large number of municipalities. For forests (BAF > 50 %), the accuracy is better, i.e. this threshold has been accurate in more than 4 times of the municipalities that were incorrectly classified. Cohen's kappa test allows us to conclude on a fair agreement (κ=0.3828) and rejects the null hypothesis: the observed agreement is not accidental (Landis and Koch, 1977). The Φ and C tests also corroborated that these variables are dependent, with similar values, 0.39 and 0.36, meaning moderate correlation (Frey, 2018) and the existence of a relationship (De Espindola et al., 2009), respectively. However, the χ2 test results indicate that we can claim that the samples are independent (Frey, 2018), with an error risk of about 4 × 10⁻⁶.
Thus, three out of four computed statistics prove a dependent relationship and, consequently, we can state that the cluster's spatial distribution patterns are correlated with vegetation type.
4.1 Burnt area and fire–weather relationship
The scatter plot of BA vs DSR indicates that BA strongly depends on DSR (Fig. 2). On the one hand, large wildfires can occur on days with a wide range of relatively low values of DSRp (DSRp < 80) due to several reasons including rapid fire-suppression activities (e.g. firefighting) or fuel constraints (e.g. fuel breaks, geographical and landscape features). On the other hand, extremely large wildfires only occur on days of extreme fire weather as pointed out by several studies (Fernandes et al., 2016). According to our results only 6 % of the TBA occurs with DSRp < 80 % and 12 % of TBA are registered in wildfires with DSRp < 90. The scatter plots of log (accumulated BA) and FTBA vs DSRp (Figs. 3 and 4) suggest that DSR90p is a suitable threshold to identify extreme weather associated with high TBA for mainland Portugal, which is in line with previous studies (Bedia et al., 2012; Carvalho et al., 2008; Fernandes, 2019; Silva et al., 2019).
However, analysis performed at a finer spatial scale (Fig. 5) discloses interesting deviations, namely differences between coastal areas and the hinterland municipalities. Large wildfires/high BA can occur in most of the inland municipalities in the northeast and parts of southern Portugal with DSRp < 80, but can only occur in coastal and some mountainous municipalities with higher DSR (DSR > DSR90p).
The cluster analysis based on the DSRp-vs-FTBA curves aimed to find groups of municipalities with similar fire–weather relationships. As expected, the spatial distribution of the clusters (Fig. 7) is also very similar to the DSRp80TBA and DSRp90TBA maps (Fig. 5), especially the marked differences between the coastal and hinterland municipalities of the northeast and south-central areas.
The curves of DSRp vs FTBA for the clusters (Fig. 8) show decreasing slopes and increasing variability with the decrease in the DSR, which means a trend for large wildfires to occur with less extreme weather conditions and greater variability between the municipalities of each cluster.
4.2 Influence of vegetation on the burnt area and fire–weather relationship
Differences in DSRp throughout the territory are expected due to distinct characteristic factors, including climate and landscape features. Mainland Portugal has two slightly different types of temperate (group C) climate, namely Csb (dry and warm summer) in the north and Csa (dry and hot summer) in the south, which promote different fire regimes in these two regions (Parente et al., 2016). LULC is also an important wildfire factor in Portugal (Barros and Pereira, 2014; Leuenberger et al., 2018; Parente and Pereira, 2016; Pereira et al., 2014; Tonini et al., 2018). Therefore, it is not surprising that there is a high similarity between the spatial patterns of DSRp80TBA or DSRp90TBA and the LULC maps for Portugal (e.g. please see Fig. 4 of Parente and Pereira, 2016). Other wildfire-related vegetation features were assessed (Fig. 10) to explain the heterogeneity of DSRp80TBA and DSRp90TBA maps (Fig. 5). The BNAF BNAS ratio pattern shows higher BNA in forests in most of the territory but the TBAF TBAS ratio reveals higher TBA in shrublands, especially in regions of lower DSRp80TBA and DSRp90TBA. These findings are in line with the higher land cover proneness to wildfires for shrublands and pine forests than for annual crops, mixed forests and evergreen oak woodlands (Barros and Pereira, 2014; Pereira et al., 2014).
Contingency tables, accuracy and statistical tests led us to conclude that vegetation types, particularly forest and shrublands, influence the spatial distribution of DSRp observed in Portugal.
The different vegetation cover can explain the spatial distribution of DSRp within mainland Portugal and, therefore, the dissimilarities between clusters (Fig. 11). On the one hand, extreme DSR extremes are strongly influenced by long-lasting severe droughts (not only during but before the fire season), heatwaves (during fire season) or both. Heat waves and droughts are important extreme weather/climate events, promoting wildfire occurrence and spread, and, therefore, high BA (Russo et al., 2017; Parente et al., 2018a, 2019). On the other hand, shrublands are more likely to suffer from droughts than forests. As observed by Gouveia et al. (2012), during drought shrublands presented higher levels of dryness, whereas broad-leaved forests exhibited lower water stress. Coniferous forests are more resistant to short-term droughts than broad-leaved forests, because of their decreased vulnerability to xylem cavitation (Allen et al., 2010). Consequently, forests tend to burn only under extreme DSR values, typically caused by simultaneous drought and heatwave, while shrublands (and also agricultural areas) can burn with lower DSRp. These facts can be additionally justified by biological features. In the Mediterranean region, precipitation is the main constraint to photosynthesis and growth (Pereira et al., 2007). This is particularly critical for shallow-rooted species, like those of herbaceous vegetation and some shrub species, which are unable to access groundwater. It is less critical for deeply rooted species such as cork oak, and other drought-resistant Mediterranean species (Cerasoli et al., 2016).
4.3 Considerations and implications for management
LULC data can affect the relationship between extreme fire weather and BA. LULC changed during the 19 years (2001–2019) of the study period in many locations, including in the BA polygons. Effectively, Meneses et al. (2018b) observed that the main land use changes, for the period 1990–2012, are related to reductions in forests and agricultural areas, together with increases in urban areas, with relatively small changes between the 2000–2006 and 2006–2012 periods. Therefore, LULC changes do not significantly affect the findings, knowing that we only use LULC data for one year/inventory to assess wildfire selectivity. Understory vegetation can also be an important factor in fire vulnerability, spread and intensity (Espinosa et al., 2019; Fonseca and Duarte, 2017). Consequently, wildfires tend to occur and spread only in managed forests with very high DSR, higher than in unmanaged forests (Fernandes et al., 2019). However, land use data do not include forest management information. Despite the small fraction of managed forested areas, which Beighley and Hyde (2018) roughly estimated as 20 %, the lack of this information can influence our results, particularly in the municipalities with a significant share of managed forest areas.
It is also important to underline that, to identify the drivers of extreme BA in Portugal, we used objective methods and adequate statistics that ensure the robustness and statistical significance of the results. The description of the study carried out also includes the chronology of the analysis performed. In a previous study (Calheiros et al., 2020), the relationship between fire weather and fire incidence was analysed in depth for the entire Iberian Peninsula. Among other results, the authors found that the DSR90p is a good indicator of extreme fire weather and is strongly related to the BA in the Iberian Peninsula. In this study, we started by verifying whether the relationship between DSRp and BA found, in general terms, for the Iberian Peninsula was also verified in mainland Portugal, at the municipality level, and what is the spatial variability of the extreme value of DSRp above which most of the burned area is registered. To objectively interpret the obtained spatial patterns (Fig. 5), we complement and deepened the analysis with the use of clustering algorithms, to classify the municipalities into statistically different groups in terms of the relationship between FTBA and DSRp. The emerging patterns showed that all of the most likely factors, such as topography, altitude (Fig. 1), slope (please see Fig. 5 of Parente and Pereira, 2016), population density (please see Fig. 2 of Pereira et al., 2011), rural and urban area type (please see Fig. 3 of Pereira et al., 2011), road density/distance to the nearest road (please see Fig. 2a of Parente et al., 2018b) and climate type (please see Fig. 1a of Parente et al., 2016), were not able to explain the spatial patterns obtained. The only factor with a similar spatial pattern was the LULC, which is the reason why we decided to explore this possibility more deeply, with contingency tables and several accuracy metrics to assess the influence of the type of vegetation cover on the relationship between DSRp and TBA.
Finally, the results of this study are a valuable resource in an innovative risk assessment system, improving the current wildfire risk mapping by taking into consideration the role of vegetation in the relationship between extreme weather and large wildfires. These maps are useful for forest management, landscape or land use planning, firefighting, civil protection and other stakeholders. Our findings are innovative for fire science in Portugal, showing an important relationship between fire weather, wildfires and vegetation.
This work disclosed that the 90th percentile of DSR, used to identify extreme fire weather days, is a good indicator of the extreme BA in mainland Portugal. However, at higher resolutions, this threshold presents regional variations that should be considered, namely for landscape and wildfire management.
This analysis of the relationship between extreme fire weather (specifically DSRp) and fire incidence (specifically BA) leads us to conclude that LULC, a structural factor, influences the impacts of meteorological conditions – a conjectural factor of fire risk. To our knowledge, this is the first study in Portugal to identify and establish that the relationship between fire weather and fire incidence depends on LULC.
The role of vegetation cover on these regional variations is an important outlook of our results. Shrublands are more suitable to burn in less extreme conditions than forests. Climate type and vegetation cover explain the DSRp spatial distribution dissimilarities, highlighting that landscape and forest management are key factors for the adaptation to future climate change, due to the highly probable vegetation changes.
To the best of our knowledge, the findings of this study have not been previously reported or published. These innovative findings significantly contribute to forest and fire management because they identify the fire weather risk limits for the large wildfire occurrence in different vegetation types. The relationship between fire weather, fire incidence and vegetation became better known. The spatial variability of DSRp and its dependence on vegetation type has high operational value and should be considered by fire managers and risk assessors to help firefighters and civil protection in fire prevention and in combat planning.
In this section, we present the results that were important but not fundamental for this paper. The number of fires in Portugal (Fig. A1), in each analysed municipality, was assessed. The distribution of the number of wildfires, between 2001 and 2019, discloses a notable contrast between northern and southern provinces (the last ones considered as Alto Alentejo, Alentejo Central, Alentejo Litoral, Baixo Alentejo and Algarve). Wildfires were more frequent in the extreme northwest (Alto Minho and Alto Tâmega) and some municipalities located in Beiras e Serra da Estrela. Wildfire frequency is much lower in the south and on most of the western coast.
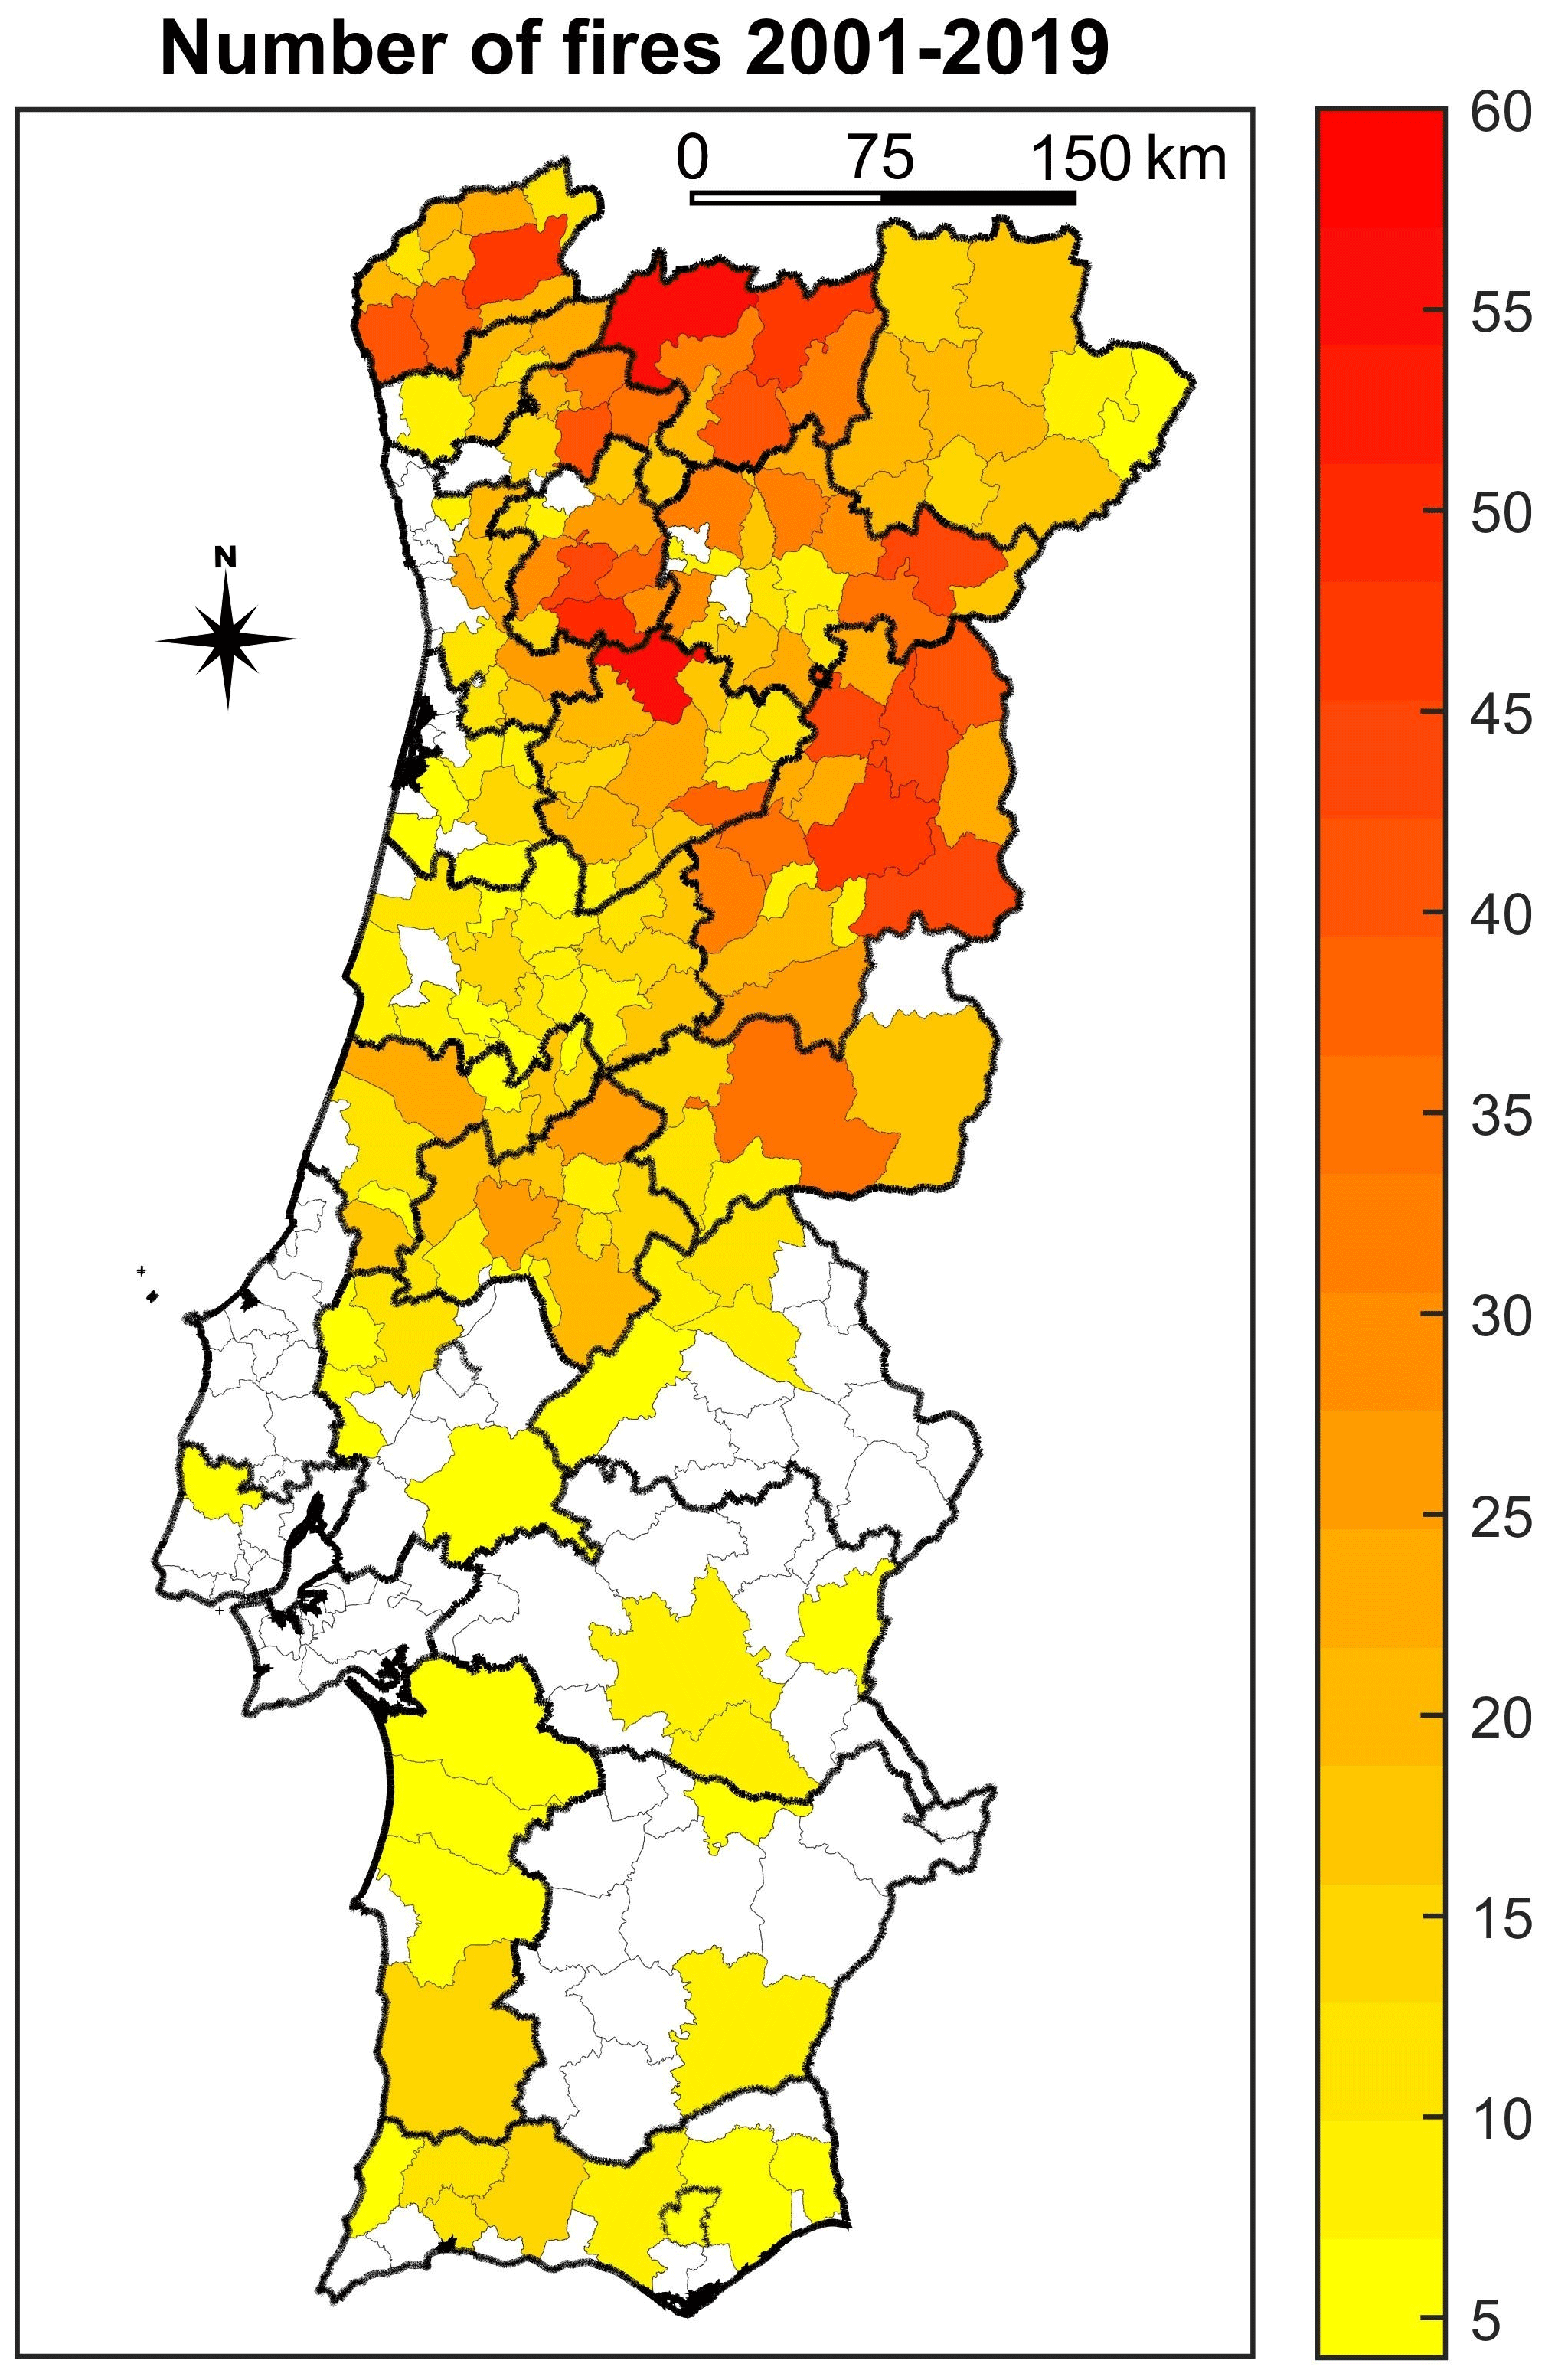
Figure A1Number of fires larger than 100 ha, all during the period 2001–2019, for the selected municipalities.
This research was developed using three public data sources. The meteorological variables were obtained from the fifth generation of ECMWF atmospheric reanalyses of the global climate (ERA5-Land) dataset (https://www.ecmwf.int/en/forecasts/dataset/ecmwf-reanalysis-v5, last access: 30 October 2020, Copernicus Climate Change Service (C3S), 2020). Land use and land cover data were provided by Portuguese national authorities, respectively, Direção Geral do Território (https://dados.gov.pt/pt/datasets/carta-de-uso-e-ocupacao-do-solo-2018/, last access: 16 March 2021; DGT, 2019a), and the wildfire database from the Instituto Nacional da Conservação da Natureza e das Florestas (https://geocatalogo.icnf.pt/catalogo_tema5.html, last access: 14 December 2020, ICNF, 2020).
TC developed the code to analyse the data, produced the results and plots, and wrote the original draft of the manuscript. For code information or access, please contact TC (tlmenezes@fc.ul.pt). AB contributed to the supervision, the code to analyse data and produce plots, and also the writing. MP contributed to the supervision, production of plots and writing. JS contributed to the supervision, methodology and writing. JN contributed to the supervision and writing. All authors contributed to the conceptualization and methodology of this research.
The contact author has declared that none of the authors has any competing interests.
Publisher’s note: Copernicus Publications remains neutral with regard to jurisdictional claims in published maps and institutional affiliations.
We would like to thank the reviewers and the editorial board for their valuable and constructive comments that allowed the publication of this article. Additionally, we thank the Portuguese Fundação para a Ciência e Tecnologia for the financial support.
This work was funded by the Portuguese Fundação para a Ciência e a Tecnologia through the PhD fellowship attributed to Tomás Calheiros (grant no. PD/BD/128173/2016). Additional funding was obtained through the individual research grant attributed to João Nunes (grant no. IF/00586/2015), research project FRISCO (grant no. PCIF/MPG/0044/2018), and research unit funding attributed to the CE3C, CITAB and Forest Research Centre (CEF) research centres (grant nos. UIDB/00329/2020, UIDB/04033/2020 and IDB/00239/2020, respectively).
This paper was edited by Yves Bühler and reviewed by four anonymous referees.
Alberg, A. J., Park, J. W., Hager, B. W., Brock, M. V., and Diener-West, M.: The use of “overall accuracy” to evaluate the validity of screening or diagnostic tests, J. Gen. Intern. Med., 19, 460–465, https://doi.org/10.1111/j.1525-1497.2004.30091.x, 2004.
Allen, C. D., Macalady, A. K., Chenchouni, H., Bachelet, D., McDowell, N., Vennetier, M., Kitzberger, T., Rigling, A., Breshears, D. D., Hogg, E. H. (T.), Gonzalez, P., Fensham, R., Zhang, Z., Castro, J., Demidova, N., Lim, J. H., Allard, G., Running, S. W., Semerci, A., and Cobb, N.: A global overview of drought and heat-induced tree mortality reveals emerging climate change risks for forests, For. Ecol. Manage., 259, 660–684, https://doi.org/10.1016/j.foreco.2009.09.001, 2010.
Amraoui, M., Pereira, M. G., Dacamara, C. C., and Calado, T. J.: Atmospheric conditions associated with extreme fire activity in the Western Mediterranean region, Sci. Total Environ., 524–525, 32–39, https://doi.org/10.1016/j.scitotenv.2015.04.032, 2015.
Araújo, C. S. P., Silva, I. A. C., Ippolito, M., and Almeida, C. D. G.: Evaluation of air temperature estimated by ERA5-Land reanalysis using surface data in Pernambuco, Brazil, Environ. Monit. Assess., 194, 381, https://doi.org/10.1007/s10661-022-10047-2, 2022.
Barros, A. M. G. and Pereira, J. M. C.: Wildfire selectivity for land cover type: Does size matter?, PLoS One, 9, https://doi.org/10.1371/journal.pone.0084760, 2014.
Beck, H. E., Zimmermann, N. E., McVicar, T. R., Vergopolan, N., Berg, A., and Wood, E. F.: Present and future köppen-geiger climate classification maps at 1-km resolution, Scientific Data, 5, 1–12, https://doi.org/10.1038/sdata.2018.214, 2018.
Bedia, J., Herrera, S., Gutiérrez, J. M., Zavala, G., Urbieta, I. R., and Moreno, J. M.: Sensitivity of fire weather index to different reanalysis products in the Iberian Peninsula, Nat. Hazards Earth Syst. Sci., 12, 699–708, https://doi.org/10.5194/nhess-12-699-2012, 2012.
Beighley, M. and Hyde, A. C.: Portugal Wildfire Management in a New Era: Assessing Fire Risks, Resources and Reforms, Beighley & Hyde (February), 52 pp., https://www.isa.ulisboa.pt/files/cef/pub/articles/2018-04/2018_Portugal_Wildfire_Management_in_a_New_Era_Engish.pdf (last access: 20 May 2021). 2018.
Benali, A., Russo, A., Sá, A. C. L., Pinto, R. M. S., Price, O., Koutsias, N., and Pereira, J. M. C.: Determining fire dates and locating ignition points with satellite data, Remote Sens., 8, 326-1-326-20, https://doi.org/10.3390/rs8040326, 2016.
Bergonse, R., Oliveira, S., Gonçalves, A., Nunes, S., DaCamara, C., and Zêzere, J. L.: Predicting burnt areas during the summer season in Portugal by combining wildfire susceptibility and spring meteorological conditions, Geomatics, Nat. Hazards Risk, 12, 1039–1057, https://doi.org/10.1080/19475705.2021.1909664, 2021.
Caetano, M., Igreja, C., Marcelino, F., and Costa, H.: Estatísticas e dinâmicas territoriais multiescala de Portugal Continental 1995–2007–2010 com base na Carta de Uso e Ocupação do Solo (COS), Relatório Técnico, Direção-Geral do Território (DGT), https://www.dgterritorio.gov.pt/sites/default/files/documentos-publicos/2017-6-7-14-51-10-609__RTC-60.pdf, (last access: 10 November 2022), 2017.
Calheiros, T., Nunes, J. P., and Pereira, M. G.: Recent evolution of spatial and temporal patterns of burnt areas and fire weather risk in the Iberian Peninsula, Agric. For. Meteorol., 287, 107923, https://doi.org/10.1016/J.AGRFORMET.2020.107923, 2020.
Calheiros, T., Pereira, M. G., and Nunes, J. P.: Assessing impacts of future climate change on extreme fire weather and pyro-regions in Iberian Peninsula, Sci. Total Environ., 754, 142233, https://doi.org/10.1016/j.scitotenv.2020.142233, 2021.
Carmo, M., Moreira, F., Casimiro, P., and Vaz, P.: Land use and topography influences on wildfire occurrence in northern Portugal, Landsc. Urban Plan., 100, 169–176, https://doi.org/10.1016/j.landurbplan.2010.11.017, 2011.
Carvalho, A., Flannigan, M. D., Logan, K., Miranda, A. I., and Borrego, C.: Fire activity in Portugal and its relationship to weather and the Canadian Fire Weather Index System, Int. J. Wildl. Fire, 17, 328–338, https://doi.org/10.1071/WF07014, 2008.
Cerasoli, S., Costa e Silva, F., and Silva, J. M. N.: Temporal dynamics of spectral bioindicators evidence biological and ecological differences among functional types in a cork oak open woodland, Int. J. Biometeorol., 60, 813–825, https://doi.org/10.1007/s00484-015-1075-x, 2016.
Chinita, M. J., Richardson, M., Teixeira, J., and Miranda, P. M. A.: Global mean frequency increases of daily and sub-daily heavy precipitation in ERA5, Environ. Res. Lett., 16, 074035, https://doi.org/10.1088/1748-9326/ac0caa, 2021.
Cohen, J.: A Coefficient of Agreement for Nominal Scales, Educ. Psychol. Meas., 20, 37–46, https://doi.org/10.1177/001316446002000104, 1960.
Congalton, R. G.: Accuracy assessment and validation of remotely sensed and other spatial information, Int. J. Wildl. Fire, 10, 321–328, https://doi.org/10.1071/wf01031, 2001.
Copernicus Climate Change Service (C3S): ERA5: Fifth generation of ECMWF atmospheric reanalyses of the global climate, Copernicus Clim. Chang. Serv. Clim. Data Store [data set], https://www.ecmwf.int/en/forecasts/dataset/ecmwf-reanalysis-v5, last access: 30 October 2020.
David, F. N. and Cramer, H.: Mathematical Methods of Statistics, Biometrika, 34, 374, https://doi.org/10.2307/2332454, 1947.
De Espindola, R. S., Luciano, E. M., and Audy, J. L. N.: An overview of the adoption of IT governance models and software process quality instruments at Brazil – Preliminary results of a survey, Proc. 42nd Annu. Hawaii Int. Conf. Syst. Sci. HICSS, 1–9, 5–8 January 2009, Big Island, Hawaii, USA, https://doi.org/10.1109/HICSS.2009.70, 2009.
De Groot, W. J.: Interpreting the Canadian Forest Fire Weather Index (FWI) System, Fourth Cent. Reg. Fire Weather Comm. Sci. Tech. Semin., Proceeding, 3–14, April 2, 1987, Winnipeg, Manitoba, Canada. The access to the document is available in https://cfs.nrcan.gc.ca/publications?id=23688 (last access: 17 December 2020), 1987.
Direção Geral do Território (DGT): Modelo Digital do Terreno (Resolução 50 m) – Portugal Continental, https://snig.dgterritorio.gov.pt/rndg/srv/por/catalog.search#/metadata/ba3f114f-51e2-4eaa-9f61-b8ade36b2378?tab=techinfo (last access: 18 January 2022), 2010.
Direção Geral do Território (DGT): Carta de Uso e Ocupação do Solo (COS) de Portugal Continental para 2018, dados.gov [data set], https://dados.gov.pt/pt/datasets/carta-de-uso-e-ocupacao-do-solo-2018/ (last access: 10 December 2020), 2019a.
Direção Geral do Território (DGT): Especificações técnicas da Carta de Uso e Ocupação do Solo (COS) de Portugal Continental para 2018, Relatório Técnico, Direção-Geral do Território [data set], https://geocatalogo.icnf.pt/catalogo_tema5.html (last access: 10 November 2022), 2019b.
Duane, A. and Brotons, L.: Synoptic weather conditions and changing fire regimes in a Mediterranean environment, Agric. For. Meteorol., 253–254, 190–202, https://doi.org/10.1016/j.agrformet.2018.02.014, 2018.
Espinosa, J., Palheiro, P., Loureiro, C., Ascoli, D., Esposito, A., and Fernandes, P. M.: Fire-severity mitigation by prescribed burning assessed from fire-treatment encounters in maritime pine stands, Can. J. For. Res., 49, 205–211, https://doi.org/10.1139/cjfr-2018-0263, 2019.
European Environment Agency (EEA): Copernicus Land Monitoring Service, Copernicus L. Monit. Serv. – EU-DEM, https://www.eea.europa.eu/data-and-maps/data/copernicus-land-monitoring-service-eu-dem, last access: 17 March 2021.
Fernandes, P. M.: Variation in the canadian fire weather index thresholds for increasingly larger fires in Portugal, Forests, 10, 838, https://doi.org/10.3390/f10100838, 2019.
Fernandes, P. M., Monteiro-Henriques, T., Guiomar, N., Loureiro, C., and Barros, A. M. G.: Bottom-Up Variables Govern Large-Fire Size in Portugal, Ecosystems, 19, 1362–1375, https://doi.org/10.1007/s10021-016-0010-2, 2016.
Fernandes, P. M., Guiomar, N., and Rossa, C. G.: Analysing eucalypt expansion in Portugal as a fire-regime modifier, Sci. Total Environ., 666, 79–88, https://doi.org/10.1016/j.scitotenv.2019.02.237, 2019.
Ferreira-Leite, F., Bento-Gonçalves, A., Vieira, A., Nunes, A., and Lourenço, L.: Incidence and recurrence of large forest fires in mainland Portugal, Nat. Hazards, 84, 1035–1053, https://doi.org/10.1007/s11069-016-2474-y, 2016.
Fonseca, T. F. and Duarte, J. C.: A silvicultural stand density model to control understory in maritime pine stands, IForest, 10, 829–836, https://doi.org/10.3832/ifor2173-010, 2017.
Frey, B. B.: The SAGE Encyclopedia of Educational Research, Measurement, and Evaluation, SAGE Encycl. Educ. Res. Meas. Eval., 1–4, https://doi.org/10.4135/9781506326139, 2018.
Gouveia, C. M., Bastos, A., Trigo, R. M., and DaCamara, C. C.: Drought impacts on vegetation in the pre- and post-fire events over Iberian Peninsula, Nat. Hazards Earth Syst. Sci., 12, 3123–3137, https://doi.org/10.5194/nhess-12-3123-2012, 2012.
Greenwood, P. E. and Nikulin, M. S.: A Guide to Chi-Squared Testing, 1–2, Wiley Series in Probability and Statistics, Wiley, ISBN 9780471557791, 1996.
Guo, J., Zhang, J., Yang, K., Liao, H., Zhang, S., Huang, K., Lv, Y., Shao, J., Yu, T., Tong, B., Li, J., Su, T., Yim, S. H. L., Stoffelen, A., Zhai, P., and Xu, X.: Investigation of near-global daytime boundary layer height using high-resolution radiosondes: first results and comparison with ERA5, MERRA-2, JRA-55, and NCEP-2 reanalyses, Atmos. Chem. Phys., 21, 17079–17097, https://doi.org/10.5194/acp-21-17079-2021, 2021.
Hassler, B. and Lauer, A.: Comparison of Reanalysis and Observational Precipitation Datasets Including ERA5 and WFDE5, Atmosphere, 12, 1462, https://doi.org/10.3390/atmos12111462, 2021.
Huai, B., Wang, J., Sun, W., Wang, Y., and Zhang, W.: Evaluation of the near-surface climate of the recent global atmospheric reanalysis for Qilian Mountains, Qinghai-Tibet Plateau, Atmos. Res., 250, 105401, https://doi.org/10.1016/j.atmosres.2020.105401, 2021.
Instituto da Conservação da Natureza e das Florestas (ICNF): 6.o Inventário Florestal Nacional (IFN6) – 2015 Relatório Final, 284 pp., https://www.icnf.pt/api/file/doc/c8cc40b3b7ec8541 (last access: 15 December 2020), 2019.
Instituto da Conservação da Natureza e das Florestas (ICNF): Territórios ardidos (Área ardida entre 1975 e 2021), ICNF [data set], https://geocatalogo.icnf.pt/catalogo_tema5.html, last access: 14 December 2020.
Instituto Português do Mar e da Atmosfera (IPMA): FWI, índice perigo de incêndio, https://www.ipma.pt/pt/riscoincendio/fwi/, last access: 14 November 2022.
Jimenez-Ruano, A., Rodrigues, M., Jolly, W. M., and de la Riva, J.: The role of short-term weather conditions in temporal dynamics of fire regime features in mainland Spain, J. Environ. Manage., 241, 575–586, https://doi.org/10.1016/j.jenvman.2018.09.107, 2018.
Jones, N., de Graaff, J., Rodrigo, I., and Duarte, F.: Historical review of land use changes in Portugal (before and after EU integration in 1986) and their implications for land degradation and conservation, with a focus on Centro and Alentejo regions, Appl. Geogr., 31, 1036–1048, https://doi.org/10.1016/j.apgeog.2011.01.024, 2011.
Kanevski, M. and Pereira, M. G.: Local fractality: The case of forest fires in Portugal, Phys. A Stat. Mech. Appl., 479, 400–410, https://doi.org/10.1016/j.physa.2017.02.086, 2017.
Krebs P., Pezzatti G. B., Mazzoleni S., Talbot L. M., and Conedera M.: Fire regime: history and definition of a key concept in disturbance ecology, Theor. Biosci., 129, 53–69, https://doi.org/10.1007/S12064-010-0082-Z, 2010.
Landis, J. R. and Koch, G. G.: The Measurement of Observer Agreement for Categorical Data, Biometrics, 33, 159, https://doi.org/10.2307/2529310, 1977.
Leuenberger, M., Parente, J., Tonini, M., Pereira, M. G., and Kanevski, M.: Wildfire susceptibility mapping: Deterministic vs. stochastic approaches, Environ. Model. Softw., 101, 194–203, https://doi.org/10.1016/j.envsoft.2017.12.019, 2018.
Lloret, F., Calvo, E., Pons, X., and Díaz-Delgado, R.: Wildfires and Landscape Patterns in the Eastern Iberian Peninsula, Landsc. Ecol., 17, 745–759, https://doi.org/10.1023/A:1022966930861, 2002.
McHugh, M. L.: Lessons in biostatistics interrater reliability: the kappa statistic, Biochem. Medica, 22, 276–282, https://hrcak.srce.hr/89395 (last access: 5 January 2022), 2012.
Meneses, B. M., Reis, E., and Reis, R.: Assessment of the recurrence interval of wildfires in mainland portugal and the identification of affected luc patterns, J. Maps, 14, 282–292, https://doi.org/10.1080/17445647.2018.1454351, 2018a.
Meneses, B. M., Reis, E., Vale, M. J., and Reis, R.: Modelling land use and land cover changes in Portugal: A multi-scale and multi-temporal approach, Finisterra, 53, 3–26, https://doi.org/10.18055/finis12258, 2018b.
Moreira, F., Viedma, O., Arianoutsou, M., Curt, T., Koutsias, N., Rigolot, E., Barbati, A., Corona, P., Vaz, P., Xanthopoulos, G., and Mouillot, F.: Landscape–wildfire interactions in southern Europe: Implications for landscape management, J. Environ. Manage., 92, 2389–2402, https://doi.org/10.1016/j.jenvman.2011.06.028, 2011.
Moreno, M. V., Conedera, M., Chuvieco, E., and Pezzatti, G. B.: Fire regime changes and major driving forces in Spain from 1968 to 2010, Environ. Sci. Policy, 37, 11–22, https://doi.org/10.1016/j.envsci.2013.08.005, 2014.
Muñoz-Sabater, J., Dutra, E., Agustí-Panareda, A., Albergel, C., Arduini, G., Balsamo, G., Boussetta, S., Choulga, M., Harrigan, S., Hersbach, H., Martens, B., Miralles, D. G., Piles, M., Rodríguez-Fernández, N. J., Zsoter, E., Buontempo, C., and Thépaut, J.-N.: ERA5-Land: a state-of-the-art global reanalysis dataset for land applications, Earth Syst. Sci. Data, 13, 4349–4383, https://doi.org/10.5194/essd-13-4349-2021, 2021.
National Wildfire Coordinating Group (NCWG): Glossary of Wildland Fire Terminology, October, 2005, 189 pp., http://www.nwcg.gov/pms/pubs/glossary/pms205.pdf (last access: 13 January 2022), 2011.
Nogueira, M.: Inter-comparison of ERA-5, ERA-interim and GPCP rainfall over the last 40 years: Process-based analysis of systematic and random differences, J. Hydrol., 583, 124632, https://doi.org/10.1016/j.jhydrol.2020.124632, 2020.
Nunes, A. N.: Regional variability and driving forces behind forest fires in Portugal an overview of the last three decades (1980–2009), Appl. Geogr., 34, 576–586, https://doi.org/10.1016/j.apgeog.2012.03.002, 2012.
Nunes, A. N., Lourenço, L., and Meira, A. C. C.: Exploring spatial patterns and drivers of forest fires in Portugal (1980–2014), Sci. Total Environ., 573, 1190–1202, https://doi.org/10.1016/j.scitotenv.2016.03.121, 2016.
Oliveira, T. M., Guiomar, N., Baptista, F. O., Pereira, J. M. C., and Claro, J.: Is Portugal’s forest transition going up in smoke?, Land Use Policy, 66, 214–226, https://doi.org/10.1016/j.landusepol.2017.04.046, 2017.
Parente, J. and Pereira, M. G.: Structural fire risk: The case of Portugal, Sci. Total Environ., 573, 883–893, https://doi.org/10.1016/j.scitotenv.2016.08.164, 2016.
Parente, J., Pereira, M. G., and Tonini, M.: Space-time clustering analysis of wildfires: The influence of dataset characteristics, fire prevention policy decisions, weather and climate, Sci. Total Environ., 559, 151–165, https://doi.org/10.1016/j.scitotenv.2016.03.129, 2016.
Parente, J., Pereira, M. G., Amraoui, M., and Fischer, E. M.: Heat waves in Portugal: Current regime, changes in future climate and impacts on extreme wildfires, Sci. Total Environ., 631–632, 534–549, https://doi.org/10.1016/j.scitotenv.2018.03.044, 2018a.
Parente, J., Pereira, M. G., Amraoui, M., and Tedim, F.: Negligent and intentional fires in Portugal: Spatial distribution characterization, Sci. Total Environ., 624, 424–437, https://doi.org/10.1016/j.scitotenv.2017.12.013, 2018b.
Parente, J., Amraouia, M., Menezes, I., and Pereira, M. G.: Drought in Portugal: Current regime, comparison of indices and impacts on extreme wildfires, Sci. Total Environ., 685, 150–173, https://doi.org/10.1016/j.scitotenv.2019.05.298, 2019.
Pausas, J. G. and Fernández-Muñoz, S.: Fire regime changes in the Western Mediterranean Basin: From fuel-limited to drought-driven fire regime, Clim. Change, 110, 215–226, https://doi.org/10.1007/s10584-011-0060-6, 2012.
Pausas, J. G. and Vallejo, V. R.: The role of fire in European Mediterranean ecosystems, in Remote Sensing of Large Wildfires, Springer Berlin Heidelberg, Berlin, Heidelberg, 3–16, https://doi.org/10.1007/978-3-642-60164-4_2, 1999.
Pelosi, A., Terribile, F., D'Urso, G., and Chirico, G. B.: Comparison of ERA5-Land and UERRA MESCAN-SURFEX reanalysis data with spatially interpolated weather observations for the regional assessment of reference evapotranspiration, Water, 12, 1669, https://doi.org/10.3390/w12061669, 2020.
Pereira, J. S., Chaves, M. M., Caldeira, M. C., and Correia, A. V.: Water Availability and Productivity, Plant Growth and Climate Change, John Wiley & Sons, Ltd, Chap. 6, 118–145, https://doi.org/10.1002/9780470988695.ch6, 2007.
Pereira, M. G., Trigo, R. M., da Camara, C. C., Pereira, J. M. C., and Leite, S. M.: Synoptic patterns associated with large summer forest fires in Portugal, Agric. For. Meteorol., 129, 11–25, https://doi.org/10.1016/j.agrformet.2004.12.007, 2005.
Pereira, M. G., Malamud, B. D., Trigo, R. M., and Alves, P. I.: The history and characteristics of the 1980–2005 Portuguese rural fire database, Nat. Hazards Earth Syst. Sci., 11, 3343–3358, https://doi.org/10.5194/nhess-11-3343-2011, 2011.
Pereira, M. G., Aranha, J., and Amraoui, M.: Land cover fire proneness in Europe, For. Syst., 23, 598–610, 2014.
Pereira, M. G., Caramelo, L., Orozco, C. V., Costa, R., and Tonini, M.: Space-time clustering analysis performance of an aggregated dataset: The case of wildfires in Portugal, Environ. Model. Softw., 72, 239–249, https://doi.org/10.1016/j.envsoft.2015.05.016, 2015.
Rodrigues, M., Trigo, R. M., Vega-García, C., and Cardil, A.: Identifying large fire weather typologies in the Iberian Peninsula, Agric. For. Meteorol., 280, 107789, https://doi.org/10.1016/j.agrformet.2019.107789, 2020.
Romano, N. and Ursino, N.: Forest fire regime in a mediterranean ecosystem: Unraveling the mutual interrelations between rainfall seasonality, soil moisture, drought persistence, and biomass dynamics, Fire, 3, 1–20, https://doi.org/10.3390/fire3030049, 2020.
Ruffault, J., Curt, T., Martin-StPaul, N. K., Moron, V., and Trigo, R. M.: Extreme wildfire events are linked to global-change-type droughts in the northern Mediterranean, Nat. Hazards Earth Syst. Sci., 18, 847–856, https://doi.org/10.5194/nhess-18-847-2018, 2018.
Russo, A., Gouveia, C. M., Páscoa, P., DaCamara, C. C., Sousa, P. M., and Trigo, R. M.: Assessing the role of drought events on wildfires in the Iberian Peninsula, Agric. For. Meteorol., 237–238, 50–59, https://doi.org/10.1016/j.agrformet.2017.01.021, 2017.
San-Miguel-Ayanz, J., Durrant, T., Boca, R., Maianti, P., Liberta', G., Artes Vivancos, T., Jacome Felix Oom, D., Branco, A., De Rigo, D., Ferrari, D., Pfeiffer, H., Grecchi, R., Nuijten, D., and Leray, T.: Forest Fires in Europe, Middle East and North Africa, 2019, https://doi.org/10.2760/468688, ISBN 978-92-76-23209-4, 2020.
Scotto, M. G., Gouveia, S., Carvalho, A., Monteiro, A., Martins, V., Flannigan, M. D., San-Miguel-Ayanz, J., Miranda, A. I., and Borrego, C.: Area burned in Portugal over recent decades: An extreme value analysis, Int. J. Wildl. Fire, 23, 812–824, https://doi.org/10.1071/WF13104, 2014.
Sianturi, Y., Marjuki and Sartika, K.: Evaluation of ERA5 and MERRA2 reanalyses to estimate solar irradiance using ground observations over Indonesia region, AIP Conf. Proc., 2223, 020002 pp., https://doi.org/10.1063/5.0000854, 2020.
Silva, J. M. N., Moreno, M. V., Page, Y. Le, Oom, D., Bistinas, I., and Pereira, J. M. C.: Spatiotemporal trends of area burnt in the Iberian Peninsula, 1975–2013, Reg. Environ. Chang., 19, 515–527, 2019.
Sousa, P. M., Trigo, R. M., Pereira, M. G., Bedia, J., and Gutiérrez, J. M.: Different approaches to model future burnt area in the Iberian Peninsula, Agric. For. Meteorol., 202, 11–25, https://doi.org/10.1016/j.agrformet.2014.11.018, 2015.
Stamou, Z., Xystrakis, F., and Koutsias, N.: The role of fire as a long-term landscape modifier: Evidence from long-term fire observations (1922–2000) in Greece, Appl. Geogr., 74, 47–55, https://doi.org/10.1016/j.apgeog.2016.07.005, 2016.
Sun, G., Hu, Z., Ma, Y., Xie, Z., Sun, F., Wang, J., and Yang. S.: Analysis of Local Land Atmosphere Coupling Characteristics over Tibetan Plateau in the Dry and Rainy Seasons using Observational data and ERA5, Sci. Total Environ., 774, 145138, https://doi.org/10.1016/j.scitotenv.2021.145138, 2021.
Sutanto, S. J., Vitolo, C., Di Napoli, C., D'Andrea, M., and Van Lanen, H. A. J.: Heatwaves, droughts, and fires: Exploring compound and cascading dry hazards at the pan-European scale, Environ. Int., 134, 105276, https://doi.org/10.1016/j.envint.2019.105276, 2020.
Tarín-Carrasco, P., Augusto, S., Palacios-Peña, L., Ratola, N., and Jiménez-Guerrero, P.: Impact of large wildfires on PM10 levels and human mortality in Portugal, Nat. Hazards Earth Syst. Sci., 21, 2867–2880, https://doi.org/10.5194/nhess-21-2867-2021, 2021.
Telesca, L. and Pereira, M. G.: Time-clustering investigation of fire temporal fluctuations in Portugal, Nat. Hazards Earth Syst. Sci., 10, 661–666, https://doi.org/10.5194/nhess-10-661-2010, 2010.
The MathWorks Inc: Linkage, Agglomerative hierarchical cluster tree, Help Cent, https://www.mathworks.com/help/stats/linkage.html, last access: 15 November 2021.
Tonini, M., Parente, J., and Pereira, M. G.: Global assessment of rural–urban interface in Portugal related to land cover changes, Nat. Hazards Earth Syst. Sci., 18, 1647–1664, https://doi.org/10.5194/nhess-18-1647-2018, 2018.
Trigo, R. M., Pereira, J. M. C., Pereira, M. G., Mota, B., Calado, T. J., Dacamara, C. C., and Santo, F. E.: Atmospheric conditions associated with the exceptional fire season of 2003 in Portugal, Int. J. Climatol., 26, 1741–1757, https://doi.org/10.1002/joc.1333, 2006.
Trigo, R. M., Sousa, P. M., Pereira, M. G., Rasilla, D., and Gouveia, C. M.: Modelling wildfire activity in Iberia with different atmospheric circulation weather types, Int. J. Climatol., 36, 2761–2778, https://doi.org/10.1002/joc.3749, 2016.
Turco, M., Rosa-Cánovas, J. J., Bedia, J., Jerez, S., Montávez, J. P., Llasat, M. C., and Provenzale, A.: Exacerbated fires in Mediterranean Europe due to anthropogenic warming projected with non-stationary climate-fire models, Nat. Commun., 9, 1–9, https://doi.org/10.1038/s41467-018-06358-z, 2018.
Turco, M., Jerez, S., Augusto, S., Tarín-Carrasco, P., Ratola, N., Jiménez-Guerrero, P., and Trigo, R. M.: Climate drivers of the 2017 devastating fires in Portugal, Sci. Rep., 9, 3821, https://doi.org/10.1038/s41598-019-50281-2, 2019.
Urban, A., Di Napoli, C., Cloke, H. L., Kyselý, J., Pappenberger, F., Sera, F., Schneider, R., Vicedo-Cabrera, A. M., Acquaotta, F., Ragettli, M. S., Íñiguez, C., Tobias, A., Indermitte, E., Orru, H., Jaakkola, J. J. K., Ryti, N. R. I., Pascal, M., Huber, V., Schneider, A., de' Donato, F., Michelozzi, P., and Gasparrini, A.: Evaluation of the ERA5 reanalysis-based Universal Thermal Climate Index on mortality data in Europe, Environ. Res., 198, 111227, https://doi.org/10.1016/j.envres.2021.111227, 2021.
Van Wagner, C. and Pickett, T. L.: Equations and fortran IV program for the 1976 metric version of the forest fire weather index, Canadian Forestry Service, Petawawa Forest Experiment Station, Chalk River, Ontario, Information Report PS-X-58,19 p., https://cfs.nrcan.gc.ca/publications?id=23602 (last access: 11 December 2020), 1975.
Van Wagner, C. E.: Development and structure of the Canadian Forest Fire Weather Index system, Canadian Forestry Service, Headquarters, Ottawa. Forestry Technical Report 35, 35 p., https://cfs.nrcan.gc.ca/publications?id=19927 (last access: 11 December 2020), 1987.
Viegas, D. X., Bovio, G., Ferreira, A., Nosenzo, A., and Sol, B.: Comparative study of various methods of fire danger evaluation in southern Europe, Int. J. Wildland Fire, 9, 235–246, 1999.
Vieira, I., Russo, A., and Trigo, R. M.: Identifying local-scale weather forcing conditions favorable to generating Iberia’s largest fires, Forests, 11, 1–14, https://doi.org/10.3390/F11050547, 2020.
Vilar, L., Camia, A., San-Miguel-Ayanz, J., and Martín, M. P.: Modeling temporal changes in human-caused wildfires in Mediterranean Europe based on Land Use-Land Cover interfaces, For. Ecol. Manage., 378, 68–78, https://doi.org/10.1016/j.foreco.2016.07.020, 2016.
Whitlock, C., Higuera, P. E., McWethy, D. B., and Briles, C. E.: Paleoecological Perspectives on Fire Ecology: Revisiting the Fire-Regime Concept, Open Ecol. J., 3, 6–23, https://doi.org/10.2174/1874213001003020006, 2010.