the Creative Commons Attribution 4.0 License.
the Creative Commons Attribution 4.0 License.
 | 12 Dec 2022
How volcanic stratigraphy constrains headscarp collapse scenarios: the Samperre cliff case study (Martinique island, Lesser Antilles)
Yoann Legendre
Aude Nachbaur
Thomas J. B. Dewez
Yannick Thiery
Clara Levy
Benoit Vittecoq
Gravitational instabilities can be significant threats to populations and infrastructure. For hazard assessment, it is important to estimate the geometry and volume of potential unstable masses. This characterization can be particularly difficult in volcanic contexts due to the succession of deposition and erosion phases. Indeed, it results in complex layering geometries in which the interfaces between geological layers may be neither parallel nor planar. Geometry characterization is all the more complex when unstable masses are located in steep and hard to access landscapes, which limits data acquisition. In this work, we show how remote observations can be used to estimate the surface envelope of an unstable mass on a volcanic cliff. We use ortho-photographs, aerial views and topographic surveys to (i) describe the different geological units of the cliff, (ii) characterize the stability of geological units, (iii) infer the paleo-morphology of the site and (iv) estimate potential unstable volumes. We investigate the Samperre cliff in Martinique (Lesser Antilles, French West Indies) as a study site, where recurrent destabilizations since at least 1988 have produced debris flows that threaten populations and infrastructure. Our analysis suggests that the destabilizations occurring on the cliff may be associated with the re-opening of a paleo-valley filled by pyroclastic materials. We estimate that between 3.5×10⁶ and 8.3×10⁶ m3 could still be mobilized by future destabilizations in the coming decades.
- Article
(6925 KB) - Full-text XML
-
Supplement
(34164 KB) - BibTeX
- EndNote


Volcanoes alternate construction phases, when eruption materials widen and heighten the volcanic edifice, and destruction phases contributing to the dismantling of the edifice (Thouret, 1999) and to its progressive widening (e.g., De Rita et al., 1997; Manville et al., 2009; Di Traglia et al., 2020). Such destruction phases occur sometimes very violently during caldera-forming eruptions, e.g., during the Samalas 1257 CE eruption (Lavigne et al., 2013) or the Tambora 1815 CE eruption (Stothers, 1984). The erosion of volcanic edifices also results from gravitational instabilities because of the construction mechanism of volcanoes by the progressive accumulation of eruptive materials (Ramalho et al., 2013). Volcanic structures are the result of alternating periods of deposition and erosion. Between these phases the materials are often subjected to strong alteration, especially in tropical and subtropical contexts. Thus, there can be strong disparities in the geotechnical and hydrogeological characteristics of the different successions of lithological layers or even within the same layer. These geometrical and internal disparities favor gravitational instabilities, especially when the morphology is favorable. These predisposing factors can be accentuated (see Schaefer et al., 2019, for a review) by steep slopes (e.g., on steep-walled andesitic edifices; Voight, 2000), hydrothermal alteration (Revil et al., 2020; Heap et al., 2021), hydrothermal pressurization (Reid, 2004), rainfall (van Wyk de Vries et al., 2000), earthquakes (Coviello et al., 2021) and eruptions (Siebert et al., 1987; Durand et al., 2018). The scale of instabilities varies from a few cubic meters (e.g., for rockfalls; Durand et al., 2018) to large debris avalanches up to several cubic kilometers (sector or flank collapse; Blahůt et al., 2019).
Since the dramatic flank collapse of Mount Saint Helens in 1980 (Voight et al., 1983), massive debris avalanches (more than 107 m3) have been widely studied (e.g., Siebert et al., 1987; Voight, 2000; Boudon et al., 2007). Siebert (1984) estimates a worldwide occurrence frequency of about four such events per century, but site-specific occurrence frequencies are variable. For instance, the Soufrière de Guadeloupe volcano has produced at least eight flank collapses in the past 9150 years (Komorowski et al., 2005; Legendre, 2012). With one event per 1100 years on average, flank collapse events appear rather frequent on a geological timescale. However, from a human perspective this represents only one event in 45 generations.
In comparison, smaller mass wasting events (from 106 to 107 m3) are more frequent. Landslide occurrence rate f is indeed related to landslide volume V through a power law , with β a positive parameter. For instance, Brunetti et al. (2009) estimate β=1.3 for a global dataset of landslides ranging from 10−4 to 1013 m3 (including among others rockfalls, rock avalanches and debris avalanches). When considering landslides in volcanic contexts only, Brunetti et al. (2009) compute β=1.1 (see their dataset R). Thus, although mass wasting events involving 106 to 107 m3 affect smaller areas in comparison to larger volcanic flank collapse (> 108 m3), their higher occurrence rate may result at similar risk levels.
In volcanic contexts, events involving 106 to 107 m3 span a wide variety of landslide type, including slow-moving landslides (a few centimeters per year to a few meters per year) as in the Salazie cirque on Réunion island, France (Belle et al., 2014; Rault et al., 2022), partial dome collapse during eruptive episodes (Harnett et al., 2019), and very fast (several tens of meters per second) rock or debris avalanches during or long after eruptive episodes (e.g., 2010 Mount Meager landslide in Canada; Guthrie et al., 2012; Moretti et al., 2015). In this study we focus on such rock and debris avalanches. They can be significant threats to populations and infrastructure as they can occur far from current eruptive centers and thus in urbanized areas. Besides, it is difficult to predict their occurrence. For instance, 2500 people were killed by the 1.6×10⁶ m3 Casita (Nicaragua) debris avalanche in 1998 during hurricane Mitch (van Wyk de Vries et al., 2000; Scott et al., 2005). Another example is the Grand Sable rock avalanche (about 20×106 m3) that killed 62 people on Réunion island in 1875 (Humbert et al., 1981; Rault et al., 2022).
In order to assess the risks associated with debris and rock avalanches, their propagation and the associated impact on populated areas can be estimated through numerical modeling (e.g., McDougall, 2017; Peruzzetto et al., 2019) or empirical laws (e.g., Mitchell et al., 2019; Peruzzetto et al., 2020). However, a major difficulty in such studies is the characterization of the geometry and volume of the initial unstable mass, that is, the initial conditions of propagation simulations. When the landslide has already occurred, they are usually reconstructed using topographic surveys carried out before and after the event. For a potential future landslide, the failure surface (or at least the surface separating stable and less stables units) must be inferred. Its extent can be deduced from field observations and/or records of surface displacements (e.g., with satellite monitoring; Schaefer et al., 2019; Hickey et al., 2020). Then, when the subsurface is homogeneous, the failure surface can be estimated with relatively simple geometric considerations (Jaboyedoff et al., 2019, 2020). However, as already said, the subsurface is often not homogeneous in volcanic environments. It is thus necessary to identify the different geological units composing the unstable slope. This requires fieldwork and/or geophysical surveys (Rosas-Carbajal et al., 2016, 2017). The nature and geometry of geological units can then be processed in an expert way to identify preferential rupture surfaces. Rupture surfaces can also be inferred from limit equilibrium analysis, provided geotechnical data are available (Apuani et al., 2005; Verrucci et al., 2019; Heap et al., 2021).
However, in many cases, researchers and/or practitioners can only rely on remote observations and/or topographic models to estimate the surface envelope of the unstable mass. This happens when fieldwork is difficult or dangerous (e.g., in remote and steep areas) and when advanced remote sensing methods are not applicable (e.g., interferometric synthetic aperture radar (InSAR) acquisition for displacement measurements does not yield conclusive results in densely vegetated areas). In these conditions where relatively few data are available but stakes require a quantified hazard assessment, how can we estimate the surface envelope of an unstable mass, from which the unstable volume can be quantified?
In this work, we show how the combined use of historical ortho-photographs and aerial photographs, digital elevation models (DEMs), and 3D point clouds can help estimate the surface envelope of an unstable mass. We investigate the Samperre cliff in Martinique (Lesser Antilles, French West Indies) as a case study. Located on the western flank of the Montagne Pelée volcano, it has undergone several episodes of destabilizations since at least 1980 or even 1950 (Aubaud et al., 2013; Clouard et al., 2013). Although the resulting rock avalanches do not directly threaten populated areas, subsequent debris flows do propagate several kilometers downstream and impact populations, buildings and infrastructure. The quantification of potentially unstable volumes is thus important to assess the volume of the resulting loose debris reservoir that could feed debris flows.
The geological context of the study site is given in Sect. 2. In Sect. 3 we present the topographic surveys and ortho-photographs used in this work, along with the methods used to (i) characterize the geometry of geological units and (ii) compute the volume of the unstable mass. Then, in Sect. 4, we describe the different geological layers forming the Samperre cliff and differentiate between stable and unstable layers (given the current morphology of the cliff). This allows the paleo-morphology of the site to be inferred and the paleo-surface of a valley progressively filled by volcanic deposits to be identified. We extrapolate the geometry of this paleo-surface to construct a stable basal surface above which materials could be remobilized. The associated volume is computed and discussed in Sect. 5, along with the other results of our work.
A detailed review of Martinique island geological history can be found in Westercamp et al. (1989), Maury et al. (1991), Boudon et al. (2005), Germa et al. (2011), and Boudon and Balcone-Boissard (2021). Martinique island is part of the Lesser Antilles volcanic arc (Fig. 1). The Samperre cliff is located in the northern part of the island, in the most recent volcanic formations and constituting since 550 ka the Montagne Pelée Volcanic Complex (Fig. 1b and Boudon and Balcone-Boissard, 2021).
The first building stage of the Montagne Pelée Volcanic Complex is a succession of andesitic breccias, lava domes and lava flows dated between 550 and 127 ka by Germa et al. (2011). The end of the first stage is marked by the Prêcheur flank collapse (Prêcheur collapse structure in Fig. 1; Le Friant et al., 2003; Boudon and Balcone-Boissard, 2021). This 25×109 m3 collapse (Brunet et al., 2016) entailed a lithostatic decompression of the lava chamber feeding this primitive Montagne Pelée edifice (Germa et al., 2011). It may have triggered the formation of the Piton Marcel lava dome near the boundary of the horseshoe shaped collapse structure (Fig. 1c).
The Prêcheur flank collapse marks the beginning of the second phase of the Montagne Pelée Volcanic Complex. Lava dome-forming eruptions and associated concentrated pyroclastic density currents were the dominant activity. The edifice that grew in the Prêcheur collapse scar was destroyed by another flank collapse about 36 kyr ago (Rivière Sèche collapse; Solaro et al., 2020). During the third building stage of the Montagne Pelée Volcanic Complex, the first 10 kyr years were characterized by abundant explosive activities with low-silica andesitic magma. Over the past 25 kyr, Boudon and Balcone-Boissard (2021) have recorded at least 55 magmatic eruptions, two-thirds of which are dome-forming eruptions and the rest being Plinian eruptions.
The volumes of flank collapses can be estimated from the on-land and submarine topography. However, before the new interpretation of Solaro et al. (2020), previous studies suggested the Prêcheur flank collapse 127 kyr ago was constituted by two separate collapses 127 and 32 kyr ago (Le Friant et al., 2003; Germa et al., 2015; Brunet et al., 2016). Their volumes were estimated to be 25×109 and 13×109 m3 by Brunet et al. (2016). Smaller volumes were computed by Germa et al. (2015) using a geomorphological analysis: 14.7×10⁹ and 8.8×10⁹ m3. Thus, the total volume for the Prêcheur collapse can be estimated between 27.5×10⁹ and 38×109 m3. However, these volumes were likely destabilized by successive smaller debris avalanches less than 5×10⁹ m3, as suggested by numerical simulations (Brunet et al., 2017). Such volumes are consistent with the volume estimated for the Rivière Sèche flank collapse: between 2×10⁹ m3 (Brunet et al., 2016) and 3.5×10⁹ m3 (Germa et al., 2015). Even so, the magnitude of such events is about 100 to 1000 times larger than that of the rock avalanches we focus on (less than 107 m3).
Rock avalanches involving up to 107 m3 occur in the Prêcheur river catchment that drains part of the western flank of Montagne Pelée. The Prêcheur river's major affluent is the Samperre river that skirts Piton Marcel to the south and has its source at the toe of Samperre cliff. This cliff is very recent, as it was formed between 1951 CE (when only smooth slopes are visible on ortho-photographs) and 1980 CE (first monitored collapse) by successive retrogressive failures (Fig. 2). Five major destabilization sequences occurred in 1980, 1997–1998, 2009–2010 and 2018 (Aubaud et al., 2013; Nachbaur et al., 2019), but another unconfirmed collapse episode may have happened in the 1950s (Aubaud et al., 2013). Thus, the cliff rim has retreated by 250 m between 1988 and 2018 along a west-southwest–east-northeast direction (azimuth 062∘ N measured clockwise as are all azimuth directions in this work, white line in Fig. 2a), resulting in a 300 m high steep () to subvertical wall. Clouard et al. (2013) estimated that a volume of about 2.1×10⁶ m3 collapsed between March and May 2010. Between May 2010 and August 2018, the cliff lost about 4.9×10⁶ m3, with a major collapse sequence between January and August 2018 (Quefféléan, 2018; Nachbaur et al., 2019; Peruzzetto, 2021b; Peruzzetto et al., 2022). These destabilizations are often (if not systematically) associated with the remobilization of deposits by water and the generation of debris and hyper-concentrated flows. For instance in June 2010, a major debris flow inundated part the Prêcheur village at the river mouth and severely damaged the bridge crossing the river (Aubaud et al., 2013; Peruzzetto et al., 2022). A new and higher bridge has since been constructed, but major lahars could still destroy it. As a result, about 420 people would be isolated from the rest of the island (INSEE, 2015). For local risk management, it is thus important to assess the volumes of future rock avalanches from the Samperre cliff in order to estimate the magnitude of the associated debris flows and to quantify the resulting risks.
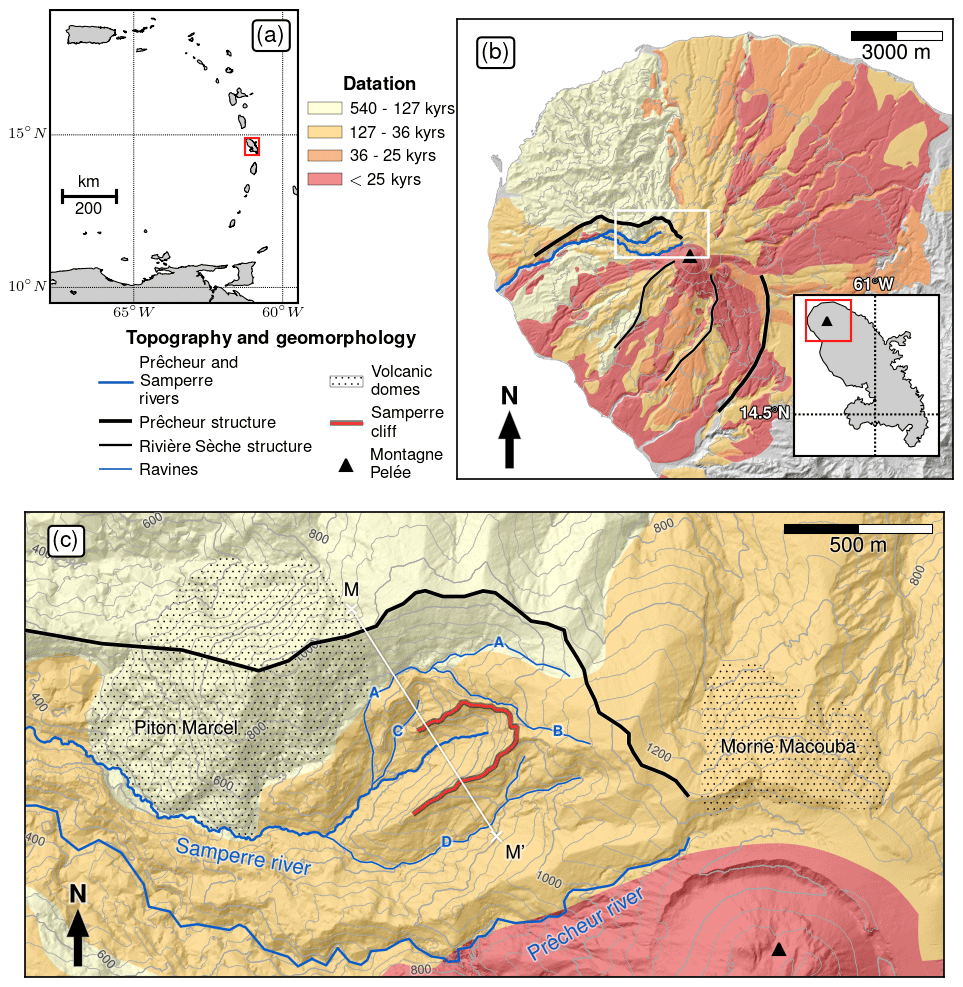
Figure 1Map of the study site. (a) Map of the Lesser Antilles. Martinique island is located in the red rectangle. (b) Geological map of Montagne Pelée volcano, adapted from Westercamp et al. (1989) using the interpretation of Boudon and Balcone-Boissard (2021). The main phases of volcanic activity are first building stage/primitive Montagne Pelée (550–127 ka), second building stage/intermediate Montagne Pelée (126–36 ka) and third building stage/recent Montagne Pelée (35–26 ka and 25 ka–present). Older formations and alluvial deposits are not mapped. The insert is Martinique island. The red rectangle in insert gives the extent of (b). The white rectangle in (b) gives the extent of (c). (c) Close-up of the northwest flank of Montagne Pelée, with the Samperre cliff, Piton Marcel, Morne Macouba, the Prêcheur and Samperre rivers, and main ravines. Ravines are referred to with letters A, B, C and D in the text. The destabilization structures are reproduced from Boudon and Balcone-Boissard (2021).
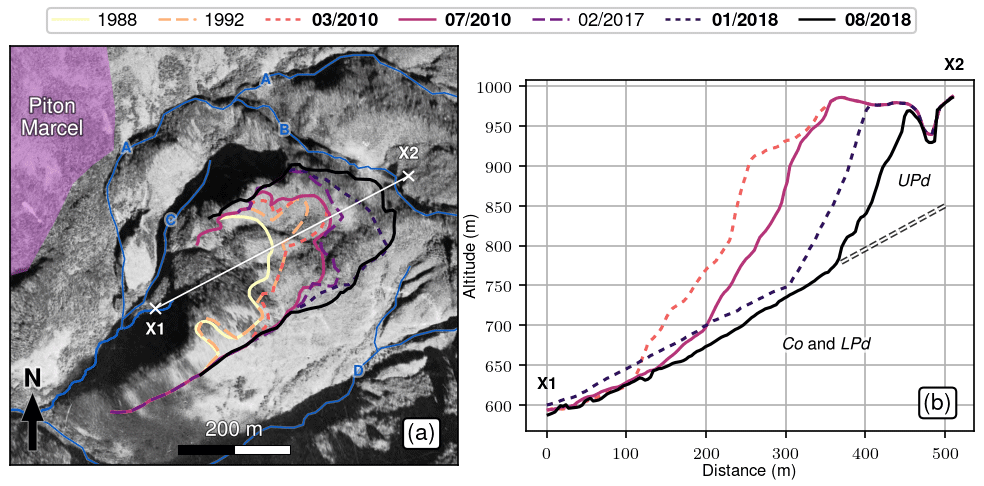
Figure 2Evolution of the Samperre cliff between 1951 and 2018. (a) 1951 ortho-photograph of the Samperre cliff. The successive cliff rims observed in ortho-photographs and DEMs between 1988 and 2018 are given by plain and dashed lines. The Samperre river (thick blue line), ravines (thin blue lines) and the Piton Marcel (purple patch) are given as in Fig. 1. (b) Successive cross-sections of the cliff (March 2010, July 2010, January 2018, August 2018, in bold in the legend). The inferred contact between the stable unit UPd and unstable units Co and LPd is given by the dashed white line. The extent of the cross-section is reported in (a) by the segment [X1,X2].
Our objective is to quantify the volume that could still collapse from the Samperre cliff in the coming decades. To that end, we need to analyze the geology of the cliff and infer the geometry of geological units. As fieldwork is too dangerous and because no geophysical data are available, we must rely on remote observations and topographic surveys only.
3.1 Data
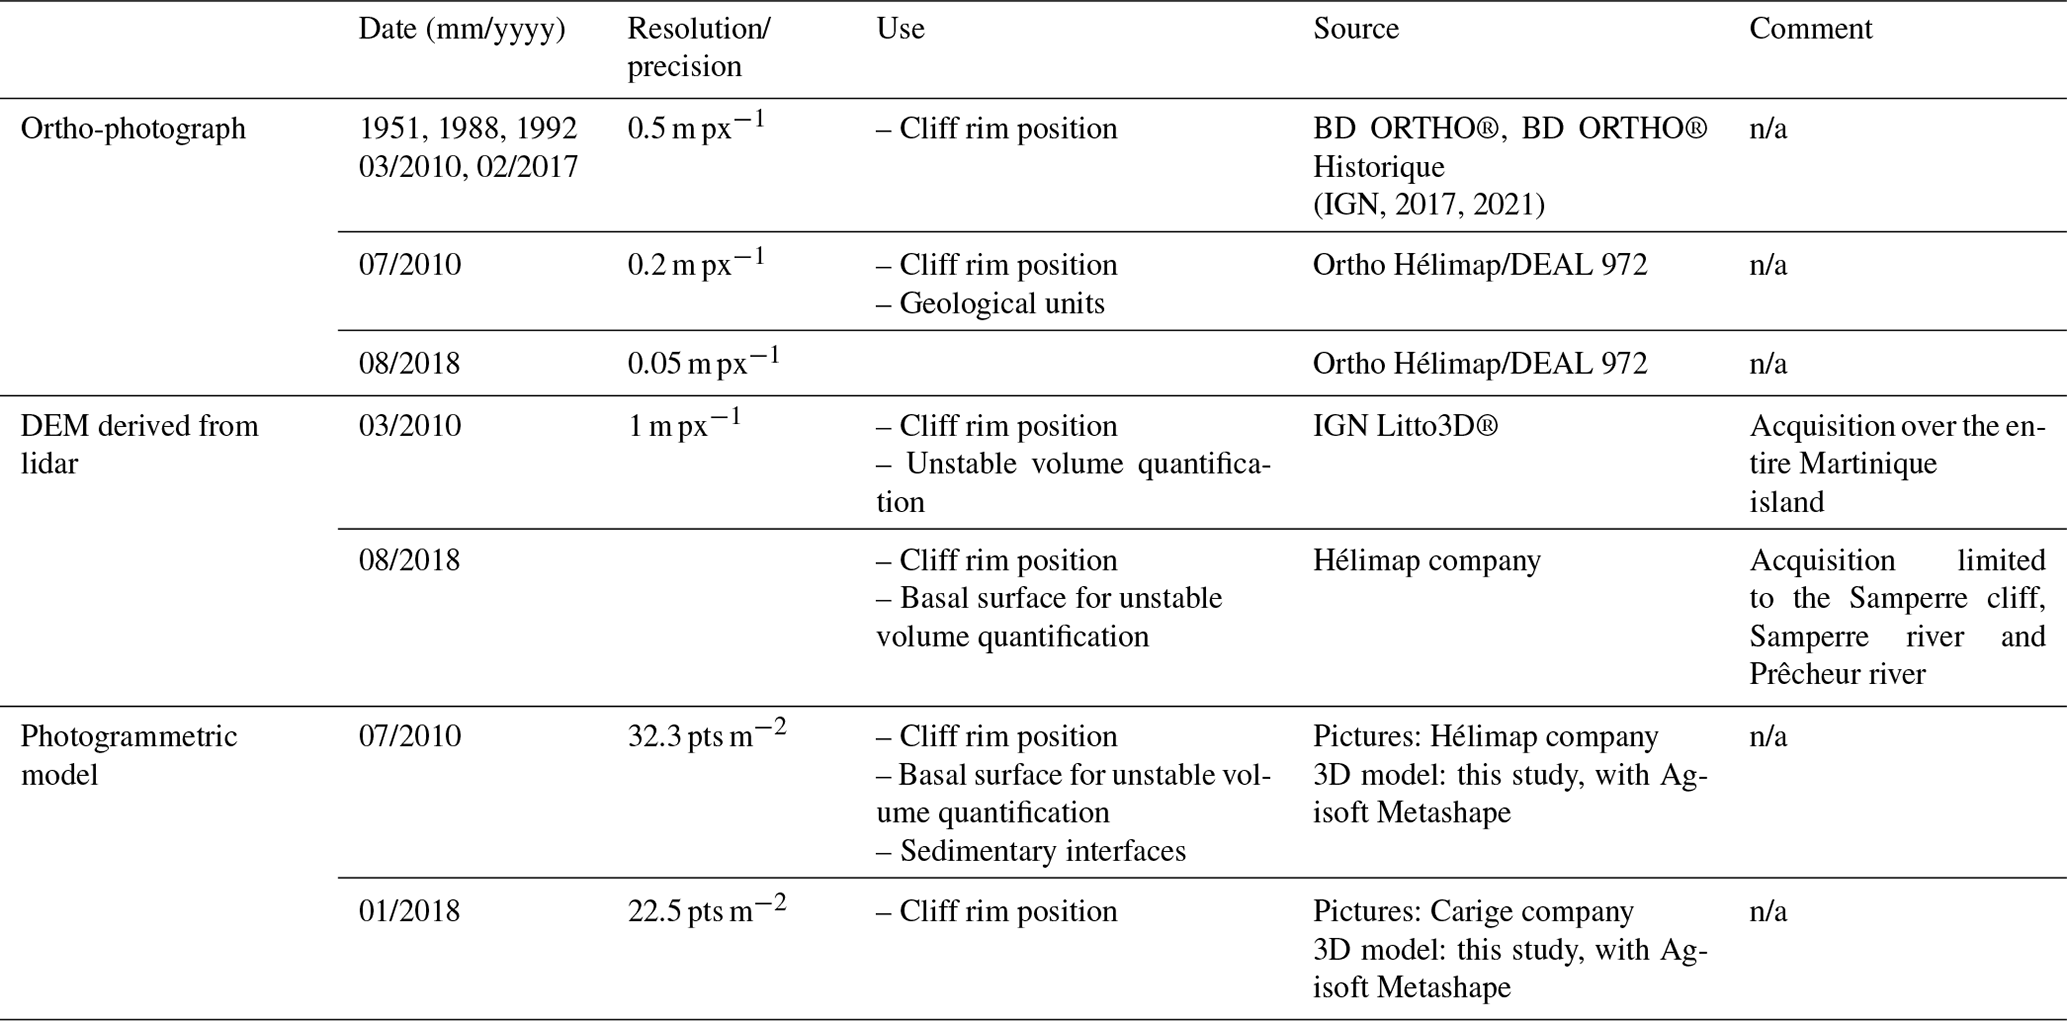
Over the past decades, and in particular since the first documented collapse sequence in 1980, numerous oblique aerial pictures taken during helicopter surveillance flights have documented the evolution of the cliff. We use them along with georeferenced ortho-photographs. The oldest available ortho-photographs date back to 1951 (IGN, 2017, 2021). Six other ortho-photographs are then available for the 1988–2018 period. The date and details of acquisitions are given in Table 1. The comparison between successive photographs document the plan-view recession of the cliff and its geology (Fig. 2). We analyze in detail the August 2018 ortho-photograph to identify visually the different geological units composing the Samperre cliff from color or texture variations.
Several DEMs and 3D point clouds are also available, derived from lidar or photogrammetric acquisitions between March 2010 and August 2018 (see Table 1). They are used to characterize the geometry of identified geological units by means of the CloudCompare software (CloudCompare, 2020). We characterize (i) deposition horizons identified by sharp color contrasts, (ii) interfaces between units inferred from slope breaks and (iii) the surface of outcrops.
(IGN, 2017, 2021)Table 1Ortho-photographs and topographic surveys. n/a: not applicable.
3.2 Geometric characterization of geological layers
We do not use the August 2018 ortho-photograph to characterize deposition horizons because the Samperre cliff displays steep and even overhanging topographic features. Instead, we work directly on textured 3D point clouds that allow a better characterization of geometric features (e.g., Pavlis and Mason, 2017; Buckley et al., 2019). The horizons are thus identified on the July 2010 photogrammetric 3D point cloud (Fig. 3). This point cloud has the best resolution compared to other point clouds of the area (on average, 32 pts m−2 (points per square meter) on the cliff). Horizons are picked in CloudCompare (CloudCompare, 2020) with the Compass plug-in (Thiele et al., 2017). This plug-in automatically interpolates paths between manually picked points with a least-cost-path solver, using a cost function chosen by the user. As deposition horizons are identified by color change, we choose a cost function that depends on a RGB (red green blue) color gradient: the resulting path is chosen such that it follows strong RGB gradients. We pick horizons that are first identified by visual inspection of the point cloud (Fig. 3a). Compass is also used to pick interfaces marked by a slope break: in this case, the cost function depends on the point cloud local curvature.
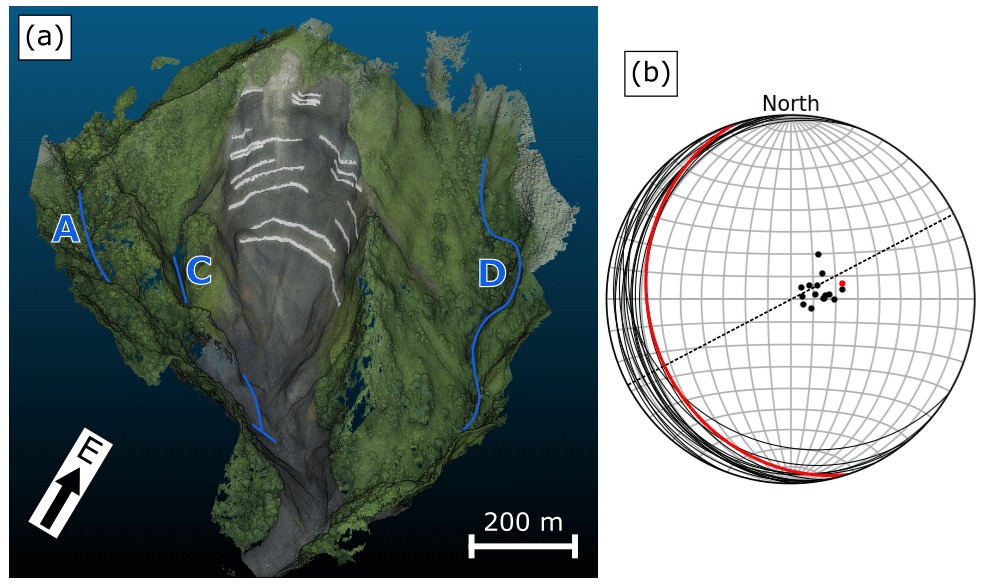
Figure 3Deposition horizon orientation. (a) July 2010 photogrammetric 3D model, with deposition horizons (white lines). Ravines are highlighted by blue lines with their name, as in Fig. 1. (b) Wolff stereonet projection of deposition horizons (black lines), with corresponding poles (black dots). The contact S0 between LPd and UPd is also given in red. The dashed black line gives the cliff retreat direction (azimuth 062∘ N, white line in Fig. 2)
To assess the dip and dip direction of the deposition horizons and interfaces, we sample points along the picked polylines (10 pts m−1). The resulting point cloud is then fitted by a plane. The quality of the fit is given by the root mean square (RMS) of the distances from the points to the best-fit plane. Following Fernández (2005), we also compute two indicators, M and K (see Appendix A for computation details). Fernández (2005) suggests that M > 4 indicates a good fit between the plane and the point cloud and that K < 0.8 indicates a correct estimation of the plane orientation. Sampling bias results in an estimation uncertainty for dip and dip direction. We quantify this uncertainty by computing the 100-times-bootstrapped standard deviation of dip and dip direction (see Appendix A for details). The same methodology is used to estimate the dip and dip orientation of outcrop surfaces extracted from point clouds.
3.3 Unstable volume quantification
The identification of the different geological units, the characterization of their geometry and their evolution since 1950 document the progressive unearthing of interfaces limiting the basal and lateral surface of successive destabilization episodes. Thus, we can differentiate between geological units affected by destabilizations and geological units that have remained stable. These observations are used to reconstruct the paleo-morphology of the site and infer a stable basal surface above which materials are unstable.
This basal surface is composed of (i) outcrop surfaces of geological units considered stable (approximated by planes, as described in the previous section) and (ii) planes fitted manually in CloudCompare to topographic features that have remained stable since 1951. The potentially unstable volume is then defined as the rock mass contained between this basal surface and the topography (August 2018 DEM for the cliff, March 2010 DEM elsewhere). Given the 1 m horizontal accuracy of the DEM, we consider only height differences of more than 1 m in an area above the contact between the stable and unstable geological units.
The computed rock mass volume is dependent upon the different modeled planar units. To estimate volume variations caused by sampling bias, we randomly resample 100 times the outcrop surfaces of stable geological units and derive the associated best-fit planes and resulting basal surface. Then, we compute the bootstrapped standard deviation of the potential unstable volume.
In this section (i) we describe geological units composing the Samperre cliff, (ii) we characterize the relative stability of each unit, (iii) we reconstruct the paleo-morphology of the site, and (iv) we use these results to reconstruct the possible surface envelope of an unstable mass and compute the corresponding volume.
4.1 Geological description of the cliff
The different geological units composing the Samperre cliff (Fig. 4) have been progressively exposed by successive destabilization episodes. In the following we describe the successive layers from top to bottom.
The topmost layer of the cliff is composed of brown to light brown, probably weathered materials (unit Pu, yellow patch in Fig. 4c). It was exposed in 2010 as a 20 to 30 m thick layer (Fig. 5a), as mentioned by Mathon and Barras (2010) and Clouard et al. (2013). The 2018 destabilizations removed most of this geological unit. By March 2018, the corresponding layer at the cliff head was only about 10 m thick (Fig. 5b and c).
Below unit Pu, a massive, light gray to light brown, 50 m thick layer was exposed in 2018 to the east and south of the cliff (unit La, orange patch in Fig. 4c). This layer displays clear vertical prismatic patterns (Fig. 5b and c). We associate these patterns with columnar jointing of tuffs (Lim et al., 2015; Hamada and Toramaru, 2020) rather than to a lava flow because no recent lava flow has been identified in this sector in previous studies (Boudon and Balcone-Boissard, 2021).
Most of the cliff below units Pu and La is formed by a 100 to 200 m succession of greyish materials (unit UPd, pink patch in Fig. 4c). The interface between successive deposits can be clearly identified by color changes, from light to dark gray (Fig. 3a). The deposits show significant variability in thickness and grain size distribution, with blocks several meters wide. We interpret unit Upd as pyroclastic deposits. On the July 2010 photogrammetric model, we approximate the deposition horizons by planes (Fig. 3b), with a mean dip of 16∘ and dip direction of 254∘ N (see Table A1). This is, to within 15∘, the opposite direction of cliff retreat since 1950 (062∘ N, dashed black line in Fig. 3b).
The bottom part of the cliff is composed, in its northwest side, of a characteristic ocher unit (unit Co in Fig. 4c, dark blue patch). Unit Co was initially unearthed in July 2010 (Fig. 5a, surface S1 in Fig. 4). Following the destabilizations of 2018, the initial outcrop extended northeastward (Fig. 5c and d, surface S2 in Fig. 4). The outcrop surfaces S1 and S2 have, respectively, dip angles of 47 and 42∘ and dip directions of 308∘ and 252∘ N. Both surfaces do not correspond to any known tectonic fault. The transition between units Co and UPd is marked by a clear slope break (see Fig. 4b and c) and water seepages (Fig. 5c and d). Another ocher outcrop can be observed on the western side of ravine A, at the bottom of Piton Marcel. Because unit Co has a distinctive ocher color and seems more consolidated and impermeable, we interpret it as old hydrothermalized volcanic materials (e.g., Salaün et al., 2011). As the northern extremity of the Prêcheur collapse scar is located only a few hundred meters away from unit Co, we make the hypothesis that the surface of unit Co is associated with the Prêcheur flank collapse. It could be either the collapse scar itself or the surface of a mega-block that slid and stopped in the vicinity of the source area (Fig. 6a). In this perspective, unit Co corresponds to eruptive materials emplaced during the first building stage of the Montagne Pelée Volcanic Complex.
On the opposite side of the cliff, to the southeast, unit UPd lies on top of another succession of light gray deposits, which we interpret as pyroclastic deposits, with no evidence of destabilizations or erosion since 2010. This unit, which we call the lower pyroclastic unit LPd (mauve patch in Fig. 4c), may have been already visible in 2010 in the southeast part of the cliff but was more obviously visible after the 2018 destabilizations (Fig. 5c and d). The visible outcrop of LPd (surface S3 in Fig. 4) is roughly planar, with a dip angle of 47∘ and dip direction of 308∘ N, which does not correspond to any known tectonic fault. No deposition horizon could be clearly identified. As for unit Co, the transition between UPd and LPd units is marked by a clear slope break (see Fig. 4b and c, dashed black line), accompanied by several water seepages. Another clear slope break can be observed on the other side of the cliff in the adjacent valley (ravine D). If we consider the areas at the junction between units LPd and UPd (i.e., dashed black lines in Fig. 4b and c), both slope breaks are roughly coplanar, and the associated plane S0 has a dip angle of 24∘ and dip direction of 252∘ N. This is consistent with horizons measured in unit UPd (compare red and black points in Fig. 3).
Absolute dating is difficult without rock samples, as the Samperre cliff area is unsafe to wander through. Following our assumption that unit Co is associated with the first building stage of the Montagne Pelée Volcanic Complex phase, it may be at least 127 kyr old. Pyroclastic deposits within the collapse scar (unit LPd) are more recent and could have been emplaced in between the Prêcheur flank collapse (127 ka) and the Rivière Sèche collapse (36 ka), as suggested by the geological map of Westercamp et al. (1989) and the interpretation of Boudon and Balcone-Boissard (2021). The upper pyroclastic deposit unit UPd would then correspond to the eruptive phase characterized by scoriaceous, low-silica, andesitic products and be associated with pyroclastic density currents (36–25 ka) and/or with the subsequent eruptive phase (25 ka–present) when dome-forming and Plinian eruptions predominated (Boudon and Balcone-Boissard, 2021). The tuff unit La cannot be dated but was probably emplaced by the fallout of 1 of the 17 Plinian to sub-Plinian eruptions reported by Boudon and Balcone-Boissard (2021) between 25 ka and the present time. Mathon and Barras (2010) and Clouard et al. (2013) interpret unit Pu as pumices of the most recent Plinian eruption, P1, that occurred in 1348 ± 50 CE (Boudon and Balcone-Boissard, 2021). This date is consistent with that of Nachbaur et al. (2019), who dated pumice deposits on the edge of the Prêcheur river ravine, about 1.5 km to the west, at 1285 ± 25 CE. However, it is possible that the unit Pu also contains deposits of previous Plinian eruptions and in particular P3 (113 ± 85 CE). This powerful eruption (1 km3 of magma dense rock equivalent) affected the entire flanks of Mount Pelée, and to the west of the summit, the associated deposits often lie below the P1 deposits (Carazzo et al., 2012, 2020).

Figure 4Geological interpretation of the Samperre cliff. (a) August 2018 orthophotograph (Hélimap/DEAL 972), with contours of identified geological units. (b) Slopes of the August 2018 DEM, completed with July 2010 DEM, with contours of identified geological units. (c) August 2018 DEM, completed with July 2010 DEM. Colored patches correspond to geological units: Co, LPd, UPd, La and Pu (see main text for details). Hatched areas identify some of the surfaces used to construct a potential unstable volume (see Sect. 4.4). The contact between LPd and UPd units, inferred from slope breaks, is given in (b) and (c) by the dashed black lines. Ravines and rivers are also displayed, as in Fig. 1.
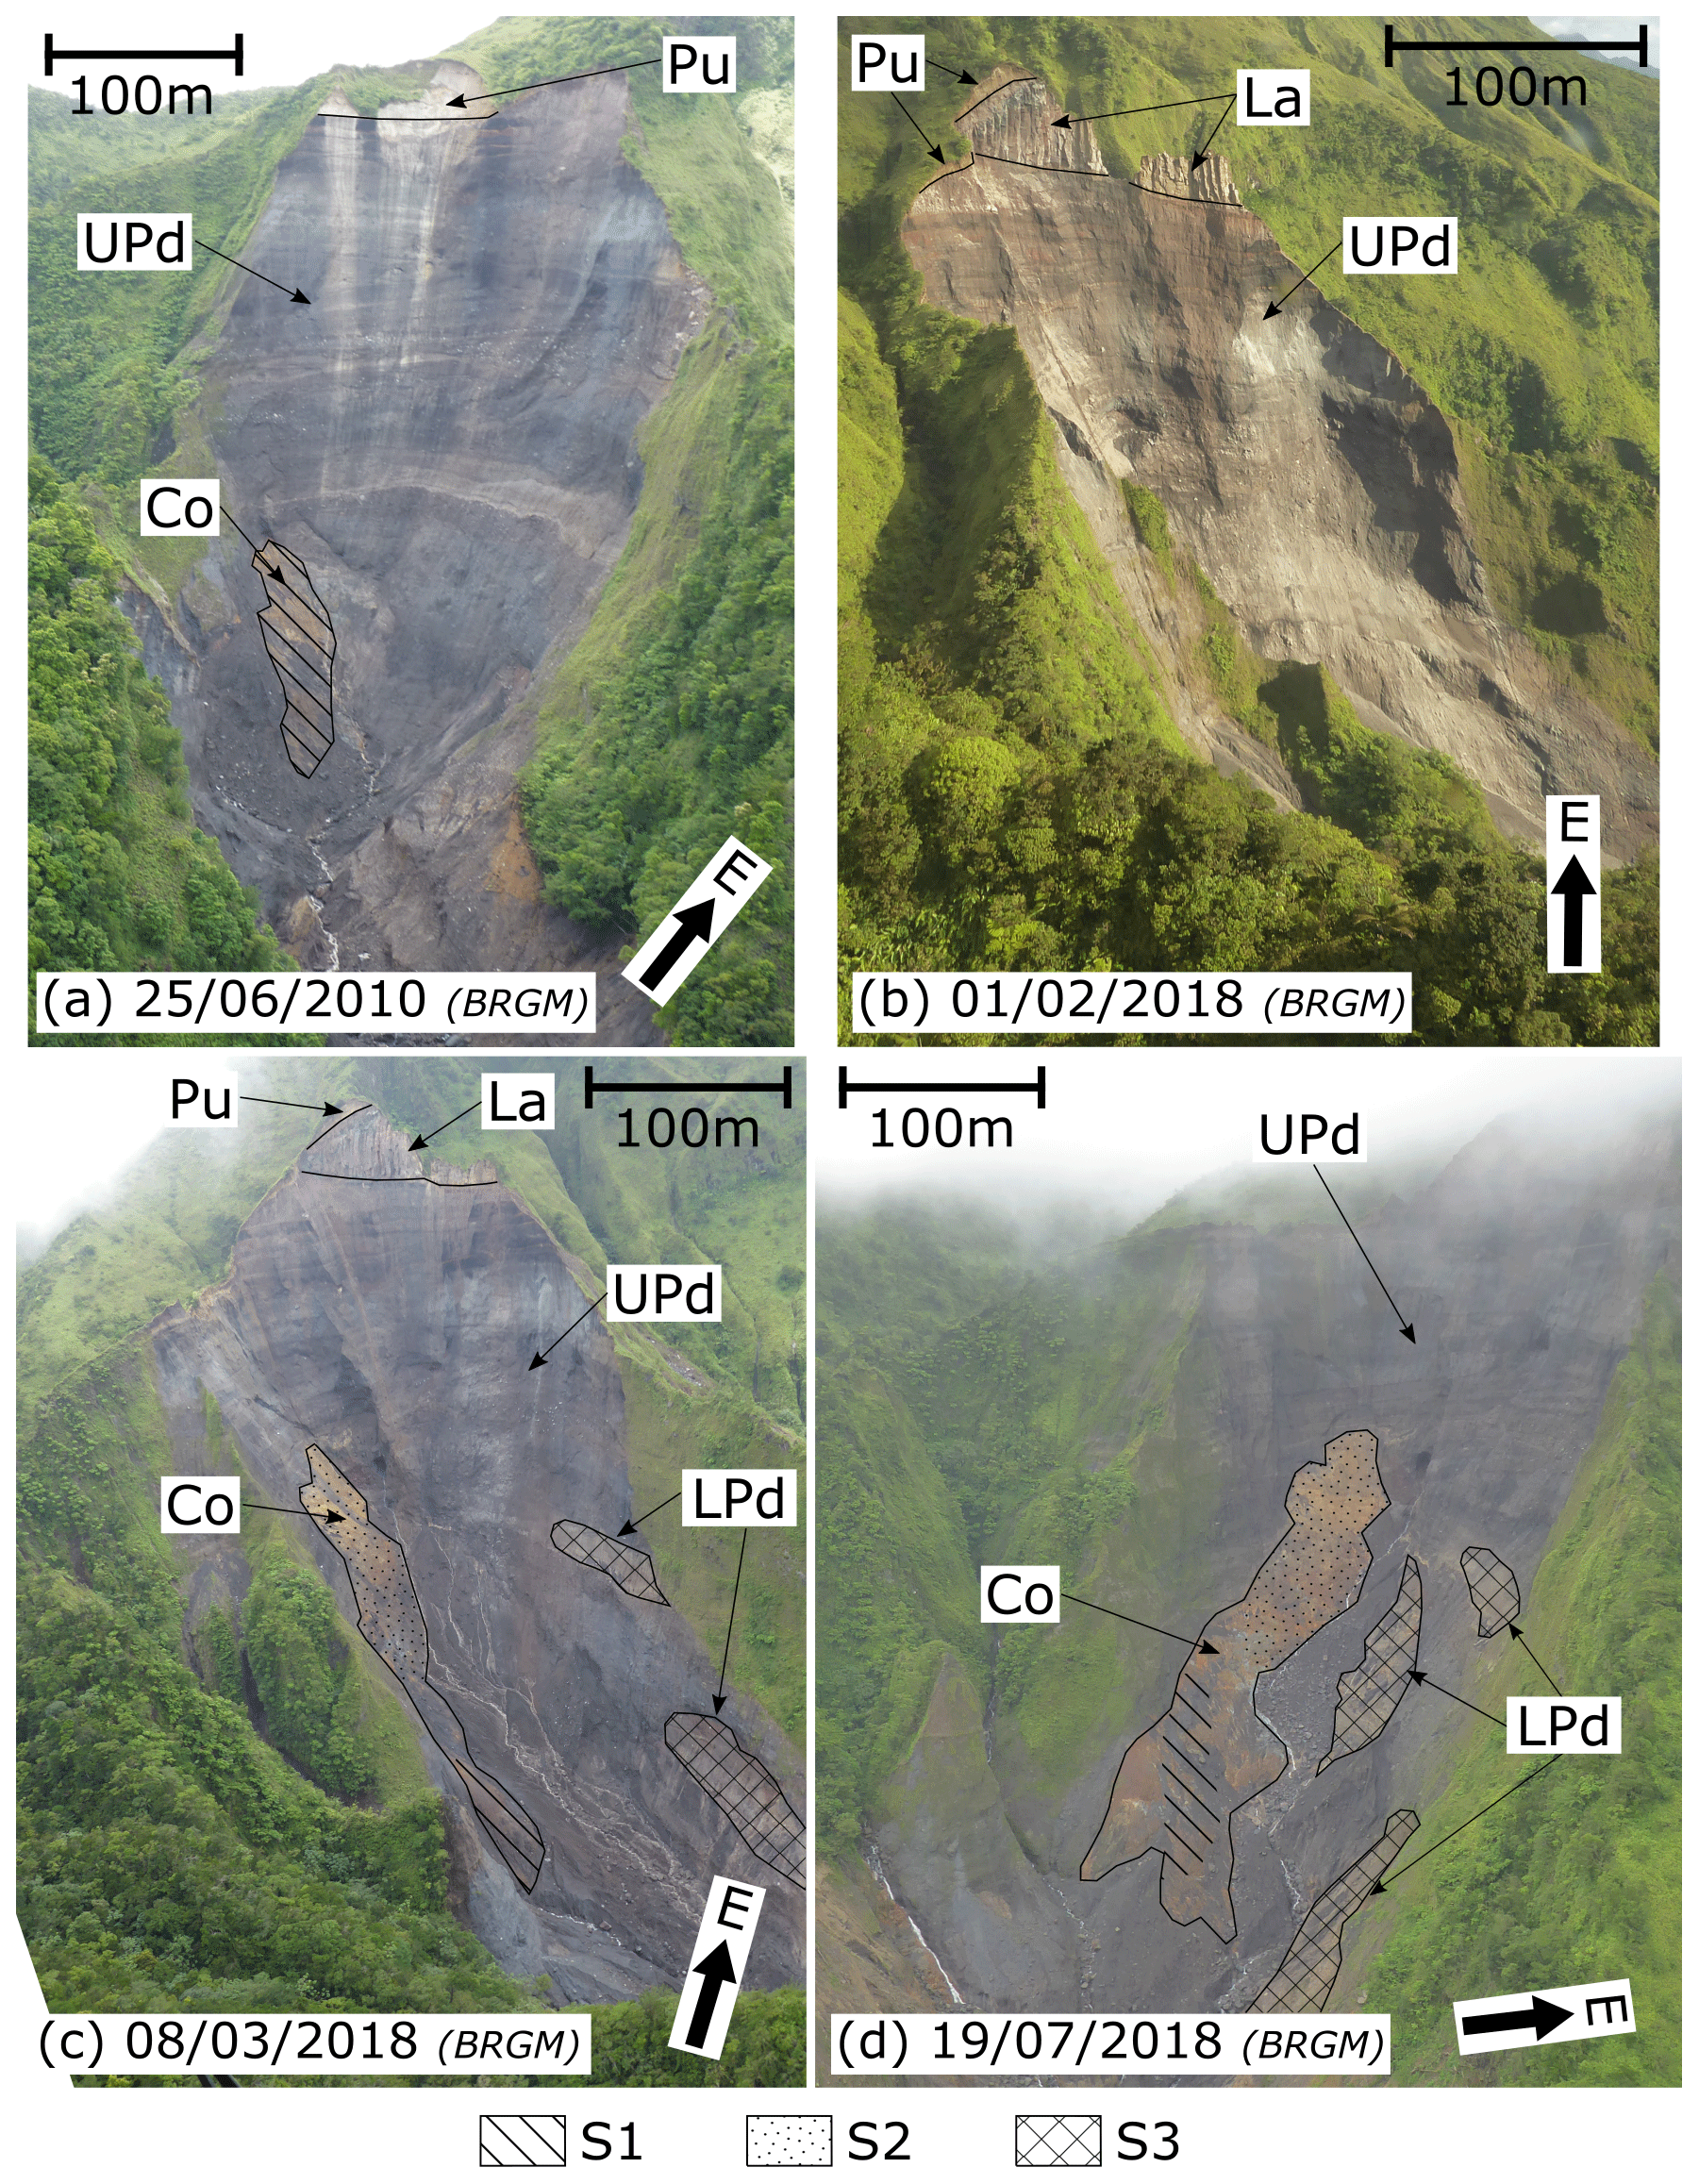
Figure 5Aerial photographs of the Samperre cliff on (a) 25 June 2010, (b) 2 January 2018, (c) 8 March 2018 and (d) 2 July 2018. The east direction is given by the arrow, the scale is given for the cliff rim. Outcrops of visible geological units are highlighted. Raw pictures (along with additional pictures) are given in the Supplement.
4.2 Relative stability of geological units
From successive ortho-photographs and topographic surveys (Fig. 2), as well as aerial photographs (e.g., Fig. 5a and b), it is clear that the upper geological units Pu, La and UPd are involved in the main destabilization episodes. Thus, we conclude they are unstable. Following NGU (2012), the presence of water seepage at the base of unit UPd also favors its instability.
Units Co and LPd were previously covered by unit UPd. Successive destabilizations have increased the surface of the outcrops. These outcrops do not display any clear collapse scar. They have remained relatively intact since they were exposed (e.g., compare outcrop of unit Co in Fig. 5a and c). This suggests units Co and LPd are more resistant than unit UPd. This stability is further confirmed by water resurgences at the base of unit UPd, which indicates that the stability of units Co and LPd is less affected by increased pore pressures.
Thus, we make the hypothesis that units Co and LPd are more stable than unit UPd, given the current morphology of the cliff. From this assumption we deduce that the outcrop surfaces S1 and S2 correspond to the formerly hidden interface between units Co and UPd (see Figs. 6 and 7). Similarly, we deduce that the outcrop surface S3 corresponds to the formerly hidden interface between units LPd and UPd.
4.3 Paleo-morphology
From the geological and geometric observations described above we propose a scenario of the evolution of the catchment geomorphology, with successive construction and dismantling phases (Fig. 6).
Following the interpretation of Solaro et al. (2020), the Prêcheur flank collapse that occurred 127 kyr ago is the oldest event that can be related to the current morphology of the Samperre cliff. This major dismantling event was followed by a construction phase, when the accommodation space left by the collapse was progressively filled with new pyroclastic deposits (unit LPd, Fig. 6a). Its surface may be given by the current interface between units LPd and UPd (surface S0).
A new dismantling phase then started (Fig. 6b). It may have been initiated by the Rivière Sèche flank collapse 36 kyr ago: this collapse did not affect the Samperre cliff area but the resulting scar concentrated newly emitted volcanic materials. Thus, unit LPd was progressively eroded. We suggest erosion was mainly caused by a preferential flow path along the Prêcheur collapse structure and thus along unit Co. It led to the formation of a valley in a west-southwest–east-northeast direction (062∘ N, Fig. 6b). The northwest flank of the paleo-valley is given by surfaces S1 and S2 of unit Co and the southeast flank by surface S3 of unit LPd.
The emplacement of pyroclastic deposits from unit UPd corresponds to a new construction phase, when pyroclastic materials started filling the paleo-valley (Fig. 6c). Because deposition was geometrically constrained by the valley, successive deposition horizons from unit UPd have dip directions similar to those of the paleo-valley. The starting time of the filling of the paleo-valley is difficult to constrain without further dating data. Considering the fact that the previous dismantling phase started after the Rivière Sèche flank collapse 36 kyr ago (see above), the filling of the paleo-valley is also posterior to that event. It may have ended when Montagne Pelée's eruption style changed 25 kyr ago (Boudon and Balcone-Boissard, 2021).
Then, a new, still ongoing erosion phase started. As a result of permeability contrast between basal units Co and LPd and the upper unit UPd, underground water flowed preferentially at the interface between these units, that is, along the paleo-valley surface (as evidenced today by water seepages). It resulted in the progressive drainage of the paleo-valley by weakening the base of unit UPd and thus favoring destabilizations. This process eventually led to the formation of the Samperre cliff (Fig. 6d). It progressively retreated in the same direction as the paleo-valley. However, the erosion phase certainly started long before the known historical destabilizations, possibly as soon as the northwest flank of Montagne Pelée was no longer fed by eruptive materials.
As of 2022, this erosion phase is still an ongoing process. Thus, we suggest that the volumes that could be involved in future rock avalanches are constrained by the volume of materials filling the paleo-valley. To quantify this volume, we reconstruct the surface of the paleo-valley that we believe is more stable.
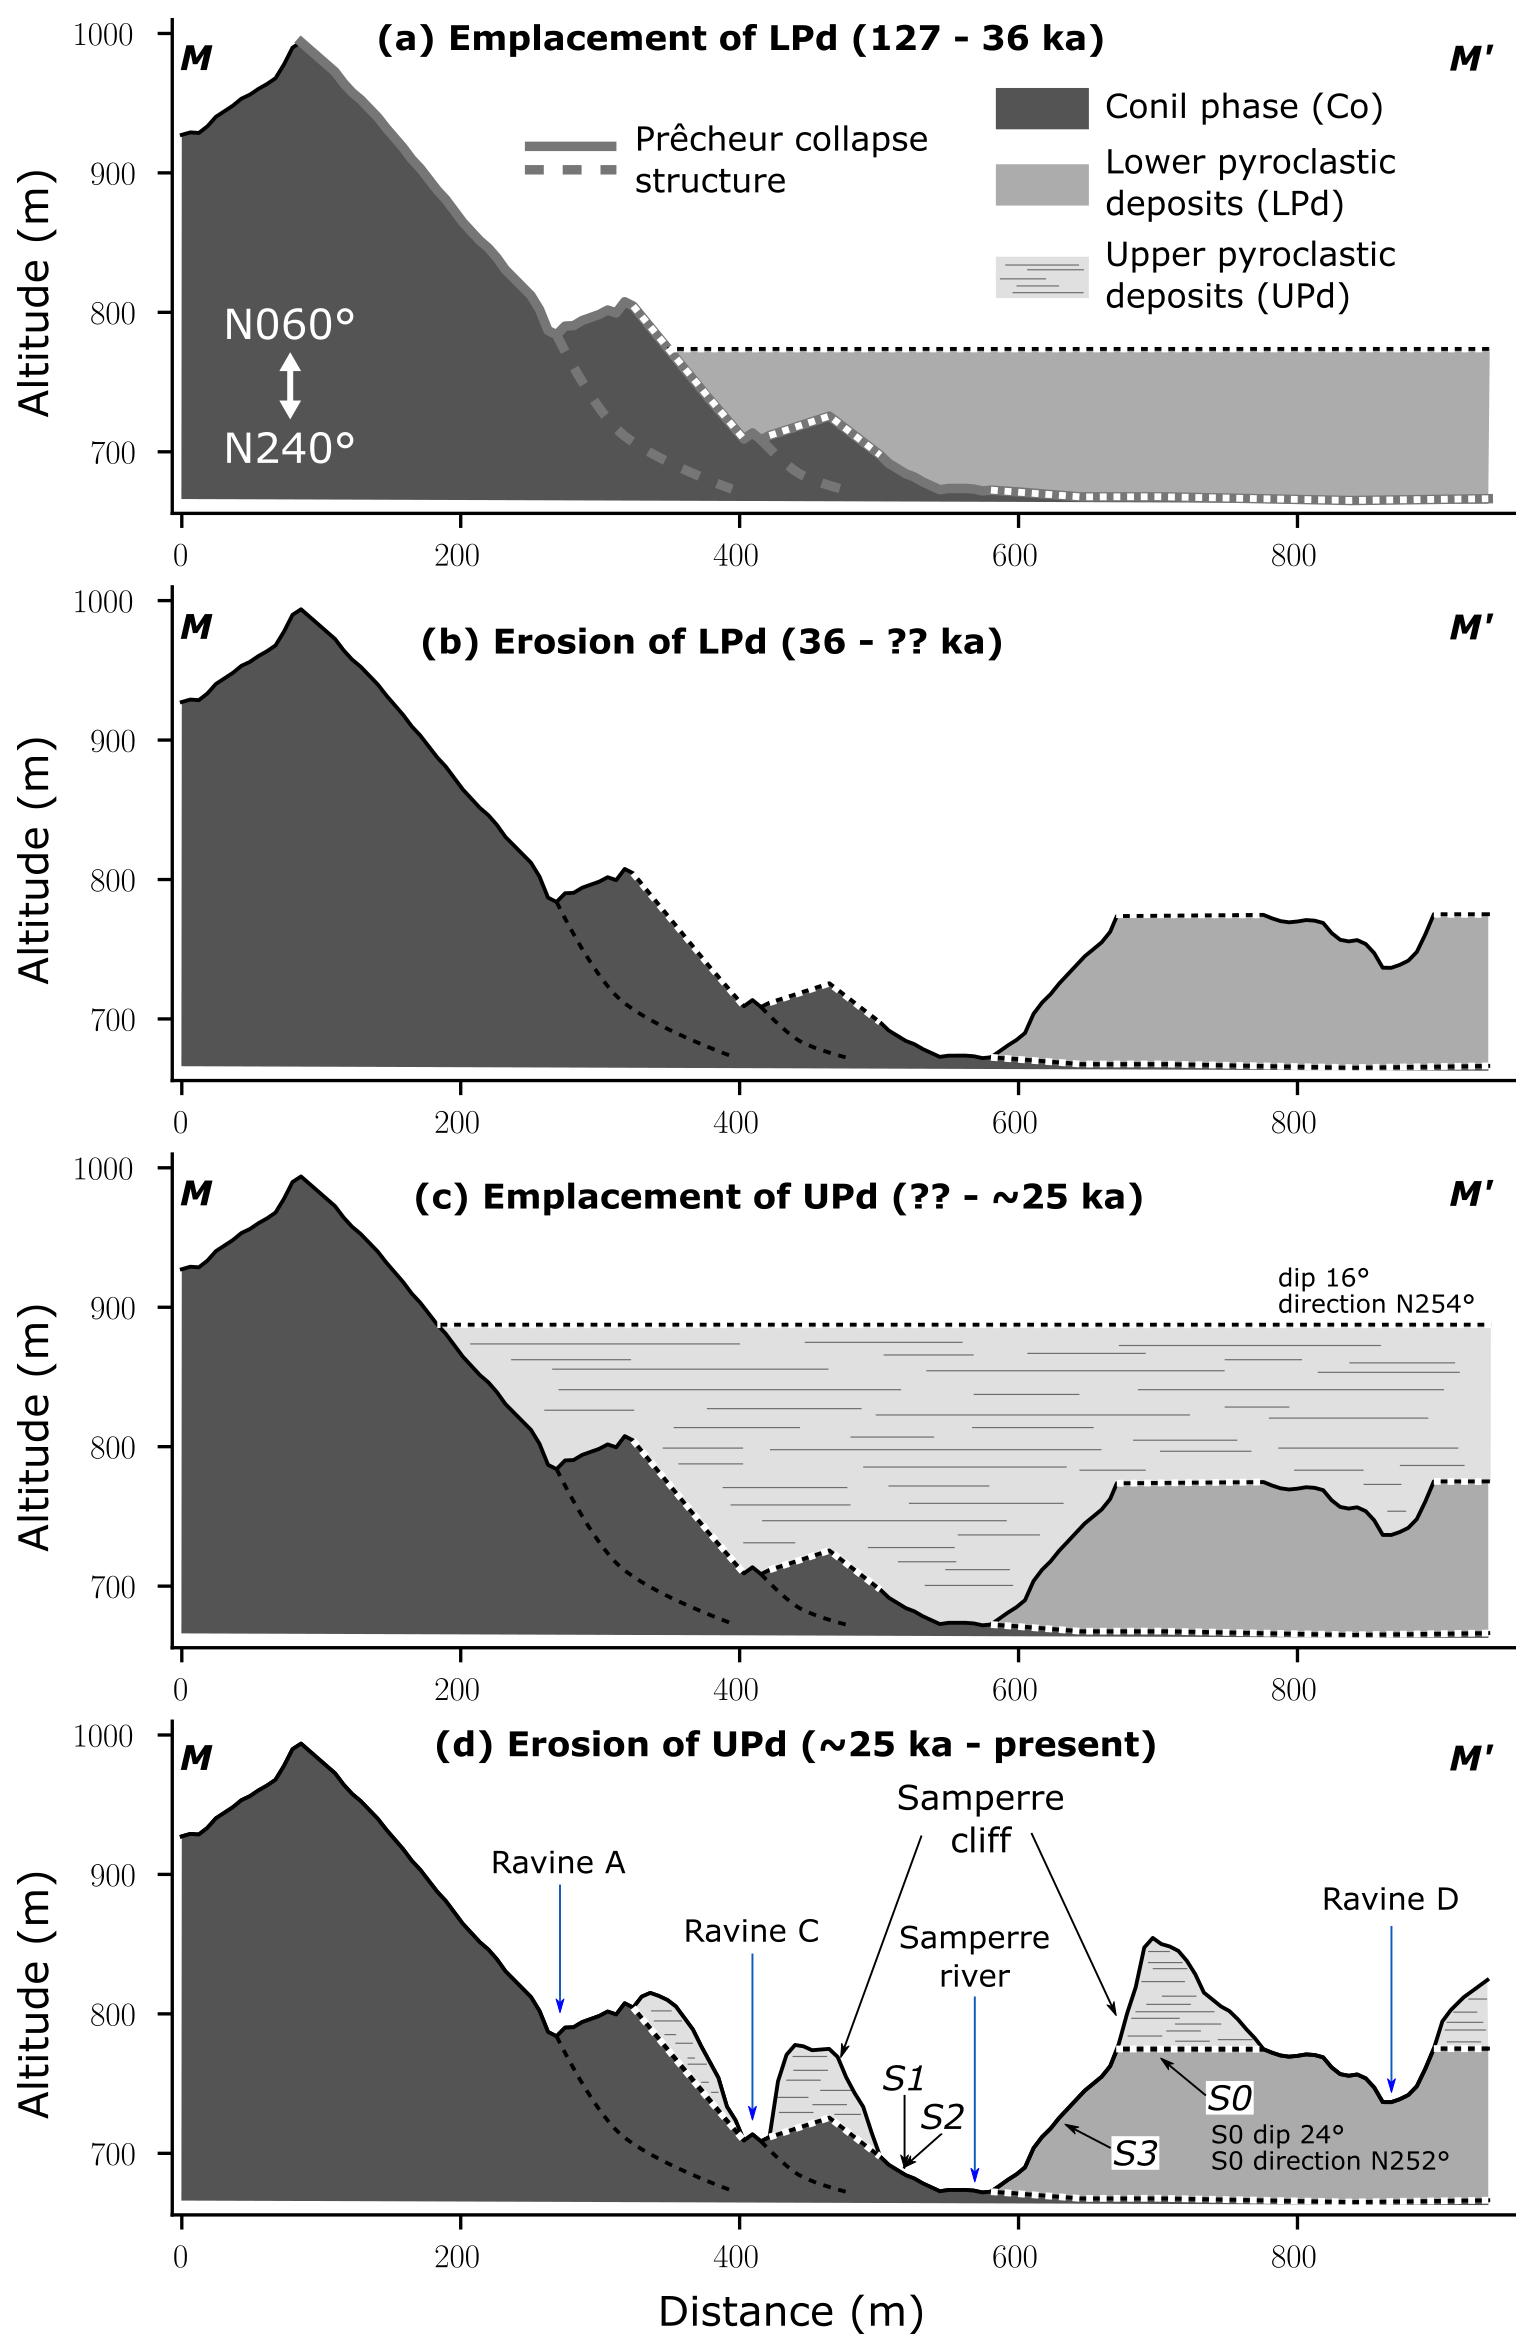
Figure 6Conceptual view of the evolution of the paleo-morphology of the Samperre cliff, along a northwest (left) to southeast (right) cross-section (MM' in Fig. 1b). The figure is facing the northeast direction (60∘ N). (a) Emplacement of unit LPd within the Prêcheur collapse scar. The horizontal lines display deposition horizons, whose dip and dip direction are indicated. (b) Erosion of unit LPd, resulting in a paleo-valley at the location of the actual Samperre cliff. (c) Emplacement of unit UPd. (d) Erosion of unit UPd, resulting in the formation of the Samperre cliff and adjacent ravines. Black lines correspond to the topography given by the August 2018 DEM. Dashed white lines are interpretations of old topographies and contact between geological units. See Fig. 1c for the position of ravines.
4.4 Assessment of unstable volume
The geometry of the paleo-valley is reconstructed by extrapolating outcropping surfaces of stable units and surfaces fitted to stable topographic features (see Sect. 3.3 for methodological details). These surfaces are displayed in Fig. 7a, and their characteristics are given in Table 2.
The northwest (southeast) side of the paleo-valley is constrained by the surfaces S1 and S2 (S3) of unit Co (unit LPd). We also fit manually a planar surface S4 to the northwest wall of ravine B, in the continuation of which we identified another outcrop of unit Co (see Fig. 4c). Similarly, we fit a planar surface S5 following the southern ridge of Samperre cliff that has remained stable since at least 1988. Finally, we assume that the bottom of the paleo-valley matches the current bed of the Samperre river (surface S6).
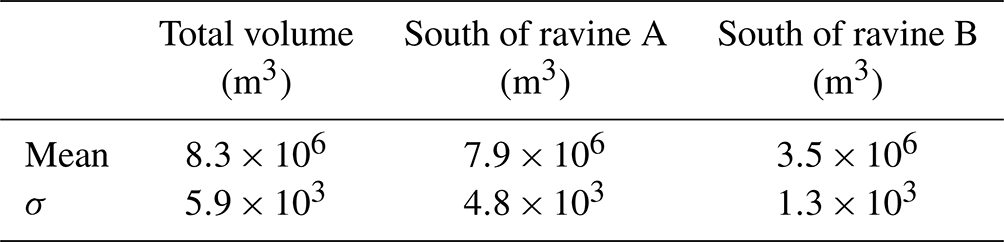
The resulting basal surface envelope is represented in Fig. 7b. The height difference between the basal surface and the 2018 topography is displayed in Fig. 8. The corresponding volume is about 8.3×10⁶ m6. The uncertainty associated with least square plane fitting (but not to manual plane fitting) amounts to less than 1 % of the estimated volume and is thus negligible (see Table 3).
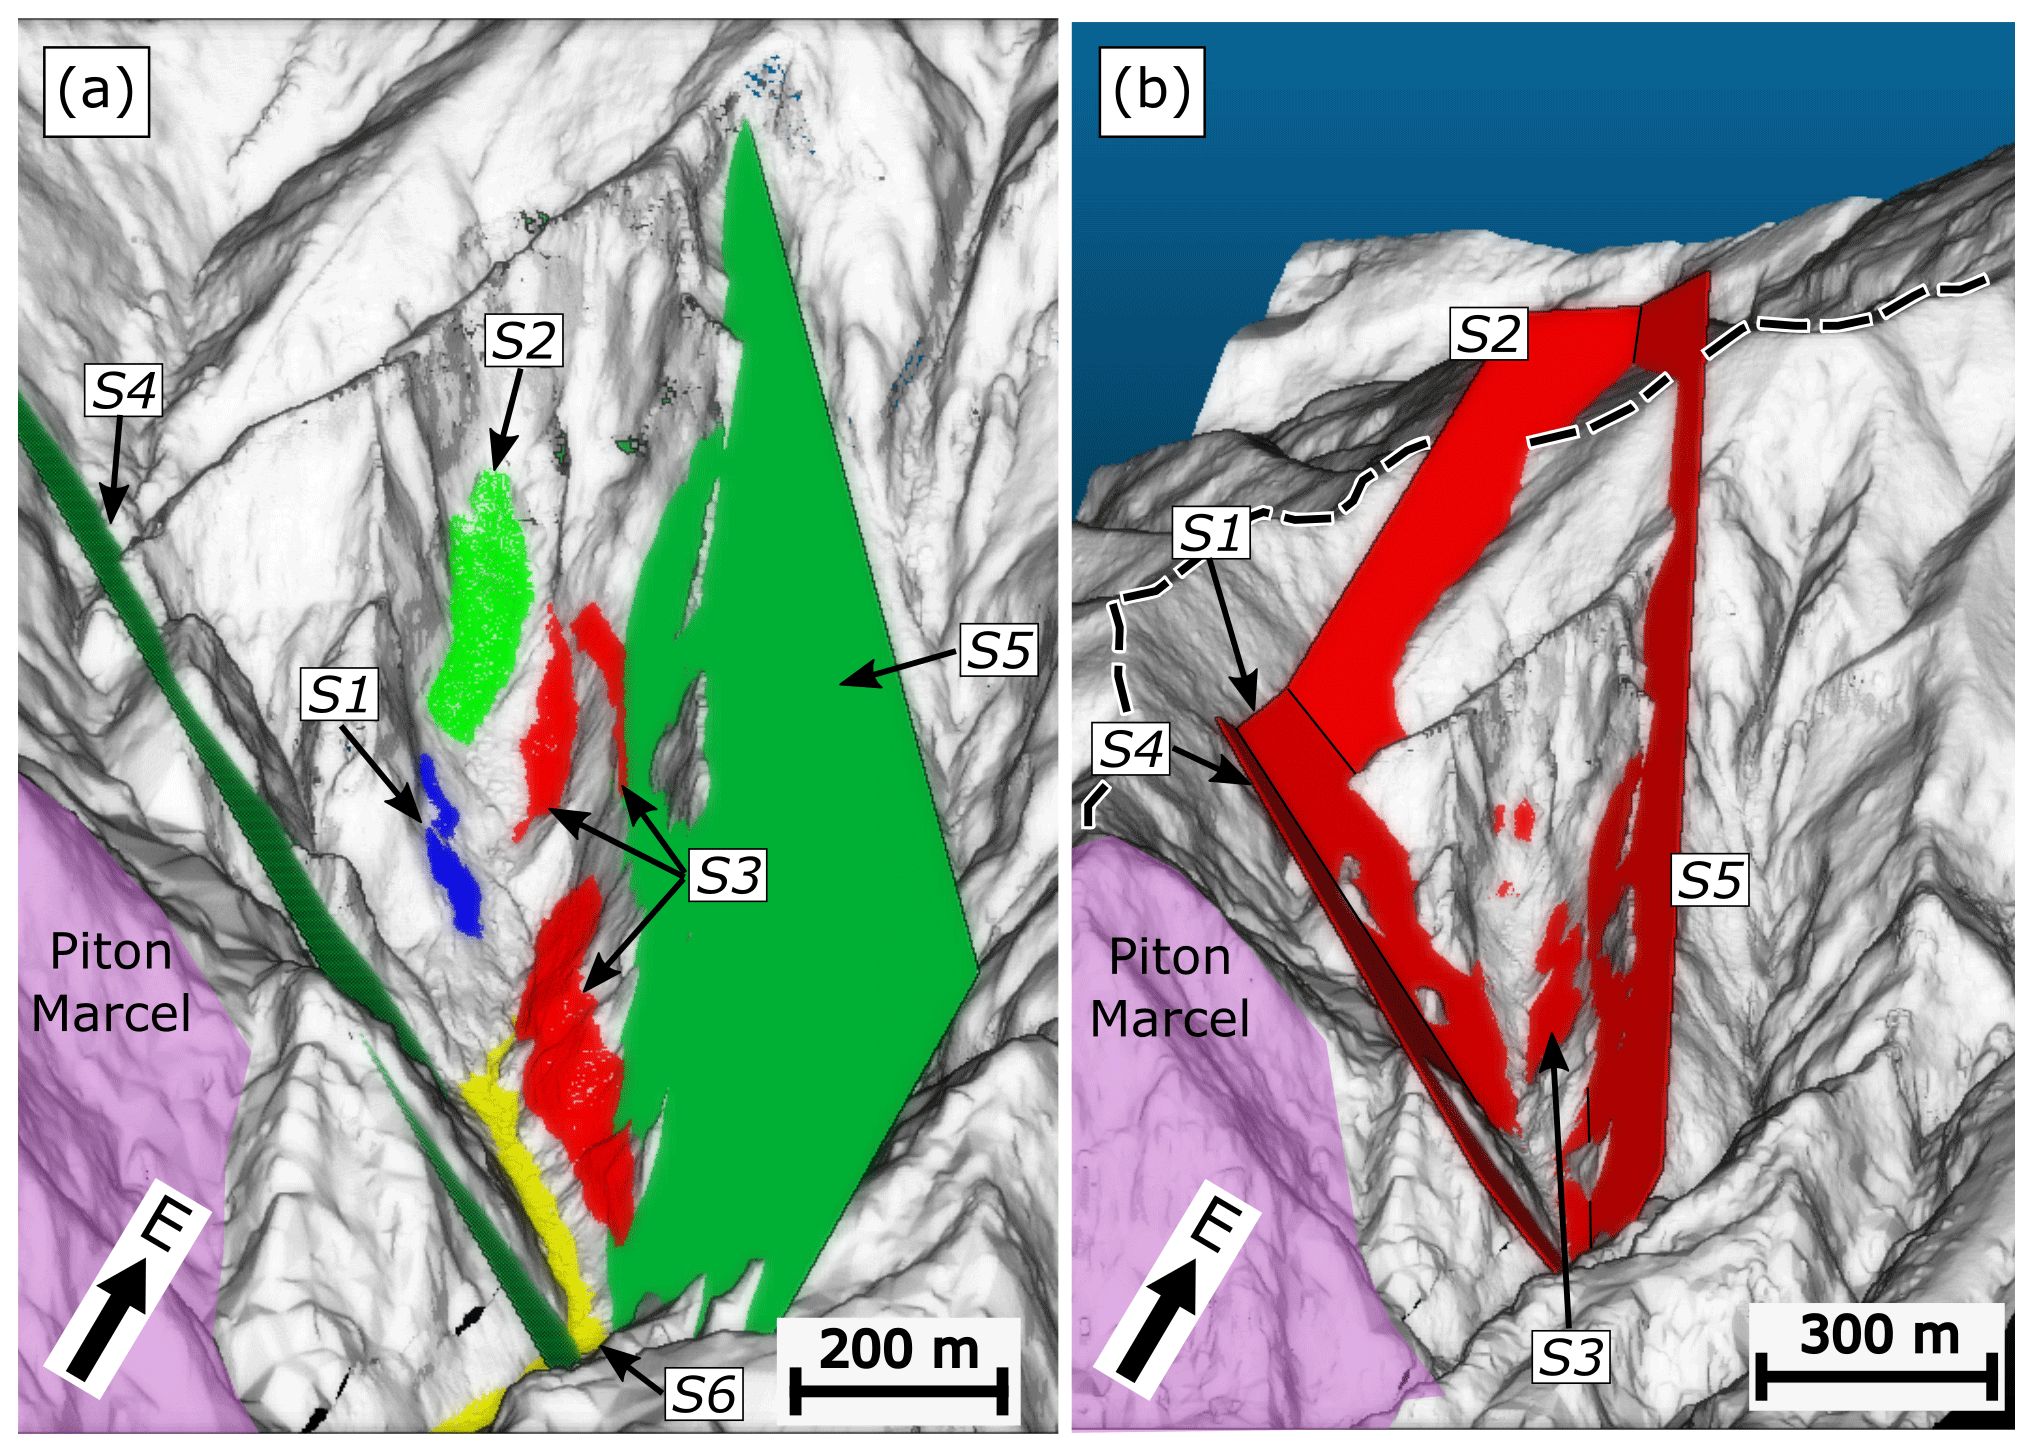
Figure 7Construction of potential basal surface for unstable volume quantification. (a) Surfaces used to define the basal surface. S1 to S4 are point clouds extracted from DEMs, and S5 and S6 are planes manually fitted to topographic trends (see Table 2). (b) Basal surface (red planes), constructed by extending and combining planes fitted to S1, S2, S3 and S4, as well as planes S5 and S6. The Piton Marcel is highlighted by the purple patch. The dashed black line is the Prêcheur destabilization structure.
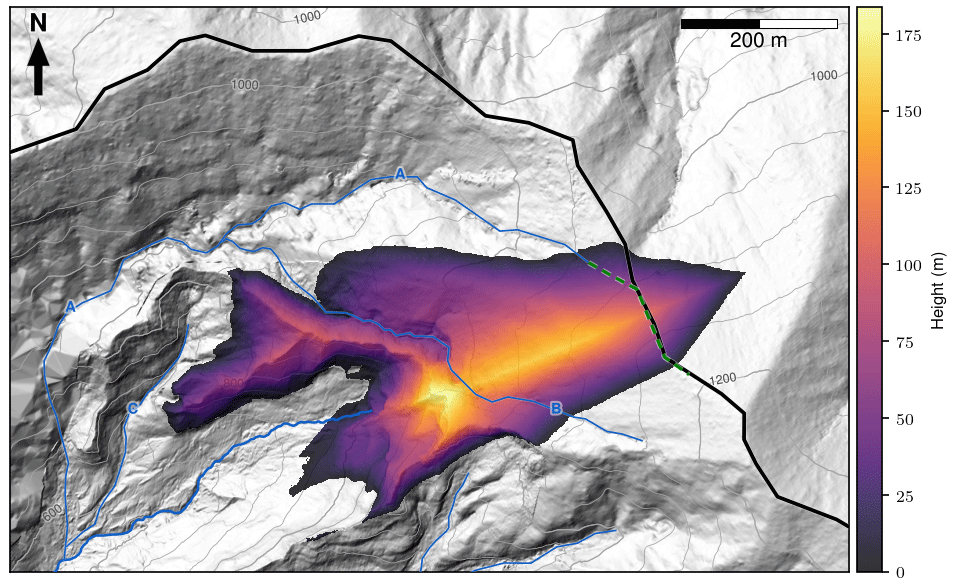
Figure 8Potentially unstable volume. The height between the reconstructed basal surface (see Fig. 7b) and the combined July 2010–August 2018 DEM (displayed here) is given by the color scale. We only display heights above the contact between D and UPd units, as well as LPd and Upd units, and disregard heights below 1 m. The Samperre river (thick blue line), ravines (thin blue lines) and the Prêcheur destabilization structure (black line) are displayed as in Fig. 1. The unstable volume is computed either directly or by limiting the extent of the collapse (i) to ravine A continued along a topographic edge (dashed green line) or (ii) to ravine B (see Table 3).
Table 2Surfaces used for quantifying a potential unstable volume, with characteristics of the associated best-fit planes. σ is the standard deviation of estimated dip and dip directions. See Appendix A for characteristic length and width computations, as well as for the derivation of M and K. Following Fernández (2005), a good fit and reliability correspond to M≥4 and K≤0.8. n/a: not applicable.

* Planes fitted manually to fit topographic trends.
Table 3Potentially unstable volumes (in m3). σ is the standard deviation of volume estimation, when considering the uncertainty of basal surface reconstruction (see Appendix A).
5.1 Stability of units Co and Lpd
We inferred from visual observations over more than a decade that units Co and LPd are more stable than unit UPd. In order to further investigate this hypothesis, we would need to characterize the geotechnical properties of these units. Geotechnical properties can be measured with in situ tests (e.g., penetration tests) or with laboratory analysis of rock samples (e.g., tri-axial tests). However, both methods require fieldwork that would be very dangerous near the Samperre cliff for safety reasons. Samples could also be collected on outcrops of the same geological units located in more accessible areas. For the UPd unit, these outcrops could be identified by comparing their mineralogy, and age if possible, to that of lahar deposits in the Prêcheur river. Indeed, these deposits mainly correspond to screes remobilized at the Samperre cliff toe and thus to collapsed materials from the UPd unit.
Until complementary fieldwork and geotechnical characterization are carried out, remote observations must be used. For instance, the stability of units Co and LPd in the coming years could be assessed by monitoring their evolution with yearly visual observations or topographic surveys. In the mean time, limit equilibrium numerical models can help characterize the stability of the cliff by performing a sensitivity analysis on key parameters, including the geometry of the interfaces between geological units, the geotechnical properties of materials, and the presence and level of aquifers. In a first approach, simple 2D limit equilibrium models such as SSAP (Brunetti et al., 2014; Borselli, 2022) or FLAC/Slope (Itasca, 2022) could be tested.
The stability of unit Co may be questioned. Indeed its ochre color suggests it has been extremely hydrothermally altered (e.g., Salaün et al., 2011), and many studies (e.g., Heap et al., 2021) have linked hydrothermal alteration to reduced rock stability. However, after the 127 ka flank collapse, alteration may have affected unit Co only at its surface. It is indeed a preferential flow path, as evidenced by water seepage at the interface between units Co and UPd. Besides, even if the unit is altered at greater depth, these water seepages suggest hydrothermal fluids no longer circulate within unit Co. Thus, we argue that the alteration of unit Co is old and has been compensated by (i) hydrothermal sealing, (ii) diagenetic cementation and (iii) lithostatic compaction (e.g., del Potro and Hürlimann, 2008). These three processes reduce connected porosity. For volcanic rocks, lower porosity is associated with increased cohesion and friction coefficient (Villeneuve and Heap, 2021). Thus, stability is increased, and the alteration of unit Co is compensated for. In turn, the surface of unit Co becomes a preferential sliding surface as observed, for instance, for old collapse scars on the Soufrière de Guadeloupe volcano (Salaün et al., 2011).
There is no clear sign of hydrothermal circulation within unit LPd, which limits the possibility of both alteration and hydrothermal sealing. However, the proximity of the Montagne Pelée eruptive center suggests pyroclastic deposits of unit LPd may have been emplaced at relatively high temperature, which favors welding (Quane and Russell, 2005). Then, as for unit Co, unit LPd was likely further strengthened by diagenetic cementing and lithostatic compaction. Furthermore, Boudon and Balcone-Boissard (2021) describe most of the pyroclastic deposits produced during this second stage as indurated materials forming a succession of ridges particularly visible on the more eroded western flank of the Montagne Pelée edifice.
5.2 Structural control of a valley paleo-surface on cliff destabilizations
The correlation between paleo-morphology and volcanic flank collapse has been investigated in several studies. For instance, Branca and Ferrara (2013) relate past destabilizations of Mount Etna to the morphology of sedimentary units it grew on. Similarly, over the past 10 kyr, numerous flank collapses from the Soufrière de Guadeloupe volcano have occurred repeatedly in the collapse scar left by the Morne Amic flank collapse (Komorowski et al., 2005; Rosas-Carbajal et al., 2016).
However, we could not find any study correlating directly the destabilization of volcanic escarpments to the drainage of paleo-valleys (i.e., the removal of solid materials filling the paleo-valley) in tropical contexts or anywhere else. For instance, Branca (2003) analyzes the successive filling and emptying phases of a fluvial valley affected by basaltic lava flows on Etna's flank but does not associate it with destabilization episodes. It may also be surprising that there are no other Samperre-cliff-like catchments on the flanks of Montagne Pelée volcano. A possible reason is that they have been eroded by surface water and/or subsequent small gravitational re-adjustments. Yet, the Samperre cliff catchment may also present some specificities, including the proximity of the Prêcheur collapse structure and the relative steep contact between UPd and underlying geological units. Geophysical surveys (e.g., airborne electromagnetic surveys, AEMs) on the Samperre cliff and other Pelée valleys would help in further investigating this question.
In the mean time, Réunion island (Indian Ocean) might be a good candidate to find analogues of the Samperre cliff paleo-morphology. Indeed, Réunion island includes both an extinct and eroded volcanic center, the Piton des Neiges, and an active volcano, the Piton de la Fournaise. An example of paleo-valley infilled by volcanic materials is the upper reach of the Rivière des Remparts (see Fig. 25.4 in Villeneuve et al., 2014). However, Piton des Neiges and Piton de la Fournaise volcanoes have mainly erupted lava flows (Salvany et al., 2012; Chaput, 2013). Besides, Rault et al. (2022) suggest that most mass wasting events occurring in the Cirque of Salazie depression (associated with the dismantling of Piton des Neiges volcano) are associated with the remobilization of old debris avalanches and epiclastic deposits (see also Chaput, 2013). As a result, destabilization mechanisms may differ from the Samperre cliff which is mainly composed of pyroclastic deposits.
Without any similar documented case studies, further data are needed to confirm or invalidate the hypothesis that the destabilizations of the Samperre cliff are structurally controlled by the surface of a paleo-valley. In this perspective, it will be important to analyze future destabilization episodes should they occur. In the mean time, the geometry of the paleo-valley could be constrained by geophysical surveys. Indeed, given observed water seepages, the contact between units Co and UPd, as well as LPd and UPd, is certainly associated with a permeability contrast and thus a resistivity contrast (e.g., Romano et al., 2018; Huntley et al., 2019). Older volcanic formations often tend to have lower permeabilities as a result of the filling of cavities and fractures (Singhal and Gupta, 2010), hydrothermal sealing (Polak et al., 2003), and compaction (Farquharson et al., 2017).
Given the difficulty of carrying out terrestrial surveys in the Samperre cliff area, airborne electromagnetic surveys (AEMs) are more feasible. They have already proven to provide valuable information to constrain landslide geometry (Nakazato and Konishi, 2005). Most of Martinique island was covered in 2013 by AEM surveys (Deparis et al., 2014; Coppo et al., 2015), and the resulting data were used to investigate hydrogeological systems (Vittecoq et al., 2015, 2019) and active landslides (Thiery et al., 2017, 2021). This highlights the great potential of this method, but unfortunately the Samperre cliff could not be flown over in 2013. The current development of AEM drone-based surveys could help in acquiring AEM data in this zone. We expect the contrast between Co and UPd to be particularly clear, as these units clearly have different lithologies or degree of weathering (as evidenced by color variations). However, units LPd and UPd are both pyroclastic deposits; hence the contrast may be less marked.
5.3 Volume estimation and implication for hazard assessment
The main surfaces controlling the extent of the reconstructed paleo-valley behind the cliff are S2 and S5. The riverbed (surface S6) has a very limited influence because it lies below other surfaces and in particular below S1, S2 and S3. This is why it does not appear in Fig. 7b. Similarly, surfaces S3 and S4 do not influence the final computed volume, provided we consider only unstable materials in the Samperre cliff.
Our estimation of the uncertainty of the unstable volume is only related to the uncertainty of the best-fit plane derivation. A more robust procedure should also take into account (i) the uncertainty of manual plane fitting for surfaces S4 and S5 and (ii) possible variations in structural orientations below the August 2018 topography. In particular, we may expect the surface of unit Co to curve itself to the east, following the same trend as the Prêcheur destabilization structure, instead of keeping the orientation of surface S2 (Fig. 7b). This would be consistent with observations, as the dip direction of surfaces associated with unit Co gradually increases from the west to the east: 137∘ N for S4, 169∘ N for S1 and 206∘ N for S2 (see Fig. 7 and Table 2).
Despite the lack of quantitative information, this possible bending of the interface between units Co and UPd can be taken into account, in a first approximation, if we simply delimit vertical surfaces constrained by topographic features. In a first case scenario, we assume that the paleo-valley did not extend further than the destabilization structure of the Prêcheur flank collapse. We thus use a northeast limit defined by ravine A (that follows the Prêcheur structure), continued along the ridge of the Prêcheur structure (dashed green line in Fig. 8). The corresponding volume, 7.9×10⁶ m3, is of the same order as our first estimation (8.3×10⁶ m3) to within 5 % difference. In a second more conservative scenario, we use ravine B (which runs behind Falaise Samperre) as the northeast limit. The associated volume is 3.5×10⁶ m3.
The upper volume value of 8×10⁶ m3 gives an estimation of the total rock mass volume that could be involved in future destabilization episodes until the catchment reaches a long-term stability state. Given the collapsed volume between 2010 and 2018 (about 5×10⁶ m3), this equilibrium state may well be reached in the coming decades. However, this does not entail that hazards associated with lahars will then be reduced in the Prêcheur river. Indeed, solid materials remobilized by lahars could also come from multiple other sources, including lateral erosion from the banks of the Samperre river and fresh eruptive materials in the event of a new phreatic or magmatic eruption. Besides, although units Co and LPd are more stable than unit UPd, they may still be subjected to retrogressive erosion or gravitational instabilities. Finally, gravitational instabilities could also occur in adjacent gullies, in particular in ravine D where superficial instabilities were witnessed in 2019 (Fig. 2 in Peruzzetto, 2021a).
In comparison, the smaller volume value, 3.5×10⁶ m3, is consistent with volumes destabilized in recent times (e.g., 2.1×10⁶ m3 in 2010 and 4.9×10⁶ m3 between 2010 and 2018) and could correspond to the volume of the next destabilization episode. A more detailed estimation would require limit equilibrium 3D numerical modeling (Apuani et al., 2005; Reid et al., 2015; Verrucci et al., 2019; Heap et al., 2021), but more geotechnical data are needed to constrain simulations. The next destabilization episode could occur in a single event or, more likely, in a succession of smaller rock avalanches. In both cases, a significant scree reservoir will be formed at the toe of the Samperre cliff. The processes controlling its remobilization by water depend on factors that are hard to constrain in real-time monitoring, including precipitation intensities and pore pressure within the reservoir. The resulting lahars may occur as a few major high-discharge events with the potential to flood the Prêcheur village downstream, as in 2010, or as multiple smaller but still dangerous events during a longer time period, which is highly disruptive for inhabitants, as in 2018. Our study suggests either of these crisis situations could still occur in the coming years, as a result destabilizations from the Samperre cliff. In the worst case scenario, we can consider a 3.5×10⁶ m3 reservoir created at the bottom of the cliff (neglecting bulking) and remobilized in a single lahar with a solid fraction of 75 % (following classical solid fraction values as in Vallance and Iverson, 2015; Thouret et al., 2020). A rough estimation of the volume of the lahar is then 4.7×10⁶ m3. The associated damages would be very important. Indeed, using numerical simulations, Peruzzetto et al. (2022) showed that a 2.0×10⁶ m3 lahar already has the potential to flood a large part of the Prêcheur village.
However, in the current state of knowledge, it is impossible to predict the date of the next collapse and of the subsequent lahars: the physical processes controlling and triggering destabilizations on the Samperre cliff are difficult to constrain. Nevertheless, they are most likely associated with water circulations.
5.4 Destabilization mechanisms
As already suggested by Clouard et al. (2013) and Nachbaur et al. (2019) groundwater circulations at the interface between units Co and UPd may be the main triggering factor for destabilizations. In the medium term (i.e., years), it could weaken the base of unit UPd by washing out fine particles. This suffusion process is widely documented in the literature (e.g., Moffat et al., 2011; Wan and Fell, 2008; Prasomsri and Takahashi, 2021). Precipitations (and associated increased pore pressure) could be a triggering factor in the short term but only after a time lag allowing groundwater to reach the cliff. Indeed, the 2018 destabilization episodes started only 2 d after the major rainfall of 31 December 2017 (almost 150 mm in 1 d in the Prêcheur village Quefféléan, 2018). We do not have access to precipitations records for previous events.
Interestingly, the chronology of recent destabilization episodes suggests that weakening by groundwater circulations is particularly important at the interface between units Co and UPd. Indeed, during the 2009–2010 destabilization episode (Clouard et al., 2013), the first major collapses occurred on 19 August 2009 on the northwest flank of the cliff (that is, in unit UPd above unit Co). The western and southern side then collapsed less than a year after on 11 May 2010. Similarly, ortho-photographs reveal that between 2010 and 2017, the cliff rim retreated to the north. The major 2018 destabilization episode concerned mainly the western side of the cliff (Fig. 2a). Thus, we suggest destabilization episodes start on the northwest side of the cliff, at the interface between units Co and UPd, and progress to the east and southeast by successive retrogressive failures.
5.5 Contribution of rock avalanches to volcano dismantling
The volume detached from the Samperre cliff between March and July 2010 is about 2.1×10⁶ m3 (Clouard et al., 2013) and 4.9×10⁶ m3 between July 2010 and August 2018 (Quefféléan, 2018; Peruzzetto, 2021b; Peruzzetto et al., 2022). This yields an average volume of 0.9×10⁶ m3 yr−1. This value certainly overestimates the sediment production rate due to rock avalanches because the 2018 collapse sequence was particularly large compared to previous episodes in 1998 or 2010. Quefféléan (2018) gives a rough estimation of the collapsed volume between 1951 and 2013 of 10–12×106 m3 for an average sediment production of about 0.16–0.19×10⁶ m3 yr−1. Considering that 15×106 m3 collapsed between 1951 and 2018, we get a similar result: 0.22×10⁶ m3 yr−1. It is twice as much as the estimation of 0.1×10⁶ m3 yr−1 of Clouard et al. (2013). If we assume a density of 3000 kg m3, we get a flux between 0.3 and 0.6 Mt yr−1: it represents between 0.2 % and 0.5 % of the sediment flux from cliff retreat in Europe (over a distance of 127 000 km; see Regard et al., 2022).
In comparison, the total volume involved in the Prêcheur and Rivière Sèche flank collapses is estimated between 27×109 m3 (Germa et al., 2015) and 40×109 m3 (Brunet et al., 2016). The associated long-time annual averages are 0.21×10⁶ and 0.31×10⁶ m3 yr−1. Taking into account the on-land deposits of flank collapse, Germa et al. (2015) estimate a slightly lower rate of volume evacuated at sea by flank collapses: 0.15×10⁶ m3 yr−1. All these rates are of the same order of magnitude as sediment production by rock avalanches from the Samperre cliff. More refined comparisons are difficult because of the uncertainty of the rate calculation.
Of course, the Samperre cliff has been particularly active since (at least) 1950, and our results suggest it could reach an equilibrium state in the coming decades. Thus, the associated sediment production rate may overestimate the actual sediment production rate linked to 106–107 m3 landslides on the Pelée edifice over a long time period. In particular, its specific location near the headscarp of the Prêcheur collapse structure could enhance instabilities in comparison to other escarpments: as suggested by Germa et al. (2015), it is important to differentiate between erosion rates inside and outside of collapse calderas. However, the pyroclastic materials composing most of the cliff are, presumably, not specific to this site. Other outcrops are thus likely to be also eroded in the long run by landslides or runoff. This is particularly true for tropical islands where intense rainfalls favor superficial instabilities and erosion (e.g., more than 200 landslides cataloged on Martinique island between 2000 and 2020; Thiery et al., 2021). Besides, our results are consistent with the conclusions of Brunetti et al. (2009). Indeed, using a global database of landslides, they find that landslide occurrence probability is proportional to V−β, with V the landslide volume and β=1.1 in volcanic contexts. Thus, the return period TV is proportional to Vβ. In turn, the sediment production rate is proportional to . That is, the sediment production rate associated with landslides slightly decreases with landslide volume or at least does not depend significantly on the landslide volume (given the uncertainties associated with the estimation of β).
Thus, following Clouard et al. (2013), Germa et al. (2015), and Quartau et al. (2015), we suggest that the contribution of large edifice collapse to volcanic island dismantling is significant but not necessarily dominant in comparison to other erosive processes and in particular smaller landslides. Of course, this may depend on the geological context, and the distinction between processes is not easy as they can follow each other (e.g., surface water remobilizing landslide deposits). This question is still discussed in the literature. For instance, Salvany et al. (2012) argue that the formation of volcanic cirques on Réunion island (Indian Ocean) was mainly the result of regressive erosion by small landslides and runoff. On the contrary, Chaput (2013) suggests that the excavation of the cirques was first initiated by major gravitational instabilities, whose resulting breccias were then remobilized by smaller landslides and surface water. More recently, Rault et al. (2022) estimate that landslides affecting both intact volcanic formations and epiclastic deposits and triggered by rainstorms have contributed to about 20 % of the erosion of Piton des Neiges over the last 72 kyr.
In our view, the long-term role of intermediate landslides (i.e., between 106 and 107 m3) should be further investigated. Indeed, landslide inventories often focus on smaller landslides or larger landslides, as can be clearly seen in Fig. 2 of Brunetti et al. (2009) giving the volume distribution of 19 landslide databases. Small landslides (below 106 m3) are indeed more frequent and can be thus cataloged at the local or regional scale from historic reports and field investigations. On the contrary, larger landslide inventories (above 108 m3) are constructed from the geomorphological analysis of topographic surveys. Given the relative scarcity of such large landslides, large areas are investigated. At this scale, the footprint of intermediate landslides is less clear such that their comprehensive and systematic identification is not easy. Future research on that matter and the construction of comprehensive landslide databases for volcanic islands (e.g., Rault et al., 2022) would improve our understandings of erosion mechanisms on volcanic islands.
The quantification of unstable volumes in rocky cliffs in volcanic contexts is difficult because of the complex geometry of successive geological layers, especially when no geophysical, geotechnical or displacement data are available. In this study, we used historic aerial oblique photographs, ortho-rectified photographs, digital elevation models and 3D point clouds to
-
identify geological units and characterize the geometry of deposition horizons, interfaces and outcrop surfaces,
-
characterize the relative stability of geological units,
-
reconstruct the paleo-morphology of the catchment, from which we deduced the 3D surface of a basal stable layer,
-
quantify the potential unstable volume for future destabilizations.
We used the Samperre cliff (Martinique, Lesser Antilles) as a case study. Over the past decades it has produced several rock avalanches from 2 to 5×10⁶ m3, whose deposits can be remobilized as debris flows threatening the Prêcheur village at the mouth of the Prêcheur river. From our observations and geometric characterization of geological units, we show that destabilizations of the Samperre cliff could be related to the remobilization of old volcanic deposits that had filled a paleo-valley. We estimate the volume of materials still filling this paleo-valley to be 7.9×10⁶ m3 and the volume involved in the next destabilization episodes to be 3.5×10⁶ m3. These results are important for operational risk management.
Our interpretation that destabilizations are linked to the presence of a paleo-valley could be verified or contradicted by airborne electro-magnetism surveys. They would identify, if it exists, the interface between the paleo-valley and materials filling it. A regular monitoring of the cliff morphology during future destabilization episodes will also help better constrain long-term evolution scenarios. Further fieldwork should also be done in the future to identity and sample accessible outcrops of the geological units composing the Samperre cliff. This would allow the geotechnical properties of the materials that compose the cliff to be estimated and limit equilibrium simulations to be carried out.
Provided a set of N points with coordinates , we fit a plane of equation to the corresponding cloud points through an ordinary least square regression, minimizing the distance between the points and the plane. The associated minimal root mean square (RMS) is
To characterize the robustness of the fit, we introduce the (N×3) matrix M:
where E(X), E(Y) and E(Z) are, respectively, the mean X, Y and Z coordinates of the point cloud. The (3×3) covariance matrix C is then given by
The three positive eigenvalues λ1, λ2 and λ3 and associated eigenvectors e1, e2 and e3 help describe the geometry of the point cloud. Assuming , e1 points in the direction of the cloud main axis, e2 in the second main axis direction and e3 in the third axis direction, all three axes being orthogonal to one another. The distribution of the points along these three axes is quantified by the eigenvalues. For instance, if the points are aligned along a line, . If the points are homogeneously distributed on a disk, λ1=λ2 and λ3=0. In this perspective, can be seen as a characteristic length of the point cloud and as a characteristic width (see corresponding columns in Tables 2 and A1). More precisely, λ1 and λ2 are the variance of point projection on the first and second axes. λ3 describes the point dispersion around the plane given by eigenvectors e1 and e2: we have λ3= RMS.
For the plane fit to be robust, the RMS, i.e., λ3, needs to be small in comparison to the length of the cloud. Following Fernández (2005), we use the indicator
The higher M is, the better the fit is. To estimate the reliability of the plane orientation, we must assess the linearity of the point cloud, as multiple planes can fit a linear distribution of points, with similar RMS. Fernández (2005) suggest the indicator K:
The lower K is, the better the reliability of the fit is. Low values of K are obtained if λ3≪λ2 (i.e., if the point cloud has a good degree of planarity) and/or if is close to 1 (by construction, ). Fernández (2005) runs multiple numerical tests to estimate threshold values for M and K corresponding to good fit and reliability. They suggest we must have M≥4 and K≤0.8. In order to have a direct estimation of the uncertainty of dip and dip direction of the fitted plane, we use a bootstrap method. This is done by drawing randomly, with replacement, N points among the initial N points of the point cloud and fitting a plane to the new point cloud. This procedure is repeated 100 times. The standard deviations of the resulting dip and dip directions are given in Tables 2 and A1.
Table A1Deposition horizon characterization. σ is the standard deviation of estimated dip and dip directions. See Appendix A for characteristic length and width computations, as well as for the derivation of M and K. Following Fernández (2005), a good fit and reliability correspond to M≥4 and K≤0.8. The line in bold corresponds to the plane fitted to the contact S0 between LPd and UPd (red line and dot in Fig. 3).

The orthophotographs, DEMs and photographs used to construct the photogrammetric models are not the property of the BRGM. Thus, they cannot be made freely available. Aerial pictures of the cliff, taken during helicopter flights, are provided in the Supplement.
The supplement related to this article is available online at: https://doi.org/10.5194/nhess-22-3973-2022-supplement.
MP, YL, AN and TD contributed to conceptualization, data curation, formal analysis, investigation, methodology and validation. MP prepared the original draft and figures. MP, YL, AN, TD, YT, CL and BV contributed to the manuscript writing and review. AN, YL and BN contributed to supervision, project administration and funding acquisition.
The contact author has declared that none of the authors has any competing interests.
Publisher’s note: Copernicus Publications remains neutral with regard to jurisdictional claims in published maps and institutional affiliations.
We thank the staff of BRGM Martinique, BRGM Guadeloupe and OVSM-IPGP for their contribution to fieldwork, as well as Rachid Omira, Federico Di Traglia, Georges Boudon and two anonymous reviewers for their comments and feedback.
This research has been supported by the DGPR (Direction Générale de la Prévention des Risques) and the DEAL Martinique (Direction de l’Environnement, de l’Aménagement et du Logement).
This paper was edited by Rachid Omira and reviewed by Georges Boudon and two anonymous referees.
Apuani, T., Corazzato, C., Cancelli, A., and Tibaldi, A.: Stability of a Collapsing Volcano (Stromboli, Italy): Limit Equilibrium Analysis and Numerical Modelling, J. Volcanol. Geoth. Res., 144, 191–210, https://doi.org/10.1016/j.jvolgeores.2004.11.028, 2005. a, b
Aubaud, C., Athanase, J.-E., Clouard, V., Barras, A.-V., and Sedan, O.: A Review of Historical Lahars, Floods, and Landslides in the Precheur River Catchment (Montagne Pelee Volcano, Martinique Island, Lesser Antilles), B. Soc. Geol. Fr., 184, 137–154, https://doi.org/10.2113/gssgfbull.184.1-2.137, 2013. a, b, c, d
Belle, P., Aunay, B., Bernardie, S., Grandjean, G., Ladouche, B., Mazué, R., and Join, J.-L.: The Application of an Innovative Inverse Model for Understanding and Predicting Landslide Movements (Salazie Cirque Landslides, Reunion Island), Landslides, 11, 343–355, https://doi.org/10.1007/s10346-013-0393-5, 2014. a
Blahůt, J., Balek, J., Klimeš, J., Rowberry, M., Kusák, M., and Kalina, J.: A Comprehensive Global Database of Giant Landslides on Volcanic Islands, Landslides, 16, 2045–2052, https://doi.org/10.1007/s10346-019-01275-8, 2019. a
Borselli, L.: SSAP, https://ssap.eu, last access: 5 December 2022. a
Boudon, G. and Balcone-Boissard, H.: Volcanological Evolution of Montagne Pelée (Martinique): A Textbook Case of Alternating Plinian and Dome-Forming Eruptions, Earth-Sci. Rev., 221, 103754, https://doi.org/10.1016/j.earscirev.2021.103754, 2021. a, b, c, d, e, f, g, h, i, j, k, l, m
Boudon, G., Le Friant, A., Villemant, B., Viodé, J.-P., Anténor-Habazac, C., and Hammmouya, G.: Volcanic Hazard Atlas of the Lesser Antilles: Martinique, in: Volcanic Hazard Atlas of the Lesser Antilles, edited by: Lindsay, J., Robertson, R., Shepherd, J., and Ali, S., 126–145, University of the West Indies, Seismic Research Unit, Trinidad and IAVCEI, https://uwiseismic.com/wp-content/uploads/2021/10/Martinique.pdf (last access: 5 December 2022), 2005. a
Boudon, G., Le Friant, A., Komorowski, J.-C., Deplus, C., and Semet, M. P.: Volcano Flank Instability in the Lesser Antilles Arc: Diversity of Scale, Processes, and Temporal Recurrence, J. Geophys. Res., 112, B08205, https://doi.org/10.1029/2006JB004674, 2007. a
Branca, S.: Geological and Geomorphological Evolution of the Etna Volcano NE Flank and Relationships between Lava Flow Invasions and Erosional Processes in the Alcantara Valley (Italy), Geomorphology, 53, 247–261, https://doi.org/10.1016/S0169-555X(02)00315-X, 2003. a
Branca, S. and Ferrara, V.: The Morphostructural Setting of Mount Etna Sedimentary Basement (Italy): Implications for the Geometry and Volume of the Volcano and Its Flank Instability, Tectonophysics, 586, 46–64, https://doi.org/10.1016/j.tecto.2012.11.011, 2013. a
Brunet, M., Le Friant, A., Boudon, G., Lafuerza, S., Talling, P., Hornbach, M., Ishizuka, O., Lebas, E., Guyard, H., and IODP Expedition 340 Science Party: Composition, Geometry, and Emplacement Dynamics of a Large Volcanic Island Landslide Offshore Martinique: From Volcano Flank-Collapse to Seafloor Sediment Failure?, Geochem. Geophy. Geosy., 17, 699–724, https://doi.org/10.1002/2015GC006034, 2016. a, b, c, d, e
Brunet, M., Moretti, L., Le Friant, A., Mangeney, A., Fernández Nieto, E. D., and Bouchut, F.: Numerical Simulation of the 30–45 Ka Debris Avalanche Flow of Montagne Pelée Volcano, Martinique: From Volcano Flank Collapse to Submarine Emplacement, Nat. Hazards, 87, 1189–1222, https://doi.org/10.1007/s11069-017-2815-5, 2017. a
Brunetti, M. T., Guzzetti, F., and Rossi, M.: Probability distributions of landslide volumes, Nonlin. Processes Geophys., 16, 179–188, https://doi.org/10.5194/npg-16-179-2009, 2009. a, b, c, d
Brunetti, M. T., Guzzetti, F., Cardinali, M., Fiorucci, F., Santangelo, M., Mancinelli, P., Komatsu, G., and Borselli, L.: Analysis of a New Geomorphological Inventory of Landslides in Valles Marineris, Mars, Earth Planet. Sc. Lett., 405, 156–168, https://doi.org/10.1016/j.epsl.2014.08.025, 2014. a
Buckley, S. J., Ringdal, K., Naumann, N., Dolva, B., Kurz, T. H., Howell, J. A., and Dewez, T. J.: LIME: Software for 3-D Visualization, Interpretation, and Communication of Virtual Geoscience Models, Geosphere, 15, 222–235, https://doi.org/10.1130/GES02002.1, 2019. a
Carazzo, G., Tait, S., Kaminski, E., and Gardner, J. E.: The Recent Plinian Explosive Activity of Mt. Pelée Volcano (Lesser Antilles): The P1 AD 1300 Eruption, B. Volcanol., 74, 2187–2203, https://doi.org/10.1007/s00445-012-0655-4, 2012. a
Carazzo, G., Tait, S., Michaud-Dubuy, A., Fries, A., and Kaminski, E.: Transition from Stable Column to Partial Collapse during the 79 Cal CE P3 Plinian Eruption of Mt. Pelée Volcano (Lesser Antilles), J. Volcanol. Geoth. Res., 392, 106764, https://doi.org/10.1016/j.jvolgeores.2019.106764, 2020. a
Chaput, M.: Déformation et activité intrusive des volcans boucliers – Du terrain à la modélisation numérique (Piton des Neiges, La Réunion), PhD thesis, Université de la Réunion, https://theses.hal.science/file/index/docid/967104/filename/Manuscrit_final_Marie_Chaput_def_opt.pdf (last access: 5 December 2022), 2013. a, b, c
Clouard, V., Athanase, J.-E., and Aubaud, C.: Physical Characteristics and Triggering Mechanisms of the 2009-2010 Landslide Crisis at Montagne Pelee Volcano, Martinique: Implication for Erosional Processes and Debris-Flow Hazards, B. Soc. Geol. Fr., 184, 155–164, https://doi.org/10.2113/gssgfbull.184.1-2.155, 2013. a, b, c, d, e, f, g, h, i
CloudCompare: GPL Software, Version 2.11.3, https://www.danielgm.net/cc/ (last access: 5 December 2022), 2020. a, b
Coppo, N., Baltassat, J.-M., Girard, J.-F., Wawrzyniak, P., Hautot, S., Tarits, P., Jacob, T., Martelet, G., Mathieu, F., Gadalia, A., Bouchot, V., and Traineau, H.: 3-D Magnetotelluric Investigations for Geothermal Exploration in Martinique (Lesser Antilles). Characteristic Deep Resistivity Structures, and Shallow Resistivity Distribution Matching Heliborne TEM Results, arXiv [preprint], https://doi.org/10.48550/arXiv.1501.06541, 2015. a
Coviello, V., Capra, L., Norini, G., Dávila, N., Ferrés, D., Márquez-Ramírez, V. H., and Pico, E.: Earthquake-induced debris flows at Popocatépetl Volcano, Mexico, Earth Surf. Dynam., 9, 393–412, https://doi.org/10.5194/esurf-9-393-2021, 2021. a
De Rita, D., Giordano, G., and Milli, S.: Forestepping-Backstepping Stacking Pattern of Volcaniclastic Successions: Roccamonfina Volcano, Italy, J. Volcanol. Geoth. Res., 78, 267–288, https://doi.org/10.1016/S0377-0273(97)00005-X, 1997. a
del Potro, R. and Hürlimann, M.: Geotechnical Classification and Characterisation of Materials for Stability Analyses of Large Volcanic Slopes, Eng. Geol., 98, 1–17, https://doi.org/10.1016/j.enggeo.2007.11.007, 2008. a
Deparis, J., Reninger, P.-A., Perrin, J., Martelet, G., and Audru, J.-C.: Acquisition géophysique héliportée électromagnétique de la Matinique, Public report BRGM/RP-62428-FR, BRGM, Orléans, France, http://infoterre.brgm.fr/rapports/RP-62428-FR.pdf (last access: 5 December 2022), 2014. a
Di Traglia, F., Fornaciai, A., Favalli, M., Nolesini, T., and Casagli, N.: Catching Geomorphological Response to Volcanic Activity on Steep Slope Volcanoes Using Multi-Platform Remote Sensing, Remote Sensing, 12, 438, https://doi.org/10.3390/rs12030438, 2020. a
Durand, V., Mangeney, A., Haas, F., Jia, X., Bonilla, F., Peltier, A., Hibert, C., Ferrazzini, V., Kowalski, P., Lauret, F., Brunet, C., Satriano, C., Wegner, K., Delorme, A., and Villeneuve, N.: On the Link Between External Forcings and Slope Instabilities in the Piton de La Fournaise Summit Crater, Reunion Island, J. Geophys. Res.-Earth, 123, 2422–2442, https://doi.org/10.1029/2017JF004507, 2018. a, b
Farquharson, J. I., Baud, P., and Heap, M. J.: Inelastic compaction and permeability evolution in volcanic rock, Solid Earth, 8, 561–581, https://doi.org/10.5194/se-8-561-2017, 2017. a
Fernández, O.: Obtaining a Best Fitting Plane through 3D Georeferenced Data, J. Struct. Geol., 27, 855–858, https://doi.org/10.1016/j.jsg.2004.12.004, 2005. a, b, c, d, e, f, g
Germa, A., Quidelleur, X., Lahitte, P., Labanieh, S., and Chauvel, C.: The K–Ar Cassignol–Gillot Technique Applied to Western Martinique Lavas: A Record of Lesser Antilles Arc Activity from 2Ma to Mount Pelée Volcanism, Quat. Geochronol., 6, 341–355, https://doi.org/10.1016/j.quageo.2011.02.001, 2011. a, b, c
Germa, A., Lahitte, P., and Quidelleur, X.: Construction and Destruction of Mont Pelée Volcano: Volumes and Rates Constrained from a Geomorphological Model of Evolution, J. Geophys. Res.-Earth, 120, 1206–1226, https://doi.org/10.1002/2014JF003355, 2015. a, b, c, d, e, f, g
Guthrie, R. H., Friele, P., Allstadt, K., Roberts, N., Evans, S. G., Delaney, K. B., Roche, D., Clague, J. J., and Jakob, M.: The 6 August 2010 Mount Meager rock slide-debris flow, Coast Mountains, British Columbia: characteristics, dynamics, and implications for hazard and risk assessment, Nat. Hazards Earth Syst. Sci., 12, 1277–1294, https://doi.org/10.5194/nhess-12-1277-2012, 2012. a
Hamada, A. and Toramaru, A.: Analogue Experiments on Morphological Transition from Colonnade to Entablature of Columnar Joints, J. Volcanol. Geoth. Res., 402, 106979, https://doi.org/10.1016/j.jvolgeores.2020.106979, 2020. a
Harnett, C. E., Thomas, M. E., Calder, E. S., Ebmeier, S. K., Telford, A., Murphy, W., and Neuberg, J.: Presentation and Analysis of a Worldwide Database for Lava Dome Collapse Events: The Global Archive of Dome Instabilities (GLADIS), B. Volcanol., 81, 16, https://doi.org/10.1007/s00445-019-1276-y, 2019. a
Heap, M. J., Baumann, T. S., Rosas-Carbajal, M., Komorowski, J.-C., Gilg, H. A., Villeneuve, M., Moretti, R., Baud, P., Carbillet, L., Harnett, C., and Reuschlé, T.: Alteration-Induced Volcano Instability at La Soufrière de Guadeloupe (Eastern Caribbean), J. Geophys. Res.-Sol. Ea., 126, e2021JB022514, https://doi.org/10.1029/2021JB022514, 2021. a, b, c, d
Hickey, J., Lloyd, R., Biggs, J., Arnold, D., Mothes, P., and Muller, C.: Rapid Localized Flank Inflation and Implications for Potential Slope Instability at Tungurahua Volcano, Ecuador, Earth Planet. Sc. Lett., 534, 116104, https://doi.org/10.1016/j.epsl.2020.116104, 2020. a
Humbert, M., Pasquet, R., and Stieltjes, L.: Les Risques Géologiques Dans Les Cirques de Salazie et de Cilaos (Ile de La Réunion), Tech. Rep. 81 SGN 543 GEG-REU, BRGM, http://infoterre.brgm.fr/rapports/81-SGN-543-GEG.pdf (last access: 5 December 2022), 1981. a
Huntley, D., Bobrowsky, P., Hendry, M., Macciotta, R., and Best, M.: Multi-Technique Geophysical Investigation of a Very Slow-moving Landslide near Ashcroft, British Columbia, Canada, J. Environ. Eng. Geophy., 24, 87–110, https://doi.org/10.2113/JEEG24.1.87, 2019. a
IGN: BD ORTHO | Géoservices, https://geoservices.ign.fr/documentation/donnees/ortho/bdortho (last access: 5 December 2022), 2017. a, b
IGN: BD ORTHO Historique | Géoservices, https://geoservices.ign.fr/documentation/donnees/ortho/bdorthohisto (last access: 5 December 2022), 2021. a, b
INSEE: Données Carroyées – Niveau Naturel, https://www.insee.fr/fr/statistiques/4176281?sommaire=4176305 (last access: 5 December 2022), 2015. a
Itasca: FLAC/Slope, Itasca, https://www.itascacg.com/software/FLAC-Slope, last access: 5 December 2022. a
Jaboyedoff, M., Chigira, M., Arai, N., Derron, M.-H., Rudaz, B., and Tsou, C.-Y.: Testing a failure surface prediction and deposit reconstruction method for a landslide cluster that occurred during Typhoon Talas (Japan), Earth Surf. Dynam., 7, 439–458, https://doi.org/10.5194/esurf-7-439-2019, 2019. a
Jaboyedoff, M., Dario, C., Marc-Henri, D., Thierry, O., Ivanna Marina, P., and Bejamin, R.: A Review of Methods Used to Estimate Initial Landslide Failure Surface Depths and Volumes, Eng. Geol., 267, 105478, https://doi.org/10.1016/j.enggeo.2020.105478, 2020. a
Komorowski, J.-C., Boudon, G., Semet, M., Beauducel, F., Anténor-Habazac, C., Bazin, S., and Hammmouya, G.: Volcanic Hazard Atlas of the Lesser Antilles: Guadeloupe, in: Volcanic Hazard Atlas of the Lesser Antilles, edited by: Lindsay, J., Robertson, R., Shepherd, J., and Ali, S., 65–102, University of the West Indies, Seismic Research Unit, Trinidad and IAVCEI, https://uwiseismic.com/wp-content/uploads/2021/10/Guadeloupe.pdf (last access: 5 December 2022), 2005. a, b
Lavigne, F., Degeai, J.-P., Komorowski, J.-C., Guillet, S., Robert, V., Lahitte, P., Oppenheimer, C., Stoffel, M., Vidal, C. M., Surono, Pratomo, I., Wassmer, P., Hajdas, I., Hadmoko, D. S., and de Belizal, E.: Source of the Great A.D. 1257 Mystery Eruption Unveiled, Samalas Volcano, Rinjani Volcanic Complex, Indonesia, P. Natl. Acad. Sci. USA, 110, 16742–16747, https://doi.org/10.1073/pnas.1307520110, 2013. a
Le Friant, A., Boudon, G., Deplus, C., and Villemant, B.: Large-Scale Flank Collapse Events during the Activity of Montagne Pelée, Martinique, Lesser Antilles, J. Geophys. Res.-Sol. Ea., 108, 2055, https://doi.org/10.1029/2001JB001624, 2003. a, b
Legendre, Y.: Reconstruction Fine de l'histoire Éruptive et Scenarii Éruptifs à La Soufrière de Guadeloupe: Vers Un Modèle Intégré de Fonctionnement Du Volcan, Thesis, Paris 7, https://theses.hal.science/tel-03884919 (last access: 5 December 2022), 2012. a
Lim, C., Huh, M., Yi, K., and Lee, C.: Genesis of the Columnar Joints from Welded Tuff in Mount Mudeung National Geopark, Republic of Korea, Earth Planets Space, 67, 152, https://doi.org/10.1186/s40623-015-0323-y, 2015. a
Manville, V., Németh, K., and Kano, K.: Source to Sink: A Review of Three Decades of Progress in the Understanding of Volcaniclastic Processes, Deposits, and Hazards, Sediment. Geol., 220, 136–161, https://doi.org/10.1016/j.sedgeo.2009.04.022, 2009. a
Mathon, C. and Barras, A.: Risque d'occurence de Lave Torrentielle Dans La Rivière Du Prêcheur Suite à l'éboulement Du 11 Mai 2010, Rapport d'expertise BRGM/RP – 58697-FR, BRGM, http://infoterre.brgm.fr/rapports/RP-58697-FR.pdf (last access: 5 December 2022), 2010. a, b
Maury, R. C., Westbrook, G. K., Baker, P. E., Bouysse, P., and Westercamp, D.: Geology of the Lesser Antilles, in: The Caribbean Region, vol. H, Geological Society of America, Boulder, CO, https://doi.org/10.1130/DNAG-GNA-H.141, 1991. a
McDougall, S.: 2014 Canadian Geotechnical Colloquium: Landslide Runout Analysis – Current Practice and Challenges, Can. Geotech. J., 54, 605–620, https://doi.org/10.1139/cgj-2016-0104, 2017. a
Mitchell, A., McDougall, S., Nolde, N., Brideau, M.-A., Whittall, J., and Aaron, J. B.: Rock Avalanche Runout Prediction Using Stochastic Analysis of a Regional Dataset, Landslides, 17, 777–792, https://doi.org/10.1007/s10346-019-01331-3, 2019. a
Moffat, R., Fannin, R. J., and Garner, S. J.: Spatial and Temporal Progression of Internal Erosion in Cohesionless Soil, Can. Geotech. J., 48, 399–412, https://doi.org/10.1139/T10-071, 2011. a
Moretti, L., Allstadt, K., Mangeney, A., Capdeville, Y., Stutzmann, E., and Bouchut, F.: Numerical Modeling of the Mount Meager Landslide Constrained by Its Force History Derived from Seismic Data, J. Geophys. Res.-Sol. Ea., 120, 2579–2599, https://doi.org/10.1002/2014JB011426, 2015. a
Nachbaur, A., Legendre, Y., Lombard, M., and Dewez, T.: Caractérisation Géologique et Identification Des Mécanismes d'instabilité de La Falaise Samperre, Rapport Final RP-68564-FR, BRGM, 2019. a, b, c, d
Nakazato, H. and Konishi, N.: Subsurface Structure Exploration of Wide Landslide Area by Aerial Electromagnetic Exploration, Landslides, 2, 165–169, https://doi.org/10.1007/s10346-005-0056-2, 2005. a
NGU: Recommended Hazard and Risk Classification System for Large Unstable Rock Slopes in Norway, Tech. Rep. 2012.029, Geological Survey of Norway, https://www.ngu.no/en/publikasjon/recommended-hazard-and-risk-classification-system-large-unstable-rock-slopes-norway (last access: 5 December 2022), 2012. a
Pavlis, T. L. and Mason, K. A.: The New World of 3D Geologic Mapping, GSA Today, 27, 4–10, https://doi.org/10.1130/GSATG313A.1, 2017. a
Peruzzetto, M.: Modélisation de scénarios de déstabilisation de la Falaise Samperre et de propagation des lahars, Rapport final BRGM/RP-71149-FR, BRGM, Orléans, France, 2021a. a
Peruzzetto, M.: Numerical Modeling of Dry and Water-Laden Gravitational Flows for Quantitative Hazard Assessment, PhD thesis, Université de Paris, https://theses.hal.science/tel-03623000 (last access: 5 December 2022), 2021b. a, b
Peruzzetto, M., Komorowski, J.-C., Friant, A. L., Rosas-Carbajal, M., Mangeney, A., and Legendre, Y.: Modeling of Partial Dome Collapse of La Soufrière of Guadeloupe Volcano: Implications for Hazard Assessment and Monitoring, Sci. Rep.-UK, 9, 1–15, https://doi.org/10.1038/s41598-019-49507-0, 2019. a
Peruzzetto, M., Mangeney, A., Grandjean, G., Levy, C., Thiery, Y., Rohmer, J., and Lucas, A.: Operational Estimation of Landslide Runout: Comparison of Empirical and Numerical Methods, Geosciences, 10, 424, https://doi.org/10.3390/geosciences10110424, 2020. a
Peruzzetto, M., Levy, C., Thiery, Y., Grandjean, G., Mangeney, A., Lejeune, A.-M., Nachbaur, A., Legendre, Y., Vittecoq, B., Saurel, J.-M., Clouard, V., Dewez, T., Fontaine, F. R., Mergili, M., Lagarde, S., Komorowski, J.-C., Le Friant, A., and Lemarchand, A.: Simplified Simulation of Rock Avalanches and Subsequent Debris Flows with a Single Thin-Layer Model: Application to the Prêcheur River (Martinique, Lesser Antilles), Eng. Geol., 296, 106457, https://doi.org/10.1016/j.enggeo.2021.106457, 2022. a, b, c, d
Polak, A., Elsworth, D., Yasuhara, H., Grader, A. S., and Halleck, P. M.: Permeability Reduction of a Natural Fracture under Net Dissolution by Hydrothermal Fluids, Geophys. Res. Lett., 30, 2020, https://doi.org/10.1029/2003GL017575, 2003. a
Prasomsri, J. and Takahashi, A.: Experimental Study on Suffusion under Multiple Seepages and Its Impact on Undrained Mechanical Responses of Gap-Graded Soil, Soils Found., 61, 1660–1680, https://doi.org/10.1016/j.sandf.2021.10.003, 2021. a
Quane, S. L. and Russell, J. K.: Ranking Welding Intensity in Pyroclastic Deposits, B. Volcanol., 67, 129–143, https://doi.org/10.1007/s00445-004-0367-5, 2005. a
Quartau, R., Hipólito, A., Mitchell, N. C., Gaspar, J. L., and Brandão, F.: Comment on “Construction and Destruction of a Volcanic Island Developed inside an Oceanic Rift: Graciosa Island, Terceira Rift, Azores” by Sibrant et al. (2014) and Proposal of a New Model for Graciosa's Geological Evolution, J. Volcanol. Geoth. Res., 303, 146–156, https://doi.org/10.1016/j.jvolgeores.2015.07.007, 2015. a
Quefféléan, Y.: Mission d'expertise ONF-RTM Sur Les Lahars Du Prêcheur, Appui tehcnique DGPR, ONF-RTM, 2018. a, b, c, d
Ramalho, R. S., Quartau, R., Trenhaile, A. S., Mitchell, N. C., Woodroffe, C. D., and Ávila, S. P.: Coastal Evolution on Volcanic Oceanic Islands: A Complex Interplay between Volcanism, Erosion, Sedimentation, Sea-Level Change and Biogenic Production, Earth-Sci. Rev., 127, 140–170, https://doi.org/10.1016/j.earscirev.2013.10.007, 2013. a
Rault, C., Thiery, Y., Chaput, M., Reninger, P. A., Dewez, T. J. B., Michon, L., Samyn, K., and Aunay, B.: Landslide Processes Involved in Volcano Dismantling From Past to Present: The Remarkable Open-Air Laboratory of the Cirque de Salazie (Reunion Island), J. Geophys. Res.-Earth, 127, e2021JF006257, https://doi.org/10.1029/2021JF006257, 2022. a, b, c, d, e
Regard, V., Prémaillon, M., Dewez, T. J. B., Carretier, S., Jeandel, C., Godderis, Y., Bonnet, S., Schott, J., Pedoja, K., Martinod, J., Viers, J., and Fabre, S.: Rock Coast Erosion: An Overlooked Source of Sediments to the Ocean. Europe as an Example, Earth Planet. Sc. Lett., 579, 117356, https://doi.org/10.1016/j.epsl.2021.117356, 2022. a
Reid, M. E.: Massive Collapse of Volcano Edifices Triggered by Hydrothermal Pressurization, Geology, 32, 373–376, https://doi.org/10.1130/G20300.1, 2004. a
Reid, M. E., Christian, S. B., Brien, D. L., and Henderson, S. T.: Scoops3D: Software to Analyze Three-Dimensional Slope Stability Throughout a Digital Landscape, in: Landslide and Debris-Flow Assessment, vol. 14 of Techniques and Methods, USGS, https://pubs.er.usgs.gov/publication/tm14A1 (last access: 5 December 2022), 2015. a
Revil, A., Coperey, A., Heap, M. J., and Carbillet, L.: A Geophysical Index to Map Alteration, Permeability, and Mechanical Properties within Volcanoes. Application to the Soft Volcanic Rocks from Whakaari/White Island (New Zealand), J. Volcanol. Geoth. Res., 401, 106945, https://doi.org/10.1016/j.jvolgeores.2020.106945, 2020. a
Romano, G., Balasco, M., Siniscalchi, A., Gueguen, E., Petrillo, Z., and Tripaldi, S.: Geological and Geo-Structural Characterization of the Montemurro Area (Southern Italy) Inferred from Audiomagnetotelluric Survey, Geomatics, Natural Hazards and Risk, 9, 1156–1171, https://doi.org/10.1080/19475705.2018.1502210, 2018. a
Rosas-Carbajal, M., Komorowski, J.-C., Nicollin, F., and Gibert, D.: Volcano Electrical Tomography Unveils Edifice Collapse Hazard Linked to Hydrothermal System Structure and Dynamics, Sci. Rep.-UK, 6, 29899, https://doi.org/10.1038/srep29899, 2016. a, b
Rosas-Carbajal, M., Jourde, K., Marteau, J., Deroussi, S., Komorowski, J.-C., and Gibert, D.: Three-Dimensional Density Structure of La Soufrière de Guadeloupe Lava Dome from Simultaneous Muon Radiographies and Gravity Data: 3-D MUON TOMOGRAPHY OF LA SOUFRIÈRE, Geophys. Res. Lett., 44, 6743–6751, https://doi.org/10.1002/2017GL074285, 2017. a
Salaün, A., Villemant, B., Gérard, M., Komorowski, J.-C., and Michel, A.: Hydrothermal Alteration in Andesitic Volcanoes: Trace Element Redistribution in Active and Ancient Hydrothermal Systems of Guadeloupe (Lesser Antilles), J. Geochem. Explor., 3, 59–83, https://doi.org/10.1016/j.gexplo.2011.06.004, 2011. a, b, c
Salvany, T., Lahitte, P., Nativel, P., and Gillot, P.-Y.: Geomorphic Evolution of the Piton Des Neiges Volcano (Réunion Island, Indian Ocean): Competition between Volcanic Construction and Erosion since 1.4 Ma, Geomorphology, 136, 132–147, https://doi.org/10.1016/j.geomorph.2011.06.009, 2012. a, b
Schaefer, L. N., Di Traglia, F., Chaussard, E., Lu, Z., Nolesini, T., and Casagli, N.: Monitoring Volcano Slope Instability with Synthetic Aperture Radar: A Review and New Data from Pacaya (Guatemala) and Stromboli (Italy) Volcanoes, Earth-Sci. Rev., 192, 236–257, https://doi.org/10.1016/j.earscirev.2019.03.009, 2019. a, b
Scott, K. M., Vallance, J. W., Kerle, N., Macías, J. L., Strauch, W., and Devoli, G.: Catastrophic Precipitation-Triggered Lahar at Casita Volcano, Nicaragua: Occurrence, Bulking and Transformation, Earth Surf. Proc. Land., 30, 59–79, https://doi.org/10.1002/esp.1127, 2005. a
Siebert, L.: Large Volcanic Debris Avalanches: Characteristics of Source Areas, Deposits, and Associated Eruptions, J. Volcanol. Geoth. Res., 22, 163–197, https://doi.org/10.1016/0377-0273(84)90002-7, 1984. a
Siebert, L., Glicken, H., and Ui, T.: Volcanic Hazards from Bezymianny- and Bandai-type Eruptions, B. Volcanol., 49, 435–459, https://doi.org/10.1007/BF01046635, 1987. a, b
Singhal, B. B. S. and Gupta, R. P.: Hydrogeology of Volcanic Rocks, in: Applied Hydrogeology of Fractured Rocks: Second Edition, edited by: Singhal, B. and Gupta, R., Springer Netherlands, Dordrecht, 257–268, https://doi.org/10.1007/978-90-481-8799-7_14, 2010. a
Solaro, C., Boudon, G., Le Friant, A., Balcone-Boissard, H., Emmanuel, L., and Paterne, M.: New Insights into the Recent Eruptive and Collapse History of Montagne Pelée (Lesser Antilles Arc) from Offshore Marine Drilling Site U1401A (IODP Expedition 340), J. Volcanol. Geoth. Res., 403, 107001, https://doi.org/10.1016/j.jvolgeores.2020.107001, 2020. a, b, c
Stothers, R. B.: The Great Tambora Eruption in 1815 and Its Aftermath, Science, 224, 1191–1198, https://doi.org/10.1126/science.224.4654.1191, 1984. a
Thiele, S. T., Grose, L., Samsu, A., Micklethwaite, S., Vollgger, S. A., and Cruden, A. R.: Rapid, semi-automatic fracture and contact mapping for point clouds, images and geophysical data, Solid Earth, 8, 1241–1253, https://doi.org/10.5194/se-8-1241-2017, 2017. a
Thiery, Y., Reninger, P.-A., Lacquement, F., Raingeard, A., Lombard, M., and Nachbaur, A.: Analysis of Slope Sensitivity to Landslides by a Transdisciplinary Approach in the Framework of Future Development: The Case of La Trinité in Martinique (French West Indies), Geosciences, 7, 135, https://doi.org/10.3390/geosciences7040135, 2017. a
Thiery, Y., Reninger, P.-A., and Nachbaur, A.: Airborne Electromagnetics to Improve Landslide Knowledge in Tropical Volcanic Environments, Appl. Sci., 11, 3390, https://doi.org/10.3390/app11083390, 2021. a, b
Thouret, J. C.: Volcanic Geomorphology – an Overview, Earth-Sci. Rev., 47, 95–131, https://doi.org/10.1016/S0012-8252(99)00014-8, 1999. a
Thouret, J. C., Antoine, S., Magill, C., and Ollier, C.: Lahars and Debris Flows: Characteristics and Impacts, Earth-Sci. Rev., 201, 103003, https://doi.org/10.1016/j.earscirev.2019.103003, 2020. a
Vallance, J. W. and Iverson, R. M.: Lahars and Their Deposits, in: The Encyclopedia of Volcanoes, Academic Press, Amsterdam, second edition edn., 649–664, https://doi.org/10.1016/B978-0-12-385938-9.00037-7, 2015. a
van Wyk de Vries, B., Kerle, N., and Petley, D.: Sector Collapse Forming at Casita Volcano, Nicaragua, Geology, 28, 167–170, https://doi.org/10.1130/0091-7613(2000)28<167:SCFACV>2.0.CO;2, 2000. a, b
Verrucci, L., Tommasi, P., Boldini, D., Graziani, A., and Rotonda, T.: Modelling the Instability Phenomena on the NW Flank of Stromboli Volcano (Italy) Due to Lateral Dyke Intrusion, J. Volcanol. Geoth. Res., 371, 245–262, https://doi.org/10.1016/j.jvolgeores.2019.01.007, 2019. a, b
Villeneuve, M. C. and Heap, M. J.: Calculating the Cohesion and Internal Friction Angle of Volcanic Rocks and Rock Masses, Volcanica, 4, 279–293, https://doi.org/10.30909/vol.04.02.279293, 2021. a
Villeneuve, N., Bachèlery, P., and Kemp, J.: La Réunion Island: A Typical Example of a Basaltic Shield Volcano with Rapid Evolution, in: Landscapes and Landforms of France, edited by” Fort, M. and André, M.-F., Springer Netherlands, Dordrecht, 261–270, https://doi.org/10.1007/978-94-007-7022-5_25, 2014. a
Vittecoq, B., Reninger, P. A., Violette, S., Martelet, G., Dewandel, B., and Audru, J. C.: Heterogeneity of Hydrodynamic Properties and Groundwater Circulation of a Coastal Andesitic Volcanic Aquifer Controlled by Tectonic Induced Faults and Rock Fracturing – Martinique Island (Lesser Antilles – FWI), J. Hydrol., 529, 1041–1059, https://doi.org/10.1016/j.jhydrol.2015.09.022, 2015. a
Vittecoq, B., Reninger, P.-A., Lacquement, F., Martelet, G., and Violette, S.: Hydrogeological conceptual model of andesitic watersheds revealed by high-resolution heliborne geophysics, Hydrol. Earth Syst. Sci., 23, 2321–2338, https://doi.org/10.5194/hess-23-2321-2019, 2019. a
Voight, B.: Structural Stability of Andesite Volcanoes and Lava Domes, Philos. T. Roy. Soc. A, 358, 1663–1703, https://doi.org/10.1098/rsta.2000.0609, 2000. a, b
Voight, B., Janda, R. J., Glicken, H., and Douglass, P. M.: Nature and Mechanics of the Mount St Helens Rockslide-Avalanche of 18 May 1980, Géotechnique, 33, 243–273, https://doi.org/10.1680/geot.1983.33.3.243, 1983. a
Wan, C. F. and Fell, R.: Assessing the Potential of Internal Instability and Suffusion in Embankment Dams and Their Foundations, J. Geotech. Geoenviron., 134, 401–407, https://doi.org/10.1061/(ASCE)1090-0241(2008)134:3(401), 2008. a
Westercamp, D., Andreieff, P., Bouysse, P., Cottez, S., and Battistini, R.: Carte Géologique France, Feuille Martinique, http://infoterre.brgm.fr/telechargements/BDCharm50/Martinique.zip (last access: 5 December 2022), 1989. a, b, c