the Creative Commons Attribution 4.0 License.
the Creative Commons Attribution 4.0 License.
 | 19 Aug 2022
Surveying the surveyors to address risk perception and adaptive-behaviour cross-study comparability
Mariana Madruga de Brito
Alexander Fekete
Emeline Comby
Peter J. Robinson
Iuliana Armaş
W. J. Wouter Botzen
Christian Kuhlicke
One of the key challenges for risk, vulnerability and resilience research is how to address the role of risk perceptions and how perceptions influence behaviour. It remains unclear why people fail to act adaptively to reduce future losses, even when there is ever-richer information available on natural and human-made hazards (flood, drought, etc.). The current fragmentation of the field makes it an uphill battle to cross-validate the results of existing independent case studies. This, in turn, hinders comparability and transferability across scales and contexts and hampers recommendations for policy and risk management. To improve the ability of researchers in the field to work together and build cumulative knowledge, we question whether we could agree on (1) a common list of minimal requirements to compare studies, (2) shared criteria to address context-specific aspects of countries and regions, and (3) a selection of questions allowing for comparability and long-term monitoring. To map current research practices and move in this direction, we conducted an international survey – the Risk Perception and Behaviour Survey of Surveyors (Risk-SoS). We find that most studies are exploratory in nature and often overlook theoretical efforts that would enable the comparison of results and an accumulation of evidence. While the diversity of approaches is an asset, the robustness of methods is an investment to be made. Surveyors report a tendency to reproduce past research design choices but express frustration with this trend, hinting at a turning point. To bridge the persistent gaps, we offer several recommendations for future studies, particularly grounding research design in theory; improving the formalisation of methods; and formally comparing theories and constructs, methods, and explanations while collecting the themes and variables most in use.
- Article
(2685 KB) - Full-text XML
-
Supplement
(334 KB) - BibTeX
- EndNote


One of the key challenges for risk, vulnerability and resilience studies is understanding risk perceptions and how these perceptions influence behaviour. A central question is why people fail to act adaptively to reduce future losses, even when there is increasingly richer risk information provided by various communication channels (e.g. websites, social media, mobile applications, and television and print news). Whilst United Nations (UN) programmes aim to foster public engagement and community participation in disaster preparedness, recovery and adaptation (UNDRR, 2015, 2019), we have a fragmented understanding of risk perception and risk reduction behaviour drivers (Lechowska, 2018). The current focus of risk management on structural measures, monetary impacts and cost–benefit analyses frequently relies on flawed underlying assumptions as they leave aside social inequalities, actual behaviour, underlying motivations and capacities that can lead to significant differences in resilience across society (Rufat et al., 2020; Kuhlicke et al., 2020). Such a narrow focus runs the risk of hollowing out resilience by overlooking citizens' perceptions, knowledge, capacities, motivations and behaviours. This hinders the achievement of more inclusive climate change adaptation (CCA) and disaster risk reduction (DRR) called for by the UN Sendai Framework (2015–2030) and the UN Sustainable Development Goals (SDGs 2030).
The current fragmentation of academic research on risk perception, behaviour and adaptation and the historically disparate development of DRR and CCA communities hinder comparability and transferability across scales and contexts in research fields defined by high degrees of uncertainty. Such issues are related to, although different from, those associated with the “replication crisis” (Shrout and Rodgers, 2018). The interdisciplinary theories and methods used are shaped by different sets of assumptions and often lead to inconsistent or contradictory findings (Bradford et al., 2012). Lindell (2022) suggested that these problems might be addressed by meta-analyses revealing a moderator variable (for contradictory findings) or inconsistent operationalisation of indicators (for inconsistent findings). Competing theories and divergent methods fragment our understanding of risk perception (Bamberg et al., 2017), with disagreement on drivers (Lechowska, 2018) and their interactions (Rufat et al., 2015) and influence on individual behaviour (Bubeck et al., 2012). Whilst predicting the actual behaviour of people before, during and after a crisis remains a major challenge (Kreibich et al., 2017), it is often assumed that risk communication and awareness campaigns can foster desired judgement, motivation and behaviour (Rufat et al., 2020). Most theories assume that high risk perception will lead to personal preparedness and then risk mitigation behaviour, but it has been verified repeatedly that high risk perceptions do not lead to preparedness or adaptive action (Wachinger et al., 2013). The current “behavioural turn” in DRR and CCA (Kuhlicke et al., 2020) overlooks this gap, with recent strategies advocating that less protected households are individually responsible for looking after themselves. The reasons for this shift are that stretched public budgets are deemed unable to carry the costs for upgrading structural measures (Slavikova, 2018) and policy is increasingly relying on individual resilience (Begg et al., 2017). Lindell (2022) also suggested that the destruction of transportation infrastructure in a disaster can prevent the authorities from delivering assistance.
The main sources of uncertainty in the design of risk perception, behaviour and adaptation studies include the many drivers of risk reduction behaviour, demographic, social and cultural factors (Wilkinson, 2001; de Brito et al., 2018); under- or overestimation of risk (Mol et al., 2020); place attachment (de Dominicis et al., 2015); exposure (O'Neill et al., 2016); previous hazard experience (Botzen et al., 2015); or the use of short-term horizons by households and decision-makers in planning and risk management (Hartmann and Driessen, 2017; Scolobig et al., 2015). However, it remains challenging to disentangle which factors drive risk perception in a specific area or among specific groups (Rufat, 2015).
Diverging risk perception and behaviour theories are used in studies to test limited sets of hypotheses, drivers or control variables, resulting in findings that are not easily rendered compatible (Lechowska, 2018). Although numerous theoretical frameworks have been developed of ways in which risk perceptions are formed and relate to preparedness and/or adaptive behaviour (e.g. Boholm, 1998; Kellens et al., 2013; Robinson and Botzen, 2019; van Valkengoed and Steg, 2019), no definitive explanation has yet been found (Siegrist and Árvai, 2020), and opposite conclusions (positive vs. negative relationships) can be reached from different case studies (Wachinger et al., 2013). Existing theories focus on different dimensions (sociological, economic, psychological), internal or personal factors (gender, age, education, income, values, trust), external or contextual factors (e.g. vulnerability, institutions, power, oppression or cultural backgrounds), risk or environmental factors (e.g. perceived likelihood or experienced frequency), and/or informational factors (e.g. media coverage, experts or risk management). This situation is not satisfying in the long run as it hinders the production of a common baseline for risk perception and adaptation studies and prevents the comparison of empirical insights derived from different studies and thus the accumulation of evidence. The current fragmentation of the field makes it an uphill battle to cross-validate the results of the current collection of independent case studies. This, in turn, hinders comparability and transferability across scales and contexts and hampers recommendations for policy and risk management. Improving comparability would significantly increase the ability of researchers from different communities to work together and build cumulative knowledge.
Risk perception and adaptive-behaviour studies usually follow a case-study approach. While case studies can provide a deep insight into social phenomena and their context (Orun, 2015), the lack of comparability hampers the generalisation of case-study findings to other situations, thus making potentially ambiguous the interpretation of different study conclusions. This, in turn, limits the accumulation of evidence by, for instance, conducting robust meta-analysis. In this regard, generalising is an important goal for scientific practice as well as for policymaking (Ruzzene, 2012; Runhard, 2017). By increasing case studies' comparability, their external validity can be assessed and, in this way, their generalisability potential enhanced (Ruzzene, 2012). This can allow researchers to identify and understand similarities and differences in the risk perception of exposed people in different regions. Overcoming this lack of comparability can be attempted by having common standards in risk perception studies (e.g. standardised questions, with the same scales).
By sending a survey of surveyors (SoS) to the research community, we wanted to initiate a discussion on research standards in this field. While we obviously cannot all run the same questionnaire or focus groups – because we have different research questions, case studies, geographical settings and social contexts – our ability to work together and build cumulative knowledge can be significantly improved by having (1) a common list of minimal requirements to compare studies and surveys, (2) a set of shared criteria to address context-specific aspects of countries and regions, and (3) a selection of survey questions or themes allowing for comparability and long-term monitoring. We conducted an international survey aiming to map current research practices. The Risk Perception and Behaviour Survey of Surveyors (Risk-SoS) intended to foster convergence and comparison in risk perception, behaviour and adaptation studies. More specifically, we wanted to investigate which theories, variables and elements are frequently targeted by surveyors.
With this survey, we aimed to identify core elements for enabling results comparability while allowing individual surveys to pursue their other specific questions. The original discussion started at the first European Conference on Risk Perception, where struggles to define these core elements within a limited group of experts occurred (Rufat and Fekete, 2019).
The survey consisted of 30 questions, mainly multiple-choice questions (see Supplement). Established brainstorming techniques were used during webinar group discussions to select the questions to be included. The first three questions dealt with the respondents' methodological practices in terms of data collection. Questions 4–7 focused on the disciplines and social theories used by the surveyors. Questions 8–14 addressed the variables analysed, focusing on explanatory variables such as age, gender and education. Questions 15–19 related to the pre-pandemic and post-pandemic survey designs and sample sizes. Questions 20–22 discussed the comparison effort and expectations regarding the variables compared. The final questions described the surveyor's experience in terms of diversity of case studies and risks studied; they also captured demographic variables (country of residence, gender, employment and education). Before disseminating the survey, we tested it within our group to eliminate ambiguities.
Risk-SoS was disseminated in a snowball fashion to reach the community by sending personal emails between December 2020 and April 2021. We first wrote personally to scientists who had published empirical studies in English academic journals relevant to the field during the last 20 years. We wrote to colleagues based in Europe, requesting them to forward the survey invitation to other persons who might be interested, and subsequently sent several reminders. Although our original focus was on Europe, the snowball effect allowed us to reach other continents. In total, 150 experts from more than 25 countries, one-quarter outside of Europe (Fig. 1), answered the survey (N=150). Their backgrounds included experience in individual or community perceptions of risk, climate impacts or hazards adaptation behaviour, using surveys, interviews, experiments or focus groups.
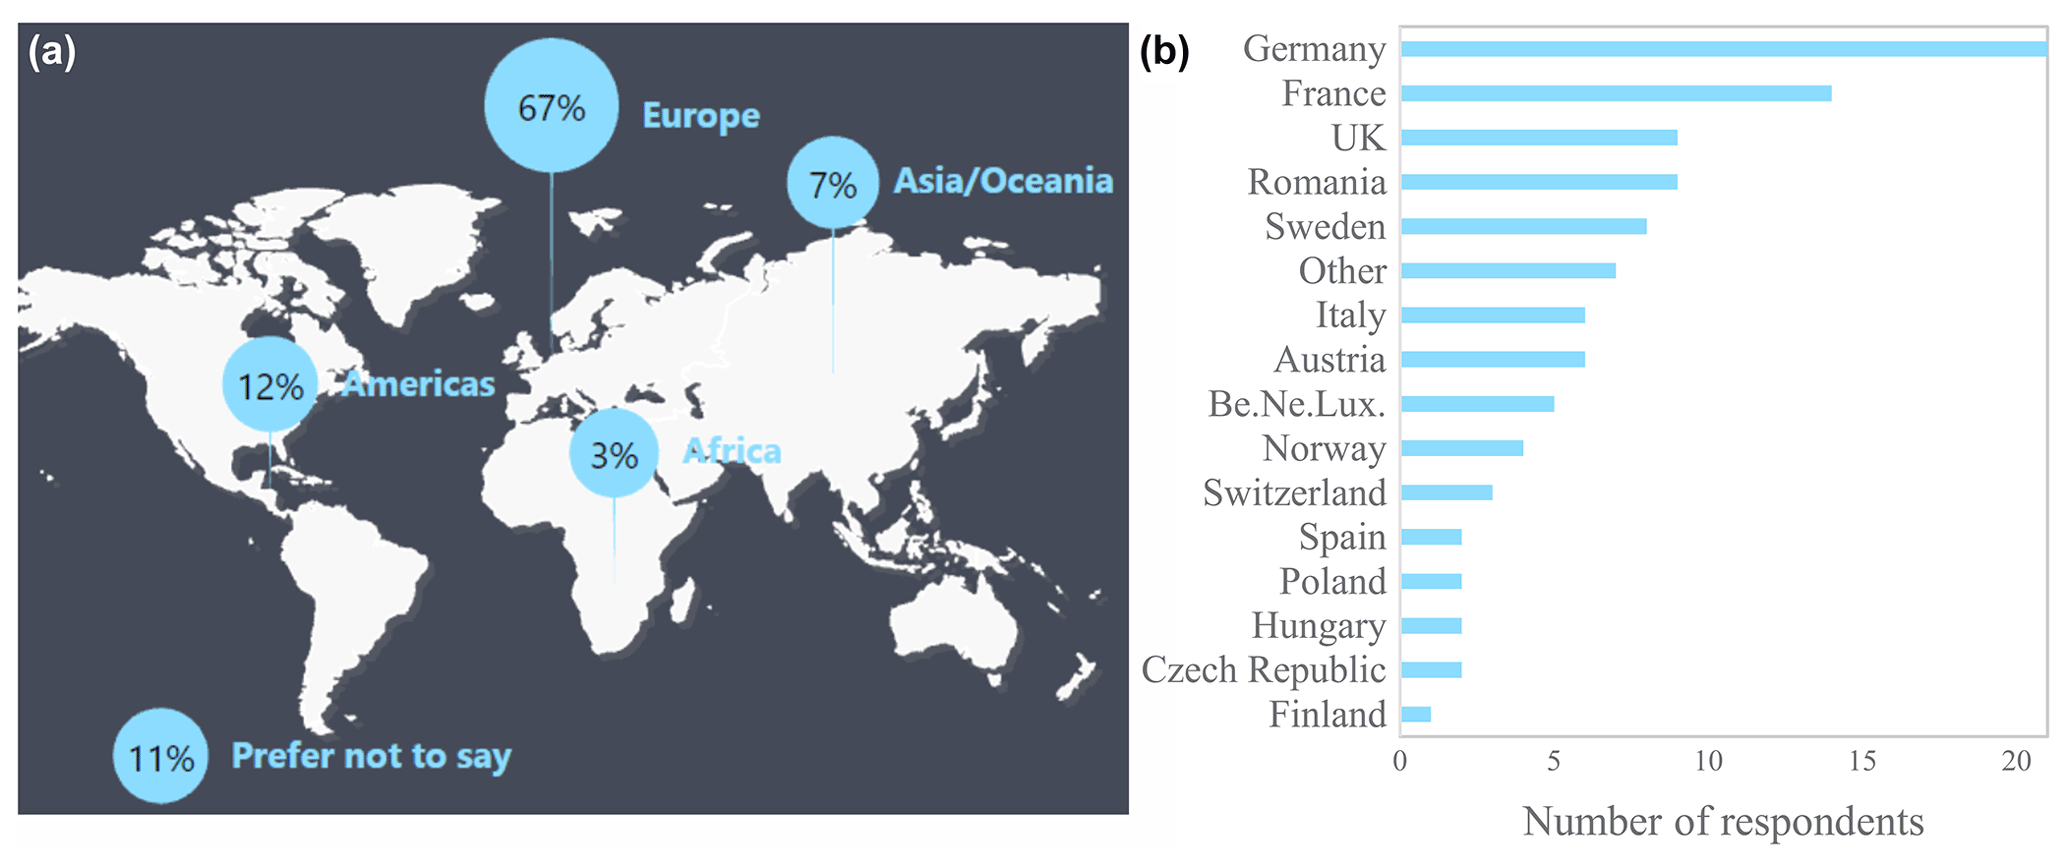
Figure 1(a) Continent of employment of the 150 respondents, (b) Number of respondents according to the participant's country of employment in Europe. Be.Ne.Lux corresponds to Belgium, the Netherlands and Luxembourg.
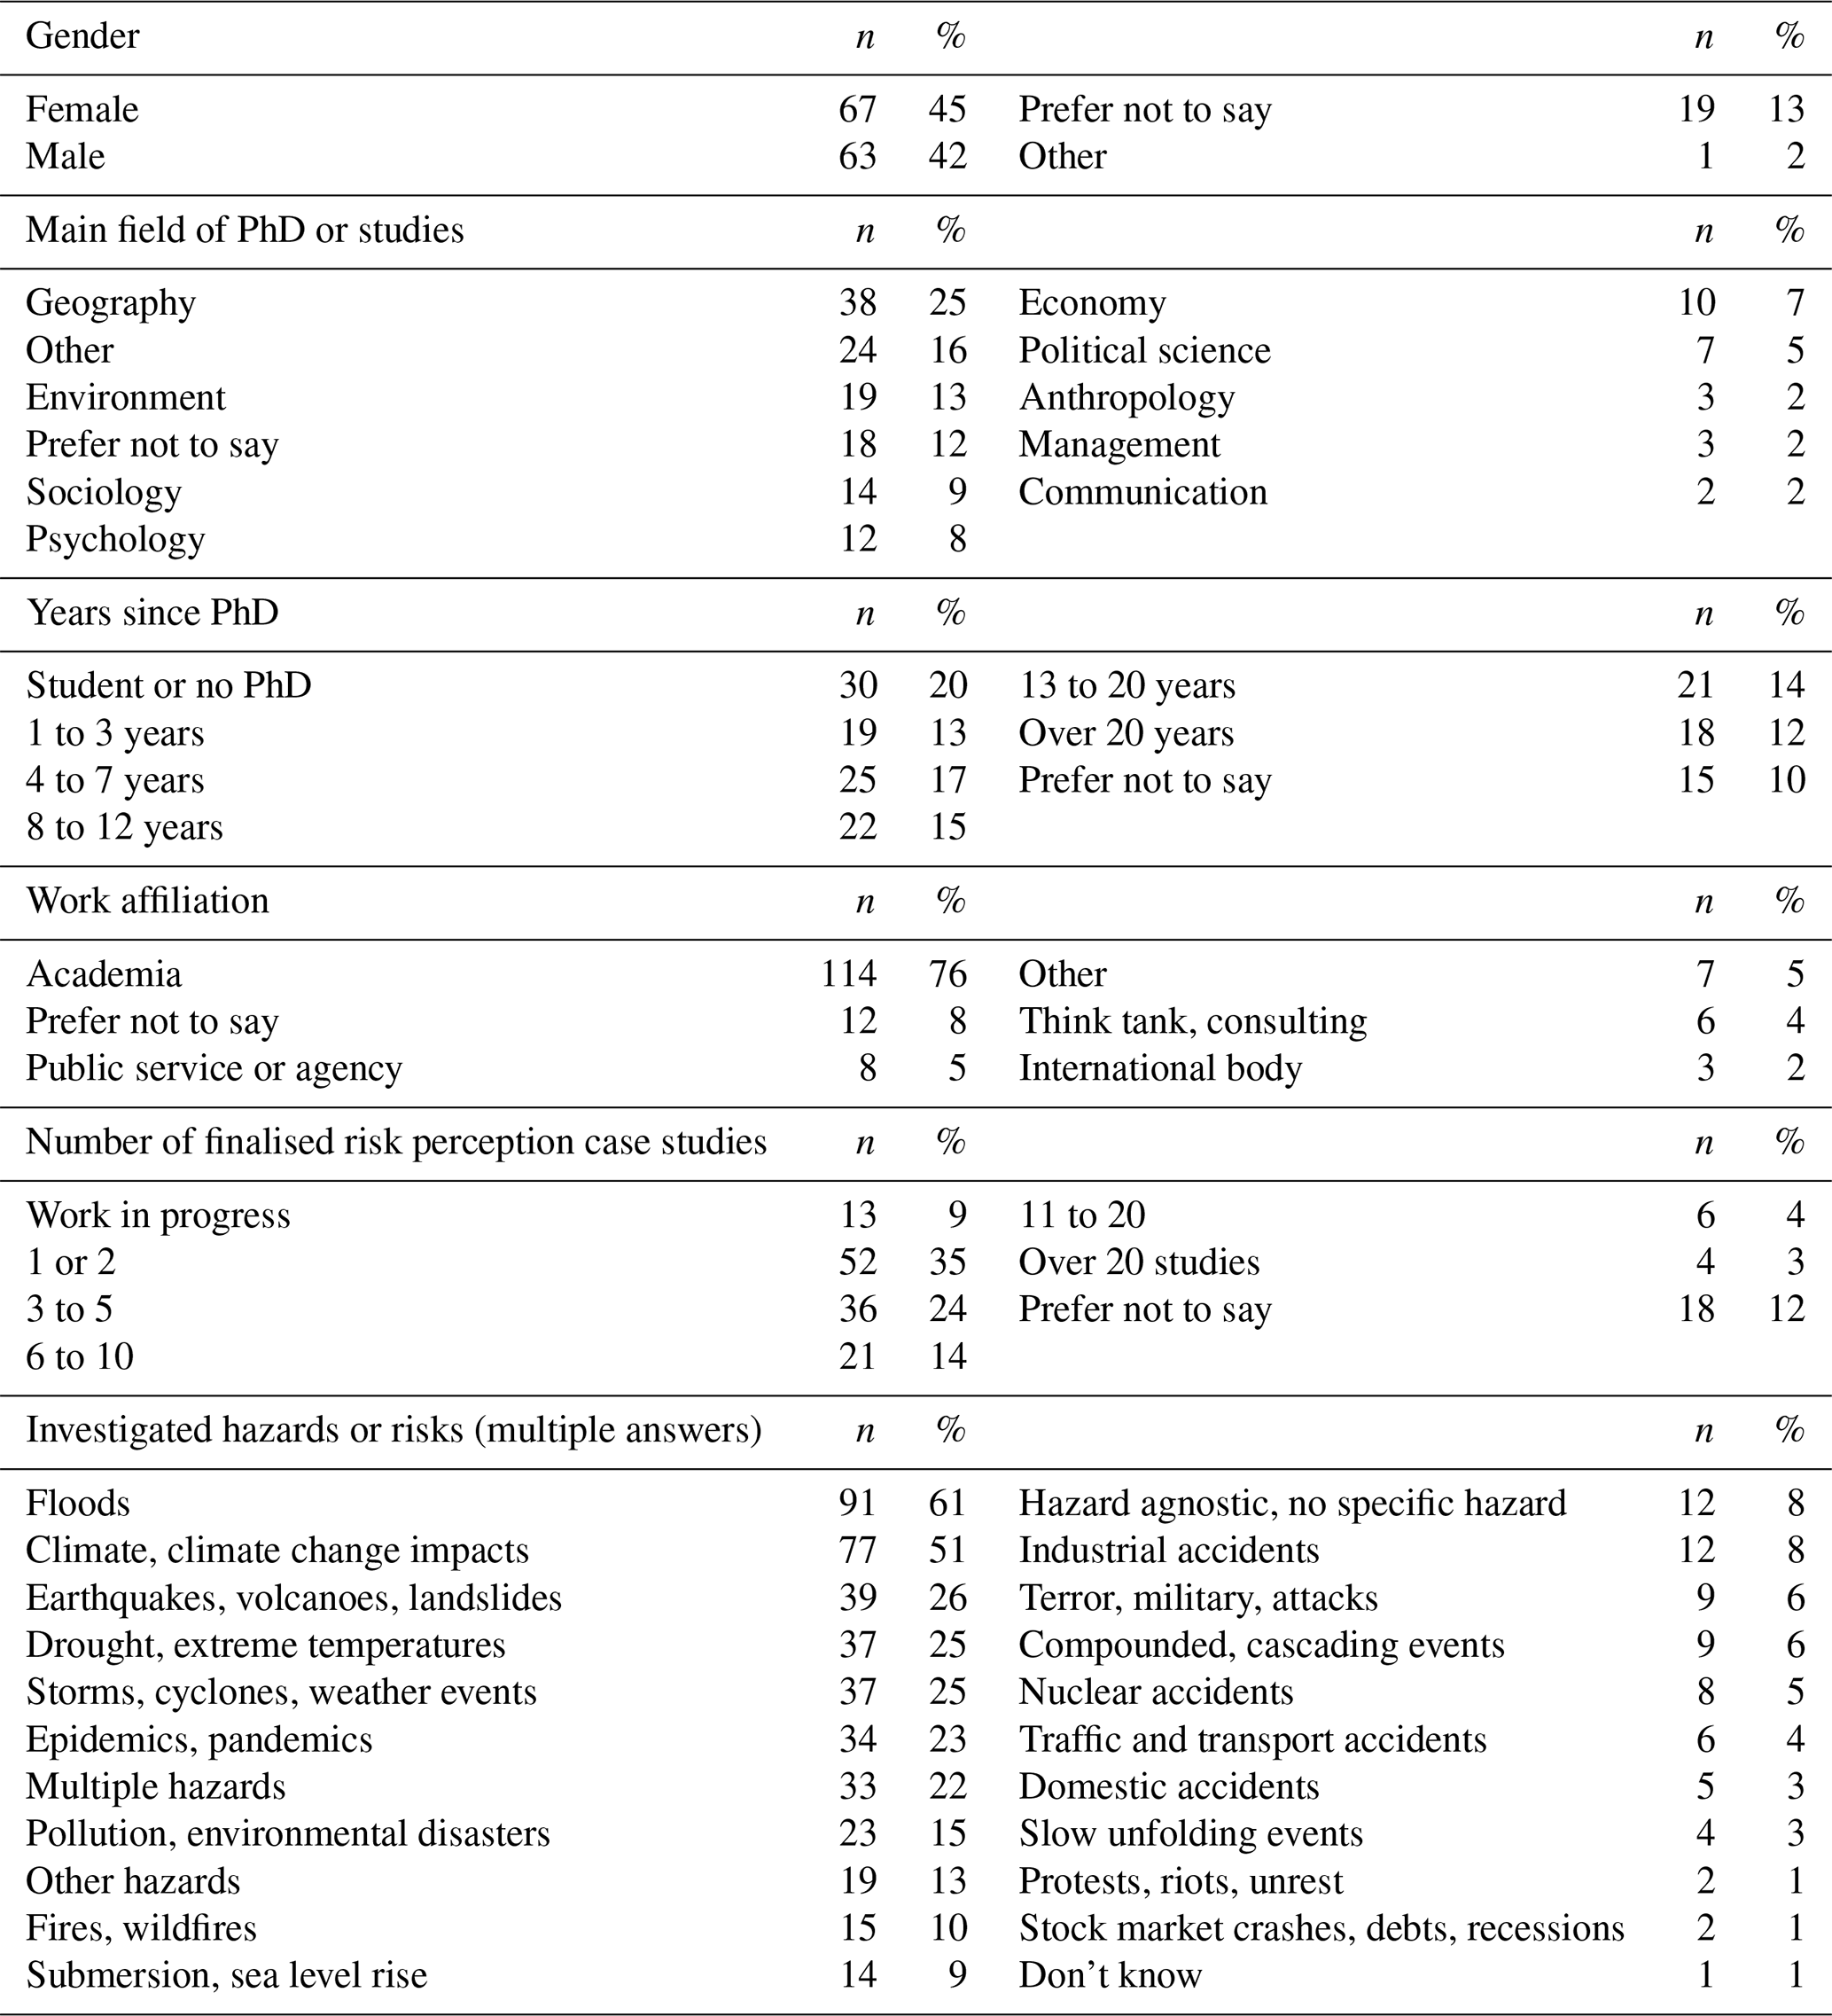
Our sample was balanced in terms of gender (Table 1). Most surveyors (n=107, 71 %) had a PhD; some of the others were PhD students. The snowball method allowed us to reach a population with substantial experience in research. This observation was confirmed by the number of studies already conducted. Just under half of the respondents (n=68, 45 %) had conducted more than three risk studies; 53 (35 %) had conducted one or two studies; 13 (9 %) were currently working on their first study. While most respondents have been working on floods (n=91, 61 %) and climate change impacts (n=77, 51 %), the question on the hazards they investigate was multiple choice and reflects a considerable diversity with over a quarter of respondents having studied each of the following: earthquakes, volcanoes, landslides, droughts, storms, cyclones and/or epidemics. Most respondents (n=114, 76 %) were currently working in academia. Thus, our respondents had experience with risk studies. Around a quarter of the respondents (n=42, 28 %) did not wish to be associated with only one humanities and social sciences discipline. A quarter of the respondents considered themselves geographers (n=38, 25 %), 18 (13 %) environmental scientists, 14 (9 %) sociologists, 12 (8 %) psychologists and 10 (7 %) economists. The results were collected and treated anonymously. They were shared and discussed with the community during monthly Risk-SoS webinars (Rufat et al., 2021).
Table 1Participants' characteristics and hazards they investigate.
The study was meant to be an exploration to map current practices. Therefore, we did not a priori define a set of hypotheses or specify an overarching framework. A combination of descriptive statistics was used to present the results. Moreover, bivariate (Pearson correlation, χ2 test) and multivariate (logistic regression) statistics were used to assess significant relationships among the answers, as well as between replies and the respondents' backgrounds.
Several theoretical strands from social sciences, psychology and environmental sciences have been introduced to support risk perception and behaviour studies. The use of theoretical constructs is encouraged as they can lead to deeper and more thorough insights into the social world. Furthermore, they allow for comparison and the consequent accumulation of evidence (Kuhlicke et al., 2020; Rufat et al., 2020).
Despite this importance, survey results showed that a large share of the participants (n=53, 35 %) had not relied on any particular theoretical model or framework to guide the design of their studies (Fig. 2). At first sight, this result might be surprising. However, it is worth mentioning that the reasons for considering theories were not captured in our survey. It may be that an underlying theory informed the research, even if the researchers did not state it clearly. Also, as many respondents mentioned that they designed their studies based on the literature or a previous study, it is possible that previous studies (including theories) inspired their choices. Additionally, it could be the case that there were good or even theoretical reasons to not apply a theory or to conduct a study inductively without the influence of pre-existing theories. In this regard, a participant mentioned that “I do not tend to use a single explicit theory in a deductive way but am informed by PMT and COM-B”.1 The responses may have also been influenced by how the question and answers were framed. Indeed, three participants that had declared the use of “no particular theory” mentioned in a subsequent question that they had formally compared more than two theories in the same study.
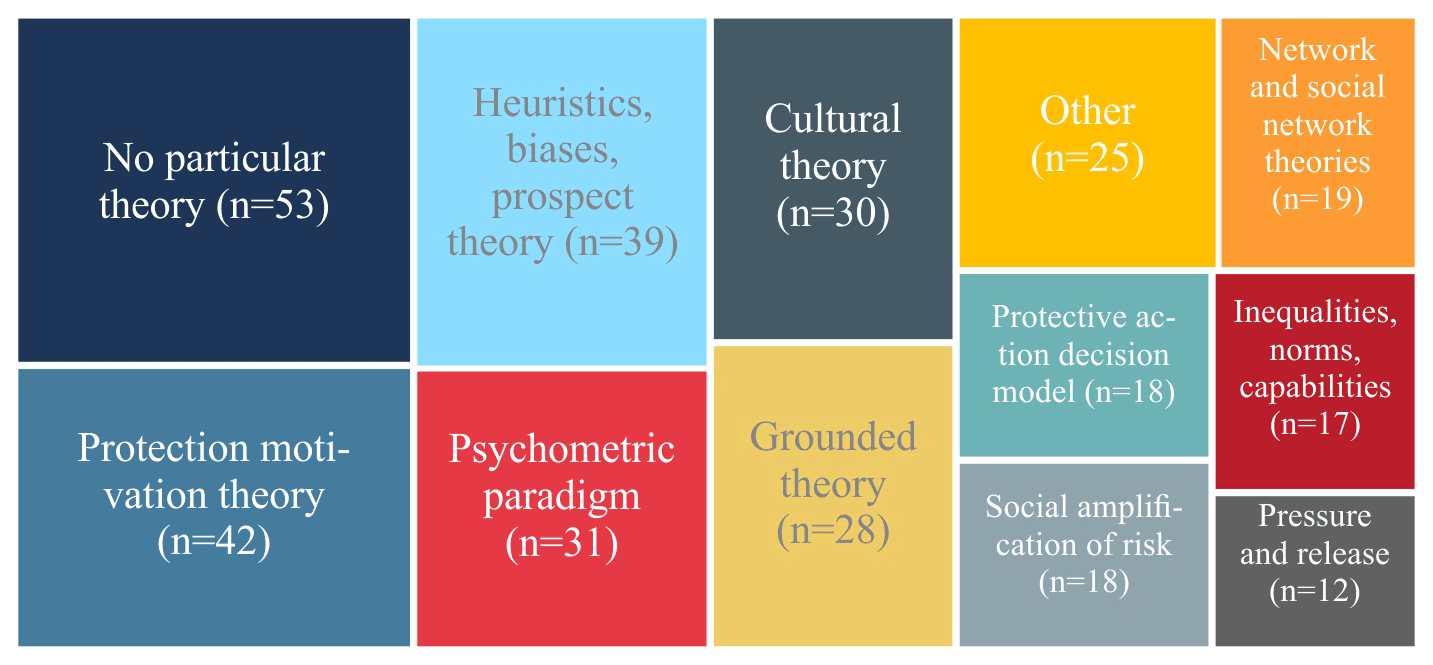
Figure 2Replies to the question, “Did you ever use a theoretical model or framework to guide the design of any of your studies on risk perception or behaviour?” Only theories that were mentioned more than 10 times are shown.
Of those who had considered a theoretical framing, most used “protection motivation theory” (n=42, 28 %), followed by “heuristics, biases, prospect theory”; the “psychometric paradigm”; and “cultural theory”. This was expected as these frameworks are well established in this field of research. Twenty-five (17 %) participants had used other frameworks not included in the survey, such as the model of pro-environmental behaviour, the mental model approach, Cutter's framing of social vulnerability, construal level theory, game theory, sense of place, the transtheoretical model, hyperbolic discounting and social capital. The high number of “other” responses warrants further investigation.
Differences existed according to the hazard investigated (Fig. 3a). Indeed, more than 50 % of the participants studying “traffic and transport accidents”; “domestic accidents”; “protests, riots, unrest”; “sea level rise”; and “nuclear accidents” did not rely on a particular theory. Conversely, participants from the hazard fields “industrial accidents”; “compounded, cascading events”; “epidemics, pandemics”; and “multiple hazards” tended to conduct theoretically grounded research.
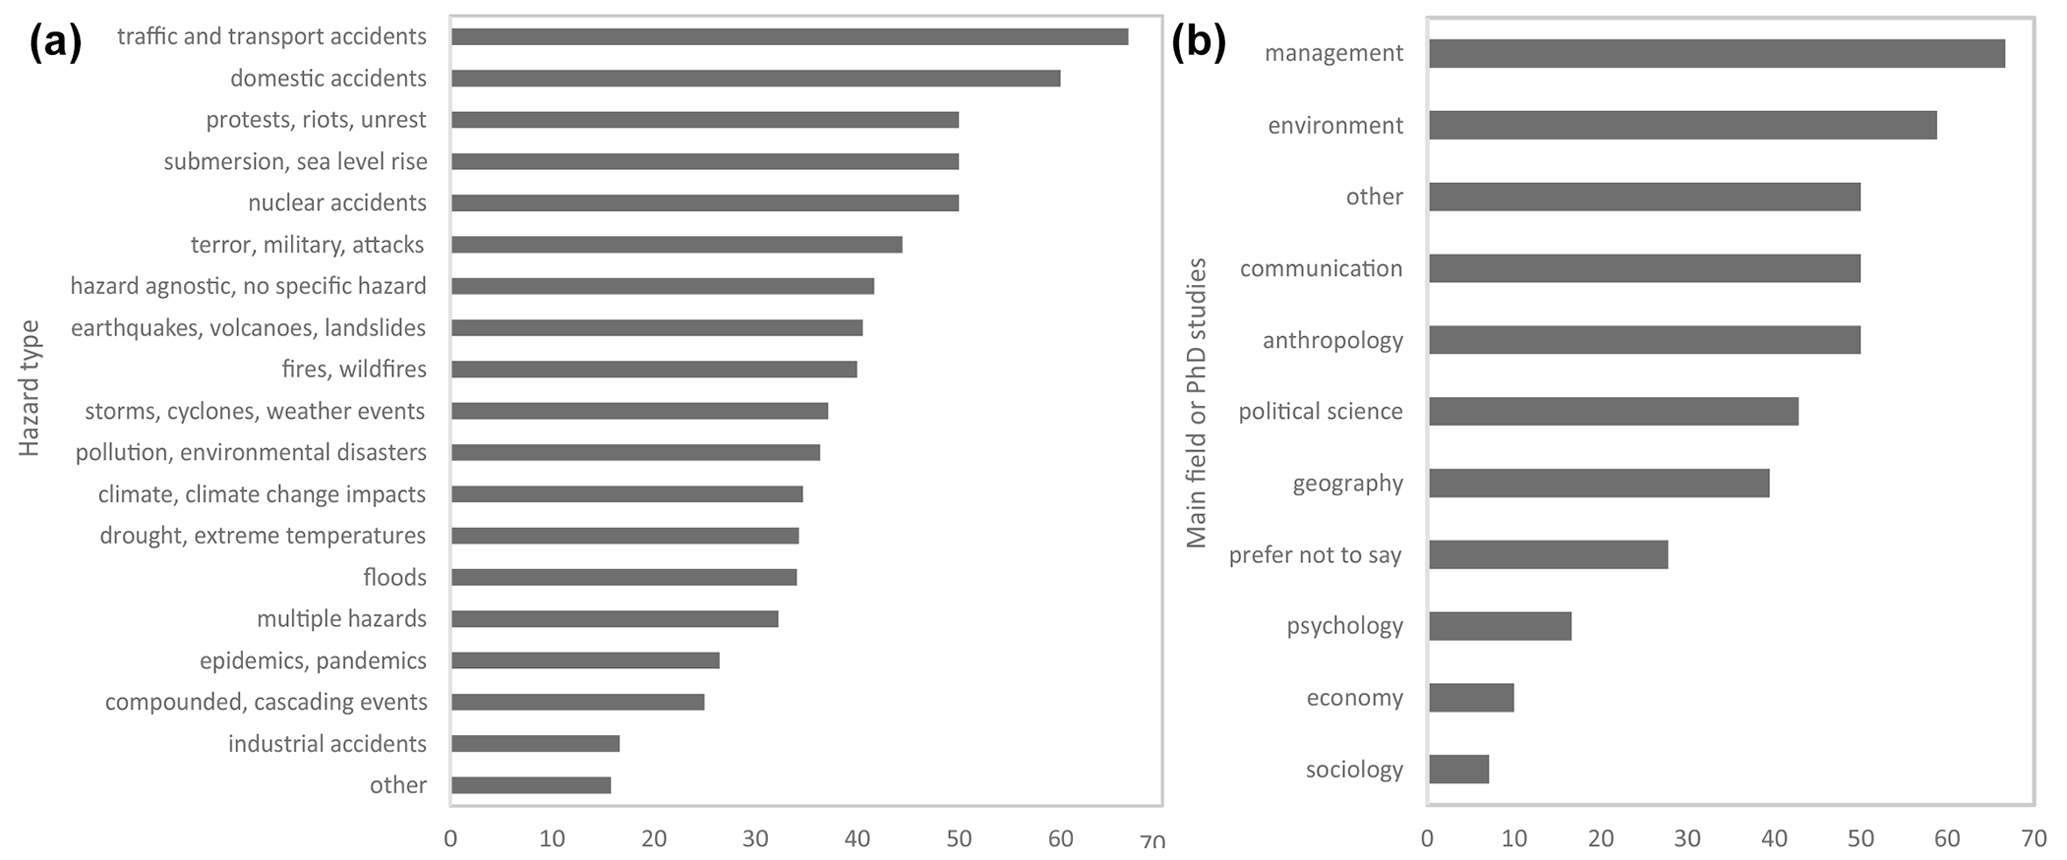
Figure 3Percent of respondents that did not rely on a theory, according to (a) the hazard they investigated and (b) their field of knowledge.
Differences were also observed according to discipline. Only 7 % (n=1) of the “sociology” participants did not rely on a particular theory. Conversely, 59 % (n=10) of the participants with a background in environmental sciences did not rely on a particular theory. Given the large share of geographers (n=38, 25 %) and environmental disciplines (n=18, 13 %) (Table 1), it is surprising that theories from these fields (e.g. pressure and release, hazards of place) did not receive a high number of responses. However, in our results, neither discipline is particularly strong in theory application (Fig. 3b). The fact that many researchers work in interdisciplinary groups might also help to explain why standard and psychological theories had been used more often. By grouping respondents according to their training, with geographers and environmental scientists in one group, sociologists and psychologists in another, and a third group with all others, we find a significant difference in their approach to risk perception and behaviour. Those in psychology or sociology had an 85 % higher chance than those in geography or environmental disciplines to prefer a specific theory (logistic regression of −1.86, i.e. a chance of 0.155). In other words, those trained in sociology and psychology were more likely to have the methodological background to formulate working hypotheses following specific theories and use measurement scales to capture human perceptions and behaviours.
A key interest of this study was to identify what is being studied in risk perception surveys, which key elements are most often explicitly targeted by the surveyors and what may be deemed out of focus. To explore this, two questions were designed to disentangle the range of choices and uncover possible convergences around key approaches and foci. While the respondents converged around some key elements, there was less agreement on the usefulness of such convergence. Results of the question “What did you try to capture with your risk perception questions?” showed that surveyors captured a multitude of elements (23 items) in their surveys (Fig. 4). This indicates that the respondents were aware that risk perception and behaviour are complex phenomena that cannot be easily reduced to a few elements.
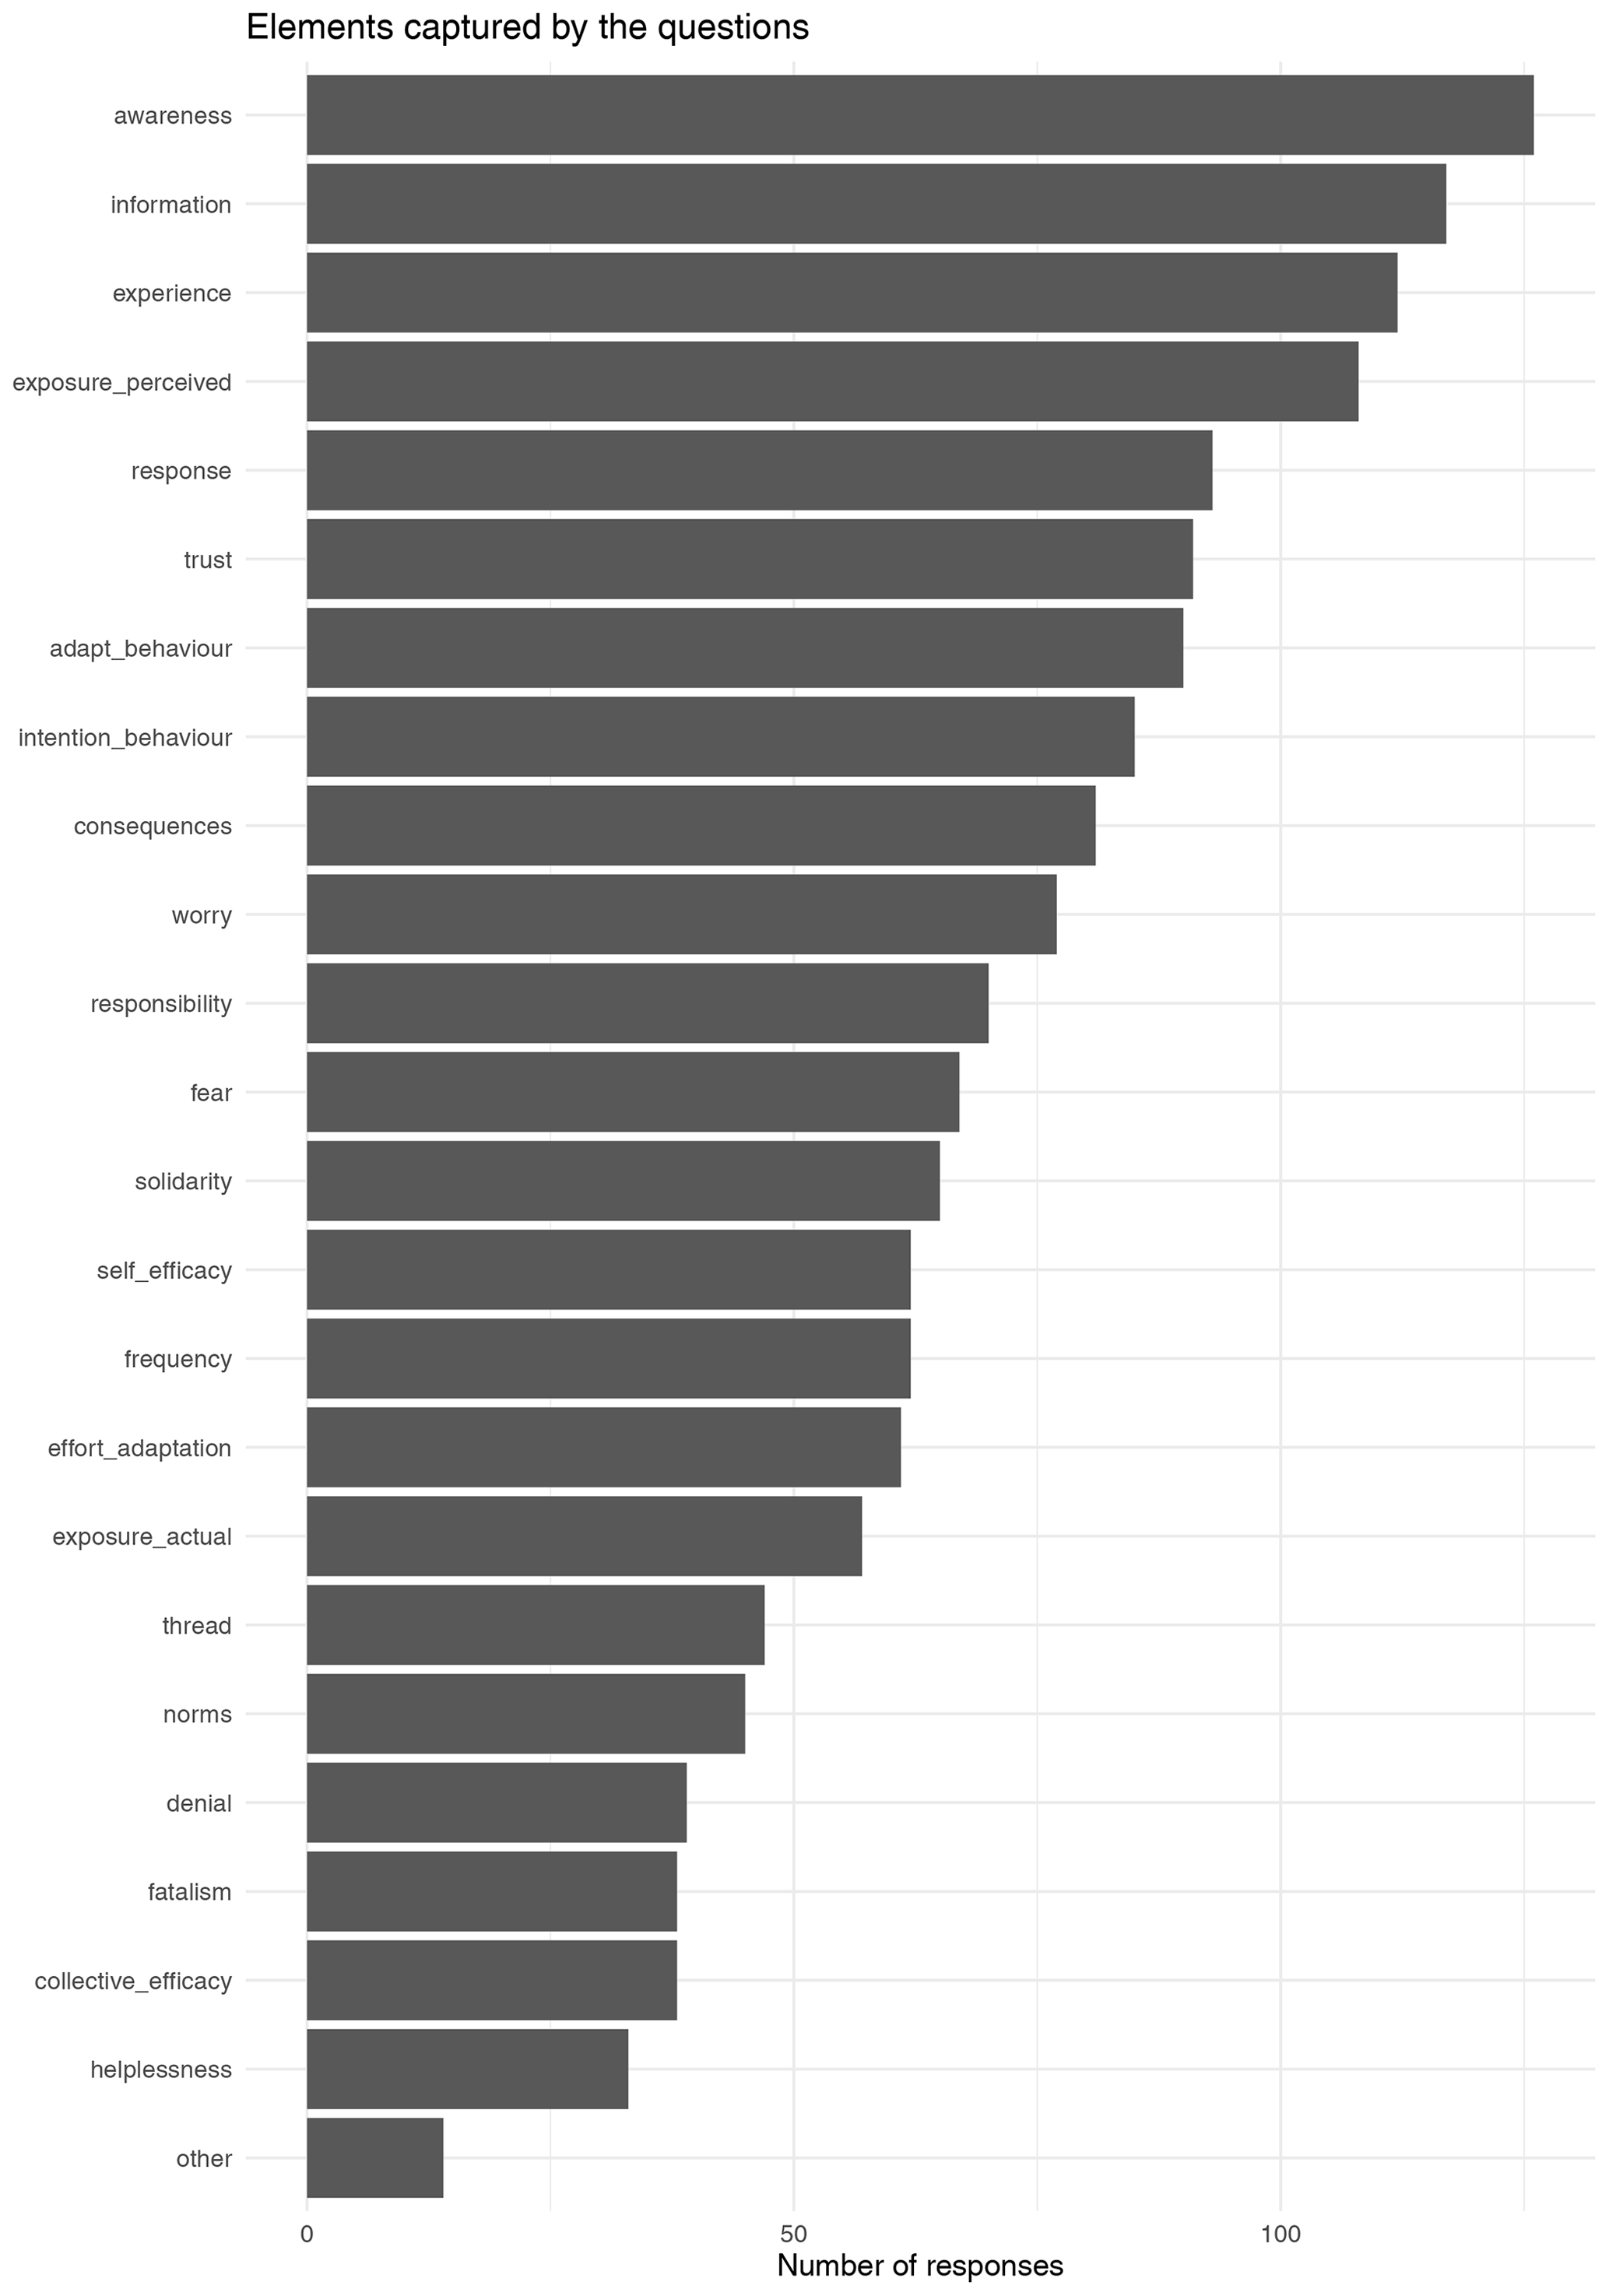
Figure 4Responses to “What did you try to capture with your risk perception questions?” The respondents could select multiple options.
The highest numbers of mentions were directed towards knowledge-related elements such as awareness, information or experience, which each received up to 120 responses per element (80 % of respondents). The lowest numbers, although still up to 50 responses (33 % of respondents), were given for “helplessness”; “collective efficacy”; “fatalism”; and “denial, wishful thinking”. Around 20 (13 %) respondents selected the option “other”. Low numbers of responses should not be over-interpreted: they may be as important, but there is less agreement on their relevance or awareness of their use amongst the respondents. Actual exposure was much less mentioned than perceived exposure. Of course, there may be biases introduced, as some elements could be considered similar. For example, the combined number of responses for “fear” and “worry” exceeds the highest numbers per element recorded. It could be tempting to group them as they might be considered examples of automatic processes (Moors and De Houwer, 2007), while denial and fatalism might be considered examples of controlled processes. However, the correlation between the two is only 0.55, indicating that the respondents make a difference between them. While 55 (37 %) respondents said they used both worry and fear in their studies, 22 (15 %) used worry but did not use fear, 12 (8 %) only used fear and 61 (41 %) used neither. We, therefore, encourage reading the results carefully and want to leave interpretation as open as possible to foster discussion.
Regarding comparability, around one-third of respondents chose to skip the question “From your experience, what would be the three decisive questions or themes for cross-study comparability?” or stated that they did not know (n=49, 32 % for the first item, 33 % for the second and 36 % for the third). In contrast to the convergence on the most used questions (Fig. 4), there was a wide dispersion on the most decisive questions or themes for cross-study comparability (Fig. 5). Adding the three possible answers, the most cited items were “awareness” (n=34, 8 %), the first choice for 16 % of the respondents and then “information, knowledge” (n=33, 7 %); “response, coping”, often a third choice (n=28, 6 %); “previous experience” (n=26, 6 %); and “adaptive behaviour” (n=25, 5 %), whereas the others were mentioned less than 5 % of the time.
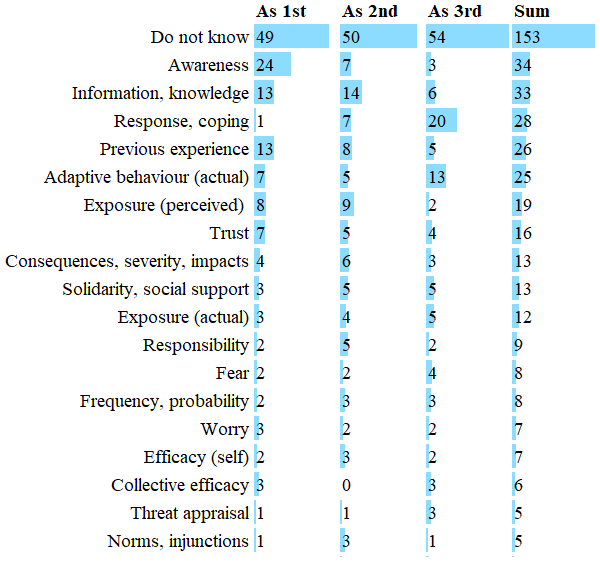
Figure 5Responses to “From your experience, what would be the three decisive questions or themes for cross-study comparability?” Only items with five or more responses are shown.
There was more agreement regarding research design choices (Fig. 6). The design of interviews, questionnaires or focus groups most often relied on the literature in general (n=115, 77 %), “discussion with co-authors” (n=96, 64 %), “previous (own) studies” (n=84, 56 %) and working “on my own” (n=71, 47 %). Fewer respondents considered “other studies to compare” (n=78, 52 %) or “discussions with practitioners or decision-makers” (n=56, 37 %). This pattern may constrain the comparability of studies, which is a key interest of our Risk-SoS study – that is, to find out how studies can be better compared or designed to be comparable. Almost one-quarter of the respondents designed studies without considering previous studies or “the literature”. While the relatively large share of studies designed “on my own” (47 %) might recall the share of studies not using theoretical models or frameworks (35 %), there was no significant relationship between them – in fact, not relying on theory had no significant relationship with any of the answers on design choices.
The same was true for how the questions were selected (Fig. 6). Respondents had most often used the literature in general (n=128, 85 %), “previous (own) studies” (n=79, 53 %), tables and data from “comparison with other studies” (n=74, 49 %), an “exploratory approach” (n=65, 43 %), and “experience and habits” (n=60, 40 %) to identify key questions. Therefore, the convergence on awareness, knowledge, experience and exposure questions might reflect the agreement on reliance on past choices – by relying on either the literature or habits. It did not, however, result in the recognition of the relevance of these choices for improving the field. A shortcoming pointed out by a participant during our webinars is that respondents could declare that they based their questions and method only on the literature, previous studies and other options, and we did not offer the option of theory.
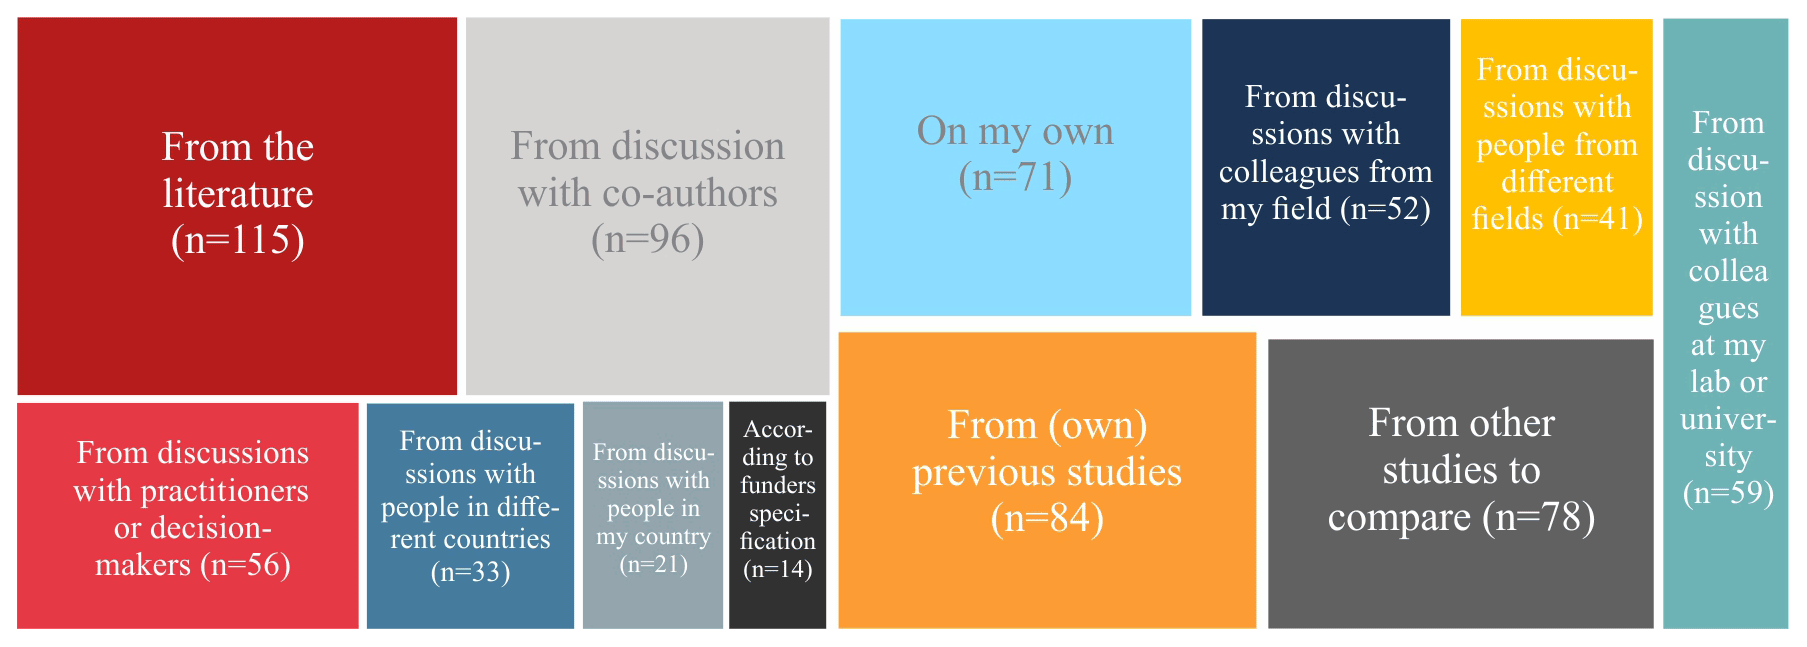
Figure 6Responses to “How are your interviews, focus groups or questionnaires usually designed?”.
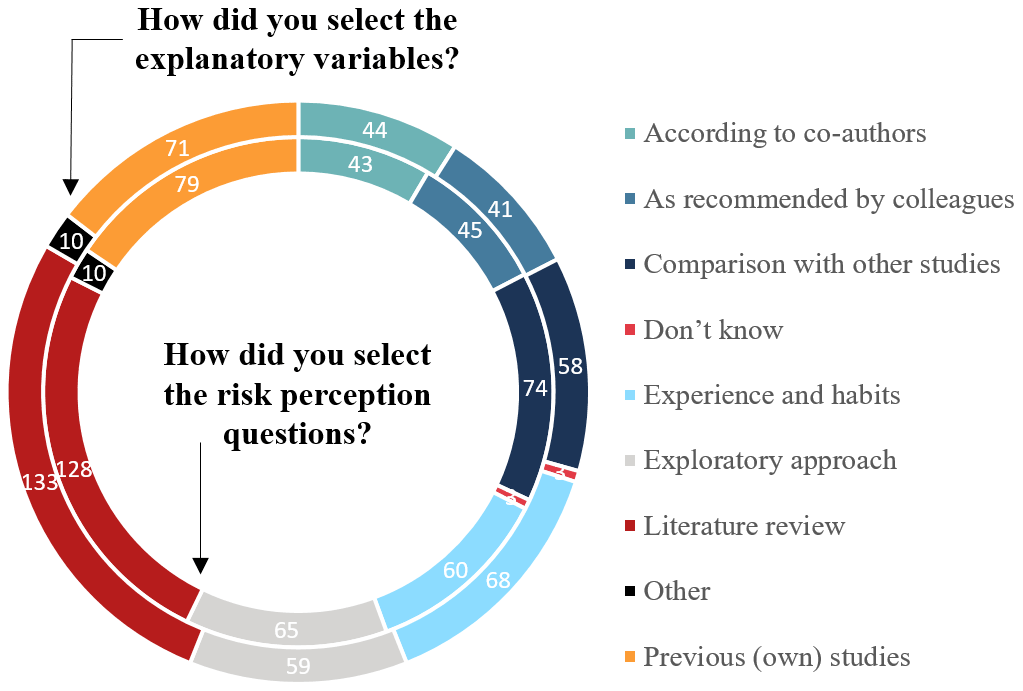
Figure 7Responses to “How did you select the risk perception questions?” (inner circle) and “How did you select the explanatory variables?” (outer circle). These were multiple-choice questions.
Overall, answers on the selection of explanatory variables were consistent with those of other design questions (Fig. 6). Most respondents selected them by considering “literature review” in general (n=133, 87 %), leaving more than 1 in 10 failing to consider previous studies for their design choices. Around half of them based the selection on “previous (own) studies” (n=74, 49 %) or “experience and habits” (n=68, 45 %). Again, only a minority considered in-depth “comparison with specific studies” relevant for their design choices (n=58, 39 %). Among the respondents declaring that they did not rely on theoretical models or frameworks (n=53), 80 % subsequently declared that they did base their variable selection on the literature (χ2=5.86, p=0.01). The other variable selection choices had no significant relationship to the answers on theory. It might be argued that while the respondents did not rely on specific theoretical models themselves, they indirectly incorporated the theoretical framing from previous studies into their own design choices. However, the tendency to reproduce past research design choices and the dissatisfaction with them or the lack of convergence on choices that might improve cross-study comparability points in the opposite direction. Therefore, a closer look at the selection of explanatory variables and the drivers of these choices is required.
Another interest of this study was to identify common explanatory elements and variables used to explain risk perception and adaptive behaviour. Previous studies have shown that results depend on the input of variables (Lechowska, 2018), and a model does not necessarily improve with a greater number of variables (Rufat et al., 2020). In our study, the sheer variety of explanatory variables in use and the divergence in research design choices might give the impression that studies run in parallel universes. Yet, this situation might be the momentary price that is paid without further reflection about the ongoing, loosely coordinated, exploratory, multidisciplinary research effort. Lindell (2022) suggested the field is experiencing “organized anarchy” (Cohen et al., 1972) with the most experienced researchers operating within self-defined domains that are coordinated implicitly and substantially confirmatory.
Socio-demographic characteristics are the most contested drivers of risk perception and evacuation (Rufat et al., 2020; Huang et al., 2016). This led us to ask respondents not only to mention the explanatory variables they have used to study risk perception and behaviour but also to identify the three most relevant variables for cross-study comparability and long-term monitoring (Fig. 8). The surveyors reported having applied a wide diversity of variables to explain variation in risk perceptions and behaviours. Unsurprisingly, socio-demographic characteristics (age, gender, education, income, family or household composition, and occupation) were the most often used. Certain risk or environmental factors were also mentioned frequently, most notably previous hazard experience and hazard exposure. “Age”, “gender”, “education” and “previous hazard experience” each received more than 100 responses (67 %). In addition, over one-third of the respondents chose a few external or contextual factors (vulnerability or resilience), whereas other personal factors were much less commonly used (minorities, disability or language proficiency), and informational factors were largely absent. A moderate number of respondents had used health; insurance demand; anxiety; or resilience and its determinants, that is, social capital and coping capacity. Factors of social vulnerability such as language proficiency and whether the surveyed individual had a disability or was of a minority background were rarely applied. These results are consistent with literature reviews published in recent years (Moreira et al., 2021; Rufat et al., 2020; Lechowska, 2018; Renn and Rohrmann, 2000).
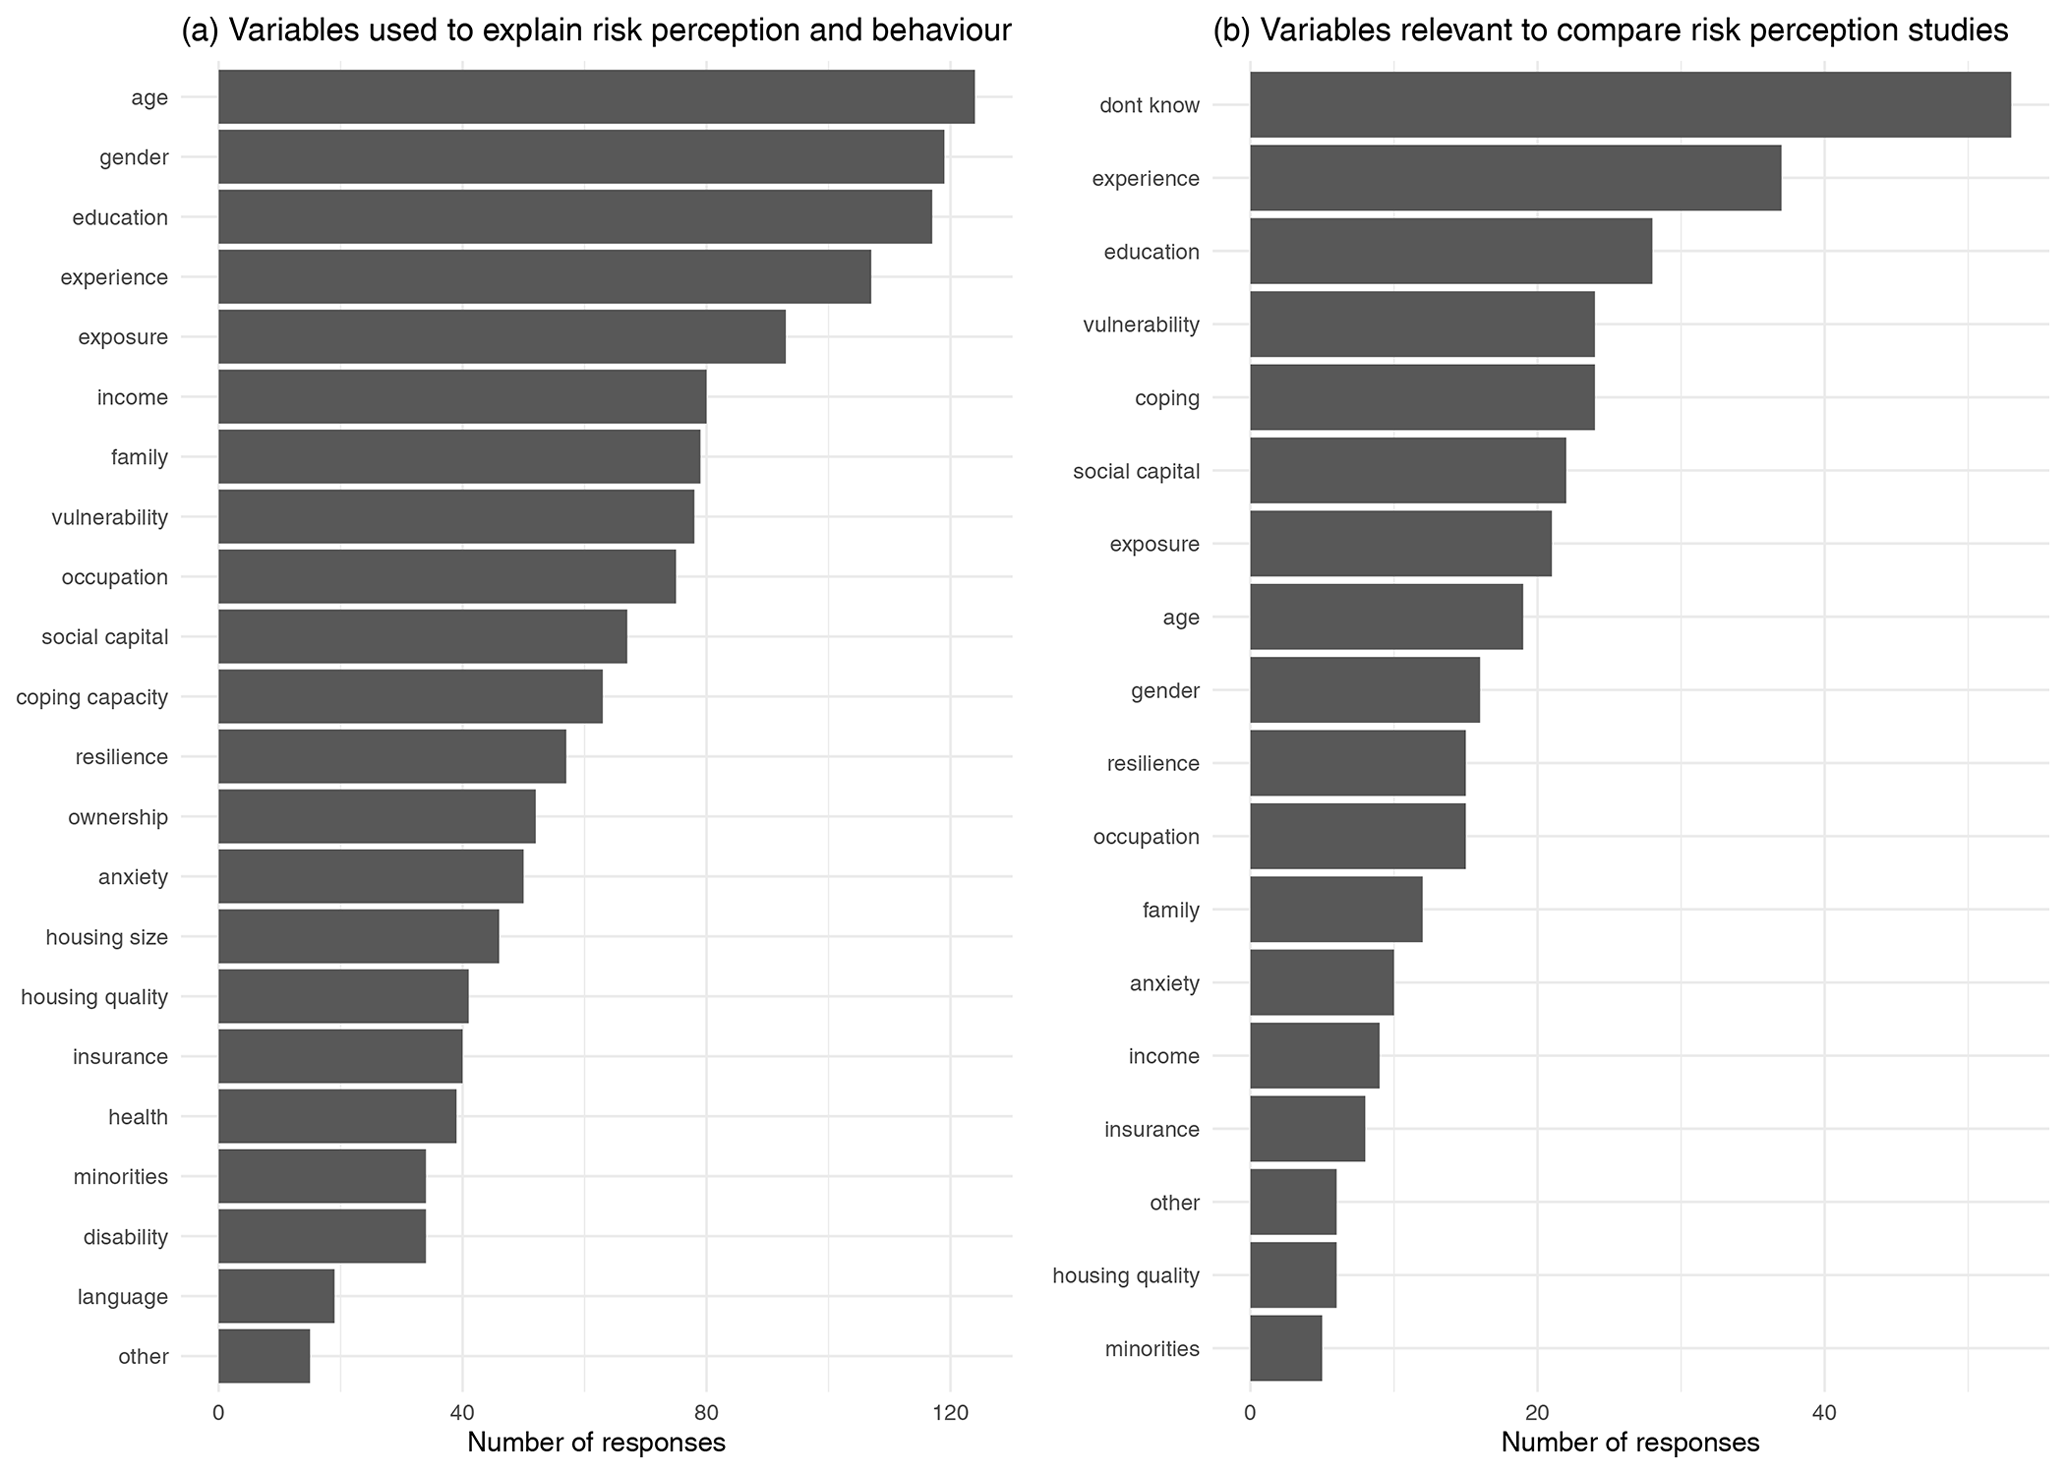
Figure 8The most used variables to explain risk perception and behaviour (a) and variables (three choices) identified as most relevant for cross-study comparability and long-term monitoring (b).
The three most often mentioned variables were ubiquitous – found in most databases – and matched general demographic characteristics. The fourth and fifth, “previous hazard experience” and “exposure to hazards”, were connected to the context of risk. Both reached similar high rankings in the questions asked by surveyors (Fig. 5), likely because they cannot be derived from standard databases and therefore must be collected by surveyors. It is worth noting that “vulnerability” was mentioned more often than “resilience” to explain risk perception and behaviour (Fig. 8a), which may be linked to the theoretical frameworks used to design the studies. Of the 21 options, “health”, “minorities”, “disability” and “language proficiency” were each mentioned by fewer than one-quarter of the respondents. Fourteen (9 %) respondents indicated that there were other useful variables that were not included in our survey. This may point towards a need for further investigation.
What stands out is the discrepancy between the variables used (Fig. 8a) and the variables thought to be critical to cross-study comparability or long-term monitoring (Fig. 8b). Around half of the respondents declared that they did not know which variables were useful to ensure comparability. This result might reflect the current disagreement on risk perception drivers and challenges in directly comparing the current collection of independent case studies. While socio-demographic characteristics (age, gender and education) were often used, followed by risk or environmental factors (experience and exposure) and contextual factors (vulnerability and resilience), the ranking is reversed in the case of comparability or long-term monitoring: environmental factors come first, followed by contextual factors, and socio-demographic factors are less mentioned, except for the role of education. Despite evidence of socio-demographic variables' weak and inconsistent correlations with behavioural variables such as evacuation (Baker, 1991; Huang et al., 2016), it is conventional to measure these variables so that readers can assess the degree to which a survey sample is biased in comparison to census data. Lindell (2022) suggested that their inclusion as predictors requires no imagination and no knowledge of the research area and that they are compatible with any of the theoretical perspectives mentioned by the respondents (Fig. 2).
Figure 9 illustrates a Pearson correlation matrix of all the variables grouped following a hierarchical cluster analysis, with statistically significant correlations (p<0.01) highlighted in red for positive correlations. These correlations are as expected; they identify groups of variables often used together (e.g. age, gender and education); the least frequently reported have fewer relationships; environmental factors (experience and exposure) have fewer relationships than personal factors.
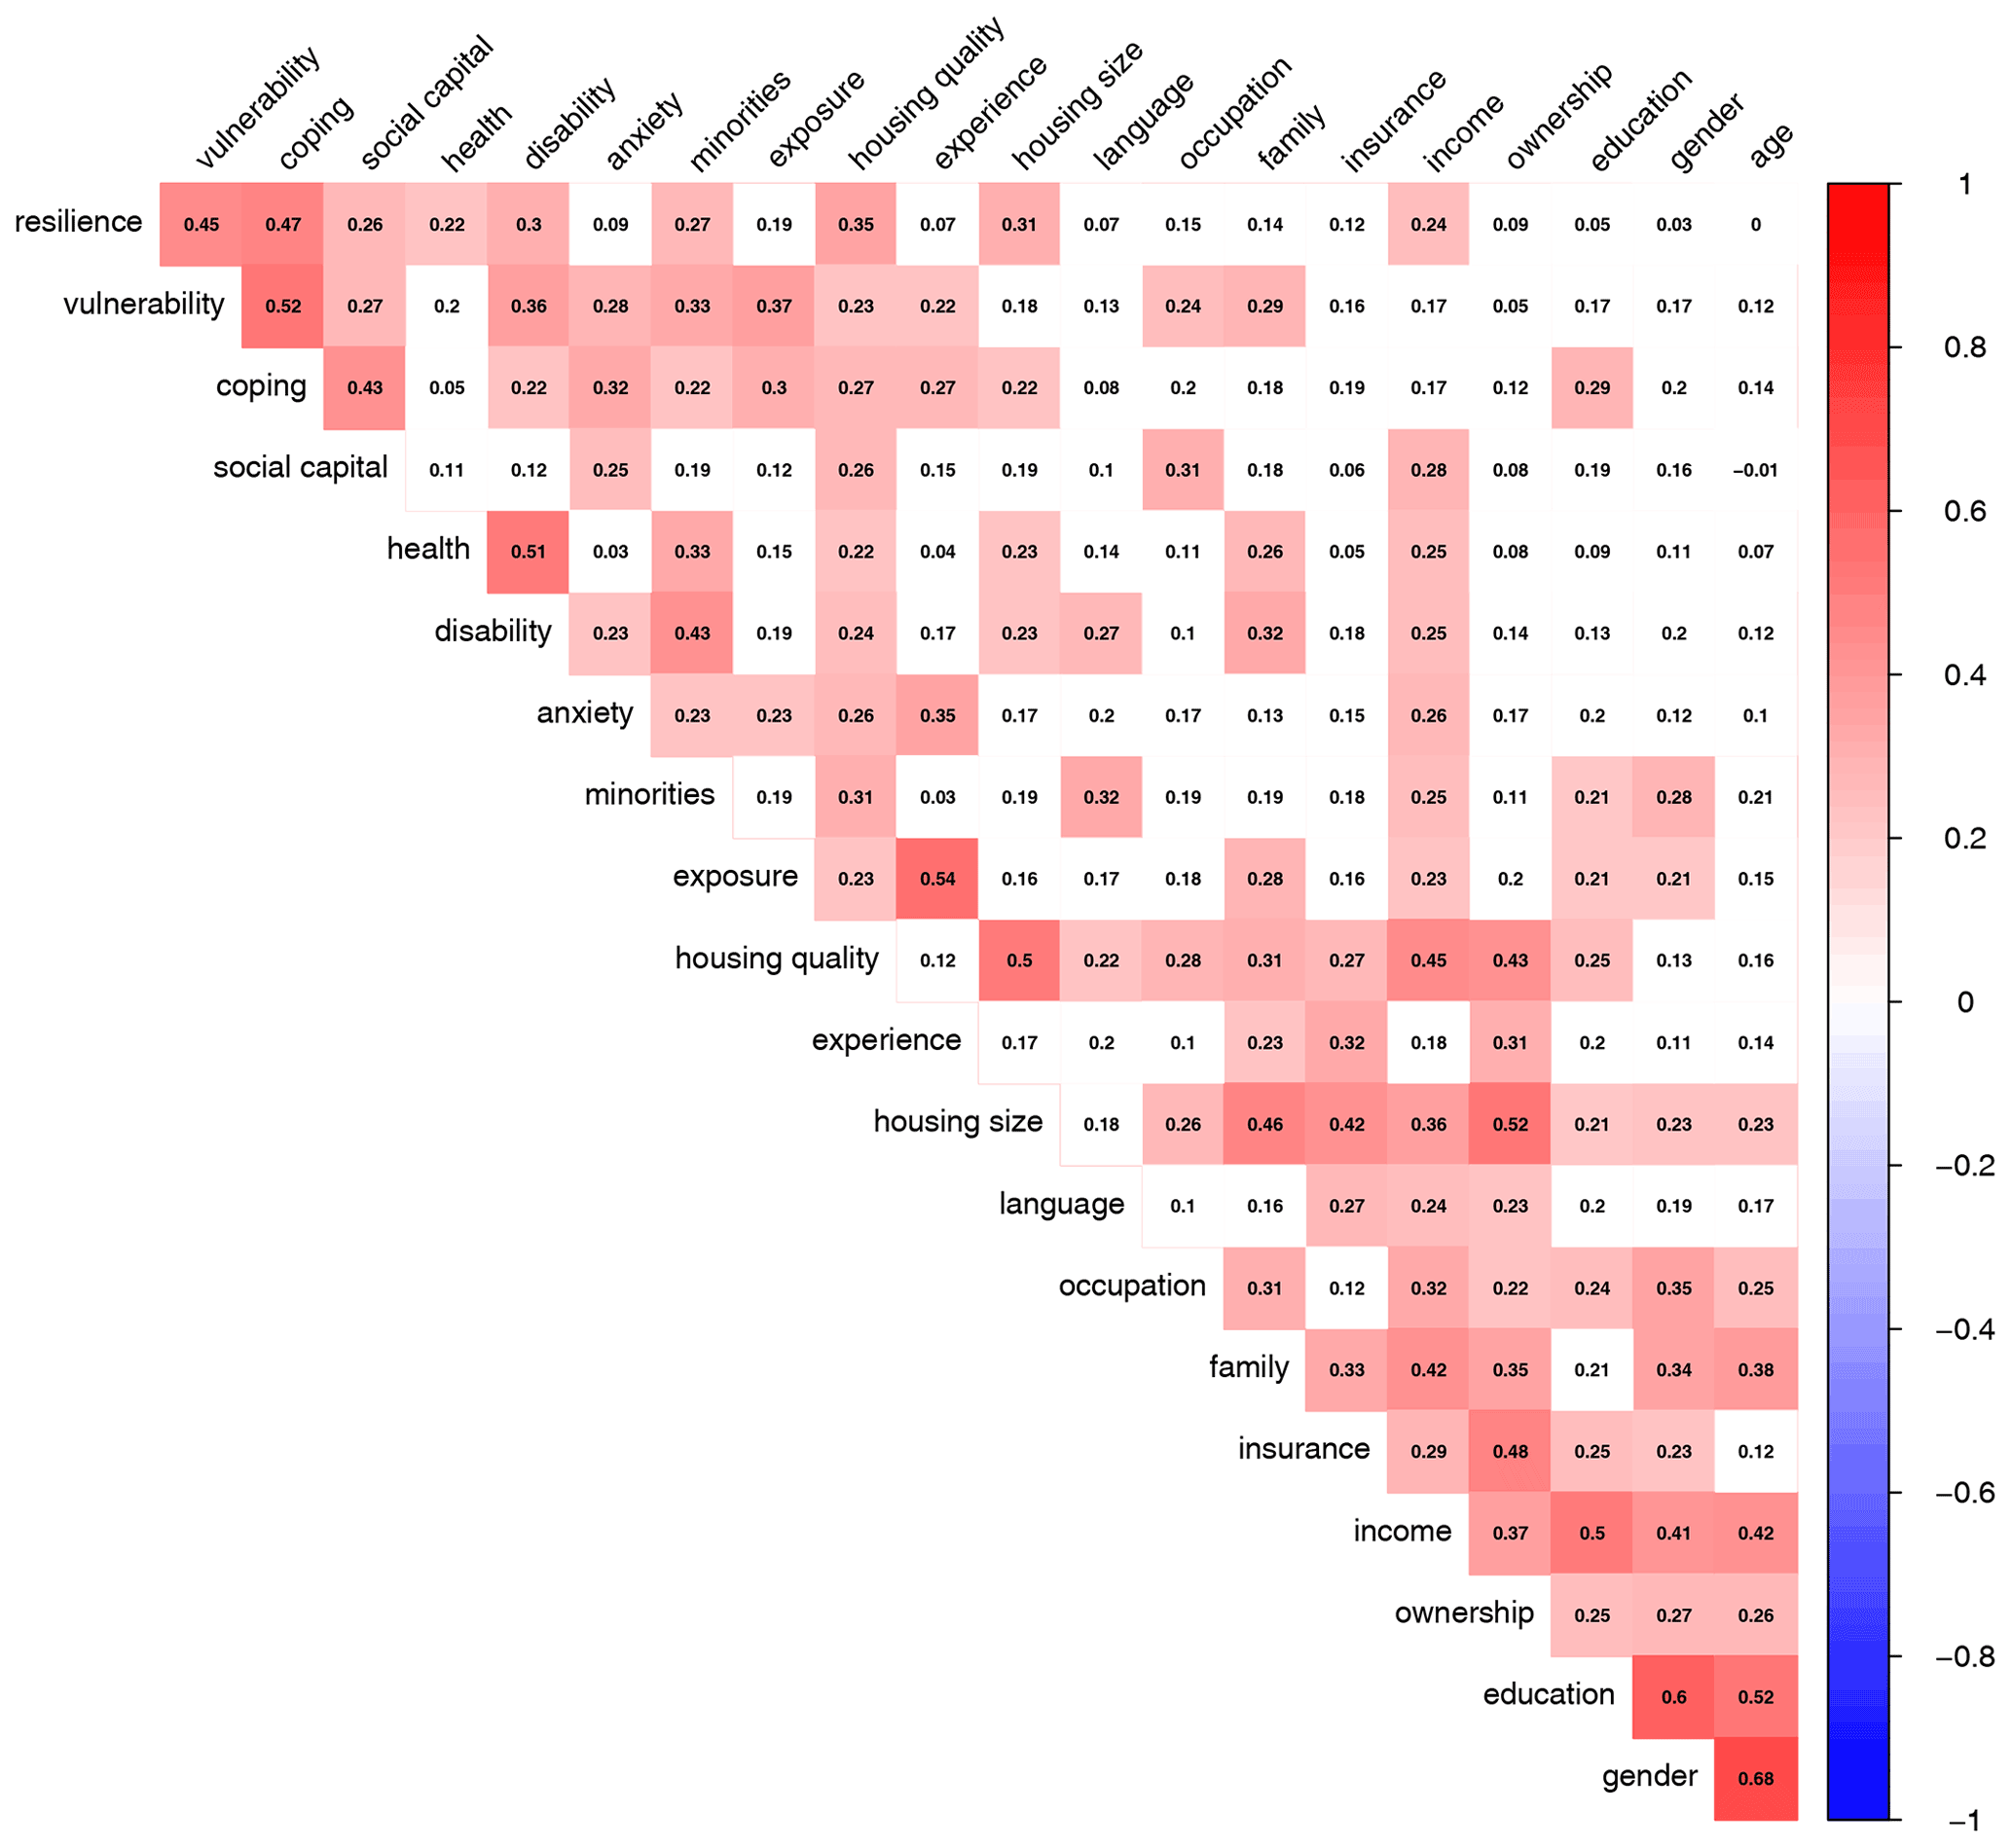
Figure 9Heatmap of the correlations among the variables used to explain risk perception and behaviour.
Comparing the explanatory variables used and declared relevant for comparison by the same respondents (Fig. 10) reveals two contrasting situations. While most respondents used socio-demographic characteristics in their studies, a minority of them considered such factors important for comparison, whereas virtually none of those who did not use them considered them important for comparison. Conversely, while a smaller proportion of the sample used environmental factors (experience and exposure) and less than half used contextual factors (vulnerability and resilience), a substantial proportion of those who did not use them did nevertheless consider that they might be important for comparison, whereas a larger share of those who did use them declared them critical for comparison. There is, however, no agreement as no single driver was mentioned by more than one-quarter of respondents as one of the three most important for case-study comparison and monitoring.

Figure 10Explanatory variables used vs. mentioned as important for cross-study comparison. For instance, 124 respondents used age as an explanatory variable, but only 19 of them (15 %) thought age was relevant for cross-study comparison.
This leaves us with the challenge of fostering convergence among the wide diversity of risk perception and behaviour drivers as there was no agreement on their relevance for comparison or long-term monitoring. This might explain why most respondents declared that they based their variable choices on the literature and their own previous studies (Fig. 6) – there does not seem to be any other robust criterion at the moment.
The ranking of variables was further analysed according to the hazards studied, the location diversity of case studies, the disciplinary background and the study size (Fig. 11). The figure breaks down the overall ranking presented in Fig. 8a. The (maximal) sample size may have a strong effect on the ranking of the explanatory variables: respondents using smaller samples had used environmental factors (experience and exposure) and contextual factors (vulnerability and resilience) more often, whereas respondents who used larger samples had more often used income, ownership and anxiety. The ranking was only marginally impacted by the hazards studied, with insurance, ownership and home characteristics slightly more used for floods; experience, vulnerability and anxiety for multi-hazard studies; education and vulnerability for geophysical hazards; and resilience and health for epidemics. The location diversity of the case studies – in only one country or in several – affected the drivers used. Respondents with a greater diversity of case studies used gender, coping capacity or minorities more often, whereas respondents with less diversity were more likely to use age, exposure, occupation, housing size or location. The disciplinary background of the respondents (main field of PhD or studies) had almost no impact, which may be linked to the interdisciplinary focus of most studies.

Figure 11Explanatory-variable selection according to the background of respondents and study characteristics. NA stands for “no answer”.
The respondent's experience, seniority and methods used had a lesser impact on the ranking of explanatory variables. The respondents' experience (number of case studies conducted) had little effect. Respondents with more than five case studies may have used minorities, language proficiency, and family or household size or composition more often. In contrast, respondents conducting their first study may have used age and gender less often and contextual factors more often. The respondent's seniority (years since PhD) also had a negligible impact on the drivers used, even though contextual factors were used by junior investigators more often, whereas more senior surveyors used education, occupation and livelihood. While respondents exclusively using interviews or focus groups were more likely than those using surveys to use contextual factors and less likely to use income, insurance or ownership factors, the impact of methods on the ranking of drivers was weak.
We also tested for the gender – half the respondents were female – and the institutional affiliation of respondents, inside or outside academia: these characteristics did not affect the ranking of explanatory variables.
Contrary to our expectations, Risk-SoS did not capture strong regional differences in risk perception and behaviour approaches. The location of the case studies conducted by respondents – only in Europe, only outside of Europe or a combination of both – had little effect on the ranking of explanatory variables (Fig. 12). Respondents in our sample working on non-European case studies less often used age, experience or income and more often used gender, exposure, vulnerability or occupation. Respondents combining case studies more often used education, family or household size, or coping capacity. Similarly, the work environment of the respondent – inside or outside of Europe – had little impact on the risk perception and behaviour drivers used, although respondents outside of Europe used education, ownership or insurance less often than gender, occupation and livelihood, or health.

We tested for hypotheses of regional difference in risk perception and behaviour approaches and assessments, on the one hand, between respondents based in or outside Europe and, on the other hand, between different regions of Europe. Most of the time, we did not find a statistically significant link (p=0.01) with the theories in use or the selection of the explanatory variables. The only time a χ2 test found a statistically significant link, logistic regression rejected the association. The same result was obtained when testing for a dichotomous division between eastern and western European regions, despite the barriers in scientific communication during communism and most of the early post-communist transition period.
Even though our study did not capture significant regional differences in research design and explanatory-variable selection, we can state that the short-term horizons used by households were more frequent in context-specific hazard research in the former communist states of eastern Europe (Raška, 2015). However, this observation might be impacted by the imbalanced background of the participants in our sample and the prevalence of geographers and researchers from environmental sciences with a focus on inductive hazard-related approaches, indirectly informed by specific risk and vulnerability theories. Another regional discrepancy in our results that may be explicable from a historical perspective was that most researchers in former communist countries were limited to studies inside their country. At the same time, researchers in western Europe remain more open to case studies located in other countries and even on other continents. It is however appropriate to underline that the initial focus of Risk-SoS was on surveyors based in Europe.
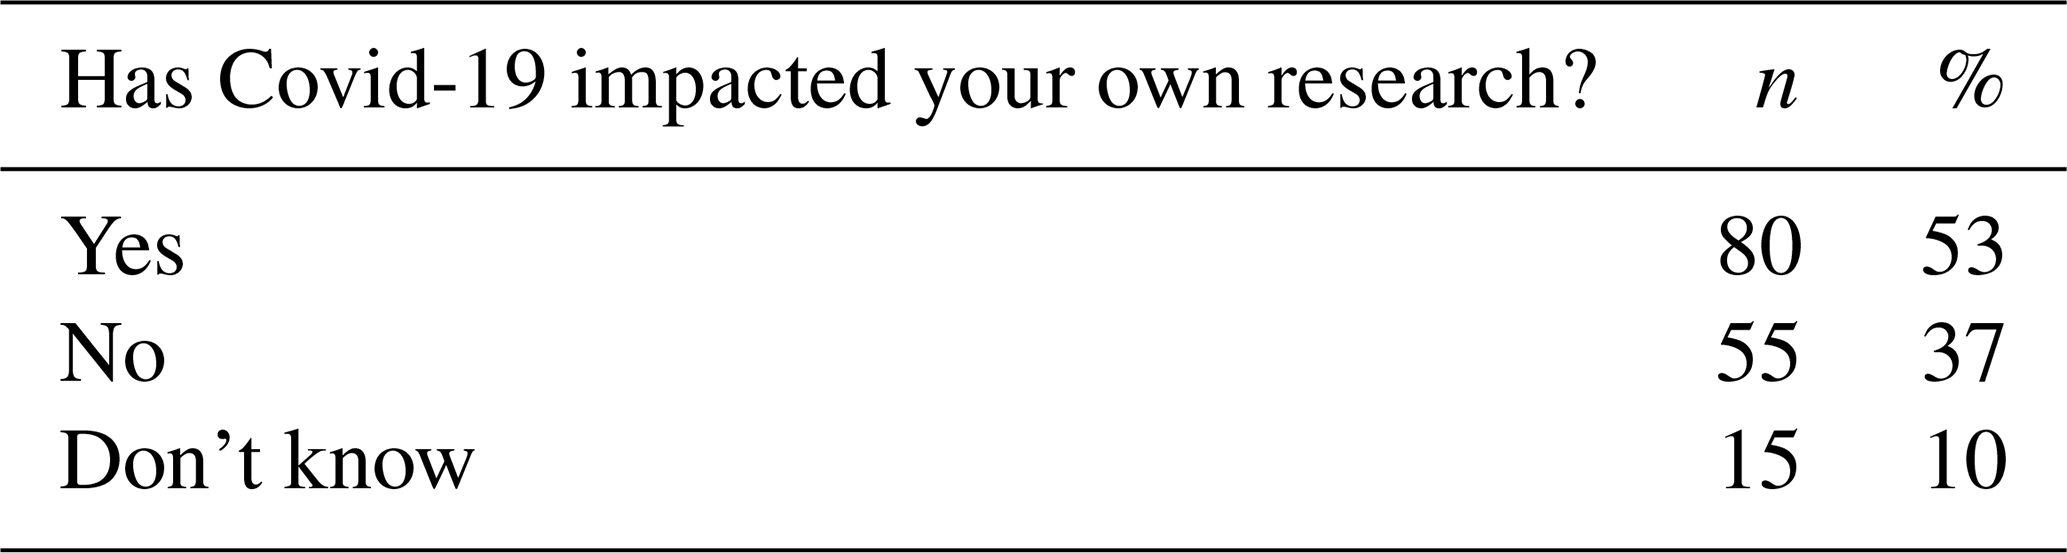
As Risk-SoS was disseminated from December 2020 to April 2021, we inquired about the impact of COVID-19 on respondents' research. Contrary to our expectations, only 53 % of respondents (n=80) declared an impact on their research on risk perception or behaviour (Table 2). It is worth noting that 10 % did not know (n=15), which leaves a little more than a third of respondents declaring no impact (n=55, 37 %).
Table 2Responses to “Has Covid-19 impacted your own research on risk perception and/or behaviour?”
An optional open question was offered to respondents to elaborate on their answer if they wished. We collected 69 different open answers (representing 46 % of respondents). Unsurprisingly, the impacts reported were mostly negative, such as impairments in access to people, colleagues, travel, fieldwork and traditional methods demanding face-to-face conversations. An increased workload and work–life balance issues were also mentioned several times, as well as reluctance of surveyed people, postponed empirical studies and an inability to conduct planned follow-up surveys. However, the adaptation of research designs to online methods, either immediately or planned for future studies, points towards an adjustment out of necessity rather than resignation or cancellation of all empirical work during the pandemic. Some respondents mentioned that online interviews or surveys had costs and practical benefits after adjusting to the new methodologies, while a few acknowledged that online meetings and webinars facilitate exchanges with a scattered research community.
8.1 Discussion of the results in relation to the existing literature
Our finding that most risk perception studies are not strongly embedded in a theoretical framework is consistent with review studies of risk perception research for particular types of hazards. For instance, Kellens et al. (2013) review 57 peer-reviewed articles on flood risk perception and communication and conclude that most studies are exploratory in nature and not based on a theoretical framework. This was subsequently confirmed by other studies (Lechowska, 2018; Santos-Reyes et al., 2014). Our observation that PMT is the most commonly applied theory is consistent with the review of risk mitigation behaviour by Bubeck et al. (2012), who point towards its relevance in explaining behaviour. A meta-analysis of determinants of climate adaptation behaviour by van Valkengoed and Steg (2019) also concludes that PMT variables are strong predictors of this behaviour and hence a suitable theoretical framework in this particular strand of research. Lechowska (2018) concludes that the main flood risk perception indicators used in the literature are awareness and worry. This is consistent with our findings for the broader risk perception literature if we consider fear to be similar to worry and combine these two variables into one category. However, our results show that surveyors distinguish between them.
Regarding explanatory variables, Kellens et al. (2013) conclude that almost any study on flood risk perception includes socio-demographic variables. They also point towards the importance of previous hazard experience as an explanatory variable that is commonly used to test the availability heuristic (Tversky and Kahneman, 1974) – however, experience was used as an explanatory variable for risk perception and hazard adjustment much earlier (Kates, 1963). More recently Demuth (2018) proposed a comprehensive method of measuring hazard experience. The work of van Valkengoed and Steg (2019) also shows that disaster experience is commonly used as an explanatory variable in the literature on climate adaptation behaviour. However, socio-demographic characteristics are the most contested drivers. For example, some studies observed that people with less education worried more about risk (Bradford et al., 2012), while others found no such effect (Kuhlicke et al., 2011), and some attributed such an effect to the relationship between education and income (Wachinger et al., 2013). Similarly, some studies conclude that immigrants and socially vulnerable communities have lower levels of self-protection and higher risk perceptions (Armaş, 2008; Rufat and Botzen, 2022), whereas others attributed such effects to other characteristics, mostly age and income (Adelekan and Asiyanbi, 2016) or residential segregation (Rufat, 2015). Some studies also claim that older and higher-income residents have higher risk perceptions and more often adopt precautionary measures (Grothmann and Reusswig, 2006), whereas other studies find that age (Armaş et al., 2015; Botzen and Van Den Bergh, 2012) or income (Lindell and Hwang, 2008; Botzen et al., 2009) has no significant impacts. Such contradictory evidence on behaviour hampers recommendations for policy and risk management (Lechowska, 2018), such as the design of targeted risk communication strategies (Höppner et al., 2012). As many studies focus on different dimensions (sociological, economic or psychological), internal or personal factors (gender, age, education, income, values or trust), external or contextual factors (vulnerability, institutions, power, oppression or cultural backgrounds), risk or environmental factors (perceived likelihood or experienced frequency), or informational factors (media coverage, experts or risk management), their diverging sets of variables, methods and approaches are scarcely compatible. Our results reflect this diversity of methods, theories, questions and explanations, as well as the discrepancy between the variables used and the variables thought to be critical to cross-study comparability or long-term monitoring.
In the absence of a census of researchers and hazards in the field of risk perception and adaptive behaviour, it remains unclear how far the respondents are representative of the field. The sample characteristics might introduce a potential bias towards researchers in Europe studying floods. However, the results show that the hazards studied and place of work only have little effect on the rankings. Lindell (2022) further suggested that based on his extensive and diverse experience, the data are likely to generalise to other hazards and countries.
8.2 Towards a list of minimal requirements to compare studies (Goal 1)
Our results map the diversity of practices and present shortcomings in the field. While they signal that cross-study comparison is not the primary concern of surveyors when they design their research, they offer two possible ways forward to improve convergence, comparability and cumulative knowledge. One is factual and relies on what surveyors are currently doing. The other is counter-factual and relies on what surveyors may have more carefully considered to ensure their study comparability. We consider six questions critical for ensuring comparability during the research design phase of a study:
-
Is there a set of explicit hypotheses specified?
-
Are the hypotheses formally derived from one or more theories?
-
Are the constructs (e.g. risk awareness or trust) and their operationalisation in terms of indicators derived from one or more theoretical frameworks?
-
Are there research questions or themes that are comparable with those of previous studies?
-
Are there explanatory variables derived from previous studies?
-
Do the results allow for a formal test of the hypotheses or theories while controlling for context and other variables?
Answering all six questions positively would ensure that the designed study is likely to lead to comparable results if other studies have applied the same theoretical framework (or parts of it). Lindell and Perry (2000) suggested that inconsistency in research findings can often be attributed to differences in the operationalisation of constructs such as experience and risk perception. In general, building a larger theory-informed empirical evidence base may facilitate meta-analyses and allow for the systematic identification of context-dependent effects. Moreover, producing cumulative knowledge in this way may assist policymakers in grounding their decisions in plausible and coherent mechanisms of action. On the other hand, “forgoing theories may result in measuring a wide range of less relevant, marginally relevant, or irrelevant constructs, while also minimising the chances of obtaining results that are meaningful and not by pure chance” (Bhattacherjee, 2012, p. 21).
However, such an approach might prove to be a major deviation from current practice according to our Risk-SoS results. An easier but less satisfactory solution – which may be only transitory – would be to follow the revealed trend in the field to base design choices on previous research. As a first step, a way forward would be to implement some of the questions, themes, constructs and variables currently most in use – i.e. the top ranking in our results – in future studies, without expending effort to improve the theoretical foundation and methodological robustness of the research design. One implication is the need for researchers to report the interrelationships among all of the variables that have been measured to test the hypotheses – not just the significant coefficients – to avoid the “file drawer problem” (Rosenthal, 1979). While we acknowledge that the ranking produced may not be definitive, this type of instrument may be a critical way forward to bridge the current research design gap in the field but, to the best of our knowledge, is missing. We do not promote a single umbrella theory, unique standardised method or some one-size-fits-all global questionnaire. Nevertheless, reproducing (at least some of) the currently most frequently used questions and explanatory variables in future case studies may be the most favourable way forward. One limitation is that research design choices are already shaped by inertia, and more of the same is therefore not necessarily advisable. Some of the most used items might lack relevance or merit – it is still important to be able to put them to the test; conversely protective actions at the core of PMT (Floyd et al., 2000) and the protective action decision model (PADM; Lindell and Perry, 2012) did not rank well in our results. The long-term perspective must therefore be to foster systematic efforts to integrate the constructs from the main frameworks beyond the currently most frequently used questions and variables.
8.3 Can we reach shared criteria to address context-specific aspects? (Goal 2)
Our survey, Risk-SoS, did not reveal significant regional differences in risk perception and adaptive-behaviour study design. The reasons are manifold, including our initial focus on researchers based in Europe. However, as risk perception, behaviour and adaptation are locally embedded practices and social, institutional and cultural factors play a key role in driving or hindering adaptation behaviour (Berrang-Ford et al., 2021), more comparative research is necessary (Gierlach et al., 2010). The issue is – for example – when a study in Italy says that gender has an effect on perceptions while one in Romania says that the effect is not caused by gender but age. At the moment, we cannot investigate if this is related to the context (country) or to the methodological choices of the study (question, theories, etc.). Therefore, relying on a unified theoretical framework and following the procedure outlined in the previous section seem particularly relevant for such a cross-regional comparison; then, more context-specific drivers can be identified. However, at which spatial level such comparative studies should be conducted (e.g. continental, country, local level) is still an open question. We suggest that any comparative study is highly relevant as there are so few. Diversity and comparability are both critical for surveying communities that differ substantially in their hazard experience and allowing for robust meta-analyses to help disentangle the various effects (contextual, methodological and casual).
8.4 Improving comparability and long-term monitoring (Goal 3)
The elements most often captured by respondents were, in descending order, risk awareness, information (knowledge), previous hazard experience, perceived hazard exposure and coping with disaster (response). The ranking is similar for those considered decisive for cross-study comparability – if we set aside the fact that “don't know” was by far the most frequent answer – with the addition of another item: adaptive behaviour (actual, not projected). The most often used explanations or variables were, in descending order, age, gender, education, previous hazard experience, actual exposure and income. The respondents made a different ranking, however, for the explanations they consider the most important: previous hazard experience, education, age, gender, vulnerability, coping capacity and social capital. The rankings were more scattered for those considered decisive for cross-study comparability – again with “don't know” being by far the most frequent answer – but were more likely to include previous experience, vulnerability, coping capacity and social capital than age or gender. Thus, ensuring that future research designs consider collecting all these themes and control for all these explanations should be considered good practice in the field. However, large shares of replies were “don't know”, and the fact that surveyors use themes and variables does not qualify them as decisive for comparison. Such a discrepancy between use and reputation is a reminder that neither of them guarantees merit. This might explain why most respondents said that they base their choices on their own previous studies – it remains hard to find other robust criteria at the moment.
Unfortunately, our study points to specific challenges for comparability and long-term monitoring. Even highly experienced researchers – with over 20 completed studies or over 20 years of research experience – struggled to narrow down the core questions of risk perception and behaviour, reduce complexity to a few key themes and variables, or agree on the most significant ones for comparison and long-term monitoring. Lindell (2022) suggested that the difference between use and relevance could be explained by the fact that environmental variables such as hazard experience tend to be homogeneous within communities, especially for infrequent hazards, so studies focused upon a small region will find little variation. While it is necessary to survey communities that differ substantially in their hazard experience to obtain the requisite variation at the household level (Lindell and Prater, 2000), such designs are much more expensive than single community surveys.
As a substantial share of studies failed to rely on the literature (n=22, 15 %), previous studies (n=76, 51 %), or theories and frameworks (n=53, 35 %) to strengthen their research design, challenges in comparing results are expected. While most respondents used risk perception as an explanation of behaviour and adaptation (n=97, 65 %), the majority of studies were observational (n=120, 80 %), and just over one-third had implemented their studies or surveys multiple times (n=62, 41 %). The dispersion of studies combined with these choices does not favour causality detection, the assessment of intervention effects, sequential disaster cumulative effects, or drawing robust lessons to guide policy and help risk communication strategies. The disuse of common theoretical frameworks may add to this problem. Only one-third of surveyors conducted formal tests of the validity of a theory or the power of an explanation (n=50, 33 %), and only half of those that did formally compared two or more theories in the same study (n=25, 17 %). Without a substantial and enduring convergence effort, comparing the merits of different theories and assessing the worthiness of different explanations, not to mention long-term monitoring, can only be achieved by studies designed by the same team or inside a group of like-minded surveyors. Beyond the issue of reduced efficiency and speed, this places context specificity assessment or cross-validation out of reach.
In other words, we recommend that future studies implement all items listed above, along with their specific questions, and test for a wider set of explanations or demonstrate which of them lack merit for their specific case study or context – presenting this explicitly as a result – before discarding them from their research design. However, our study does not intend to promote a single theoretical framework or make assumptions about why many seem not to use such frameworks. There may be good reasons to avoid using pre-existing frameworks or to use an inductive approach, especially because understanding risk perception or the bridge between perception and adaptive behaviour has evaded most explanatory frameworks or models so far.
This study initiated a discussion on standards on risk perception, behaviour and adaptation research. Although we reached many surveyors (N=150), our empirical basis has sampling constraints. The results point towards further research and discussion aiming to inform the community about key findings and persistent gaps. While using theoretical constructs allows comparing and accumulating evidence, most of these studies are exploratory in nature. Over one-third of surveyors did not rely on a particular theoretical model or framework to guide their studies. Only one-third of surveyors tested the validity of a theory or the power of an explanation. Even fewer formally compared two or more theories in the same study. These limitations might be the momentary price to pay for an ongoing multidisciplinary effort. However, the exploratory and fragmented nature of current studies may make them look like fishing expeditions, finding results mostly by chance and reaching conclusions that other studies cannot substantiate.
While the diversity of approaches is an asset, the robustness of methods is an investment. Surveyors reported a tendency to reproduce past research design choices. They also expressed frustration with this trend, and one-third of surveyors did not know how to improve the situation in the field. We recommend greater attention to the formalisation and robustness of methods and advocate reaping the benefits of the current diversity of choices by systematically comparing different approaches. Similarly, we recommend that future studies test for a broader set of explanations or demonstrate which of them lack merit for a specific case study or context before discarding them from their research design.
The wide diversity of opinions on how to remedy comparability is a cause for concern: convergence and comparison remain high-hanging fruits in the field. The discrepancy between actual usage, estimated utility and belief in the merit of cross-validation or long-term monitoring of the current wide range of potential explanations is equally worrying. One way forward is counter-factual and relies on what surveyors should more carefully consider, especially (1) grounding their research design in theory; (2) improving the formalisation of methods and operationalisation of constructs; and (3) formally comparing theories, methods and explanations. Another is factual and relies on what surveyors are currently doing. It involves (1) ensuring that future research designs consider collecting all the themes most in use and (2) controlling for all the explanations most in use if they can be theoretically linked to the research questions and logically implemented in their models and methods.
The authors do not have the consent of respondents to share the data.
The supplement related to this article is available online at: https://doi.org/10.5194/nhess-22-2655-2022-supplement.
SR, AF and CK originally conceived the study. SR, AF, EC, PJR, IA, WJWB and CK designed the survey with inputs from the community during the Risk-SoS webinars. SR performed the data collection and curation. SR, MMdB and IA analysed the results of the survey, and all authors contributed to the interpretation of the results with further inputs from the participants to the Risk-SoS webinars. SR and MMdB wrote the first draft of the paper, to which all authors contributed.
The contact author has declared that neither they nor their co-authors have any competing interests.
Publisher’s note: Copernicus Publications remains neutral with regard to jurisdictional claims in published maps and institutional affiliations.
The authors thank Michael Lindell and Lara Mani for their reviews and significant contributions to the paper.
The article processing charges for this open-access publication were covered by the Helmholtz Centre for Environmental Research – UFZ.
This paper was edited by Amy Donovan and reviewed by Michael Lindell and Lara Mani.
Adelekan, I. O. and Asiyanbi, A. P.: Flood risk perception in flood-affected communities in Lagos, Nigeria, Natural Hazards, 80, 445–469, https://doi.org/10.1007/s11069-015-1977-2, 2016.
Armaş, I.: Social vulnerability and seismic risk perception. Case study: the historic center of the Bucharest Municipality, Nat. Hazards, 47, 397–410, https://doi.org/10.1007/s11069-008-9229-3, 2008.
Armaş, I., Ionescu, R., and Posner, C. N.: Flood risk perception along the Lower Danube river, Romania, Nat. Hazards, 79, 1913–1931, https://doi.org/10.1007/s11069-015-1939-8, 2015.
Baker, E. J.: Hurricane evacuation behavior, Int. J. Mass Emerg. Disasters, 9, 287–310, 1991.
Bamberg, S., Masson, T., Brewitt, K., and Nemetschek, N.: Threat, coping and flood prevention – A meta-analysis, J. Environ. Psychol., 54, 116–126, https://doi.org/10.1016/j.jenvp.2017.08.001, 2017.
Begg, C., Ueberham, M., Masson, T., and Kuhlicke, C.: Interactions between citizen responsibilization, flood experience and household resilience: insights from the 2013 flood in Germany, Int. J. Water Resour. D., 33, 591–608, https://doi.org/10.1080/07900627.2016.1200961, 2017.
Berrang-Ford, L., Siders, A. R., Lesnikowski, A., Fischer, A. P., Callaghan, M. W., et al.: A systematic global stocktake of evidence on human adaptation to climate change, Nat. Clim. Chang., 11, 989–1000, https://doi.org/10.1038/s41558-021-01170-y, 2021.
Bhattacherjee, A.: Social science research: principles, methods, and practices, Univ. South Florida, Tampa, Florida, 2012.
Boholm, A.: Comparative studies of risk perception: a review of twenty years of research, J. Risk Res., 1, 135–163, https://doi.org/10.1080/136698798377231, 1998.
Botzen, W. J. W. and Van Den Bergh, J. C.: Monetary valuation of insurance against flood risk under climate change, Int. Econ. Rev., 53, 1005–1026, https://doi.org/10.1111/j.1468-2354.2012.00709.x, 2012.
Botzen, W. J. W., Aerts, J. C. J. H., and van den Bergh, J. C. J. M.: Dependence of flood risk perceptions on socio-economic and objective risk factors, Water Resour. Res., 45, 1–15, https://doi.org/10.1029/2009WR007743, 2009.
Botzen, W. J. W., Kunreuther, H. C., and Michel-Kerjan, E. O.: Divergence between individual perceptions and objective indicators of tail risks, Judgm. Decis. Mak., 10, 365–385, http://journal.sjdm.org/15/15415/jdm15415.pdf (last access: 17 August 2022), 2015.
Bradford, R. A., O'Sullivan, J. J., van der Craats, I. M., Krywkow, J., Rotko, P., Aaltonen, J., Bonaiuto, M., De Dominicis, S., Waylen, K., and Schelfaut, K.: Risk perception – issues for flood management in Europe, Nat. Hazards Earth Syst. Sci., 12, 2299–2309, https://doi.org/10.5194/nhess-12-2299-2012, 2012.
Bubeck, P., Botzen, W. J. W., and Aerts, J. C. J. H.: A Review of Risk Perceptions and Other Factors that Influence Flood Mitigation Behavior, Risk Anal., 32, 1481–1495, https://doi.org/10.1111/j.1539-6924.2011.01783.x, 2012.
Cohen, M. D., March, J. G., and Olsen, J. P.: A Garbage Can Model of Organizational Choice, Admin. Sci. Quart., 17, 1, https://doi.org/10.2307/2392088, 1972.
de Brito, M. M., Evers, M., and Almoradie, A. D. S.: Participatory flood vulnerability assessment: a multi-criteria approach, Hydrol. Earth Syst. Sci., 22, 373–390, https://doi.org/10.5194/hess-22-373-2018, 2018.
De Dominicis, S., Fornara, F., Cancellieri, U. G., Twigger-Ross, C., and Bonaiuto, M.: We are at risk, and so what? Place attachment, environmental risk perceptions and preventive coping behaviours, J. Environ. Psychol., 43, 66–78, https://doi.org/10.1016/j.jenvp.2015.05.010, 2015.
Demuth, J. L.: Explicating Experience: Development of a Valid Scale of Past Hazard Experience for Tornadoes: Explicating Experience, Risk Anal., 38, 1921–1943, https://doi.org/10.1111/risa.12983, 2018.
Floyd, D. L., Prentice-Dunn, S., and Rogers, R. W.: A Meta-Analysis of Research on Protection Motivation Theory, J. Appl. Soc. Pyschol., 30, 407–429, https://doi.org/10.1111/j.1559-1816.2000.tb02323.x, 2000.
Gierlach, E., Belsher, B. E., and Beutler, L. E.: Cross-Cultural Differences in Risk Perceptions of Disasters, Risk Anal., 30, 1539–1549, https://doi.org/10.1111/j.1539-6924.2010.01451.x, 2010.
Grothmann, T. and Reusswig, F.: People at risk of flooding: why some residents take precautionary action while others do not, Natural Hazards, 38, 101–120, https://doi.org/10.1007/s11069-005-8604-6, 2006.
Hartmann, T. and Driessen, P. J.: The Flood Risk Management Plan: Towards spatial water governance, J. Flood Risk Manage., 10, 145–154, https://doi.org/10.1111/jfr3.12077, 2017.
Höppner, C., Whittle, R., Bründl, M., and Buchecker, M.: Linking social capacities and risk communication in Europe: a gap between theory and practice?, Nat. Hazards, 64, 1753–1778, https://doi.org/10.1007/s11069-012-0356-5, 2012.
Huang, S.-K., Lindell, M. K., and Prater, C. S.: Who Leaves and Who Stays? A Review and Statistical Meta-Analysis of Hurricane Evacuation Studies, Environ. Behav., 48, 991–1029, https://doi.org/10.1177/0013916515578485, 2016.
Kates, R. W.: Perceptual regions and regional perception in flood plain management, Pap. Reg. Sci. Assoc., 11, 215–227, https://doi.org/10.1007/BF01943205, 1963.
Kellens, W., Terpstra, T., and De Maeyer, P.: Perception and Communication of Flood Risks: A Systematic Review of Empirical Research, Risk Anal., 33, 24–49, https://doi.org/10.1111/j.1539-6924.2012.01844.x, 2013.
Kreibich, H., Müller, M., Schröter, K., and Thieken, A. H.: New insights into flood warning reception and emergency response by affected parties, Nat. Hazards Earth Syst. Sci., 17, 2075–2092, https://doi.org/10.5194/nhess-17-2075-2017, 2017.
Kuhlicke, C., Scolobig, A., Tapsell, S., Steinführer, A., and De Marchi, B.: Contextualizing social vulnerability: findings from case studies across Europe, Natural Hazards, 58, 789–810, https://doi.org/10.1007/s11069-011-9751-6, 2011.
Kuhlicke, C., Seebauer, S., Hudson, P., Begg, C., Bubeck, P., Dittmer, C., Grothmann, T., Heidenreich, A., Kreibich, H., Lorenz, D. F., Masson, T., Reiter, J., Thaler, T., Thieken, A. H., and Bamberg, S.: The behavioral turn in flood risk management, its assumptions and potential implications, W. Water, 7, e1418, https://doi.org/10.1002/wat2.1418, 2020.
Lechowska, E.: What determines flood risk perception? A review of factors of flood risk perception and relations between its basic elements, Nat. Hazards, 94, 1341–1366, https://doi.org/10.1007/s11069-018-3480-z, 2018.
Lindell, M. K.: Comment on nhess-2021-365, Nat. Hazards Earth Syst. Sci., https://doi.org/10.5194/nhess-2021-365-RC1, 2022.
Lindell, M. K. and Hwang, S. N.: Households' perceived personal risk and responses in a multihazard environment, Risk Anal., 28, 539–556, https://doi.org/10.1111/j.1539-6924.2008.01032.x, 2008.
Lindell, M. K. and Perry, R. W.: Household Adjustment to Earthquake Hazard: A Review of Research, Environ. Behav., 32, 461–501, https://doi.org/10.1177/00139160021972621, 2000.
Lindell, M. K. and Perry, R. W.: The Protective Action Decision Model: Theoretical Modifications and Additional Evidence: The Protective Action Decision Model, Risk Anal., 32, 616–632, https://doi.org/10.1111/j.1539-6924.2011.01647.x, 2012.
Lindell, M. K. and Prater, C. S.: Household Adoption of Seismic Hazard Adjustments: A Comparison of Residents in Two States, Int. J. Mass Emerg. Disasters, 18, 317–338, 2000.
Mol, J. M., Botzen, W. J. W., Blasch, J. E., and de Moel, H.: Insights into Flood Risk Misperceptions of Homeowners in the Dutch River Delta, Risk Anal., 40, 1450–1468, https://doi.org/10.1111/risa.13479, 2020.
Moors, A. and De Houwer, J.: What is automaticity? An analysis of its component features and their interrelations, in: Automatic Processes in Social Thinking and Behavior, Psychology Press, 11–50, 2007.
Moreira, L. L., de Brito, M. M., and Kobiyama, M.: Review article: A systematic review and future prospects of flood vulnerability indices, Nat. Hazards Earth Syst. Sci., 21, 1513–1530, https://doi.org/10.5194/nhess-21-1513-2021, 2021.
O'Neill, E., Brereton, F., Shahumyan, H., and Clinch, J. P.: The Impact of Perceived Flood Exposure on Flood-Risk Perception: The Role of Distance, Risk Anal., 36, 2158–2186, https://doi.org/10.1111/risa.12597, 2016.
Orum, A. M.: Case Study: Logic, in: International Encyclopedia of the Social & Behavioral Sciences, Elsevier, 202–207, https://doi.org/10.1016/B978-0-08-097086-8.44002-X, 2015.
Raška, P.: Flood risk perception in Central-Eastern European members states of the EU: a review, Nat. Hazards, 79, 2163–2179, https://doi.org/10.1007/s11069-015-1929-x, 2015.
Renn, O. and Rohrmann, B.: Cross-Cultural Risk Perception: a Survey of Empirical Studies, Springer US, Boston, MA, 2000.
Robinson, P. J. and Botzen, W. J. W.: Economic Experiments, Hypothetical Surveys and Market Data Studies of Insurance Demand Against Low-Probability/High-Impact Risks: A Systematic Review of Designs, Theoretical Insights and Determinants of Demand, J. Econ. Surv., 33, 1493–1530, https://doi.org/10.1111/joes.12332, 2019.
Rosenthal, R.: The “file drawer problem” and tolerance for null results, Psychol. Bull., 86, 638–641, https://doi.org/10.1037/0033-2909.86.3.638, 1979.
Rufat, S.: Towards a Social and Spatial Risk Perception Framework, Cybergeo, 725, https://doi.org/10.4000/cybergeo.27010, 2015.
Rufat, S. and Botzen, W. J. W.: Drivers and dimensions of flood risk perceptions: Revealing an implicit selection bias and lessons for communication policies, Global Environ. Chang., 73, 102465, https://doi.org/10.1016/j.gloenvcha.2022.102465, 2022.
Rufat, S. and Fekete, A.: Conclusions of the first European Conference on Risk Perception, Behaviour, Management and Response, CY Cergy Paris University, halshs-02486584, https://halshs.archives-ouvertes.fr/halshs-02486584/document (last access: 15 November 2021), 2019.
Rufat, S., Tate, E., Burton, C. G., and Maroof, A. S.: Social vulnerability to floods: Review of case studies and implications for measurement, Int. J. Disast. Risk Re., 14, 470–486, https://doi.org/10.1016/j.ijdrr.2015.09.013, 2015.
Rufat, S., Fekete, A., Armaş, I., Hartmann, T., Kuhlicke, C., Prior, T., Thaler, T., and Wisner, B.: Swimming alone? Why linking flood risk perception and behavior requires more than “it's the individual, stupid”, W. Water, 7, e1462, https://doi.org/10.1002/wat2.1462, 2020.
Rufat, S., Armaş, I., Botzen, W., Comby, E., de Brito, M., Fekete, A., Kuhlicke, C., and Robinson, P.: Risk Perception & Behaviour Survey of Surveyors. Risk-SoS 2020 Preliminary results, https://hal.archives-ouvertes.fr/hal-03228369 (last access: 15 November 2021), 2021.
Runhardt, R. W.: Causal Comparability, Causal Generalizations, and Epistemic Homogeneity, Philos. Soc. Sci., 47, 183–208, https://doi.org/10.1177/0048393116681079, 2017.
Ruzzene, A.: Drawing Lessons from Case Studies by Enhancing Comparability, Philos. Soc. Sci., 42, 99–120, https://doi.org/10.1177/0048393111426683, 2012.
Santos-Reyes, J., Gouzeva, T., and Santos-Reyes, G.: Earthquake risk perception and communication: A review of empirical research, Disaster Adv., 7, 77–87, 2014.
Scolobig, A., Prior, T., Schröter, D., Jörin, J., and Patt, A.: Towards people-centred approaches for effective disaster risk management: Balancing rhetoric with reality, Int. J. Disast. Risk Re., 12, 202–212, https://doi.org/10.1016/j.ijdrr.2015.01.006, 2015.
Shrout, P. E. and Rodgers, J. L.: Psychology, Science, and Knowledge Construction: Broadening Perspectives from the Replication Crisis, Annu. Rev. Psychol., 69, 487–510, https://doi.org/10.1146/annurev-psych-122216-011845, 2018.
Siegrist, M.: Trust and Risk Perception: A Critical Review of the Literature, Risk Anal., 41, 480–490, https://doi.org/10.1111/risa.13325, 2021.
Siegrist, M. and Árvai, J.: Risk perception: Reflections on 40 years of research, Risk Anal., 40, 2191–2206, https://doi.org/10.1111/risa.13599, 2020.
Slavikova, L.: Effects of government flood expenditures: The problem of crowding-out, J. Flood Risk Manage., 11, 95–104, https://doi.org/10.1111/jfr3.12265, 2018.
Tversky, A. and Kahneman, D.: Judgment under Uncertainty: Heuristics and Biases, Science, 185, 1124–1131, https://doi.org/10.1126/science.185.4157.1124, 1974.
UNDRR: Sendai Framework for Disaster Risk Reduction 2015–2030, United Nations, Geneva, 2015.
UNDRR: Global assessment report on disaster risk reduction 2019, United Nations, Geneva, 2019.
van Valkengoed, A. M. and Steg, L.: Meta-analyses of factors motivating climate change adaptation behaviour, Nat. Clim. Change, 9, 158–163, https://doi.org/10.1038/s41558-018-0371-y, 2019.
Wachinger, G., Renn, O., Begg, C., and Kuhlicke, C.: The Risk Perception Paradox – Implications for Governance and Communication of Natural Hazards, Risk Anal., 33, 1049–1065, https://doi.org/10.1111/j.1539-6924.2012.01942.x, 2013.
Wilkinson, I.: Social Theories of Risk Perception: At Once Indispensable and Insufficient, Current Sociol., 49, 1–22, https://doi.org/10.1177/0011392101049001002, 2001.
PMT stands for protection motivation theory; COM-B proposes that behaviour consists of the components capability, opportunity and motivation.
- Abstract
- Introduction
- Methods, questionnaire and dissemination
- Theories, disciplines and frameworks used by the surveyors
- Questions asked and themes explored by the surveyors
- Explanatory variables – looking for a needle in parallel universes?
- Case studies and regional patterns
- Impact of COVID-19 on research
- Discussion
- Conclusions
- Data availability
- Author contributions
- Competing interests
- Disclaimer
- Acknowledgements
- Financial support
- Review statement
- References
- Supplement