the Creative Commons Attribution 4.0 License.
the Creative Commons Attribution 4.0 License.
 | 28 Jan 2022
Brief communication: Monitoring a soft-rock coastal cliff using webcams and strain sensors
Diego Guenzi
Danilo Godone
Paolo Allasia
Nunzio Luciano Fazio
Michele Perrotti
Piernicola Lollino
In this brief communication, we describe a case study about monitoring a soft-rock coastal cliff using webcams and a strain sensor, located in the Apulia region (southeastern Italy). In this urban and touristic area, coastal recession is extremely rapid and rockfalls are very frequent. Using low-cost and open-source hardware and software, we are monitoring the area, trying to correlate both meteorological information with measures obtained from the crack meter and webcams, aiming to recognize potential precursor signals that could be triggered by instability phenomena.
- Article
(6272 KB) - Full-text XML
- BibTeX
- EndNote


Among the geo-hydrological instability phenomena that affect the Apulia region, the rockfall hazard affecting the coastal areas characterized by high cliffs formed from soft rocks is of high scientific interest, mainly due to the possible interaction with nearby infrastructures and urban areas.
The evolution of these cliffs and their collapse is well known among the scientific community (Sunamura, 1992; Adams et al., 2005; Stephenson and Naylor, 2010; Sansò et al., 2016; Fazio et al., 2019), but currently there are no consolidated methods concerning the monitoring of these phenomena with a spatial and temporal resolution suitable for prediction and alerting purposes. Along these cliffs, brittle failures are frequent, resulting in entire cliff sectors that suddenly are involved in rockfalls without any appreciable precursor signal. The main elements that contribute to the collapse are the poor geomechanical properties of the rock materials combined with environmental forcing, such as sea waves, winds, rainfalls, and temperature variations (Perrotti et al., 2020; Lollino et al., 2021). In our study, we want to pursue a monitoring approach with two main aims: (i) the integration of conventional geotechnical sensors with digital images and video processing and (ii) the detection of potential precursor signals that could occur in case of instability phenomena.
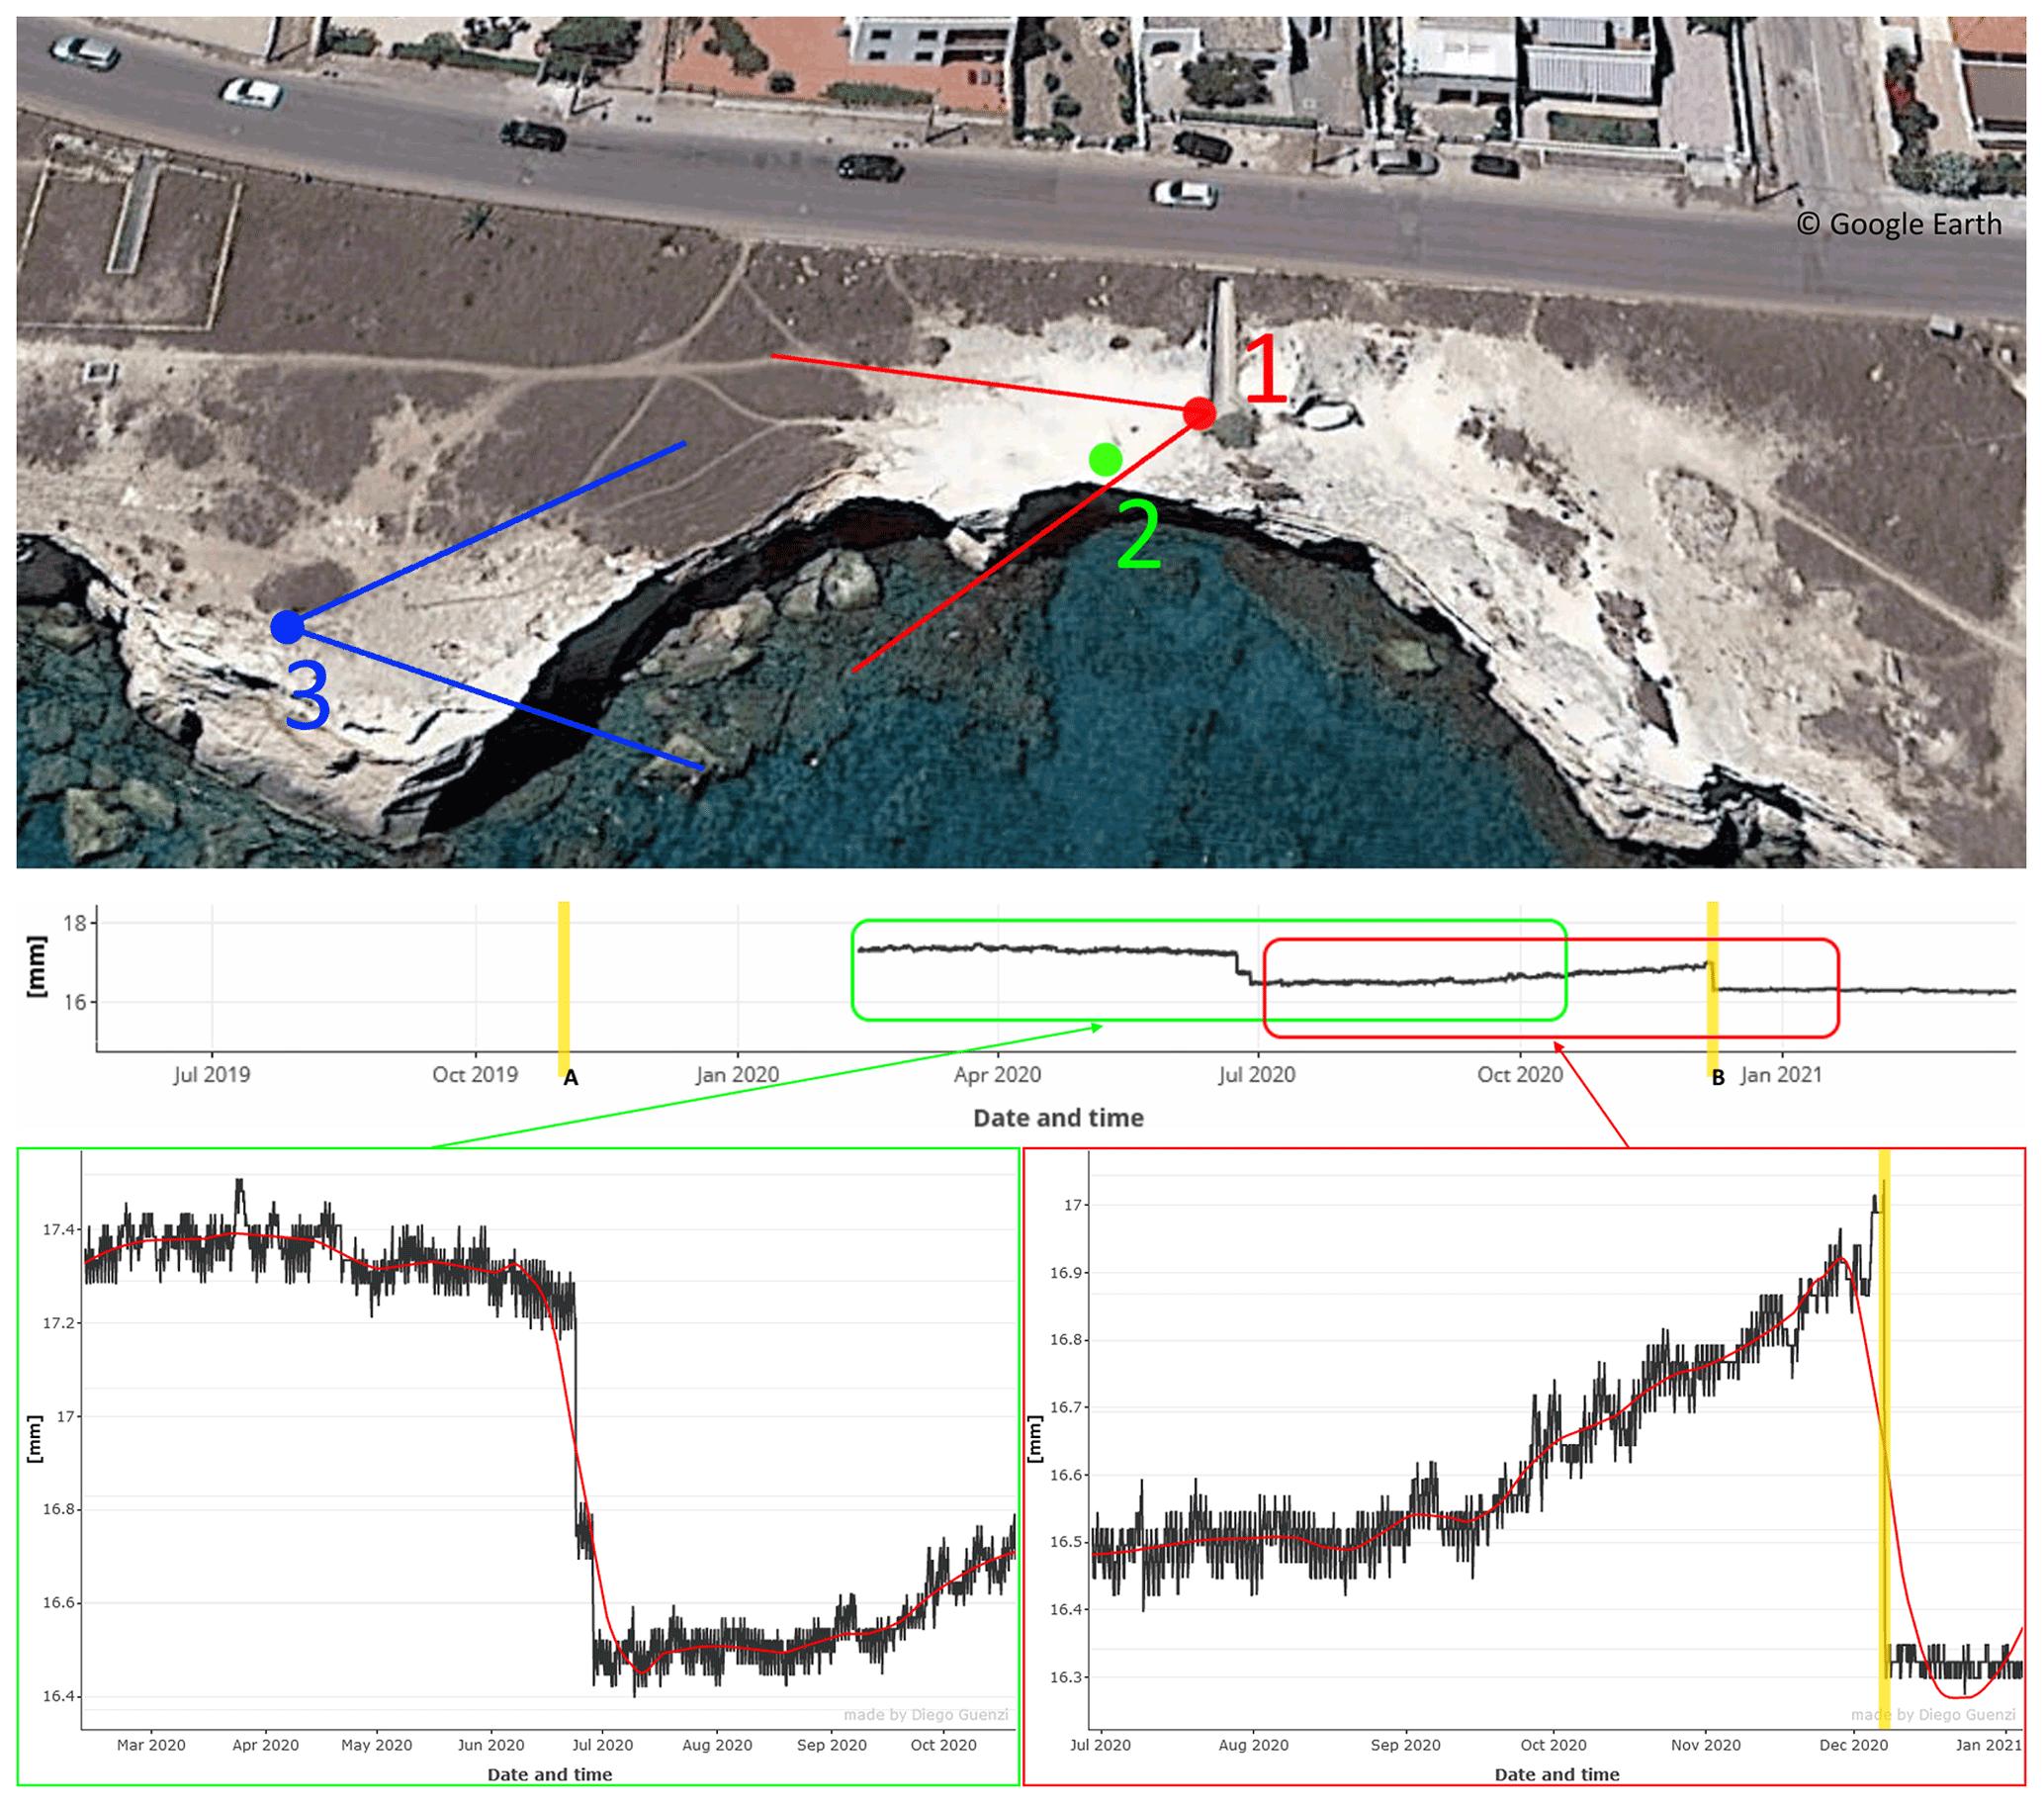
Figure 1At the top, plan of the monitored cliff area (taken from © Google Earth) – in red (marked with “1”) the main camera position and the Raspberry Camera Module field of view; in blue (marked with “3”) the secondary camera; the green dot marked with “2” is the position of the crack meter. At the bottom, the crack-meter data – in the green box the first period of data obtained using the automatic crack meter (from 12 February 2020 up to 20 October 2020). In the red box the second period of data of the same crack meter (going from 29 June 2020 to 4 January 2021). Two main rockfalls have been noticed in this period and have been marked with the “A” and “B” yellow lines.
The coastal area of Melendugno, located in the southeastern area of the Apulia region (latitude 40∘16′45′′ N and longitude 18∘25′53′′ E), has been characterized by a large number of rockfall events in the last decades (Lollino et al., 2021). Coastal erosion phenomena are continuously evolving, and many sites have reached a high degree of geomorphological hazard due to the close presence of roads, infrastructures, and urban areas. From a geological point of view, the area is characterized by the outcropping of the Uggiano la Chiesa Formation, dating back to the upper Pliocene–lower Pleistocene, which is formed from stratified marly calcisiltites and biocalcarenites of low mechanical strength and highly susceptible to water-induced weakening processes. A specific sector of the local coastline has shown a significant coastal recession in recent years due to recurring rockfalls, with an average retreat rate estimated in approximately 0.10–0.15 m yr−1 as described in Lollino et al. (2021). Moreover, laboratory testing carried out by the authors on rock samples taken from the study area (or of the same typology) has confirmed that even rock of low mechanical strength can exhibit brittle failure (Lollino and Andriani, 2017; Perrotti et al., 2020). Therefore, an integrated monitoring system has been specifically designed in order to control the evolution of the coastal sector and the corresponding recession rate.
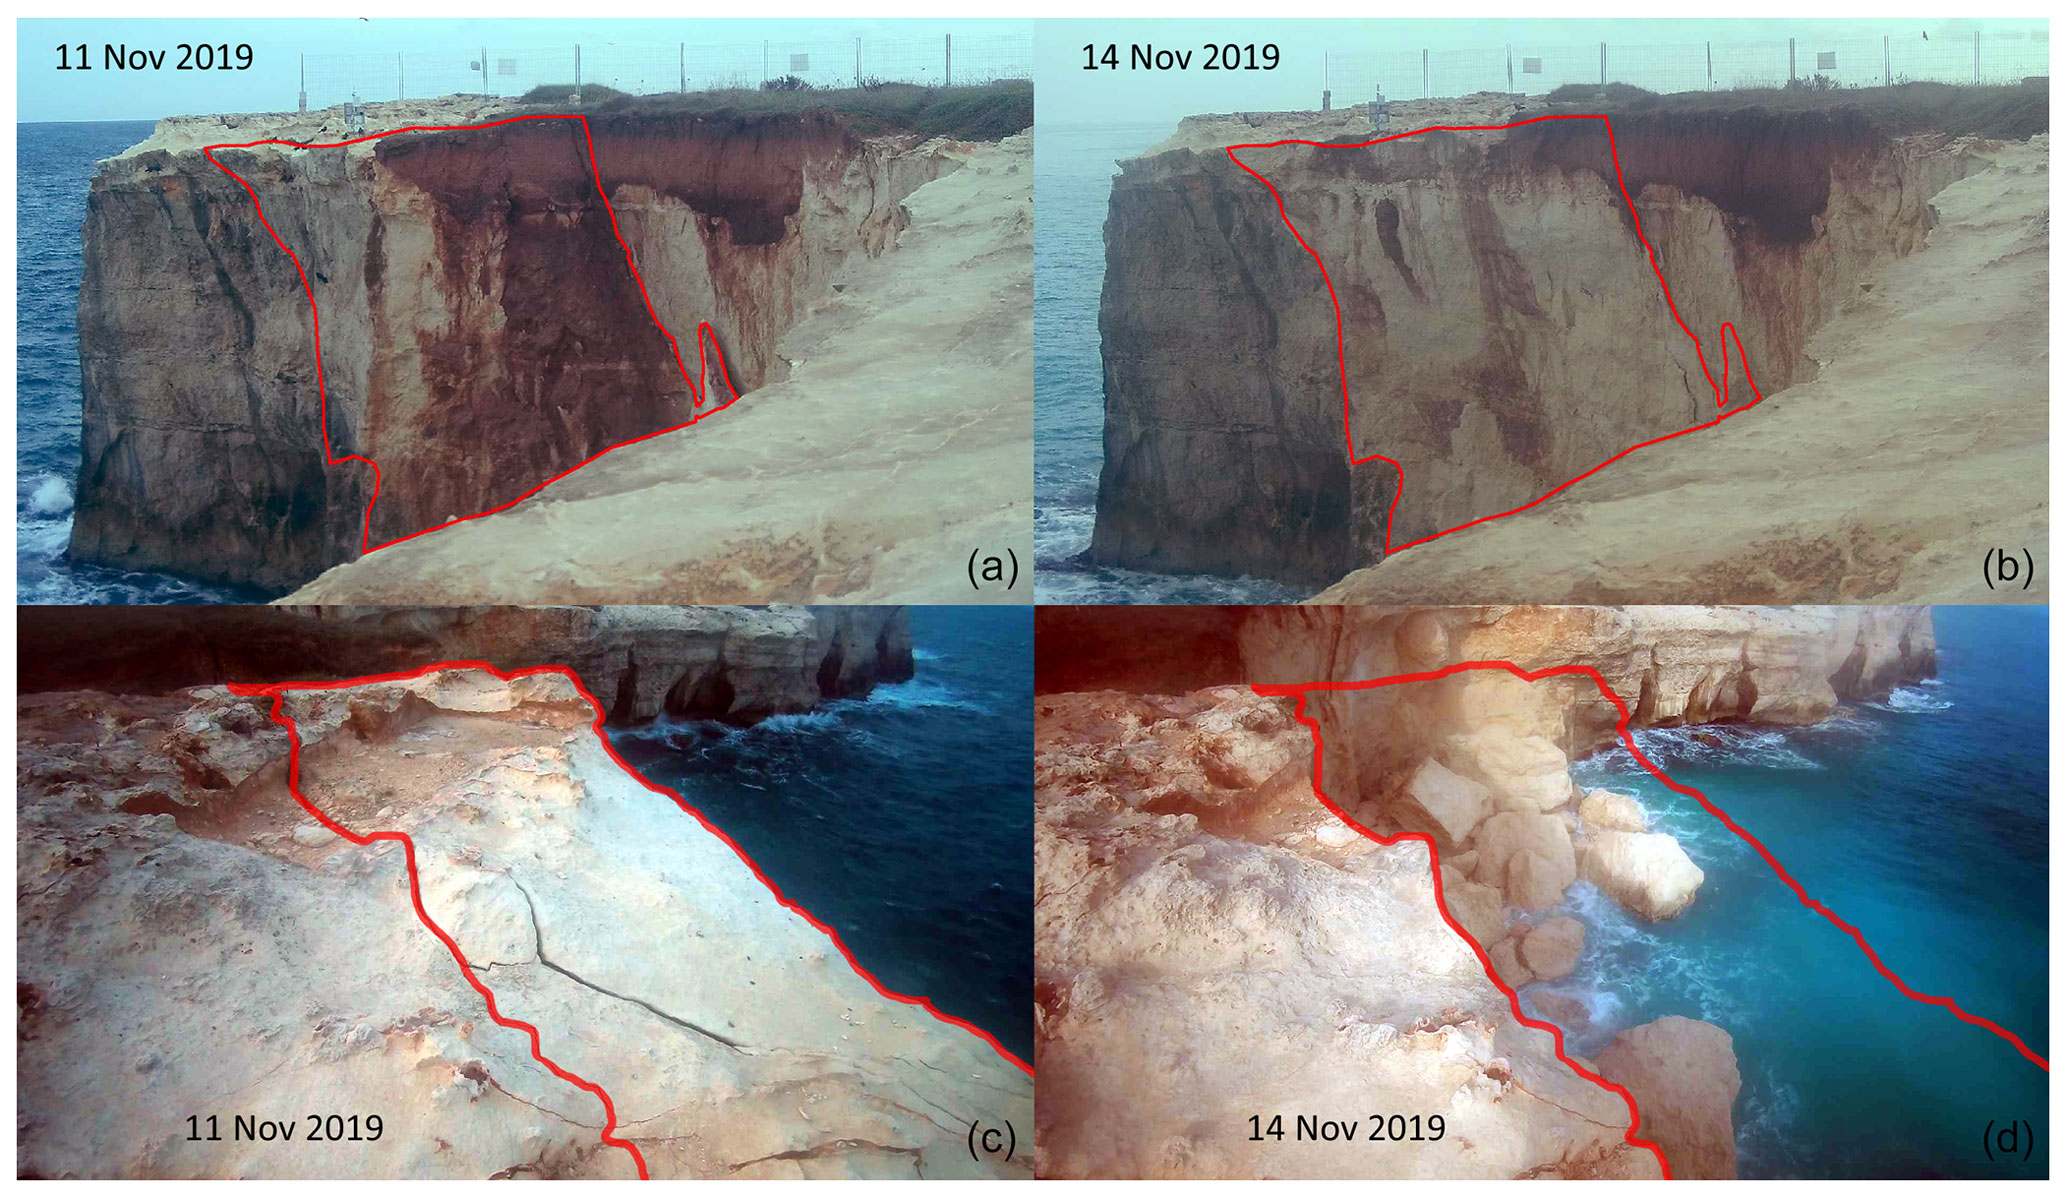
Figure 2The first rockfall (marked with “A” in Fig. 1) – panel (a) shows the cliff as it was on 11 November 2019 and panel (b) shows it as it was 3 d later (both images are taken from the Raspberry Camera Module – see Fig. 1 for the position). Panels (c) and (d) show the same event but from a different point of view (the secondary camera – see Fig. 1 for the position): (c) a picture taken before the collapse and (d) a picture taken on 14 November 2019.
Automatic monitoring of geo-hydrological phenomena allows high-frequency data acquisition that enables advancements in the analysis of the phenomena and their evolution. In particular, due to the reduced temporal delay between sequential measurements, rapidly evolving brittle processes can even be explored and eventually correlated with external variables. To ensure such a frequent monitoring, however, it is necessary to have both software and hardware that are able to adequately support all the activities of the system in addition to a suitable power supply system (Herrera et al., 2011; Intrieri et al., 2015; Allasia et al., 2020).
In our study, we decided to implement a digital photographic monitoring system that follows these principles (Giordan et al., 2016; Dematteis et al., 2021) and that is based mostly on open-source hardware and software, ensuring a flexible and low-cost system. In particular, we choose a Raspberry Pi Zero W (https://www.raspberrypi.org/, last access: 25 January 2022) as the main control unit. This single-board computer is connected wirelessly to two webcams: a main camera (a commercial 2 MP PTZ Foscam – https://www.foscam.it/, last access: 25 January 2022) and a secondary one (a 2 MP bullet-model Foscam). Moreover, it integrates an additional 8 MP webcam cabled directly to its Camera Serial Interface: the Raspberry Camera Module. All these optical sensors constantly monitor the area 24 h a day also thanks to the infrared (IR) capability, storing videos in full high definition (HD) and photos. In particular, webcams continuously record videos and take shots every few seconds, while the Raspberry Camera Module takes only shots at timed intervals. The periodically acquired images are analyzed and, in case of a possible rockfall between two consecutive photos, we analyze the corresponding videos to obtain further details. This can be achieved either manually or using artificial intelligence techniques (i.e., image change detection), leading to an automated and smart system.
The two webcams are mounted on two different poles distant approximately 50 m, watching each other and looking at different sides of the cliff (see top of Fig. 1). Each camera (which is around 5 m from the cliff) has its own solar panel, charge controller, and 12 V battery; on the main camera pole, there is also a 4G wireless router with an IP voltmeter and a relay. Thanks to the router, it is possible to connect remotely to the Raspberry (i.e., via SSH) to have a complete control, in addition to changing webcam configuration and orientation. Moreover, the IP voltmeter let us know in real time the system voltage, while the relay allows turning on/off of any device (router, Raspberry, or webcam). Finally, it is possible to obtain all the data by uploading photographs and videos automatically and periodically to an FTP server in real time. This system was installed at the end of May 2019, while on 12 February 2020 we added an electric crack meter on the most evident fracture present on the cliff (see bottom of Fig. 1). This crack meter has an accuracy of 0.1–0.3 mm and is remotely connected with the FTP server.
In addition to photos, videos, and crack-meter measurements, we constantly download data from a neighboring weather station managed by the Civil Protection in order to correlate the information logged from the cameras and the crack meter with the meteorological variables such as temperature, rainfall rate, wind speed, and direction. The analysis is carried out using a code written in the R language (R Core Team, 2021).
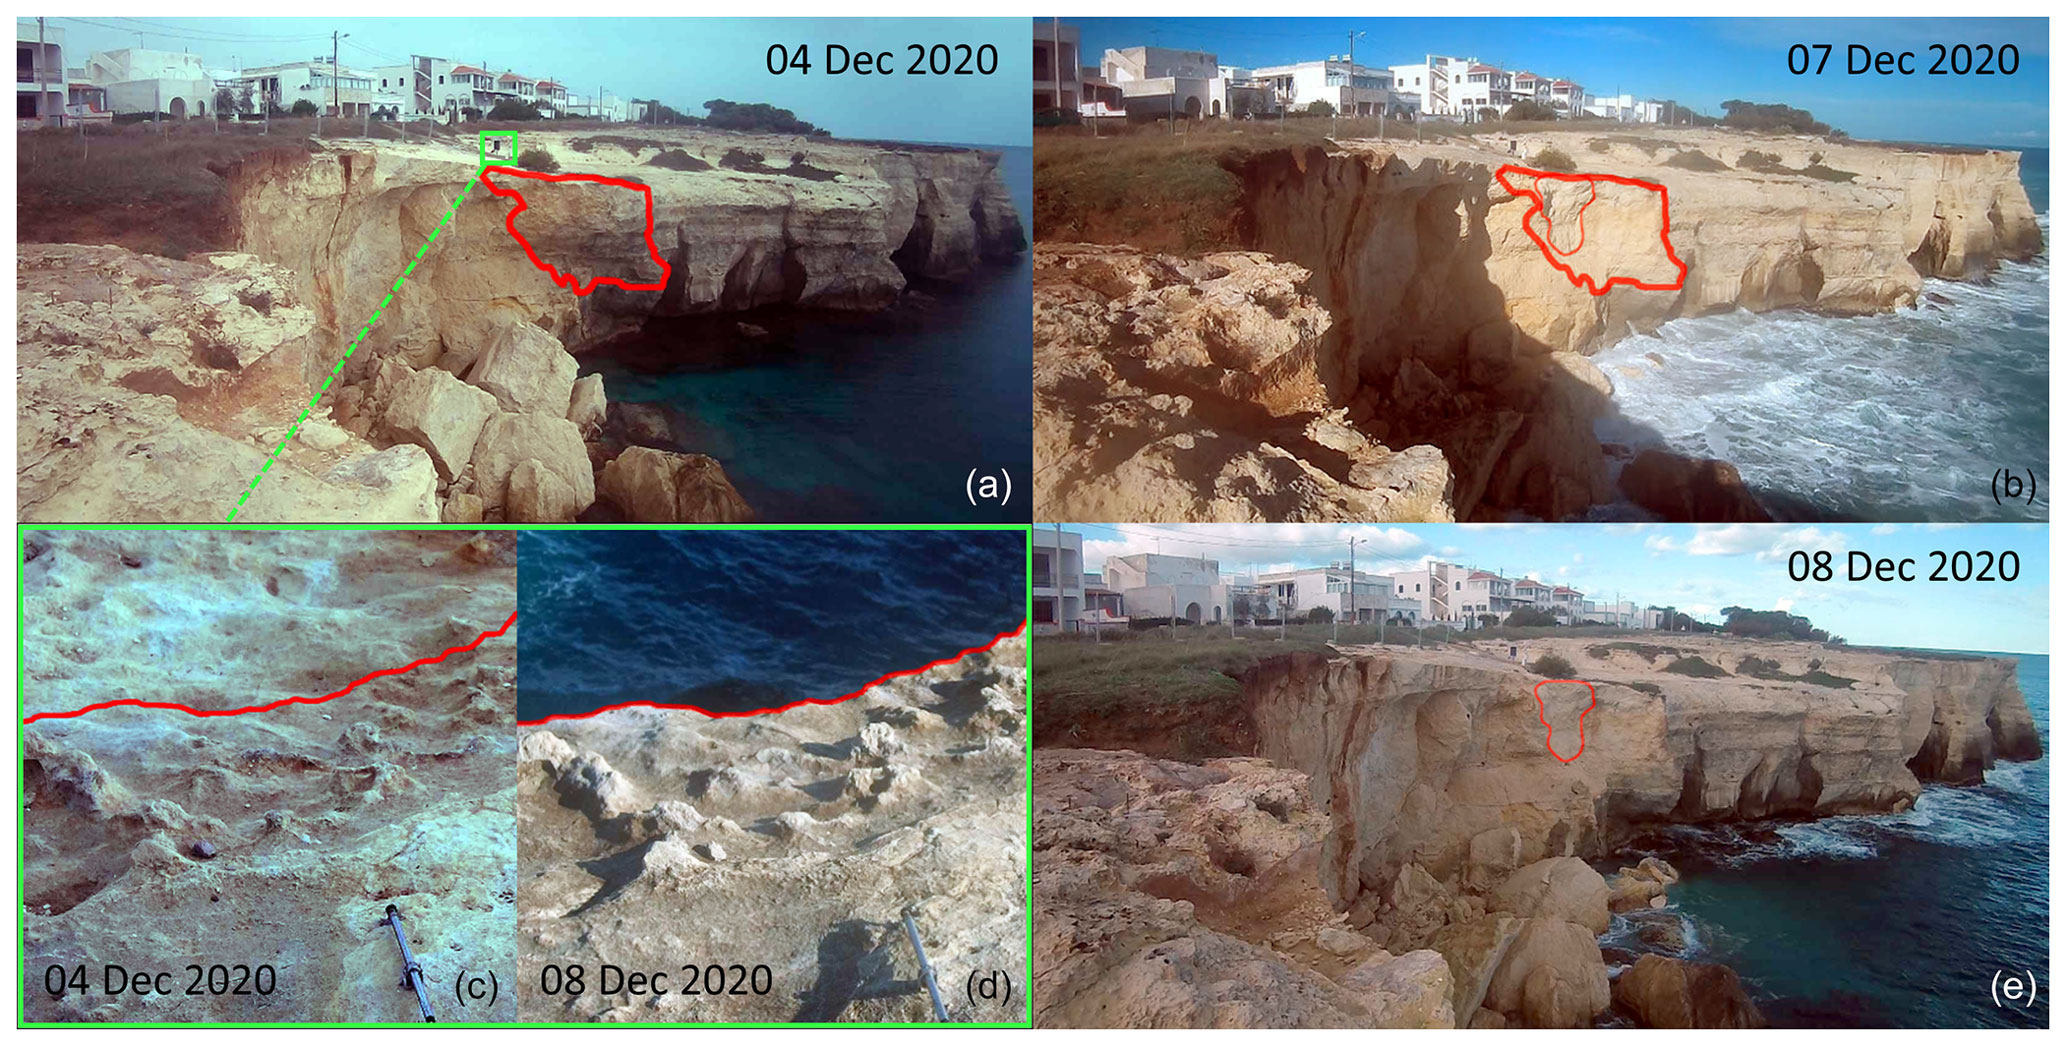
Figure 3The second rockfall (marked with “B” in Fig. 1) – panel (a) shows the cliff as it was on 4 December 2020 and panel (b) shows it as it was on the morning of 7 December 2020, after the main collapse (marked by the thick red line). Panel (e) shows the cliff as it was on 8 December 2020, after a minor rockfall (marked by the thin red line). Those three images are taken from the secondary camera (see Fig. 1 for the position). In panels (c) and (d), two smaller images that show the collapse from another point of view (the main camera, which could also be seen in the top left image, highlighted in green – see Fig. 1 for the position) both before the rockfall (c) and after it (d). In those images, the newly installed automatic crack meter is also visible.
In these 2 years of activity, the monitoring system recorded several events. The first remarkable event occurred between 12 November 2019 (after 09:00 CET) and 14 November 2019 (before 08:30) when a collapse of a large part of the cliff took place (see Fig. 2). Unfortunately, when the failure occurred, the instrumentation was inactive due to the lack of energy caused by the severe rainstorm that struck the area for a few days; moreover, no crack meter was still available (see bottom of Fig. 1). Despite these issues, both images and videos just before and after the collapse were available. Based on such information and the application of image change detection techniques, we estimated a volume of the collapse equal to 300 m3±30 % following the methods described in Giordan et al. (2020).
Two other rockfall events took place on 23 June 2020, around 17:05 (bottom of Fig. 1, green area), and on 28 June 2020, approximately between 09:00 and 11:00. In the latter event, the cameras, despite the area being under restricted access, also detected the presence of a passer-by; this anthropogenic disturbance interfered with the crack-meter measurements. This event confirmed that crack-meter devices alone cannot be used to monitor areas like the examined one, and an optical system is fundamental for having an additional control on the global factors acting on the site.
The last recorded event is related to the rockfall that occurred on 7 December 2020, 04:15. In this case, crack-meter data starting from July 2020 show a slight trend of the monitored fissure, which is seen to gradually enlarge up to the time of failure (bottom of Fig. 1, red area). Unfortunately, at that time, the optical instrumentation was off due to the lack of power caused by the adverse weather conditions: in the previous 96 h, a rather intense rainfall event occurred, which reached a peak of 24 h cumulative precipitation of 80 mm. Despite this issue, however, the images and videos obtained before and after the event are consistent with what was detected by the sudden deviation in the data of the crack meter. The fracture monitored by the instrument was not directly affected by the collapse, since the collapse involved a rock block not far from it, while the crack meter itself recorded, at the time of failure, a contraction of approximately 1 mm. In this case, following the same approach, it was possible to estimate the volume of the collapse, which resulted in being about 20 m3±30 %. Based on the data acquired by the secondary camera, we have also observed that the collapse itself occurred in two stages: the most conspicuous part, as already mentioned, collapsed around 04:15, while a second detachment, considerably smaller, occurred between 11:00 and 16:30 on the same day, without affecting the crack-meter measurements (see Fig. 3).
An optical monitoring system (integrated by conventional strain measurement devices) for the control of a coastal rock cliff has been presented in this paper, and the data acquired through the last 2 years have been briefly discussed. The data indicate that the combination of frequently acquired digital images with local displacement measurements can provide useful information regarding the evolution of the rock cliff. In particular, digital images can give information on the rock volumes progressively subjected to detachment and collapse, thus providing clear indications on the evolution of the cliff recession and the areas highly susceptible to instability as well as on the correlation of the failure events with potential triggering factors. Strain sensors, instead, can offer detailed information on the local enlargement or closure behavior of single fractures and joints to be related to the information obtained from the optical images.
In all the events described above, adverse conditions (i.e., severe storms, battery outage, and human disturbance) prevented us from obtaining direct optical information on the collapse itself and from detecting potential precursory signs of the failure. However, the data acquired show that, even in such adverse cases, the monitoring system is capable of giving valuable information, even using only shots that are antecedent and subsequent to the failure event.
The choice of using a single strain sensor is only due to the fact that we are experimenting with a very low-cost monitoring system; in other cases, this system can be extended with as many crack meters as needed.
Moreover, despite being a low-cost solution, this system demonstrated a lot of potential, especially in flexibility and adaptability, since it allows us to readily estimate the volume of the fallen blocks as well as the evolving failure mechanism of the examined coastal sector and, as such, the potential evolution of the coastal retreat. As a consequence, it could easily be applied to the monitoring of different coastal areas subject to rockfalls.
No data sets were used in this article.
PL and PA designed and supervised the research. PA engineered the hardware platform. DiG implemented the software platform. DiG, NLF, MP and PL installed the system on site. PL, NLF and MP studied the site. DiG, DaG and PA were responsible of data analysis, interpretation and visualization. DaG also did some drone flight on the site, to confirm the volumes of the falls. DiG wrote the paper, in collaboration with all other authors. All authors reviewed the results and approved the final version of the manuscript.
The contact author has declared that neither they nor their co-authors have any competing interests.
Publisher's note: Copernicus Publications remains neutral with regard to jurisdictional claims in published maps and institutional affiliations.
The present work is funded by the Apulia regional authority and is part of the research project “Integrated assessment of geo-hydrological instability processes in Apulia region, interpretative models and rainfall thresholds for shallow landslides” (grant no. POR-FESR 2014-2020).
This paper was edited by Oded Katz and reviewed by two anonymous referees.
Adams, P. N., Storlazzi, C. D., and Anderson, R. S.: Nearshore wave-induced cyclical flexing of sea cliffs, J. Geophys. Res., 110, F02002, https://doi.org/10.1029/2004JF000217, 2005.
Allasia, P., Godone, D., Giordan, D., Guenzi, D., and Lollino, G.: Advances on Measuring Deep-Seated Ground Deformations Using Robotized Inclinometer System, Sensors, 20, 3769, https://doi.org/10.3390/s20133769, 2020.
Dematteis, N., Giordan, D., Troilo, F., Wrzesniak, A., and Godone, D.: Ten-Year Monitoring of the Grandes Jorasses Glaciers Kinematics. Limits, Potentialities, and Possible Applications of Different Monitoring Systems, Remote Sensing, 13, 15, 3005, https://doi.org/10.3390/rs13153005, 2021.
Fazio, N. L., Perrotti, M., Andriani, G. F., Mancini, F., Rossi, P., Castagnetti, C., and Lollino, P.: A new methodological approach to assess the stability of discontinuous rocky cliffs using in-situ survey supported by UAV-based techniques and 3-D finite element model: a case study, Eng. Geol., 260, 105205, https://doi.org/10.1016/j.enggeo.2019.105205, 2019.
Giordan, D., Allasia, P., Dematteis, N., Dell'Anese, F., Vagliasindi, M., and Motta, E.: A Low-Cost Optical Remote Sensing Application for Glacier Deformation Monitoring in an Alpine Environment, Sensors, 16, 1750, https://doi.org/10.3390/s16101750, 2016.
Giordan, D., Dematteis, N., Allasia, P., and Motta, E.: Classification and kinematics of the Planpincieux Glacier break-offs using photographic time-lapse analysis, J. Glaciol., 66, 188–202, 2020.
Herrera, G., López-Davalillos, J. C. G., Fernández-Merodo, J. A., Béjar-Pizarro, M., Allasia, P., Lollino, P., Lollino, G., Guzzetti, F., Álvarez-Fernández, M. I., Manconi, A., Duro, J., Sánchez, C., and Iglesias, R.: The differential slow-moving dynamic of a complex landslide: Multi-sensor monitoring, in: Proceedings of the 4th World Landslide Forum, 29 May–2 June 2011, Ljubljana, Slovenia, 219–225, https://doi.org/10.1007/978-3-319-53498-5_25, 2011.
Intrieri, E., Gigli, G., Nocentini, M., Lombardi, L., Mugnai, F., Fidolini, F., and Casagli, N.: Sinkhole monitoring and early warning: An experimental and successful GB-InSAR application, Geomorphology, 241, 304–314, https://doi.org/10.1016/j.geomorph.2015.04.018, 2015.
Lollino, P. and Andriani, G. F.: Role of Brittle Behaviour of Soft Calcarenites Under Low Confinement: Laboratory Observations and Numerical Investigation, Rock Mech. Rock Eng., 50, 1863–1882, https://doi.org/10.1007/s00603-017-1188-0, 2017.
Lollino, P., Pagliarulo, R., Trizzino, R., Santaloia, F., Pisano, L., Zumpano, V., Perrotti, M., and Fazio, N. L.: Multi-scale approach to analyse the evolution of soft rock coastal cliffs and role of controlling factors: a case study in south-eastern Italy, Geomatics Hazard Risk, 12, 1058–1081, https://doi.org/10.1080/19475705.2021.1910351, 2021.
Perrotti, M., Godone, D., Allasia, P., Baldo, M., Fazio, N. L., and Lollino, P.: Investigating the susceptibility to failure of a rock cliff by integrating Structure-from-Motion analysis and 3D geomechanical modelling, Remote Sens., 12, 3994, https://doi.org/10.3390/rs12233994, 2020.
R Core Team: R – A language and environment for statistical computing, R Foundation for Statistical Computing, Vienna, Austria, available at: https://www.R-project.org/ (last access: 25 January 2022), 2021.
Sansò, P., Gianfreda, F., Leucci, G., and Mastronuzzi, G.: Cliff evolution and late Holocene relative sea level change along the Otranto coast (Salento peninsula, southern Apulia, Italy), J. Geophys. Res., 9–12, 42–53, 2016.
Stephenson, W. and Naylor, L.: Rock coast geomorphology, Geomorphology, 114, 1–100, 2010.
Sunamura, T.: Geomorphology of rocky coasts, Wiley & Sons, Chichester, UK, 1–314, 1992.