the Creative Commons Attribution 4.0 License.
the Creative Commons Attribution 4.0 License.
 | 02 Jun 2022
Automated avalanche hazard indication mapping on a statewide scale
Peter Bebi
Marc Christen
Stefan Margreth
Lukas Stoffel
Andreas Stoffel
Christoph Marty
Gregor Schmucki
Andrin Caviezel
Roderick Kühne
Stephan Wohlwend
Perry Bartelt
Snow avalanche hazard mapping has a long tradition in the European Alps. Hazard maps delineate areas of potential avalanche danger and are only available for selected areas where people and significant infrastructure are endangered. They have been created over generations, at specific sites, mainly based on avalanche activity in the past. For a large part of the area (90 % in the case of the canton of Grisons) only strongly generalized hazard indication maps are available (SilvaProtect), not showing impact information such as pressure. This is a problem when new territory with no or an incomplete historical record is to be developed. It is an even larger problem when trying to predict the effects of climate change at the state scale, where the historical record may no longer be valid. To close this gap, we develop an automated approach to generate spatially coherent hazard indication mapping based on a digital elevation model for the canton of Grisons (7105 km2) in the Swiss Alps. We calculate eight different scenarios with return periods ranging from frequent to very rare as well as with and without taking the protective effects of the forest into account, resulting in a total of approximately 2 million individual avalanche simulations. This approach combines the automated delineation of potential release areas, the calculation of release depths and the numerical simulation of the avalanche dynamics. We find that between 47 % (most frequent scenario) and 67 % (most extreme scenario) of the cantonal area can be affected by avalanches. Without forest, approximately 20 % more area would be endangered. This procedure can be applied worldwide, where high-spatial-resolution digital elevation models, detailed information on the forest and data on the snow climate are available, enabling reproducible hazard indication mapping also in regions where no avalanche hazard maps yet exist. This is invaluable for climate change studies. The simulation results are validated with official hazard maps, by assessments of avalanche experts, and by existing avalanche cadastres derived from manual mapping and mapping based on satellite datasets. The results for the canton of Grisons are now operationally applied in the daily hazard assessment work of the authorities. Based on these experiences, the proposed approach can be applied for further mountain regions.
- Article
(49018 KB) - Full-text XML
- BibTeX
- EndNote


Hazard maps are a key tool to cope with avalanche hazard in settled regions within alpine terrain, delineating areas with high risk, where buildings and infrastructure should not be erected (Rudolf-Miklau et al., 2014). In Switzerland and most other alpine countries, hazard maps are generated by avalanche experts for individual avalanche tracks, combining historical records, field investigations, terrain analysis, forest information and numerical modeling. Hazard maps proved to be an effective and reliable tool to prevent avalanche damage and victims (Margreth and Romang, 2010). However, hazard maps are only available for selected areas, mainly where infrastructure already exists, and are very costly to elaborate, in particular for large regions. For the canton of Grisons in Switzerland for example, only 10 % of the alpine area is covered by hazard maps. If new buildings and infrastructure are planned, limited information on avalanche hazard is available in most areas. Furthermore, there are many mountain regions worldwide where no hazard maps exist at all. To overcome this gap, we developed a computer-based, automated procedure to generate reproducible avalanche hazard indication maps over large regions based on digital elevation model (DEM) data. In addition to the detailed hazard maps, hazard indication maps show the potential hazard areas outside the settlement area. These maps contain rough model-based estimates of the maximum hazard area affected in the case of an extreme event; however, they usually do not contain any information about the intensities that will occur.
Avalanche hazard indication mapping has been tested in different regions before. In 2004, the project SilvaProtect-CH started a first attempt to model the protective effects of the forest in Switzerland (BAFU, 2013; Gruber and Baltensweiler, 2004). This approach was based on a 25 m resolution DEM and the numerical avalanche simulation tool AVAL-2D (Gruber and Bartelt, 2007). A generalized version of these results is still applied in Switzerland today, due to a lack of alternatives, resulting in hazard indication maps delineating the vast majority of alpine terrain a hazard area, lacking detailed information. This coarse level of detail is of limited use for most practical applications. Ghinoi and Chung (2005) developed a statistical model to assess avalanche susceptibility in the Italian Dolomites but without modeling avalanche runout. Barbolini et al. (2011) developed a semi-automated procedure to map avalanche hazard in two test sites in Italy based on the simple α runout model (McClung and Mears, 1991) and statistical modeling (Barbolini and Keylock, 2002). Soteres et al. (2020) produced an avalanche susceptibility map of the Circo de Gredos in Spain, applying geographic information system (GIS) tools and a collection of information from newspapers, field observations and feedback from backcountry users. They do not account for avalanche runout outside observed avalanche tracks. Horton et al. (2013) applied the hydrological flow model Flow-R for different processes such as rockfalls, debris flows and snow avalanches. The avalanche hazard mapping was calculated for an area of 25 km2. Aydin and Eker (2017) modeled avalanche hazard in the Bayburt region in Turkey based on a 10 m resolution DEM applying the Austrian Elba+ model, an improved version of the Elba model (Volk and Kleemayr, 1999). They further developed their approach for the Çaykara District (Aydin et al., 2021). Even though an avalanche runout model is applied, only one scenario is calculated. Larsen et al. (2020) developed an avalanche terrain exposure scale (ATES) for Norway, applying the raster-based TauDEM model. Issler (2020) developed NAKSIN, a new methodology for avalanche hazard indication maps in Norway. Choubin et al. (2019) applied machine learning methods to predict avalanche hazard areas in the Karaj watershed in Iran. They focus on topographical and partly negligible land cover variables and do not apply an avalanche runout model. All of these recent approaches contain interesting components but are not able to produce reliable and validated avalanche runout modeling. However, this is key for hazard indication mapping within the settled areas of alpine valleys.
By developing a reliable and carefully validated algorithm to delineate potential avalanche release areas (PRAs) (Maggioni and Gruber, 2003; Bühler et al., 2013), we initiated the possibility of applying the state-of-the-art avalanche dynamics model RAMMS (Christen et al., 2010b) to automatically generate hazard indication maps on a large scale (Bühler et al., 2018a) and to produce terrain classifications for backcountry touring (Harvey et al., 2018). Avalanche experts worldwide have been applying the RAMMS model for more than 10 years for hazard mapping and mitigation measure planning (Rudolf-Miklau et al., 2014), making it the most applied, tested, validated and therefore trusted avalanche dynamics model for the simulation of dense-flow avalanches. A main advantage of this approach is that it accounts for the standard return periods for hazard mapping applied in Switzerland and can therefore produce different hazard scenarios. We apply this newly developed automated hazard indication mapping tool to the canton of Grisons in Switzerland and validate the results with existing hazard maps, assessments of avalanche experts, historical avalanche cadastres and avalanche records mapped by satellites. Then we discuss the strengths and weaknesses of this approach and provide an outlook on future applications and potential improvements.
The Swiss canton of Grisons with a total area of 7105 km2 is the largest state of Switzerland (total area 41 285 km2); 100 % of its area is Alpine terrain, ranging from Piz Bernina (4049 m a.s.l.) down to the Moësa river in the Misox valley (252 m a.s.l.) at the border to the canton of Ticino (Fig. 1). With a permanent population of roughly 200 000 persons its population density is the lowest in Switzerland (28 persons per square kilometer; average in Switzerland: 215 persons per square kilometer). However, during the winter season roughly 2.5 million tourists (overnight stays) visit the more than 40 ski resorts in the canton every year. Some of these ski resorts are world-famous, for example St. Moritz, Davos-Klosters, Arosa-Lenzerheide or Flims-Laax. Providing and securing the infrastructure for all these people in high alpine terrain is a challenging task.
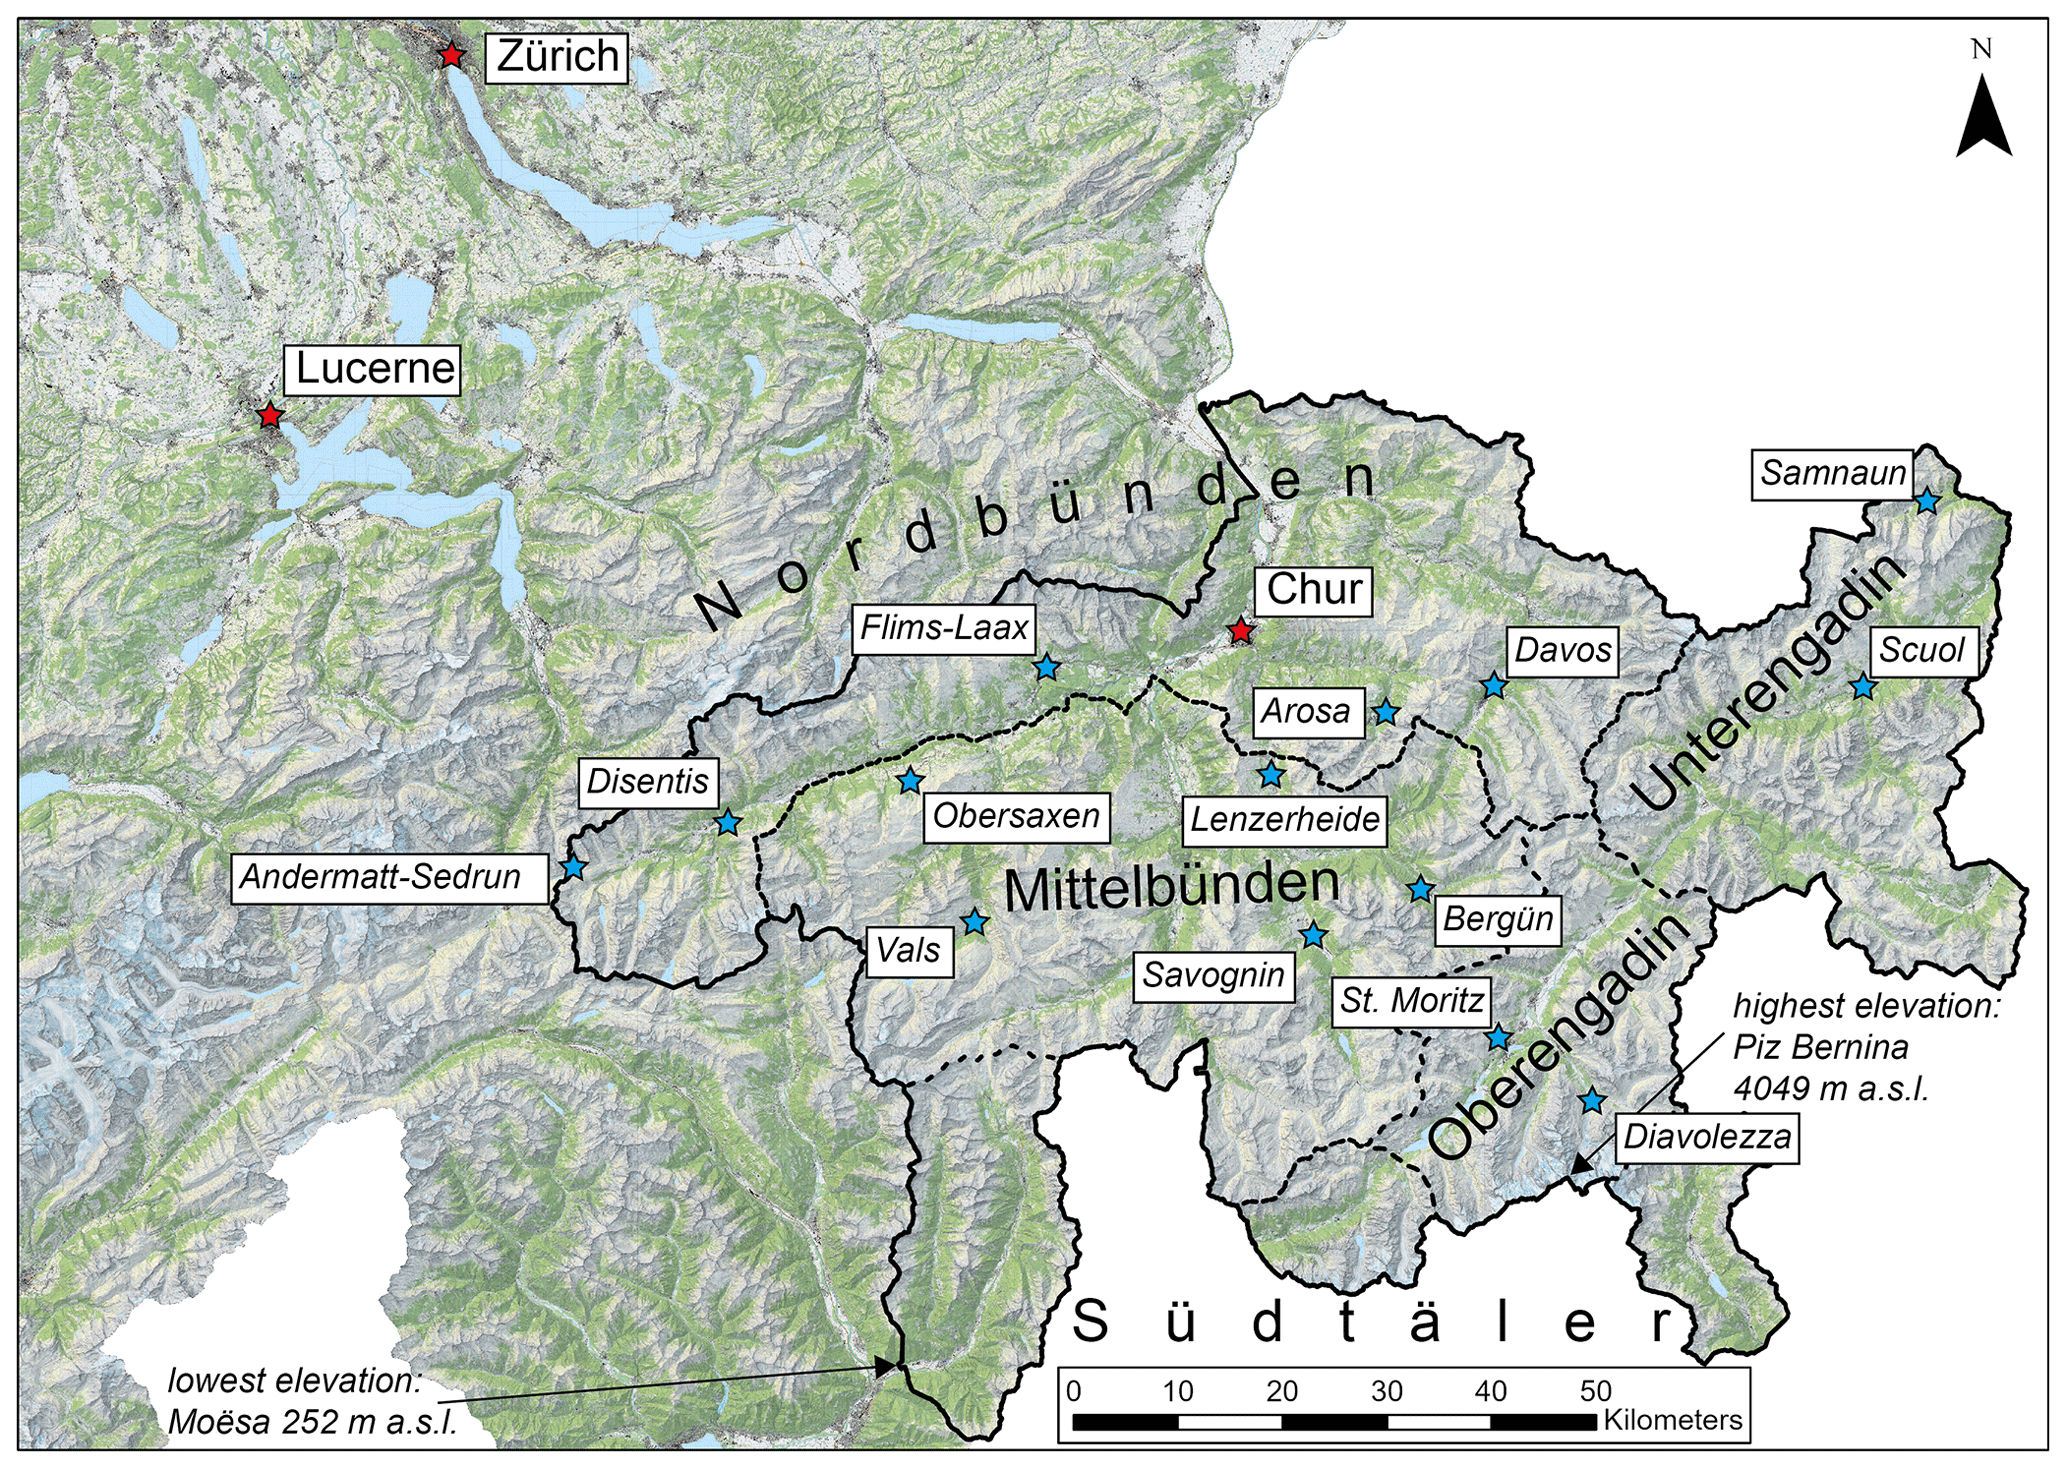
Figure 1Map of eastern Switzerland visualizing the extent of the canton of Grisons (black outline), the major towns (red stars) and the largest ski resorts (blue stars) as well as the climatic regions (dashed lines) applied in Sect. 3.4 to regionalize the release depth (d0) of the avalanches (map source: Swiss Federal Office of Topography).
The extreme relief causes frequent gravitational mass movements such as snow avalanches, rockfalls, debris flows and landslides. A severe event took place at the Pizzo Cengalo in 2017 where roughly 3×10⁶ m3 of rock caused a large rock avalanche, killing eight people and causing large debris flows reaching the village of Bondo at the valley bottom (Walter et al., 2020). Extreme avalanche winters such as 1999 (SLF, 2000) and again 2018 and 2019 (Bühler et al., 2019; Bründl et al., 2019; Zweifel et al., 2019) caused damage, but thanks to well-established protection strategies (Bründl and Margreth, 2021) there were only few victims.
The Department for Forest and Natural Hazards (AWN) of the canton of Grisons developed hazard maps for the settled regions in collaboration with local engineering offices. However, these maps only exist within predefined areas, where buildings and infrastructure are at immanent risk. This is the case for approximately 10 % of the area of the canton of Grisons. For the remaining 90 % of the area, no hazard maps exist. If new infrastructure is planned in areas outside the hazard maps, if existing settlements grow into such areas or if a detailed assessment of the protective effects of forests is necessary, the basic information allowing for risk assessment has to be generated. Therefore, the AWN commissioned the WSL Institute for Snow and Avalanche Research SLF to develop an approach to fill the blind spots and to generate a hazard indication maps for snow avalanches for the entire area of the canton. The approach should be automated and build on available geodata.
3.1 Digital terrain model (DTM) and scenario setting
The basis for the delineation of the PRAs (Sect. 3.3) and the numerical avalanche simulations (Sect. 3.5) is the DEM provided by swisstopo. The applied DTM swissALTI3D, representing the bare earth surface without vegetation and buildings, is available for the entire area of Switzerland with a spatial resolution of 2 m (swisstopo, 2018). It is produced based on airborne laser scanning (below 2000 m a.s.l.) and airborne photogrammetry (above 2000 m a.s.l.) data and has a nominal accuracy of 0.5 m in the x, y and z dimensions for the lower part and 1–3 m for the higher part of the DTM. Due to the smoothing effect of the snow cover on the terrain, the original DTM was resampled to a resolution of 5 m (Bühler et al., 2018a, b). Based on this DTM product, the derivatives slope, curvature, aspect and ruggedness are calculated with ArcGIS Pro tools (ESRI).
Based on the standard procedure for snow avalanche hazard mapping in Switzerland defined by the Federal Office for the Environment (FOEN) in collaboration with SLF, we simulate the four return periods 10, 30, 100 and 300 years, where the 10-year return period is optional in the guidelines. To assess the protective effects of the forest, we simulate these scenarios once taking the forest effects into account for the PRAs (For) and once without taking it into account (NoFor). This results in eight different scenarios.
3.2 Forest information
In order to define forests with a potentially protective effect against avalanches, we deduce objective criteria for potential avalanche releases in forested terrain and implement them within a GIS approach described in Bebi et al. (2021). We therefore statistically analyze data on forest structure and topography of 150 avalanche releases in forested terrain (Schneebeli and Meyer-Grass, 1993) and use the modeling approach of Bebi et al. (2001) to deduce threshold values for relevant explanatory variables (Fig. 2). The resulting logistic regression model is reduced to the variables “slope inclination”, “percentage of crown cover” and “gap width” and allows us to deduce an “avalanche disposition” between 0 % (no disposition) and 100 % (very high avalanche release probability) to each forested raster cell of 5×5 m. To minimize the calculation time, we applied the model only within a forest mask, defined by forested areas according to the Federal Office of Topography (swisstopo) and the Swiss National Forest Inventory (NFI). We define different threshold values for tree heights to assign forest gaps (“gap threshold”) and forest cover (“forest cover threshold”) for the two different avalanche scenarios (frequent and very rare). The calculation of the gap threshold considers regional differences in snow depth distribution according to Margreth (2007) and compensates for underestimation of tree heights by the used vegetation height model. The forest cover threshold takes into account the coverage at different spatial scales and optimizes for the detection of trees, especially in a critical range between 3 and 5 m (see details in Table 2 in Bebi et al., 2021). In order to account for increased protection forest capacities of high terrain roughness compared to smooth surfaces, we delineate areas with a high surface roughness with the “vector ruggedness measure” (VRM) according to Sappington et al. (2007) based on the 2 m DTM (swissALTI3D) and a moving window of 5×5 m. Areas with a value > 0.02 and no lateral convex curvature are considered to be rough (Brožová et al., 2021). Likewise, we account for reduced protection forest capacities of shrubs (e.g., green alder, Alnus viridis, or the shrub form of mountain pine, Pinus mugo Turra subsp. mugo) compared to trees with erect growth forms of the same height. We consider the scrub forest area layer according to Weber et al. (2020) and assign a lower protection forest index to areas covered by shrubs (Fig. 2). Based on the resulting “protection forest index” we then deduce threshold values defining a sufficient protection forest index for frequent (10–30-year return period) and very rare (100–300-year return period) scenarios. We finally correct the protection forest thresholds and other threshold values in an iterative process after validating avalanche simulations with former avalanche events and after discussing different scenarios together with the responsible regional natural hazard experts (Bebi et al., 2021).

Figure 2Schematic structure of the model for calculating the spatial extent of potential avalanche protection forest, simplified according to (Bebi et al., 2021).
3.3 PRA identification
The detailed approach to automatically identify and delineate the PRAs, combining GIS terrain analysis with object-based image analysis (OBIA), is described in Bühler et al. (2018a) in detail. The only adaption is that the fold (a derivative of the curvature) is replaced by the curvature itself. The main input datasets are the binary forest information (Sect. 3.2) and the DTM (Sect. 3.1). To efficiently process the large area, the different steps are programmed in Python scripts and are run by ArcGIS Pro. To avoid PRAs with very low release probability, polygons with areas less than 1000 m2, a mean slope angle of less than 28∘ or with a mean elevation of less than 600 m a.s.l. are excluded. These thresholds were elaborated in collaboration with the cantonal experts.
3.4 Release depth d0
The calculation of the release depth d0, the SLF standard procedure (Salm et al., 1990), is carried out as follows: for each PRA polygon, the specific snow climate region is assigned (Fig. 1). Based on the long-term data series from the SLF observer network (https://www.slf.ch/en/avalanche-bulletin-and-snow-situation/measured-values/description-of-manual-measuring-sites.html, last access: 14 January 2022), the annual maxima of snow depth increase (in centimeters) within 3 d (ΔHS3; Fig. 3) are then calculated, and the return period (e.g., for a 10-year event) is determined. This return level is adjusted to the height of the respective polygon using a gradient of 5 cm per 100 m elevation change. Next, a flat-rate drifting snow surcharge is added. Below 1000 m no surcharge is added, and above 2000 m the full surcharge (300 years: 0.5 m; 100 years: 0.3 m; 30 years: 0.2 m; and 10 years: 0.1 m) is added; the local topography and snow drift situation was not taken into account. In between, linear interpolation is used to give more weight to the altitude dependence. Finally, the slope gradient is considered by assuming that less snow can be accumulated in steep areas than in flat areas. We improved the standard procedure by replacing the Gumbel distribution for the return level estimation with the generalized extreme value (GEV) distribution. The GEV allows for three different types of distributions (one of which is the Gumbel distribution), which more closely matches the possible distribution of the measured data. On the other hand, we determined the return values of ΔHS3 per climate region and not per station. The reason for this is the large estimation uncertainties in return values for the individual stations.
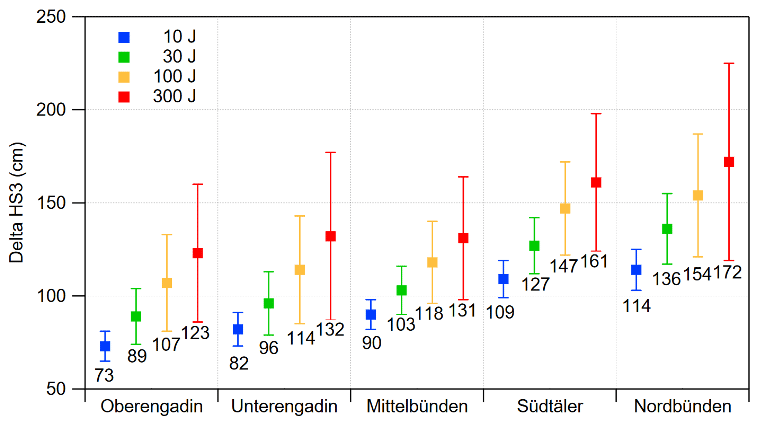
Figure 3ΔHS3 values in centimeters and associated uncertainties for the five different climatic regions of Grisons and the four scenarios normalized to an elevation of 2000 m a.s.l.
To derive the ΔHS3 values for the five different snow climate regions, the daily data of 44 long-term, manual SLF and MeteoSwiss snow measuring stations between 1000 and 2600 m are used. The minimum measurement duration is 25 years, and the median value of the measurement duration of all stations is 65 years. We decided to divide the canton into the following regions with respect to different snow climates: Oberengadin, Unterengadin, Mittelbünden, Nordbünden, Südtäler (Fig. 1). However, it must be taken into account that especially the determination of the return values of 100- and 300-year events reveals such large uncertainties for all stations (Fig. 3) that a clear distinction between the regions is hardly possible. The original goal was to determine the elevation gradients per climate region. A separate study of the same 44 stations demonstrates that the gradients strongly depend on the individual heavy snowfall events and on the selection of stations. It is therefore decided to continue with the old SLF standard gradient of ±5 cm per 100 vertical meters. This means that the return values and their uncertainty for the calculation of the release depth are determined as a function of the elevation and the climatic region.
3.5 Numerical avalanche simulations with RAMMS::LSHIM (large-scale hazard indication mapping)
The PRAs (Sect. 3.3) for the eight scenarios (10 years – frequent, 30 years – average, 100 years – rare, 300 years – very rare, with and once without taking the protective effects of the forest into account) are then loaded with the corresponding d0 (Sect. 3.4) based on their location within one of the five climatic regions (Fig. 3). Based on the size of the avalanche release area and d0, the PRAs are classified into the volume classes large (> 60 000 m3), medium (25 000–60 000 m3), small (5000–25 000 m3) and tiny (< 5000 m3) to define the RAMMS model friction parameters μ (basal friction) and ξ (turbulent friction) according to the RAMMS standard modeling workflow (Christen et al., 2010b), which is applied in Switzerland for hazard mapping. Then the calculation domains are delineated for every individual PRA. Due to the large study area, a calculation grid of 10 m spatial resolution is applied for the RAMMS::LSHIM calculations. The parameter setting is based upon the standard approach for avalanche hazard mapping in Switzerland. Curvature effects for the friction are considered, the cohesion is set to 50 Pa, and the stop criterion is set to 5 % of the total momentum. Based on these input datasets, all individual PRAs are simulated with RAMMS::LSHIM (Bühler et al., 2018b) in sequence as individual avalanches, not interacting with each other.
The output is then combined to raster maps of the maximum pressure, velocity and flow depth per cell. The outlines of the avalanches are exported as polygons containing the area with a maximum flow depth larger than 0.25 m and a maximum velocity larger than 1 m s−1. For the scenarios taking forest into account (For), the forest layer (Sect. 3.2) is additionally considered for the automatic definition of the friction values. For the PRAs in the volume classes small and tiny, the turbulent friction ξ is set to 400 m s−1, braking the velocity of the avalanche (Christen et al., 2010b). For the volume classes large and medium this braking effect is neglected because a destruction of the forest is assumed. We perform these calculations on a DALCO rack-mount server with 96 cores and 384 GB RAM. The calculation of one scenario takes about 24 h for approximately 200 000 simulations.
3.6 Assumptions and limitations
The presented approach automatically generates the PRAs; defines the release volumes; and simulates the avalanche runout, impact pressure, flow velocity and flow depth. To be able to automate this process, several important assumptions have to be made:
-
The simulations are based on up-to-date digital elevation model data and the recent status of the forest. However, the terrain characteristics and in particular the forest structure can locally change (Bebi et al., 2009), impacting the avalanche hazard. Snow cover or avalanche deposits are not considered.
-
The hazard indication maps do not take release probabilities into account. The basic assumption is that all potential release areas, derived with the PRA algorithm (Sect. 3.3), will release and produce an avalanche. The return periods are only linked to the forest layer (frequent and very rare; Sect. 3.2), the release depth d0 (Sect. 3.4) and the friction values of the RAMMS model (Sect. 3.5).
-
Only the dense flowing part of dry avalanches is simulated. Powder snow avalanches and wet-snow avalanches are not considered. Also, the occurrence of several subsequent avalanches within tracks as well as the interaction of different avalanches and snow entrainment is neglected.
-
Mitigation measures within avalanche release zones are not taken into account as a reliable GIS layer containing the necessary information is not yet available for the canton of Grisons. However, for the automated hazard indication mapping of Liechtenstein, where such a layer was available, the mitigation measures were considered. The effect of the supporting structures was checked by an expert, in particular on the basis of the height of the structure, the type of construction and the arrangement. In those areas of supporting structures that were found to be fully effective, no release areas were identified. The mitigation measures within the avalanche tracks, such as deflection and catching dams, are only applied if they are well depicted in the DTM data. This is one of the reasons for discrepancies in the official hazard maps (Sect. 5.1).
-
Not all PRAs present in reality can be captured with the presented approach. For example, PRAs caused by cornice failure or initiated in extremely steep rock faces are neglected. On the other hand, even the runout of the 300-year scenarios does not completely cover all area that could be endangered by an avalanche in very rare scenarios. In particular where very large bowls are present that could release as a whole in a very rare case, the release volume can be underestimated. Yet the reach of powder clouds and the breakout of side arms of wet-snow avalanches cannot be simulated.
These points need to be considered for the interpretation of the results and the application of the final products. Nevertheless, the generated maps are very valuable for numerous practical applications (Sect. 6).
4.1 Forest layers
Our automated approach allowed us to define forests with potentially protective effects against avalanches for rare to very rare (100–300 years) avalanche events and for relatively frequent (10–30 years) events (Fig. 4). A total area of 1868 km2 (71 % of the forested area in Graubünden) was assigned a protective effect against rare and very rare avalanche events. These forest areas are mainly characterized by a relatively dense to moderately dense forest cover of trees that clearly exceed the height of the area-specific extreme snow height. As slope angle is an important factor in the underlying logistic model, 37 % of these forests are on terrain with a steepness of < 35∘. Forests with a potentially protective effect against relatively frequent avalanches cover a total area of 2088 km2 (79 % of the total forest cover). In addition to forests with an assigned protection effect against rare and very rare avalanches, this category contains a larger variety of more open and less tall trees in a steeper environment. Typical forests with an assigned effect against frequent but not against rare or very rare avalanche events are found in higher elevations close to treelines or in disturbed forests (Fig. 3).
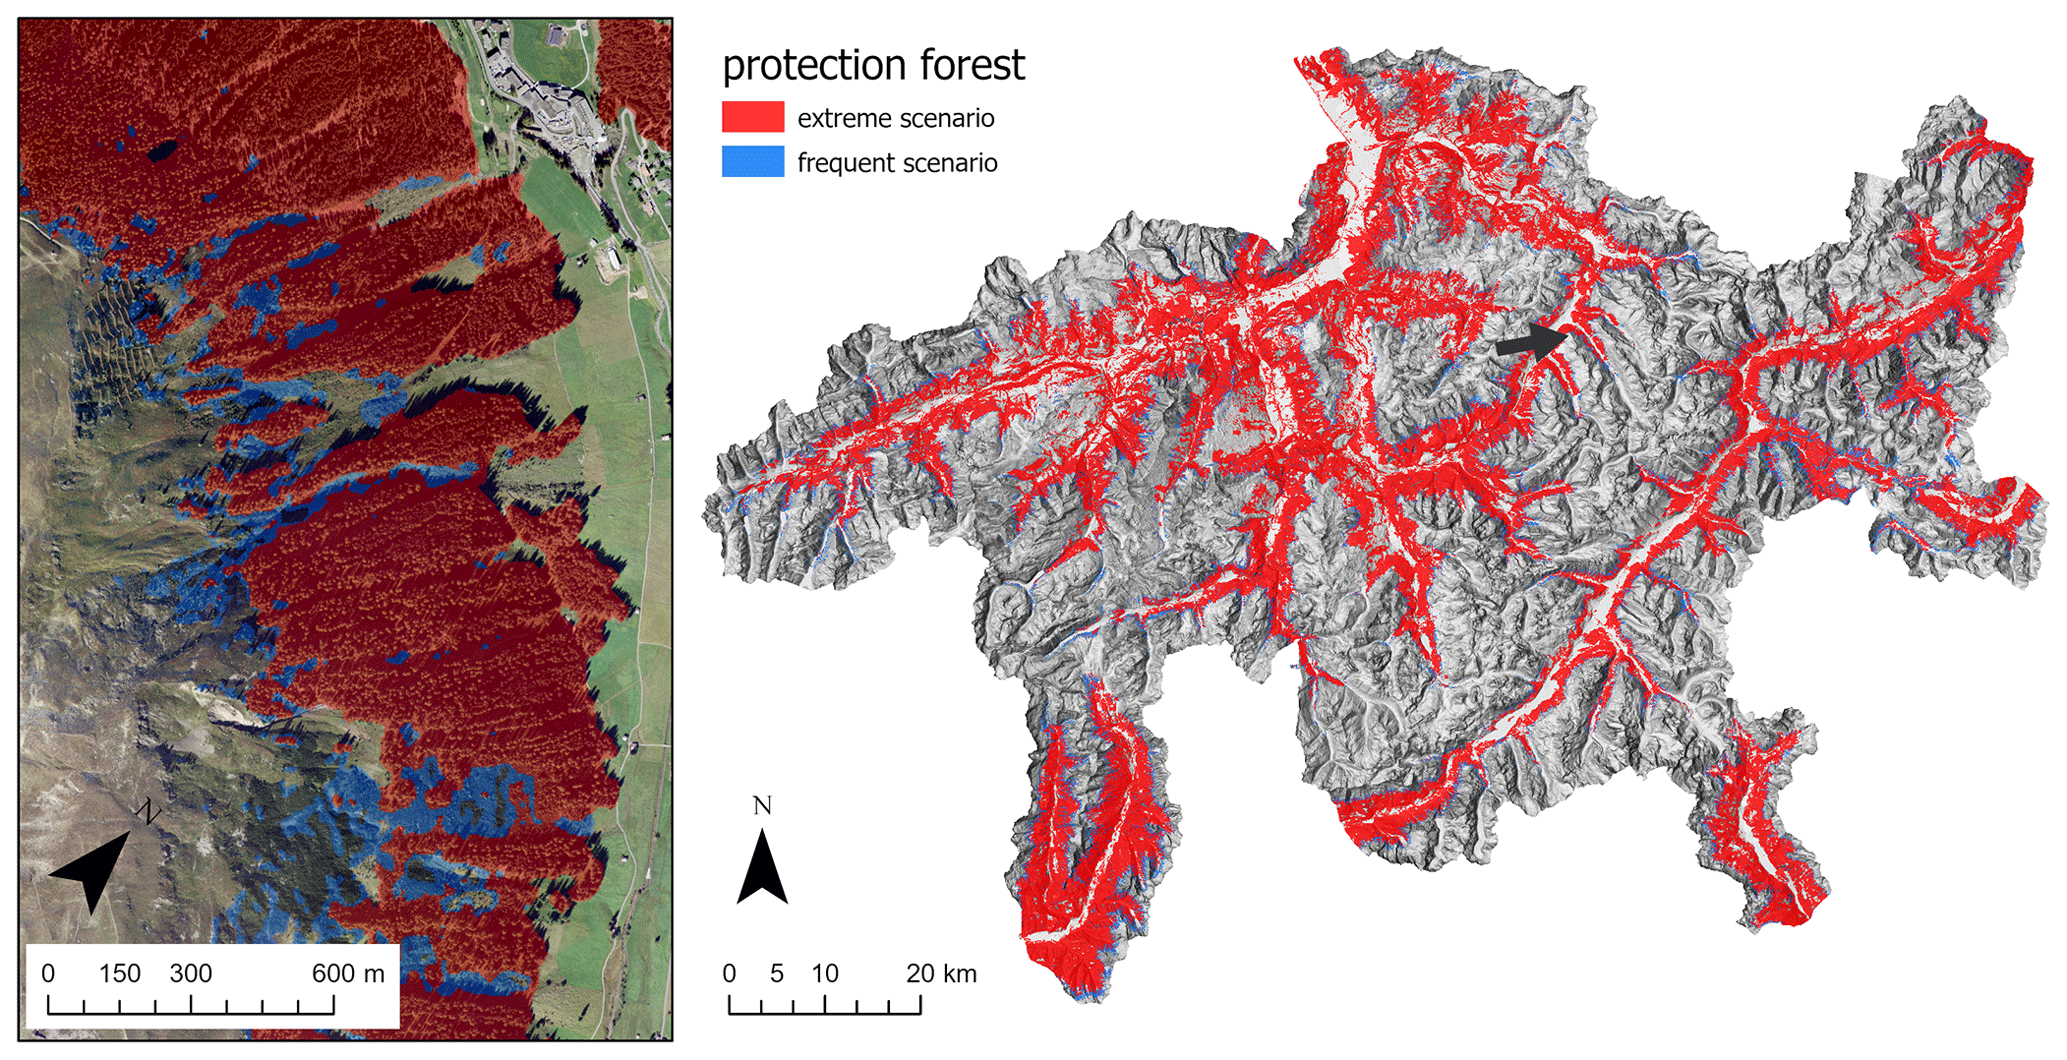
Figure 4Protection forest map for the canton of Graubünden for a frequent (10–30 years) avalanche scenario (corresponding to avalanche events with a 10–30-year return period, displayed in blue and red combined) and for an extreme-snow-cover scenario (corresponding to a ca. 100–300-year avalanche event, displayed in red). Orthophoto source: Swiss Federal Office of Topography.
4.2 Release areas
In total, nearly 2 million individual avalanches are simulated. Figures 5 and 6 show the results of the PRA delineation (Sect. 3.3) for all scenarios in an area of approximately 4 km2. The size of the PRA is increased with increasing return period. The forest, where present, prevents the formation of a release area and therefore reduced the PRAs by roughly one-third (Table 1). For the 300yFor scenario, 29 % of the area of the entire canton of Grisons (7105 km2) is delineated as a PRA. For the scenario 300yNoFor it is already 43 %. For the 10y scenarios it is 22 % (For) and 35 % (NoFor). These numbers illustrate the steep topography and the high protective effects of forests in the canton of Grisons for the prevention of avalanche release.
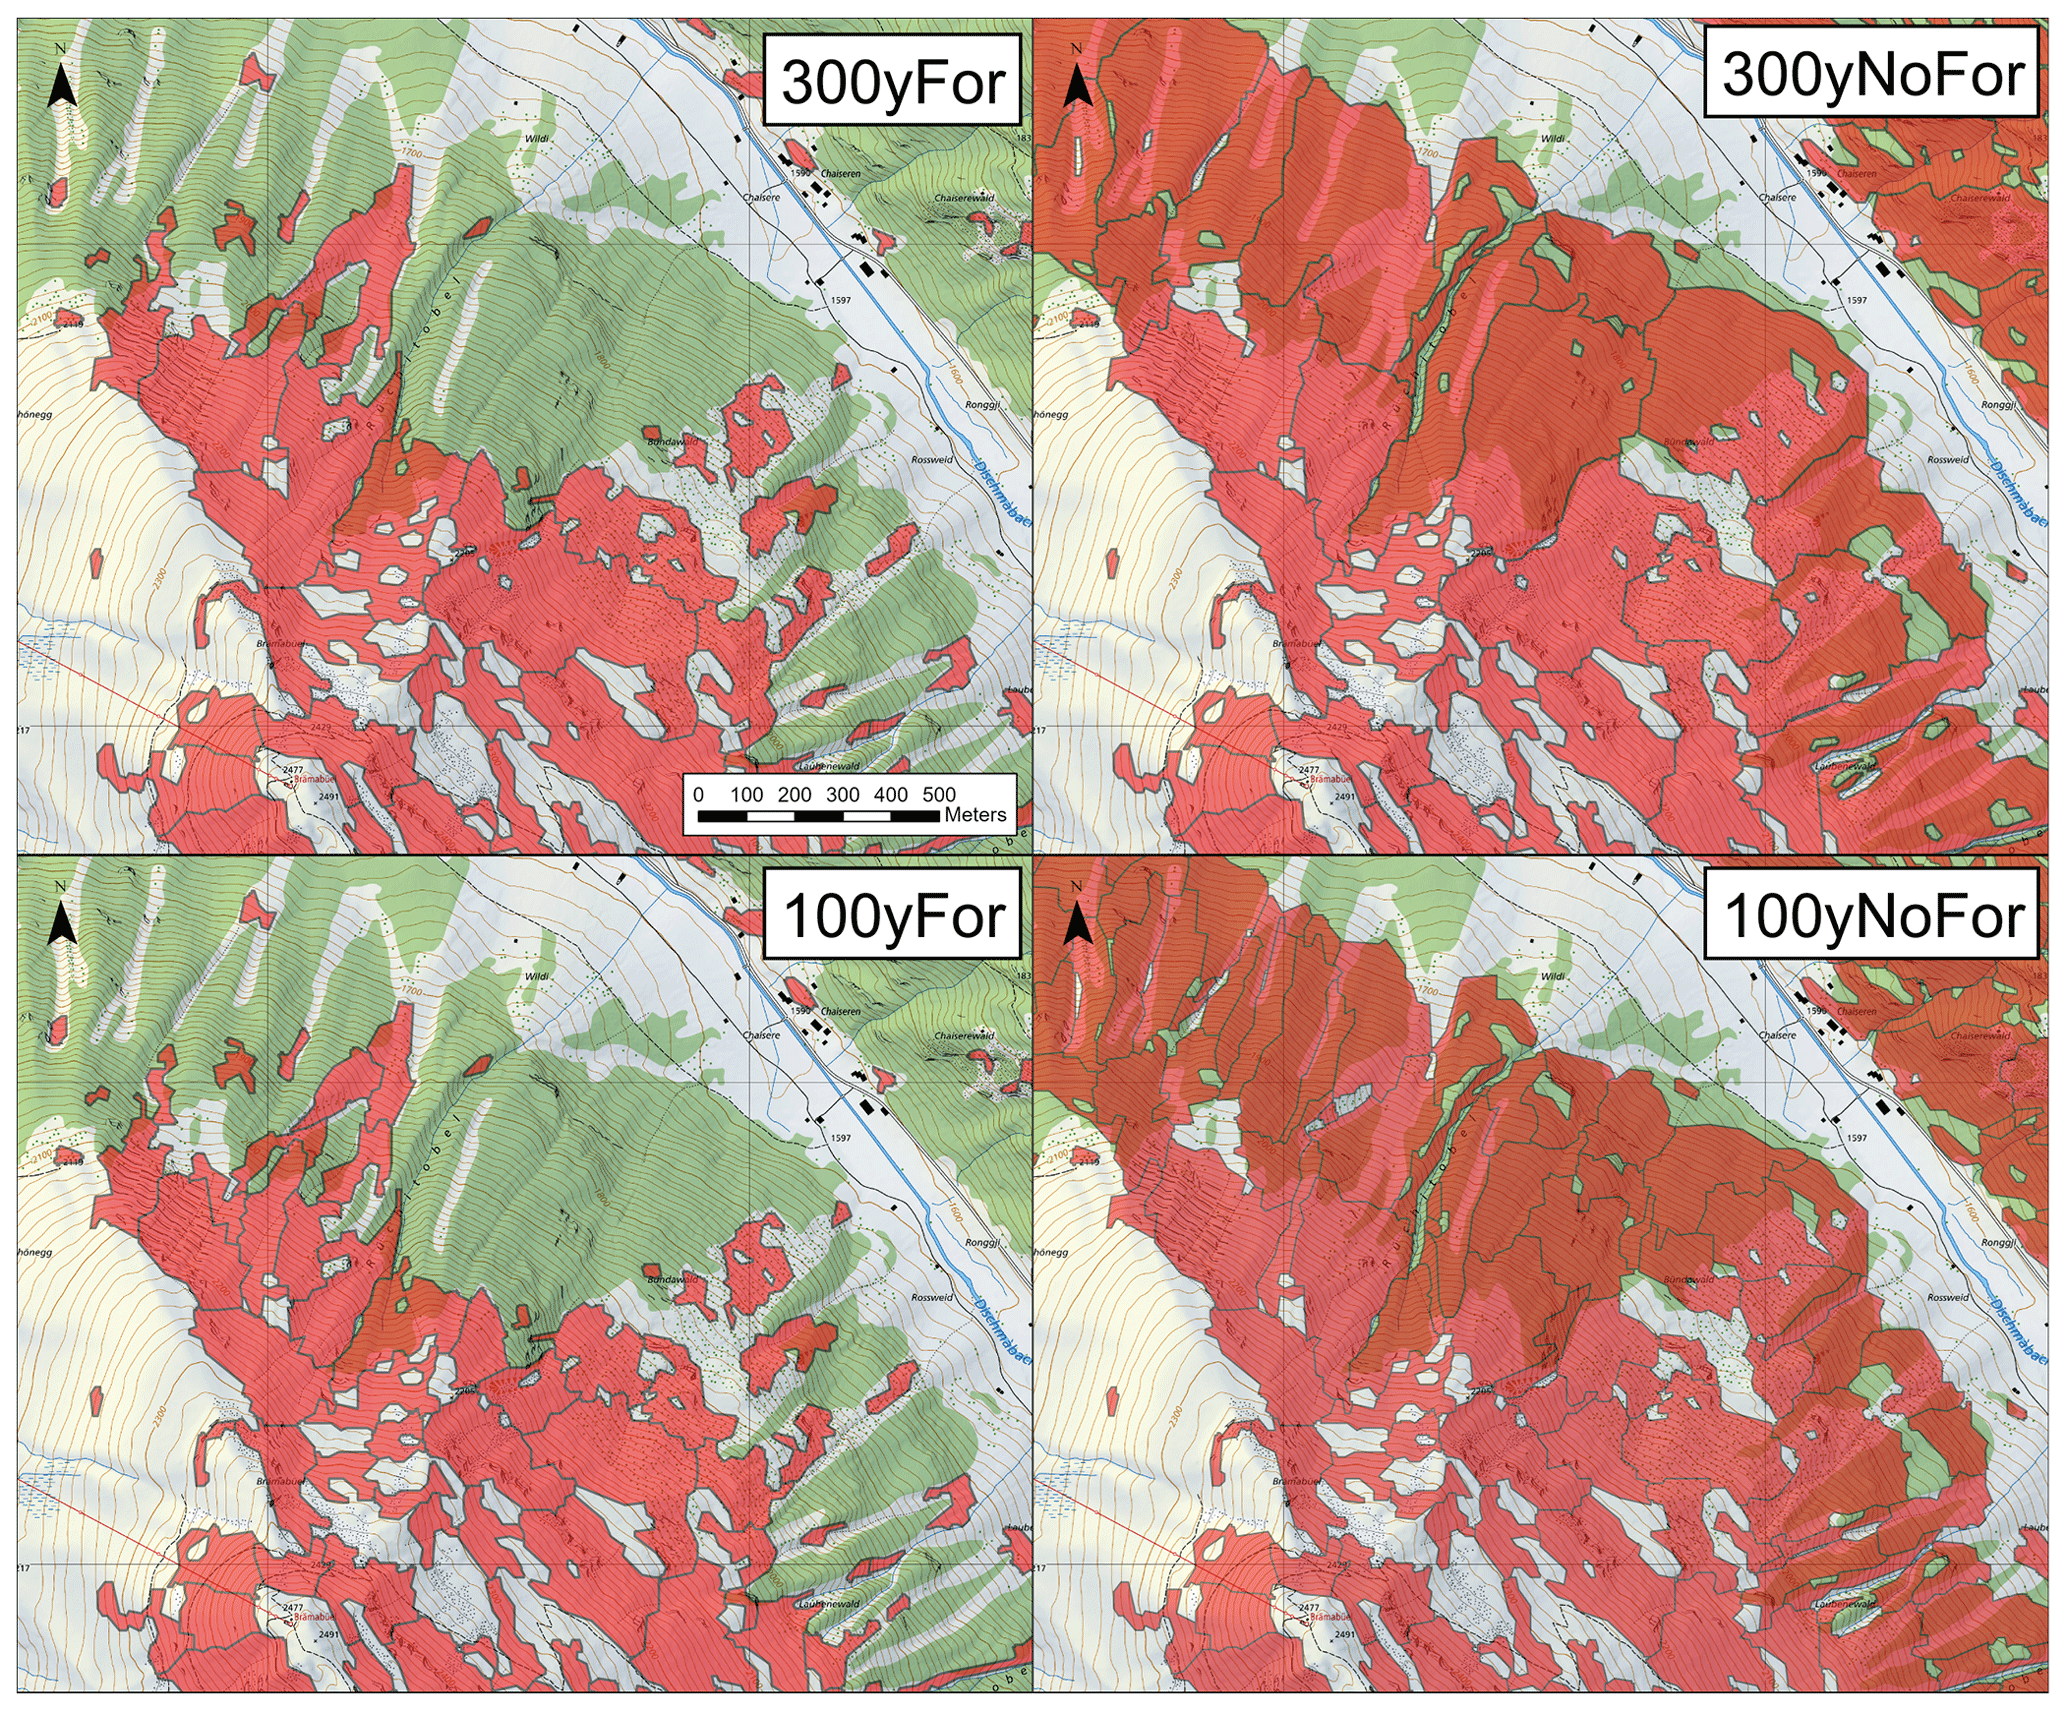
Figure 5PRA delineation at the Duchli slope at the beginning of the Dischma valley close to Davos for the two rare scenarios (300 and 100 years) with (For) and without (NoFor) taking the protective effects of the forest into account (map source: Swiss Federal Office of Topography).
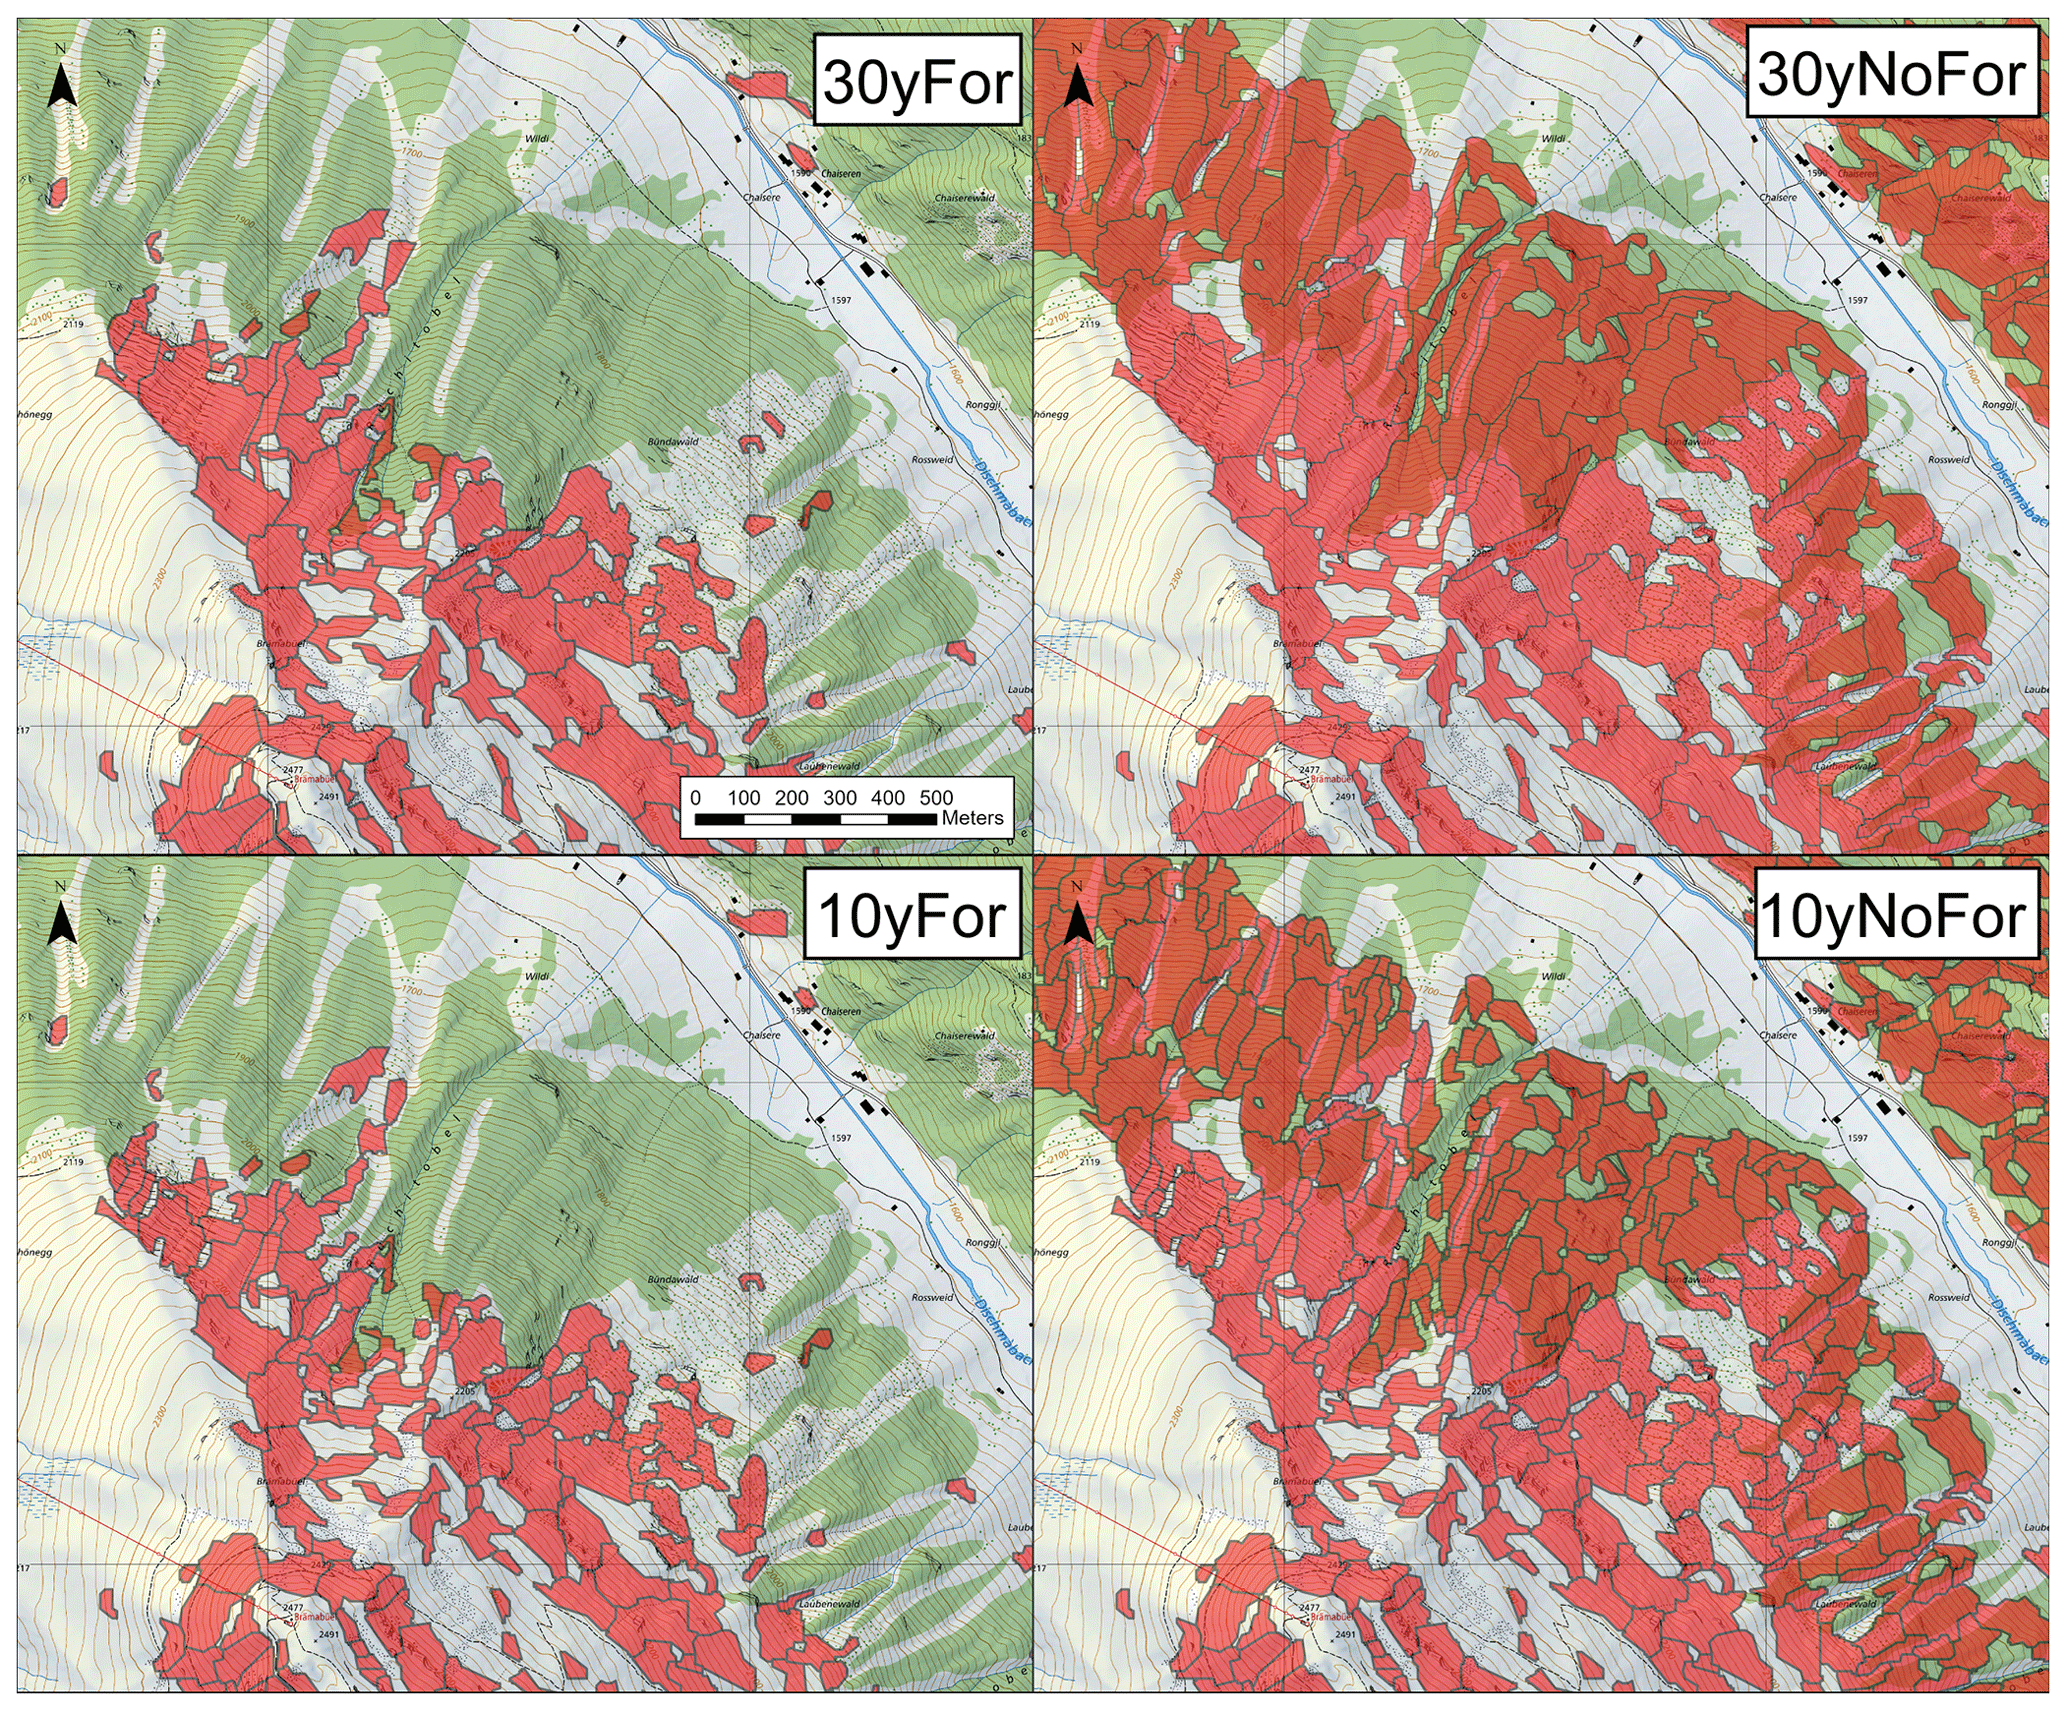
Figure 6PRA delineation at the Duchli slope at the beginning of the Dischma valley close to Davos for the two frequent scenarios (30 and 10 years) with (For) and without (NoFor) taking the protective effects of the forest into account (map source: Swiss Federal Office of Topography).
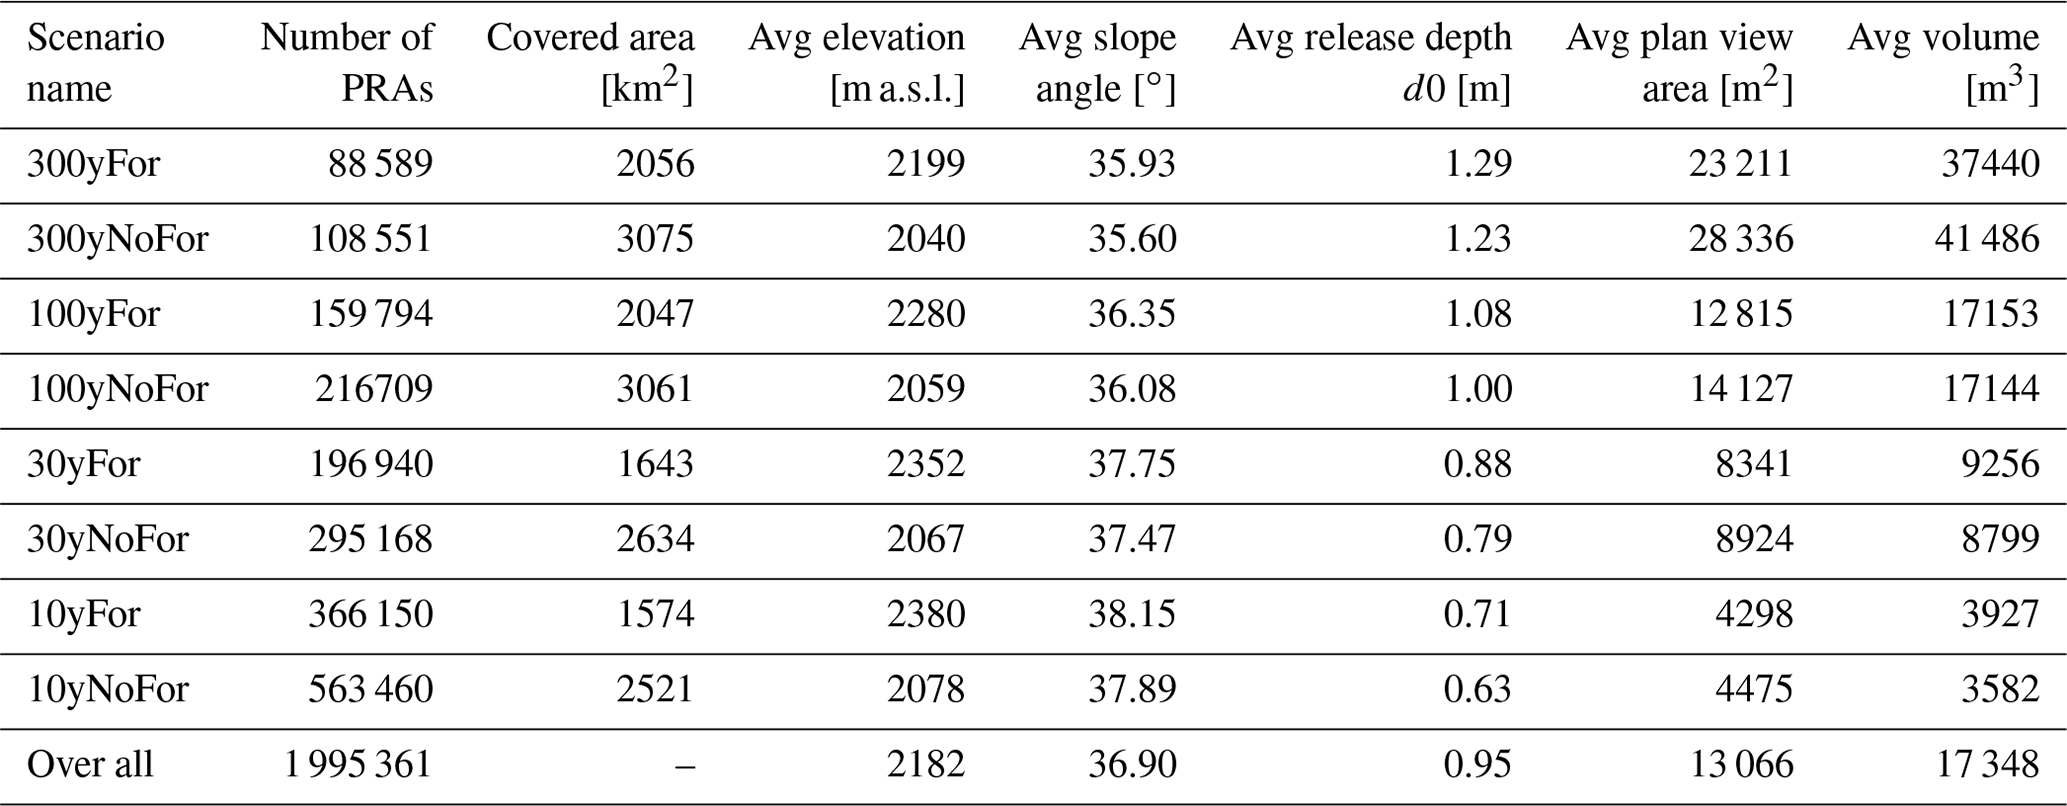
Table 1 lists the statistical overview of the resulting PRAs for the individual scenarios. The combination of reduced area with reduced release depth (d0; Sect. 3.4) results in reduced release volume of the PRAs for the more frequent scenarios. The forested areas (forest boundaries at ∼ 2100 m a.s.l. in the northern and ∼ 2300 m a.s.l. in the southern regions) cause a reduction in the average release elevation of ca. 150 m (300 years) to 300 m (10 years). By not taking the protective effects of the forest into account, 20 % (300 years) to up to 35 % (10 years) more PRAs are delineated in forested terrain. Because these regions are at lower elevation below the treeline, the average d0 and slope angle are higher for the scenarios taking the forest into account (For). The average d0 varies between 1.29 m (300yFor) and 0.71 m (10yFor).
Table 1Statistical overview of the PRAs for the eight different scenarios over the entire canton of Grisons.
4.3 Simulation results
To provide an overview of the simulation results for the entire canton of Grisons, Fig. 7 depicts the endangered areas for the most rare (300yFor) and the most frequent (10yFor) scenario. Because the canton of Grisons is situated entirely within the Alps, a large portion of the area is endangered by avalanches. Even in the most frequent scenario, a considerable part of the canton could be hit by avalanches with impact pressures of more than 30 kPa. The consequence is that a large part of the canton of Grisons, mostly at higher altitudes, would be classified as a red hazard zone. As only about 10 % of the area of the canton of Grisons is covered by these hazard maps, mostly within isolated areas where infrastructure is at risk, the spatially coherent indication maps presented in this paper are of high value. For 90 % of the area of the canton, no detailed information on avalanche hazard existed before.
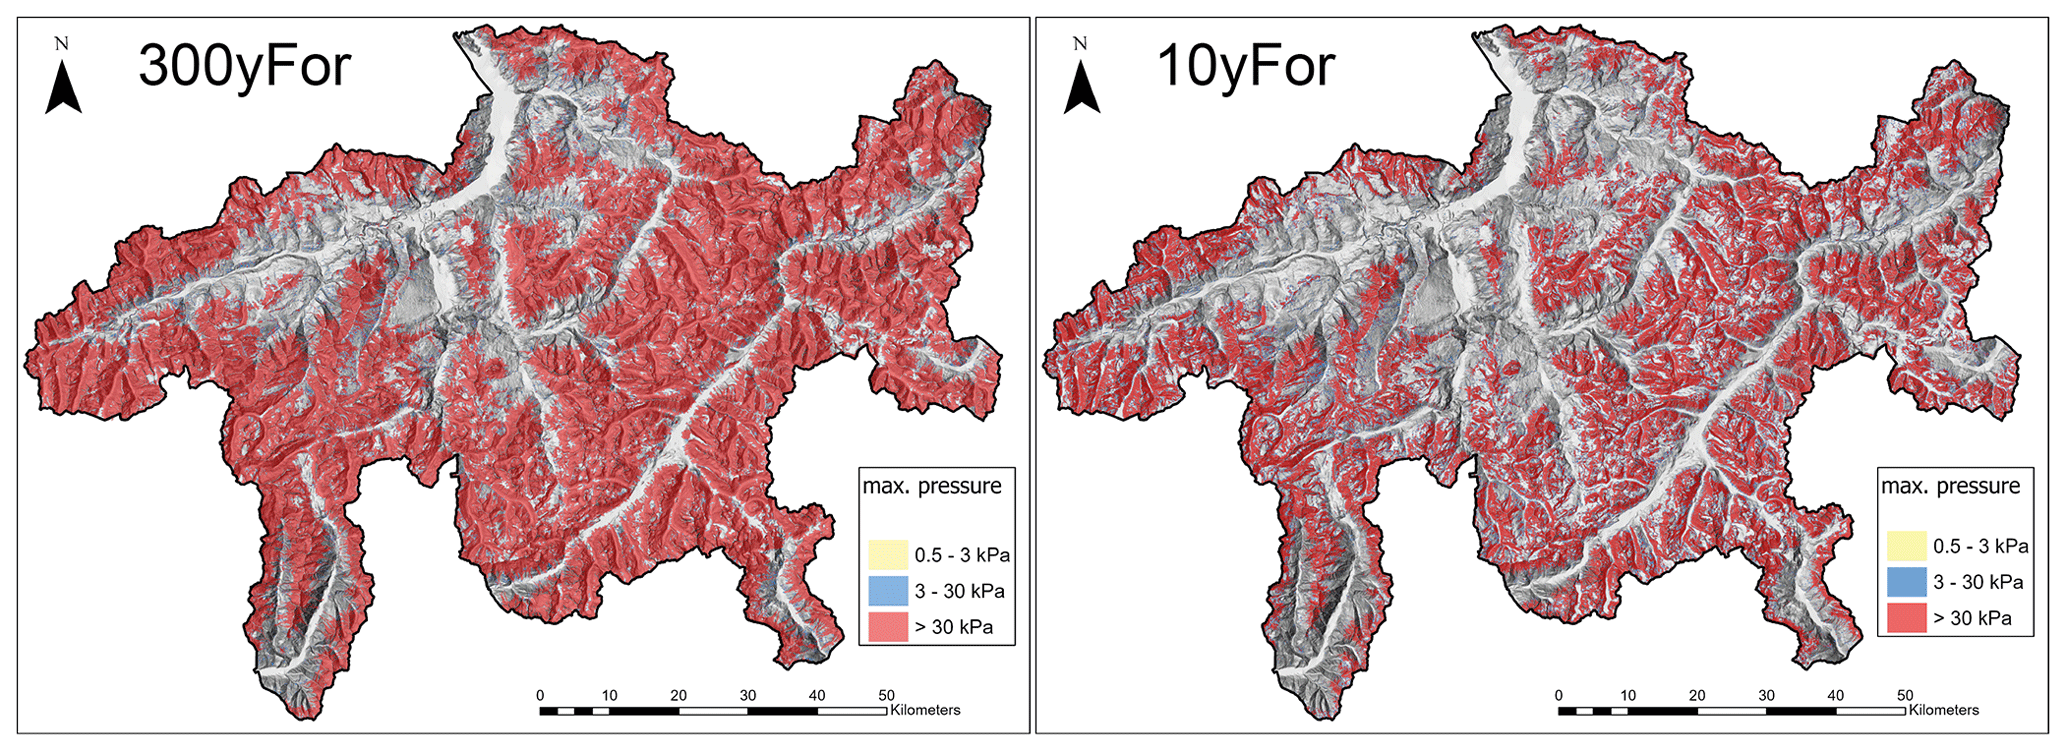
Figure 7Simulation result for the entire canton of Grisons for the rarest (300 years, left) and the most frequent (10 years, right) scenario, taking the protective effects of the forest into account (hillshade source: Swiss Federal Office of Topography).
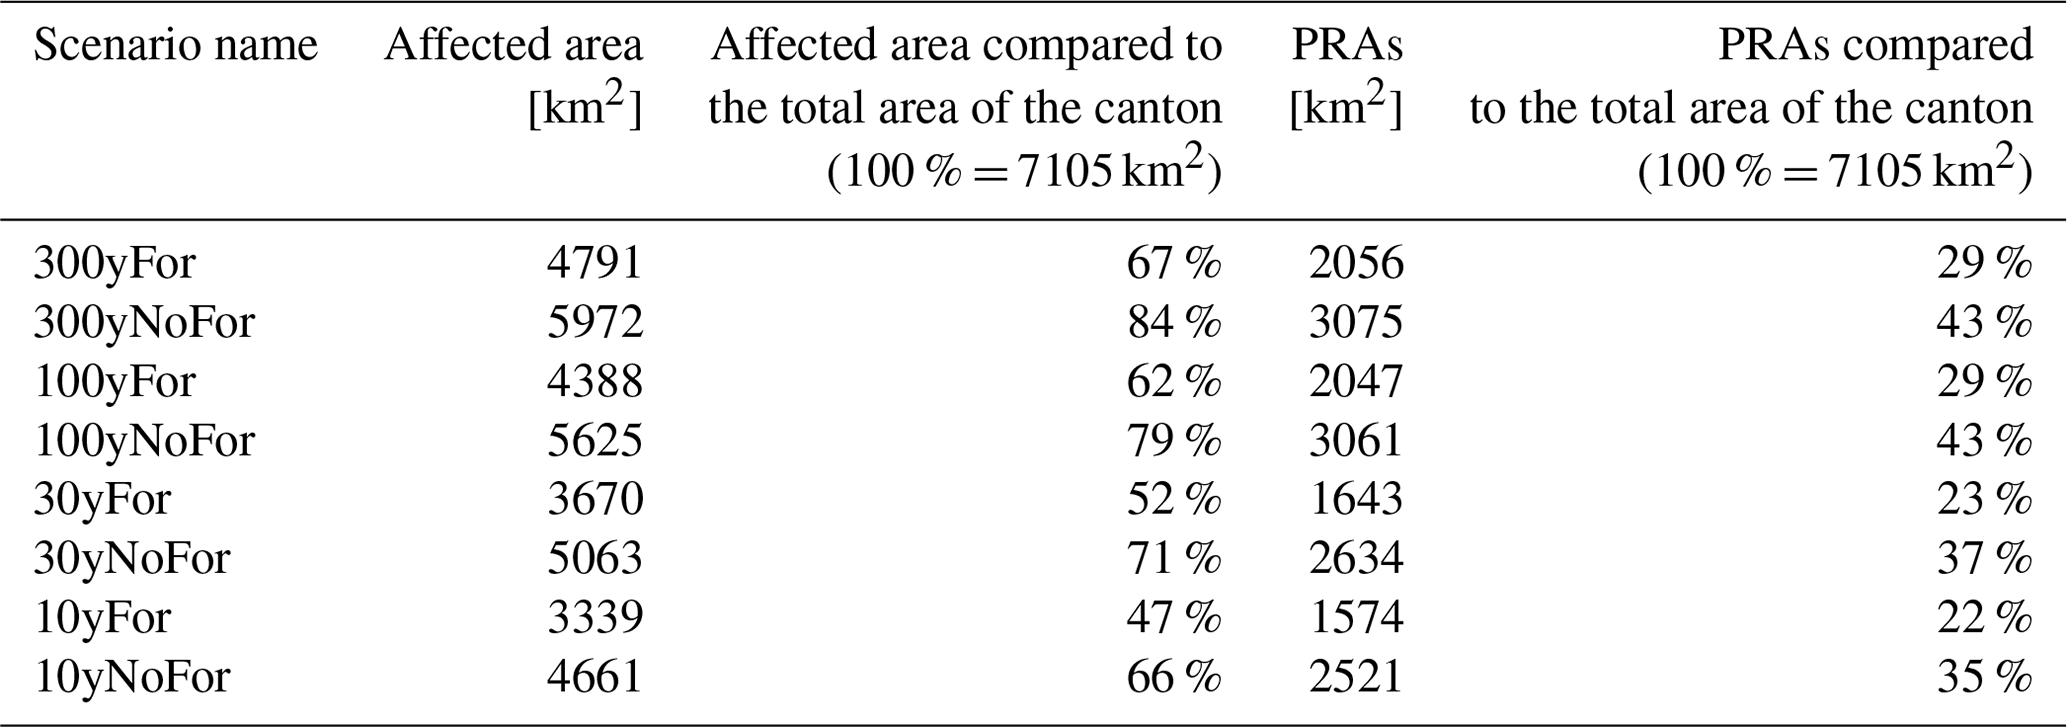
To set the affected area in relation to the total area of the canton, Table 2 gives a summary of the different scenarios. Without the protective effects of the forest, 5972 km2 or 84 % of the total area would be endangered during a very rare avalanche period (300yNoFor). The forest reduces this endangerment by 17 % down to 67 % (300yFor). The reduction in the endangered area increases to 19 % for the frequent scenarios (10 and 30 years). This is a lot taking into account that only 1852 km2 or 26 % of the cantonal area is covered by high timber forest, highlighting the high protective value of the forest. Even within the most frequent scenario (10yFor) and taking the protective effects of the forest into account, still 47 % of the area of the canton is endangered by avalanches.
Table 2Statistical overview of the simulation results for the eight different scenarios over the entire canton of Grisons.
To illustrate the level of detail contained in the simulation output, Figs. 8 and 9 show the simulated maximal impact pressure for the Duchli slopes in Davos for all scenarios. The corresponding release areas are depicted in Figs. 5 and 6. This very steep slope, where frequent avalanche activity is observed, illustrates the differences in impact pressure and runout distance between the scenarios. In the avalanche tracks, a pressure of 300 kPa is exceeded in many places in nearly all scenarios. The effect of the forest is not very obvious for the rare scenarios (Fig. 8) because the large PRAs are located high above the treeline (Fig. 5), and the forest is assumed to be destroyed by the high impact pressure of the resulting avalanches. For the frequent scenarios however (Fig. 9), the forest slows down and stops the smaller avalanches. Only avalanches in the forest-free tracks, where avalanches occur practically every winter, reach the valley bottom. The visualization of the maximum impact pressures allows for a detailed investigation of the endangered terrain.

Figure 8Maximum pressure of the simulated avalanches for the two rare scenarios for the subsection Duchli. The corresponding PRAs are depicted in Fig. 5 (map source: Swiss Federal Office of Topography).

Figure 9Maximum pressure of the simulation results for the two frequent scenarios for the subsection Duchli. The corresponding PRAs are depicted Fig. 6 (map source: Swiss Federal Office of Topography).
A meaningful validation of the calculated hazard indication maps is very challenging. Spatially coherent and reliable information on avalanche occurrence with a time span of decades to centuries is not available. To validate our product, we therefore use the best information available.
-
Hazard maps of the canton of Grisons (https://edit.geo.gr.ch/theme/Naturgefahrenkarte, last access: 24 May 2022). These legally binding hazard maps are produced by avalanche experts for individual avalanche tracks by taking different sources into account. The most important sources are avalanche cadastres, terrain analysis, climatic situation, field investigations, numerical simulations and expert experience (Rudolf-Miklau et al., 2014).
-
The event register of the canton of Grisons. In Switzerland, the cantons are obliged to keep an event register. Some of the documented events date back to the 17th century.
-
SLF avalanche cadastre. This has a focus on the regions Davos and Zuoz in Grisons (Schweizer et al., 2020; Hafner et al., 2021).
-
Avalanches mapped based on optical and radar satellite imagery for two large avalanche periods in January 2018 and January 2019 (Bühler et al., 2019; Bründl et al., 2019; Zweifel et al., 2019; Hafner et al., 2021; Bühler et al., 2021).
-
Qualitative comparison with hazard assessments of avalanche experts from SLF, the canton of Grisons and Liechtenstein.
However, the hazard maps are only available within settled areas where the community has initiated a hazard assessment (about 10 % of the cantonal area). The coverage and quality of the avalanche cadastre is dependent on the individual observers, is incomplete and contains mapping errors (Bühler et al., 2018a). The satellite mapping only covers two recent, large avalanche periods (Hafner et al., 2021; Bühler et al., 2021). Despite these limitations these datasets were the best available to validate our product.
5.1 Comparison to official hazard maps
The most reliable validation is the direct comparison of the 300yFor scenario with the existing hazard maps within settled areas (Margreth, 2019). Not all hazard maps are generated yet with state-of-the-art methodology. Furthermore, the hazard maps partially take mitigation measures into account. Only dense closed forests covering the entire release area provide very good avalanche protection. When drawing up a hazard map, it is assumed that no avalanches will start there. If there are openings in the forest or if the forest is scattered, avalanche release can no longer be ruled out, and the protective effect is reduced. If avalanches finally release above a forest, it can be destroyed. Such forest stands or forest stands in the avalanche track are not taken into account in hazard maps. Together with avalanche experts from the canton and from SLF, the simulation results were compared to existing hazard maps at different locations within the canton. The region of Davos is selected to illustrate such a comparison (Fig. 10).
Davos (1560 m a.s.l.) is the second-largest city of the canton (∼ 12 000 inhabitants) after the capital Chur and has a well-documented avalanche history reaching back to the settlement of the Walser tribe in the 13th century. By accommodating the WSL Institute for Snow and Avalanche Research SLF, founded in 1936, this region has one of the most reliable avalanche cadastres, and a rigorous mapping of recent avalanche events is maintained (Hafner et al., 2021). The hazard maps of the area are an important tool for hazard management and have been revised several times since the first version.
The difference in the spatial coverage between the hazard maps and the presented simulations is well visible in Fig. 10. The runout of the Salezer avalanche (1 in Fig. 10) agrees well with the simulation results. However, in the hazard map the blue and yellow zones reach about 200 m further to the east than in the simulation. This is because the runout of the powder snow avalanche is much longer compared to the runout of large, dry and dense avalanches. This effect is not simulated in the presented approach (see Sect. 3.6). The large avalanche was artificially triggered in January 2019, and the estimated return period is about 10 years. The large powder avalanche developed a runout as predicted for the 100-year return period in the indication map. The runout of the Lusi avalanche (2 in Fig. 10) agrees very well with the simulation and observations. The Schiawang avalanche (3 in Fig. 10) shows major differences. While the hazard zones end in the area of the topmost buildings, the simulated hazard zones run further down, impacting many buildings. This is because there are snow-supporting structures in the release zone of this avalanche. They are considered for the hazard map but not for the simulations (see Sect. 3.6). However, if the supporting structures were no longer functional, the situation could become as depicted in the simulation. In February 1817, long before the first protection measures in the release area of the Schiawang avalanche were built, the observed runout distance was even longer than in the simulated hazard zones. The Arelen avalanche (4 in Fig. 10) has released several times in the last decades (Christen et al., 2010a) and reached very long runouts, as indicated by the hazard map. However, a few years ago a new protection dam against debris flows was erected in the channel. Finally, the Dorfbach avalanche (5 in Fig. 10) is rather well modeled. The Dorfbach avalanche was very large in 1968 and 1609. The extent of these avalanches is covered by the official hazard map. The simulated hazard zones are somewhat longer. A reason might be that the braking effect of existing buildings is not considered in the simulations. The overall impression of the avalanche experts examining the results is that taking the assumptions and limitations described in Sect. 3.6 into account, the simulation results agree rather well with the official hazard maps.
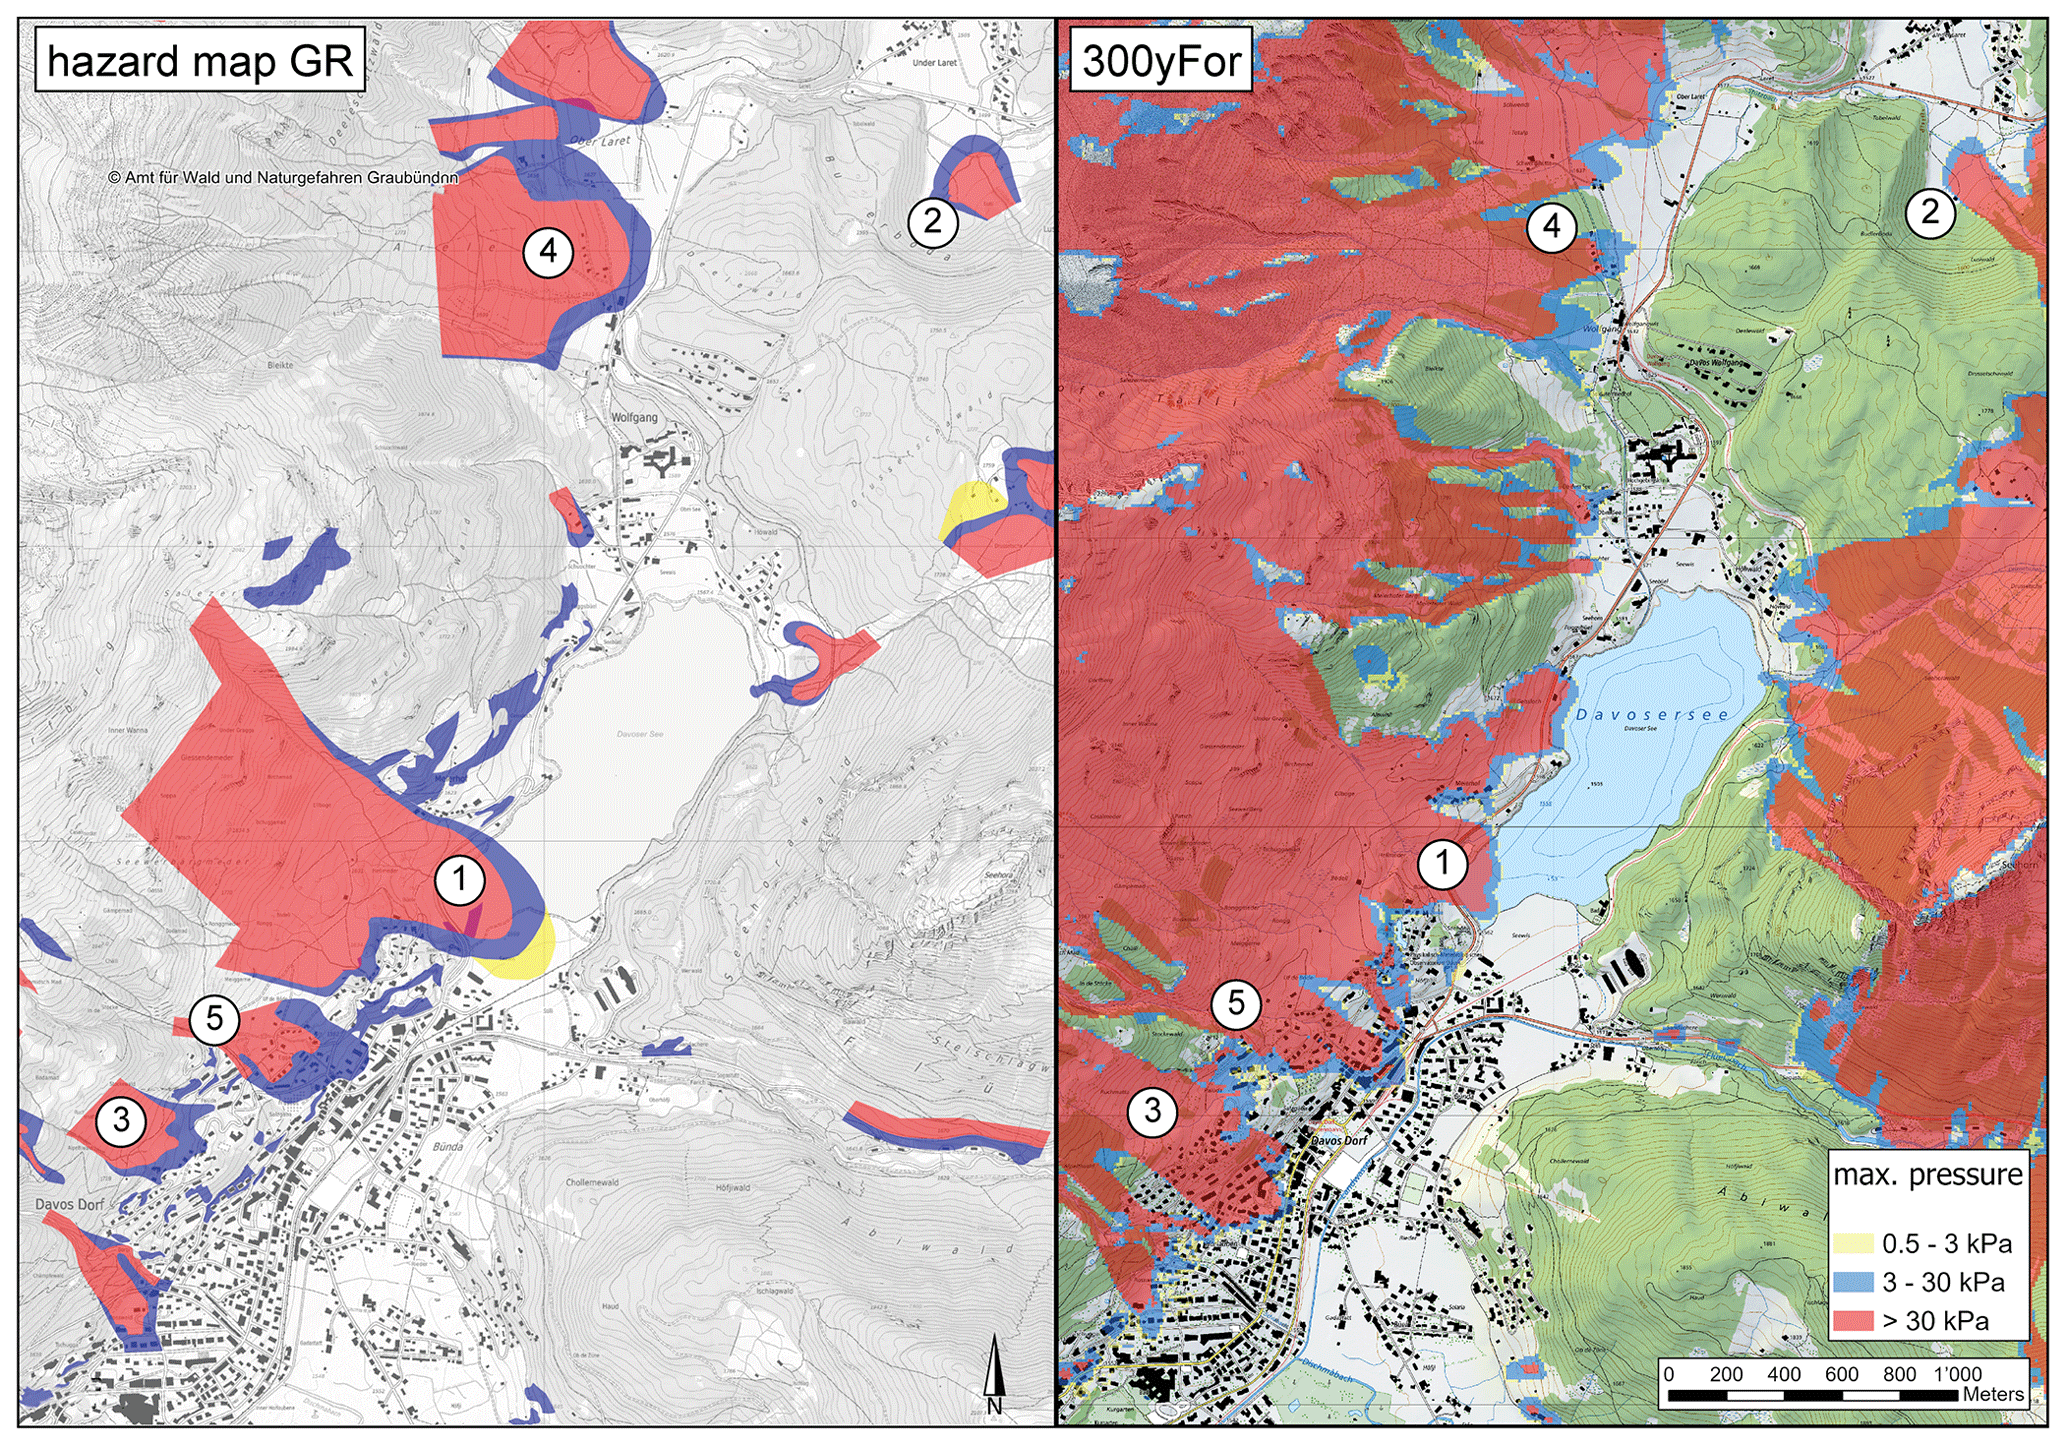
Figure 10Comparison of the official hazard map (https://edit.geo.gr.ch/theme/Naturgefahrenkarte, last access: 23 May 2022; left) with the simulation results of the scenario 300yFor (right). The numbers indicate the location of selected avalanche tracks discussed in this section (map source: Swiss Federal Office of Topography).
5.2 Comparison to the SLF avalanche cadastre and recent events mapped by satellite
During January 2018 and again in January 2019, Switzerland experienced extreme snowfall events (Bründl et al., 2019; Zweifel et al., 2019). For the first time since 1999 the avalanche warning reached level five, the highest level of the danger scale. These extreme storm cycles resulted in numerous very large wet (2018) and dry (2019) snow avalanches with partly long runouts. To accurately map these avalanches, optical and radar satellite data were applied to cover roughly 12 000 km2 of the Swiss Alps and large parts of the canton of Grisons (Bühler et al., 2019; Leinss et al., 2020; Hafner et al., 2021, 2022). In total approximately 25 000 individual avalanche outlines were mapped using satellite data, 6737 of them within the canton of Grisons (Bühler et al., 2021). The main uncertainties occur in areas which were in cast shadow in the optical imagery (Hafner et al., 2021). Additionally, the SLF and its observer network map avalanches for the SLF avalanche database (Schweizer et al., 2020). This dataset contains mapping errors mainly due to inaccurate or even false localization of the avalanche events in the topographic maps by the persons mapping the avalanche events. Even though all three of these datasets are affected by specific mapping problems and are not complete, they still allow for a quantitative validation of the area affected by avalanches. By comparing how much area is affected within the reference datasets (SLF database and satellite mapping) but not in the 300yFor simulation results (Table 3), it can be assessed how much endangered area is not captured by the simulation results. Because it cannot be stated that areas where no avalanche is captured in the SLF database or where no avalanche has occurred in January 2018 and 2019 are safe from avalanches, the area that is falsely affected in the simulation result cannot be assessed with these datasets. Comparing the simulations without taking the protective effects of the forest into account would not make sense as the area would be massively overestimated. For the scenario 300yFor, only 1.4 % of the area is not captured as endangered by our simulations (Table 3). As the reference datasets contain mapping errors, a part of this area could be caused by these mapping errors and not by an insufficient performance of the simulations. The avalanches mapped by satellite and present in the existing cadastre are, in the vast majority of the cases, the outlines of the deposited debris. Therefore, this corresponds well with our simulations. There might be some isolated cases where the areas impacted by powder clouds were also mapped, but we do not expect this to have a noteworthy influence on the statistics.
Table 3Avalanche-affected area in the reference datasets (SLF database and satellite mapping) within the canton of Grisons which is not affected in the simulation results in comparison to the total affected area (%). An example for visualization of a subset of regions is given in Fig. 11.
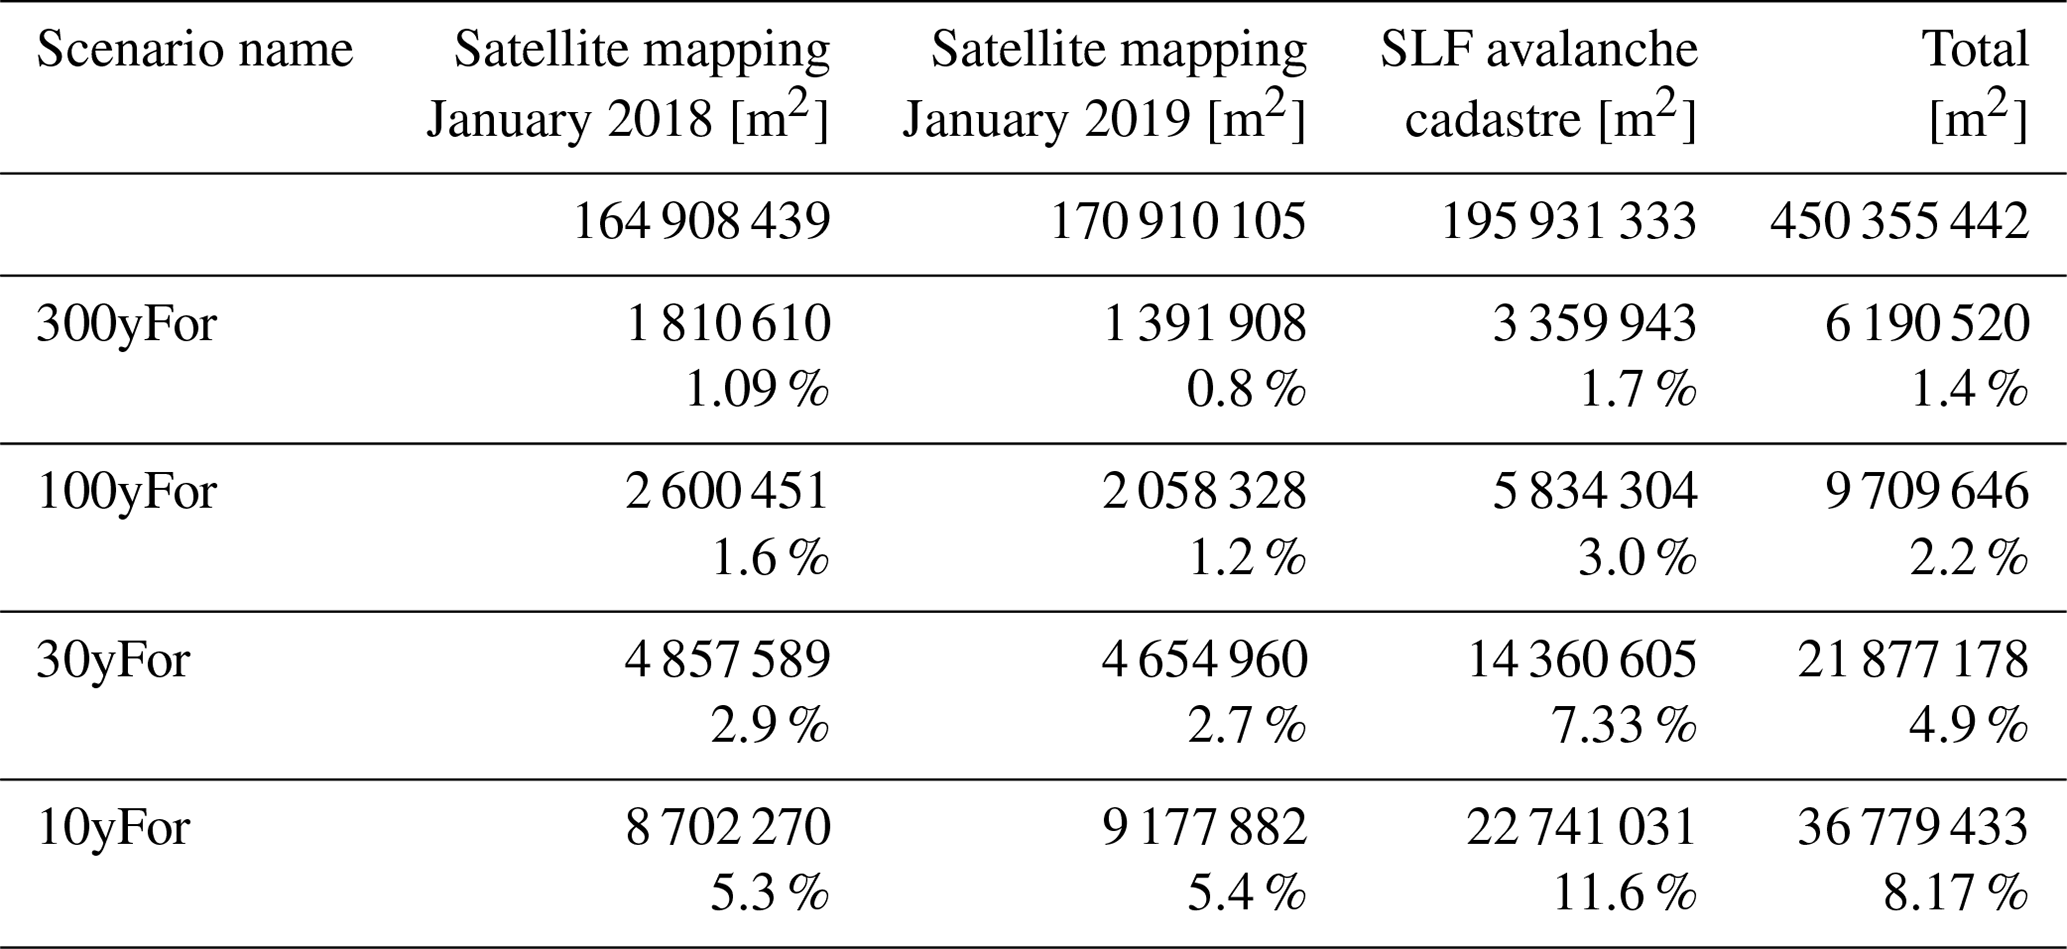
To visualize the applied reference datasets and the comparison with the 300yFor scenario, Fig. 11 shows a subset of the comparison south of Davos. The avalanche events recorded in the SLF database that released in the forest (southeastern area in Fig. 11) are not all captured in the simulations. This could be caused by changes in the forest structure during the past decades. As the SLF database contains avalanche events back to the year 1888 with continuous mapping since 1951, the forest and its protective effects may have changed significantly since back then. Figure 11 demonstrated that a large part of the area has no observation of past avalanche events but still is endangered according to the simulations. This is even more distinct in regions which are outside of the focus area of the SLF database (Schaer, 1995).
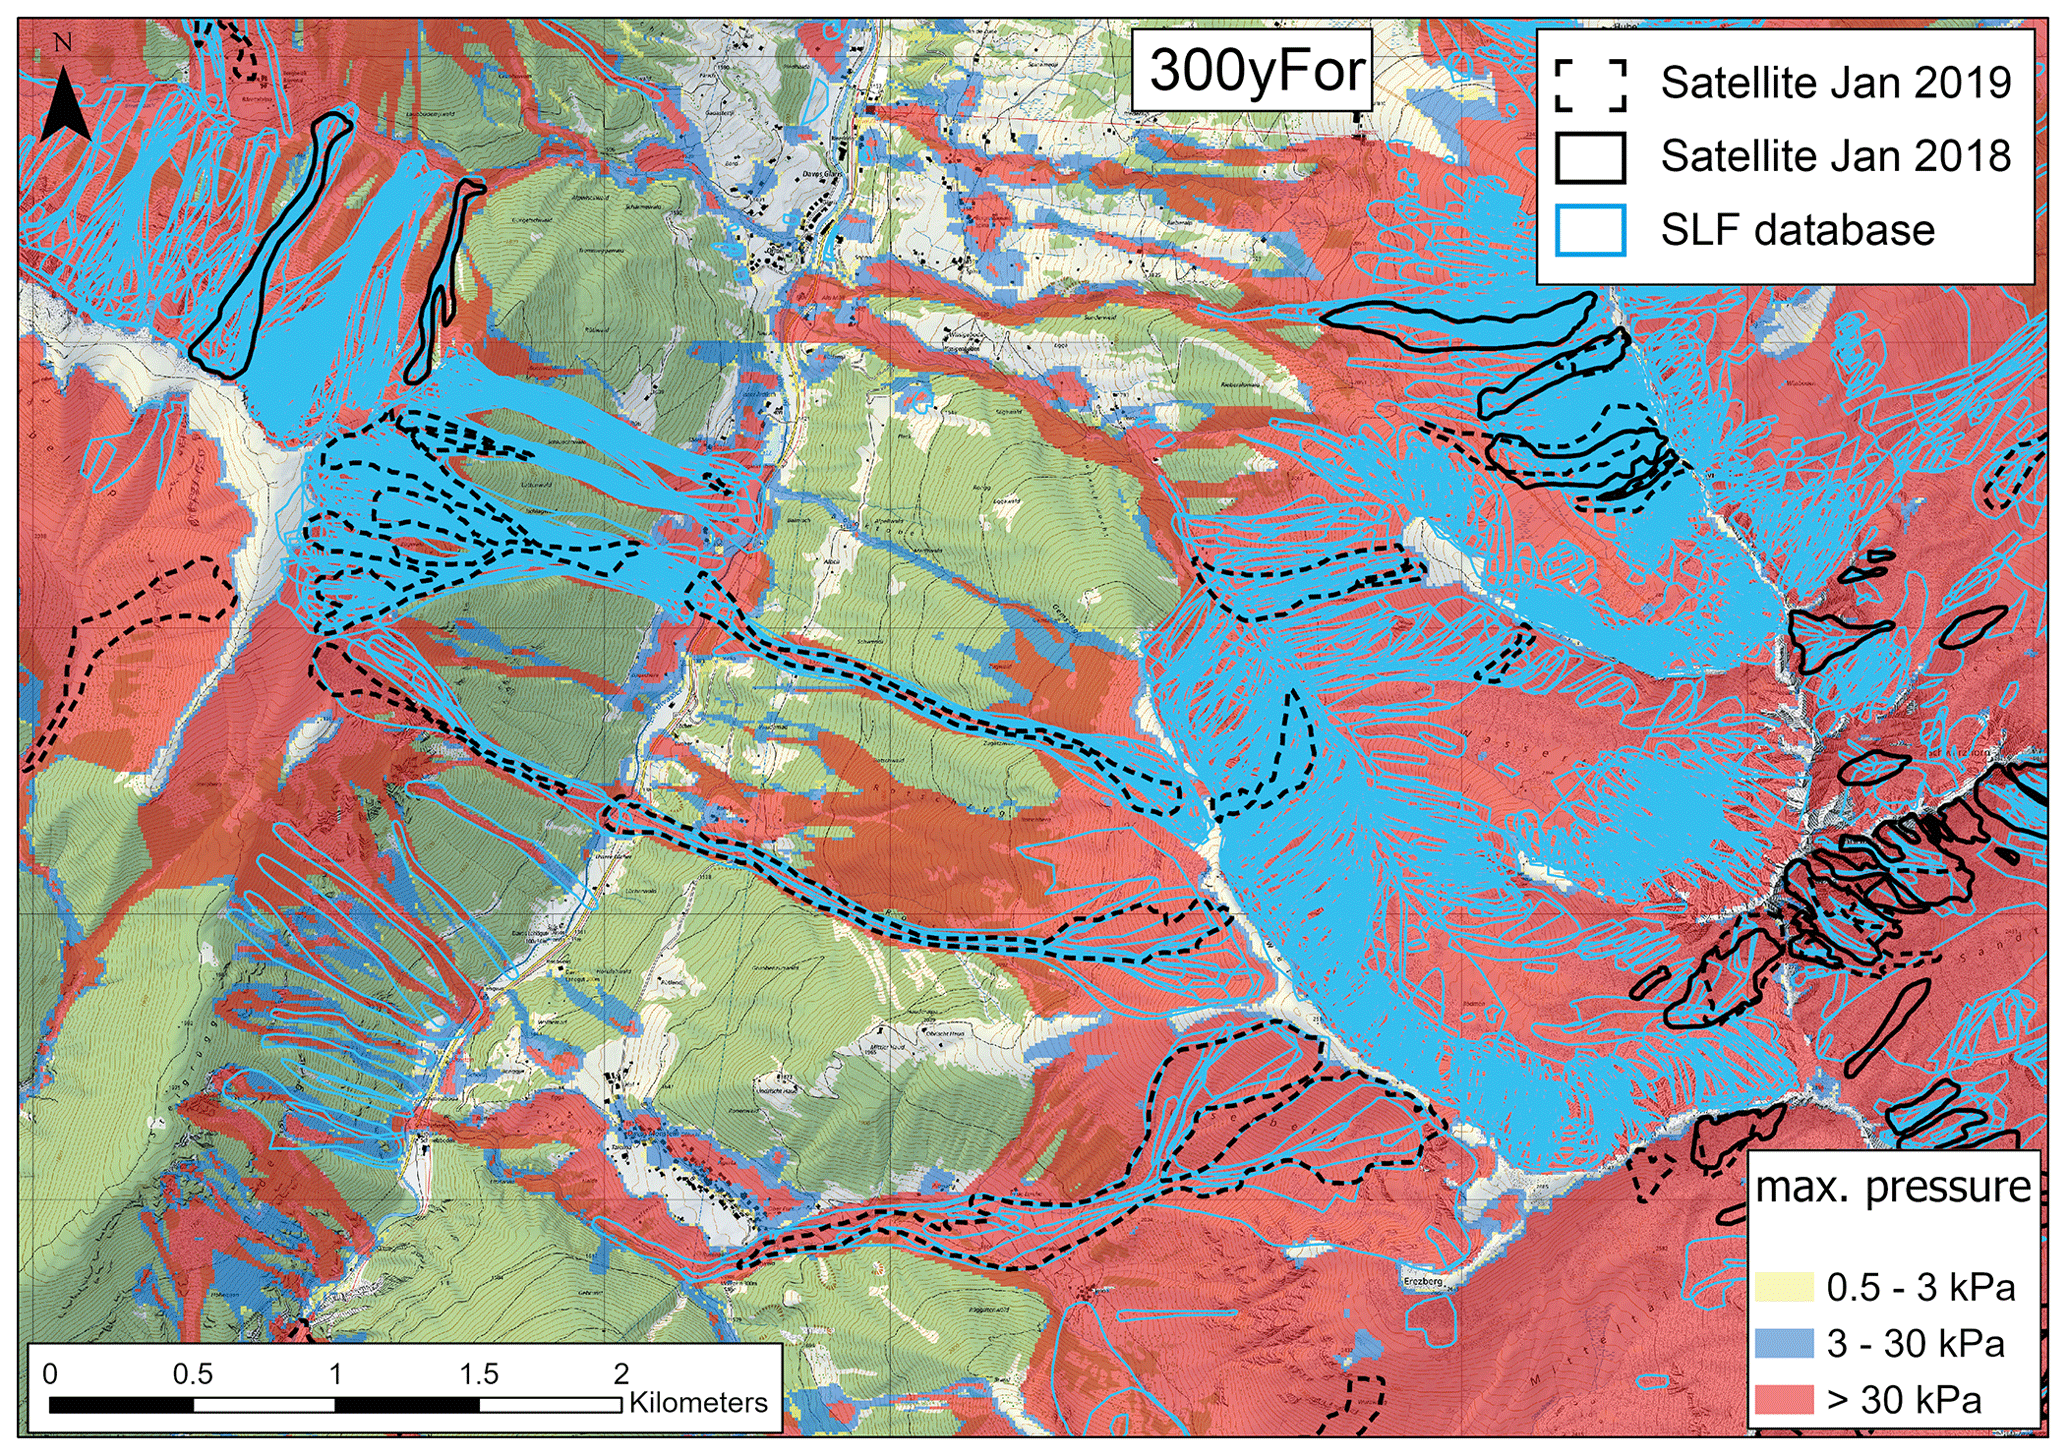
Figure 11Scenario 300yFor overlay of the mapped avalanches from the different data sources (satellite mapping and SLF database) for the region south of Davos. Only very small areas of even the rarest events are not captured by the hazard indication map, for example in forested slopes in the southeast, where the forest structure might have changed since the recording of the avalanche event (map source: Swiss Federal Office of Topography).
6.1 Strengths and weaknesses
The results of the large-scale simulations capture the area endangered by rare avalanches (100–300-year return period) well. By providing spatially coherent information, this product sets a new level of detail and accuracy for hazard information outside the zones captured by the official hazard maps (90 % of the area in the canton of Grisons). This enables new applications for practitioners (Sect. 6.2). By simulating four different return period scenarios (10, 30, 100 and 300 years) with and without taking the protective effects of the forest into account, detailed hazard analysis for different problem definitions can be performed. Furthermore, the presented approach can be applied to regions worldwide where a high-spatial-resolution DTM, information on the protective effects of present forest and information on extreme snow depth increase is available. We already successfully applied this approach to the regions of Trentino, Livigno, Aosta and Langtaufers in Italy (Monti et al., 2018; Maggioni et al., 2018; Bühler et al., 2018b) as well as regions in Canada (Sykes et al., 2021), Alaska, India, Afghanistan and New Zealand. An adapted version of this approach was applied to simulate typical skier avalanches over all of Switzerland (Harvey et al., 2018). Currently we are simulating the entire canton of Valais (5224 km2), the second-largest Alpine canton of Switzerland after Grisons. These applications demonstrate the big potential of the presented approach for automated hazard indication mapping. As the processing chain is automated, it enables reproducible hazard indication mapping applicable in mountain regions around the world where the required input data are available.
However, as the presented approach is fully automated and performed by computers, assumptions have to be made (Sect. 3.6). These assumptions and further restrictions of the presented approach lead to important limitations that have to be considered when interpreting the results. First of all, not the entire area that is not affected by the simulations (even in the very rare scenario 300yFor) is completely safe. The runout of very extreme avalanches, releasing in large bowls as a whole and where the large snow volumes confluence in a gully, can be underestimated. On the other hand, the runout of very small release areas can be overestimated. The impact of powder avalanches as well as the effects of protection buildings and the occurrence of several avalanche events within the same avalanche track is neglected. These limitations on runout have been detected by the involved avalanche experts of the canton and SLF for isolated examples. The overall assessment of the simulated runout revealed a very good agreement with the expert assessments (Sect. 5.1), and only very few cases were observed where the avalanche runout was underestimated (Sect. 5.2). The automated delineation of the avalanche PRAs sometimes produces polygons that would be delineated differently by the experts. Considering these limitations, the simulated runouts from these PRAs agree again mostly with the assessment of the experts.
Secondly the protective effects of the forest are dynamic and have a considerable influence on avalanche release in the Alps (Bebi et al., 2001, 2021; Teich et al., 2012). The simulations can only consider the state of the forest at a specific point in time and are not yet able to incorporate forest changes. Together with the neglection of present mitigation measures, this leads to the main deviations between the simulations and the validation data. For the interpretation of the results, potential future changes in the protective effects of the forest have to be considered. The presented tool enables the assessment of future forest conditions of avalanche hazard.
6.2 Applications in practice
As 90 % of the area within the canton, potentially endangered by snow avalanches, is not covered by official hazard maps, the hazard indication maps produced in this study are the basis for assessing hazard within these uncovered regions. For example, this is important if mountain huts or cabins are planned from scratch or if extensions are requested. Also, if expansions of ski resorts or further alpine infrastructure are planned, the simulations are a first point of reference. The produced indication maps are applied as reference scenarios for the first assessment of potential hazard impacts. They enable the generation of risk indication maps as performed already for the Rhaetian Railway (RhB) within selected regions.
By comparing the simulations to the existing hazard maps, potential shortcomings, wrong or changed assumptions, or changes in the boundary conditions of the hazard maps (e.g., forest and terrain changes) can be identified. Older hazard maps can be assessed and verified. However, the consideration of mitigation measures causes a large part of the deviations between hazard maps and the presented simulations (Sect. 3.6); this has to be considered for this comparison. Nevertheless, if areas with high damage potential show considerable avalanche impacts in our simulations but are not yet covered by official hazard maps, they can be identified and carefully checked with more detailed hazard assessments.
As all scenarios were calculated with and without taking the protective effects of the forest into account (Sect. 3.5), these scenarios can be applied to visualize, quantify and evaluate the protective effects of the forest. The delineation of protection forest is today based on the simulations performed in the project SilvaProtect-CH in 2004 (Gruber and Baltensweiler, 2004; Gruber and Bartelt, 2007; BAFU, 2013), applying a 25 m digital elevation model, a different PRA algorithm (Maggioni and Gruber, 2003), the avalanche dynamics model AVAL-2D (a precursor of the RAMMS model) and the forest information that was available at that time. Therefore, we expect major differences in the delineation of the protection forest. Because of the high economical and societal relevance of the protection forest functions in Grisons (Stritih et al., 2021), changes in the delineation of protection forest have very large impacts. Therefore, more time and discussions are needed to implement the new simulations for this application. The work to do so has already started. Taking the effect of climate change, which is more distinct in alpine regions, into account, the presented scenarios serve as a baseline to assess potential changes in the future.
Last but not least the produced spatially coherent hazard indication maps prove to be a valuable tool to communicate and discuss risk between different stakeholders, including the population of alpine communities and decision-making authorities. Concluding, the presented maps are now an important basis for the continuous spatial assessment of potential avalanche danger and allow for an efficient prioritization for in-depth hazard assessments such as hazard maps within the canton of Grisons.
In this study we present an automated approach to generate hazard indication maps for snow avalanches for the entire canton of Grisons, with an area of 7105 km2 the largest state of Switzerland. Four different scenarios (10, 30, 100 and 300 years) are calculated, covering the whole range from relatively frequent to very rare events. A remote-sensing-based identification of forests with protecting capacity against avalanche releases is developed. In total, approximately 2 million individual avalanche PRAs are delineated, loaded with estimated snow volumes per scenario and simulated with the state-of-the-art avalanche dynamic model RAMMS. The resulting spatially coherent hazard indication maps are then validated with existing, legally binding hazard maps, by expert assessment and by outlines of avalanches mapped with optical satellite data. The main deviations are caused by changes in the forest structure, the underestimation of very rare avalanche releases in large bowls and inaccurate mapping within the reference datasets. However, as the datasets applied for validation only cover scenarios with undefined return periods and not all of the most extreme avalanche events possible, the validity is limited (even though they are the best datasets available). We identify some room for improvement by the implementation of the protection measures in the avalanche release areas. But this is a very difficult task as the protective effect for specific areas and different scenarios has to be defined. This is already a very delicate issue in the hazard mapping process for individual tracks, and it is very hard to automate meaningfully.
The product is already applied in daily practice by the cantonal authorities for approximately 1 year and proves to be a valuable tool for
-
initial hazard assessments
-
the evaluation of infrastructure planning in areas not captured by the official hazard maps (90 % of the area in the canton of Grisons)
-
the evaluation and adaption of existing hazard maps
-
the delineation and rating of protection forests
-
the communication and discussion of avalanche risks with stakeholders.
The reproducible, spatially coherent maps enable efficient prioritizing of further investigations and also serve as a “second opinion” for assessments performed by avalanche experts or to perform risk assessments on a large scale (Ortner et al., 2022). Such maps can be calculated for any area where high-spatial-resolution DEMs, information on the snow climatology and the protective effects of the forest are available. Today, such information can be deducted from satellite data (Sykes et al., 2021). Any available avalanche observations in the region are very helpful to check the validity of the results.
In the future, when better input and validation datasets become available, for example summer DTMs from high-density lidar point clouds or even snow-covered digital surface models (DSMs) derived from airplanes (Bühler et al., 2015; Meyer and Skiles, 2019; Bührle et al., 2022) or satellites (Marti et al., 2016; Deschamps-Berger et al., 2020; Eberhard et al., 2021), the existing approach can be refined with updated and partly more detailed terrain, snow cover and forest information. To assess potential effects of climate change on avalanche hazard we plan to implement RAMMS::EXTENDED (Bartelt et al., 2012; Buser and Bartelt, 2015; Bartelt et al., 2015) into the processing chain, allowing for the consideration of snow erosion, the temperature of the snow layers, the generation of free water and therefore the transition of flow regimes. This may have large impacts on avalanche runout and allows for consideration of specific avalanche types such as powder or wet-snow avalanches. This would also enable the continuous spatial analysis of climate effects on the scale of states or even entire countries. The presented approach thus forms the basis for future developments in automated hazard indication mapping.
The PRAs and the simulation results presented in this study are available on EVIDAT (https://doi.org/10.16904/envidat.316; Bühler et al., 2022):
YB developed the processing chain and wrote the manuscript with contributions from all co-authors. PB and GS developed the classification for the protective effects of the forest. MC developed the RAMMS::LSHIM model. AS and AC contributed to the simulation part. CM defined the climatic regions and calculated the ΔHS3 to derive the d0. SM and LS (the leading avalanche experts from SLF), RK (the leading expert from the canton of Grisons), and SW (the leading expert from Liechtenstein) evaluated the results and proposed various improvements that were incorporated.
At least one of the (co-)authors is a member of the editorial board of Natural Hazards and Earth System Sciences. The peer-review process was guided by an independent editor, and the authors also have no other competing interests to declare.
Publisher’s note: Copernicus Publications remains neutral with regard to jurisdictional claims in published maps and institutional affiliations.
The authors want to thank the Department for Forest and Natural Hazards (AWN) of the canton for Grisons and the Office for Civil Protection (ABS) of Liechtenstein for the mandate to perform this work and for their valuable contributions. The authors are grateful for the various contributions from the SLF staff and internal discussions. This enabled us to digitize a lot of SLF know-how and experience. They thank Christian Ginzler, Lars Waser and Adrian Zaugg (all WSL) for their contributions to the forest layers. They also want to thank Fabiano Monti (from AlpSolut, Livigno), Margherita Maggioni (University of Torino) and Christoph Oberschmied (Civil Protection Alto Adige) for their cooperation with LSHIM in Italy.
This paper was edited by Paolo Tarolli and reviewed by Patrizia Köpfli and one anonymous referee.
Aydin, A. and Eker, R.: GIS-Based snow avalanche hazard mapping: Bayburt-AşağıDere catchment case, J. Environ. Biol., 38, 937-943, https://doi.org/10.22438/jeb/38/5(SI)/GM-10, 2017.
Aydin, A., Eker, R., and Odabasi, Y. B.: Generating Avalanche Hazard Indication Map and Determining Snow Avalanche Protection Forests in Caykara-Trabzon (NE-Turkey), Forestist, 72, 62–72, https://doi.org/10.5152/forestist.2021.20060, 2021.
BAFU: SilvaProtect-CH: Prozessmodellierung, Federal Office for the Environment FOEN, Bern, 74 pp., https://www.bafu.admin.ch/dam/bafu/de/dokumente/naturgefahren/fachinfo-daten/silvaprotect-ch_prozessmodellierung.pdf.download.pdf/silvaprotect-ch_prozessmodellierung.pdf (last access: 24 May 2022), 2013.
Barbolini, M. and Keylock, C. J.: A new method for avalanche hazard mapping using a combination of statistical and deterministic models, Nat. Hazards Earth Syst. Sci., 2, 239–245, https://doi.org/10.5194/nhess-2-239-2002, 2002.
Barbolini, M., Pagliardi, M., Ferro, F., and Corradeghini, P.: Avalanche hazard mapping over large undocumented areas, Nat. Hazards, 56, 451–464, https://doi.org/10.1007/s11069-009-9434-8, 2011.
Bartelt, P., Bühler, Y., Buser, O., Christen, M., and Meier, L.: Modeling mass-dependent flow regime transitions to predict the stopping and depositional behavior of snow avalanches, J. Geophys. Res., 117, F01015, https://doi.org/10.1029/2010JF001957, 2012.
Bartelt, P., Vera Valero, C., Feistl, T., Christen, M., Bühler, Y., and Buser, O.: Modelling cohesion in snow avalanche flow, J. Glaciol., 61, 837–850, https://doi.org/10.3189/2015JoG14J126, 2015.
Bebi, P., Kienast, F., and Schönenberger, W.: Assessing structures in mountain forests as a basis for investigating the forests' dynamics and protective function, Forest Ecol. Manag., 145, 3–14, https://doi.org/10.1016/S0378-1127(00)00570-3, 2001.
Bebi, P., Kulakowski, D., and Rixen, C.: Snow avalanche disturbances in forest ecosystems – State of research and implications for management, Forest Ecol. Manag., 257, 1883–1892, https://doi.org/10.1016/j.foreco.2009.01.050, 2009.
Bebi, P., Bast, A., Helzel, K., Schmucki, G., Brozova, N., and Bühler, Y.: Avalanche Protection Forest: From Process Knowledge to Interactive Maps, in: Protective forests as Ecosystem-based solution for Disaster Risk Reduction, edited by: Teich, M., Accastello, C., Perzl, F., and Kleemayr, K., IntechOpen, London, United Kingdom, https://doi.org/10.5772/intechopen.99514, 2021.
Brožová, N., Baggio, T., D'Agostino, V., Bühler, Y., and Bebi, P.: Multiscale analysis of surface roughness for the improvement of natural hazard modelling, Nat. Hazards Earth Syst. Sci., 21, 3539–3562, https://doi.org/10.5194/nhess-21-3539-2021, 2021.
Bründl, M. and Margreth, S.: Integrative Risk Management: The Example of Snow Avalanches, in: Snow and Ice-Related Hazards, Risks, and Disasters, edited by: Häberli, W., and Whiteman, C., Elsevier, 259–296, https://doi.org/10.1016/C2018-0-00970-6, 2021.
Bründl, M., Hafner, E., Bebi, P., Bühler, Y., Margreth, S., Marty, C., Schaer, M., Stoffel, L., Techel, F., Winkler, K., Zweifel, B., and Schweizer, J.: Ereignisanalyse Lawinensituation im Januar 2018, WSL Berichte, Vol. 76, Birmensdorf: Eidg. Forschungsanstalt für Wald, Schnee und Landschaft WSL, https://www.dora.lib4ri.ch/wsl/islandora/object/wsl:19842 (last access: 24 May 2022), 2019.
Bühler, Y., Kumar, S., Veitinger, J., Christen, M., Stoffel, A., and Snehmani: Automated identification of potential snow avalanche release areas based on digital elevation models, Nat. Hazards Earth Syst. Sci., 13, 1321–1335, https://doi.org/10.5194/nhess-13-1321-2013, 2013.
Bühler, Y., Marty, M., Egli, L., Veitinger, J., Jonas, T., Thee, P., and Ginzler, C.: Snow depth mapping in high-alpine catchments using digital photogrammetry, The Cryosphere, 9, 229–243, https://doi.org/10.5194/tc-9-229-2015, 2015.
Bühler, Y., von Rickenbach, D., Stoffel, A., Margreth, S., Stoffel, L., and Christen, M.: Automated snow avalanche release area delineation – validation of existing algorithms and proposition of a new object-based approach for large-scale hazard indication mapping, Nat. Hazards Earth Syst. Sci., 18, 3235–3251, https://doi.org/10.5194/nhess-18-3235-2018, 2018a.
Bühler, Y., von Rickenbach, D., Christen, M., Margreth, S., Stoffel, L., Stoffel, A., and Kühne, R.: Linking modelled potential release areas with avalanche dynamic simulations: An automated approach for efficient avalanche hazard indication mapping, International Snow Science Workshop ISSW, Innsbruck, Austria, https://arc.lib.montana.edu/snow-science/item/2653 (last access: 24 May 2022), 2018b.
Bühler, Y., Hafner, E. D., Zweifel, B., Zesiger, M., and Heisig, H.: Where are the avalanches? Rapid SPOT6 satellite data acquisition to map an extreme avalanche period over the Swiss Alps, The Cryosphere, 13, 3225–3238, https://doi.org/10.5194/tc-13-3225-2019, 2019.
Bühler, Y., Hafner, E., and Techel, F.: Mapping avalanches with satellites – the vision of more complete avalanche datasets, 2021 IEEE Int. Geosci. Remote Se., 11–16 July 2021, 232–235, https://doi.org/10.1109/IGARSS47720.2021.9553577, 2021.
Bühler, Y., Bebi, P., and Christen, M.: Large Scale Hazard Indication Simulations for avalanches, canton of Grisons, Envidat [data set], https://doi.org/10.16904/envidat.316, 2022.
Bührle, L. J., Marty, M., Eberhard, L. A., Stoffel, A., Hafner, E. D., and Bühler, Y.: Spatially continuous snow depth mapping by airplane photogrammetry for annual peak of winter from 2017 to 2021, The Cryosphere Discuss. [preprint], https://doi.org/10.5194/tc-2022-65, in review, 2022.
Buser, O. and Bartelt, P.: An energy-based method to calculate streamwise density variations in snow avalanches, J. Glaciol., 61, 563–575, https://doi.org/10.3189/2015JoG14J054, 2015.
Choubin, B., Borji, M., Mosavi, A., Sajedi-Hosseini, F., Singh, V. P., and Shamshirband, S.: Snow avalanche hazard prediction using machine learning methods, J. Hydrol., 577, 123929, https://doi.org/10.1016/j.jhydrol.2019.123929, 2019.
Christen, M., Bartelt, P., and Kowalski, J.: Back calculation of the In den Arelen avalanche with RAMMS: Interpretation of model results, Ann. Glaciol., 51, 161–168, 2010a.
Christen, M., Kowalski, J., and Bartelt, P.: RAMMS: Numerical simulation of dense snow avalanches in three-dimensional terrain, Cold Reg. Sci. Technol., 63, 1–14, https://doi.org/10.1016/j.coldregions.2010.04.005, 2010b.
Deschamps-Berger, C., Gascoin, S., Berthier, E., Deems, J., Gutmann, E., Dehecq, A., Shean, D., and Dumont, M.: Snow depth mapping from stereo satellite imagery in mountainous terrain: evaluation using airborne laser-scanning data, The Cryosphere, 14, 2925–2940, https://doi.org/10.5194/tc-14-2925-2020, 2020.
Eberhard, L. A., Sirguey, P., Miller, A., Marty, M., Schindler, K., Stoffel, A., and Bühler, Y.: Intercomparison of photogrammetric platforms for spatially continuous snow depth mapping, The Cryosphere, 15, 69–94, https://doi.org/10.5194/tc-15-69-2021, 2021.
Ghinoi, A. and Chung, C. J.: STARTER: A statistical GIS-based model for the prediction of snow avalanche susceptibility using terrain features – application to Alta Val Badia, Italian Dolomites, Geomorphology, 66, 305–325, 2005.
Gruber, U. and Baltensweiler, A.: SilvaProtect-CH, Eidg. Forschungsanstalt WSL, Birmensdorf, Schweiz, 40, 2004.
Gruber, U. and Bartelt, P.: Snow avalanche hazard modelling of large areas using shallow water numerical methods and GIS, Environ. Modell. Softw., 22, 1472–1481, https://doi.org/10.1016/j.envsoft.2007.01.001, 2007.
Hafner, E. D., Techel, F., Leinss, S., and Bühler, Y.: Mapping avalanches with satellites – evaluation of performance and completeness, The Cryosphere, 15, 983–1004, https://doi.org/10.5194/tc-15-983-2021, 2021.
Hafner, E. D., Barton, P., Daudt, R. C., Wegner, J. D., Schindler, K., and Bühler, Y.: Automated avalanche mapping from SPOT 6/7 satellite imagery: results, evaluation, potential and limitations, The Cryosphere Discuss. [preprint], https://doi.org/10.5194/tc-2022-80, in review, 2022.
Harvey, S., Schmudlach, G., Bühler, Y., Dürr, L., Stoffel, A., and Christen, C.: Avalanche terrain maps for backcountry skiing in switzerland, International Snow Science Workshop ISSW, Innsbruck, Austria, https://arc.lib.montana.edu/snow-science/item/2833 (last access: 24 May 2022), 2018.
Horton, P., Jaboyedoff, M., Rudaz, B., and Zimmermann, M.: Flow-R, a model for susceptibility mapping of debris flows and other gravitational hazards at a regional scale, Nat. Hazards Earth Syst. Sci., 13, 869–885, https://doi.org/10.5194/nhess-13-869-2013, 2013.
Issler, D.: Approaches to Including Climate and Forest Effects in Avalanche Hazard Indication Maps in Norway, https://www.nve.no/media/10589/20150457-10-tn.pdf (last access: 24 May 2022), 2020.
Larsen, H. T., Hendrikx, J., Slåtten, M. S., and Engeset, R. V.: Developing nationwide avalanche terrain maps for Norway, Nat. Hazards, 103, 2829–2847, https://doi.org/10.1007/s11069-020-04104-7, 2020.
Leinss, S., Wicki, R., Holenstein, S., Baffelli, S., and Bühler, Y.: Snow avalanche detection and mapping in multitemporal and multiorbital radar images from TerraSAR-X and Sentinel-1, Nat. Hazards Earth Syst. Sci., 20, 1783–1803, https://doi.org/10.5194/nhess-20-1783-2020, 2020.
Maggioni, M. and Gruber, U.: The influence of topographic parameters on avalanche release dimension and frequency, Cold Reg. Sci. Technol., 37, 407–419, https://doi.org/10.1016/S0165-232X(03)00080-6, 2003.
Maggioni, M., Bovet, E., Freppaz, M., Segor, V., and Bühler, Y.: Potential of automated avalanche dynamic simulations for large scale hazard indication mapping in italy: a first test appli-cation in aosta valley, International Snow Science Workshop ISSW, Innsbruck, Austria, https://arc.lib.montana.edu/snow-science/item/2637 (last access: 24 May 2022), 2018.
Margreth, S.: Lawinenverbau im Anbruchgebiet. Technische Richtlinie als Vollzugshilfe, Eidgenössisches Institut für Schnee- und Lawinenforschung SLF, Bern, 101, https://www.bafu.admin.ch/bafu/de/home/themen/naturgefahren/publikationen-studien/publikationen/lawinenverbau-im-anbruchgebiet.html (last access: 24 May 2022), 2007.
Margreth, S.: Lawinengefahrenkarten in der Schweiz [Avalanche hazard maps in Switzerland], Wildbach- und Lawinenverbau, 83, 80–92, 2019.
Margreth, S. and Romang, H.: Effectiveness of mitigation measures against natural hazards, Cold Reg. Sci. Technol., 64, 199–207, 2010.
Marti, R., Gascoin, S., Berthier, E., de Pinel, M., Houet, T., and Laffly, D.: Mapping snow depth in open alpine terrain from stereo satellite imagery, The Cryosphere, 10, 1361–1380, https://doi.org/10.5194/tc-10-1361-2016, 2016.
McClung, D. M. and Mears, A. I.: Extreme value prediction of snow avalanche runout, Cold Reg. Sci. Technol., 19, 163–175, 1991.
Meyer, J. and Skiles, S. M.: Assessing the Ability of Structure From Motion to Map High-Resolution Snow Surface Elevations in Complex Terrain: A Case Study From Senator Beck Basin, CO, Water Resour. Res., 55, 6596–6605, https://doi.org/10.1029/2018wr024518, 2019.
Monti, F., Alberti, R., Comin, P., Wolynski, A., and Bühler, Y.: Automated identification of forest with protective function against snow avalanches in the Trento Province (Italy), International Snow Science Workshop ISSW, Innsbruck, Austria, https://arc.lib.montana.edu/snow-science/item/2636 (last access: 24 May 2022), 2018.
Ortner, G., Bründl, M., Kropf, C. M., Röösli, T., Bühler, Y., and Bresch, D. N.: Large-scale risk assessment on snow avalanche hazard in alpine regions, Nat. Hazards Earth Syst. Sci. Discuss. [preprint], https://doi.org/10.5194/nhess-2022-112, in review, 2022.
Rudolf-Miklau, F., Sauermoser, S., and Mears, A., Rudolf-Miklau, F., Sauermoser, S., and Mears, A. (Eds.): The Technical Avalanche Protection Handbook, Wiley-VCH, Berlin, Germany, 430 pp., https://doi.org/10.1002/9783433603840.ch01, 2014.
Salm, B., Burkhard, A., and Gubler, H. U.: Berechnung von Fliesslawinen. Eine Anleitung für den Praktiker mit Beispielen, Eidgenössisches Institut für Schnee- und Lawinenforschung SLF, Davos, 1990.
Sappington, J. M., Longshore, K. M., and Thompson, D. B.: Quantifying landscape ruggedness for animal habitat analysis: A case study using bighorn sheep in the Mojave Desert, J. Wildlife Manage., 71, 1419–1426, https://doi.org/10.2193/2005-723, 2007.
Schaer, M.: Avalanche activity during major avalanche events, a case study for hydroelectric reservoirs, Les rapports de la recherche scientifique à la sécurité neige, glace et avalanche, Chamonix, FR1995, 1995.
Schneebeli, M. and Meyer-Grass, M.: Avalanche starting zones below the timber line – Structure of forest., International Snow Science Workshop ISSW, Breckenridge, Colorado, USA, https://arc.lib.montana.edu/snow-science/item/1250 (last access: 24 May 2022), 1993.
Schweizer, J., Mitterer, C., Techel, F., Stoffel, A., and Reuter, B.: On the relation between avalanche occurrence and avalanche danger level, The Cryosphere, 14, 737–750, https://doi.org/10.5194/tc-14-737-2020, 2020.
SLF, Ammann, W., and Bründl, M. (Eds.): Der Lawinenwinter 1999 – Ereignisanalyse, Eidgenössisches Institut für Schnee- und Lawinenforschung, Davos, 588 pp., https://www.dora.lib4ri.ch/wsl/islandora/object/wsl:17698 (last access: 24 May 2022), 2000.
Soteres, R. L., Pedraza, J., and Carrasco, R. M.: Snow avalanche susceptibility of the Circo de Gredos (Iberian Central System, Spain), J. Maps, 16, 155–165, https://doi.org/10.1080/17445647.2020.1717655, 2020.
Stritih, A., Bebi, P., Rossi, C., and Grêt-Regamey, A.: Addressing disturbance risk to mountain forest ecosystem services, J. Environ. Manage., 296, 113188, https://doi.org/10.1016/j.jenvman.2021.113188, 2021.
swisstopo: swissALTI3D – Das hoch aufgelöste Terrainmodell der Schweiz, Swiss Federal Office of Topography swisstopo, Berne, Switzerland, 27, https://www.swisstopo.admin.ch/en/geodata/height/alti3d.html (last access: 24 May 2022), 2018.
Sykes, J., Haegeli, P., and Bühler, Y.: Automated snow avalanche release area delineation in data sparse, remote, and forested regions, Nat. Hazards Earth Syst. Sci. Discuss. [preprint], https://doi.org/10.5194/nhess-2021-330, in review, 2021.
Teich, M., Bartelt, P., Grět-Regamey, A., and Bebi, P.: Snow avalanches in forested terrain: Influence of forest parameters, topography, and avalanche characteristics on runout distance, Arct. Antarct. Alp. Res., 44, 509–519, https://doi.org/10.1657/1938-4246-44.4.509, 2012.
Volk, G. and Kleemayr, K.: ELBA – Ein GIS-gekoppeltes Lawinensimulationsmodell Anwendungen und Perspektiven, VGI – Österreichische Zeitschrift für Vermessung und Geoinformation, 87, 84–92, 1999.
Walter, F., Amann, F., Kos, A., Kenner, R., Phillips, M., de Preux, A., Huss, M., Tognacca, C., Clinton, J., Diehl, T., and Bonanomi, Y.: Direct observations of a three million cubic meter rock-slope collapse with almost immediate initiation of ensuing debris flows, Geomorphology, 351, 106933, https://doi.org/10.1016/j.geomorph.2019.106933, 2020.
Weber, D., Rüetschi, M., Small, D., and Ginzler, C.: Grossflächige Klassifikation von Gebüschwald mit Fernerkundungsdaten, Schweizerische Zeitschrift fur Forstwesen, 171, 51–59, https://doi.org/10.3188/szf.2020.0051, 2020.
Zweifel, B., Lucas, C., Hafner, E., Techel, F., Marty, C., and Stucki, T.: Schnee und Lawinen in den Schweizer Alpen. Hydrologisches Jahr 2018/19, WSL-Institut für Schnee- und Lawinenforschung SLF; Eidg. Forschungsanstalt für Wald, Schnee und Landschaft WSL, Davos, Birmensdorf, 134, https://www.wsl.ch/de/publikationen/default-34cd5573e3.html (last access: 24 May 2022), 2019.