the Creative Commons Attribution 4.0 License.
the Creative Commons Attribution 4.0 License.
 | 27 Jan 2022
Compound inland flood events: different pathways, different impacts and different coping options
Annegret H. Thieken
Guilherme Samprogna Mohor
Heidi Kreibich
Meike Müller
Several severe flood events hit Germany in recent years, with events in 2013 and 2016 being the most destructive ones, although dynamics and flood processes were very different. While the 2013 event was a slowly rising widespread fluvial flood accompanied by some severe dike breaches, the events in 2016 were fast-onset pluvial floods, which resulted in surface water flooding in some places due to limited capacities of the drainage systems and in destructive flash floods with high sediment loads and clogging in others, particularly in small steep catchments. Hence, different pathways, i.e. different routes that the water takes to reach (and potentially damage) receptors, in our case private households, can be identified in both events. They can thus be regarded as spatially compound flood events or compound inland floods. This paper analyses how differently affected residents coped with these different flood types (fluvial and pluvial) and their impacts while accounting for the different pathways (river flood, dike breach, surface water flooding and flash flood) within the compound events. The analyses are based on two data sets with 1652 (for the 2013 flood) and 601 (for the 2016 flood) affected residents who were surveyed around 9 months after each flood, revealing little socio-economic differences – except for income – between the two samples. The four pathways showed significant differences with regard to their hydraulic and financial impacts, recovery, warning processes, and coping and adaptive behaviour. There are just small differences with regard to perceived self-efficacy and responsibility, offering entry points for tailored risk communication and support to improve property-level adaptation.
- Article
(1095 KB) - Full-text XML
- BibTeX
- EndNote


Floods are the most frequent natural hazard worldwide affecting the most people (CRED and UN-DRR, 2020), with Europe being no exception (EEA, 2019). Among these, different flood types can be distinguished (de Bruijn et al., 2009):
-
coastal flooding, i.e. when seawater inundates land;
-
fluvial flooding, i.e. when rivers overtop their banks or embankments fail;
-
pluvial flooding with areal inundations after heavy rainfall, e.g. due to limited drainage capacities.
These flood types can occur separately or simultaneously; e.g. the coincidence of coastal and fluvial flooding is commonly referred to as a compound event. Originating from research on climate change, compound events are described as (1) simultaneous or successively occurring (climate-related) events such as simultaneous coastal and fluvial floods, (2) events combined with background conditions that augment their impacts such as rainfall on already saturated soils, or (3) a combination of (several) average values of climatic variables that result in an extreme event (IPCC, 2012; Pescaroli and Alexander, 2018). However, recent inland floods revealed features of compound events. For example, severe flooding in 2002 caused losses of over EUR 21 billion in Central Europe (EEA, 2019). During this flood event, the city of Dresden in Saxony, Germany, was hit by four consecutive flood waves, which were all triggered by the same rainfall event: first, surface water flooding occurred in the city as an immediate response to the heavy precipitation on 12 August 2002 and the limited capacity of the sewer system, which was shortly, i.e. on the next day, followed by a flash flood from the local and mid-sized rivers of Weißeritz and Lockwitzbach that drain into the bigger river Elbe within the city area of Dresden. A few days later, i.e. on 17 August 2002, this flooding was followed by inundations from the flood wave of the river Elbe, which was later followed by high groundwater levels lasting for several months (Kreibich et al., 2005). Further downstream of the river Elbe, dike breaches caused huge inundations of the hinterland (DKKV, 2003). Zscheischler et al. (2020) termed a situation in which multiple locations are impacted within a limited time window and are connected via a physical modulator, i.e. the atmospheric circulation, spatially compound events. To avoid confusion with the coincidence of river and coastal flooding, we use the term compound inland flood in this paper.
Following the source–pathway–receptor–consequence model (SPRC model; e.g. Sayers et al., 2002), the different processes observed in Dresden and downstream in 2002 can also be regarded as specific pathways within a regional flood event since the floodwater takes a different route to reach (and potentially damage) receptors such as buildings or residents. In flood impact analyses or loss modelling, compound inland floods with different pathways have rarely been studied, although there are indications that the resulting consequences differ. For example, buildings affected by dike breaches tend to experience higher losses than buildings affected by a usual river flood (Cammerer and Thieken, 2011; Mohor et al., 2020). Overall analyses of data from fluvial floods between 2002 and 2013 suggest that different flood pathways, i.e. river floods, dike breaches, surface water flooding and groundwater floods, play an important role when it comes to the assessment of (financial) flood impacts (Vogel et al., 2018; Mohor et al., 2020, 2021). Differences in coping options during the event, as well as in recovery in its aftermath, are less clear. For example, the widespread flood of June 2013 demonstrated improved flood risk management all over Germany (Thieken et al., 2016a, b). This most severe flood event in hydrological terms (Merz et al., 2014; Schröter et al., 2015) caused lower losses, i.e. EUR 6 to 8 billion, than the 2002 flood at EUR 11.6 billion (Thieken et al., 2016a, b). Still, some areas, particularly those affected by dike breaches, suffered from severe losses. To mitigate future damage, this pathway needs further attention.
Next to fluvial floods, pluvial flooding has occurred in several places in Germany in recent years, for example, in the city of Münster in 2014 (Spekkers et al., 2017) or in the village of Braunsbach in 2016 (Bronstert et al., 2018), causing damage that was unprecedented for this type of flooding. Particularly events at the end of May and beginning of June 2016 challenged (local) water authorities, emergency responders and residents: several places in Germany were affected by heavy rainfall and hail leading to surface water flooding due to limited capacities of urban drainage systems (GDV, 2016; Piper et al., 2016). Moreover, in some places, particularly in the small towns of Braunsbach (located in the federal state of Baden-Württemberg) and Simbach (located in the Free State of Bavaria), flooding was accompanied by quick concentrated surface runoff activating huge amounts of mud, debris and further material that was carried downstream, blocked culverts, and threatened people and assets (Piper et al., 2016; Hübl et al., 2017; Laudan et al., 2017; LfU, 2017; Vogel et al., 2017). Overall losses amounted to EUR 2.6 billion (Munich Re, 2017), 11 people lost their lives, and more than 80 people were injured, mostly by lightning strikes.
Analyses of pluvial floods illustrate that warning is more difficult and residents tend to be less experienced with this flood type and are hence less prepared for it, but average property losses are commonly lower in comparison to fluvial floods (compare Kienzler et al., 2015, with Rözer et al., 2016; Spekkers et al., 2017; Kind et al., 2019; GDV, 2020). These analyses, however, mainly focussed on surface water flooding in urban areas, ignoring that impacts caused by flash floods with sediment loads can be exceptionally high (GDV, 2016; Laudan et al., 2017), which was emphasized by flooding in July 2021 in western Germany that caused more than 180 fatalities and losses of around EUR 30 billion. In 2016, the severity of flash flood processes also affected mental health, as well as precautionary behaviour (Laudan et al., 2020), and even led to relocations of some buildings at risk, a risk management strategy that has been rarely implemented in Germany (Mayr et al., 2020). Hence, to better understand flood impacts and coping options, it seems necessary to not only distinguish different flood types (fluvial and pluvial flood) but also different pathways within one flood event, like dike breaches during fluvial floods and flash floods with sediment loads during pluvial floods.
Accounting for interactions between hazard processes helps us to better understand and prepare for complex events. In this context, compound, interacting and cascading events are distinguished (e.g. Pescaroli and Alexander, 2018). We argue that the flood events of 2002, 2013 and 2016 in Germany that were described above can be understood as compound flood events since rainfall from a common atmospheric circulation led to different flood situations depending on the antecedent soil moisture, the characteristics of the catchment (e.g. topography, size, land use, drainage network) and/or the failure of flood protection. Zscheischler et al. (2020) further recommend separating and analysing different elements, i.e. pathways in our view, to better understand the event as a whole. Hence, the term compound inland flood is used for floods that unfold different damaging pathways while being connected through the same triggering event.
Furthermore, event-oriented storyline approaches were proposed to link climate change to societal impacts in order to improve disaster risk management (Shephard et al., 2018; Sillmann et al., 2021). Therefore, we created subsamples that capture different flood pathways, i.e. dike breaches, river floods, flash floods (with sediment loads) and surface water flooding, to study their characteristics within and between the two flood events of 2013 and 2016 (see Sects. 2 and 3.3). We hypothesize that such in-depth analyses of impact and coping patterns of different flood types and pathways provide entry points to derive storylines and to better tailor flood risk management to local circumstances. In particular, this paper aims to reveal whether and how differently people were affected by different flood types and pathways, how much they were impacted in hydraulic, financial and psychological terms, and how differently they were prepared before the damaging event, coped with it and recovered from the impacts. The intention is to provide empirically based, quantitative insights that help establish risk management strategies tailored to different flood types and pathways.
Like in previous studies (Thieken et al., 2007, and Kienzler et al., 2015, for fluvial floods and Rözer et al., 2016, and Spekkers et al., 2017, for pluvial floods) the risk management cycle is used as the guiding framework. However, in contrast to the previous studies this paper also looks at patterns within the compound inland flood events separating cases affected by dike breaches in 2013 and flash floods with heavy sediment loads in 2016 from the overall samples to better understand the impacts of and coping options for specifically challenging pathways. For clarity, general flood types are termed fluvial and pluvial floods in this paper, while pathways within the events are named dike breach, river flood, surface water flood and flash flood.
2.1 The flood of June 2013
In June 2013, widespread fluvial flooding occurred in Central Europe, particularly in Germany: 12 out of 16 German federal states were affected; 8 of them declared a state of emergency (Thieken et al., 2016a, b). Flooding was triggered by a combination of wet antecedent conditions and high precipitation amounts between 31 May and 2 June 2013 (Merz et al., 2014; Schröter et al., 2015). By the end of May 2013, record-breaking antecedent soil moisture was recorded in 40 % of the German territory (DWD, 2013) and above-average initial streamflows were observed in many rivers (Thieken et al., 2016b). Hotspots of precipitation between 31 May and 3 June 2013 totalled up to 346 mm within 72 h at the official DWD weather station of Aschau-Stein (Schröter et al., 2015). This combination resulted in high flood peaks in the upper catchments of the rivers Rhine and Weser and particularly in many parts of the catchments of the rivers Danube and Elbe (Thieken et al., 2016b). Altogether, peak flows exceeded the 5-year flood discharge in 45 % of the German river network (Schröter et al., 2015). Around 1400 km of the river network saw 100-year flood discharges. Hydrological and statistical analyses indicated that this event was Germany's most severe fluvial flood over the past 60 years (Merz et al., 2014) leading to widespread inundations, particularly along the rivers Danube and Elbe. Although huge investments had been made in upgrading embankments after the 2002 flood, some dike breaches and consequent inundations of their hinterland occurred. Three breaches were particularly severe (Merz et al., 2014): (1) a breach at Deggendorf-Fischerdorf at the confluence of the rivers Isar and Danube flooded several properties in Bavaria; due to floating and bursting oil tanks and consequently highly contaminated flood water, 150 homes had to be completely rebuilt (Bavarian Parliament, 2014); (2) a breach in Klein Rosenburg-Breitenhagen at the confluence of the rivers Saale and Elbe in Saxony-Anhalt; and (3) a breach near Fischbeck at the middle reach of the Elbe River in Saxony-Anhalt that also affected the high-speed train connection between Berlin and Hanover which was disrupted for several months (Thieken et al., 2016a). In all of Germany, 14 people died, and direct losses summed up to EUR 8 billion (Thieken et al., 2016a).
In comparison to regions flooded by a river, areas affected by dike breaches tend to suffer from extended inundation durations (Vogel et al., 2018) and – where oil heating is common – floating and leaking oil tanks that cause considerable material and environmental damage (DKKV, 2015; Thieken et al., 2016a). Considering the triggering mechanism of this flood, as well as the dike breaches mentioned above, this event can be understood as a spatially compound event. To account for different flood pathways, residents affected by “normal” river floods and residents affected by dike breaches are analysed separately in this paper.
2.2 Flooding in May and June 2016
From 26 May to 9 June 2016, Germany and parts of Central and Southern Europe were hit by an extraordinarily high number of severe convective storms with intense rainfall and hail. This thunderstorm episode was caused by the interaction of high atmospheric moisture content, low thermal stability, weak wind speed and large-scale lifting by surface lows (Piper et al., 2016). Low wind speed at mid-tropospheric levels led to nearly stationary or slow-moving convective cells and hence to locally extreme rain accumulations exceeding 100 mm within 24 h. Due to atmospheric blocking these boundary conditions persisted for almost 2 weeks (Piper et al., 2016). Depending on the characteristics of the affected catchments and areas, the heavy precipitation triggered surface water flooding (due to limited sewer capacity, e.g. in the city of Hanover in Lower Saxony), inundations along (small) rivers and creeks, and flash floods, partly carrying huge amounts of mud and debris. The main hotspots occurred in southern Germany. In Braunsbach, a small village in Baden-Württemberg, the extreme precipitation of more than 100 mm within 2 h on 29 May caused a devastating flash flood (Bronstert et al., 2017). The Orlacher Bach, a creek that runs through the village with just 6 km2 catchment size and very steep slopes, showed extreme runoff with massive debris transport of 42 000 m3 (Vogel et al., 2017). Streets were blocked with gravel and stones up to a thickness of 2 to 3 m, causing immense damage to buildings and infrastructure (Laudan et al., 2017). In Simbach, a village in southern Bavaria situated on the river Inn, the rainfall amounted to 120 mm in 24 h on 1 June (Piper et al., 2016). Subsequently the small river Simbach (33 km2 catchment size) and its tributaries showed extreme runoff. At the gauging station of Simbach, the water level rose from 63 to 506 cm within 10 h (described in LfU, 2017, p. 40). Several culverts were blocked with debris and driftwood, dams broke, and parts of the village were flooded (LfU, 2017).
In all of Germany 11 people died, and the economic loss amounted to EUR 2.6 billion, which is extraordinary high with regard to heavy rainfall and thunderstorms in Germany (GDV, 2016; Laudan et al., 2017; Munich Re, 2017; Vogel et al., 2017). Because of the huge losses in Simbach and other villages in Bavaria, a grant and loan programme for compensating flood damage to residential buildings and household contents was implemented (Bavarian State Government, 2016). In Baden-Württemberg, the market penetration of insurance against natural hazards is still high, i.e. around 94 %, due to the fact that it was mandatory until 1994 (Surminski and Thieken, 2017; GDV, 2020).
Since different types of flooding and various runoff dynamics could be observed from 26 May to 9 June, this event is also treated as a spatially compound inland flood in this paper. The dynamics comprise different pathways, flow velocities and water depths, as well as different impacts that are difficult to categorize distinctly. Yet, households have been mainly affected by shallow surface water flooding but, in fewer cases, also by the forceful overflowing of water bodies and partly to clogging and subsequent dam breaches which led to strong flash floods with a heavy sediment load (e.g. in Braunsbach and Simbach). Thus, the data set from this pluvial flood was separated into cases affected by low–medium surface water flooding on the one hand and cases that suffered from flash floods with debris flows on the other hand (Fig. 1; see Sect. 3.3 for details).
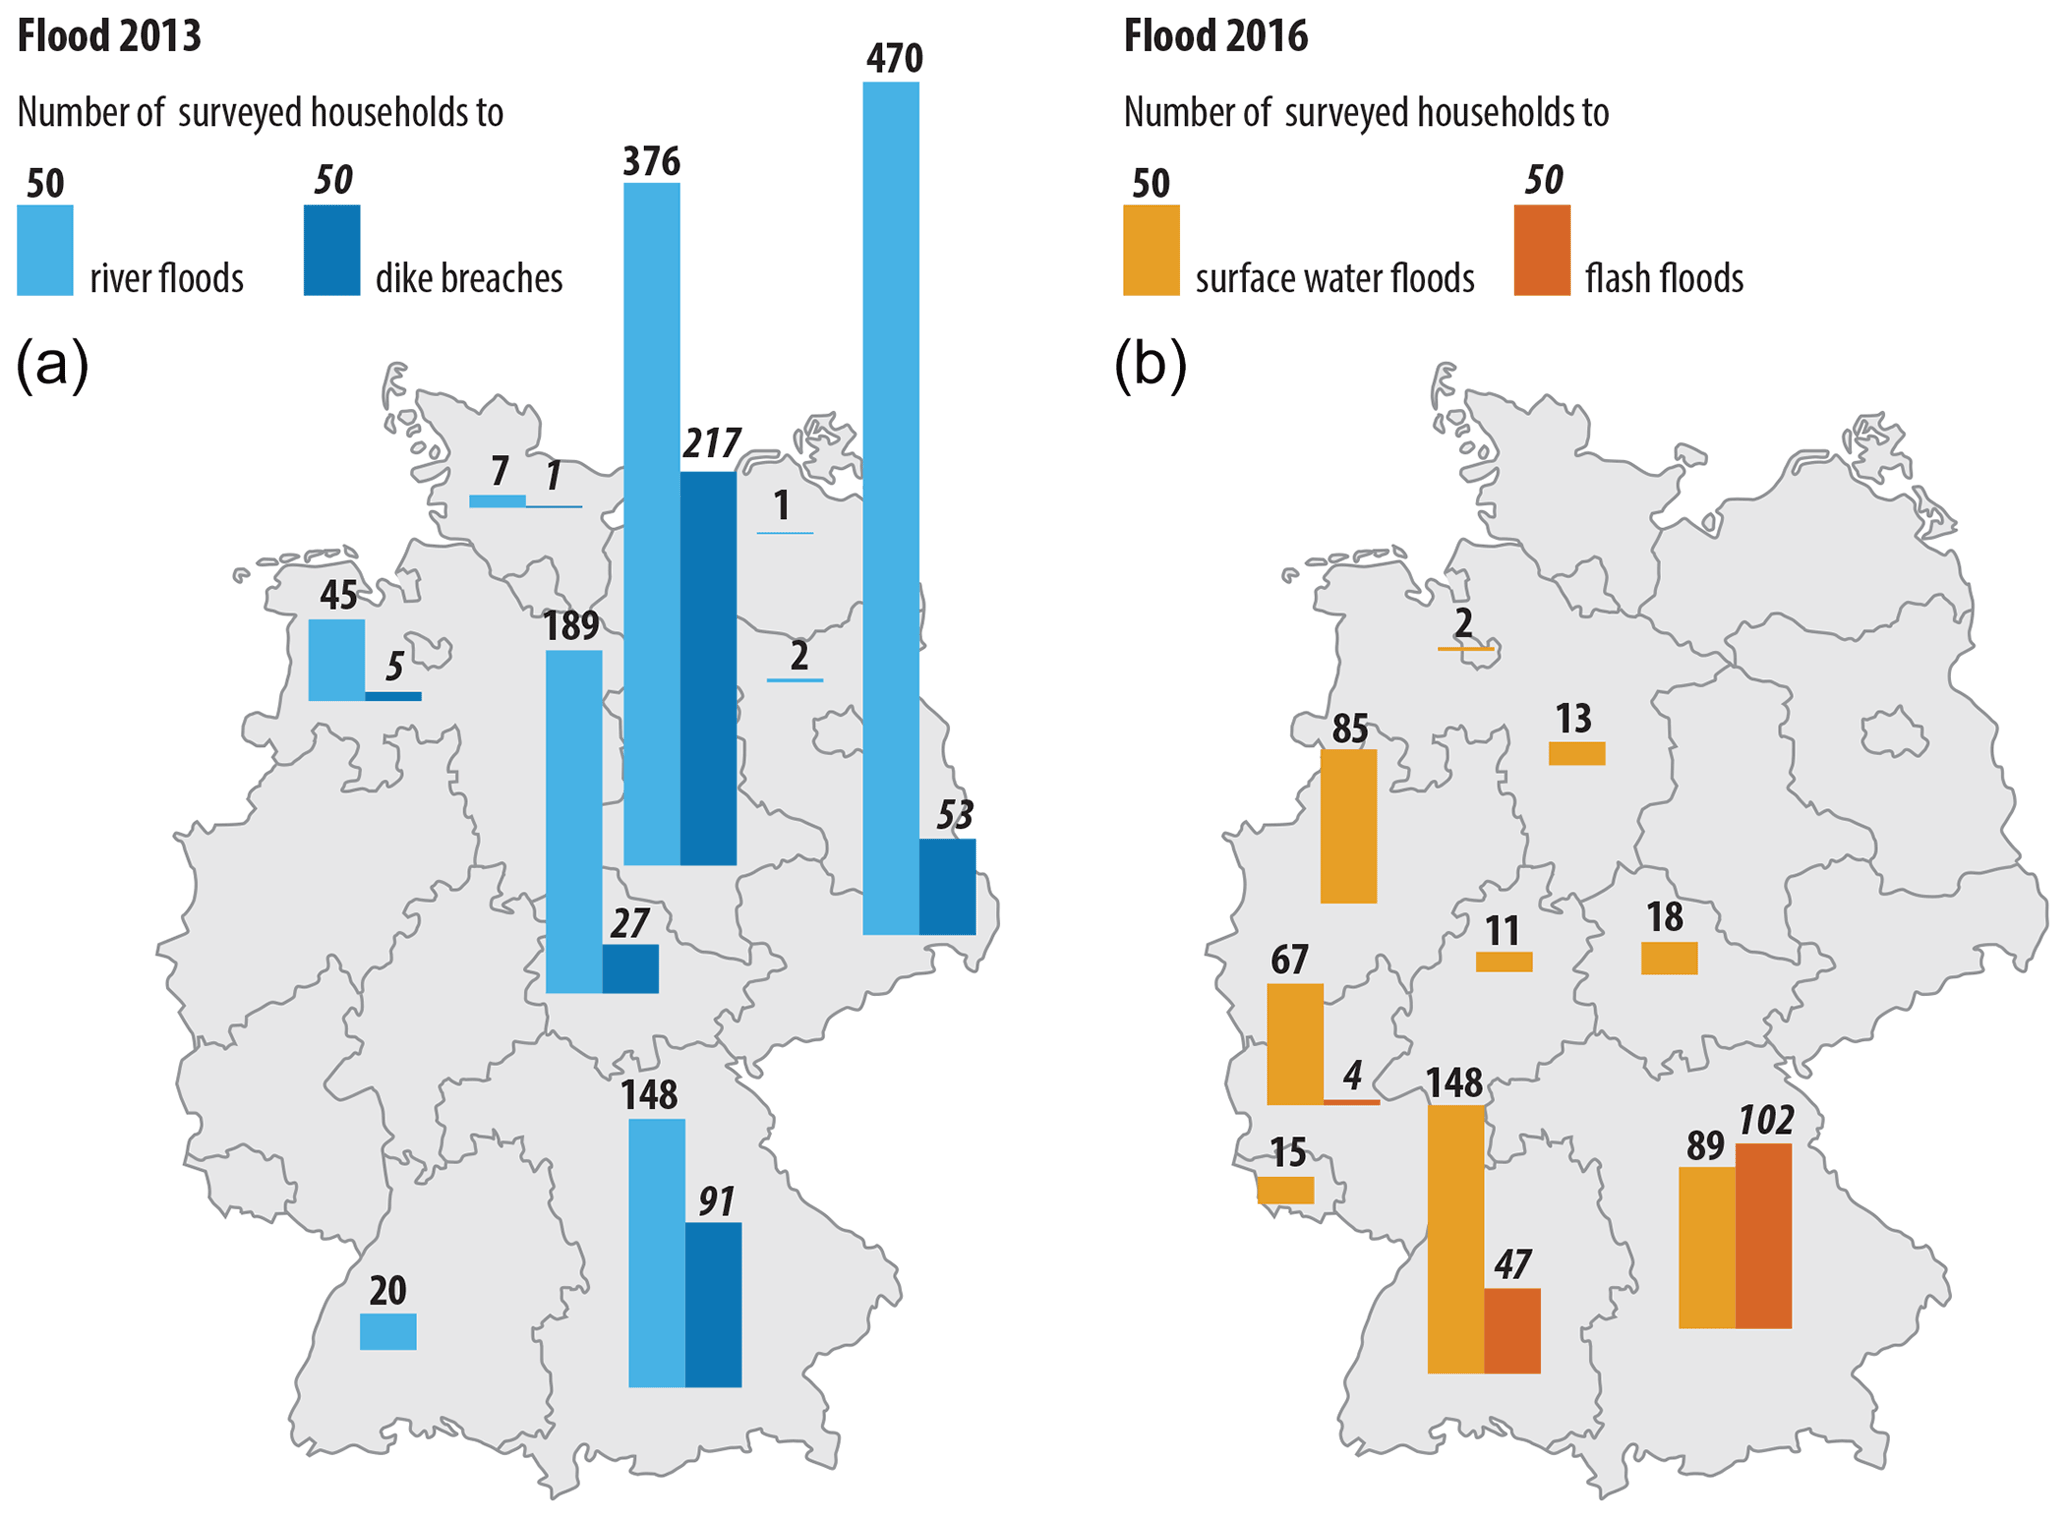
Figure 1Geographic overview of the number of households surveyed about the flood of 2013 (a) and 2016 (b).
The analyses are based on survey data that were gathered among private households that suffered from property damage caused by flooding in 2013 or 2016. Both surveys were conducted around 9 months after the respective damaging event using computer-aided telephone interviews (CATIs), during which residents were guided through a standardized questionnaire (see Thieken et al., 2017). On average, an interview lasted around 30 min.
3.1 Sampling flood-affected households
To identify affected households, media reports and satellite images were used to compile a list of inundated streets and zip codes. In some cases, this information was provided by affected communities and districts or fire brigades. The lists served as a basis for retrieving telephone numbers (landlines) from public telephone directories. Due to a high number of non-affected residents within the areas identified, all retrieved telephone numbers were finally called. Always the person in the household who had the best knowledge about the flood event was questioned. The surveys were conducted by a subcontracted pollster from 18 February to 24 March 2014 for the 2013 flood and from 28 March to 28 April 2017 for the 2016 event. In total, 1652 interviews from 173 different municipalities across nine federal states were completed for the 2013 flood (out of a total of 43 281 numbers, from which 16 554 could not be reached during the field time; another 16 721 residents did not suffer from financial damage, and 8144 refused to participate). For the 2016 event, it was possible to complete 601 interviews in 76 different municipalities spread across nine federal states of Germany (out of 42 487 retrieved numbers, from which 24 486 could not be reached during the field time; 12 010 residents did not suffer from financial damage, and 4254 refused to participate).
3.2 Contents of the questionnaire and data processing
The questionnaires already presented by Thieken et al. (2005, 2007) and Rözer et al. (2016) were slightly adapted for the two surveys and contained about 160 questions addressing a range of topics: source of flooding (pathway), depth, velocity and duration of the inundation at the affected property, contamination of the flood water, flood warnings, emergency measures, characteristics and amount of damage to household contents and buildings, recovery and psychological burden of the interviewed person, precautionary measures, previously experienced flood events, perceived threat and coping appraisal, and socio-demographic information. In both surveys, tenants were only asked about their household, the damage to contents and some core characteristics of the building. Several questions used an ordinal Likert-type scale from 1 to 6, in which just the meanings of the end points were explicitly verbalized to enable quantitative analyses.
After the collection, data were post-processed through comparisons and consistency checks. While questions about characteristics of the building, e.g. the existence of a cellar, and the type of the losses were cross-checked during the survey, additional checks were performed in the aftermath; e.g. the size of the household was compared to the reported numbers of children and elderly in that household. In addition, some items were aggregated to indicators as described by Thieken et al. (2005) and Laudan et al. (2020): contamination, source of the flood warning, emergency measures (short-term measures, performed during the event), precautionary measures (long-term measures, implemented before or after the flood) and previously experienced flooding.
Further, the total asset values of contents and buildings were estimated based on the floor space (of the flat or the building) and standardized values. For contents, a unit value of EUR 650/m2 as of 2005 was scaled to the year of the event by a consumer price index excluding food, resulting in EUR 695.90/m2 (as of 2013) and EUR 719.52/m2 (as of 2016). The total value of a building was estimated by the “Mark1914” insurance value per square metre per building type multiplied by the “Gleitender Neuwertfaktor” (16.2 for 2013 and 17.2 for 2016), a specific building price index used by the German insurance industry. If the reported damage exceeded the so-estimated asset value, a loss ratio of 1 was assumed. For the comparisons in this study, all monetary values of 2013 were scaled to 2016 based on price indices.
3.3 Subsamples
To study differences in flood pathways the following subsamples were distinguished (compare Fig. 1):
-
2013 dike breaches. All households that reported that they had been affected by a dike breach were included in this subsample; this applied to 394 cases from more than 60 different places across six federal states, i.e. to around 24 % of all surveyed cases affected by flooding in 2013.
-
2013 river flooding. This includes all other households from the 2013 data set, i.e. 1258 cases (76 %) located in more than 160 municipalities across nine federal states.
-
2016 flash floods. This includes all surveyed households from areas that had been affected by severe flash floods accompanied by sediment loads, clogging or failure of flood protection (see below); this applied to 153 cases from 10 different municipalities located in three different federal states, i.e. around 25 % of all surveyed cases affected by flooding in 2016.
-
2016 surface water flooding. This includes all other households from the 2016 data set, i.e. 448 cases (75 %) from 66 different municipalities across nine federal states.
The places of cases that reported dike breaches in the 2013 survey were cross-checked with the three locations of severe levee breaches (see introduction), revealing that at least 74 cases can be linked to the breach at Deggendorf-Fischerdorf, 129 to the breach in Klein Rosenburg-Breitenhagen and 62 to the breach near Fischbeck (Elbe), illustrating that the answers of the respondents are credible.
Since different pathways of the pluvial flooding in 2016 were more difficult to be distinguished by lay people and were not well captured by the survey questions on the damaging flood pathways, event analyses and reports were used to identify places that were hit by rapid onset floods that were accompanied by huge sediment loads, debris flow, clogging and/or failure of flood protection. Such event characteristics were described for the municipality of Braunsbach in Baden-Württemberg (e.g. Laudan et al., 2017; Bronstert et al., 2018), as well as for Künzelsau and Forchtenberg based on field inspections (Mühr et al., 2016). In Bavaria, similar damaging processes were described for the municipalities of Ansbach, Flachslanden, Julbach, Obernzenn, Simbach and Triftern (Hübl et al., 2017; LfU, 2017). An overtopped flood retention basin was reported for the municipality of Grafschaft in Rhineland-Palatinate (Demuth et al., 2016). All cases from these municipalities were included in the flash flood sample.
3.4 Data analysis
Data subsets were compared either through the non-parametric Mann–Whitney–Wilcoxon two-sample test or chi-squared contingency table test, depending on whether a variable was metric or categorical (Noether, 1991), comparing the median of differences or the closeness of expected frequencies, respectively.
A p value threshold was set to 0.05 for statistical significance, regardless of the absolute difference or effect size. These procedures were run with the R language (R Core Team, 2017) – with the assistance of the packages “stats”, “rcompanion” and “PMCMR”. For variables with significant differences further statistics were calculated in SPSS. Means and frequencies are presented in relation to the valid answers, i.e. ignoring no answers or “I don't know” entries.
In this section we present the main differences and commonalities between and within the two compound inland flood events. Per topic we will first compare the fluvial 2013 flood to the pluvial 2016 flood, which is then followed by a comparison of the flood pathways within each compound event, i.e. river floods versus dike breaches for the 2013 event, as well as surface water floods versus flash floods in 2016.
Table 1Socio-demographic characteristics of households affected by different flood pathways in 2013 and 2016.
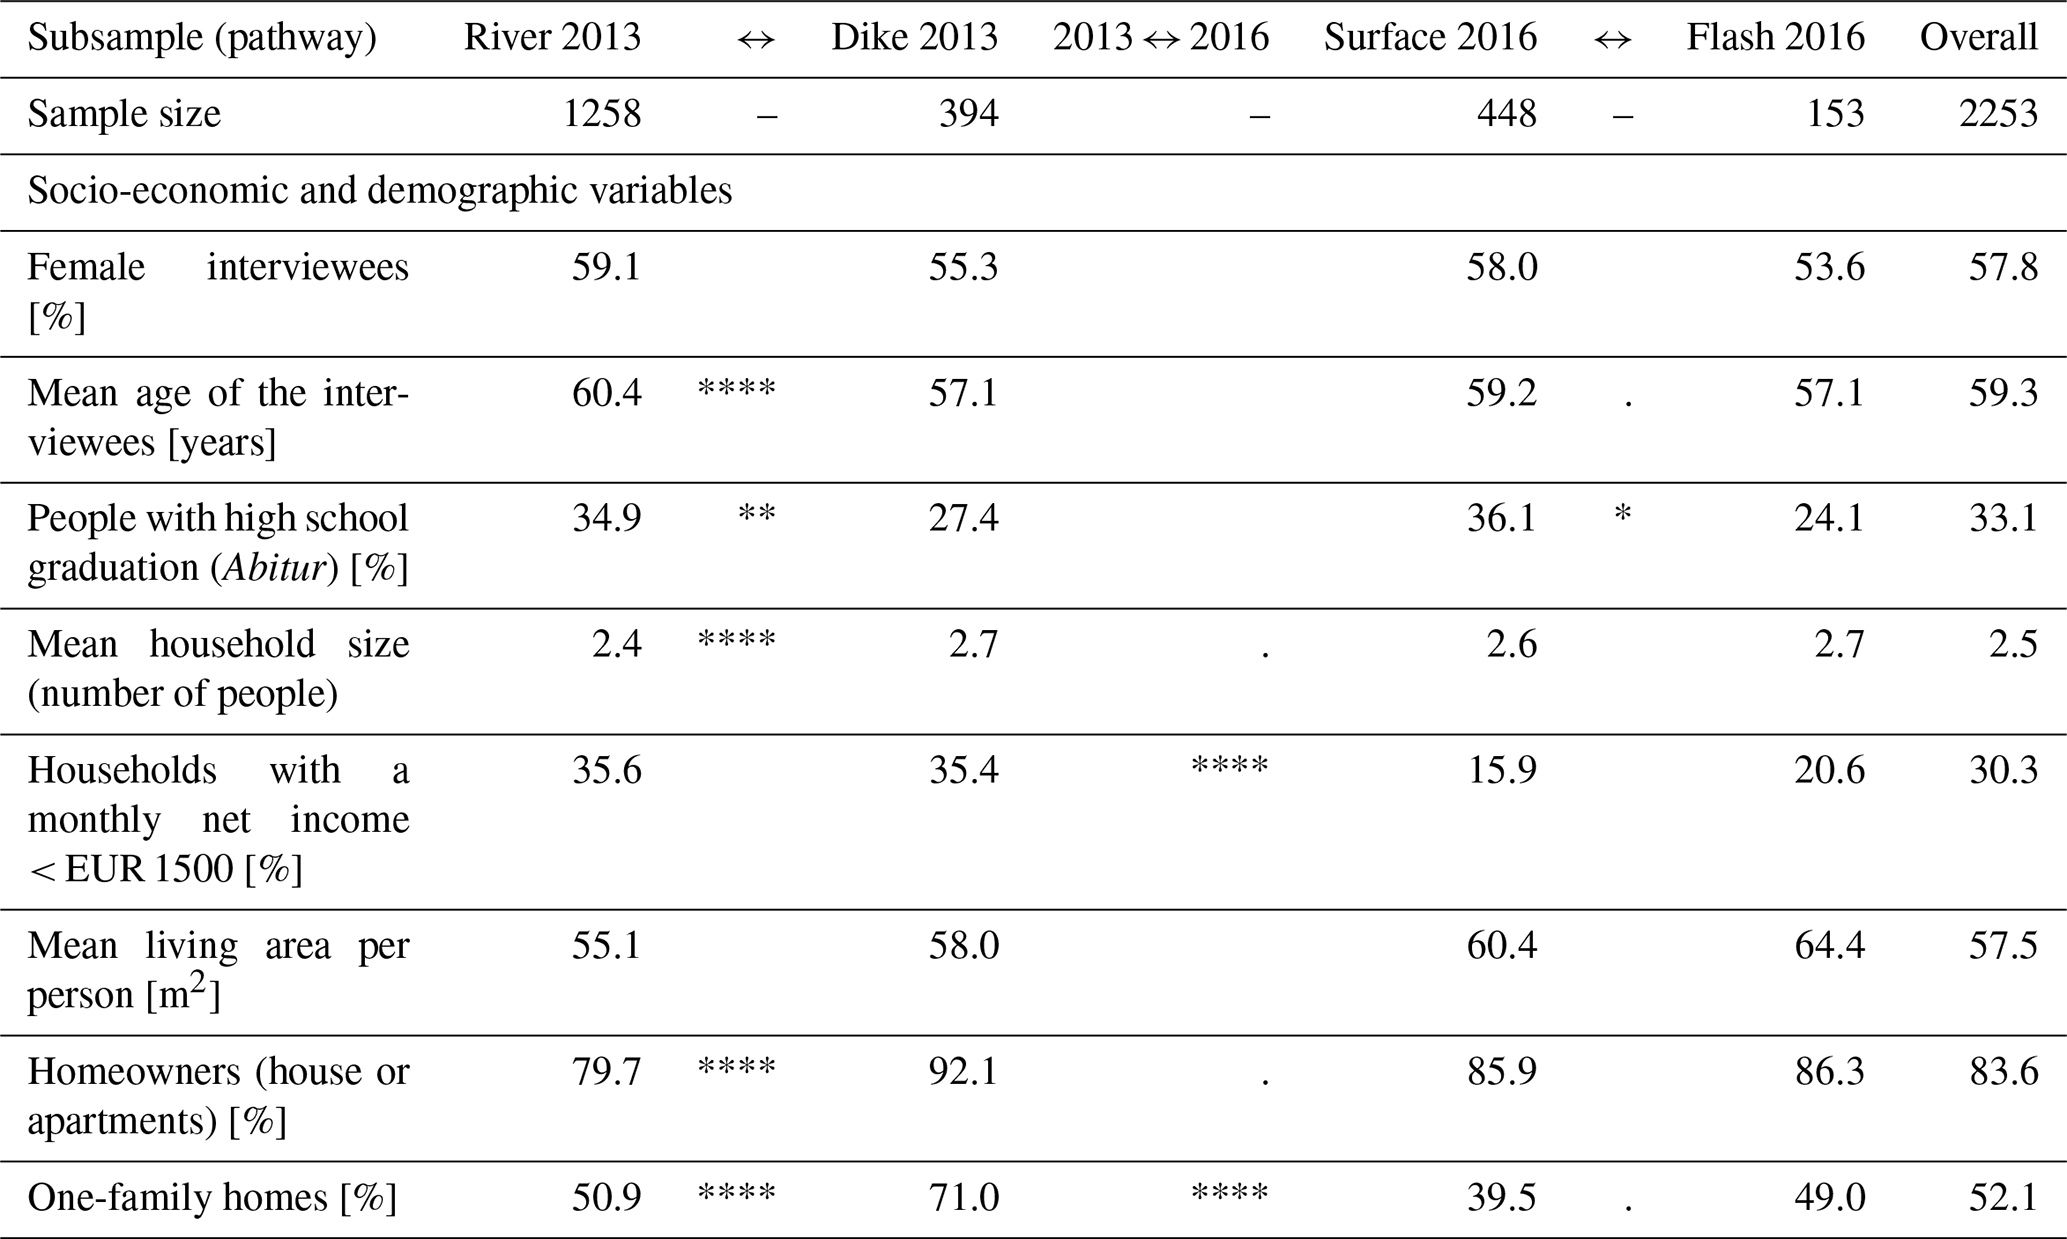
Percentage or means only regarding valid values, i.e. answered entries.
Comparison of subsets or 2013 to 2016 in the middle columns, with p value
ranges from Mann–Whitney–Wilcoxon or chi-square tests represented as follows:
“****” ≤0.001, “***” ≤0.005, “**” ≤0.01, “*” ≤0.05, “.” ≤0.1, “ ” ≤1.
4.1 Socio-demographic characteristics of the subsamples
This section presents the characteristics of the surveyed residents in the four subsamples. Besides the mean values for each item and each subsample, as well as for the whole data set, Table 1 provides the test statistics of the Mann–Whitney–Wilcoxon or chi-square tests when comparing all data from the 2013 flood with the 2016 flood, as well as when comparing the two subsamples (pathways) within each event.
On a 5 % significance level, Table 1 reveals that socio-demographic characteristics do not differ between the two events, except for the share of households with a monthly net income below EUR 1500 and the share of one-family homes. Both values are higher for the 2013 flood, reflecting that more rural areas were affected by this widespread fluvial flood. Those affected by surface water flooding in 2016 had the smallest percentage of households with income below EUR 1500 or, in other words, a higher share of higher-income households than the other subsamples, as well as the smallest percentage of households living in one-family homes reflecting that mainly urban areas were affected by this flood pathway. In contrast, the flood of 2013 widely affected rural areas in the eastern parts of the country. The 2013 sample contains many cases from Saxony and Saxony-Anhalt (see Fig. 1); in East Germany the mean monthly net income per household amounted to EUR 2521 in 2013, while it was EUR 3297 in West Germany, which was hit by the 2016 floods (Destatis, 2018; see Fig. 1). So, the differences in income in our data reflect the regional income pattern in Germany.
In addition, there are slight (i.e. low-significant) differences between the two events with respect to the mean household size and homeownership (Table 1). However, these variables more pronouncedly differ between the two subsamples of the 2013 flood: surveyed households affected by river flooding had the smallest household size and the lowest percentage of home/apartment ownership (80 %), whilst those affected by dike breaches showed the highest percentage of homeowners (92 %). Similarly, the 2013 river subsample shows a lower share of one-family homes (51 %) than the 2013 dike subsample (71 %). This suggests that areas affected by dike breaches were mostly rural areas with owner-occupied dwellings and larger families, while other areas affected in 2013 are probably located in more urban settings, also showing a better education and a higher mean age. Similar but statistically weaker differences were found for the 2016 event. Here the regions affected by flash floods slightly tend to contain more one-family homes, a lower age and fewer people with a high-school education than areas affected by surface water flooding. Still, there are no significant differences in the living area per person among the subsamples despite a range between 55 m2 (river floods) and 64 m2 (flash floods). Often, the flash flood subsample did not show high statistical differences to other subsamples even when presenting the highest or lowest means due to its smaller number of cases (Table 1).
Altogether, the characteristics of the four subsamples lie within previous studies' averages, though with varied sample sizes and from different regions in Germany, which should be taken into account when interpreting further results. Previous works compared the socio-economic characteristics of survey respondents to a city or a national census. Some differences are noticeable such as a higher age and a greater share of ownership among respondents probably because only fixed landlines were consulted. Given the similarity of sampling methods, we expect similar biases in all subsamples. For a more detailed discussion of potential biases, see the works of Kienzler et al. (2015), Rözer et al. (2016), and Spekkers et al. (2017). Nevertheless, all subsamples contain data from several municipalities and federal states reflecting different geographic, social and governance contexts across Germany. Even the smallest subsample of the flash floods contains 153 cases from 10 municipalities located in three different federal states (Fig. 1), allowing us to draw conclusions beyond the studied events in Germany.
Table 2Hydraulic flood characteristics and impacts reported by households affected by different flood pathways in 2013 and 2016.
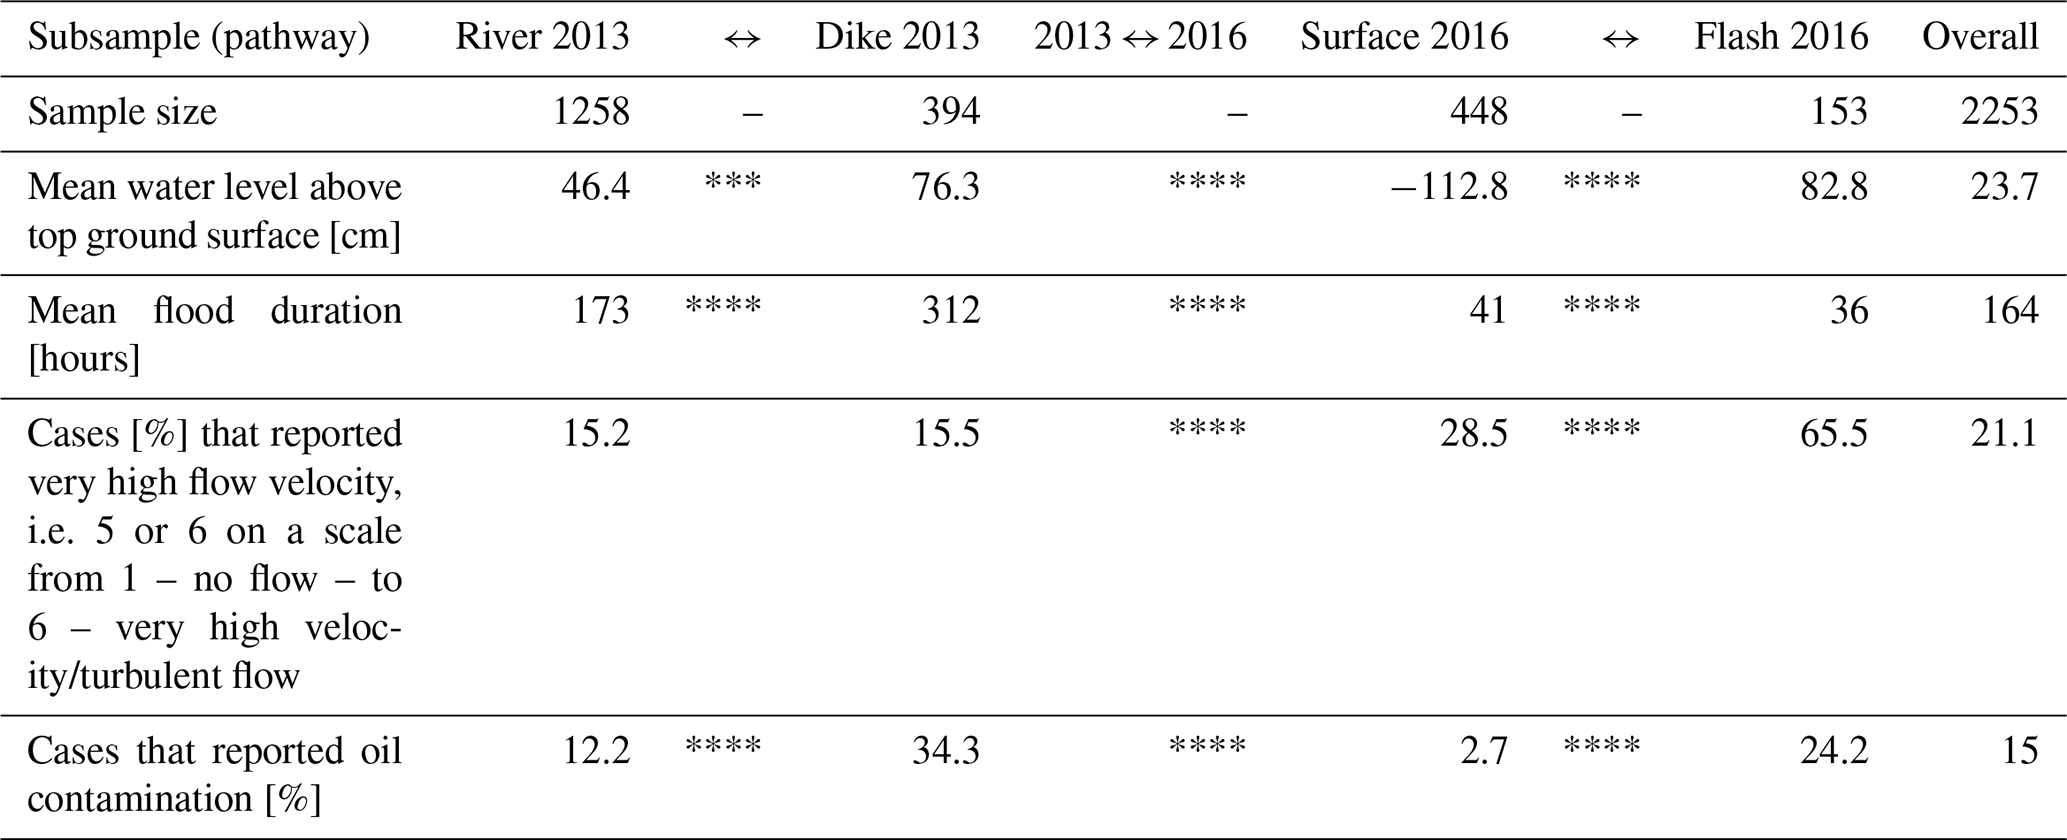
Percentage or means only regarding valid values, i.e. answered entries.
Comparison of subsets or 2013 to 2016 in the middle columns, with p value
ranges from Mann–Whitney–Wilcoxon or chi-square tests represented as follows:
“****” ≤0.001, “***” ≤0.005, “**” ≤0.01, “*” ≤0.05, “.” ≤0.1, “ ” ≤1.
4.2 Flood characteristics
The hydraulic impacts of the flood events on the affected buildings are presented in Table 2 in terms of water level, flood duration, flow velocity and the presence of contamination by oil, which all differ significantly between the events of 2013 and 2016, as well as within the two events (except for flow velocity in the case of the 2013 flood). There is a clear difference in water level from surface water floods, which mostly affected only the cellar of houses (indicated by negative values in Table 2), followed by river floods to cases of dike breaches and flash floods, which showed the highest mean water level. Negative average water levels, i.e. a water level below the ground surface, were also reported for pluvial and fluvial floods in 2005 (Rözer et al., 2016; Kienzler et al., 2015), a frequent river flood in 2011 (Kienzler et al., 2015), and the Danube area affected in 2002 (Thieken et al., 2007). Hence, the mean water level roughly reflects the intensity of the event.
Surface water and flash floods have considerably shorter durations than river floods and dike breaches (Table 2). This pattern is also noticed by Kienzler et al. (2015), given that floods in 2002, 2006 and 2011 with an average duration of more than 4 d had a predominance of riverine flood dynamics, whilst Rözer et al. (2016) found shorter durations, less than 1 d on average, for pluvial floods. This pattern of the pathways is reflected in our samples roughly confirming the approaches of how the subsamples of the pathways were created.
Of those who were affected by river floods or dike breaches only around 15 % reported a very high water velocity, i.e. a value of 5 or 6 on a scale from 1 to 6, in contrast to 65 % in the case of flash floods and 28 % in the case of surface water floods. The percentage of cases that reported oil contamination was the lowest in surface water floods (3 %), followed by river floods (12 %) and the flash flood subsample (24 %). The highest value (34 %) was reported by residents who were affected by dike breaches (see Table 2). A similar pattern is revealed for other contaminants like sewage, chemicals or petrol (Fig. 2).

Figure 2Contaminants in the flood water as reported by households affected by different flood pathways in 2013 and 2016 (multiple answers possible).
Altogether Table 2 illustrates that the people affected by different flood pathways had to cope with significantly different hazard situations, particularly in terms of water levels, flood duration and oil contamination. In addition, residents affected in 2016 by flash floods had to cope with high flow velocities. These findings confirm that our subsamples represent significantly differing flood pathways, while their socio-demographic characteristics differ comparatively little (see Sect. 4.1). The next section looks into the financial flood impacts and recovery before we address coping options and strategies.
Table 3Financial flood impacts, perceived recovery and psychological burden reported by households affected by different flood pathways in 2013 and 2016.
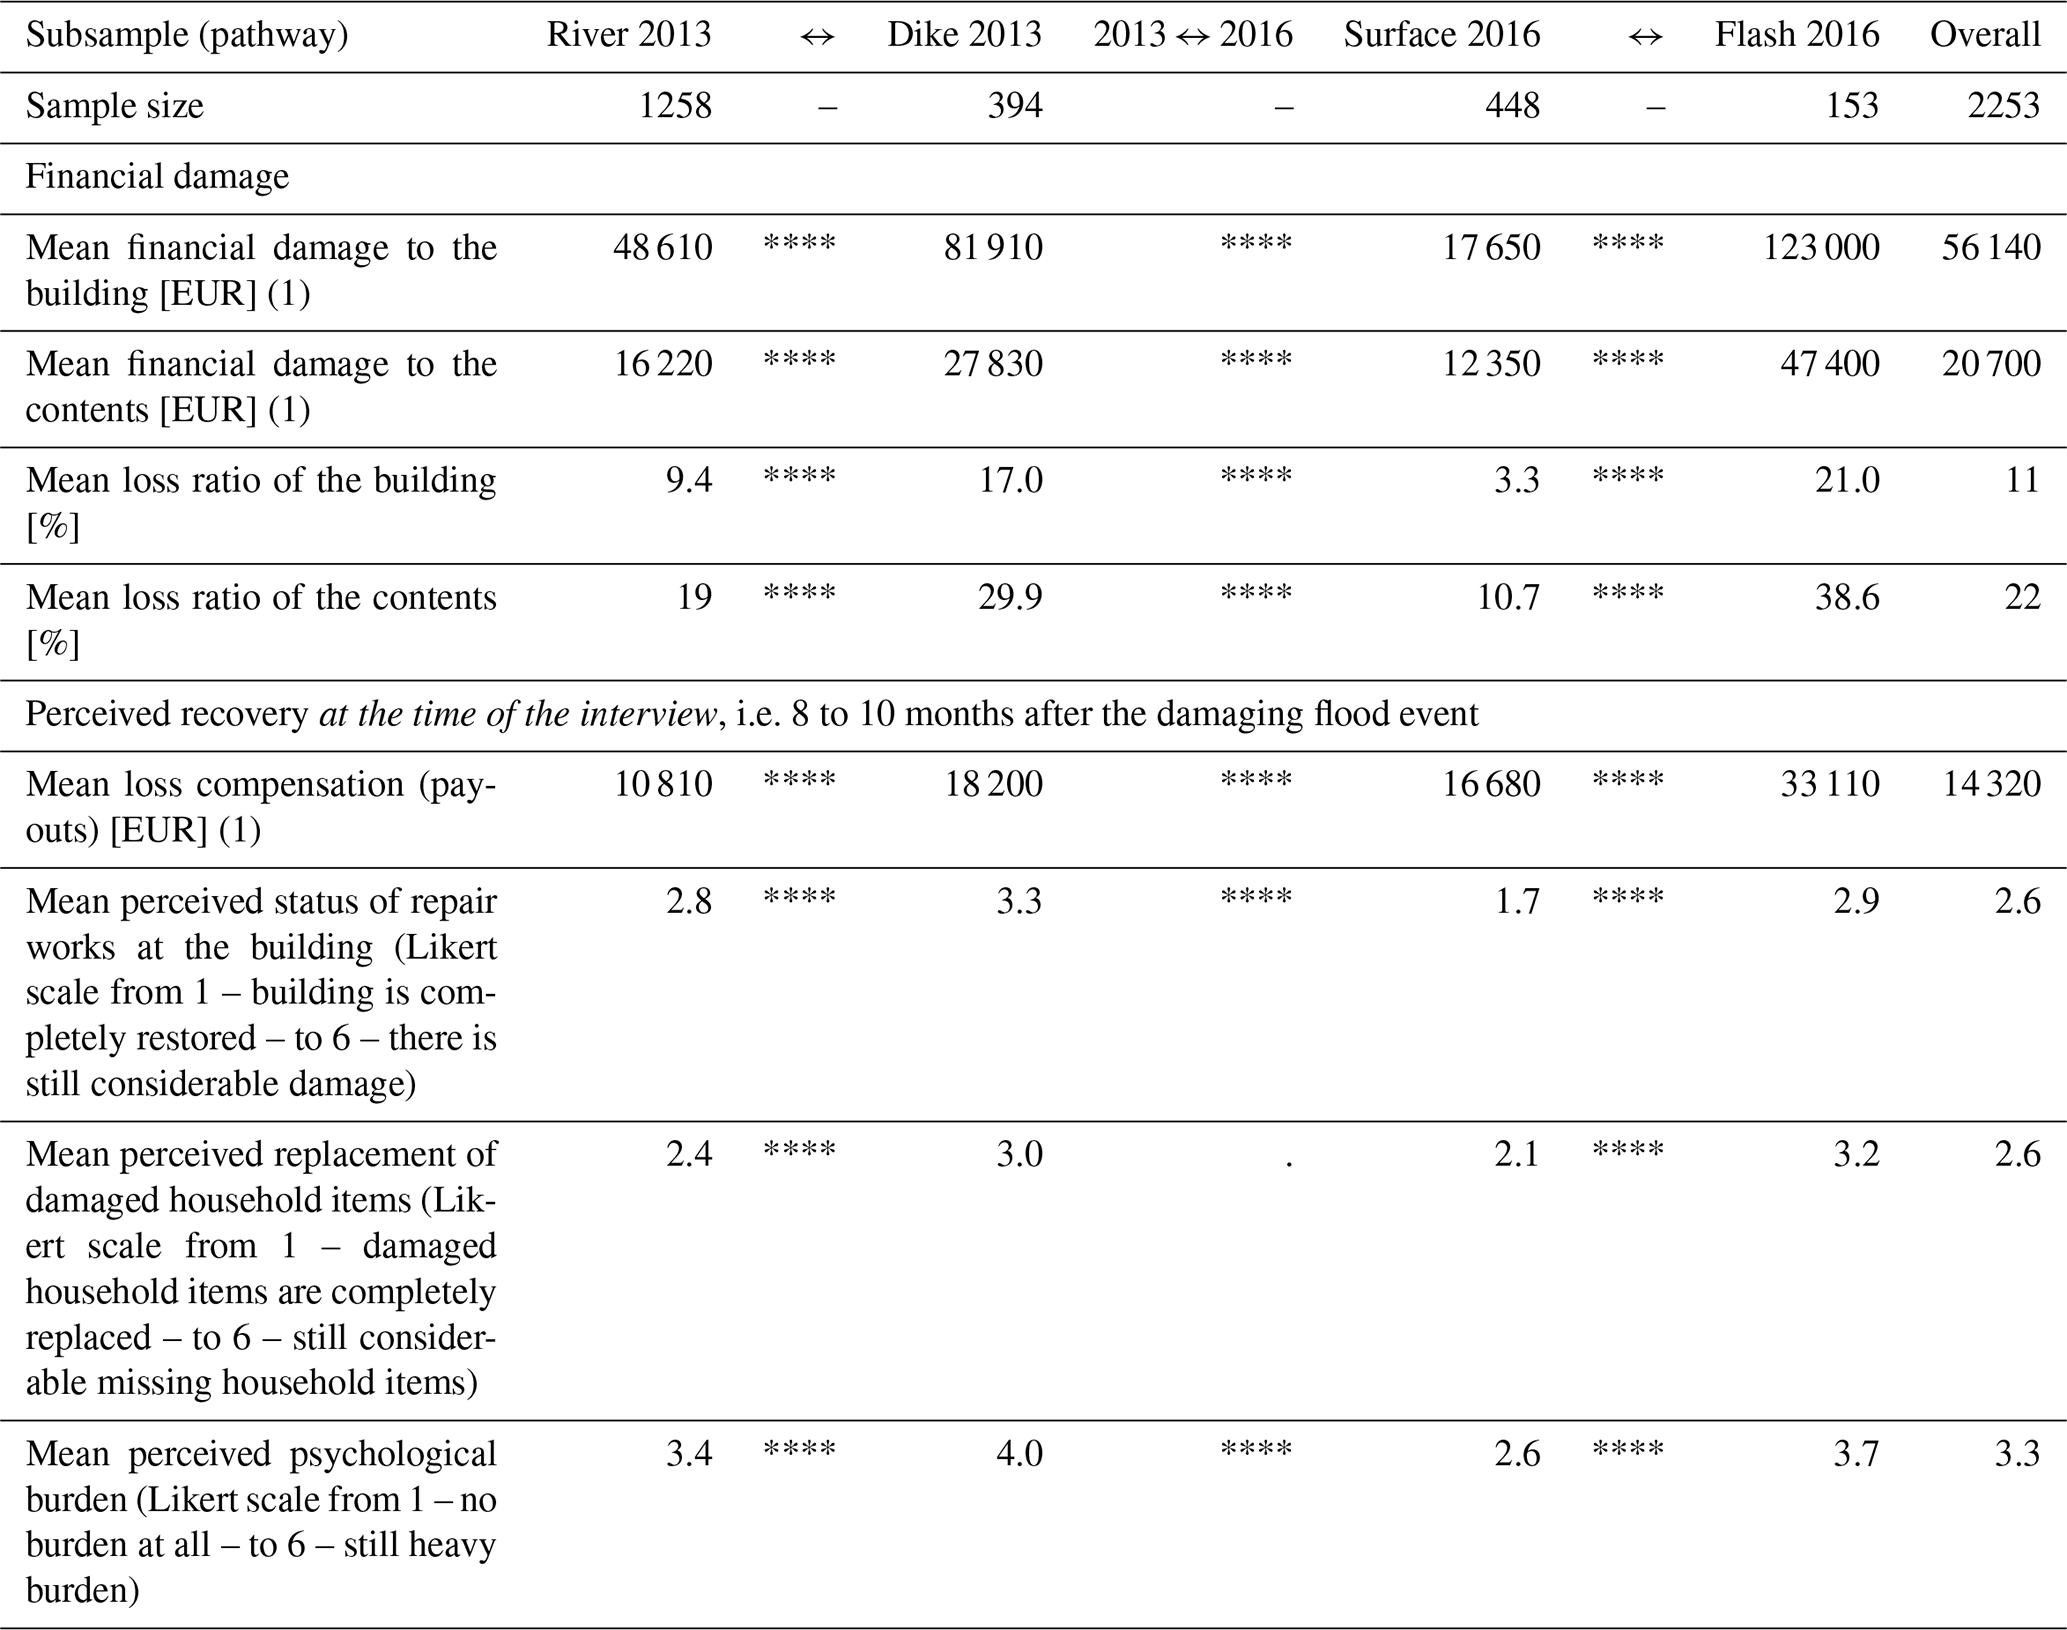
Percentage or means only regarding valid values, i.e. answered entries.
(1) In 2016 prices.
Comparison of subsets or 2013 to 2016 in the middle columns, with p value
ranges from Mann–Whitney–Wilcoxon or chi-square tests represented as follows:
“****” ≤0.001, “***” ≤0.005, “**”, ≤0.01, “*” ≤0.05, “.” ≤0.1, “ ” ≤1.
4.3 Financial flood impacts and perceived recovery
The average financial losses of buildings and household contents differ significantly between and within the flood events (Table 3). Here, the financial loss refers to the repair and replacement costs (in prices of 2016). Residents affected by flash floods suffered from the highest financial losses, in absolute numbers and in terms of loss ratios, followed by those affected by dike breaches and river floods. Losses caused by surface water flooding resulted in the lowest amounts (in absolute numbers, as well as with regard to loss ratios; see Table 3). Overall, the significant differences in the flood processes and the resulting hydraulic loads presented in Table 2 are reflected in the adverse effects of the floods.
To capture the status of recovery at the time of the survey, i.e. 8 to 10 months after the damage occurred, payments received to compensate losses were recorded. Further, respondents were asked to assess the accomplishment of the replacement of damaged household items or of the repair works at the damaged building on a Likert scale. On a similar scale, they were asked to assess the psychological burden the flood still had at the time of the survey. Table 3 reveals that all variables except for the perceived status of the replacement of damaged household items significantly differ between 2013 and 2016. In addition, there are highly significant differences between the pathways within the two events. In general, respondents affected in 2016 received higher payouts, assessed their recovery a bit better and felt less burdened than those affected in 2013. However, those who experienced a flash flood in 2016 recovered less and felt more burdened than those affected by surface water flooding. Similarly, residents affected by dike breaches in 2013 are worse off than those affected by river flood.
Altogether, the recovery status around 9 months after the damaging event is worse for households affected by the stronger pathways, i.e. dike breaches in 2013 or flash floods in 2016, compared to the low–medium pathways, i.e. river floods in 2013 or surface water floods in 2016. It should be noted that the financial damage was the most severe for flash floods, while the psychological burden and the perceived recovery were the worst for residents who experienced dike breaches in 2013, who are then followed by the flash flood cases (Table 3). Maybe the better recovery among severe cases in 2016 is owing to the stronger community resilience that was found to buffer psychological burden in Simbach and its surroundings (Masson et al., 2019) as cases from Simbach constitute almost 37 % of this subsample (57 of 153 cases). Therefore, this finding needs more cases studies for a confirmation. Furthermore, it is striking that the average payouts for loss compensation are – in relation to the mean financial losses – considerably higher for the cases affected by the 2016 floods in comparison to the 2013 flood. Again, this could be due to the local specifics, e.g. the high insurance penetration in Baden-Württemberg (GDV, 2020) and the compensation programme in Bavaria (Bavarian State Government, 2016).
In general, financial losses, recovery and psychological burden show highly significant differences between the two events, as well as between the pathways. Financial impacts and recovery tend to follow the severity pattern of the flood characteristics (i.e. the hydraulic impact variables shown in Table 2), particularly the water level, which is considered the most important variable that explains flood damage (e.g. Gerl et al., 2016; Vogel et al., 2018). Within each flood event, the stronger flood pathways, i.e. dike breaches and flash floods, show significantly higher values than their less severe counterparts (river and surface water floods). This supports the hypothesis that the overall (hydraulic) severity of a flood pathway is more important for the perceived psychological burden than the general flood type (see Laudan et al., 2020). The results further support studies that recommend developing pathway-specific loss models (Vogel et al., 2018; Mohor et al., 2020, 2021). At this point, the question arises of whether and to which degree flood pathways also govern coping options.
4.4 Short-term response as coping strategy: warning and emergency measures
There are several strategies to mitigate flood impacts, of which (1) preparedness and response in the case of an event, (2) damage mitigation by implementing property-level adaptation measures, and (3) risk transfer in terms of insurance coverage are the most relevant for residents (Driessen et al., 2016). The first strategy can also be described as reactive or short-term response, while the second is seen as a more proactive or long-term coping strategy (Neise and Revilla Diez, 2019). Insurance coverage does not primarily reduce damage but facilitates a quick recovery since financial losses are compensated; its interlinkage with property-level adaptation is not clear (e.g. Surminski and Thieken, 2017; Hudson et al., 2017, 2020). In this section, we focus on reactive responses, for which timely warning is an important pre-requisite (e.g. Penning-Rowsell and Green, 2000).
Table 4Characteristics of the warning process and emergency response as reported by households affected by different flood pathways in 2013 and 2016.
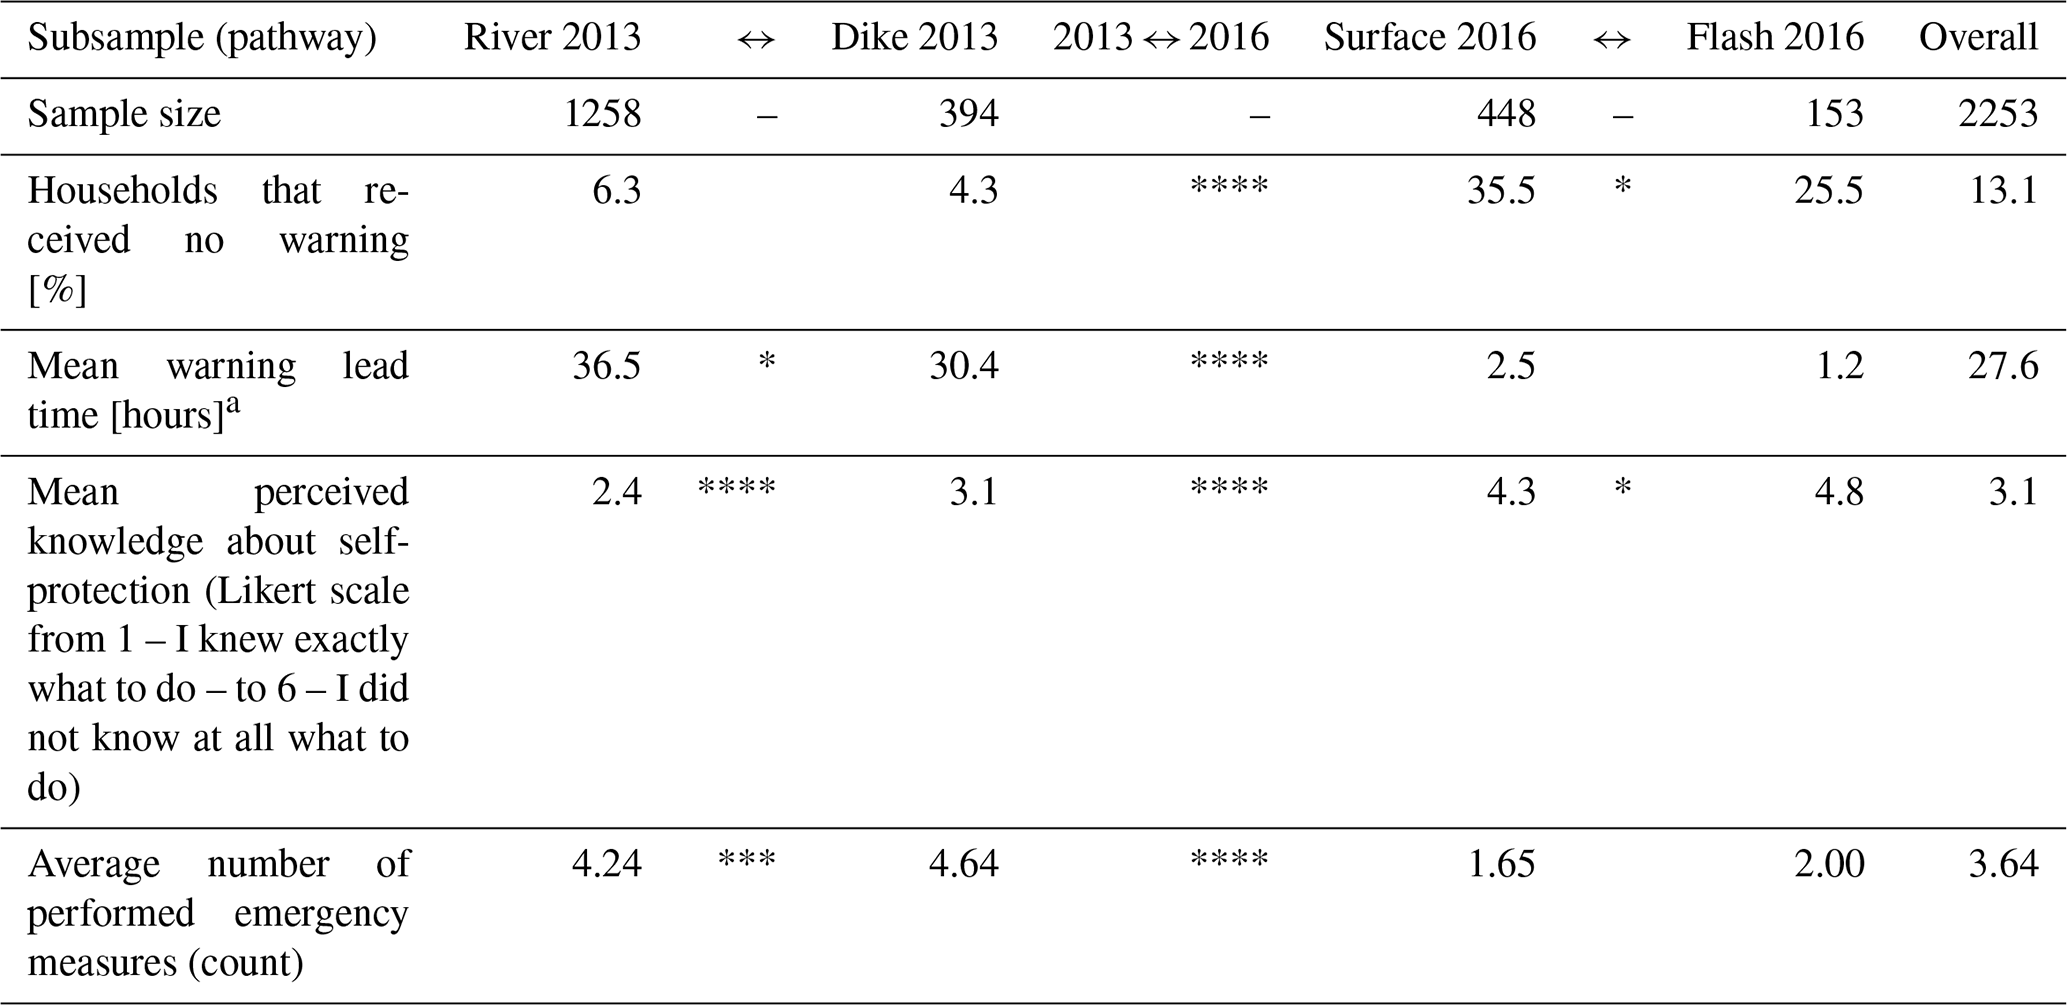
a Cases that received no warning were considered with a lead time of 0 hours.
Comparison of subsets or 2013 to 2016 in the middle columns, with p value ranges from Mann–Whitney–Wilcoxon or chi-square tests represented as follows: “****” ≤0.001, “***” ≤0.005, “**” ≤0.01, “*” ≤0.05, “.” ≤0.1, “ ” ≤1.
Table 4 reveals highly significant differences between the two flood events with regard to warning and emergency response. Residents affected by the 2013 flood were warned more often and at a considerably longer lead time in comparison to the 2016 event (Table 4). After the extreme flood event in 2002 in Germany, various initiatives and high investments had been undertaken to improve river flood risk management including early warning and preparedness, which had proven to be successful in 2013 (Thieken et al., 2016b; Kreibich et al., 2017).
Table 5Answers to the question “how did you become aware of the imminent danger of being flooded?” (multiple answers possible), given in percentage of all interviewed residents per subset and median lead time per subset.
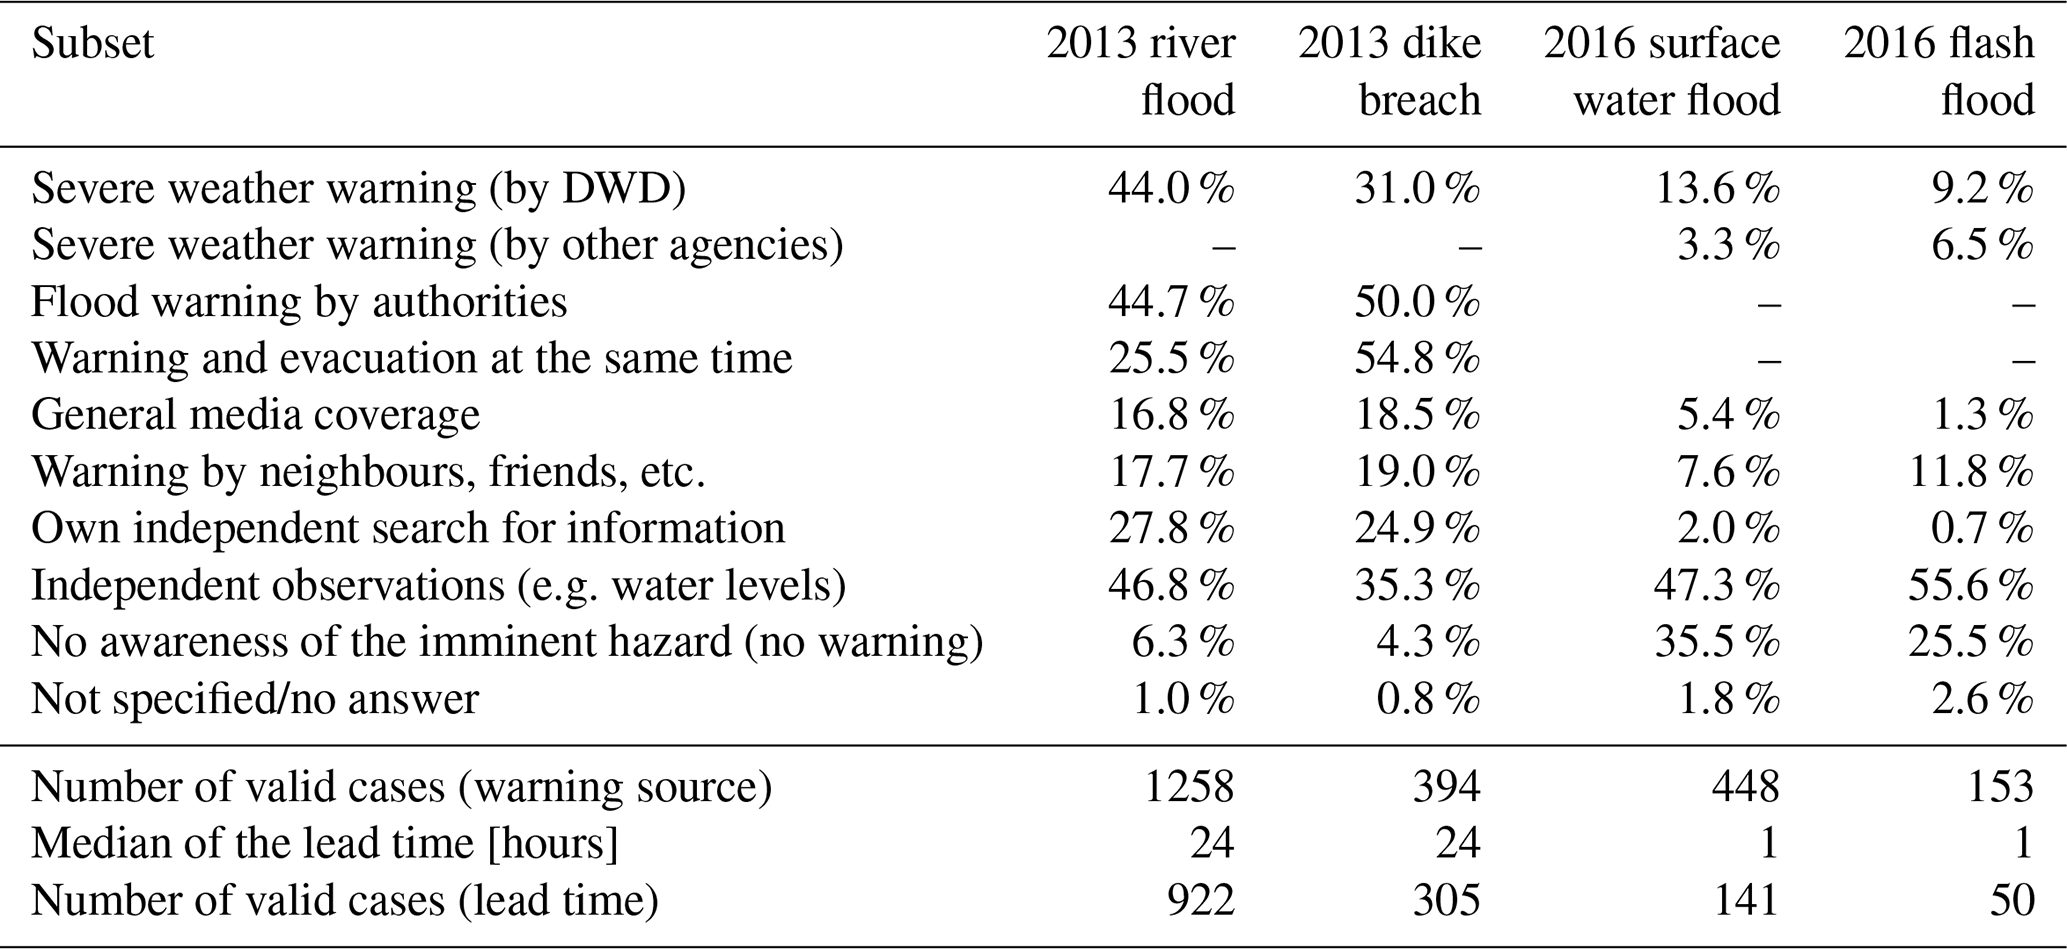
Table 5 provides more details on how people had become aware of the imminent flood danger underlining the huge differences between the two flood events. Considerably more residents who had been affected by the 2013 flood received official flood warnings than those in 2016: while 31 % to 55 % of the people affected in 2013 were warned by severe weather warnings, flood alerts or calls for evacuation, this applies to just 3 % to 14 % of those affected in 2016 (Table 5). It is striking that internal or independent observations play an important role in all four data subsets: one-third to more than half of the people per subsample reported that their own observations of, for example, cloud formations, heavy rainfall or rising water levels made them aware of the imminent flood danger (Table 5). However, while just 4 % to 6 % of the 2013 flood victims were not warned at all, this applies to 26 % to 36 % of people surveyed in 2016 (Tables 4 and 5).
These numbers reflect the current differences in the warning capabilities of river floods and convective storms or flash floods: while river floods, particularly at reaches downstream, can be forecasted several days in advance, forecasting convective storms that cause pluvial flooding is more challenging due to the dynamic formation of convective cells. Moreover, small creeks are often ungauged and not included in the regional flood monitoring and forecasting system of the federal state but may experience unexpected flash floods and inundations. Hence, lead times are restricted to a few hours, if at all (Merz et al., 2020). This is illustrated by the average lead time that is particularly short for the flash floods in 2016 (Table 4). The median values suggest that 50 % of the people affected in 2013 were warned at least 24 hours before the water entered their home, while this value drops to just 1 h for the 2016 subsets (Table 5), which contain maximum lead times of 24 h in the surface water subset (20 cases from 14 different places) and maximum lead times of 12 h in the flash flood subset (three cases from three different places). For the pathway dike breach, which is characterized by stronger and unforeseen flooding, the mean lead time is significantly different from the mean value for river floods (Table 4), indicating that dike breaches pose an additional challenge on timely and informative warnings, and hence time-critical situations may arise in the hinterland of dikes. The fact that the percentages of people who were not warned and – to a lesser degree – the lead times do not differ (highly) significantly between the flood pathways but between the events underlines that warning possibilities and capacities are primarily governed by the overall flood type (fluvial versus pluvial) or the triggering atmospheric pattern, while knowledge and emergency response are additionally influenced by the pathway, particularly in 2013 (Table 4).
Residents affected by river floods in 2013 knew much better how to protect themselves from flooding than people affected in 2016 (Table 4). In addition, the values of the perceived response knowledge indicate highly significant differences within the event of 2013, suggesting that people affected by dike breaches had to cope not only with shorter lead times but were more often unaware of what they could do to mitigate losses and protect their lives. Knowledge about adequate behaviour is, however, an important pre-requisite for loss mitigation (Kreibich et al., 2021). Within the 2016 event differences are smaller but indicate that people affected by flash flood were less informed and less prepared (Table 4). In detail, the percentage of well-informed people who chose a 1 or 2 when asked how well they knew how to protect themselves and their household from flood impacts on a scale from 1 to 6 drops from 65 % for river floods in 2013 to 48 % in the subset containing dike breaches and even to 24 % for cases with surface water flooding in 2016 and 15 % for flash floods in 2016. This pattern indicates shortcomings in crisis and risk communication with respect to pluvial flooding in general and flash floods in particular, but it could also be influenced by previously experienced flooding and associated learning effects (see Sect. 4.6).
The different warning capabilities and the different levels of perceived response knowledge are further reflected in the responsive behaviour during the events: residents affected in 2013 undertook a significantly higher number of emergency measures, namely around four or five, than those affected in 2016 with one or two measures on average, while there are no differences between pathways in 2016 (Table 4).
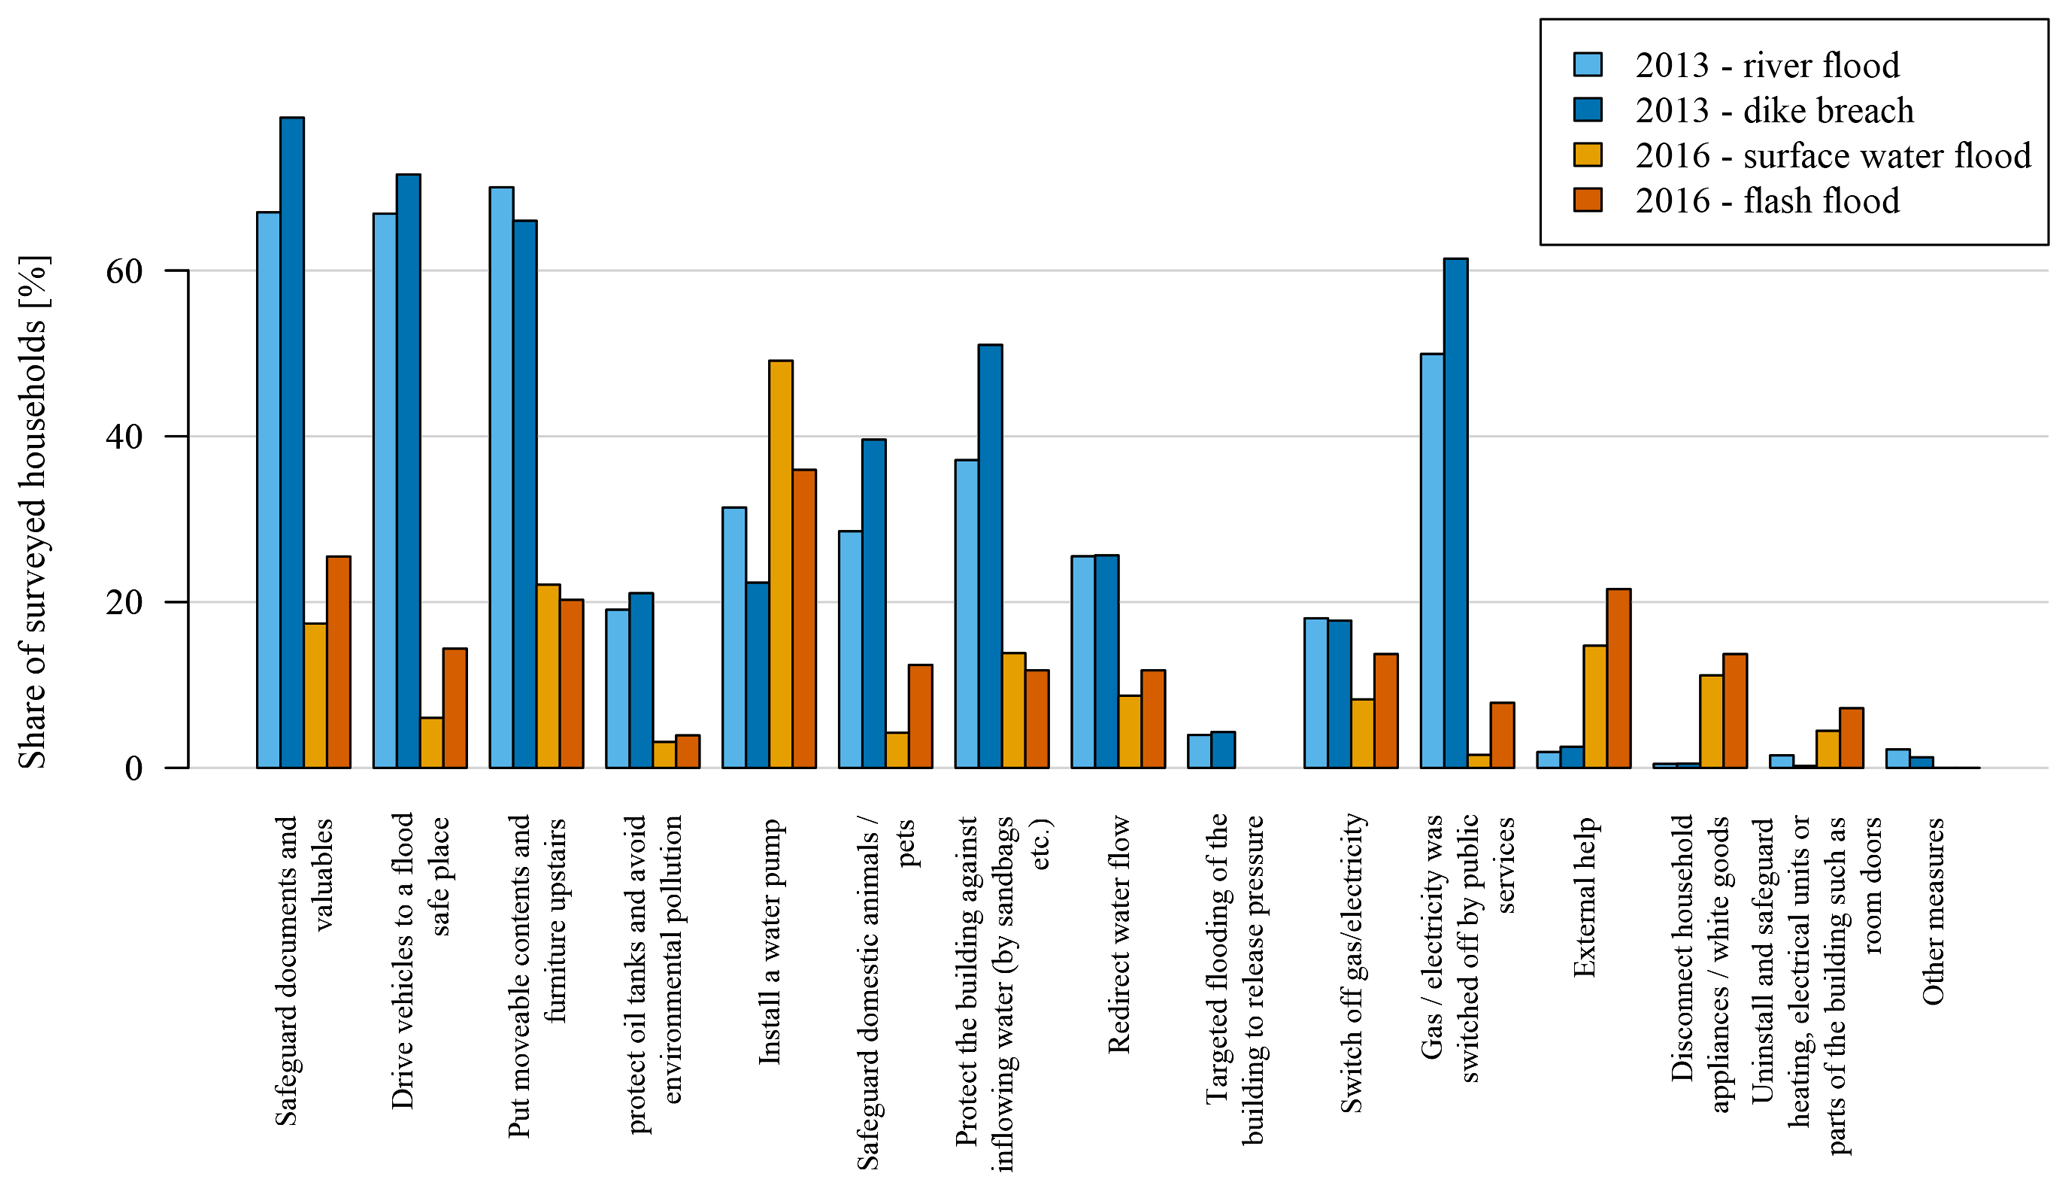
Figure 3Performed emergency measures before and during the event as reported by households affected by different flood pathways in 2013 and 2016 (multiple answers possible).
To get a clearer picture, Fig. 3 shows what kind of emergency measures were undertaken. While residents affected by fluvial flooding in 2013 performed a variety of measures, residents affected in 2016 relied mostly on water pumps. Further, it should be noted that in the case of fluvial floods electricity and natural gas are more often switched off centrally, while those affected by pluvial floods have to take care of it on their own, which poses further risks of electrocution in the case that a person enters the water.
Overall, the analyses illustrate that residents in areas that are prone to river flooding were provided with better and timely warning information in 2013. Together with their higher level of response knowledge, they were capable of performing more emergency measures than residents affected in 2016. Since emergency response seems to be an effective coping strategy for pluvial flooding, particularly due to their relative low water depths (Rözer et al., 2016; Spekkers et al., 2017), our analysis highlights that there is room for improving not only early warning but also communicating potential measures and adequate behaviour in the case of pluvial flooding in general. Table 4 and Fig. 3 further reveal that residents affected by dike breaches tend to perform more emergency measures, although they have less knowledge and shorter lead times. The resulting damage (Table 3) shows that this strategy probably only mitigates a small amount of damage. Hence, more studies on the efficacy of emergency measures are needed.
4.5 Long-term response as coping strategy: performance of property-level flood adaptation before and after the floods
Besides emergency response in the case of an event, there are various proactive precautionary (or adaptive) measures that can reduce flood losses (e.g. Kreibich et al., 2015; Attems et al., 2020a). Both surveys included questions on the actual and intended implementation of property-level flood adaptation. In particular, respondents were asked to state whether they had implemented a specific measure before or after the event, are planning to do so within the next 6 months, or do not intend to implement that measure. In total, 16 measures were considered, four of which comprised informative measures (search for information about the flood risk or adaptation options, attendance of flood seminars, or participation in neighbourhood networks). Another six measures addressed non-structural adaptation (flood-adapted building use, flood-adapted interiors and avoidance of noxious liquids in the cellar, e.g. petrol, paint), which also included measures that improve preparedness (purchase of a water pump or an emergency power generator or existence of an emergency plan and box). Insurance coverage was treated separately. Finally, the implementation of five structural measures was studied (i.e. relocating heating and electricity, securing heat and oil tanks, improving the flood safety of the building, installing a backflow preventer or water barriers); commonly, structural measures can be implemented by homeowners only.
Table 6Property-level adaptation before and after damaging floods as reported by households affected by different flood pathways in 2013 and 2016.
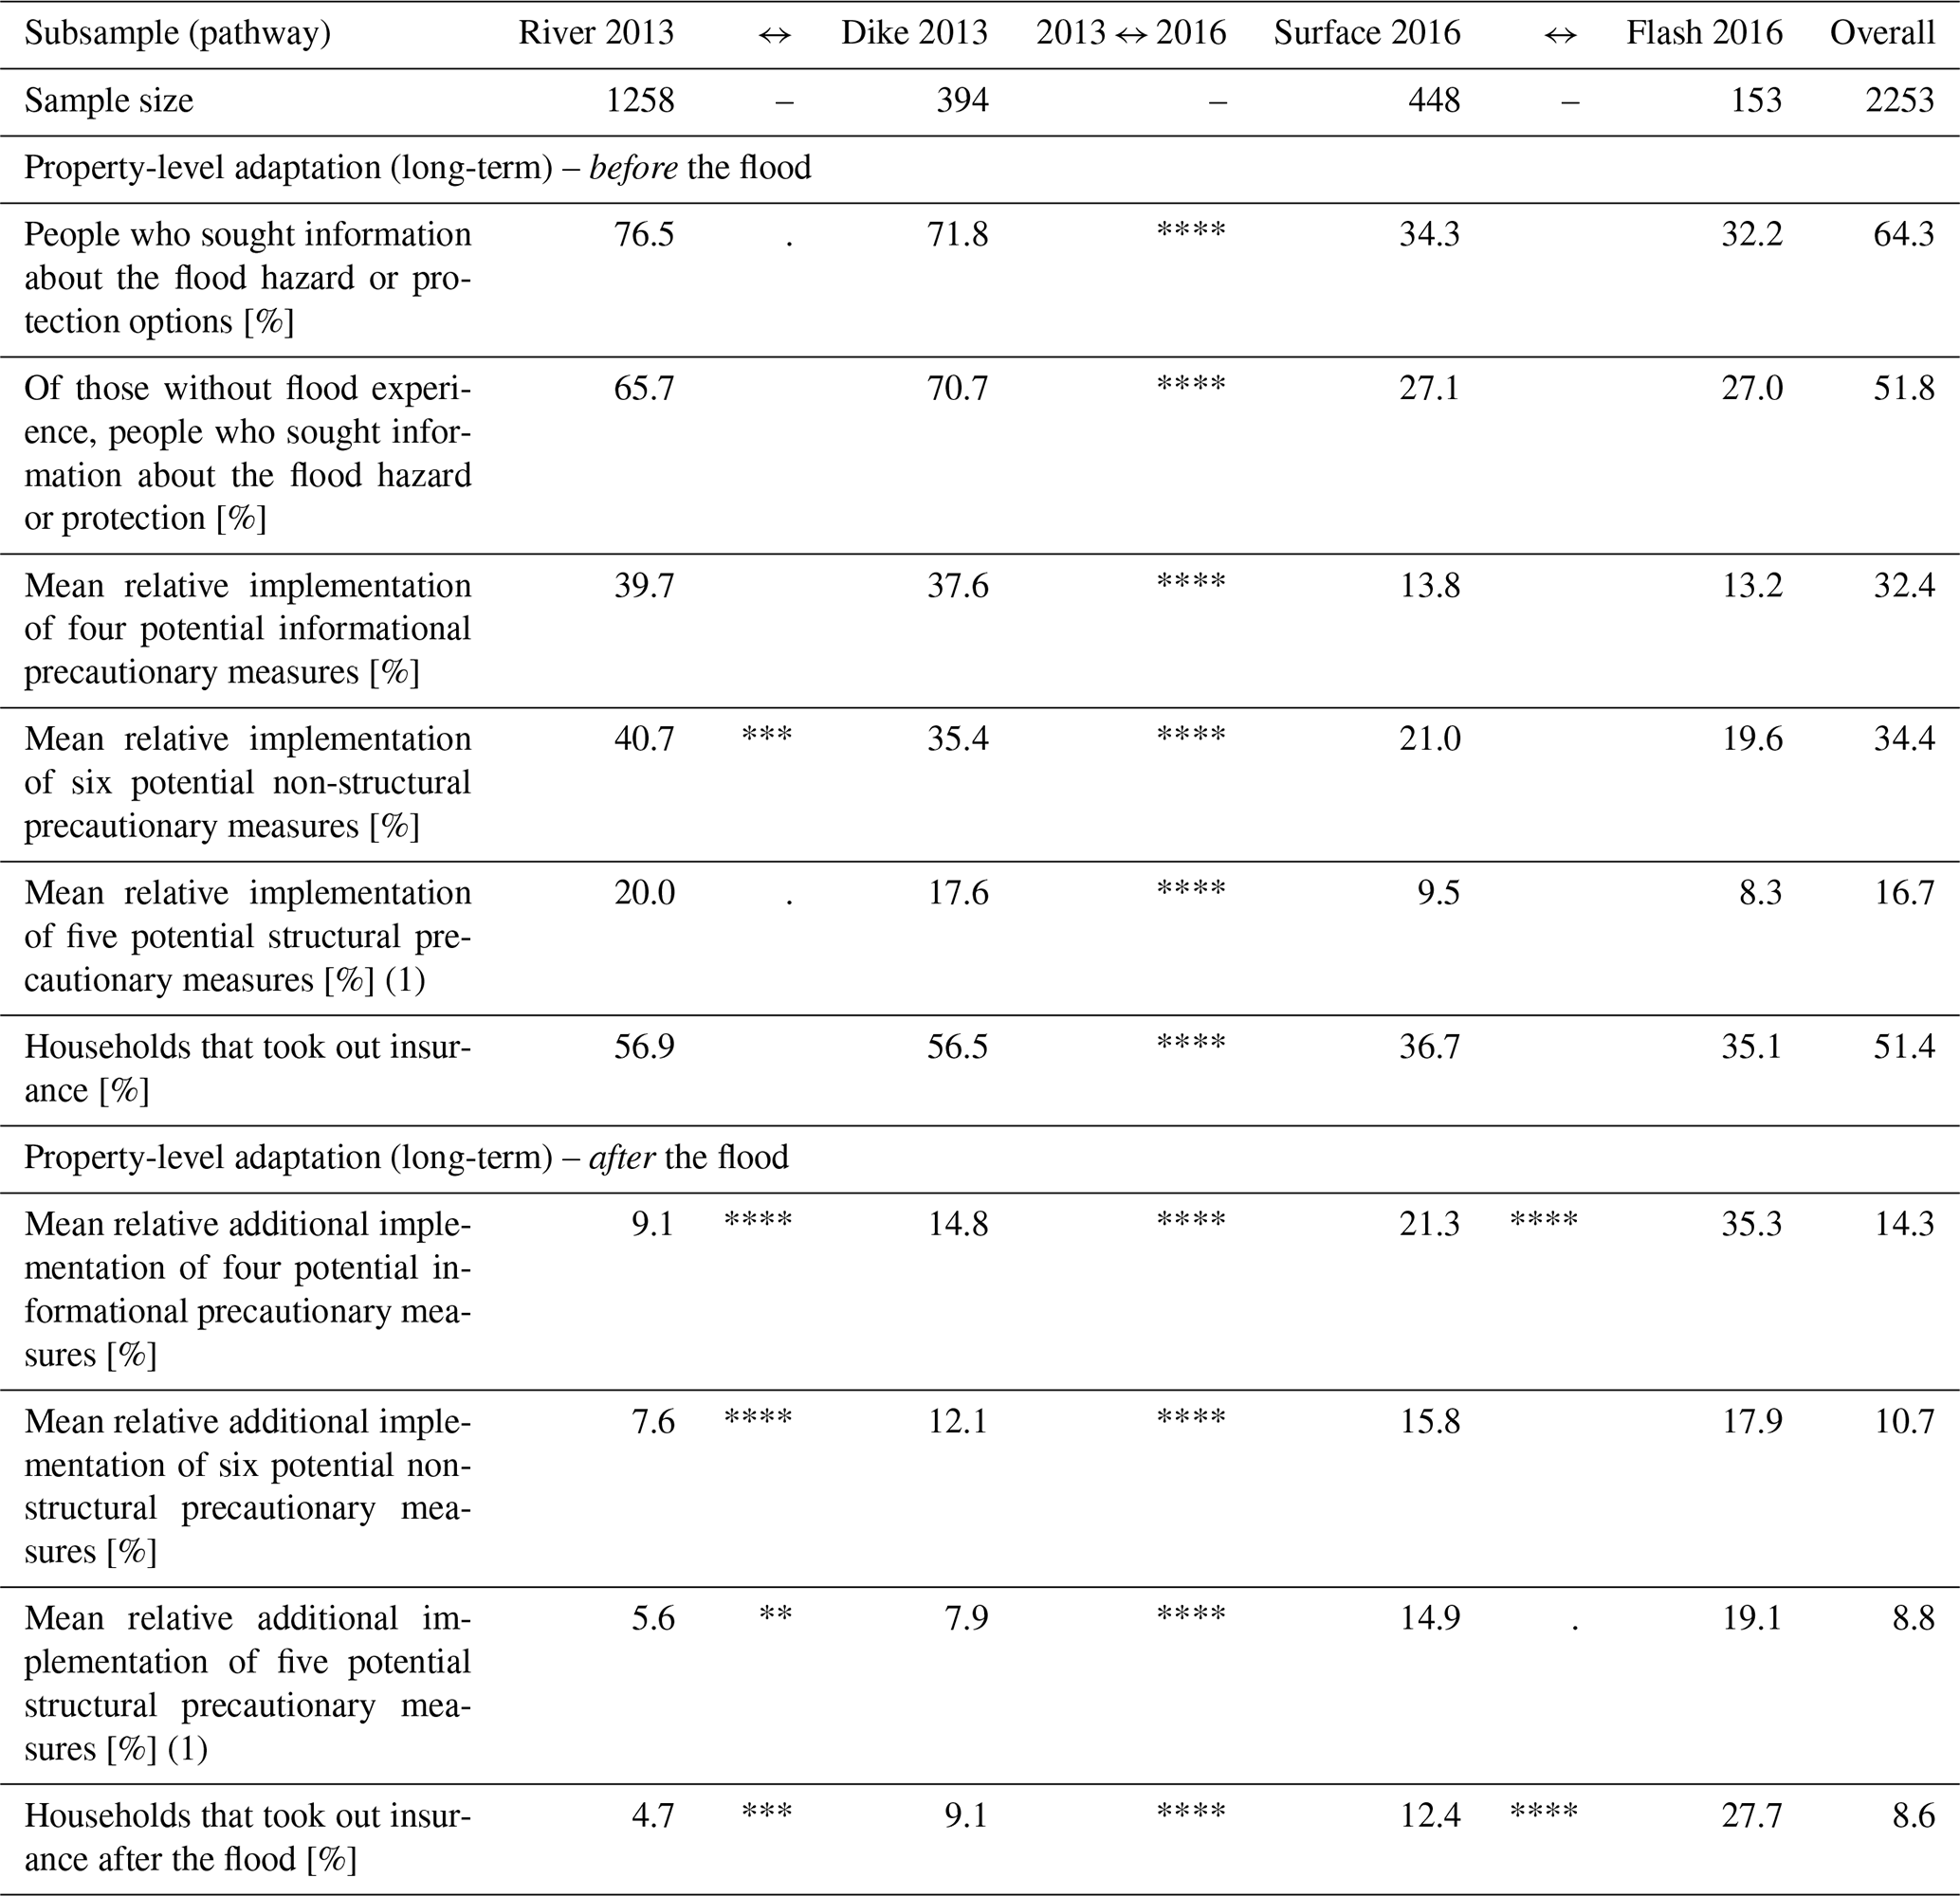
Percentage or means only regarding valid values, i.e. answered entries.
(1) Only among homeowners.
Comparison of subsets or 2013 to 2016 in the middle columns, with p value
ranges from Mann–Whitney–Wilcoxon or chi-square tests represented as follows:
“****” ≤0.001, “***” ≤0.005, “**” ≤0.01, “*” ≤0.05, “.” ≤0.1, “ ” ≤1.
In Table 6 the mean relative implementation per category is presented for the situation before the damaging flood and around 9 months later. To calculate the relative implementation, the total count per category was normalized by the count of possible measures per category, i.e. a person who had implemented all five structural measures got the value 1, a person who had only secured the heat and oil tank and implemented a backflow preventer received 0.4 (). The values in Table 6 correspond to the average relative implementation of the measures per category per subsample. It should be noted that only property owners were asked about the five structural measures.
Table 6 reveals that adaptive behaviour before the floods was significantly different between the two flood events. In all categories, i.e. informative, non-structural and structural measures, as well as insurance, people affected in 2013 were better adapted to the flood risk than residents affected in 2016. In most categories, the values for 2013 are around twice as high as in 2016. With regard to the different pathways, there are no differences in the 2016 cases, while in the 2013 samples there is a significant difference with regard to non-structural adaptation and a slight difference in structural adaptation. Hence, people affected by dike breaches in 2013 were less adapted than those affected by river floods (Table 6).
After the flood, the adaptation status and the differences between and within flood events changed considerably, revealing a pathway-specific behaviour. Table 6 confirms a boost of information-seeking behaviour in all subsets with, however, a varying degree: people affected by flash floods in 2016 searched most frequently for additional information on flood risk and mitigation options, followed by residents affected by surface water flooding in 2016, dike breaches in 2013 and river floods in 2013 (Table 6).
If we sum up the mean relative implementation of informational precaution before and after the floods, people affected by dike breaches performed best (52 % mean implementation), followed by river floods in 2013 and flash floods in 2016 (49 % mean implementation each) and surface water floods in 2016 (just 35 % mean implementation). This pattern persists when intended information-seeking behaviour is included (Fig. 4) and illustrates that particularly severe flood pathways and impacts trigger information-seeking behaviour.
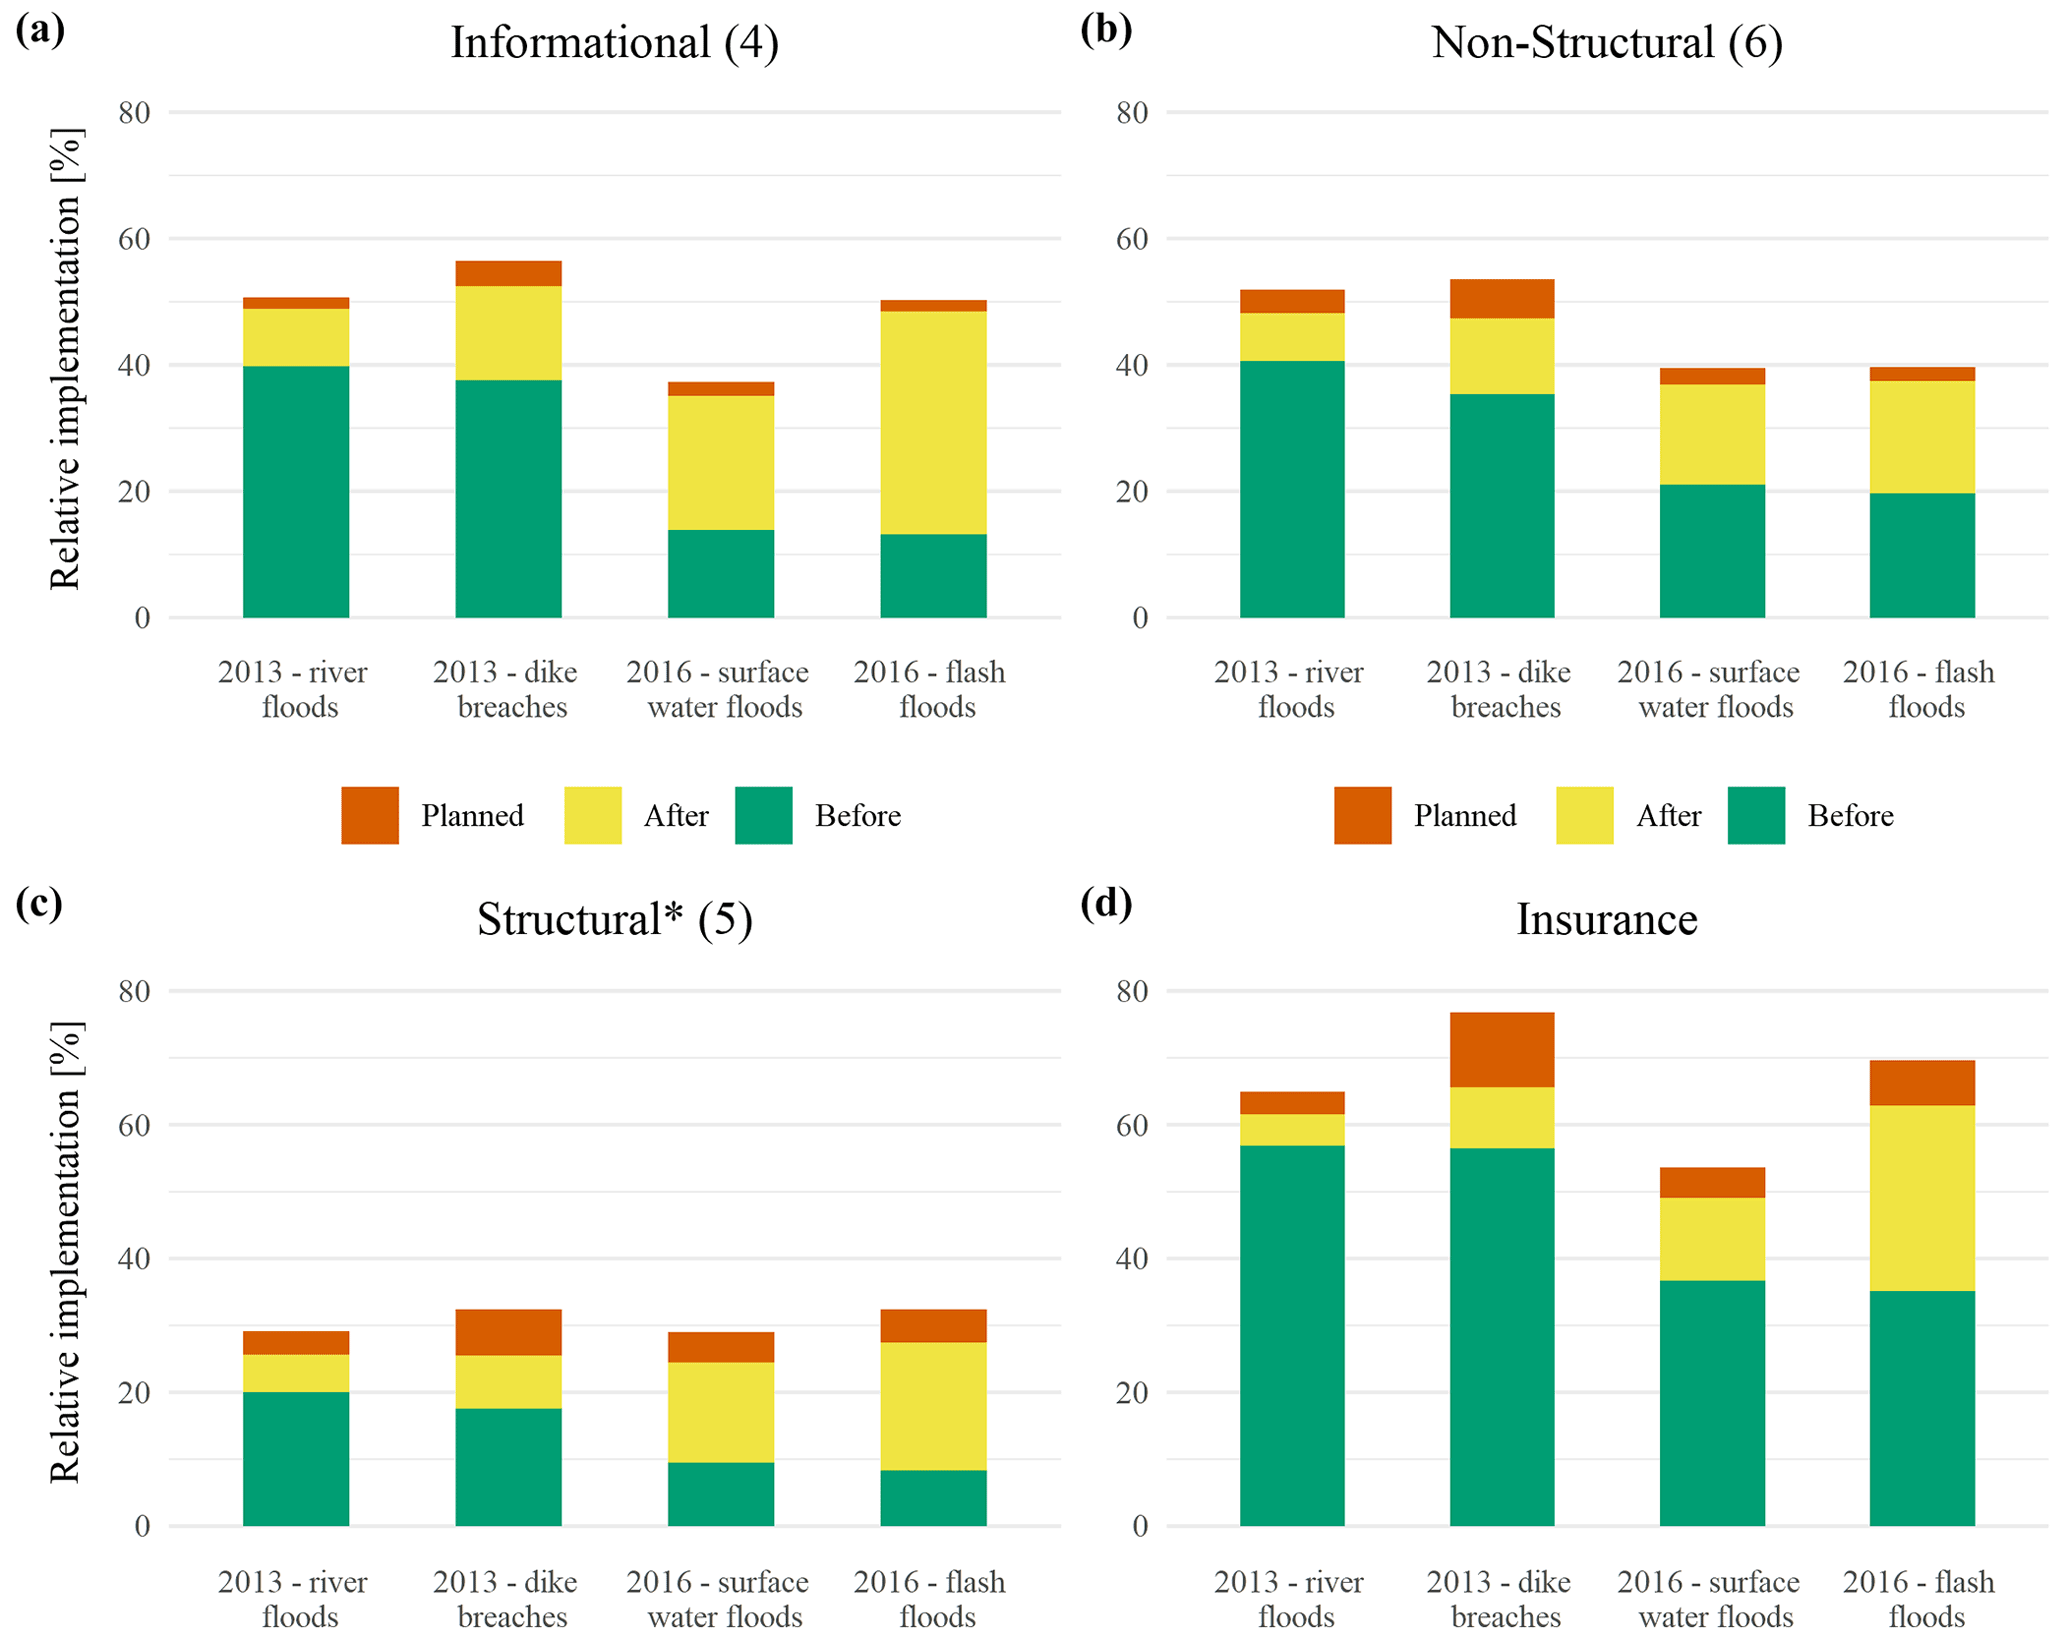
Figure 4Cumulative mean relative implementation of adaptation, including measures that were (at the time of the survey) planned to be implemented within the next 6 months (* surveyed only among homeowners).
When it comes to the implementation of non-structural and structural measures or to the conclusion of an insurance policy, the additional mean implementation follows – in principle – a pattern similar to the information-seeking behaviour: residents affected in 2016 implemented the most additional measures, followed by those affected by dike breaches in 2013 and river floods in 2013 (Table 6). This might also be due to the fact that more people affected by river floods in 2013 had already implemented measures before the flood, so the perceived necessity for further improvement after the flood was not as high as among residents affected in 2016.
Considering that the subgroups started at very different levels of adaptation before the events struck, the cumulative implementation depicted in Fig. 4 reveals that non-structural measures are more popular along rivers, i.e. among those affected in 2013. On average, a relative implementation of 50 % of a total of six measures is reached, meaning that on average three measures have been implemented per affected household, in contrast to around 40 % or 2.4 measures in the case of the 2016 subsamples (Fig. 4b). Maybe this is due to a higher risk perception of fluvial floods in contrast to pluvial floods.
Interestingly, the cumulative implementation of structural adaptation measures reaches a similar level across all four flood pathways, though they have the overall lowest numbers in comparison to the other categories: around 9 months after the floods a mean implementation of around 25 % (or 1.3 measures) is reported in all four subsamples and inches up to 30 % (or 1.5 measures) if intended adaptation is included (Fig. 4c). This pattern was described before for fluvial floods (Thieken et al., 2007; Kienzler et al., 2015) and pluvial floods (Rözer et al., 2016), for which structural measures such as sealing the basement, relocating heating or electrical utilities to higher stories, changing the heating system, or protecting the oil tank had been identified as the least popular measures. Most likely this is due to the higher costs of structural measures and the fact that the property owner has to implement them.
The conclusion of insurance reflects the pattern of the information-seeking behaviour (Table 6, Fig. 4d) and highlights that particularly people who experienced severe flood pathways strive for a backstop. In addition, the severity of the flood processes and their impacts might cause a lower appraisal of the efficacy of adaptive measures on the property level. Therefore, the next section finally looks at perceptions.
Table 7Previously experienced flooding and perceptions on risk and property-level adaptation of households affected by different flood pathways in 2013 and 2016.
Percentage or means only regarding valid values, i.e. answered entries.
Comparison of subsets or 2013 to 2016 in the middle columns, with p value
ranges from Mann–Whitney–Wilcoxon or chi-square tests represented as follows:
“****” ≤0.001, “***” ≤0.005, “**” ≤0.01, “*” ≤0.05, “.” ≤0.1, “ ” ≤1.
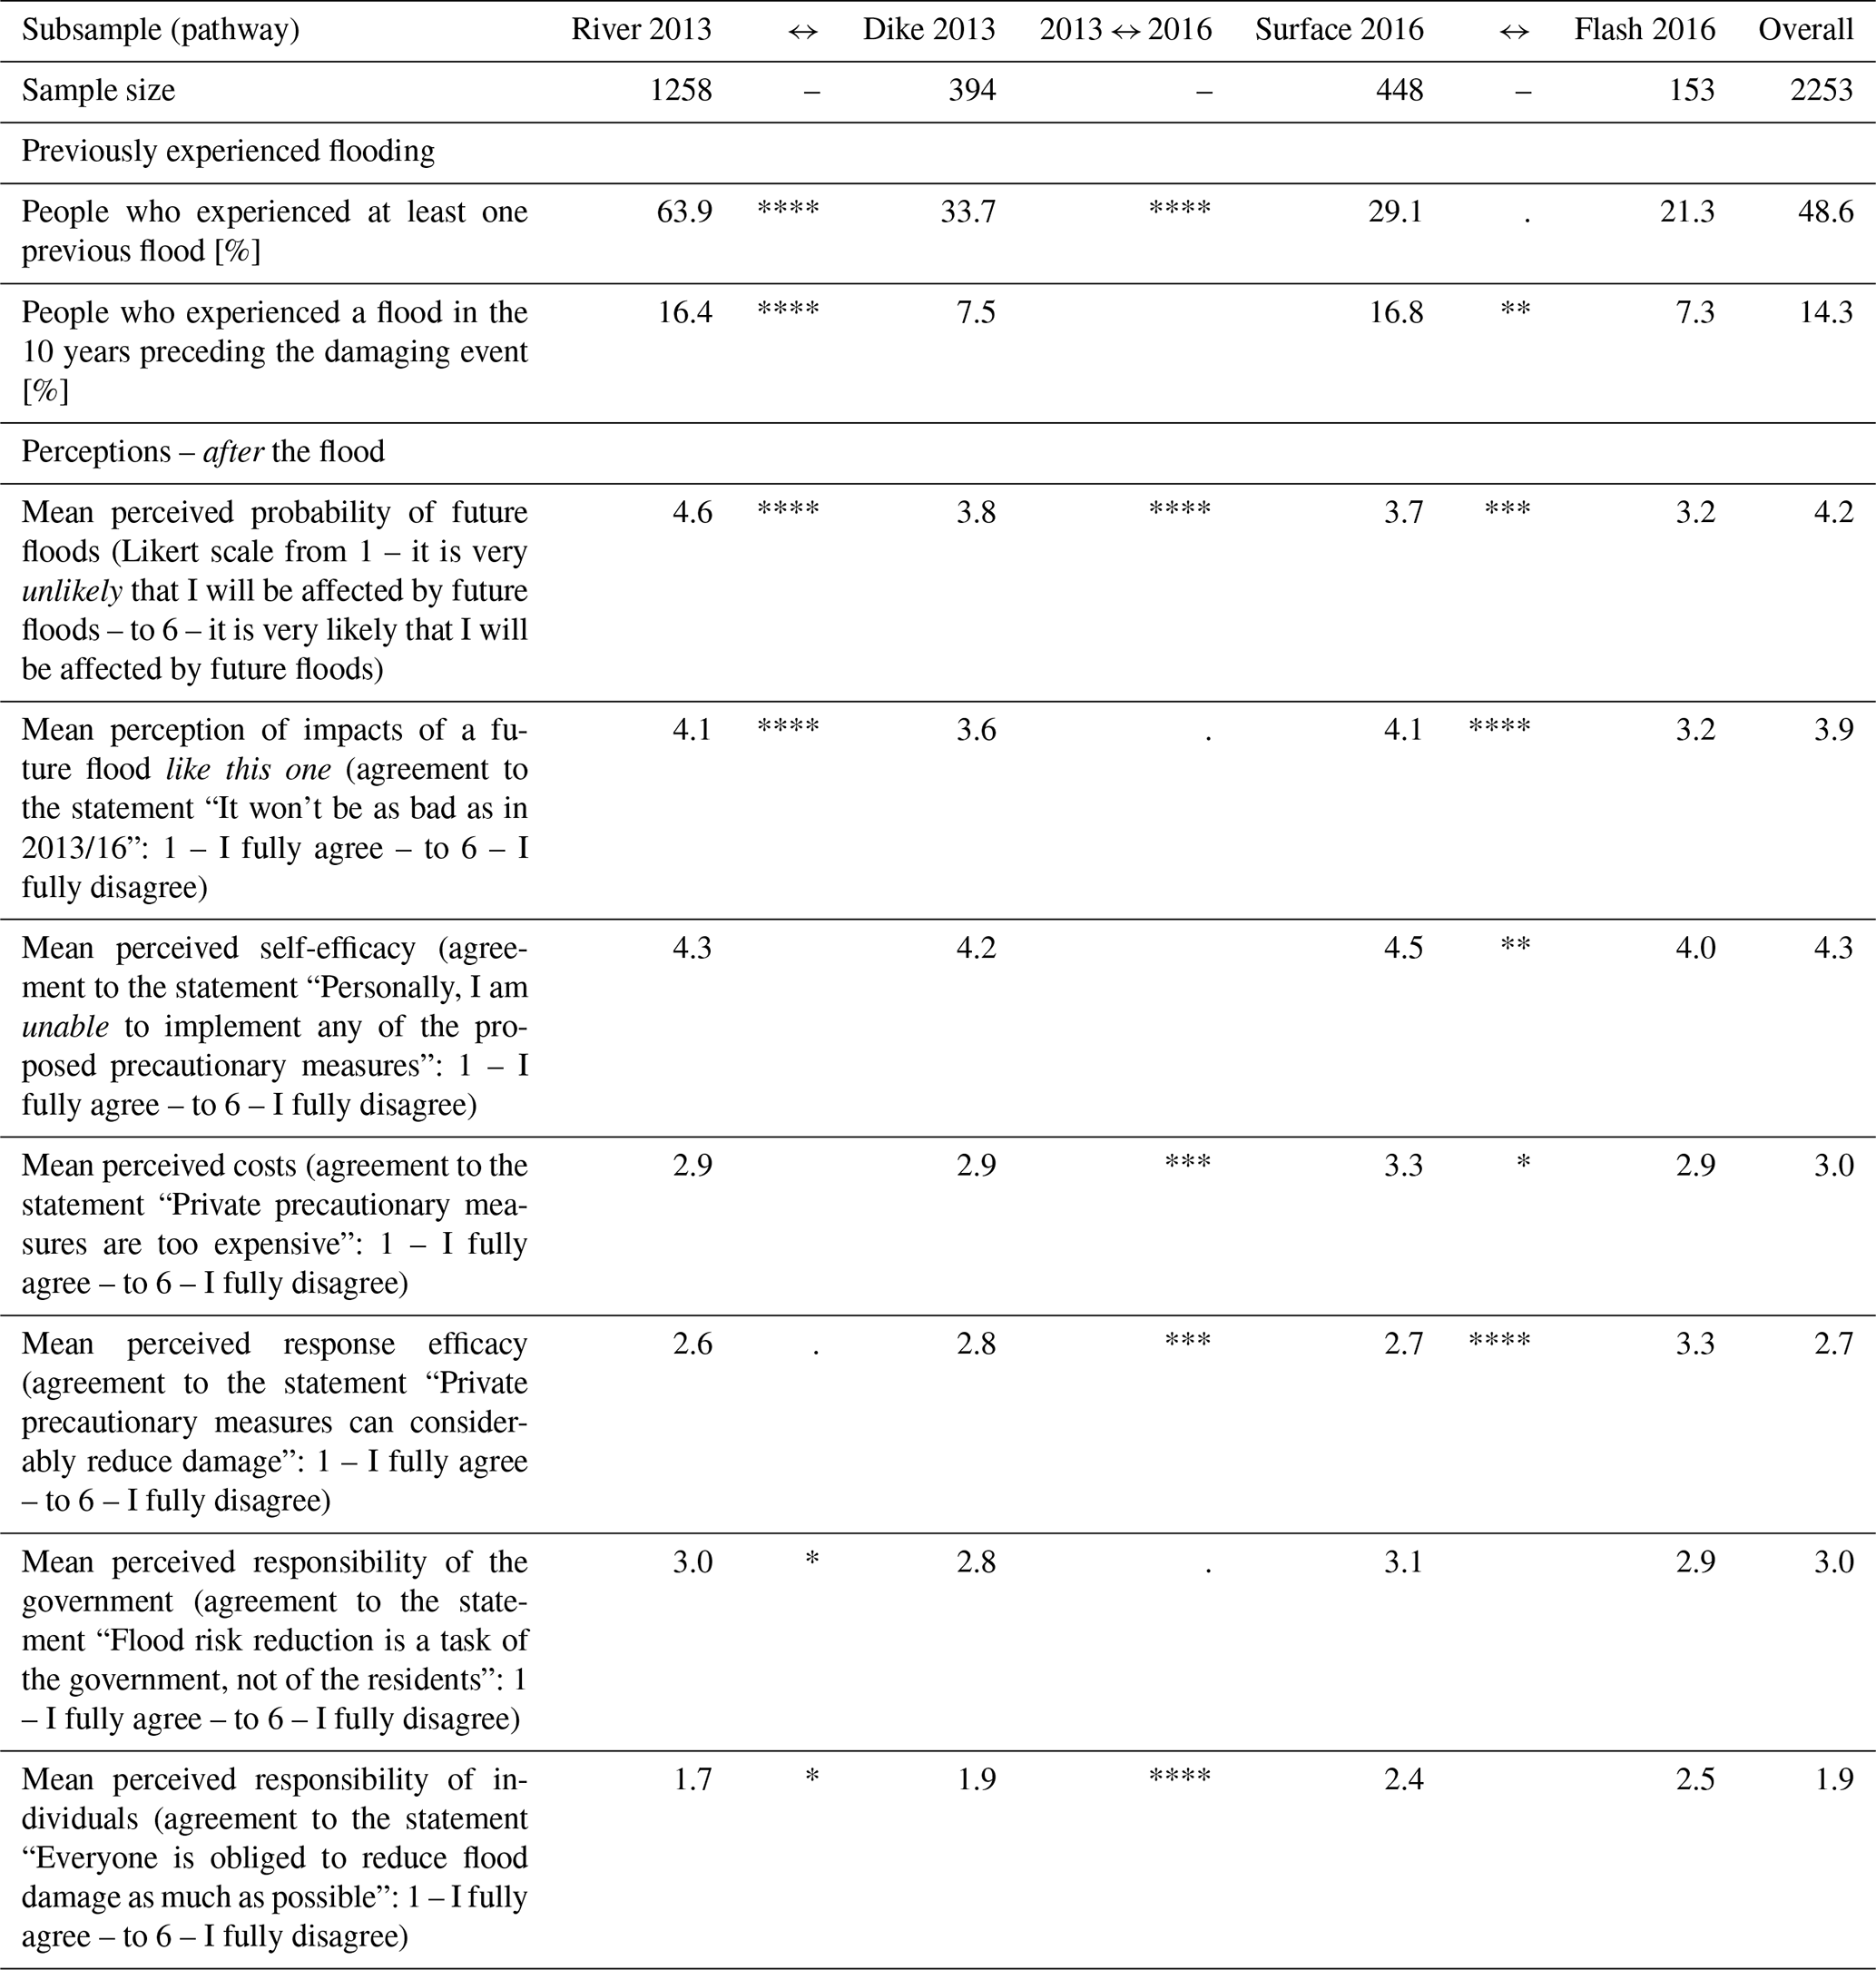
4.6 Previously experienced flooding and risk perceptions
Since previous flood experience impacts risk perceptions and influences adaptive behaviour (e.g. Bubeck et al., 2012), Table 7 summarizes related outcomes. There are significant differences with regard to previously experienced flooding between and within the events. Most households affected by river floods in 2013, i.e. 64 %, had been affected previously. This percentage is much lower in the subset on dike breaches in 2013 (34 %), as well as on surface water floods in 2016 (29 %) and flash floods (only 21 %; Table 7). As noted by Kienzler et al. (2015), having experienced river floods has considerably changed after the 2002 flood, whilst there is a lower percentage among those affected by pluvial floods, which was also observed by Spekkers et al. (2017), who reported that just 21 % of households surveyed in the city of Münster had been flooded before the severe pluvial flood of July 2014.
However, among all surveyed households, less than 15 % had experienced a flood in the 10 years preceding the events that are studied in this paper, with a distinction between the stronger pathways (8 % for 2013 dike breach and 7 % for the 2016 flash flood subsamples) and the low–medium flood pathways (16 % for 2013 river and 17 % for 2016 surface water flood subsamples; see Table 7). Altogether, residents that were affected by flash floods in 2016 were the least experienced with flooding. It is remarkable that the highly significant differences in previously experienced floods between the two events vanish when just the preceding 10 years are taken into account, while the differences within the events, i.e. between the different pathways, remain (Table 7).
With regard to various perceptions, it is striking that there are no to just small differences between the events and the pathways with regard to perceived self-efficacy and the perceived responsibility of the government (Table 7). A comparison with other regions and data could reveal whether the reported values could be regarded as representative mean perception or as a kind of benchmark. Particularly, self-efficacy is seen as a key component for adaptive behaviour (Bubeck et al., 2013; Poussin et al., 2014) and tends to be lower with regard to flash floods (Table 7), which might be accompanied by heavy structural damage (Laudan et al., 2017).
Average perceived response costs, response efficacy and responsibility of any individual to reduce damage, however, differ between the two events: people affected in 2013 perceived response costs a bit higher than those affected in 2016; this also holds for the perceived efficacy of measures and the responsibility of individuals (Table 7). It is striking that response efficacy is perceived as the lowest by people who were affected by flash floods in 2016, probably highlighting the high velocities and severe impacts on buildings (Tables 2 and 3) and indicating the limits of property-level adaptation.
Furthermore, the threat appraisal of future floods differs significantly between and within the events: the perceived probability of future floods is the highest among residents affected by river floods in 2013, followed by dike breaches in 2013 and surface water flooding in 2016. Those who were affected by flash floods in 2016 tend to believe that they will not be affected again. This pattern is even more pronounced when a statement on the perception of the impacts of a future flood like this one was assessed: here the ones who were damaged the most (i.e. by flash floods in 2016 and by dike breaches in 2013; see Table 3) tend to think that impacts comparable to those just experienced are less likely to occur again (Table 7). This highlights that it is important to distinguish probability and impacts in threat appraisals as shown by Bubeck et al. (2013). The statement on the perceived impacts of future floods also contains a nuance of denial of the flood risk, which might explain the lower adaptation that is revealed in Fig. 4.
Table 8Qualitative summary of the flood pathway characteristics, in which medium often reflects the averages.
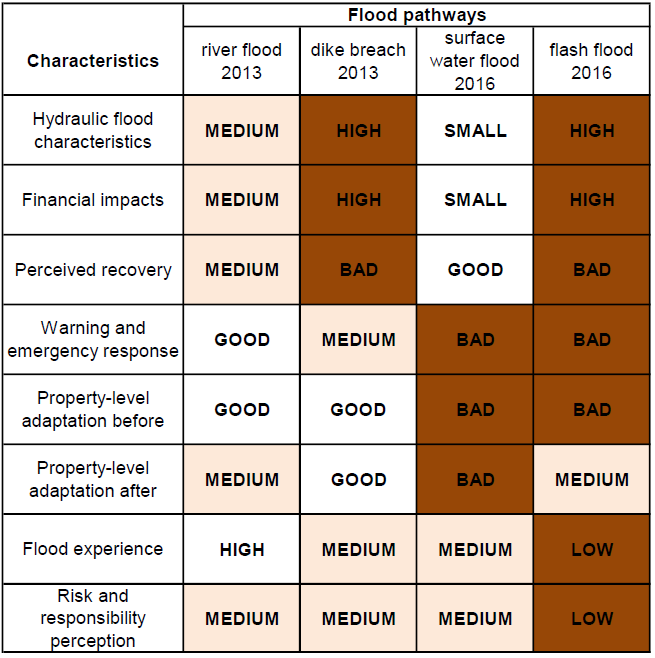
Based on two surveys among residents in Germany who were affected by flooding in 2013 and 2016, this paper looked at differences in flood processes, impacts and coping strategies between four flood pathways found in these spatially compound inland flood events. While the socio-economic characteristics did not differ much between the samples (except for income, which can be explained by the spatial patterns of the floods), impacts and coping strategies differed considerably. Based on the detailed quantitative analyses of a broad range of variables presented in Sect. 4, each flood pathway can be characterized qualitatively as shown in Table 8. The following event-based storylines were derived from these findings and can be applied to environments similar to the studied regions.
River floods (2013). The flood processes are characterized by high water levels and long durations of inundations. The financial impacts, recovery and the psychological burden from the flood represent more or less the average of the total data (note that this was the biggest subsample). Most of the residents affected by river floods in 2013 were warned in advance with comparatively long lead times. They were well-prepared, i.e. performed many emergency measures and also showed the highest level of flood adaptation at their property before the flood hit. After the flood they undertook considerable additional adaptation, but Fig. 4 reveals that they lost their top position and other subsamples reached the same level, although this group believes on average it will be affected again by future floods and also agrees that individuals have to contribute to flood risk reduction. Overall, adaptation of this group could be supported by financial incentives and funds since they perceive response costs as rather high (Table 7). Such costs might also be related to the efforts involved to implement a measure. Therefore, improved consultation and support during implementation as also proposed by Attems et al. (2020b) deserve further attention. Since previously experienced flooding was the highest in this subsample, their level of adaptation after the flood might also indicate a kind of saturation level. This hypothesis, however, needs to be researched in more detail.
Dike breaches (2013). This pathway is characterized by very high water levels, very long durations of inundations and a high frequency of oil contamination. Consequently, the financial impacts are the second highest, repair works at buildings are slow, and the psychological burden from the flood is the highest across all four subsamples. Most of the residents affected by dike breaches in 2013 were warned in advance with comparatively long lead times. Like those that were affected by river flooding, they performed many emergency measures and showed to be comparatively well-informed about flood hazards and coping options. With regard to structural and non-structural measures, adaptation before the flood was lower than in the river flood sample, but they reached a similar level after the flood and a higher level of insurance penetration. Perceptions of flood risk, coping options and responsibilities represent more or less an average behaviour. The fact that losses are very high despite a good responsive and adaptive behaviour indicates the limits of individual adaptation in view of the high hydraulic impacts caused by dike breaches. Insurance serves as a backstop. Overall, this group should be further educated with regard to risks and suitable coping options. Since response time might be limited in the case of dike breaches, potential environmental risks due to bursting oil tanks or the release of other harmful substances should receive particular attention. During the last revision of the German Federal Water Act a regulation of oil tanks in (potentially) flood-prone areas was already introduced. Still, more information on effective and suitable property-level adaptation is needed for residents potentially affected by this flood pathway.
Surface water floods (2016). The flood processes are characterized by (very) low water levels and short durations of inundations. Financial impacts and psychological burden from this pathway were the lowest across the subsamples, while there was a speedy recovery. Threats may occur from high velocities. Most of the residents affected by surface water flooding in 2016 were not warned in advance, lead times were short, and knowledge about self-protection was below-average. Hence, people prone to pluvial flooding – this is in general the urban population since pluvial floods are ubiquitous – should be better informed about potential traps (cellars, subways, cars, etc.) and suitable adaptation measures, particularly after events. In comparison to other subsamples, this group was the least informed and the least insured. Moreover, implementation of non-structural measures was below average – also after the event. Therefore, risk communication on pluvial flooding has in general to be improved and has a good chance to be successful since threat and coping appraisals are well developed and the uptake of measures after the 2016 event was good. Responsibility and feasibility should be clearly communicated and demonstrated by best-practise examples. Workshops could serve as a good instrument in this case as they strengthen self-efficacy and protection motivation (Heidenreich et al., 2020).
Flash floods (2016). The flood processes are characterized by (very) high water levels and often (very) high flow velocities which might be accompanied by contamination. These dynamic processes led to the highest financial impacts and a high psychological burden. Recovery was comparable to the dike breach sample of 2013, although this group received the highest financial support which might be due to the lumped character of this subsample with cases from just 10 municipalities. Like other affected residents in 2016, most of the people in this group were not warned in advance, and if so, lead times were short. Due to potential danger to life caused by flash floods, local forecasting and warning systems should be installed. The preparedness and adaptation before the flood in the subsample is comparable to the 2016 surface water flood group. After the flood the information-seeking behaviour was very high, as was the conclusion of insurance policies that serve as a backstop. To strengthen property-level adaptation, risk communication should focus on the efficacy of measures that can also withstand high flow velocities.
Altogether, the study demonstrates that flood hazard characteristics, impacts and coping options differ between and also within compound inland flood events. Hydraulic characteristics and flood impacts are strongly governed by the specific flood pathway, while coping options (short and long term) are more related to the general flood type (i.e. fluvial and pluvial). Hence, the concept of spatially compound events is helpful to understand different flood impacts, but it could be strengthened towards coping and adaptive behaviour. The above-mentioned flood-pathway-specific recommendations for risk communication and management are a first step in this direction. In addition, we can draw some conclusions that go beyond the studied cases and the German context.
First, the relation between hydraulic forces and impacts strongly support recommendations of developing pathway-specific loss models as done by Vogel et al. (2018) or Mohor et al. (2020, 2021). Research on this is, however, in its infancy. Secondly, to further mitigate damage, risk and crisis communication should distinguish not only flood types but also pathways highlighting their specific threats, e.g. life-threatening situations during flash floods. Identifying and communicating such threats might better fulfil user needs as it has been shown that adding impact information or additional descriptions of the threats may provide a clearer picture of the upcoming situation than abstract indications of warning levels (e.g. “strong”), specially to less proficient users (Kox et al., 2018). With regard to flash floods, options for local warning and alerting systems should be explored as an option of improving warning and response in small catchments.
Thirdly, it should be noted that experiencing strong flooding caused by dike breaches or flash floods boost precaution, while surface water flooding does not, although the latter can happen almost everywhere. Therefore, modes to communicate and experience flood impacts in a tangible way are particularly important (e.g. exhibitions, storytelling, etc.). In addition, the efficacy of emergency and precautionary measures with regard to different pathways needs further research. Finally, people affected by strong pathways such as dike breaches or flash floods (with sediment loads) need special assistance to recover physically and mentally from the impacts; their burden is the highest. Our results indicate that these residents experience limits of their adaptation options.
The survey data are owned by the first, third and fourth authors. Data from the 2013 event are available via the German flood loss database HOWAS21 (https://doi.org/10.1594/GFZ.SDDB.HOWAS21, GFZ German Research Centre for Geosciences, 2021). Data from the 2016 event will be included by 2029 and can currently be provided upon request only.
AHT, HK and MM developed the questionnaires and conducted the surveys. AHT and GSM designed the statistical test protocols, and GSM mainly carried them out. AHT mainly prepared the manuscript with contributions from all co-authors. All authors commented on previous versions of the manuscript. All authors read and approved the final manuscript.
The contact author has declared that neither they nor their co-authors have any competing interests.
Publisher's note: Copernicus Publications remains neutral with regard to jurisdictional claims in published maps and institutional affiliations.
This article is part of the special issue “Understanding compound weather and climate events and related impacts (BG/ESD/HESS/NHESS inter-journal SI)”. It is not associated with a conference.
The two surveys were undertaken within the BMBF-project “Hochwasser 2013” (FKZ: 13N13017) and the DFG Research Training Group “NatRiskChange” (GRK 2043/1). Funding is gratefully acknowledged, as are additional funds provided by the GeoForschungsZentrum Potsdam and the Deutsche Rückversicherung AG, Düsseldorf, for the data collection. Both surveys were conducted by explorare GmbH, Bielefeld, Germany. We further thank Sarah Kienzler, Jonas Laudan and Ina Pech for their contributions to the survey design and data processing.
This research has been supported by the Deutsche Forschungsgemeinschaft (grant no. GRK 2043/1). The second author received a scholarship from Deutscher Akademischer Austauschdienst (DAAD) in the Graduate School Scholarship Programme (GSSP, grant no. 2017-ID 57320205).
This paper was edited by Bart van den Hurk and reviewed by three anonymous referees.
Attems, M. S., Thaler, T., Genovese, E., and Fuchs, S.: Implementation of property level flood risk adaptation (PLFRA) measures: choices and decisions, Wiley Interdisciplinary Reviews: Water, 7, e1404, https://doi.org/10.1002/wat2.1404, 2020a.
Attems, M. S., Thaler, T., Snel, K. A. W., Davids, P., Hartmann, T., and Fuchs, S.: The influence of tailored risk communication on individual adaptive behaviour, Int. J. Disast. Risk Re., 49, 101618, https://doi.org/10.1016/j.ijdrr.2020.101618, 2020b.
Bavarian Parliament: Printed matter 17/889, Written enquiry by the representative R. Steinberger BÜNDNIS 90/DIE GRÜNEN, answer by the Bavarian State Ministry of Environment and Consumer Protection, 21 March 2014, 17th legislative period, 2014 (in German).
Bavarian State Government: Hilfsmaßnahmen für die Hochwasserkatastrophe im Mai/Juni 2016, Allgemeines Ministerialblatt, 29, 10, 1632–1641, available at: https://www.verkuendung-bayern.de/files/allmbl/2016/10/allmbl-2016-10.pdf#page=1 (last access: 6 September 2021), 2016.
Bronstert, A., Agarwal, A., Boessenkool, B., Fischer, M., Heistermann, M., Köhn-Reich, L., Moran, T., and Wendi, D.: The Braunsbach Flashflood of Mai 29th, 2016 – Origin, Pathways and Impacts of an Extreme Hydro-Meteorological Event. Part 1: Meteorological and Hydrological Analysis, Hydrologie and Wasserbewirtschaftung, 61, 150–162, https://doi.org/10.5675/HyWa_2017,3_1, 2017 (in German).
Bronstert, A., Agarwal, A., Boessenkool, B., Crisologo, I., Fischer, M., Heistermann, M., Köhn-Reich, L., López-Tarazón, J. A., Moran, T., Ozturk, U., Reinhardt-Imjela, C., and Wendi, D.: Forensic hydro-meteorological analysis of an extreme flash flood. The 2016-05-29 event in Braunsbach, SW Germany, Sci. Total Environ., 630, 977–991, 2018.
Bubeck, P., Botzen, W. J. W., and Aerts, J. C. J. H.: A review of risk perceptions and other factors that influence flood mitigation behaviour, Risk Analysis, 32, 1481–1495, 2012.
Bubeck, P., Botzen, W. J. W., Kreibich, H., and Aerts, J. C. J. H.: Detailed insights into the influence of flood-coping appraisals on mitigation behaviour, Global Environ. Change, 23, 1327–1338, https://doi.org/10.1016/j.gloenvcha.2013.05.009, 2013.
Cammerer, H. and Thieken, A.: Flood loss reduction due to private precaution, in: Urban Flood Risk Management – Approaches to enhance resilience of communities, edited by: Zenz, G. and Hornich, R., Proceedings of the International Symposium UFRIM, Graz, 21–23 September 2011, 381–386, 2011.
CRED and UN-DRR: Human costs of disasters: an overview of the last 20 years 2000–2019, Report, 2020.
De Bruijn, K., Klijn, F., Ölfert, A., Penning-Rowsell, E., Simm, J., and Wallis, M.: Flood risk assessment and flood risk management. FloodSite Report T29-09-01, available at: http://www.floodsite.net/html/partner_area/project_docs/T29_09_01_Guidance_Screen_Version_D29_1_v2_0_P02.pdf (last access: 5 September 2021), 2009.
Demuth, N., Gerlach, N., van der Heijden, S., and Johst, M.: Starkregen und Hochwasser in Rheinland-Pfalz im Mai/Juni 2016, Landesamt für Umwelt Rheinland-Pfalz, 46 pp., available at: http://www.hochwasser-rlp.de/publikationen/bericht_starkregen_hochwasser_juni2016.pdf (last access: 5 September 2021), 2016 (in German).
Destatis – Federal Statistical Office: Wirtschaftsrechnungen: Einkommens- und Verbrauchsstichsprobe – Einkommensverteilung in Deutschland 2013, Fachserie 15, Heft 6, 2018 (in German).
DKKV – Deutsches Komitee Katastrophenvorsorge (Ed.): Lessons Learned – Hochwasservorsorge in Deutschland – Lernen aus der Katastrophe 2002 im Elbegebiet, DKKV-Schriftenreihe 29, Bonn, 2003 (in German).
DKKV (Ed.): Das Hochwasser im Juni 2013 – Bewährungsprobe für das Hochwasserrisikomanagement in Deutschland, DKKV-Schriftenreihe 53, Bonn, 2015 (in German).
Driessen, P. P. J., Hegger, D. L. T., Bakker, M. H. N., Van Rijswick, M. H. F. M. W., and Kundzewicz, Z. W.: Toward more resilient flood risk governance, Ecol. Soc., 21, 53, https://doi.org/10.5751/ES-08921-210453, 2016.
DWD – Deutscher Wetterdienst (Ed.): Das Hochwasser an Elbe und Donau im Juni 2013, Berichte des Deutschen Wetterdienstes 242, Offenbach, 2013 (in German).
EEA – European Environment Agency: Economic losses from climate-related extremes in Europe, 29 pp., EEA, Copenhagen, Denmark, 2019.
GDV – Gesamtverband der Deutschen Versicherungswirtschaft: Naturgefahrenreport 2016, Berlin, 2016 (in German).
GDV: Naturgefahrenreport 2020 – Serviceteil, Berlin, 2020 (in German).
Gerl, T., Kreibich, H., Franco, G., Marechal, D., and Schröter, K.: A review of flood loss models as basis for harmonization and benchmarking, PLoS ONE, 11, e0159791, https://doi.org/10.1371/journal.pone.0159791, 2016.
Heidenreich, A., Masson, T., and Bamberg, S.: Let's talk about flood risk – Evaluating a series of workshops on private flood protection, Int. J. Disast. Risk Re., 50, 101880, https://doi.org/10.1016/j.ijdrr.2020.101880, 2020.
Hübl, J., Heiser, M., Braito, S., Tscharner, S, Kuntner, K., Schraml, K., Falkensteiner, M., and Rabanser, E.: Ereignisdokumentation und Ereignisanalyse Rottal-Inn 2016, IAN Report 180, BOKU, Vienna, 1, 173, 2017 (in German).
Hudson, P., Botzen, W. J., Czajkowski, J., and Kreibich, H.: Moral Hazard in Natural Disaster Insurance Markets: Empirical Evidence from Germany and the United States, Land Econ., 93, 179–208, https://doi.org/10.3368/le.93.2.179, 2017.
Hudson, P., de Ruig, L., de Ruiter, M., Kuik, O., Botzen, W., le Den, X., Persson, M., Benoist, A., and Nielsen, C.: Best practices of extreme weather insurance in Europe and directions for a more resilient society, Environ. Hazards, 19, 303–321, https://doi.org/10.1080/17477891.2019.1608148, 2020.
IPCC – Intergovernmental Panel on Climate Change: Managing the Risks of Extreme Events and Disasters to Advance Climate Change Adaptation, special Report of Working Groups I and II of the Intergovernmental Panel on Climate Change, edited by: Field, C. B., Barros, V., Stocker, T. F., Qin, D., Dokken, D. J., Ebi, K. L., Mastrandrea, M. D., Mach, K. J., Plattner, G.-K., Allen, S. K., Tignor, M., and Midgley, P. M., Cambridge University Press, Cambridge, UK, and New York, NY, USA, 2012.
Kienzler, S., Pech, I., Kreibich, H., Müller, M., and Thieken, A. H.: After the extreme flood in 2002: changes in preparedness, response and recovery of flood-affected residents in Germany between 2005 and 2011, Nat. Hazards Earth Syst. Sci., 15, 505–526, https://doi.org/10.5194/nhess-15-505-2015, 2015.
Kind, C., Kaiser, T., Riese, M., Bubeck, P., Müggenburg, E., Schüller, L., Fleischmann, R., and Thieken, A.: Vorsorge gegen Starkregenereignisse und Maßnahmen zur wassersensiblen Stadtentwicklung – Analyse des Standes der Starkregenvorsorge in Deutschland und Ableitung zukünftigen Handlungsbedarfs, UBA-Text 55/2019, Dessau, 2019.
Kox, T., Kempf, H., Lüder, C., Hagebdorn, R., and Gerhold, L: Towards user-orientated weather warnings, Int. J. Disast. Risk Re., 30, 74–80, https://doi.org/10.1016/j.ijdrr.2018.02.033, 2018.
Kreibich, H., Petrow, T., Thieken, A. H., Müller, M., and Merz, B.: Consequences of the extreme flood event of August 2002 in the city of Dresden, Germany, in: Sustainable Water Management Solutions for Large Cities, edited by: Savic, D. A., Mariño, M. A., Savenije, H. H. G., Bertoni, J. C., IAHS Publication, 293, 164–173, 2005.
Kreibich, H., Bubeck, P., Van Vliet, M., and De Moel, H.: A review of damage-reducing measures to manage fluvial flood risks in a changing climate, Mitigation and Adaptation Strategies for Global Change, 20, 967–989, 2015.
Kreibich, H., Müller, M., Schröter, K., and Thieken, A. H.: New insights into flood warning reception and emergency response by affected parties, Nat. Hazards Earth Syst. Sci., 17, 2075–2092, https://doi.org/10.5194/nhess-17-2075-2017, 2017.
Kreibich, H., Hudson, P., and Merz, B.: Knowing What to Do Substantially Improves the Effectiveness of Flood Early Warning, B. Am Metorol. Soc., 102, E1450–E1463, 2021.
Laudan, J., Rözer, V., Sieg, T., Vogel, K., and Thieken, A. H.: Damage assessment in Braunsbach 2016: data collection and analysis for an improved understanding of damaging processes during flash floods, Nat. Hazards Earth Syst. Sci., 17, 2163–2179, https://doi.org/10.5194/nhess-17-2163-2017, 2017.
Laudan, J., Zöller, G., and Thieken, A. H.: Flash floods versus river floods – a comparison of psychological impacts and implications for precautionary behaviour, Nat. Hazards Earth Syst. Sci., 20, 999–1023, https://doi.org/10.5194/nhess-20-999-2020, 2020.
LfU – Bayerisches Landesamt für Umwelt (Ed.): Sturzfluten- und Hochwasserereignisse Mai/Juni 2016 – Wasserwirtschaftlicher Bericht, 2017 (in German).
Masson, T., Bamberg, S., Stricker, M., and Heidenreich, A.: “We can help ourselves”: does community resilience buffer against the negative impact of flooding on mental health?, Nat. Hazards Earth Syst. Sci., 19, 2371–2384, https://doi.org/10.5194/nhess-19-2371-2019, 2019.
Mayr, B., Thaler, T., and Hübl, J.: Successful Small-Scale Household Relocation after a Millennial Flood Event in Simbach, Germany 2016, Water, 12, 1–19, https://doi.org/10.3390/w12010156, 2020.
Merz, B., Elmer, F., Kunz, M., Mühr, B., Schröter, K., and Uhlemann-Elmer, S.: The extreme flood in June 2013 in Germany, Houille Blanche, 100, 5–10, 2014.
Merz, B., Kuhlicke, C., Kunz, M., Pittore, M., Babeyko, A. Y., Bresch, D. N., Domeisen, D. I. V., Feser, F., Koszalka, I., Kreibich, H., Pantillon, F., Parolai, S., Pinto, J. G., Punge, H. J., Rivalta, E., Schröter, K., Strehlow, K., Weisse, R., and Wurpts, A.: Impact Forecasting to Support Emergency Management of Natural Hazards, Rev. Geophys., 58, e2020RG000704, https://doi.org/10.1029/2020RG000704, 2020.
Mohor, G. S., Hudson, P., and Thieken, A. H.: A comparison of factors driving flood losses in households affected by different flood types, Water Resour. Res., 54, e2019WR025943, https://doi.org/10.1029/2019WR025943, 2020.
Mohor, G. S., Thieken, A. H., and Korup, O.: Residential flood loss estimated from Bayesian multilevel models, Nat. Hazards Earth Syst. Sci., 21, 1599–1614, https://doi.org/10.5194/nhess-21-1599-2021, 2021.
Mühr, B., Daniell., J., Ehmele, F., Kron, A., Dittrich, A., and Kunz, M.: Hochwasser/Überschwemmungen Süddeutschland Mai/Juni 2016, CEDIM-Forensic Disaster Analysis Report No 1, 13 pp., available at: https://www.cedim.kit.edu/download/Hochwasser_Süddeutschland_Report_1.pdf (last access: 5 September 2021), 2016 (in German).
Munich Re: Topics Geo 2016 – Natural catastrophes 2016 – Analyses, assessments, positions, Munich, 2017.
Neise, T. and Revilla Diez, J.: Adapt, move or surrender? Manufacturing firms' routines and dynamic capabilities on flood risk reduction in coastal cities of Indonesia, Int. J. Disast. Risk Re., 33, 332–342, https://doi.org/10.1016/j.ijdrr.2018.10.018, 2019.
Noether, G. E.: Introduction to statistics: The nonparametric way, Springer texts in statistics, Springer-Verlag New York, 415 pp., 1991.
Penning-Rowsell, E. C. and Green, C.: New insights into the appraisal of flood-alleviation benefits: (1) Flood damage and flood loss information, J. Chart. Inst. Water Engrs, 14, 347–353, 2000.
Pescaroli G. and Alexander, D.: Understanding Compound, Interconnected, Interacting, and Cascading Risks: A Holistic Framework, Risk Analysis, 38, 2245–2257, 2018.
Piper, D., Kunz, M., Ehmele, F., Mohr, S., Mühr, B., Kron, A., and Daniell, J.: Exceptional sequence of severe thunderstorms and related flash floods in May and June 2016 in Germany – Part 1: Meteorological background, Nat. Hazards Earth Syst. Sci., 16, 2835–2850, https://doi.org/10.5194/nhess-16-2835-2016, 2016.
Poussin, J. K., Botzen, W. J. W., and Aerts, J. C. J. H.: Factors of influence on flood damage mitigation behaviour by households, Environ. Sci. Policy, 40, 69–77, https://doi.org/10.1016/j.envsci.2014.01.013, 2014.
R Core Team: R: A language and environment for statistical computing, Version 3.4.2, R Foundation for Statistical Computing, Vienna, Austria, available at: https://www.R-project.org (last access: 24 January 2022), 2017.
Rözer, V., Müller, M., Bubeck, P., Kienzler, S., Thieken, A., Pech, I., Schröter, K., Buchholz, O., and Kreibich, H.: Coping with pluvial floods by private households, Water, 8, 304, https://doi.org/10.3390/w8070304, 2016.
Sayers, P. B., Hall, J. W., and Meadowcroft, I. C.: Towards risk-based flood hazard management in the UK, Proc. Inst. Civ. Eng. Civ. Eng., 150, 36–42, 2002.
Schröter, K., Kunz, M., Elmer, F., Mühr, B., and Merz, B.: What made the June 2013 flood in Germany an exceptional event? A hydro-meteorological evaluation, Hydrol. Earth Syst. Sci., 19, 309–327, https://doi.org/10.5194/hess-19-309-2015, 2015.
Shepherd, T. G., Boyd, E., Calel, R. A., Chapman, S. C., Dessai, S., Dima-West, I. M., Fowler, H. J., James, R., Maraun, D., Martius, O., Senior, C. A., Sobel, A. H., Stainforth, D. A., Tett, S. F. B., Trenberth, K. E., van den Hurk, B. J. J. M., Watkins, N. W., Wilby, R. L., and Zenghelis, D. A.: Storylines: an alternative approach to representing uncertainty in physical aspects of climate change, Clim. Change, 151, 555–571, https://doi.org/10.1007/s10584-018-2317-9, 2018.
Sillmann, J., Shepherd, T. G., van den Hurk, B., Hazeleger, W., Martius, O., Slingo, J., and Zscheischler, J.: Event-Based Storylines to Address Climate Risk, Earth's Future, 9, e2020EF001783, https://doi.org/10.1029/2020EF001783, 2021.
Spekkers, M., Rözer, V., Thieken, A., ten Veldhuis, M.-C., and Kreibich, H.: A comparative survey of the impacts of extreme rainfall in two international case studies, Nat. Hazards Earth Syst. Sci., 17, 1337–1355, https://doi.org/10.5194/nhess-17-1337-2017, 2017.
Surminski, S. and Thieken, A. H.: Promoting flood risk reduction: the role of insurance in Germany and England, Earth's Future, 5, 979–1001, https://doi.org/10.1002/2017EF000587, 2017.
Thieken, A., Kreibich, H., Müller, M., and Lamond, J.: Data collection for a better understanding of what causes flood damage – experiences with telephone surveys, in: Flood damage survey and assessment: new insights from research and practice, edited by: Molinari, D., Menoni, S., and Ballio, F., AGU, Wiley, chapter 7, 95–106, https://doi.org/10.1002/9781119217930.ch7, 2017.
Thieken, A. H., Kreibich, H., Müller, M., and Merz, B.: Coping with floods: preparedness, response and recovery of flood-affected residents in Germany in 2002, Hydrol. Sci. J., 52, 1016–1037, 2007.
Thieken, A. H., Müller, M., Kreibich, H., and Merz, B.: Flood damage and influencing factors: New insights from the August 2002 flood in Germany, Water Resour. Res., 41, W12430, https://doi.org/10.1029/2005WR004177, 2005.
Thieken, A. H., Bessel, T., Kienzler, S., Kreibich, H., Müller, M., Pisi, S., and Schröter, K.: The flood of June 2013 in Germany: how much do we know about its impacts?, Nat. Hazards Earth Syst. Sci., 16, 1519–1540, https://doi.org/10.5194/nhess-16-1519-2016, 2016a.
Thieken, A. H., Kienzler, S., Kreibich, H., Kuhlicke, C., Kunz, M., Mühr, B., Müller, M., Otto, A., Petrow, T., Pisi, S., and Schröter, K.: Review of the flood risk management system in Germany after the major flood in 2013, Ecol. Soc., 21, 51, https://doi.org/10.5751/ES-08547-210251, 2016b.
Vogel, K., Öztürk, U., Riemer, A., Laudan, J., Sieg, T., Wendi, D., Agarwal, A., Rözer, V., Korup, O., and Thieken, A.: The Braunsbach Flashflood of Mai 29th, 2016 – Origin, Pathways and Impacts of an Extreme Hydro-Meteorological Event. Part 2: Geomorphological Processes and Damage Analysis, Hydrologie and Wasserbewirtschaftung, 61, 163–175, https://doi.org/10.5675/HyWa_2017,3_2, 2017 (in German).
Vogel, K., Weise, L., Schröter, K., and Thieken A. H.: Identifying Driving Factors in Flood Damaging Processes Using Graphical Models, Water Resour. Res., 54, 8864–8889, https://doi.org/10.1029/2018WR022858, 2018.
Zscheischler, J., Martius, O., Westra, S., Bevacqua, E., Raymond, C., Horton, R. M., van den Hurk, B., AghaKouchak, A., Jézéquel, A., Mahecha, M. D., Maraun, D., Ramos, A. M., Ridder, N. N., Thiery, W., and Vignotto, E.: A typology of compound weather and climate events, Nat. Rev. Earth Environ., 1, 333–347, https://doi.org/10.1038/s43017-020-0060-z, 2020.