the Creative Commons Attribution 4.0 License.
the Creative Commons Attribution 4.0 License.
 | 13 May 2022
Earthquake-induced landslide monitoring and survey by means of InSAR
Mohamed Abed
Ahmed Mebarki
Milan Lazecky
This study uses interferometric synthetic aperture radar (SAR) techniques to identify and track earthquake-induced landslides as well as lands prone to landslides, by detecting deformations in areas struck by earthquakes. The pilot study area investigates the Mila region in Algeria, which suffered significant landslides and structural damage (earthquake: Mw 5, 7 August 2020). DInSAR analysis shows normal interferograms with small fringes. The coherence change detection (CCD) and DInSAR analysis were able to identify many landslides and ground deformations also confirmed by Sentinel-2 optical images and field inspection. The most important displacement (2.5 m), located in the Kherba neighborhood, caused severe damage to dwellings. It is worth notice that CCD and DInSAR are very useful since they were also able to identify ground cracks surrounding a large zone (3.94 km2 area) in Grarem City, whereas the Sentinel-2 optical images could not detect them. Although displacement time-series analysis of 224 interferograms (April 2015 to September 2020) performed using LiCSBAS did not detect any pre-event geotechnical precursors, the post-event analysis shows a 110 mm yr−1 subsidence velocity in the back hillside of Kherba.
- Article
(25219 KB) - Full-text XML
- BibTeX
- EndNote


Although it is still challenging to predict exactly where and when natural hazards (earthquakes, landslides, floods, etc.) might occur, the capacity to monitor and survey the zones prone to important landslides and the capacity to identify and locate those impacted by earthquakes are key issues in risk mitigation, reduction, preparedness, and adaptation. Actually, since earthquakes and landslides might occur in many places worldwide, they might cause a huge number of victims, important socio-economic damage, and asset damage and losses. Their impact can be significantly reduced thanks to satellite imaging, which allows prediction and early alerts of some landslide cases (Jacquemart and Tiampo, 2021; Mazzanti et al., 2012; Moretto et al., 2021).
It is then worth detecting or predicting critical ground changes at specific places, either after a geotechnical hazard occurs due to landslides and earthquakes mainly or before it is suddenly triggered (Bakon et al., 2014; Galve et al., 2015). Such challenges can be tackled by regular image-processing-oriented landslide area monitoring, in the aftermath of earthquakes, using SAR interferometric methods and optical images, for instance. Actually, since SAR (synthetic aperture radar) is an active sensor system that uses microwave signals to collect data backscattered from the earth's surface, the use of satellite imaging systems like interferometric SAR methods appears to be a cost-effective way for measuring millimeter-level displacements of the earth surface (Herrera et al., 2009) at a regional scale and can be used as an early warning system for the safety of structures and their surroundings (Galve et al., 2015; Roque et al., 2015).
The expected outcomes are based upon the processing of SAR data as they use differential InSAR (DInSAR), coherence change detection (CCD), and time series analysis (LiCSBAS software). LiCSBAS exploits the LiCSAR data that process InSAR datasets automatically (Sentinel-1), taking advantage of high-resolution SAR sensing, in order to track ground changes and landslides.
The SAR analyses aim to detect ground deformations through DInSAR and CCD investigations as they consider, for illustrative purposes, a city in Algeria struck by an earthquake (7 August 2020: Algeria, Mila): the ground deformations and displacements, in Kherba City and Grarem City (northeastern part of Mila downtown, 2 km), are investigated. The affected areas span over 3.94 km2 for Grarem and 2.1 km2 for the Kherba landslides. Furthermore, a time-series analysis of LiCSAR data performed by LiCSBAS software investigates the possible existence of precursors in geotechnical conditions.
2.1 Satellite images and methods – case study
The present research study is multifold. It aims to use InSAR image processing for various purposes, in the case of landslides and earthquakes.
-
We use InSAR in the aftermath of an earthquake in order to identify the geotechnical displacements or deformations, their extent, and locations. The Differential radar interferometry and the Coherence Changes Detection are the most adapted methods for ground and soil surface change detection (Jung and Yun, 2020; Meng et al., 2020; Pawluszek-Filipiak and Borkowski, 2020; Tampuu et al., 2020; Tzouvaras et al., 2020). A city, Mila, in northern Algeria, is considered as the pilot study. It was struck by an earthquake in August 2020. The landslides and surface cracks were affected significantly during the earthquake events, with two distinct zones being almost 15 km from each other (Kherba and Grarem).
-
We use time-series analysis to investigate the displacements and their velocities before and after the occurrence of the main shock. For the city of Mila, the time series is performed for a period extending from April 2015 to October 2020, i.e., a long period before (5 entire years) the main shock in order to avoid a disturbance or bias that might be related to seasonal effects such as rains and vegetation effects (Lazeckỳ et al., 2020a), and a short period (4 months) ahead of the event date in order to investigate the historical development of the landslide.
-
We compare and correlate the InSAR image processing results with the satellite optical image observations.
2.2 Pilot zone, earthquakes, and landslides – observed disorders
The case study area lies in Mila Province, which is located in the northeast part of Algeria (Mediterranean zone), near the dam of Beni Haroun. The Mediterranean zone is seismically active because of the northward convergence (4–10 mm yr−1) of the African plate relative to the Eurasian plate along a complex plate boundary (Frizon de Lamotte et al., 2000; Mouloud and Badreddine, 2017; Peláez Montilla et al., 2003; USGS, 2021b). Throughout the last years, several landslide events have taken place in the wider region of Mila (Merghadi et al., 2018). Merghadi et al. (2018) constructed a detailed landslide inventory map of the study area. The seismic activities and landslides pose a persistent threat for built-up areas and facilities, such as roadways, bridges, and tunnels, which need continuous monitoring and survey.
After an earthquake (Mw 5, 7 August 2020, epicenter 36.550∘ N–6.271∘ E, depth = 10 km, USGS, 2021a) that struck this region, important landslides were mostly observed in Mila City and its surroundings (see Figs. 1–3). Although the earthquake was moderate, Beni Haroun Dam and the two large bridges built on the RN 27 highway need to be inspected and their possible displacements monitored.
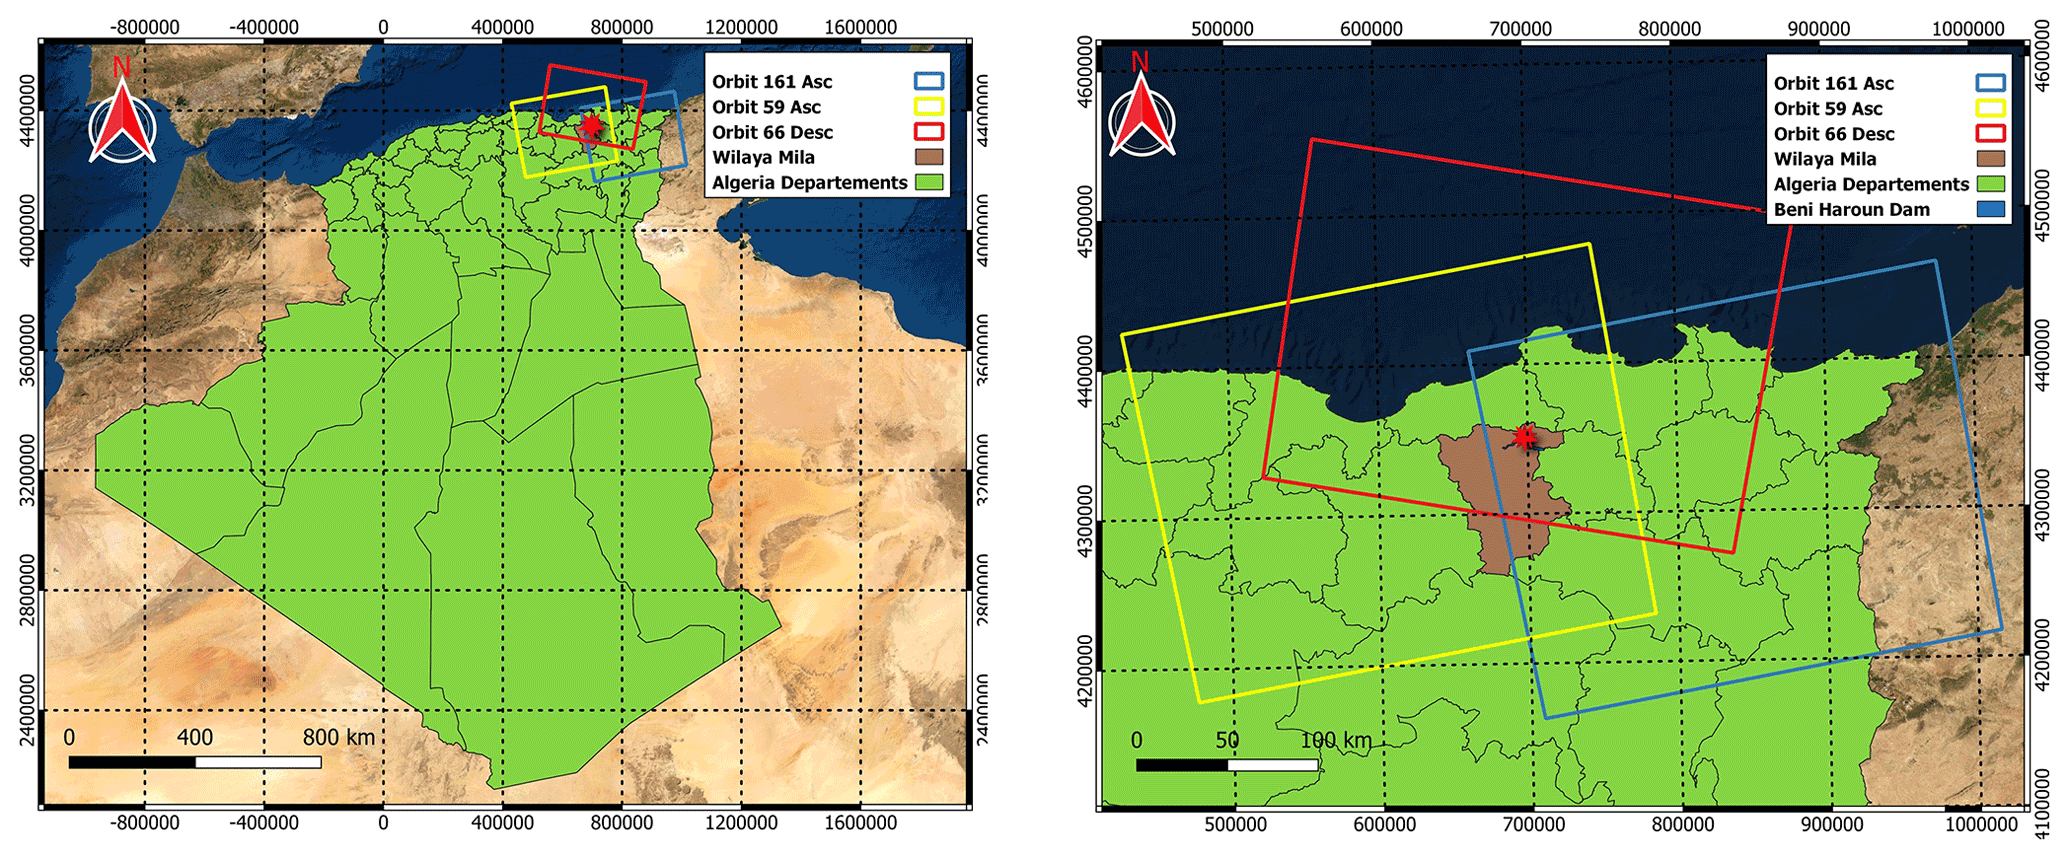
Figure 1Mila location map (left panel), ascending and descending orbit footprints. Red stars indicate earthquake epicenter (QGIS, ESRI basemap).
In the present work, two areas are studied, i.e., Kherba and Grarem cities. The altitude at the top point 1 (Fig. 2a) in Kherba hill is 654 and 411 m for the upper point (2), located 2.14 km away with 11.34 % slope. The maximum ground horizontal offset reached 2.5 m, and the vertical deformations exceed 1.8 m (Fig. 3b) at the top of Kherba hill (point A Fig. 2a). The slope failure boundary of Kherba City is mapped as shown in Fig. 2b. The Grarem area of interest (AoI) is located northeast of Mila in hilly ground with an average slope reaching 12.5 % (see Fig. 2c).
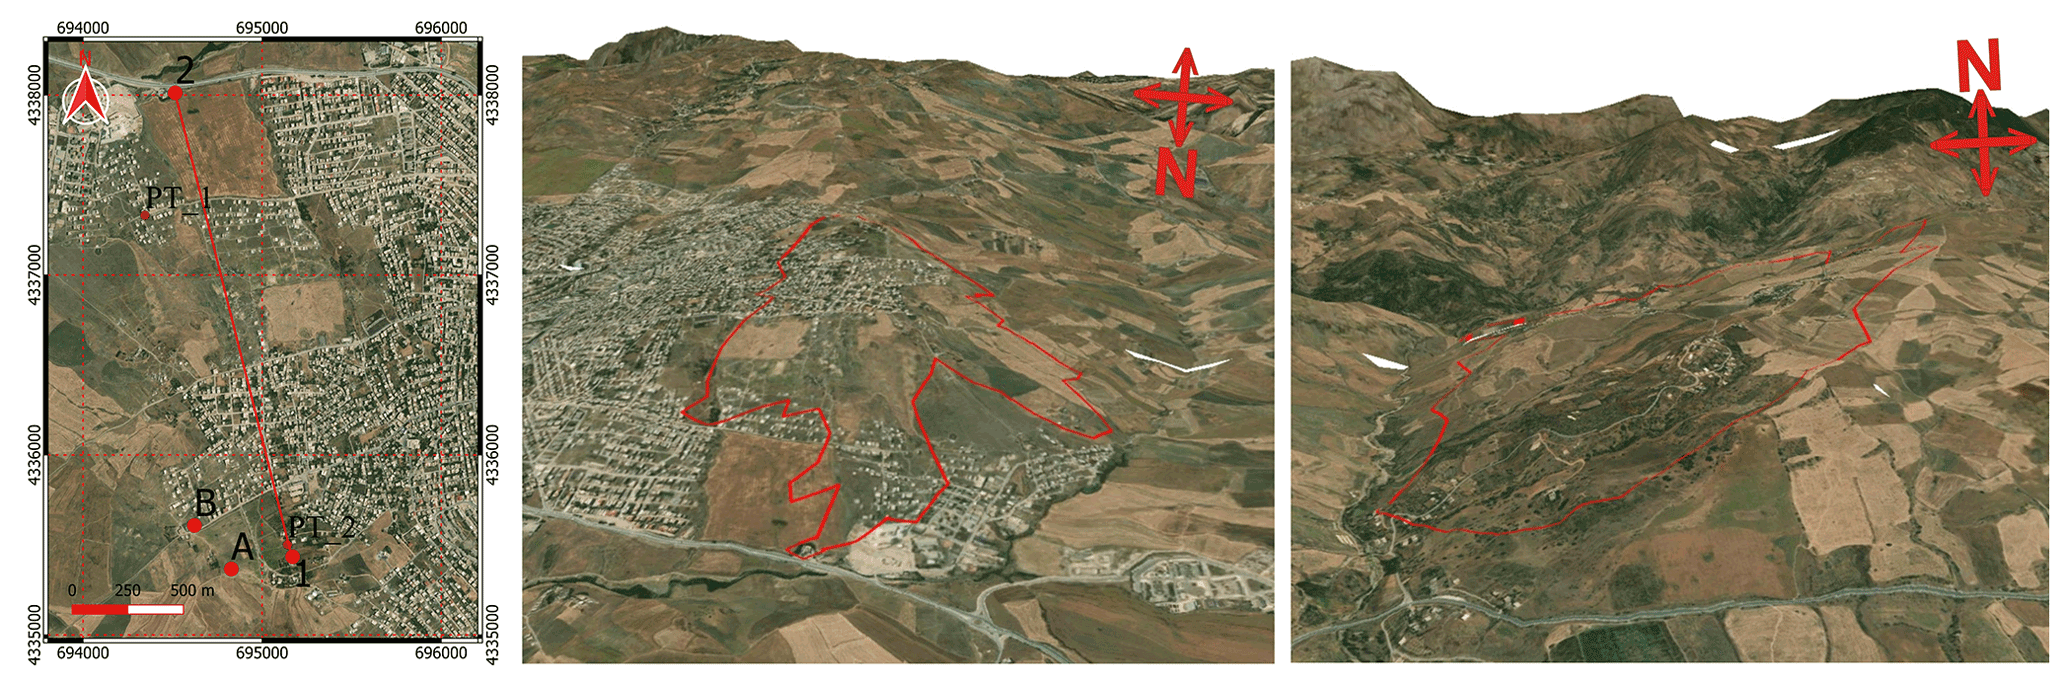
Figure 2The 3D view of AoIs, Kherba AoI, and Grarem using QGIS with DEM SRTM 1sec and ESRI basemap. Panels (a, b) show the Kherba AoI, and (c) shows the Grarem case area. The red polygon is the boundary of change detected by InSAR.
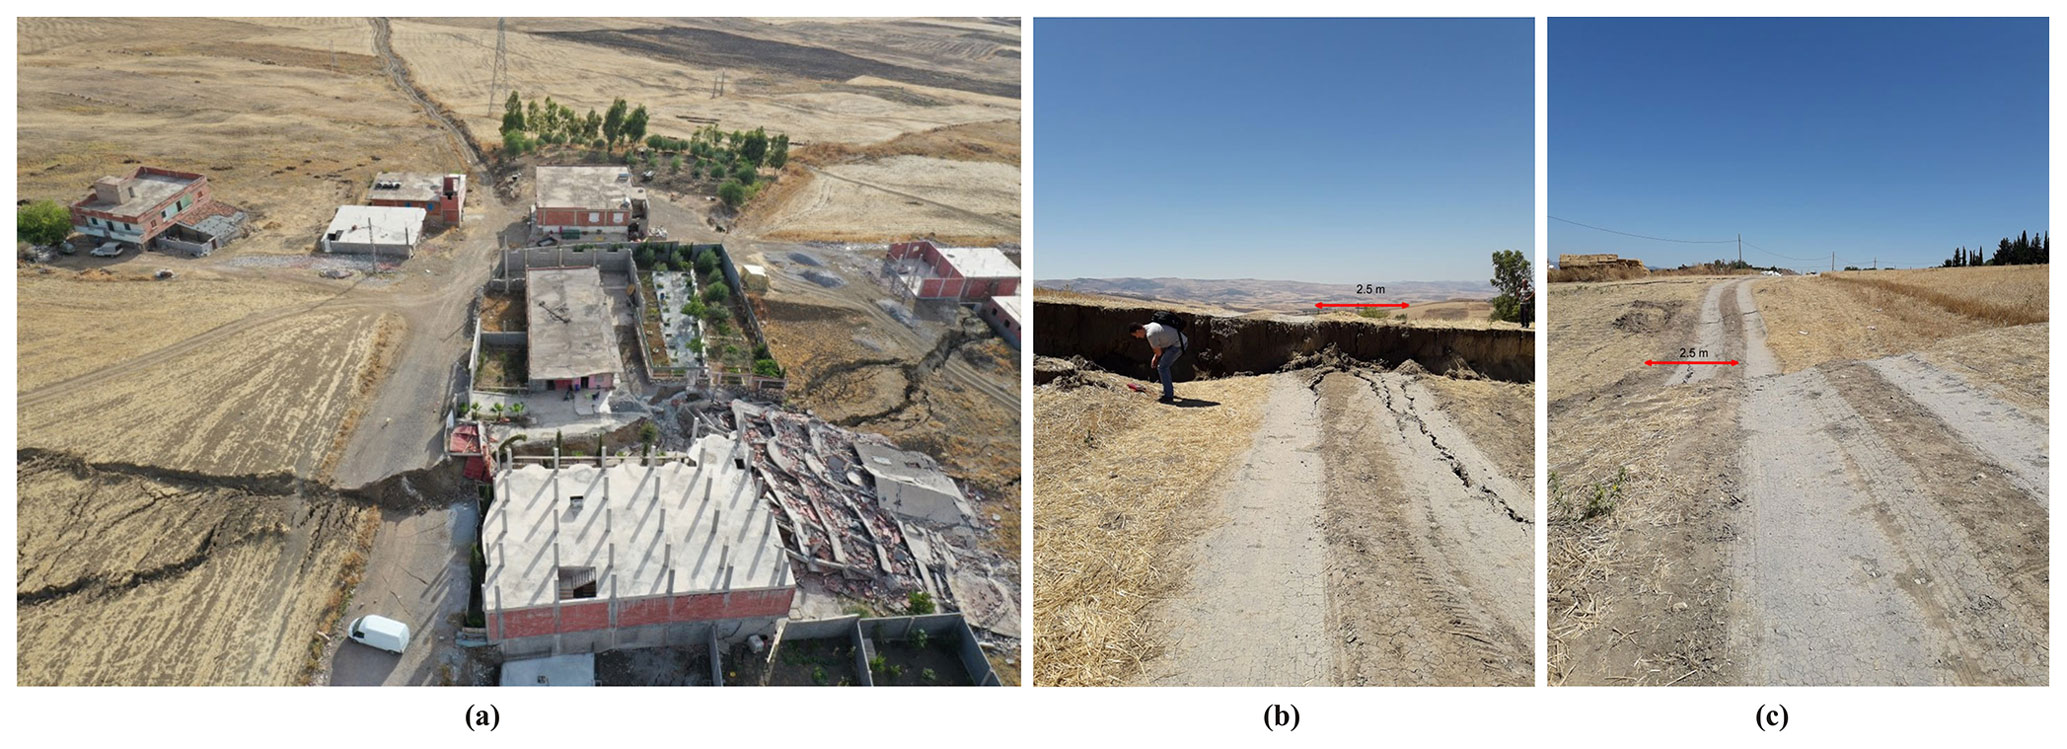
Figure 3Ground cracks due to landslides in Kherba, Mila, ∼2.5 m offset towards the north. (a) Drone aerial photo from LNHC (2021). (b, c) Lateral displacements (photos: courtesy M. Yacoub Ali, University of Setif, Algeria).
2.3 Pilot zone – data and image collection
The dataset used for this study is collected from the European Space Agency (ESA), via the Copernicus Open Access portal, and from the Alaska Satellite Facility (ASF DAAC, 2021). The C-band Sentinel-1 A and B, launched in 2014 and 2016, respectively, provide regular datasets. The Sentinel-1 sensors have a wavelength of 5.546 cm (ESA, 2021a, b), suitable for change detection and monitoring of large areas, and are right side-looking with an incidence angle ranging approximately from 20 to 46∘ (ESA, 2012). For the InSAR use, the interferometric wide (IW) swath single look complex (SLC) data are selected and processed with the open-source software SNAP (Sentinel Applications Platform). It is worth using data from many orbits to monitor the AoIs due to different oriented directions, incidence angles of satellites, and the ground topography. The optical images of Sentinel-2 satellites are obtained from ESA, whereas downloading and processing data are done via QGIS, Semi-Automatic Classification Plugin (SCP) (Congedo, 2021).
For the Mila region, the AoI is covered by three orbits; two are ascending (66, 59) and one is descending (161) (Fig. 1). Since the present study intends to detect the areas influenced by landslides, many pre-event and post-event data were used. Eighteen Sentinel-1 A and 17 Sentinel-1 B images (a total of 35) were downloaded to monitor Mila's area for the period from 1 July to 26 October 2020. Table 1 summarizes the appropriate interferograms, i.e., those having small perpendicular baselines and short temporal baselines. Tables 1–3 present all the images, with their labels as IFG-ID, Orbits, and dates of acquisition.
Table 1Characteristics of Sentinel-1 InSAR pairs used for this study.
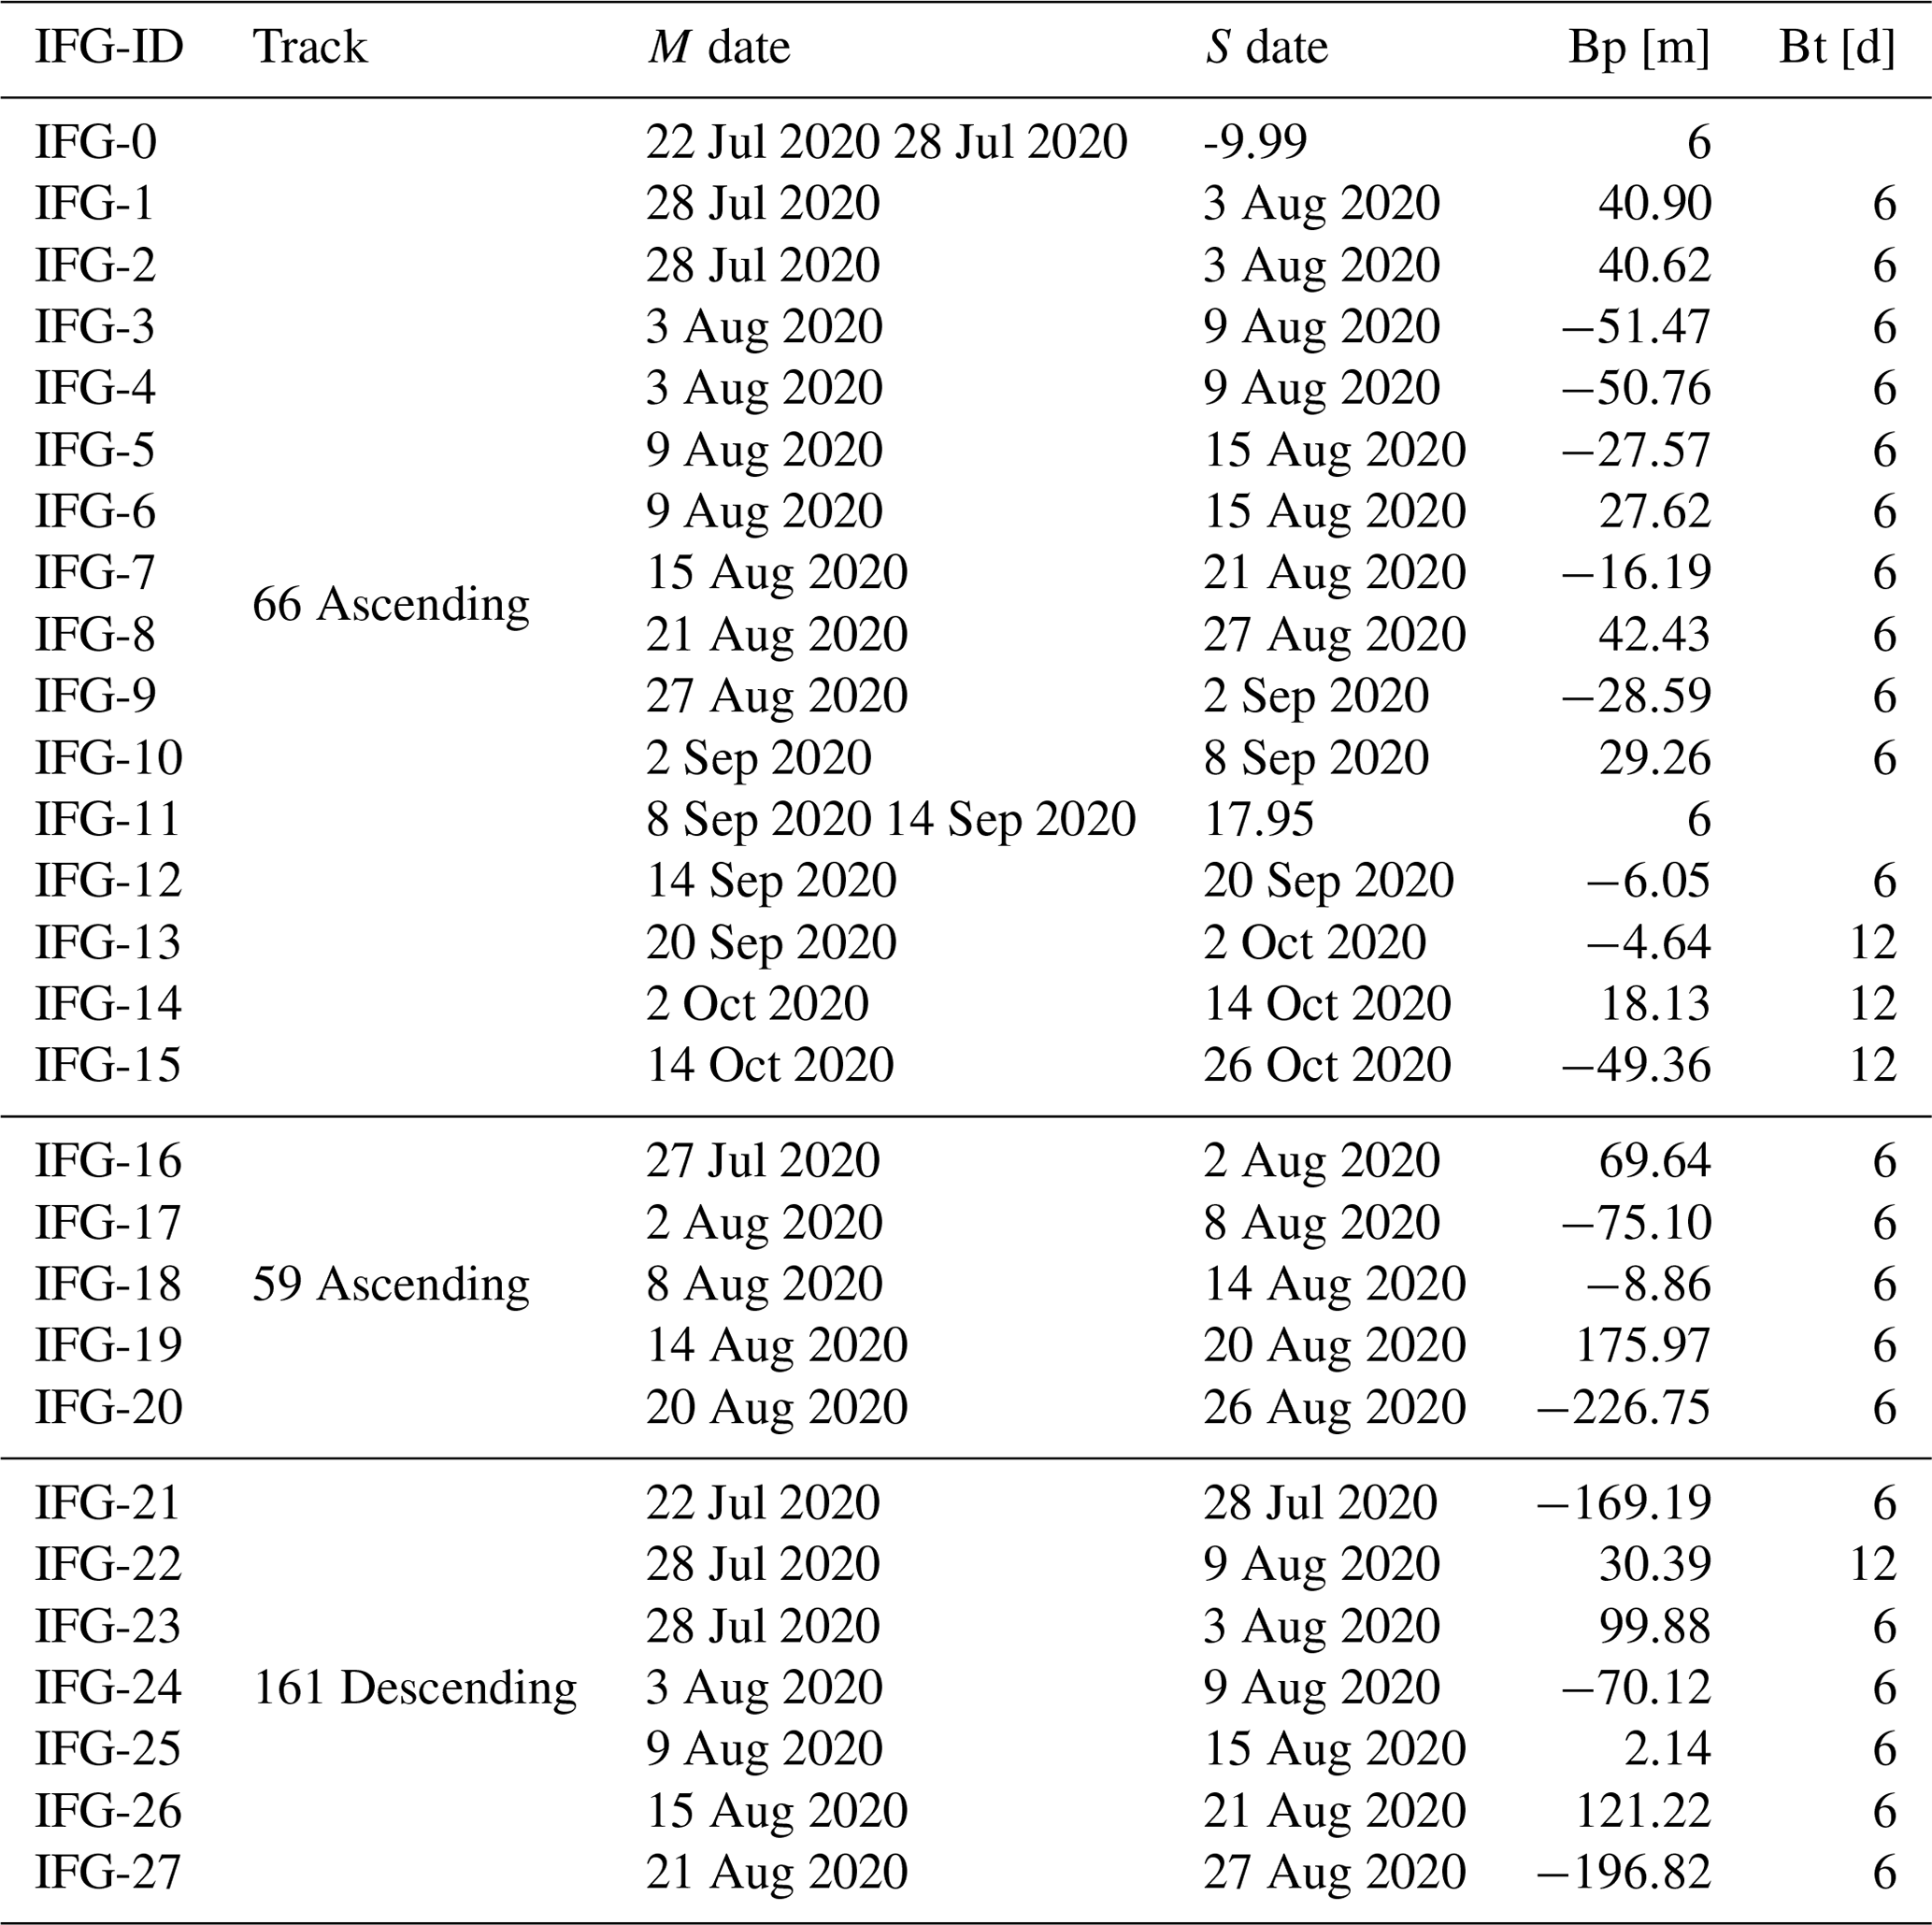
Bt: temporal baseline; Bp: perpendicular baseline.
Table 2LiCSAR frames, analysis periods, and the total number of IFGs used in this study.
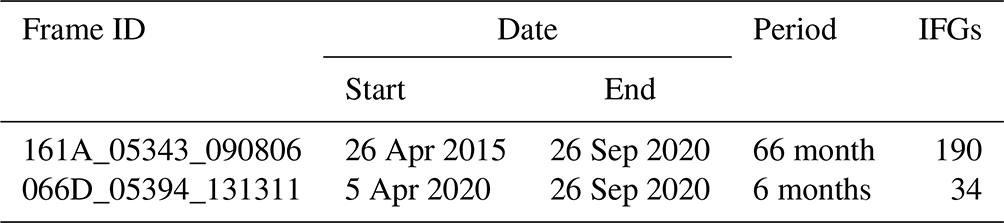
Table 3Sentinel-2 optical images collected for the study case.

The temporal baselines for all InSAR pairs are 6 d, except the last three pairs of the ascending orbit 66 that have 12 d. Furthermore, since a bad coherence map of the IFG-24 (Orbit 161) may lead to misinterpretation of results, prior acquisition data (before 3 August) are selected to generate the co-event interferogram (IFG-22). Therefore the temporal baseline is 12 d. The gray rows in Table 1 represent the co-event interferograms of the three orbits. The perpendicular baselines also guarantee a good quality of InSAR studies (Braun, 2019). As LiCSBAS time series analysis aims to investigate long-period displacements and velocities over a large area: 34 interferograms from orbit 66 and 190 interferograms collected from the 161 ascending tracks (Table 2), are selected for the present study.
Four aspects are investigated and compared in the present case study:
-
the SAR Interferometric (InSAR) methodology, which is subdivided into three sub-groups,
-
DInSAR for the phase changes (fringes),
-
CCD for the coherence change detection,
-
time series analysis and LiCSAR data,
-
-
the optical image processing.
Every image contains the description of its source, i.e., IFG-ID (Tables 1–3) or the image's acquisition dates.
3.1 SAR interferometric methodology
The synthetic aperture radar (SAR) is an active microwave imaging system. It is independent of sunlight and penetrates clouds, unlike passive optical imaging systems. The interferometric SAR method uses the phase components of co-registered SAR images of the same pixel to estimate the topography and to measure the surface change in the target area (Kim, 2013). At least two constellation images are needed to generate an interferogram, which contains topographic, atmospheric effect, baseline error, and noise components (Goudarzi, 2010; Kim, 2013; Netzband et al., 2007):
where ϕdisp is the line-of-sight (LOS) displacement, ϕflat the flat earth phase, ϕtopo the topographic phase, ϕatm an atmospheric phase, ϕorbit the baseline phase, and ϕnoise noise phase contribution (Kim, 2013).
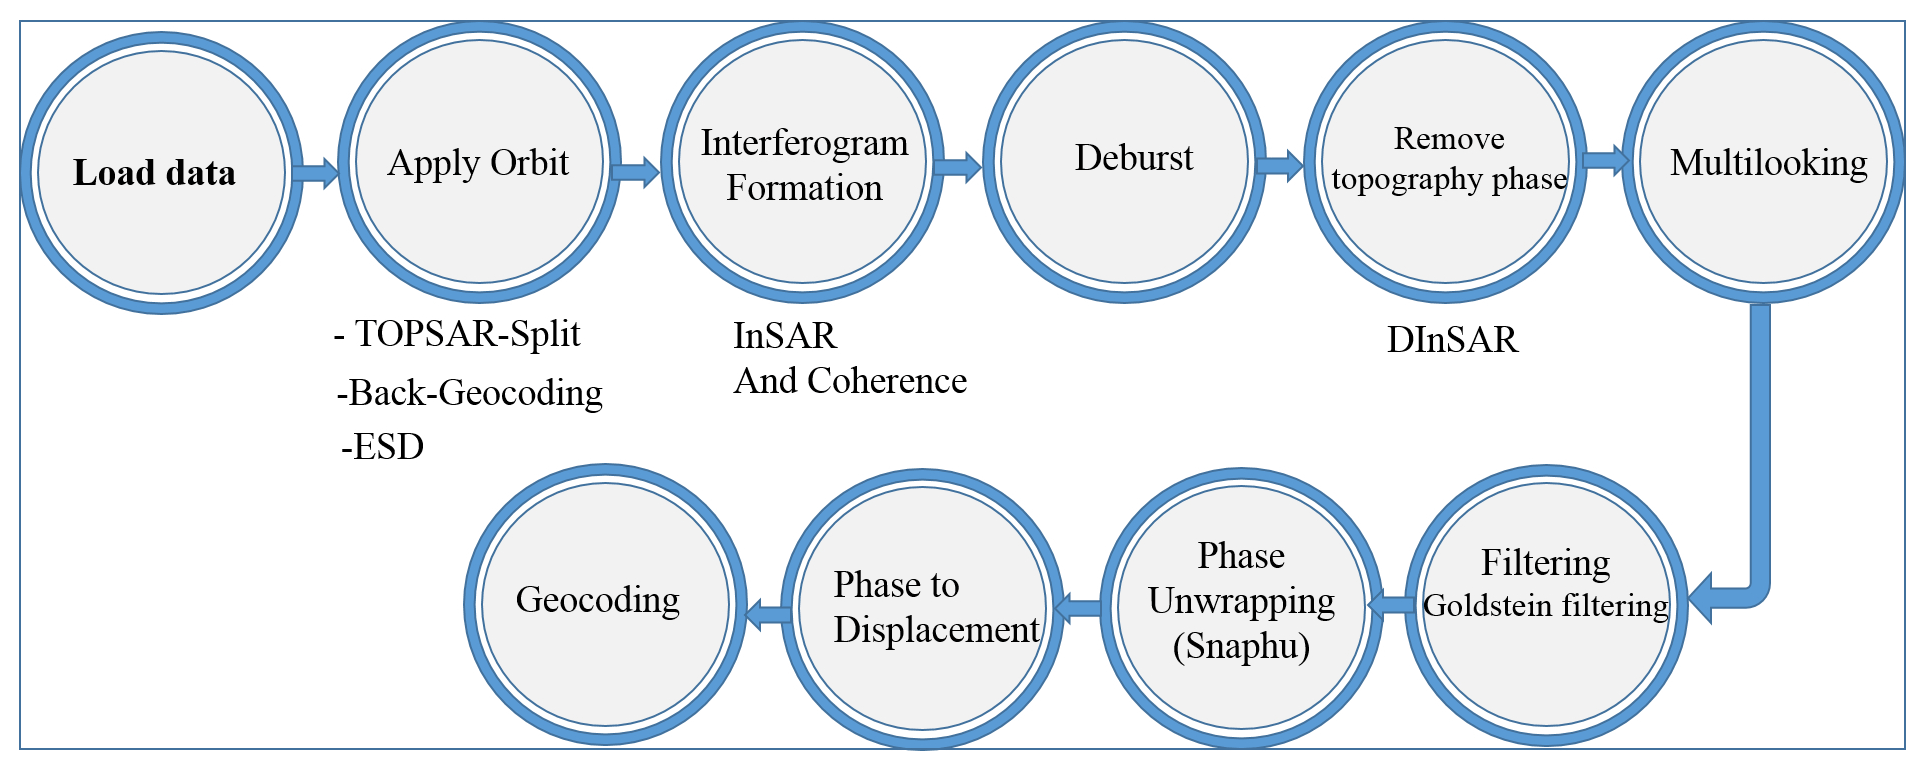
The main steps of processing data using SNAP software (DInSAR and CCD) are depicted in Fig. 4. It is worth noticing that for CCD processing, it is not necessary to follow the whole workflow (DInSAR, phase unwrapping, and phase to displacement).
3.1.1 Differential radar interferometry (DInSAR)
Differential radar interferometry (DInSAR) exploits the phase difference to measure coherent changes or deformation between two image acquisitions. It is often used for ground subsidence measurement (Canaslan Çomut et al., 2020; Galve et al., 2015). One of DInSAR's limitations is that the changes are not measurable in the case of non-coherent events (e.g., rapid landslide) (Braun, 2019) such as the present study.
3.1.2 Coherence change detection (CCD)
The estimated coherence is considered a quality indicator of an interferogram (Jacquemart and Tiampo, 2021). Actually, it indicates that the phase and amplitude of the received signal express the degree of similarity between the image pair. The pixel coherence γ of two SAR images is estimated on the basis of N neighboring pixels (Jia et al., 2019; Wang et al., 2018).
where S1i and S2i are the complex signal values of the SAR image pair, N is the window of neighboring pixels, and * is the complex conjugate.
The coherence values range between 0 and 1 so that the map is represented as a gray color, where 0 is white and 1 is black.
3.1.3 Time series analysis and LiCSAR data
The “Looking into Continents from Space with Synthetic Aperture Radar” (LiCSAR) system automatically processes Sentinel-1 datasets for InSAR use and generates wrapped and unwrapped interferograms and coherence maps (Lazeckỳ et al., 2020b), with a final product resolution of ∼26.5 m (Lazeckỳ et al., 2020a). For such purposes, the open-source LiCSBAS software, adopted in the present study, is used for InSAR time series analysis based on LiCSAR data. It can generate maps of LOS displacement velocity and deformation time series for all processed frames. Furthermore, it is easy to implement and does not require high-performance computing facilities (Morishita, 2021).
In addition, the mechanism of landslides can be thoroughly studied through LiCSBAS analyses. They rely on the InSAR time-series analysis package integrated into LiCSAR (Lazeckỳ et al., 2020b). Such time-series analyses are very useful in identifying, for a given landslide or ground deformation and displacement, the prior patterns of ground movements versus the time.
3.2 Optical image processing
The optical sensors are passive detection means that need sunlight and clear weather conditions to exploit the data. The Sentinel-2 is a multi-spectral instrument (MSI) that measures reflected solar radiance in 13 bands with a moderate spatial resolution of 10 m in the red, green, blue, and near-infrared bands (Laneve et al., 2021).
The optical data collected from the ESA platform (Sentinel-2) are treated and plotted using QGIS software to generate true-color images (bands 2, 3, and 4 corresponding to RGB). The present study skips the image of 3 August 2020 due to bad weather conditions, so that only the two images collected and mentioned in Table 3 were used to validate the ground changes detected by InSAR.
The case studies are located in two different sites, and both areas of interest are located in Algeria. They have a hilly relief: the first one is located northeast of Mila City (Grarem) and the second is in the western part of Mila City (Kherba). To monitor the AoIs, several images are processed and used with different orbit directions (total of 35 ascending and descending acquisitions; see Fig. 1) to catch deformation from different angles along the sensor's LOS. The InSAR technique is used in both areas to detect land deformation and landslides triggered by the earthquake.
The adopted methods are applied for the Mila case study to
-
detect and measure the co-event surface displacements and landslides, caused by the earthquake (CCD and DInSAR);
-
monitor their dynamic evolution in the first weeks and months, in the post-event period (CCD and LiCSAR data);
-
analyze their possible initiation ahead of the earthquake by months and years, in the pre-event period (Time-series methods and LiCSAR data);
-
corroborate the results by comparing several method outputs, i.e., SAR (CCD, DInSAR, LiCSAR), aerial optical photo (Sentinel-2), and field surveys.
The quality of the SAR image is consistent with the topography slopes and area roughness. Actually, the AoI has rough topography, hills, and rivers (Fig. 2). Selecting either ascending or descending passes, relying on which will avoid some limitation of InSAR, is an extremely essential action to infer the deformation from various angles. Therefore, considering the regional topography and geology of the AoI is necessary to process InSAR and interpret results.
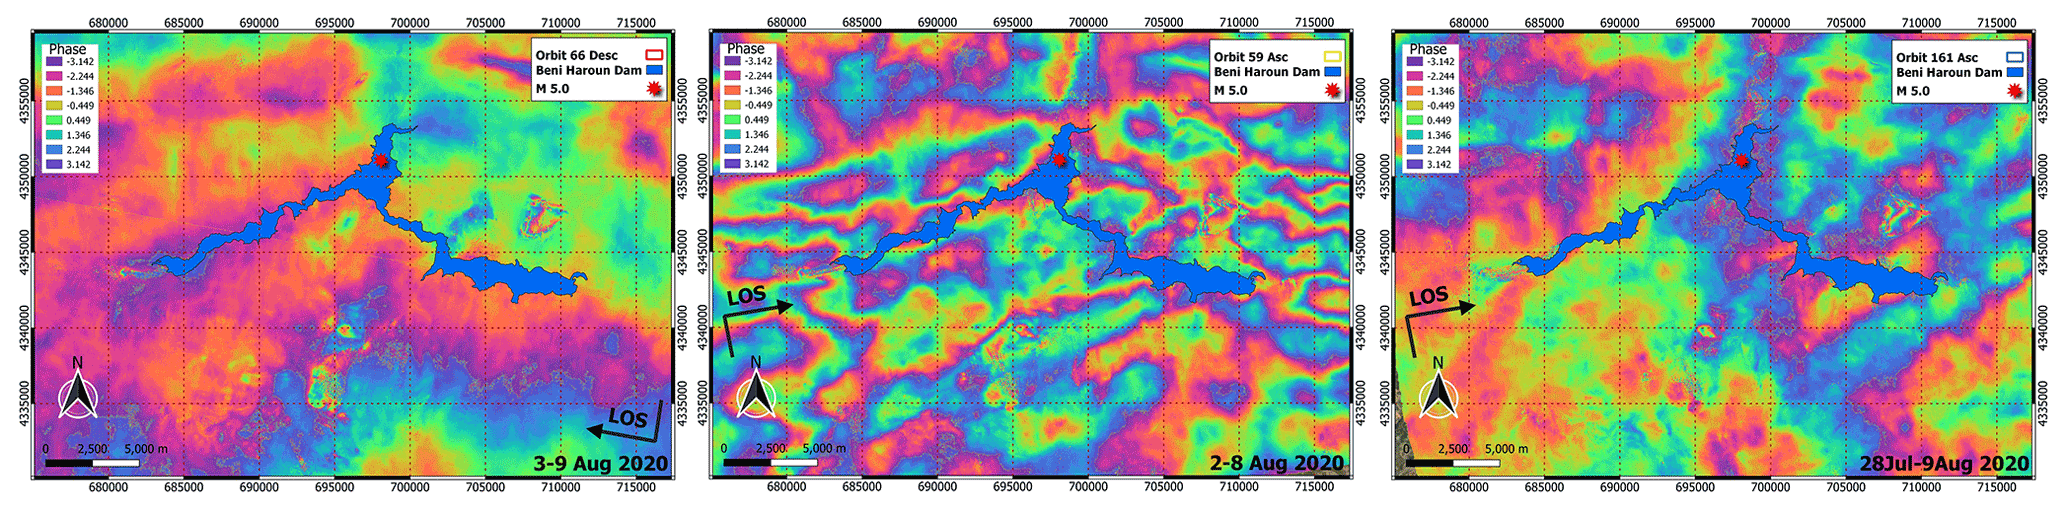
Figure 5Wrapped interferograms from Sentinel-1 for IFG-3 + IFG-4, IFG-17, and IFG-22. The red star is the epicenter location (USGS,2021a).
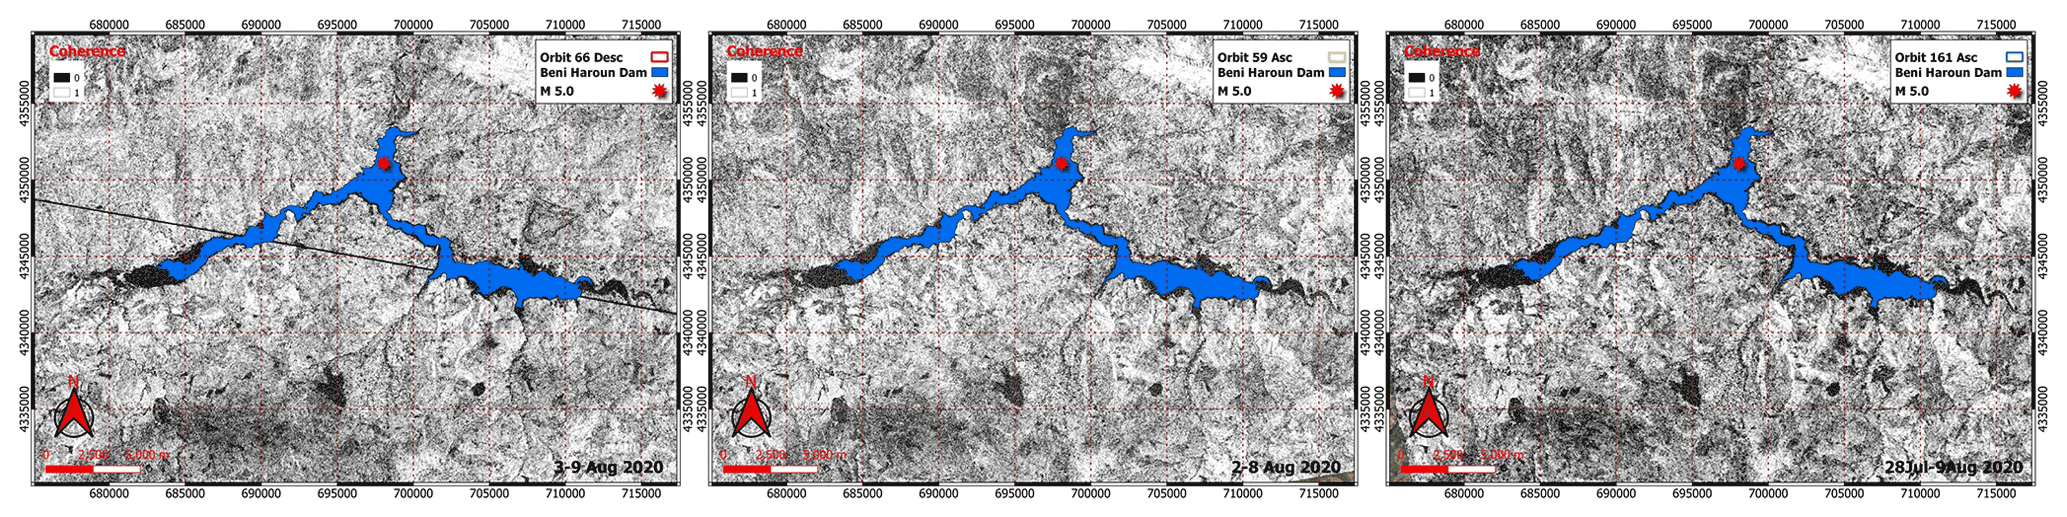
Figure 6Mila area, InSAR coherence maps for IFG-3 + IFG-4, IFG-17, and IFG-22.

Figure 7Detected fringes in interferograms 3, 17, and 22, with images focused on the Grarem zone.
The differential InSAR (DInSAR) method is helpful to investigate co-seismic effects and detect ground changes. The produced interferograms and coherence images are projected to WGS84 reference, with a pixel size of 13.4 m. The unwrapped interferograms present phase contribution of many noise resources (atmospheric) (see Fig. 5). In general, strong earthquakes cause large-scale fringe patterns around the epicenter, which is not the case in the event under study (a moderate earthquake). Processing DInSAR analysis may then lead to misinterpretation due to atmospheric contribution in differential phase interferograms (Figs. 5 and 6). In the study case, no regional deformation due to the earthquake is observed, and there is no need to continue investigating the dam and the two bridges by simple DInSAR. However, to monitor the dam and bridges, it is highly recommended to use PS-InSAR for regional and local ground deformation detection (Hooper et al., 2004; Rapant et al., 2020; Sanabria et al., 2014).
This moderate earthquake has triggered small deformation and landslides in Grarem, Kherba, and Azeba. The IFG-3 and IFG-4 are merged into one image due to the AoIs (Kherba and Grarem), which are located in two different image acquisitions of the descending orbit number 66.
4.1 Case of Grarem
The detection of deformation or changes between two InSAR images reveals a small change in the region of Grarem. This change is observed as small fringes, with each fringe corresponding to a displacement of a half-wavelength (λ=5.546 cm) in the LOS direction (Figs. 7 and 9). Usually, coherent change does not appear in coherence images as a dark region, but in the study case, the outer borderline of the fringe region shows incoherence change, which is clearly visible in coherence maps (Fig. 8).
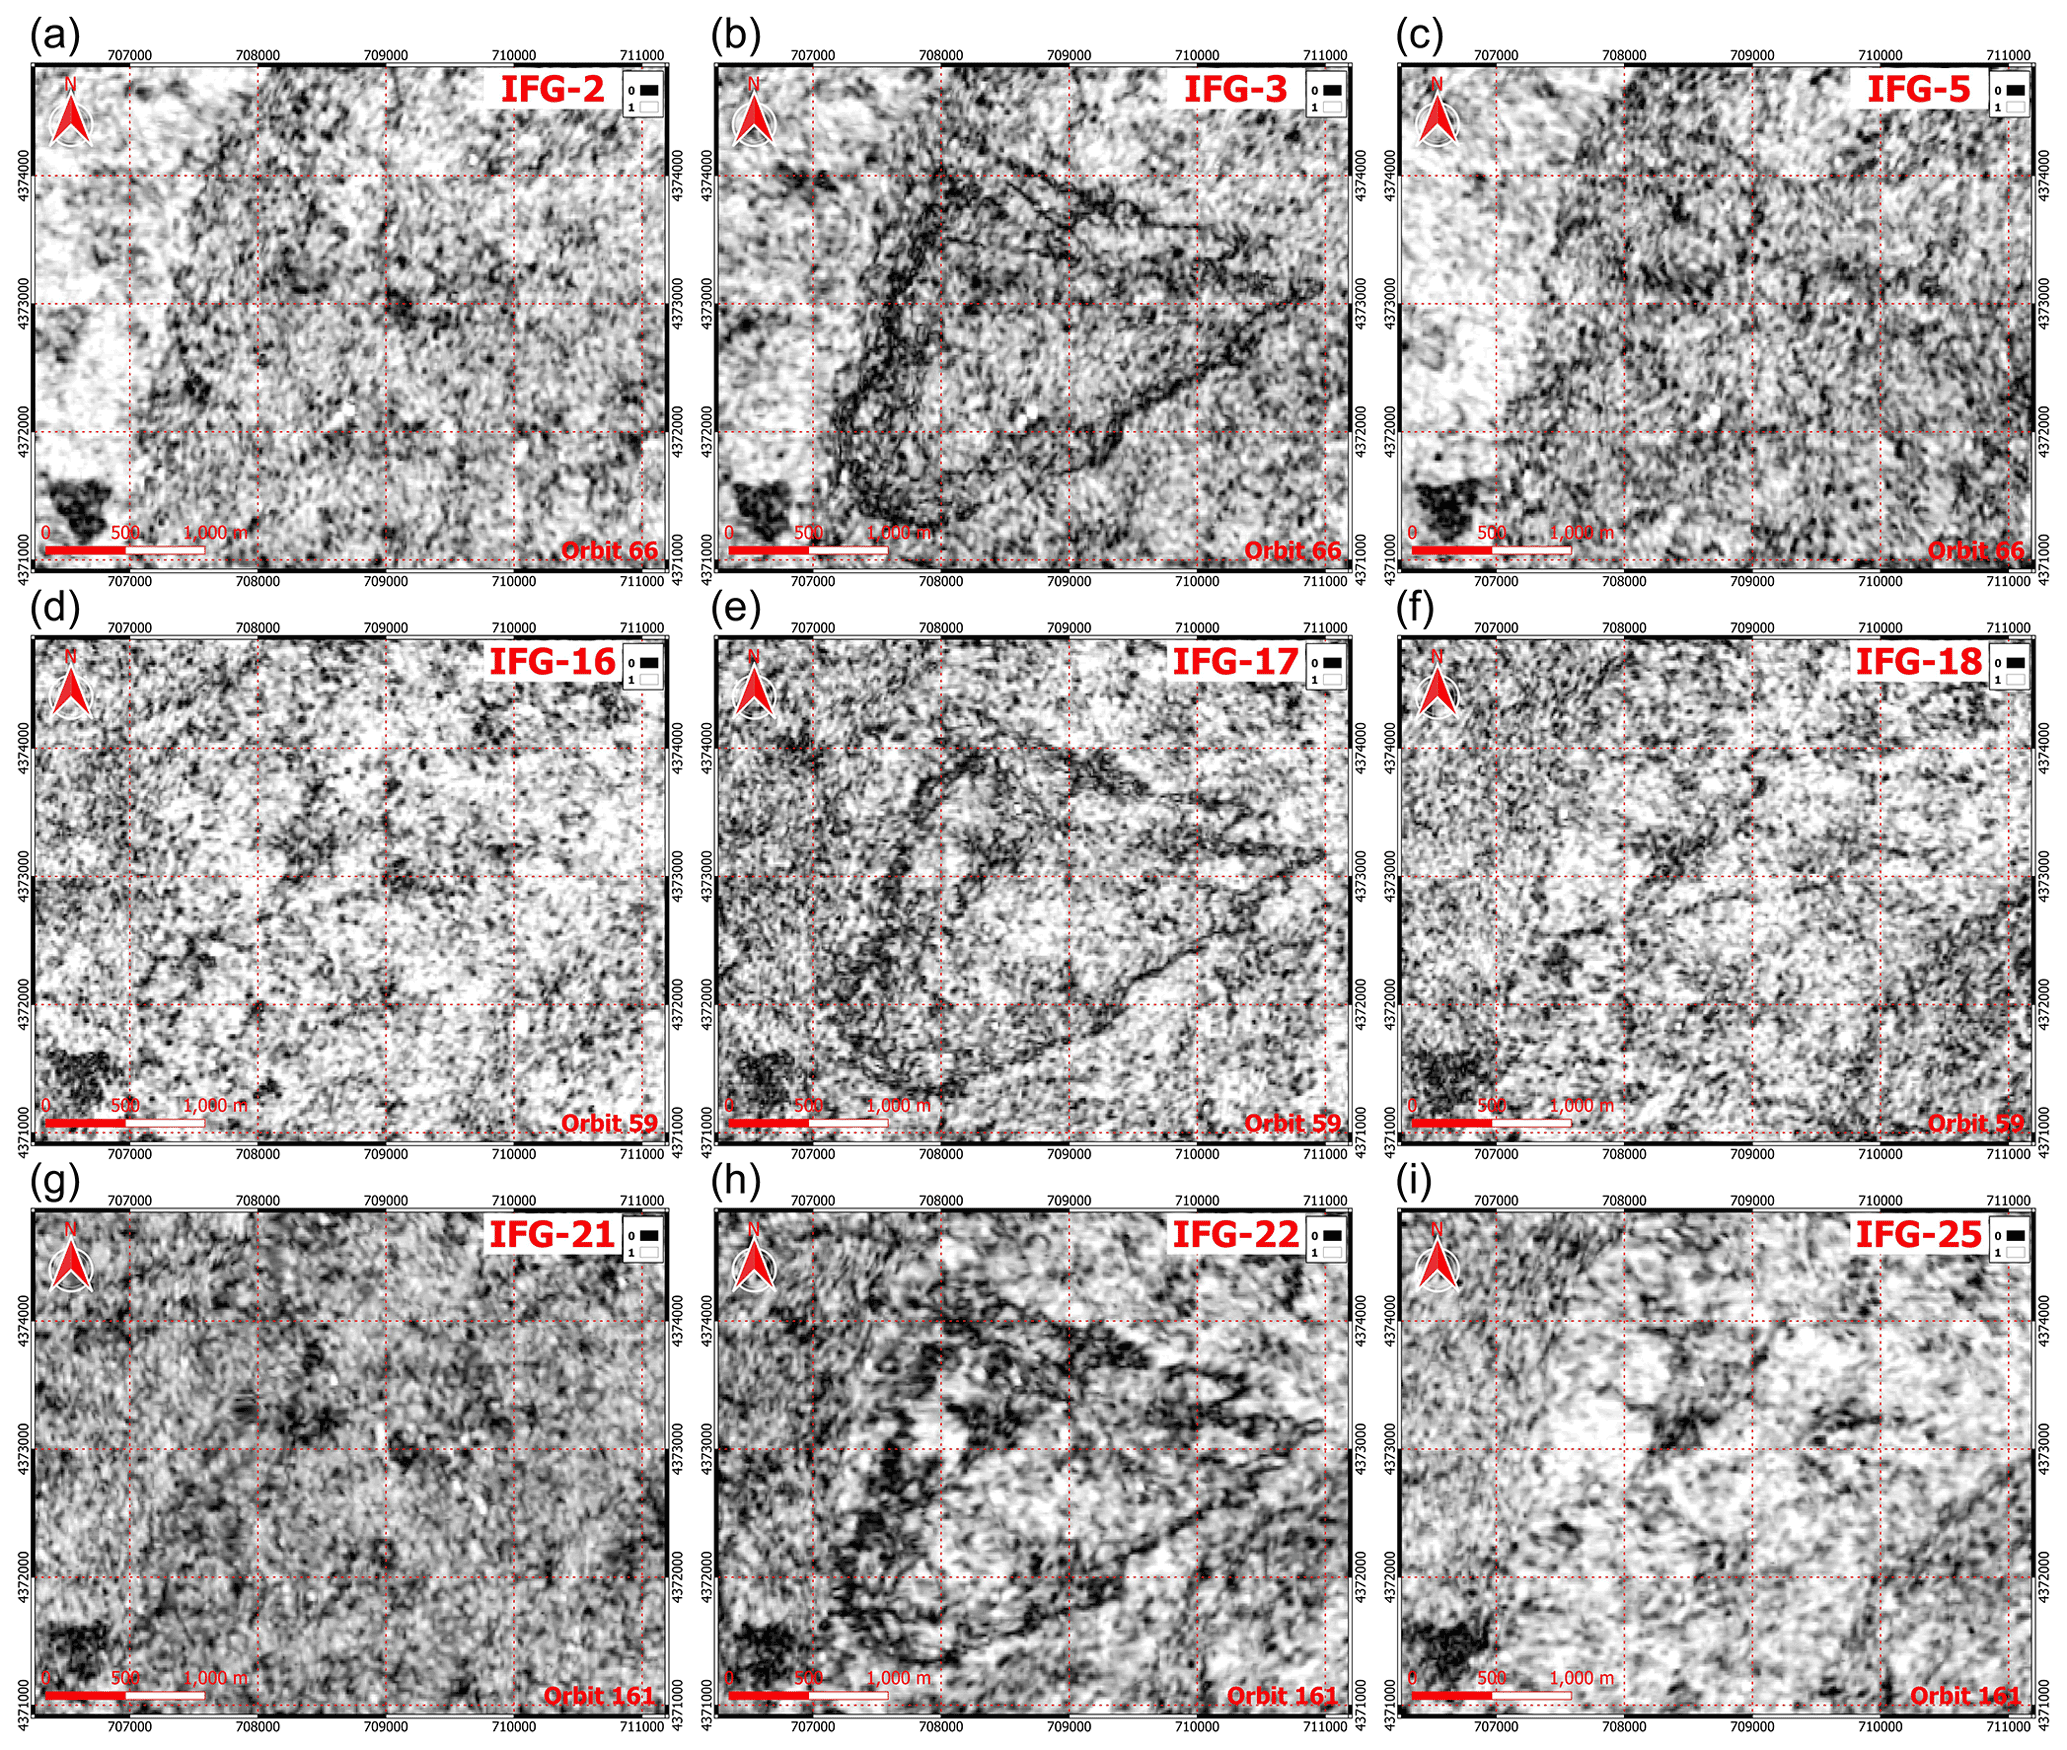
Figure 8Coherence maps of Grarem AoI: the images represent pre-event (a, d, g), co-event (b, e, h), and post-event (c, f, i) for orbits 66, 59, and 161. Note: the co-event maps for the three orbits show the decay of coherence that is triggered by the earthquake.
A time-series analysis then needs to be performed to prove whether this contour was formed on the event occurrence date (7 August 2020). The coherence maps of the co-event period present a dark polygon that is related to incoherent change or deformation. But inside the AoI, the results show some coherent changes, which mean that this area has deformed as a block up or down.
According to phase and coherence maps, the affected area is approximately 3.94 km2, with an average runout distance of 2.6 km from top to downhill (Fig. 2a distance from point 1 to point 2).
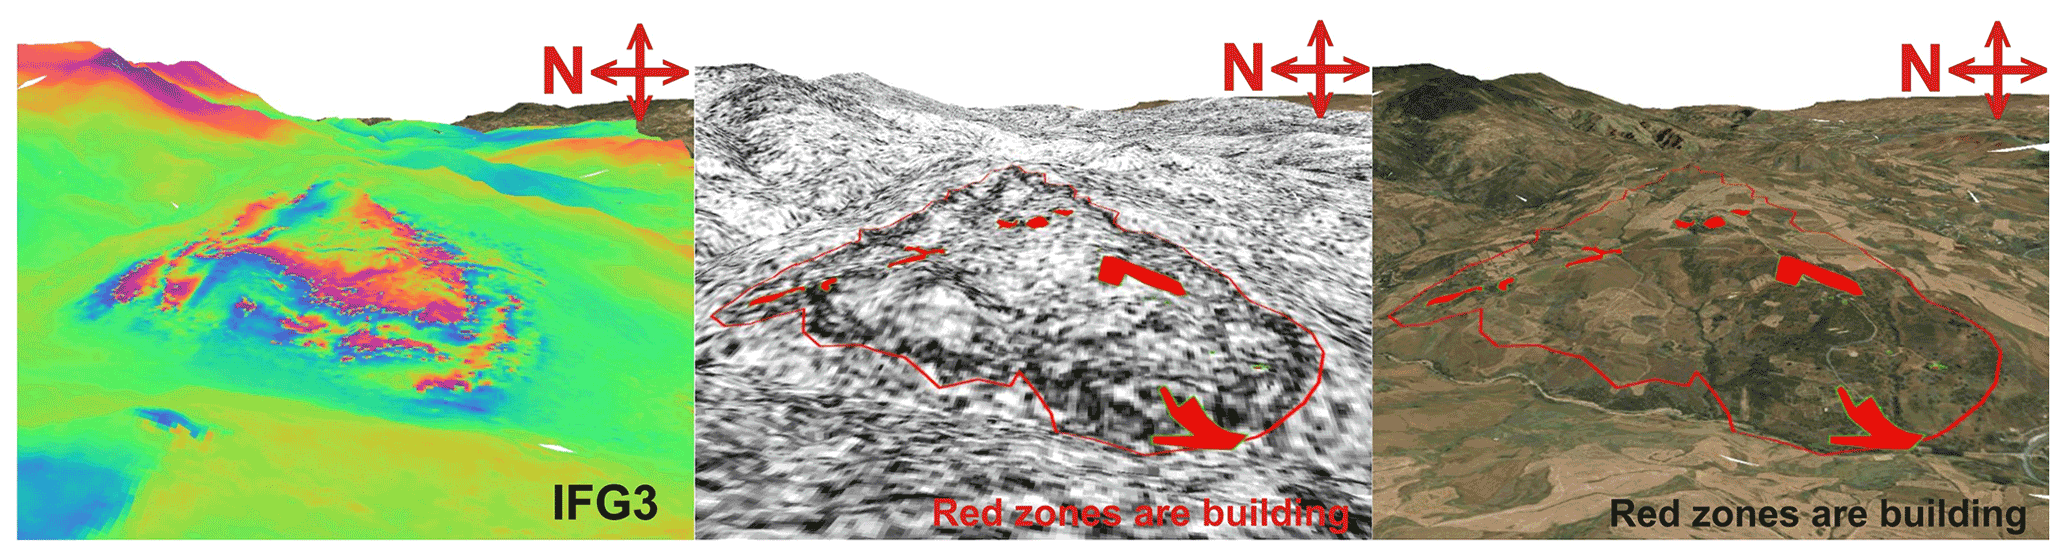
Figure 9The 3D view of Grarem area, images of IFG-3. Each fringe is the wavelength divided by 2 in LOS, and red zones represent existing building compounds (QGIS, ESRI basemap).
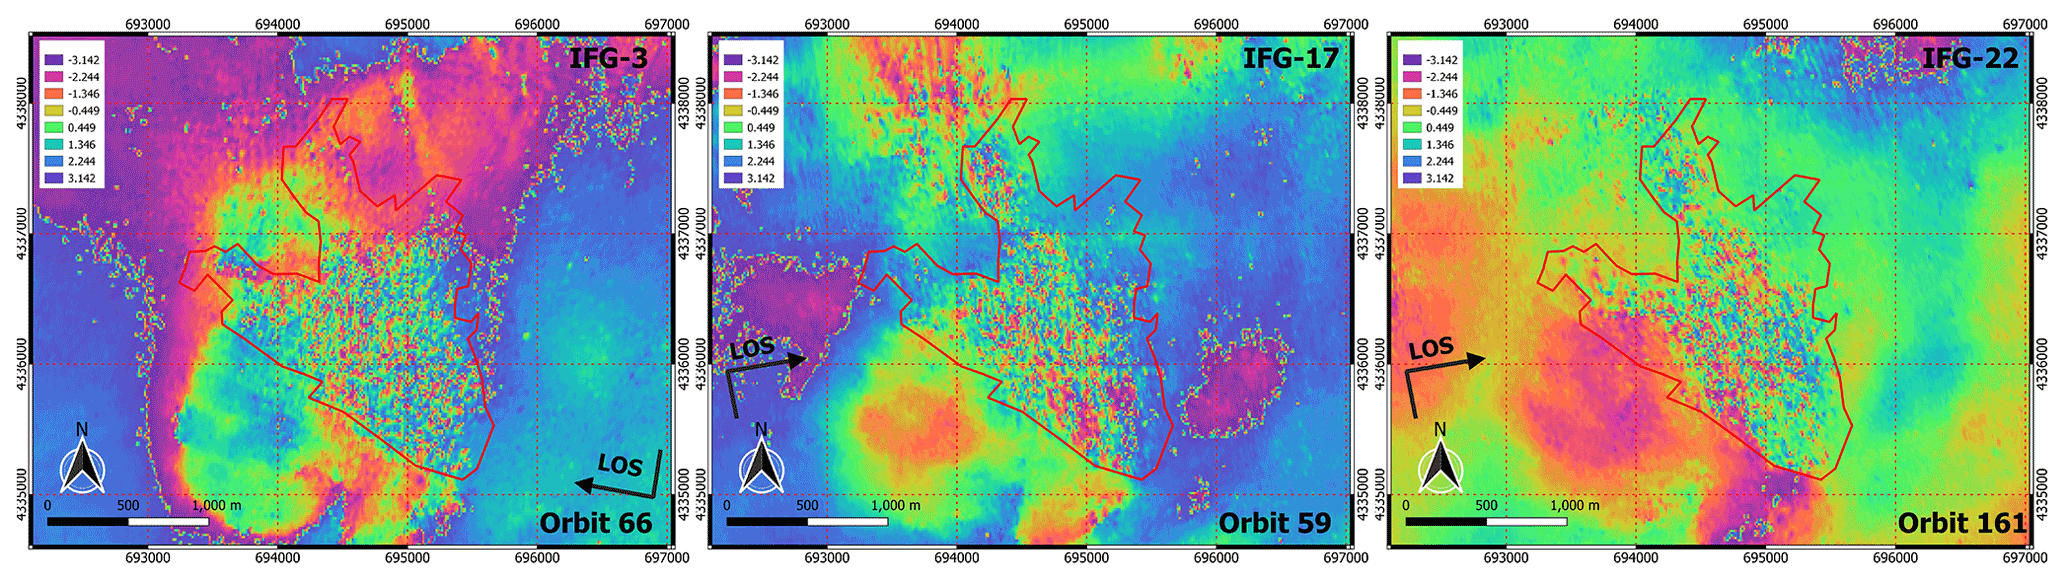
Figure 10Kherba main event interferograms; biased pixels inside the red line correspond to incoherent changes.
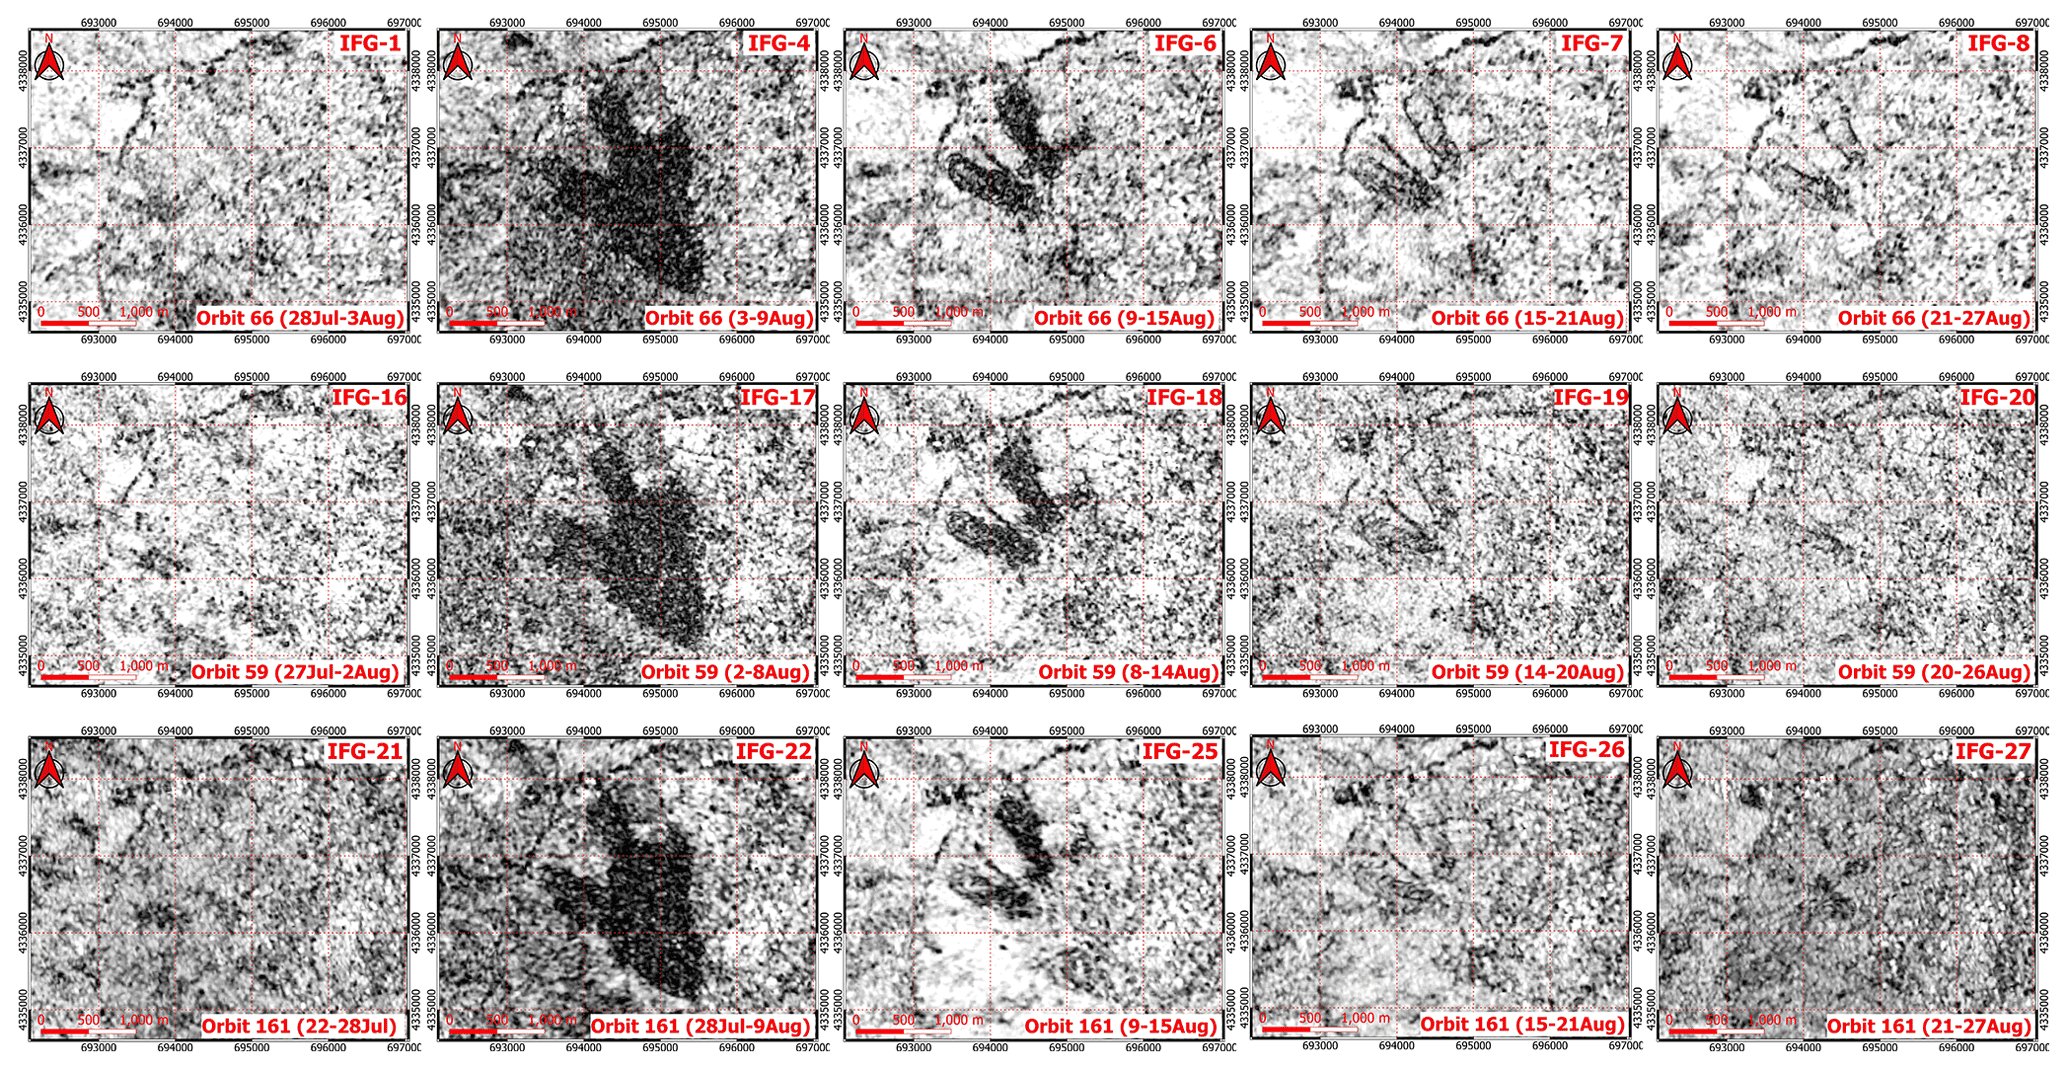
Figure 11Coherence time series maps of the Kherba landslide, Sentinel-1.
4.2 Case of Kherba
DInSAR has abundantly demonstrated its reliability as a technique for monitoring slow movements (Cascini et al., 2013; Wempen, 2020). In the present study, Kherba's landslides exceed the capabilities of DInSAR since this method cannot measure the deformations due to incoherent change at the first event (Fig. 10). Phase images of the region of interest (RoI) show a clear decorrelation, and consequently, the phase information is no longer convenient for analysis.
In such cases of incoherent changes in the scene, DInSAR is useless, whereas the coherence change detection (CCD) method remains useful and suitable to monitor the event.

Figure 12The 3D view of Kherba landslide, Sentinel-1 coherence images of orbit 66 with a 6 d temporal baseline; the dark areas are the landslide and deformation zones.
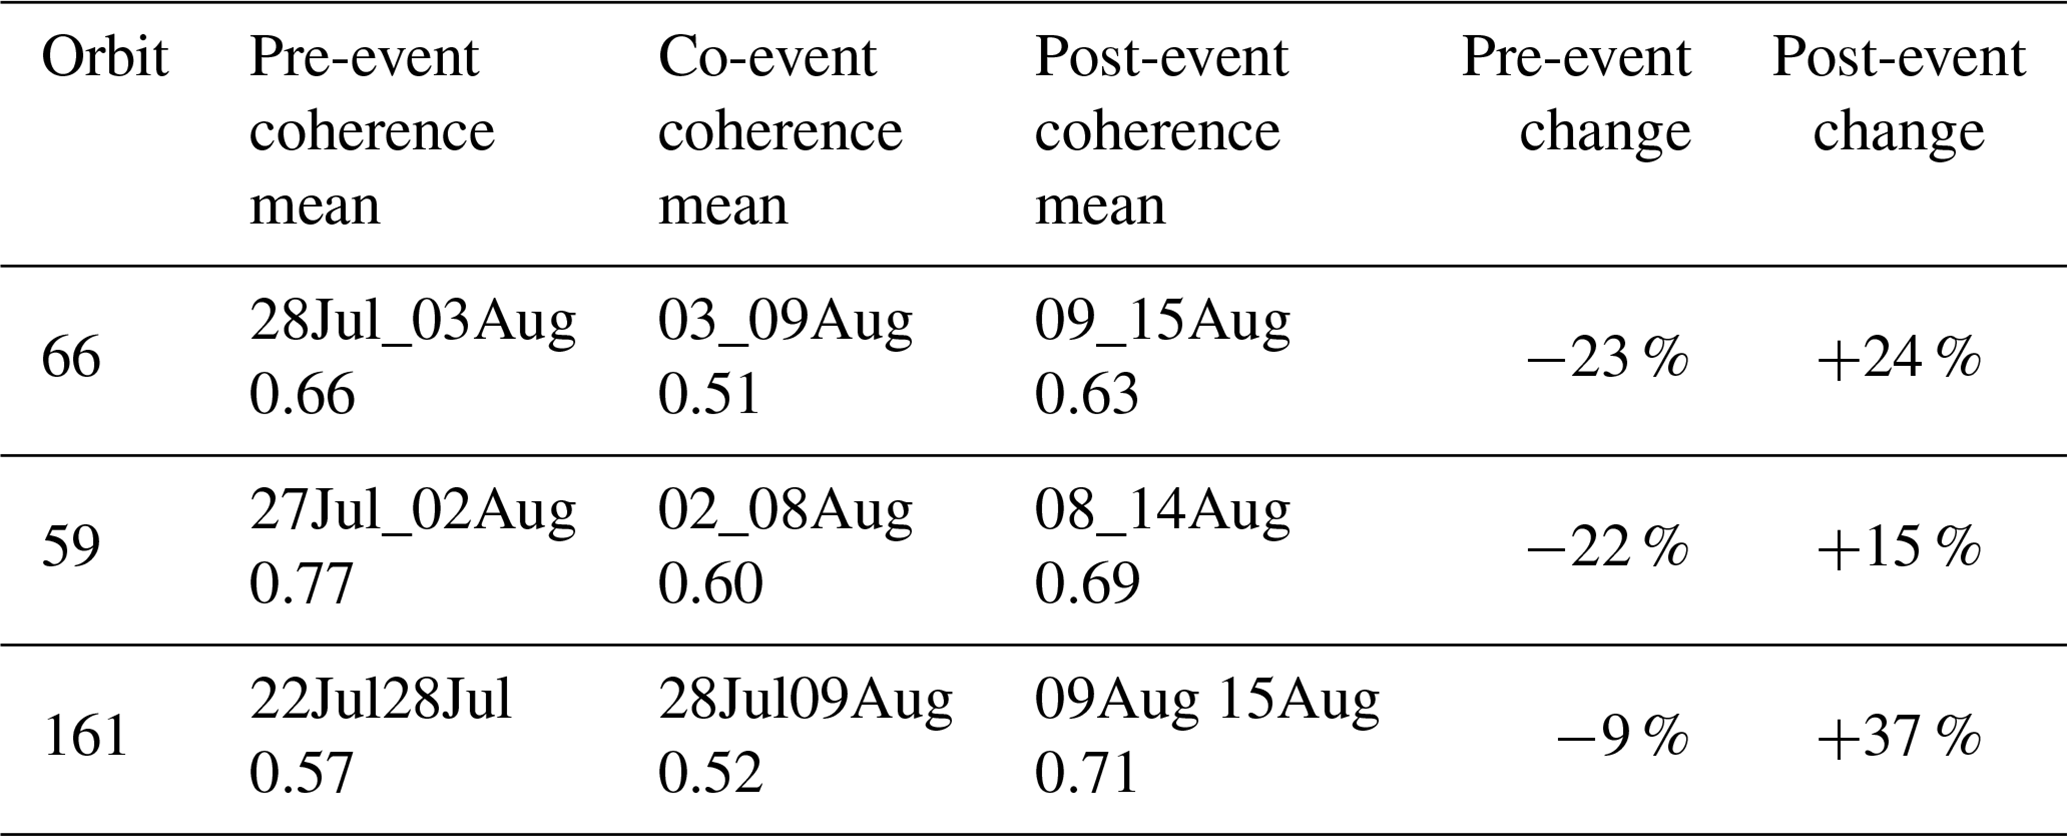
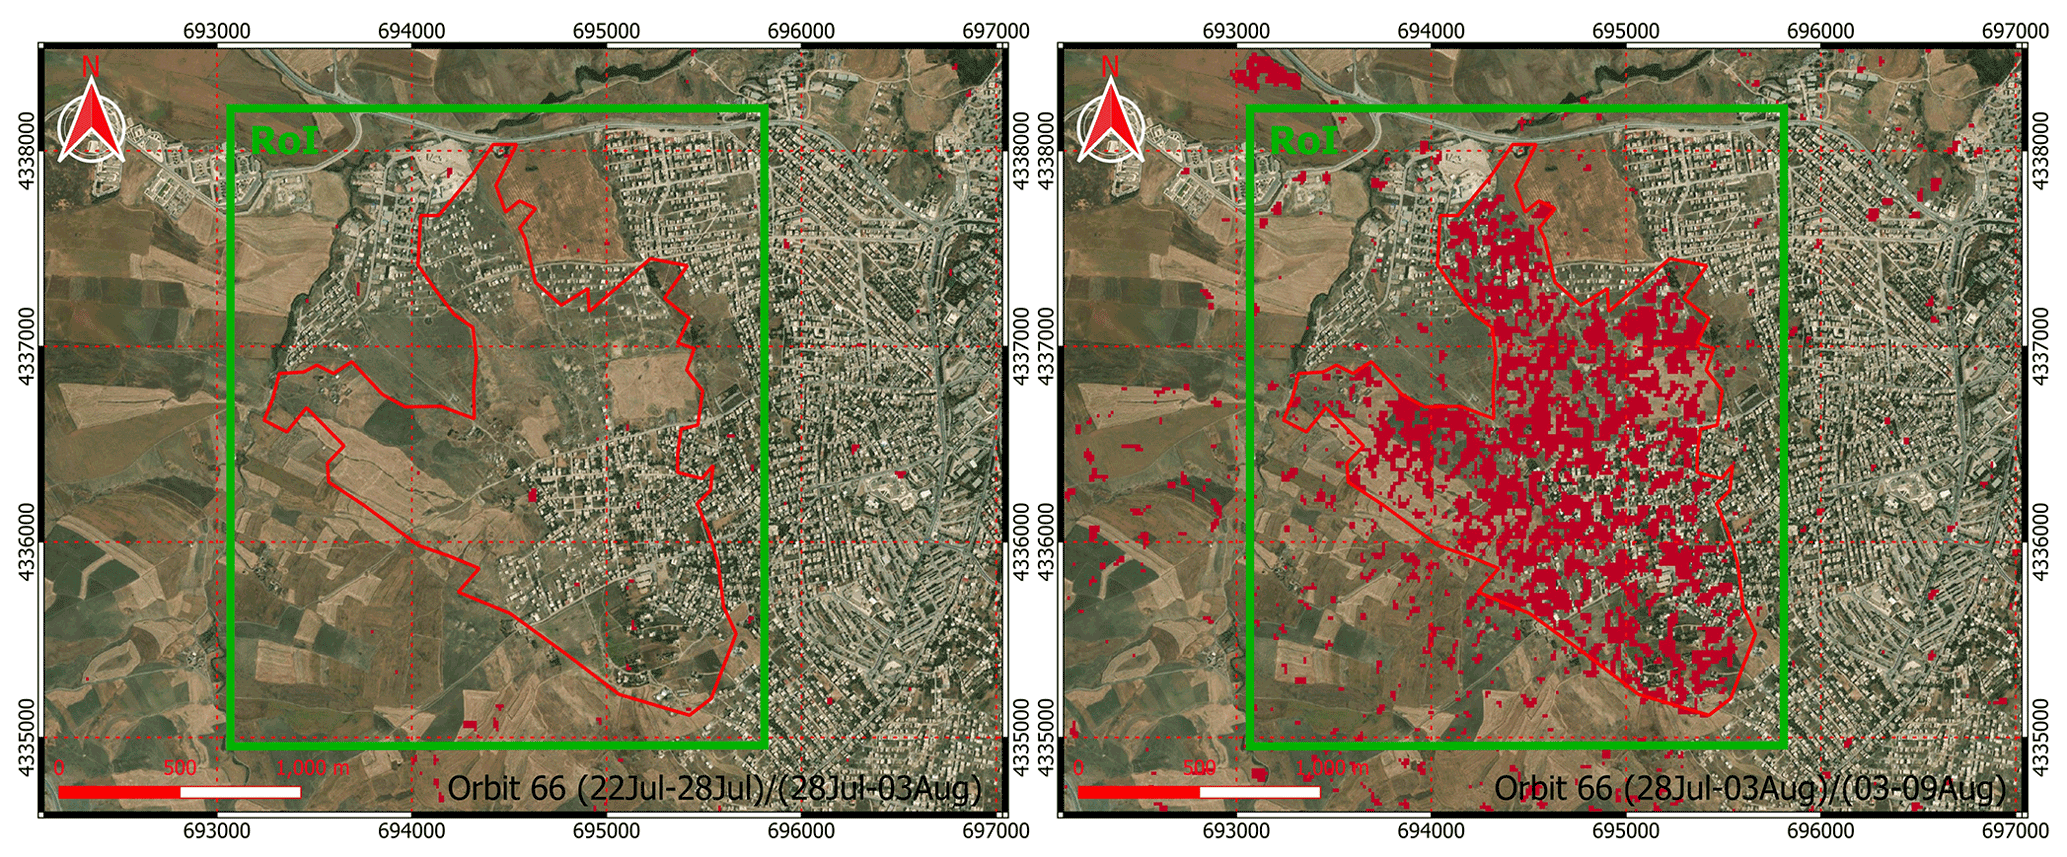
Figure 13Pre-event coherence ratio (left panel), co-event coherence ratio (right panel), Sentinel-1 orbit 66. The green box indicates the scope of the RoI, and red spots represent significant changes of coherence in the landslide region (QGIS, ESRI World Imagery basemap).
4.2.1 CCD times series analyses
For the case study, the coherence maps (Figs. 11–13) show very low coherence in the Kherba area, indicating that some changes have occurred. The CCD quantifies changes between two SAR images and is represented as a decay of coherence values (co-event maps). Decreases in coherence values can be caused by a variety of factors such as geotechnical landslides as well as water and vegetation. To distinguish between natural low coherence and induced surface changes, a second coherence map (pre-event or post-event) is required to serve as a reference, which can be compared with the main co-event images. It is preferable to mask the rest of the non-changed area using a ratio of pre-event to co-event images and filter values equal to or less than 1 (see Fig. 13).
The CCD time-series analysis displays the changes in the AoI over time for the Kherba landslide. The dark region represents the main changes that occurred during the co-event period (earthquake date). The landslide shape is divided into two toes at the lower side of the hill, as shown in Figs. 11 and 12.
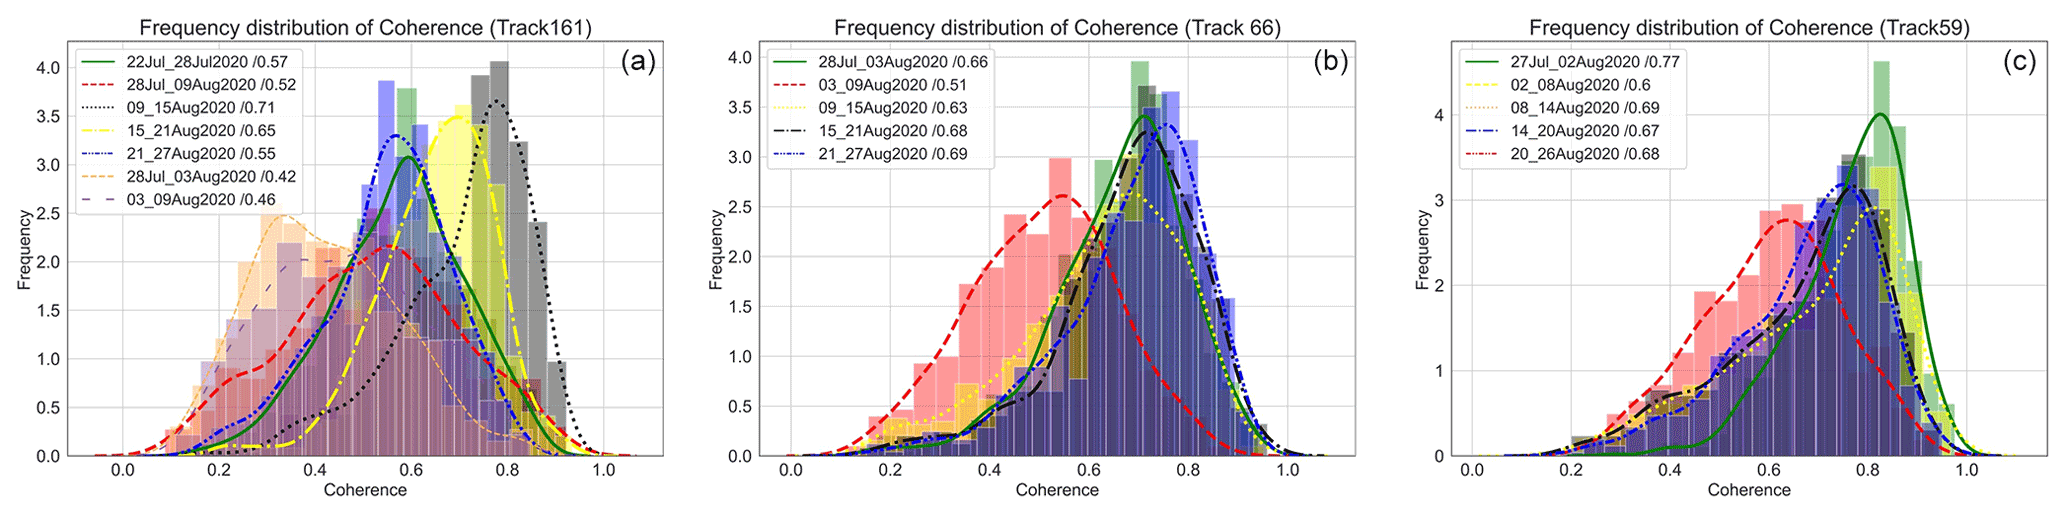
Figure 14Frequency distributions of coherence values within RoI for all coherence time series images.
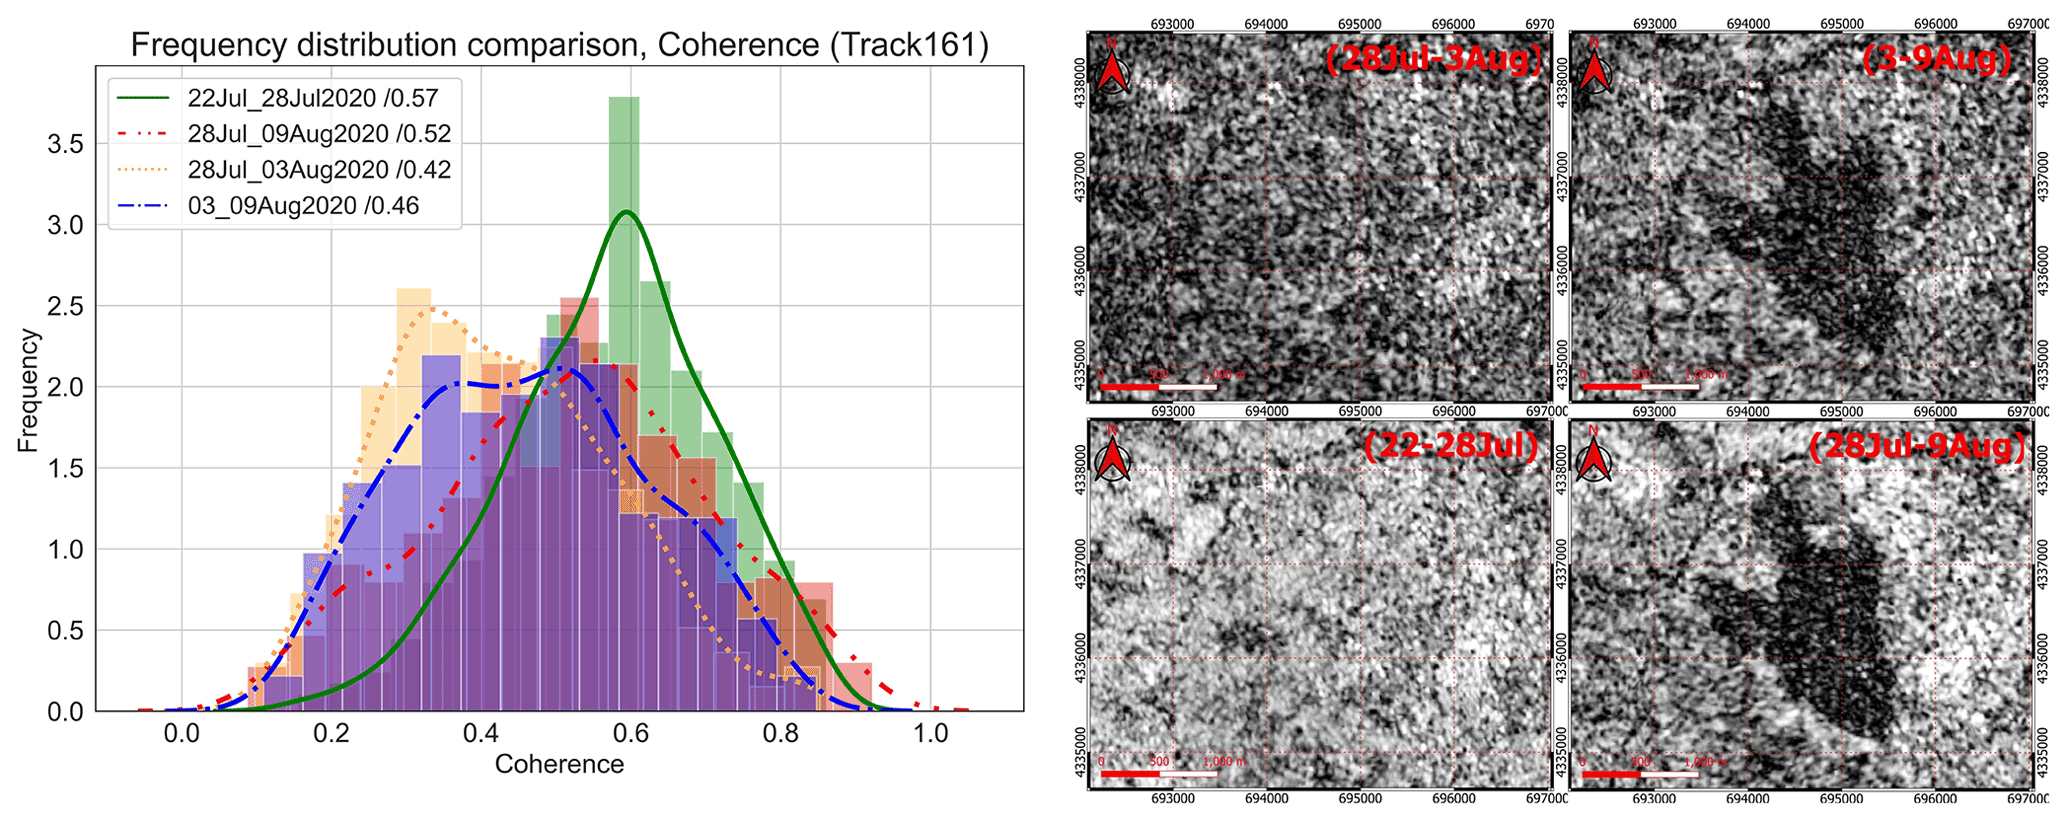
Figure 15Effect of bad coherence: the cause is the acquisition of 3 August start at (17:28:15 UTC, orbit 161) under bad weather conditions in the acquisition time according to precipitation site (WWO, 2021) (rainfall in daytime), compared to the acquisition of the same day but not the same time (05:37:58 UTC for orbit 66).
During the first week following the earthquake, changes are detected in the lower side of the hill and lasted until the late date of August 2020 (IFG-8 orbits 66, IFG-27 orbit 161, and IFG-20 for orbit 59). Afterwards, many other sources of noise were present in the AoI, which makes this technique less efficient (weather, human activities). Most of the processed images are 6 d intervals, except orbit 161 in which the co-event interferogram (IFG-24) was not good enough (bad coherence) to compare with other pre-post-event images, so it was replaced by IFG-22. Figures 14 and 15 illustrate how the interferogram selection may change the interpretation of results.
To quantify the change, an RoI represented in Fig. 13 (green rectangle) is selected for analysis. The plots in Figs. 14 and 15 also show the frequency distributions of coherence values within the RoI. Table 4 displays the calculated average coherence values of the RoI and the percentage of changes. For the orbit 66 pairs, the RoI average coherence starts at 0.66 during the pre-event period (IFG-2) and decreases to 0.51 during the co-event period (−23 %) (IFG-3). For orbit 59 pairs, it decreases by 22 % after an initial mean value of 0.77 (IFG-16) and a mean value of 0.60 (IFG-17).
The last orbit 161 pairs make an exception due to the initial bad coherence maps (IFG-23 and 24), as shown in Fig. 15, where the dotted green line has low coherence compared to the co-event coherence map (red dotted line). So, the orbit 161 acquisition of 3 August must be skipped and not used for the analysis. It was replaced by the previous acquisition on 28 July. However, the previous pair (IFG-21 and IFG-22) had a value of 0.57 (IFG-21) that decreased to 0.52 (IFG-22), representing a 9 % change.
The lines in Fig. 14 indicate the frequency distributions of coherence time series maps. The green line in Fig. 14a represents the pre-event coherence distribution, while the red line represents the post-event coherence distribution, which clearly shows a decay of the mean coherence after the main event (dates and values are presented in the legend).
Figure 15 illustrates why the interferogram of 22–28 July (green line) is chosen for the pre-event (initial) even though there is another IFG (28 July–3 August green dotted line) only 4 d before the main event (7 August 2020).
The surface area derived from the coherence images covers 2.1 km2, and the shape ends in two toes. The runout distance is 2.4 km for the right toe and 2.15 km for the left one. The CCD method has the potential to differentiate between the areas impacted by induced changes and those affected by other sources of noise. The ratio operation is useful in canceling out other noise factors and improving the detection of changes in the region.

Figure 16Sentinel-2 optic images: (a) dated 30 July 2020 and (b) dated 9 August 2020.
4.2.2 Optical detection
To validate the SAR method results, two images from Sentinel-2 are downloaded and treated using QGIS software; the dates of the images are 30 July 2020 (a week before the main shock) and 9 August 2020 (2 d after the main shock).
The optical detection shows that an important displacement affected the ground in the Kherba neighborhood, over an area of 1.32 km2. The landslide shape of deformation has only one toe at the lower part of the hill (blue line Fig. 16b) compared to the CCD method results.
The optical images were unable to detect the ground deformations and displacements in Grarem in which there was no apparent landslide, although there were a lot of ruptures and cracks. However, a field inspection has confirmed the results of the CCD and DInSAR analysis in terms of pattern and limits of the zone affected by the deformation (surface rupture).
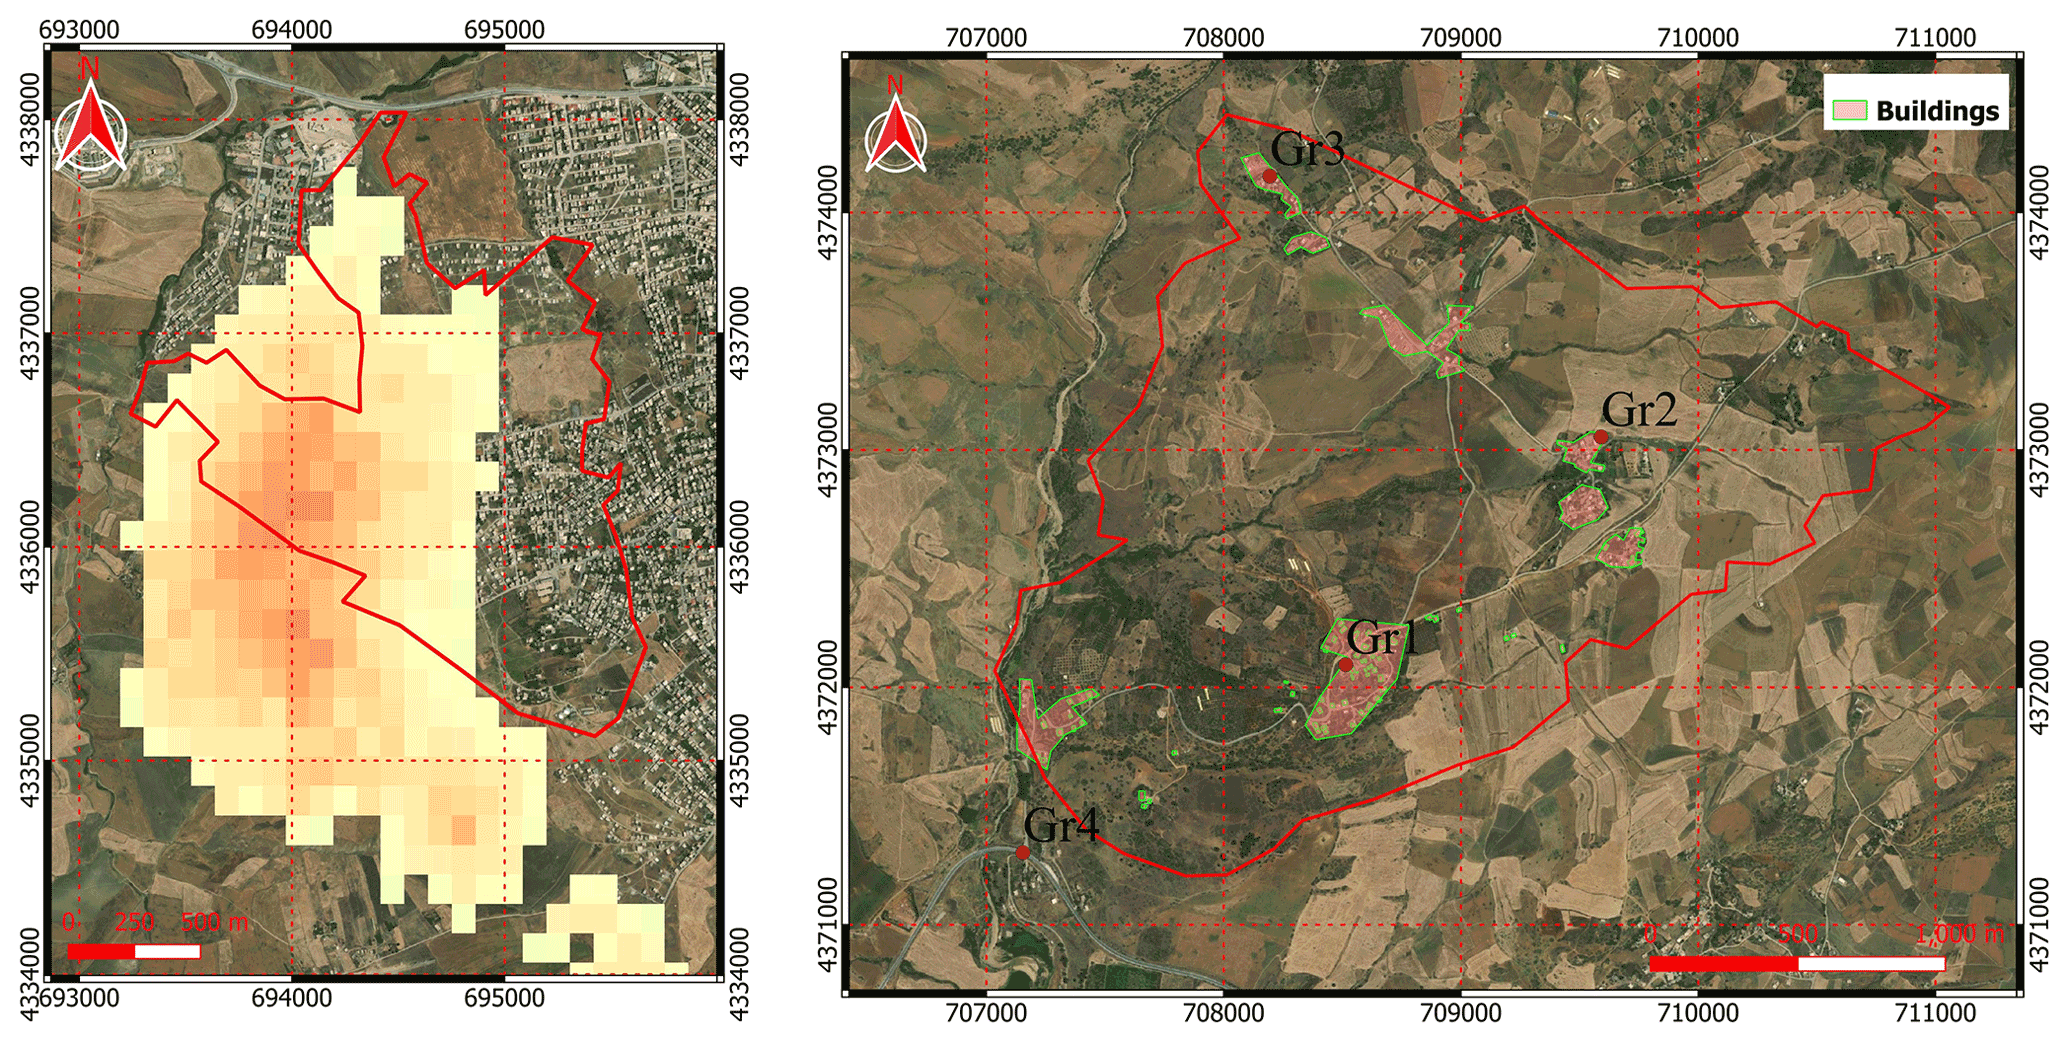
Figure 17(a) Line-of-sight displacement velocity map; the red line is landslide area (066D_05394_131311). (b) Grarem case selected points for time-series analysis (QGIS, ESRI basemap).
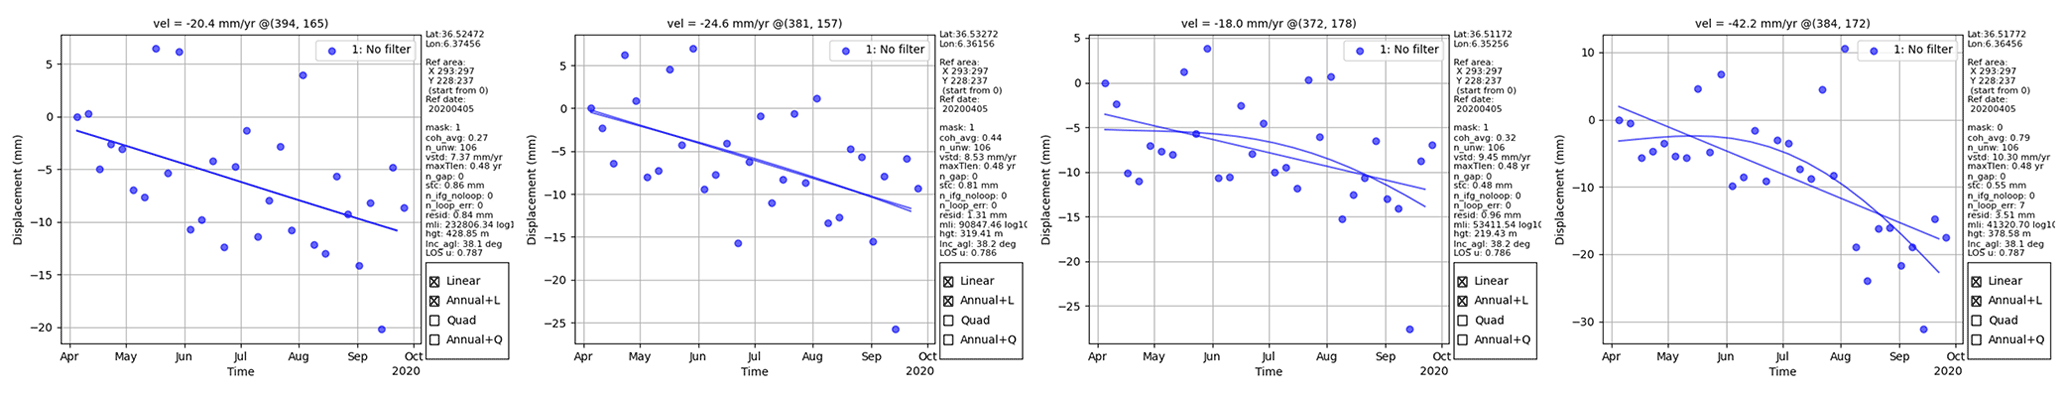
Figure 18Displacement time series (orbit 66, Grarem case), corresponding to the points in image (Fig. 17b); the displacement is relative to a reference point, and the plots present a great dispersion of data points, which is related to many noise resources (weather, manmade, etc.) and short period of analysis (QGIS, ESRI basemap).
4.3 LiCSBAS analyses
Displacement time series and velocity analysis of the region is performed using LiCSBAS, which exploits the data of the LiCSAR system (Morishita, 2021). It allows identification of whether unstable conditions existed previously or are still undergoing. The study took place from 5 April to 26 September 2020, for orbit 66 and from 26 April 2015 to 26 September 2020 for orbit 161.

Figure 19Displacement time series (orbit 161), corresponding to the points in Fig. 17b, The plots show less dispersion of data points (linear) compared to short analysis. The long-period analysis (5 years) is useful to eliminate other sources of noise.
The time-series analysis detected subsidence of the west part of Kherba. This region is on the other hillside of Kherba hill, and both sides have a significant slope. A site investigation did not find any drilled wells. One may assume that this subsidence is not caused by the pumping of groundwater. Therefore, another possible explanation is probably related to the large mass movement of the main landslide hillside (red polygon), causing the opposite side of the hill to move down (subsidence). The displacement velocity in Kherba is about 110 mm yr−1 (Fig. 17).
For the Grarem case, the velocity map looks stable between the same dates (5 April to 26 September 2020). The change occurred rapidly and is removed by the filters. For illustrative purposes, the displacement time series of some points are illustrated in Figs. 18 and 19.
During the LiCSBAS processing, a primary stable reference point is selected at (36.455885∘ N, 6.276909∘ E). This method proves to be efficient for large-scale deformation monitoring and slow coherent changes. Long time series analysis is useful in reducing other noise factors.
4.4 Discussion
InSAR monitoring proves its ability to detect land changes. First, landslides and land deformation can be detected remotely by InSAR. Furthermore, optical images could detect only one case (Kherba). The theoretical results were validated by site visits and investigation as explained in the following.
-
Compared to results obtained from optical images for the Kherba landslide, InSAR is more precise for detecting small deformation (two toes in CCD maps). Besides, the optical analysis did not detect the full deformed area in the region (only one toe).
-
Large-scale landslides exceed DInSAR's capabilities, which induce an extreme loss of coherence. The co-event interferograms are strongly decorrelated. Therefore, the phase information is no longer usable, and one cannot measure the displacement of incoherent ground changes (Landslide).
-
Land deformation in Grarem first detected by DInSAR was confirmed by a site visit, during which small cracks were visible on the ground (incoherent boundary region). Due to incoherent boundaries and because the displacement is probably larger than what can be measured by one fringe cycle (depending on the wavelength, 5 cm for Sentinel-1), the deformation measurements in this case are not reliable and accurate.
-
Another landslide detected by InSAR in the Azeba region (6 km east of Mila) was visited too: the area covers 0.42 km2, and the site investigation confirms the landslide (Fig. 20).
-
Analysis with LiCSBAS revealed new hillside deformation (subsidence), which is probably a consequence of the mass that moved in the main landslide hillside. Displacements time series of the Grarem region at some points show deformation along the LOS with velocities ranging from 6 mm yr−1 to 67 mm yr−1. This method is preferable in large-scale areas and long-period analyses.
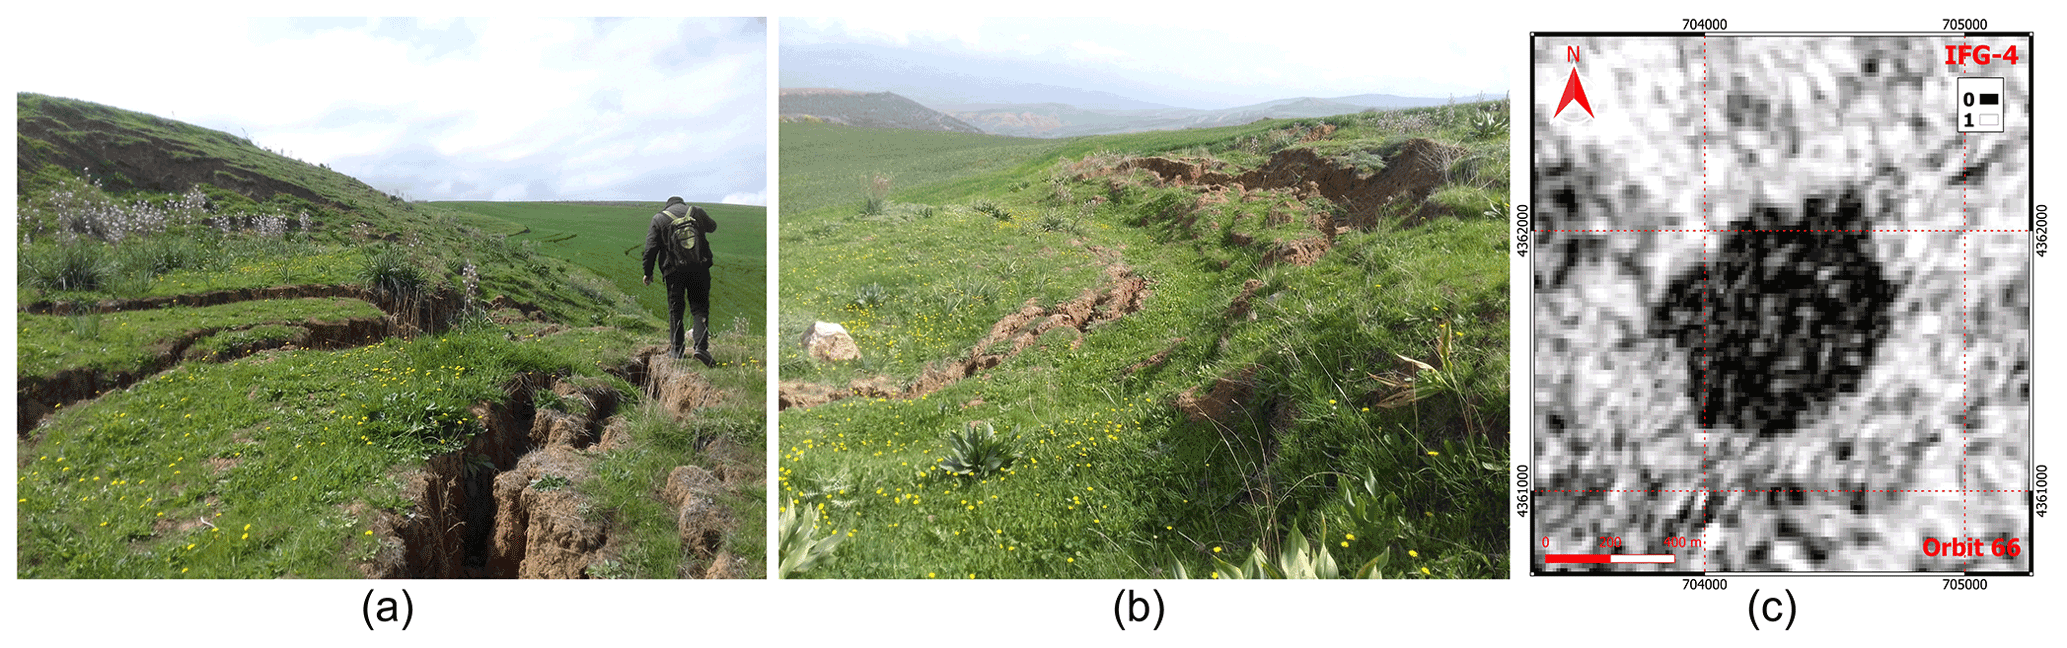
Figure 20Landslide that occurred in the Azeba region (2 km north) detected by InSAR: (a, b) visible ground cracks and (c) coherence map of Azeba zone delimited by the cracks.
In this paper, active and passive space-based satellite data are used to monitor and study the impact of natural hazards (earthquakes and landslides) on struck areas. The C-band Sentinel-1 SAR datasets (active sensing) and optical images of Sentinel-2 data (10 m spatial resolution) were used in this study to investigate the area, and the passive images were used only to validate the active sensing results. For the InSAR processing, the use of DInSAR, CCD methods, and the LiCSBAS tools has been able to generate a detailed time series analysis of ground changes.
InSAR techniques have proven their efficiency to extract useful geodetic information, such as the ground movement and track surface deformation over large areas with centimetric accuracy in coherent change cases. The present research study has demonstrated that the InSAR processing is adapted to study earthquake and landslide zones. As a result, three primary land failures were detected over the study area using InSAR.
DInSAR is poorly suited to track and detect landslides. It is represented as a pixel decorrelation in phase interferograms and high decay in coherence values. CCD is further suitable to map earthquake-induced landslides that may remain undetected using coherent methods (DInSAR). The estimation of their horizontal and vertical displacements is a challenge to be inferred.
The Grarem deformation looks like a landslide that has just been initiated but might extend under an upcoming triggering event. Actually, the failure plane rim is presented as a dark line in the coherence map or as the fringe circumference in phase maps (estimated area 3.94 km2). This impending land failure therefore needs a thorough and real-time monitoring by the PS-InSAR method, which can provide an efficient and low-cost monitoring method able to obtain millimeter-level precision displacement measurements over selected points in the area (Jia et al., 2019), and adequate geotechnical studies.
It is worth increasing awareness of possible future geotechnical threats in a timely manner, through on-site monitoring using GPS and crack meters and by placing inclinometers in the Grarem area, in order to develop a model of the slope stability.
The code was created by Morishita et al. (2020). The LiCSBAS package is available online: https://github.com/yumorishita/LiCSBAS (Morishita, 2022).
The data in this work are freely provided from the European Space Agency (ESA) and are available online through the Copernicus program https://scihub.copernicus.eu/dhus/#/home (ESA Copernicus, 2022). Or ASF DAAC https://search.asf.alaska.edu/ (ASF DAAC, 2022), and COMET-LiCS Sentinel-1 InSAR Portal https://comet.nerc.ac.uk/COMET-LiCS-portal/, (COMET, 2022).
TS processed and analyzed the data and provided interpretation and redaction. MA and AM supervised the work and provided advice and feedback throughout the process. ML processed the data, analyzed the data, and provided interpretation.
The contact author has declared that neither they nor their co-authors have any competing interests.
Publisher's note: Copernicus Publications remains neutral with regard to jurisdictional claims in published maps and institutional affiliations.
This article is part of the special issue “Earthquake-induced hazards: ground motion amplification and ground failures”. It is not associated with a conference.
In this work, we used SNAP and QGIS to analyze and plot maps. The authors are grateful to the European Space Agency (ESA) for freely providing the data through the Copernicus program and COMET.
This paper was edited by Giovanni Forte and reviewed by three anonymous referees.
ASF DAAC: Alaska Satellite Facility, https://search.asf.alaska.edu/#/, last access: 26 June 2021.
ASF DAAC: Sentinel-1, https://search.asf.alaska.edu/, last access: 10 May 2022.
Bakon, M., Perissin, D., Lazecky, M., and Papco, J.: Infrastructure Non-linear Deformation Monitoring Via Satellite Radar Interferometry, Procedia Technol., 16, 294–300, https://doi.org/10.1016/j.protcy.2014.10.095, 2014.
Braun, A.: Radar satellite imagery for humanitarian response: Bridging the gap between technology and application, https://publikationen.uni-tuebingen.de/xmlui/bitstream/handle/10900/91317/Braun2019 Radar satellite imagery for humanitarian response UB.pdf?sequence=1 (last access: 8 May 2022), 2019.
Canaslan Çomut, F., Gürboğa, Ş., and Smail, T.: Estimation of co-seismic land deformation due to Mw 7.3 2017 earthquake in Iran (12 November 2017) using Sentinel-1 DInSAR, Bull. Miner. Res. Explor., 162, 11–30, https://doi.org/10.19111/bulletinofmre.604026, 2020.
Cascini, L., Peduto, D., Pisciotta, G., Arena, L., Ferlisi, S., and Fornaro, G.: The combination of DInSAR and facility damage data for the updating of slow-moving landslide inventory maps at medium scale, Nat. Hazards Earth Syst. Sci., 13, 1527–1549, https://doi.org/10.5194/nhess-13-1527-2013, 2013.
COMET: COMET-LiCS Sentinel-1 InSAR portal, COMET [data set], https://comet.nerc.ac.uk/COMET-LiCS-portal/, last access: 10 May 2022.
Congedo, L.: Semi-Automatic Classification Plugin: A Python tool for the download and processing of remote sensing images in QGIS, J. Open Source Softw., 6, 3172, https://doi.org/10.21105/joss.03172, 2021.
ESA: ESA's radar observatory mission for GMES operational services, https://sentinel.esa.int/documents/247904/349449/S1_SP-1322_1.pdf (last access: 8 May 2022), 2012.
ESA: Resolution and Swath – Sentinel-1 – Missions – Sentinel Online – Sentinel, https://sentinel.esa.int/web/sentinel/missions/sentinel-1/instrument-payload/resolution-swath (last access: 26 June 2021), 2021a.
ESA: SAR Instrument – Sentinel-1 SAR Technical Guide – Sentinel Online – Sentinel, https://sentinels.copernicus.eu/web/sentinel/technical-guides/sentinel-1-sar/sar-instrument (last access: 26 June 2021), 2021b.
ESA Copernicus: Copernicus Open Access Hub, https://scihub.copernicus.eu/dhus/#/home, last access: 10 May 2022.
Frizon de Lamotte, D., de Lamotte, D. F., Bezar, B. Saint, Bracène, R., and Mercier, E.: The two main steps of the Atlas building and geodynamics of the western Mediterranean, Tectonics, 19, 740–761, 2000.
Galve, J. P., Castañeda, C., and Gutiérrez, F.: Railway deformation detected by DInSAR over active sinkholes in the Ebro Valley evaporite karst, Spain, Nat. Hazards Earth Syst. Sci., 15, 2439–2448, https://doi.org/10.5194/nhess-15-2439-2015, 2015.
Goudarzi, M. A.: Detection and measurement of land deformations caused by seismic events using InSAR, Sub-pixel correlation, and Inversion techniques, p. 7, https://webapps.itc.utwente.nl/librarywww/papers_2010/msc/gem/goudarzi.pdf, (last access: 8 May 2022), 2010.
Herrera, G., Fernández, J. A., Tomás, R., Cooksley, G., and Mulas, J.: Advanced interpretation of subsidence in Murcia (SE Spain) using A-DInSAR data – Modelling and validation, Nat. Hazards Earth Syst. Sci., 9, 647–661, https://doi.org/10.5194/nhess-9-647-2009, 2009.
Hooper, A., Zebker, H., Segall, P., and Kampes, B.: A new method for measuring deformation on volcanoes and other natural terrains using InSAR persistent scatterers, Geophys. Res. Lett., 31, 1–5, https://doi.org/10.1029/2004GL021737, 2004.
Jacquemart, M. and Tiampo, K.: Leveraging time series analysis of radar coherence and normalized difference vegetation index ratios to characterize pre-failure activity of the Mud Creek landslide, California, Nat. Hazards Earth Syst. Sci., 21, 629–642, https://doi.org/10.5194/nhess-21-629-2021, 2021.
Jia, H., Zhang, H., Liu, L., and Liu, G.: Landslide deformation monitoring by adaptive distributed scatterer interferometric synthetic aperture radar, Remote Sens., 11, 1–18, https://doi.org/10.3390/rs11192273, 2019.
Jung, J. and Yun, S. H.: Evaluation of coherent and incoherent landslide detection methods based on synthetic aperture radar for rapid response: A case study for the 2018 Hokkaido landslides, Remote Sens., 12, 1–26, https://doi.org/10.3390/rs12020265, 2020.
Kim, J. W.: Applications of Synthetic Aperture Radar (SAR)/SAR Interferometry (InSAR) for Monitoring of Wetland Water Level and Land Subsidence, Ohio State Univ., 1–111, https://core.ac.uk/download/pdf/159596183.pdf (last access: 8 May 2022), 2013.
Laneve, G., Bruno, M., Mukherjee, A., Messineo, V., Giuseppetti, R., De Pace, R., Magurano, F., and Ugo, E. D.: Remote Sensing Detection of Algal Blooms in a Lake Impacted by Petroleum Hydrocarbons, Remote Sens., 14, 121, https://doi.org/10.3390/RS14010121, 2021.
Lazeckỳ, M., Hatton, E., González, P. J., Hlaváčová, I., Jiránková, E., Dvořák, F., Šustr, Z., and Martinovič, J.: Displacements monitoring over Czechia by IT4S1 system for automatised interferometric measurements using Sentinel-1 data, Remote Sens., 12, 1–21, https://doi.org/10.3390/RS12182960, 2020a.
Lazeckỳ, M., Spaans, K., González, P. J., Maghsoudi, Y., Morishita, Y., Albino, F., Elliott, J., Greenall, N., Hatton, E., Hooper, A., Juncu, D., McDougall, A., Walters, R. J., Watson, C. S., Weiss, J. R., and Wright, T. J.: LiCSAR: An automatic InSAR tool for measuring and monitoring tectonic and volcanic activity, Remote Sens., 12, 2430, https://doi.org/10.3390/RS12152430, 2020b.
LNHC: Laboratoire National de l'Habitat et de la Construction, LNHC, http://lnhc-dz.com/, last access: 26 June 2021.
Mazzanti, P., Rocca, A., Bozzano, F., Cossu, R., and Floris, M.: Landslides Forecasting Analysis By Displacement Time Series Derived From Satellite INSAR Data: Preliminary Results, undefined, http://www.nhazca.it/pdf/Mazzanti_et_al_2011.pdf (last access: 8 May 2022), 2012.
Meng, Q., Confuorto, P., Peng, Y., Raspini, F., Bianchini, S., Han, S., Liu, H., and Casagli, N.: Regional recognition and classification of active loess landslides using two-dimensional deformation derived from sentinel-1 interferometric radar data, Remote Sens., 12, 1541, https://doi.org/10.3390/rs12101541, 2020.
Merghadi, A., Abderrahmane, B., and Tien Bui, D.: Landslide susceptibility assessment at Mila basin (Algeria): A comparative assessment of prediction capability of advanced machine learning methods, ISPRS Int. J. Geo-Inform., 7, 268, https://doi.org/10.3390/ijgi7070268, 2018.
Moretto, S., Bozzano, F., and Mazzanti, P.: The role of satellite insar for landslide forecasting: Limitations and openings, Remote Sens., 13, 1–31, https://doi.org/10.3390/rs13183735, 2021.
Morishita, Y.: Nationwide urban ground deformation monitoring in Japan using Sentinel-1 LiCSAR products and LiCSBAS, Prog. Earth Planet. Sci., 8, 6, https://doi.org/10.1186/s40645-020-00402-7, 2021.
Morishita, Y.: yumorishita/LiCSBAS, GitHub [code], https://github.com/yumorishita/LiCSBAS, last access: 10 May 2022.
Morishita, Y., Lazecky, M., Wright, T. J., Weiss, J. R., Elliott, J. R. and Hooper, A.: LiCSBAS: An Open-Source InSAR Time Series Analysis Package Integrated with the LiCSAR Automated Sentinel-1 InSAR Processor, Remote Sens., 12, 424, https://doi.org/10.3390/rs12030424, 2020.
Mouloud, H. and Badreddine, S.: Probabilistic seismic hazard assessment in the Constantine region, Northeast of Algeria, Arab. J. Geosci., 10, 156, https://doi.org/10.1007/s12517-017-2876-5, 2017.
Netzband, M., Stefanov, W. L., and Redman, C.: Applied remote sensing for urban planning, governance and sustainability, Springer, https://doi.org/10.1007/978-3-540-68009-3, 2007.
Pawluszek-Filipiak, K. and Borkowski, A.: Integration of DInSAR and SBAS techniques to determine mining-related deformations using Sentinel-1 data: The case study of rydultowy mine in Poland, Remote Sens., 12, 242, https://doi.org/10.3390/rs12020242, 2020.
Peláez Montilla, J. A., Hamdache, M., and Casado, C. L.: Seismic hazard in Northern Algeria using spatially smoothed seismicity. Results for peak ground acceleration, Tectonophysics, 372, 105–119, https://doi.org/10.1016/S0040-1951(03)00234-8, 2003.
Rapant, P., Struhár, J., and Lazeck?, M.: Radar interferometry as a comprehensive tool for monitoring the fault activity in the vicinity of underground gas storage facilities, Remote Sens., 12, 271, https://doi.org/10.3390/rs12020271, 2020.
Roque, D., Perissin, D., Falcão, A. P., Fonseca, A. M., and Maria, J.: Dams regional safety warning using time-series insar techniques, in: Second Internatinal Dam World Conf., 21–24, https://www.researchgate.net/publication/317620924_DAM_REGIONAL_SAFETY_WARNING_USING_TIME-SERIES_INSAR_TECHNIQUES (last access: 8 May 2022), 2015.
Sanabria, M. P., Guardiola-Albert, C., Tomás, R., Herrera, G., Prieto, A., Sánchez, H., and Tessitore, S.: Subsidence activity maps derived from DInSAR data: Orihuela case study, Nat. Hazards Earth Syst. Sci., 14, 1341–1360, https://doi.org/10.5194/nhess-14-1341-2014, 2014.
Tampuu, T., Praks, J., Uiboupin, R., and Kull, A.: Long term interferometric temporal coherence and DInSAR phase in Northern Peatlands, Remote Sens., 12, 7–9, https://doi.org/10.3390/rs12101566, 2020.
Tzouvaras, M., Danezis, C., and Hadjimitsis, D. G.: Small scale landslide detection using Sentinel-1 interferometric SAR coherence, Remote Sens., 12, 1560, https://doi.org/10.3390/rs12101560, 2020.
USGS: M 5.0 – 3 km NNE of Sidi Mérouane, Algeria, https://earthquake.usgs.gov/earthquakes/eventpage/us6000bag6/executive (last access: 26 June 2021), 2021a.
USGS: USGS Earthquake Hazards Program, https://earthquake.usgs.gov/ (last access: 26 June 2021), 2021b.
Wang, Z., Li, Z., and Mills, J.: A new approach to selecting coherent pixels for ground-based SAR deformation monitoring, ISPRS J. Photogram. Remote Sens., 144, 412–422, https://doi.org/10.1016/j.isprsjprs.2018.08.008, 2018.
Wempen, J. M.: International Journal of Mining Science and Technology Application of DInSAR for short period monitoring of initial subsidence due to longwall mining in the mountain west United States, Int. J. Min. Sci. Technol., 30, 33–37, https://doi.org/10.1016/j.ijmst.2019.12.011, 2020.
WWO: Mila, Mila, Algeria Historical Weather Almanac, https://www.worldweatheronline.com/mila-weather-history/mila/dz.aspx /, last access: 26 June 2021.
- Abstract
- Introduction
- Land and ground movement monitoring and surveying in the aftermath of an earthquake
- Methodology description and results
- Application to the case study and results
- Conclusions and recommendations
- Code availability
- Data availability
- Author contributions
- Competing interests
- Disclaimer
- Special issue statement
- Acknowledgements
- Review statement
- References