the Creative Commons Attribution 4.0 License.
the Creative Commons Attribution 4.0 License.
 | 25 Apr 2022
Ground motion variability in Israel from 3-D simulations of M 6 and M 7 earthquakes
Jonatan Glehman
Michael Tsesarsky
In Israel, due to low seismicity rates and a sparse seismic network, the temporal and spatial coverage of ground motion data is insufficient to estimate the variability in moderate–strong (M>6) ground motions required to construct a local ground motion model (GMM). To fill this data gap and to study the ground motion variability in M>6 events, we performed a series of 3-D numerical simulations of M 6 and M 7 earthquakes. Based on the results of the simulations, we developed a parametric attenuation model (AM) and studied the residuals between simulated and AM peak ground velocities (PGVs) and the single station variability. We also compared the simulated ground motions with a global GMM in terms of PGV and significant duration (Ds 595). Our results suggested that the AM was unable to fully capture the simulated ground motion variability mainly due to the incorporation of super-shear rupture and effects of local sedimentary structures. We also showed that an imported GMM considerably deviates from simulated ground motions. This work sets the basis for future development of a comprehensive GMM for Israel, accounting for local source, path, and site effects.
- Article
(12331 KB) - Full-text XML
-
Supplement
(753 KB) - BibTeX
- EndNote


The recent report by the Centre for Research on the Epidemiology of Disasters (CRED) and the UN Office for Disaster Risk Reduction (UNDRR) – The human cost of disasters: an overview of the last 20 years (2000–2019) – clearly shows that earthquakes are the deadliest natural disasters. Accounting for only 3 % of the total number of people affected by natural disasters, they count for 58 % of deaths (more than 700 000) of all disaster types and 21 % of recorded economic losses (Mizutori and D'ebarati, 2020). Over the past 40 years, the global population exposed to a moderate to severe intensity earthquake has increased by 93 % (to 2.7 billion people) (Pesaresi et al., 2017). This value is expected to grow with population growth and increasing urbanization.
Seismic hazard is the intrinsic natural occurrence of earthquakes and the resulting ground motion and other effects (Wang, 2005). Ground motion models (GMMs) are critical components in the mitigation of seismic hazard. Empirically based GMMs, also known as ground motion prediction equations (GMPEs), are parametric models that estimate the median and the variability in the expected ground motions at a site. The main explanatory variables of such models are typically earthquake magnitude, distance, and site conditions. New generation GMMs also address faulting style, depth to rock, and others.
Many regions worldwide, either due to low seismicity rates and/or sparse coverage of the seismic network, do not provide sufficient temporal and spatial data to estimate the variability in ground motions required to construct a local GMM or validate an imported GMM to local conditions. This situation is specifically acute in the range of strong earthquakes at relatively short distances that pose the most significant hazard to human life and infrastructure.
The use of imported GMMs under the ergodic assumption attributes the ground motion variability to the randomness of the process (i.e., aleatory variability) rather than to local systematic source, path, and site effects (i.e., epistemic uncertainty) (Anderson and Brune, 1999). Abrahamson et al. (2019) showed that the increased number of strong motion records over the past decade exhibits significant differences in scaling of the ground motions even within relatively small regions and that most of the variability typically treated as aleatory is actually due to systematic source, path, and site effects. Kuehn et al. (2019) showed the importance of variations in quality factor (Q) over small spatial scales (30 km) in California. Specifically showing that accounting for path effects leads to a smaller value of the aleatory variability and results in different median predictions, depending on source and site location. To achieve this improvement, Kuehn et al. (2019) divided California into a grid with a cell size of 30 km by 30 km and used 12 039 records from 274 events recorded at 1504 stations. This approach can be employed only in data-rich regions, such as California. Lan et al. (2019) showed that for southwestern China, imported GMMs result in significant discrepancies compared with regional instrumental data (including the Wenchuan Mw 7.9 event). In addition, despite the recorded ground motion data expanding, it remains sparse for large, complex ruptures with recurrence intervals generally exceeding the observation length of instrumental records.
The challenges met while predicting ground motion in data-poor regions turn numerical modeling into an essential complementary method for seismic hazard analysis (Chaljub et al., 2010). Numerical modeling alleviates the need for the ergodic assumption as it can augment the seismic data with strong motion records and account for ground motion variability by systematically separating source, path, and site effects. For example, Graves et al. (2011) showed that the combination of rupture directivity and basin response effects could lead to an increased hazard in particular sites, relative to that calculated by GMM. Pitarka et al. (2021) found that the combination of rupture propagation effects with the amplification due to local topography can result in large ground motion amplifications with complex spatial variability.
However, the shift from ergodic models to non-ergodic models, which account for local source, site, and path effects such as numerical models, leads to large epistemic uncertainty in the median ground motion, resulting in increased epistemic uncertainty of the hazard (Walling and Abrahamson, 2012). Such uncertainty is derived from both modeling and parametric uncertainties, as the model, is not well constrained. Model uncertainty can be reduced by using more accurate 3-D crustal models and source models.
Subsurface models with different levels of accuracy and completeness are available around the world. With the increasing use of terrestrial and space geodesy, the control of seismic sources is also improving with time. Combining the two enables the construction of numerical models for regional assessment of ground motions (Pitarka et al., 2021; Douglas and Aochi, 2008; Graves and Pitarka, 2015). A hybrid GMM, based on empirical and synthetic ground motion databases, is expected to reduce the epistemic uncertainty of the median ground motion and will lead to a lower aleatory variability than GMMs based on data with limited magnitude and distance bands.
In Israel, low seismicity rates (centennial and millennial return periods) and a limited instrumental catalog, spanning only four decades and containing mainly M<6 events, impede the development of a local empirical GMM. The practical outcome of this shortcoming is the use of imported GMMs, such as that of Campbell and Bozorgnia (2008; hereafter, CB08) used in the Israel Seismic Design Code IS 413 (Israel Standards Institution, 2013). Contrary to the instrumental catalog, the Israel pre-instrumental catalog spans over three millennia (Agnon, 2014), including numerous M>6 events and up to 14 M>7 events.
This paper presents numerical modeling of ground motions in Israel and is intended to study ground motion variability from moderate (M 6) and strong (M 7) earthquakes. The primary purpose of this work was to study the different source, path, and site effects of simulated M 6 and M 7 earthquakes and their contribution to ground motion variability in Israel. To this end, we have improved the 3-D regional velocity model of Shimony et al. (2021) and numerically modeled M 6 and M 7 earthquakes with different source and path properties. Subsequently, we developed a parametric model of median ground motions and their variability in terms of peak ground velocity (PGV). The model quantifies the spatial distribution of the ground motions in central and northern Israel, accounting for source, path, and site effects.
We begin with a brief introduction to the seismotectonic setting of the region. Then, we proceed to the methodology section to describe the process of generating a synthetic ground motion database and the subsequent construction of a parametric ground motion model. Next, in the results section, we present the simulated ground motions and the respective attenuation model. Then, we show the comparison between the results of our simulations and global GMMs of Campbell and Bozorgnia (2014; hereafter, CB14) and Afshari and Stewart (2016). Finally, we discuss our findings and provide insights regarding the seismic hazard from moderate to strong earthquakes and the importance of developing a regional GMM to mitigate the seismic hazard in Israel.
2.1 Seismicity and seismic hazard in Israel
The Dead Sea Transform (DST) fault system is an active tectonic boundary separating the African and Arabian plates. Extending from the Gulf of Aqaba to southern Turkey, a total length of approx. 1100 km, it dominates the seismicity of Israel, the Palestinian Authority, Lebanon, and Syria (Fig. 1a and b). The DST is a left-lateral strike-slip fault with a total offset of 105 km (Garfunkel, 2014). The average long-term slip rate is 4 to 5 mm yr−1 (Bartov et al., 1980). Geodetic slip rates along the Israeli part of the DST range from 3 to 5 mm yr−1 (Hamiel et al., 2016; Sadeh et al., 2012).
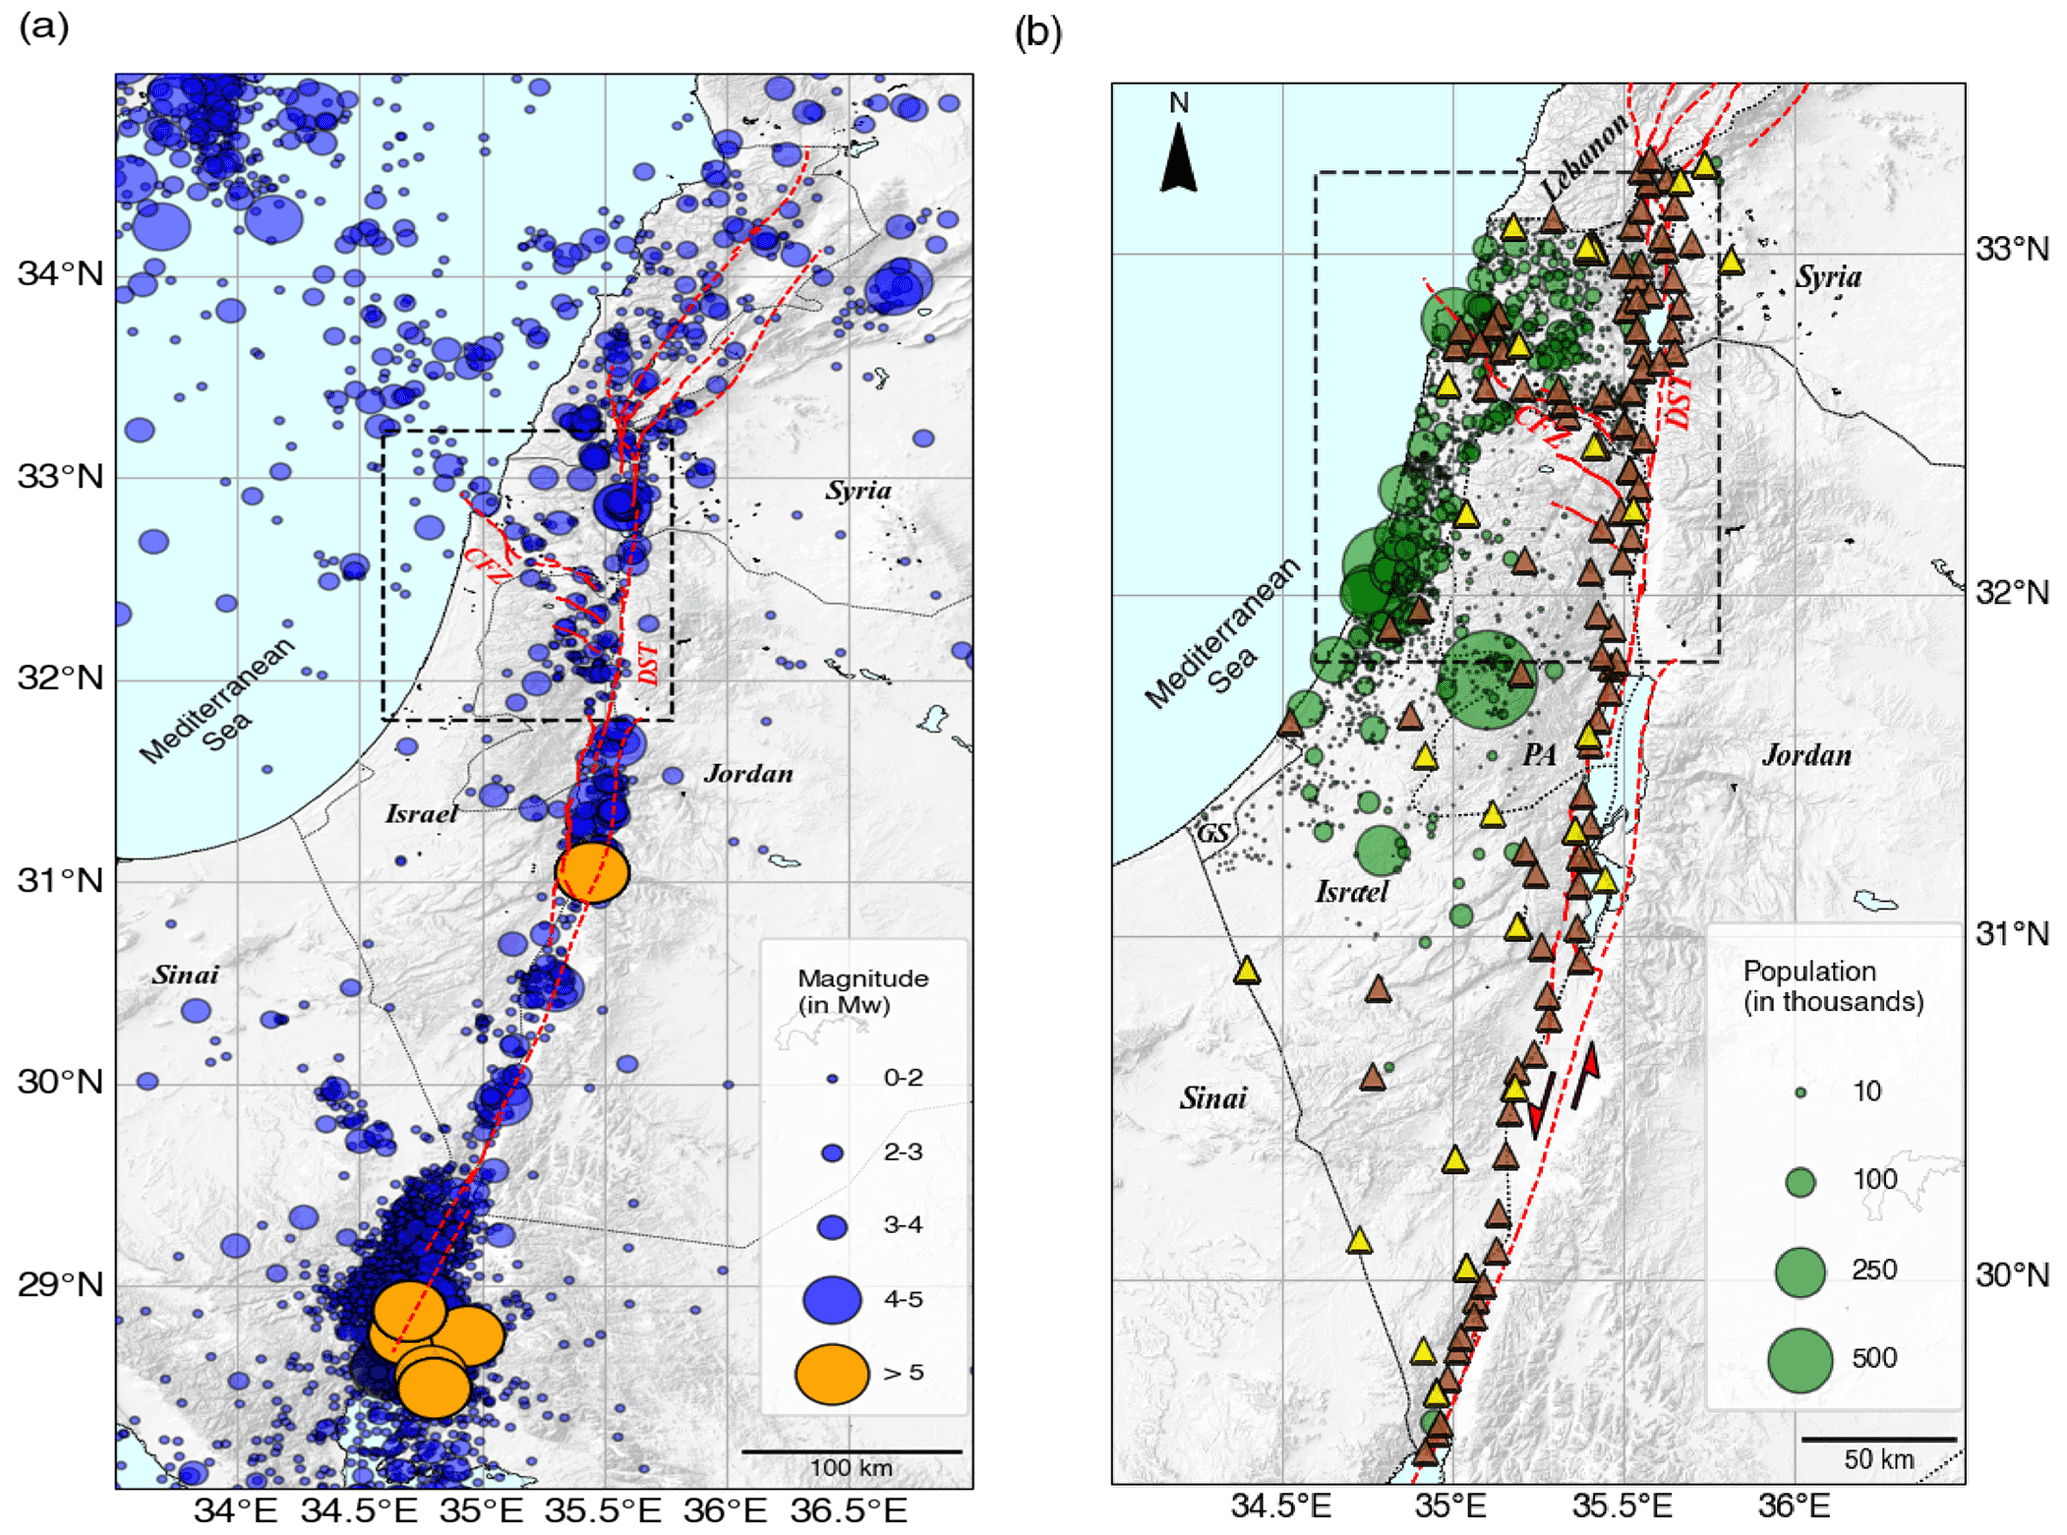
Figure 1(a) Israel seismic catalog (Mw) for the period 1985–2021. Orange circles are events with Mw>5 (expansion of Wetzler and Kurzon, 2016a, catalog). Red lines are active tectonic borders and faults, DST is Dead Sea Transform, and CFZ is Carmel Fault Zone. (b) Demographics of Israel and the Palestinian Authority (PA) and the deployment of the Israel Seismic Network. Yellow triangles are the old (up to October 2017) Israel Seismic Network stations, and brown triangles are the current (TRUAA) seismic network stations (after Kurzon et al., 2020a). GS is Gaza Strip. The black rectangles define the computational domain presented in Fig. 3a.
Splaying northwest from the DST is the Gilboa Fault and farther northwest towards the Mediterranean the Carmel Fault. Both comprise an active zone generalized as the Carmel Fault Zone (CFZ). The DST segments are capable of producing M 6 and M 7–7.5 events (Shamir et al., 2001; Hamiel et al., 2009), and the CFZ is capable of producing up to M 6.5 earthquakes (Grünthal et al., 2009).
The Israel Seismic Network (ISN), established in 1983 and upgraded over the years, consists of a mixture of different instrumental and operational stations, including short-period stations (14 in total), broadband stations (24 in total), and a large broadband array (part of the Comprehensive Nuclear Test Ban Treaty). The deployment of the ISN does not cover areas of increased seismic hazard, e.g., densely populated zones and soil sites, or areas designated by the Israel Seismic Code (IS413) as being suspected of extreme ground motion amplification, such as the Zevulun Valley (Fig. 1b). Currently, the seismic network is upgraded within the TRUAA project (an early warning system), with up to 69 strong motion accelerometers and 12 broadband seismometers added to ISN (Kurzon et al., 2020a). However, most of the instrumentation are placed along the DST and Carmel Fault to provide early warning and not in densely populated or industrialized areas where the seismic risk is tangible. Based on demographic projections (the Taub Center for Social Policy Study in Israel; for URL see data and resources) the population of Israel is expected to grow from 9.05 million in 2021 to 12.8 million in 2040, and combined with the increasing demand for housing and infrastructures, the seismic risk is expected to grow.
The Israel seismic catalog covers 36 years of measurements (1985–2021) and includes more than 23 300 events (Wetzler and Kurzon, 2016a), but only 15 of them are of M>5 (Figs. 1a and 2). Moving back in time, Israel's pre-instrumental catalog spans over 3000 years (Agnon, 2014; Zohar, 2019) with many catastrophic events, such as the 749 (M>7), 1202, (M>7.5), 1759 (M>7), and the 1837 (M>7) earthquakes, among others. In total, 14 M>7 events were cataloged by Ambraseys (2006) in the past two millennia. Recent geodetic studies (Hamiel et al., 2016; Sadeh et al., 2012) identified a slip deficit on specific segments of the DST, such as the Jordan Gorge Fault (JGF) and the Jordan Valley Fault (JVF), equivalent to an M>7 earthquake.
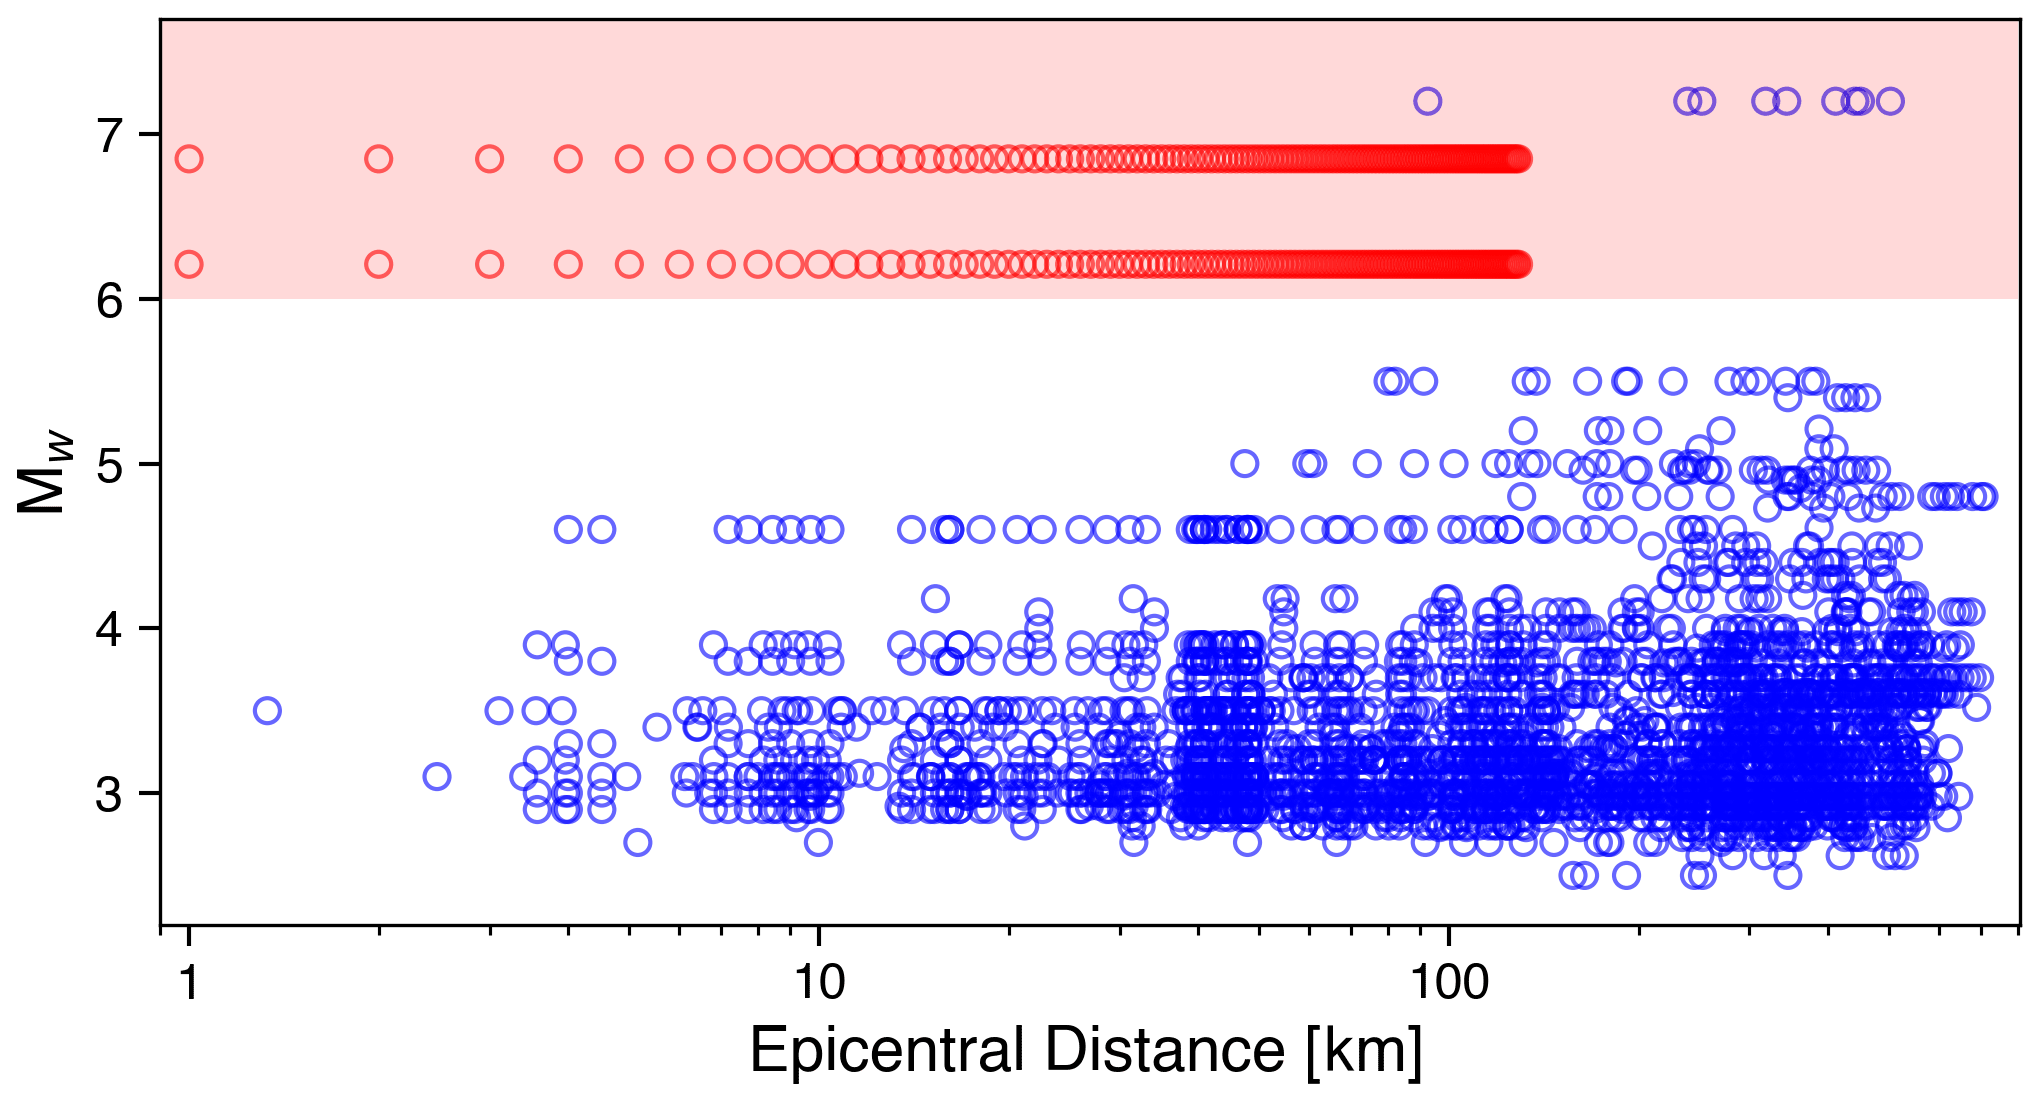
Figure 2Israel's ground motion database (blue circles) for the period 1983–2021 as a function of epicentral distance (Yagoda-Biran et al., 2021a). The shaded rectangle spans the Mw>6 region of moderate–strong ground motion records. The red circles are the simulated ground motions from this work.
2.2 Spatial heterogeneity of Israel
The geological structure of Israel exhibits strong spatial heterogeneity over short scales (Fig. 3a and b). Deep pull-apart basins (up to 10 km) filled with soft sediments (Vs∼600–800 m s−1) accompany the active DST system, from south to north: the Dead Sea Basin, Beit Shean Valley (BSV), the Sea of Galilee (SG), and the Hula Valley (Rosenthal et al., 2019). Along the CFZ, the Zevulun, Harod, and Jezreel valleys are formed. The vulnerability of Zevulun Valley is particularly crucial because of its dense population and the high concentration of strategic industrial infrastructure (Shani-Kadmiel et al., 2020).

Figure 3(a) The DST fault system and the Carmel Fault Zone (CFZ) and accompanying structures. Sedimentary structures (yellow): BSV – Beit Shean Valley, ZV – Zevulun Valley, JV – Jezreel Valley, HV – Hula Valley, SG – Sea of Galilee, and the sedimentary wedge; and hard rock structures (purple): K – Korazim structural saddle, BB – Belvoir basalts, and GB – Golan basalts. The yellow stars indicate the epicenter of the seismic sources simulated in our work: Jordan Gorge Fault (JGF), with bilateral and unilateral slip realization, Jordan Valley Fault (JVF), Jericho Fault, Shemona Fault (only for M 7), and CFZ (only for M 6). (b) Representative depth velocity profiles of the computational domain (green circles).
The Israeli coastal plain, one of the most densely populated regions of the country (on average, 9000 people per square kilometer), is underlain by a westward-thickening sedimentary wedge (SW). In the Judea foothills area, east of the SW, a strong reflector exists between the sandstones and clays (Pleistocene Kurkar group, Vs∼300 m s−1) and the hard carbonate rocks (the Cretaceous Judea group, Vs∼2000 m s−1). In the coastal plain, the Kurkar group overlays the soft carbonates (Avedat group, Vs∼900 m s−1) and clastic sediments (the Bet Guvrin Formation, Vs∼800 m s−1) (refer to Fig. 3b). The depth of the Kurkar group base reflector is typically several tens of meters. Further to the west, a prominent reflector is a contact between the clays (Pliocene Yafo Formation, Vs∼600 m s−1) and top of the Judea group (Gvirtzman et al., 2008). These two reflectors, when shallower than 250 m, were used for the latest update of the Israel Building Code IS 413 (Israel Standards Institution, 2013) to delineate areas of a high potential of ground motion amplification (Gvitzman and Zaslavsky, 2009). This situation further complicates the process of developing an empirical GMM for Israel.
2.3 Source effects
The impact of inter-basin sources along the DST on regional ground motions was examined by Shimony et al. (2021). This work clearly showed that regional ground motions are determined by source–path coupling effects in the strike-slip basins before waves propagate into the surrounding areas. Ground motions are determined by the location of the rupture nucleation, the near-rupture lithology, and the local structures. Shimony et al. (2021) focused on symmetric sub-shear ruptures and did not model rupture directivity or super-shear rupture velocities, both known to amplify regional ground motions.
Under specific conditions, super-shear ruptures and directivity occur on bi-material faults (Shi and Ben-Zion, 2006). Specifically, for subsonic propagation, symmetrically initiated bilateral rupture evolves after some propagation distance to a unilateral rupture in the positive direction, which is the direction of slip on the compliant side of the fault containing the softer layer. The magnitude of this effect increases with propagation velocity and the degree of material contrast across the fault. At super-shear propagation speeds, along a bi-material fault, the propagation direction is reversed.
The DST is a mature left-lateral fault with a 105 km offset, resulting in a strong material contrast between the hard layers on the Jordan side (east) and the soft layers on the Israeli side (west). Thus, the rupture can potentially propagate unilaterally southwards, discharging most of the seismic energy into Israel or northward in super-shear mode. The Jordan Gorge Fault and the Jordan Valley Fault (both active faults of the DST) specifically can produce an earthquake with rupture propagating in super-shear velocity since they border deep sedimentary basins, characterized by a large shear wave velocity contrast along the rupture propagation path. Thus, to quantify the seismic hazard ensuing from bi-material faults, it is necessary to study the two propagation directions: both sub-shear and super-shear velocities.
Developing a regional GMM for Israel requires a database of ground motion records, including M>6 events at short, <100 km, distances. To supplement the existing ground motion database, we added a suite of synthetic ground motions from physics-based 3-D numerical models of different M 6 and M 7 earthquakes (Fig. 2).
Our work comprised two main stages; first, we modified and expanded the regional velocity model of Shimony et al. (2021) to represent a more realistic geological setting and contain the Golan basalts, the central part of Israel, and the sedimentary wedge. Then, we simulated five different earthquake scenarios for each magnitude, with nucleation at different locations along the DST and CFZ. For each scenario, we recorded synthetic ground motions at 129 stations (see Fig. S1 in the Supplement), with 124 stations deployed in a uniform grid with 10 km spacing and 5 more stations in areas of interest (such as Zevulun Valley and Kiryat Shemona, among others). Next, we performed statistical analysis of the synthetic database, using multivariable regression, by minimizing residuals between data and model estimations. We then formulated a parametric model of the ground motions and examined the median ground motions and their variability for each of the simulated scenarios.
3.1 Numerical model
Ground motions in this research were modeled using the SW4v2 software (Petersson and Sjogreen, 2014, 2017a, b), developed for large-scale simulations of seismic wave propagation on parallel computers.
The velocity model covers the northern and central part of Israel (Fig. 4a) and includes the main DST trough and the following basins/structures, from south to north: Beit Shean Valley (BSV), Belvoir basalts (BB), Sea of Galilee (SG), Korazim structural saddle (K), Golan basalts (GB), and Hula Valley (HV). Along the CFZ, we model the major sedimentary basins of Jezreel Valley (JV) and Zevulun Valley (ZV). The coastal plain is underlain by the westward-thickening sedimentary wedge (SW). Geographically, the model extends from the city of Ashdod in the south (31.8∘ N, 34.6∘ E) to the Hula Valley in the north (33.23∘ N, 35.72∘ E) and from the Mediterranean Sea in the west to the Golan basalts in the east. Figure 4b–d illustrate the north–south and east–west cross-sections of the velocity profiles. The numerical domain spans 159 km in the north–south direction and 124 km in the east–west direction. It covers almost 80 % of the Israeli population and a significant part of the population of the Palestinian Authority.
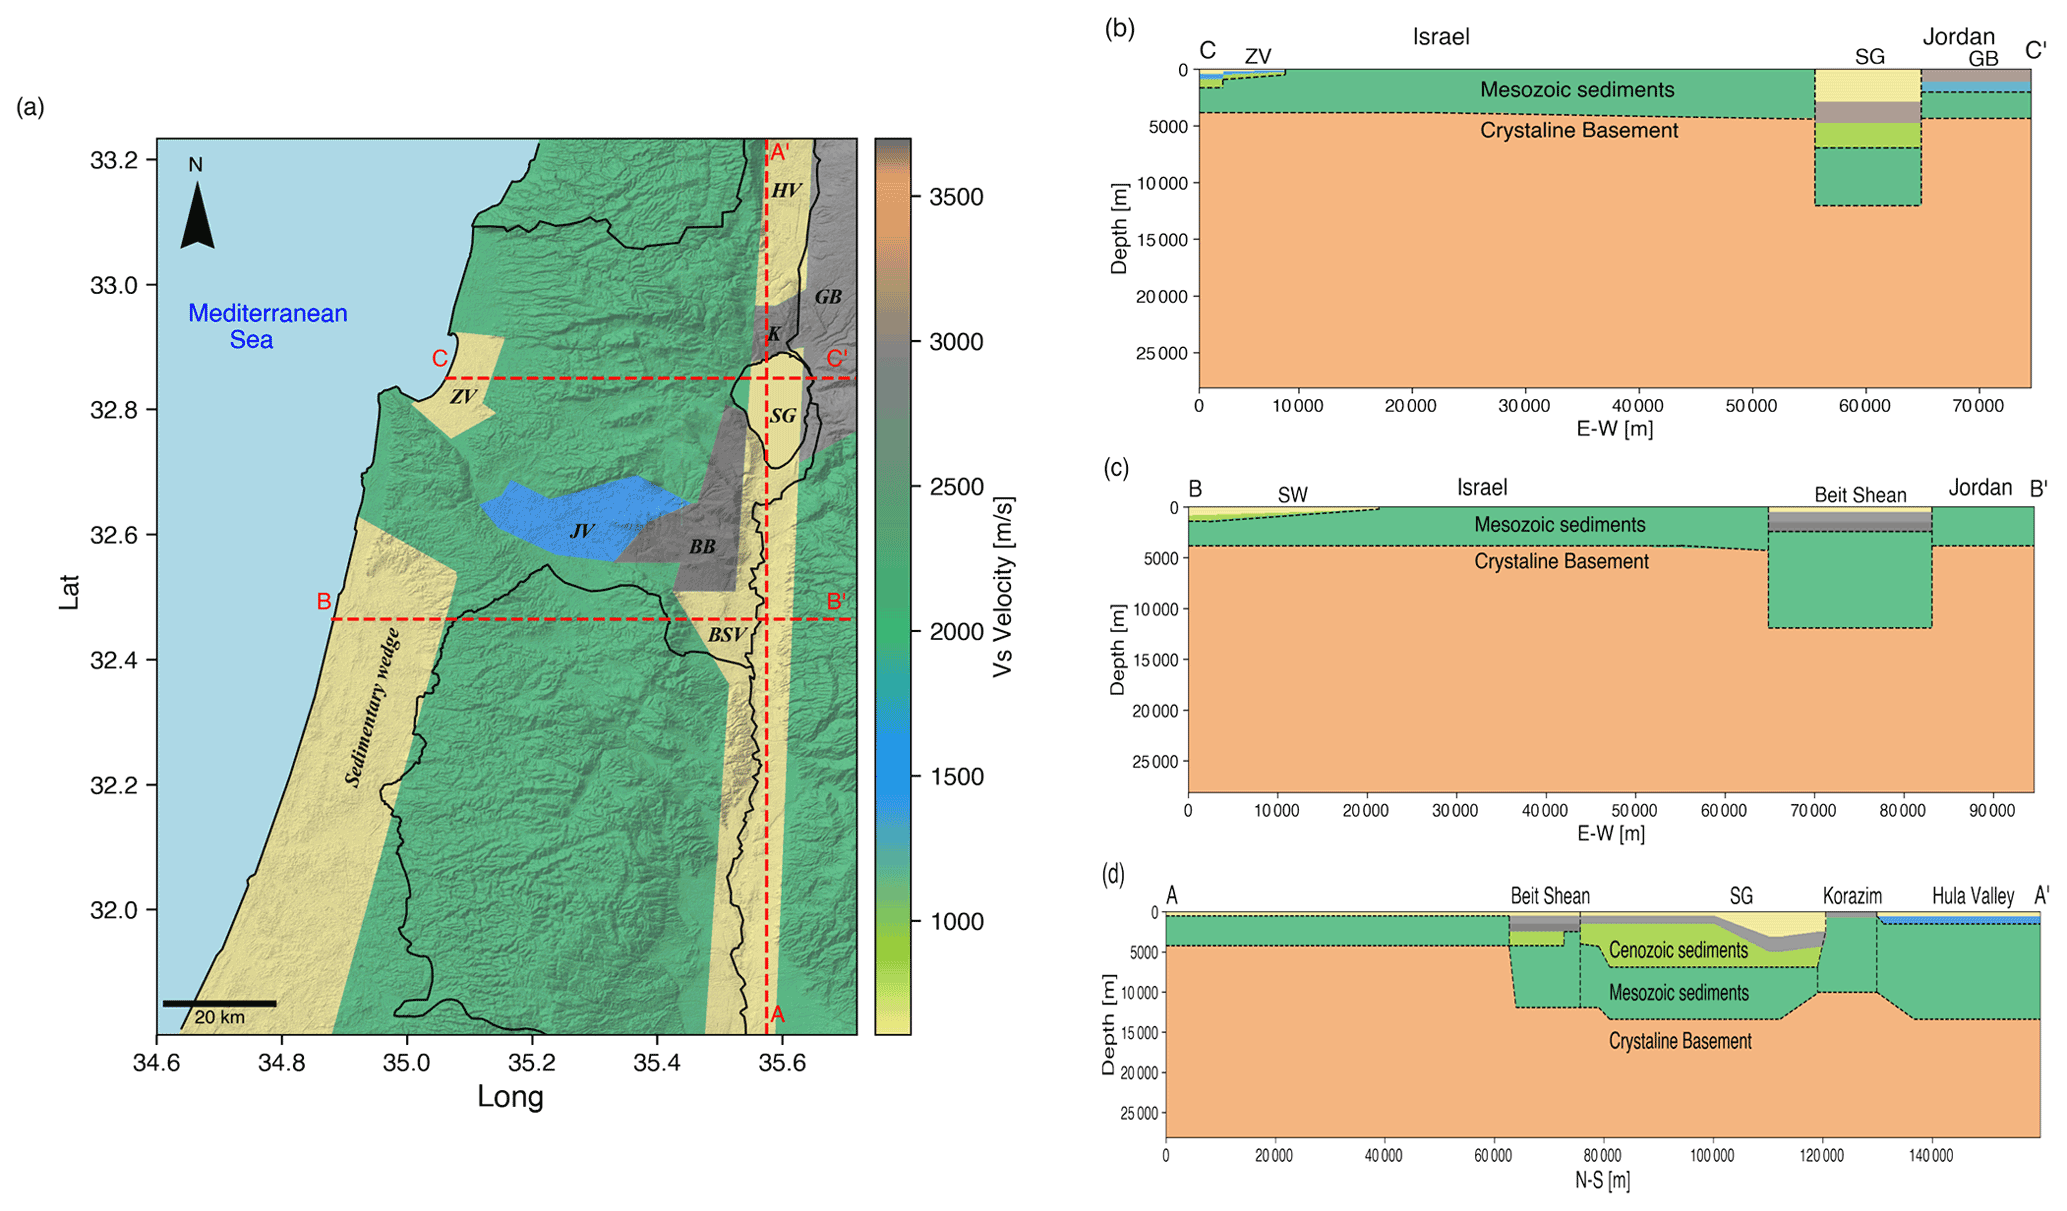
Figure 4(a) The numerical model of the computational domain accompanied with subsurface cross-sections, marked with red dashed lines: (b) east–west cross-section through Zevulun Valley, C–C', (c) east–west cross-section through the sedimentary wedge, B–B', and (d) north–south cross-section through the DST trough, A–A'.
Subsurface geometry and the characteristics of the DST trough were obtained from Rosenthal et al. (2019), with modifications for the Hula Valley, obtained from the density log of the Notera 3 borehole (Rybakov et al., 2003). The sedimentary wedge structure retrieved from Gvirtzman et al. (2008) and the Zevulun Valley structure was set using data from Gvirtzman et al. (2011). The basement depth along the model is based on Ben-Avraham et al. (2002). Five physical quantities describe the viscoelastic material model used in this research: shear wave velocity (Vs), pressure wave velocity (Vp), density (ρ), and seismic quality factors (Qs, Qp) for each point in the computational space. The missing parameters were assessed indirectly by using the correlation presented by Brocher (2008). The main units with their respective velocity, density, and quality factors are shown in Table 1.
Table 1Material properties of the main stratigraphic units used in this work.

Seismic sources were modeled using the distributed slip model (DSM) developed by Shani-Kadmiel et al. (2016). DSM is a kinematic model which describes the rupture patch as an elliptic surface with maximum slip at the nucleation point, decaying toward the edges as a pseudo-Gaussian function (Fig. S2 in the Supplement). Shani-Kadmiel et al. (2016) present validation of the DSM using macroseismic reports of the 1927 Jericho earthquake, showing good agreement between the reported and simulated ground motions. Rupture patch size and displacements were scaled following the relations presented in Wells and Coppersmith (1994). All sources were modeled as left-lateral, vertical strike slips (a dip of 90∘ and rake of 0∘), with a strike of 3∘ for sources on the DST and a strike of 325∘ for the CFZ. The moment rate time function of each point on the rupture patch was set to a GaussianInt pulse (Petersson and Sjogreen, 2017b) with a central frequency of f0=0.4 Hz and a maximum frequency of fmax=1 Hz.
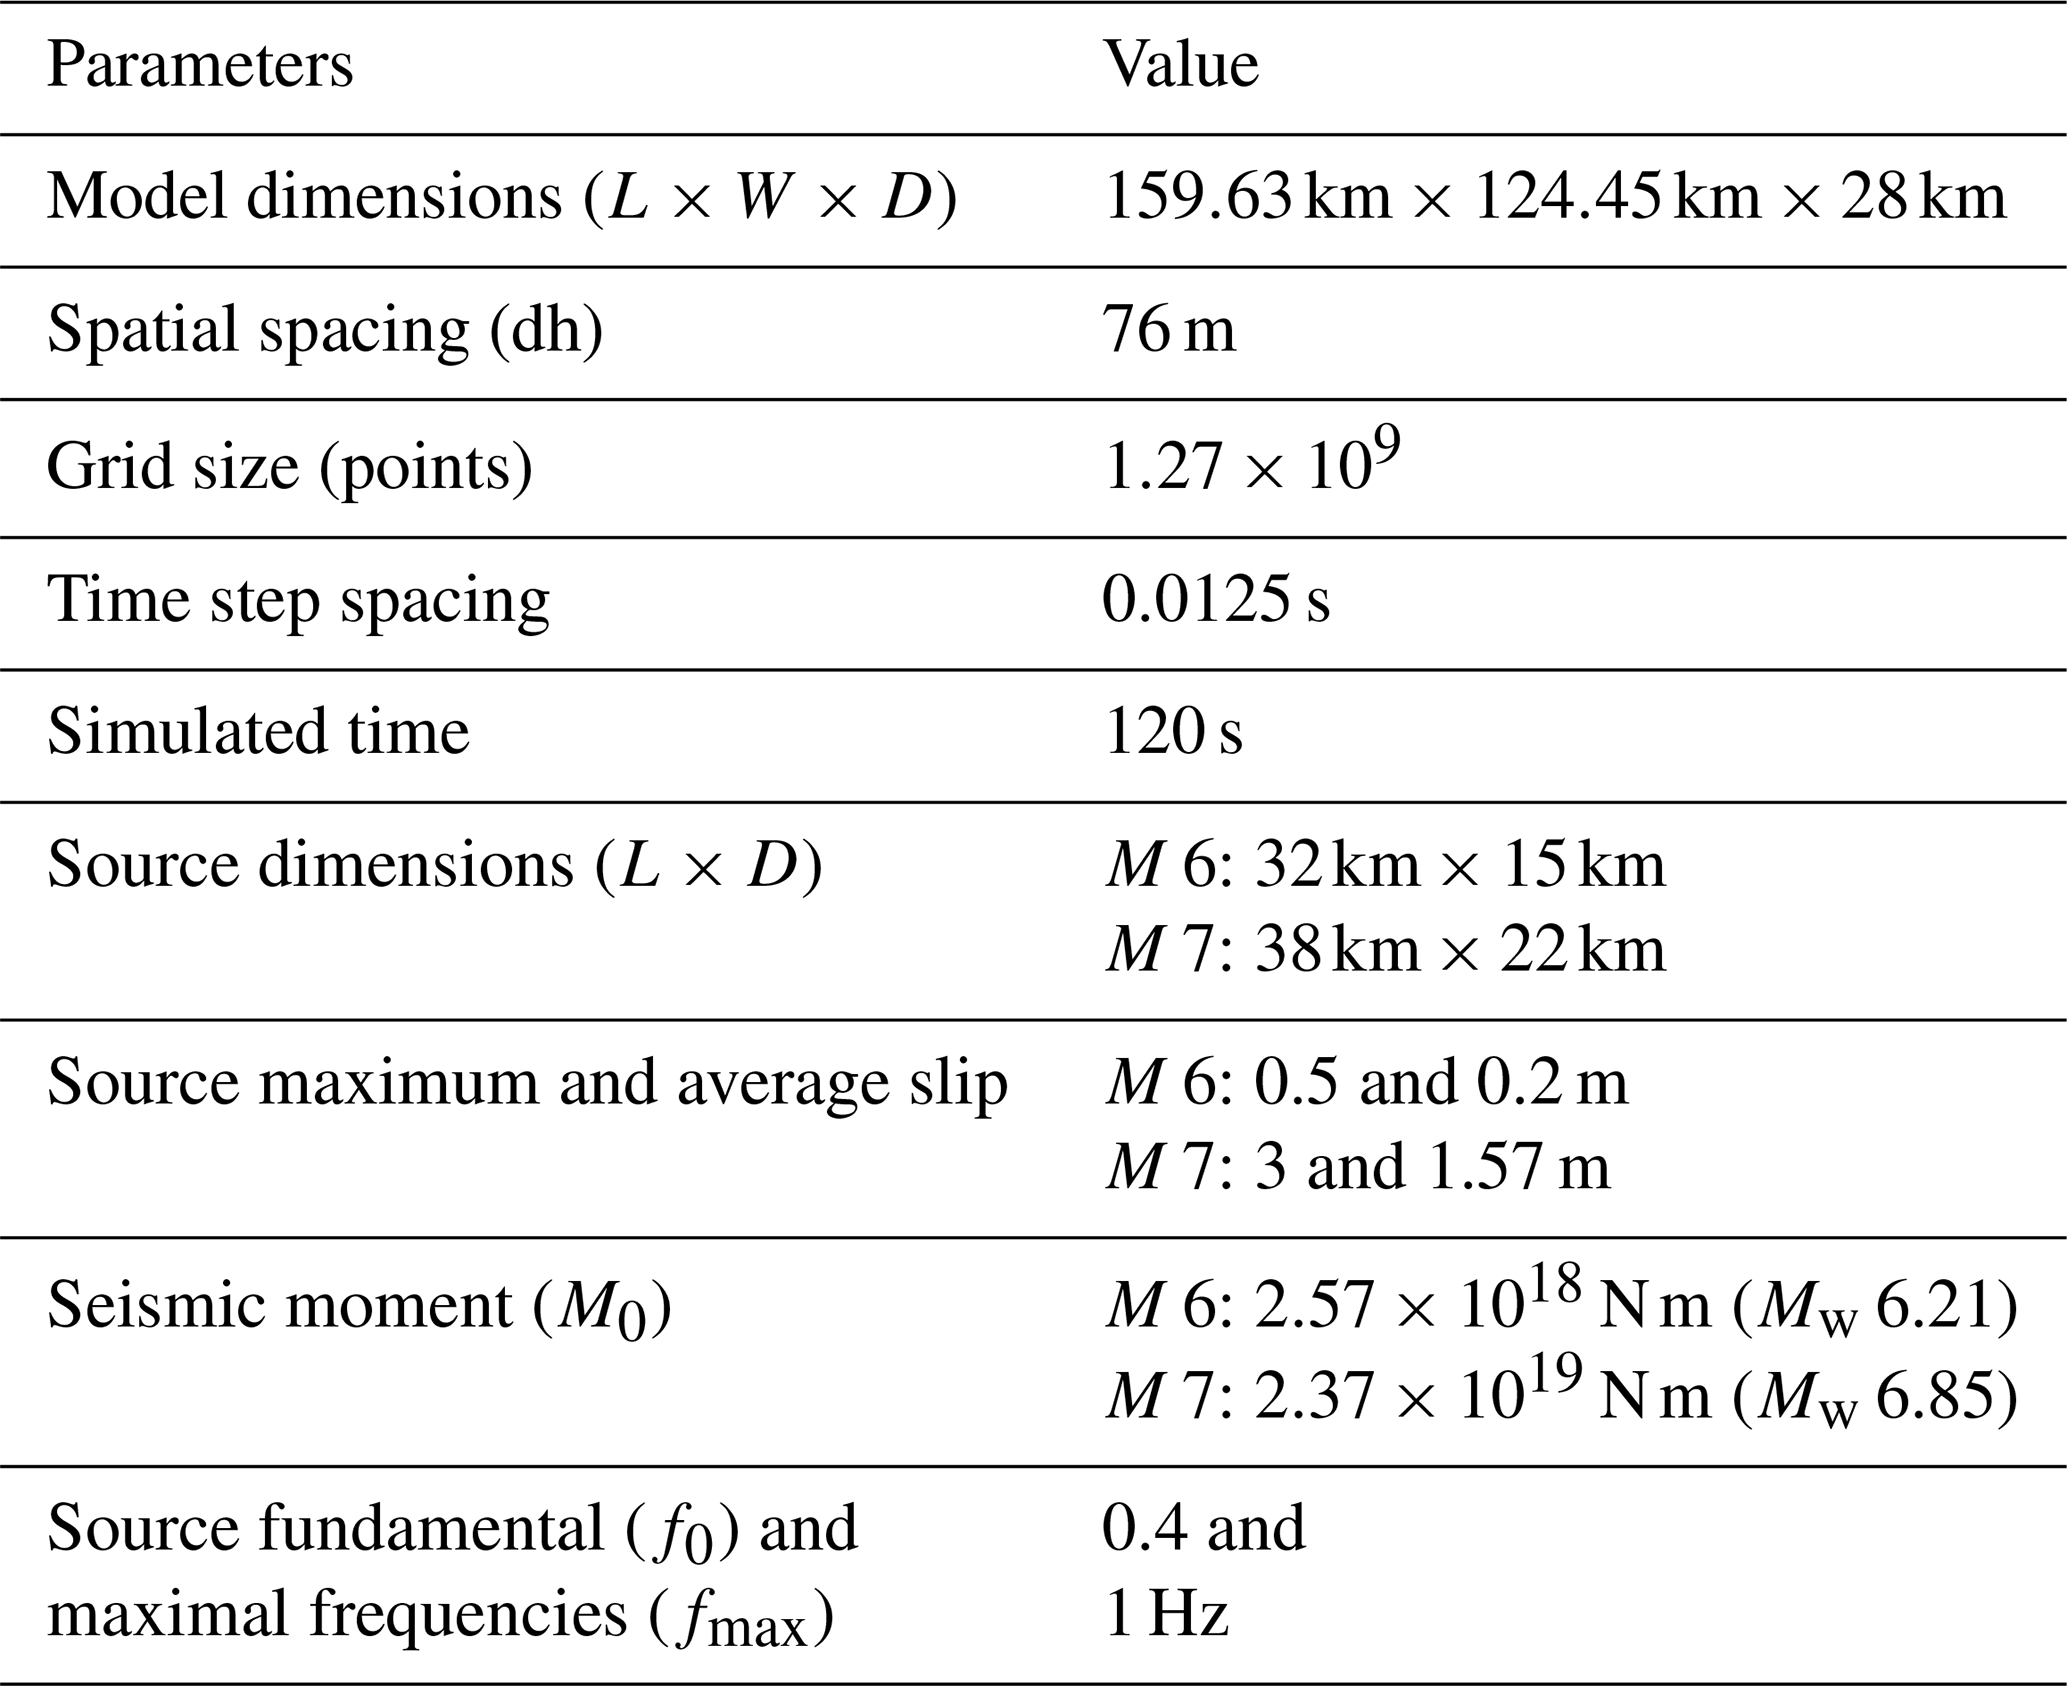
The depth of the model was set to 28 km corresponding to the maximum seismogenic depth in this region (Wetzler and Kurzon, 2016a). We assigned a minimum shear wave velocity of 608 m s−1 for the uppermost sedimentary layer due to the computational limitations of our system. Grid spacing was set to 76 m in accordance with the minimum shear wave velocity and the maximum frequency of the source. We set the simulation time to 120 s to allow the slowest waves to propagate across the entire computational domain. The main parameters of the numerical setting are summarized in Table 2.
3.2 Earthquake scenarios and database
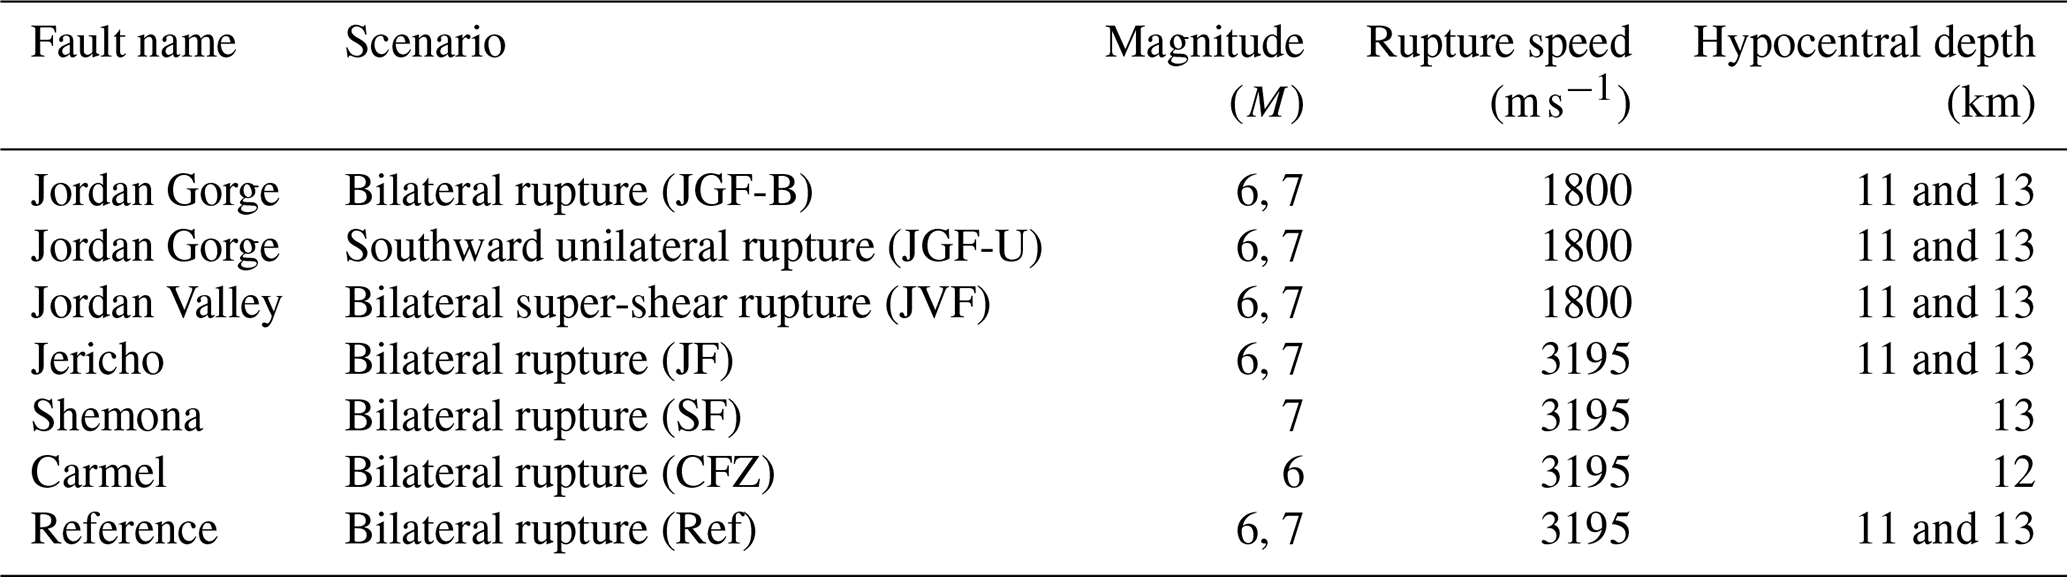
To examine the variability in ground motions from moderate M 6 and strong M 7 earthquakes, we concentrated on earthquake events nucleating on active segments of the DST system, with known slip deficit, and along the CFZ. We modeled a symmetric bilateral rupture on the Jordan Gorge Fault (JGF-B), Jericho Fault (JF), Carmel Fault Zone (CFZ), and the Shemona Fault (SF), a southward unilateral rupture on the JGF (JGF-U), and a super-shear rupture on the Jordan Valley Fault (JVF) (Fig. 3).
The hypocenter for the DST events was placed in the middle of the seismogenic depth: 11 and 13 km for the M 6 and M 7 models, respectively; for the M 6 CFZ, the value was set to 12 km. The rupture patch was designed to be contained in uniform lithology to prevent super-shear rupture speeds in the shallow parts of our model. Therefore, rupture speed for each scenario was set to 0.9 VS of the lithology surrounding the nucleation zone. The only exception was the JVF scenario for both M 6 and M 7, in which we modeled super-shear effects. For this scenario, the rupture nucleates within the hard rock with a sub-shear speed of 1800 m s−1 and evolves into a super-shear rupture when it ruptures the sediments with a shear wave velocity of <900 m s−1. The rupture velocity of each scenario corresponds to the local variations in the sediment's depth. Following the transition of the nucleation zone from the shallow crystalline basement in the south and west parts of the model to the thick Mesozoic and Cenozoic sediments in the north and the east, the rupture velocity decreases from 3195 m s−1 along the Shemona, Carmel, and Jericho faults to 1800 m s−1 along the JGF and JVF faults. As a reference, we simulated a simple two-layered reference model (Ref) on the JGF, with mechanical properties similar to the regional setting, following Aldersons et al. (2003). The scenarios are summarized in Table 3.
In this section, we report the simulation results and the simulation-based attenuation model for M 6 and M 7. We begin with elaborating on the regression process and its deliverable, the attenuation model. Next, we present the ground motion variability, starting from total and following with within-event and between-event PGV residuals, as well as the contribution of each earthquake scenario to the total deviation. Then, we proceed with looking into single station variability, through maps of the predicted and simulated PGV, with the corresponding residuals at each station. Finally, we show the PGV and the 5 %–95 % ground motion significant duration (Ds 595) correspondence between those predicted by global GMMs (CB14; Afshari and Stewart, 2016) and those simulated.
4.1 Simulation results
For each simulation, we attained a set of 129 synthetic ground motion records (three components each; north–south, east–west, and vertical) from the network deployed in the computational domain. Next, we calculated the PGV values for each scenario at each station as the maximum value over the three components. We decided to exclude some of the M 7 near-source records (stations 104, 105, and 106 for the JVF scenario and stations 122, 123, and 129 for the JGF-B, JGF-U, and Shemona scenarios) due to high strain values and possible nonlinear effects not compatible with the linearity assumption of our model. In total, our ground motion database consists of 645 and 633 synthetic records for M 6 and M 7 models, respectively. Figure 5 presents our results in terms of PGV as a function of distance. We used different markers for records from the sedimentary structures of the Zevulun Valley and the sedimentary wedge to differentiate them from the remaining data.
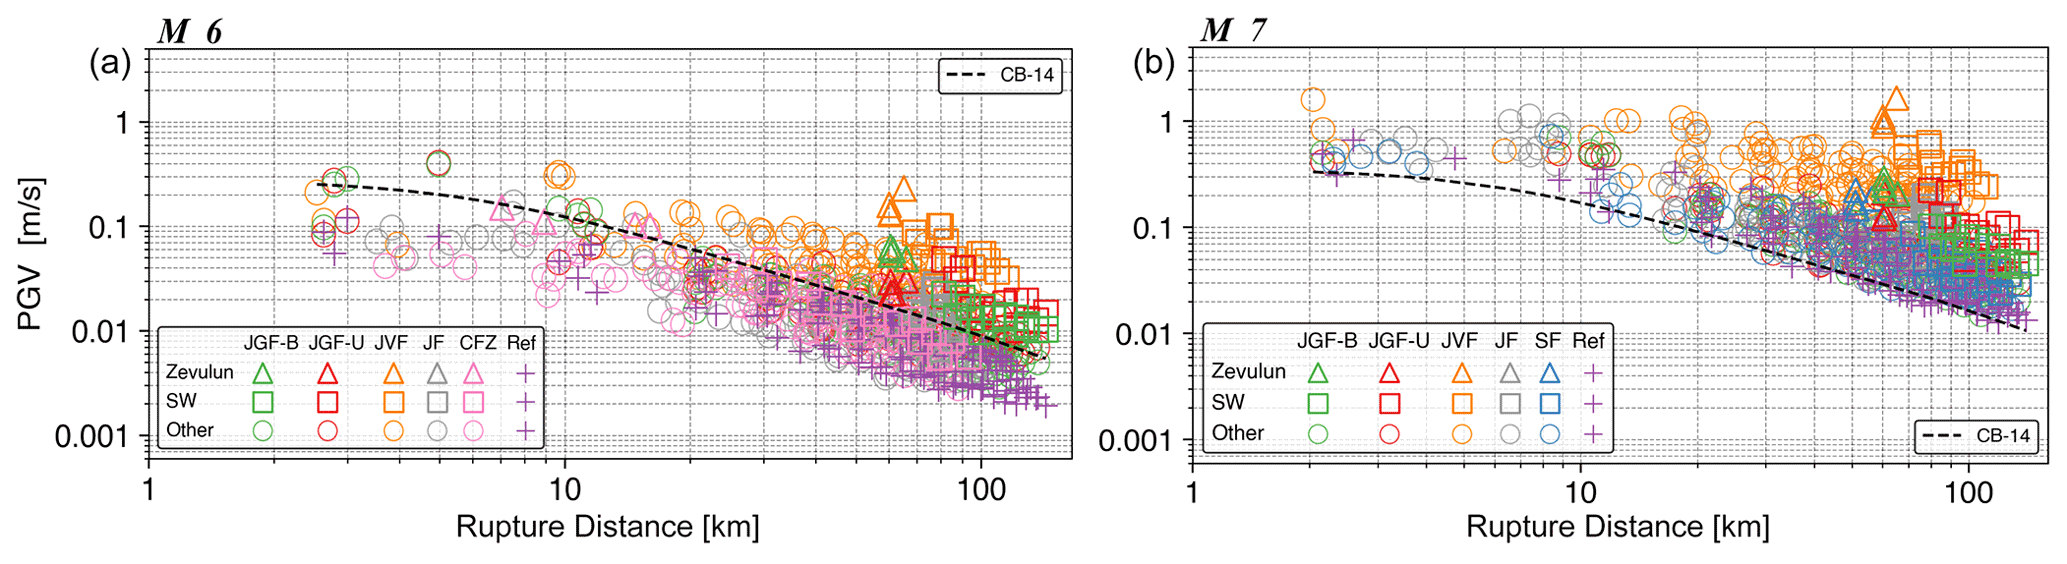
Figure 5Simulation results and PGV distance space for bilateral rupture on the Jordan Gorge Fault (JGF-B), Jericho Fault (JF), Carmel Fault Zone (CFZ; for M 6), and the Shemona Fault (SF; for M 7), a southward unilateral rupture on the JGF (JGF-U), and a super-shear rupture on the Jordan Valley Fault (JVF) for M 6 (a) and M 7 (b). The records from Zevulun Valley and the sedimentary wedge (SW) are marked with triangles and rectangles, respectively. The other records are marked with circles; the reference records are marked with pluses. For comparison, the CB14 is plotted for a strike-slip fault, Z2.5=0.42 km and Vs30=1686 m s−1 (representing averaged values over all the sites).
4.2 Statistical analysis of ground motion results
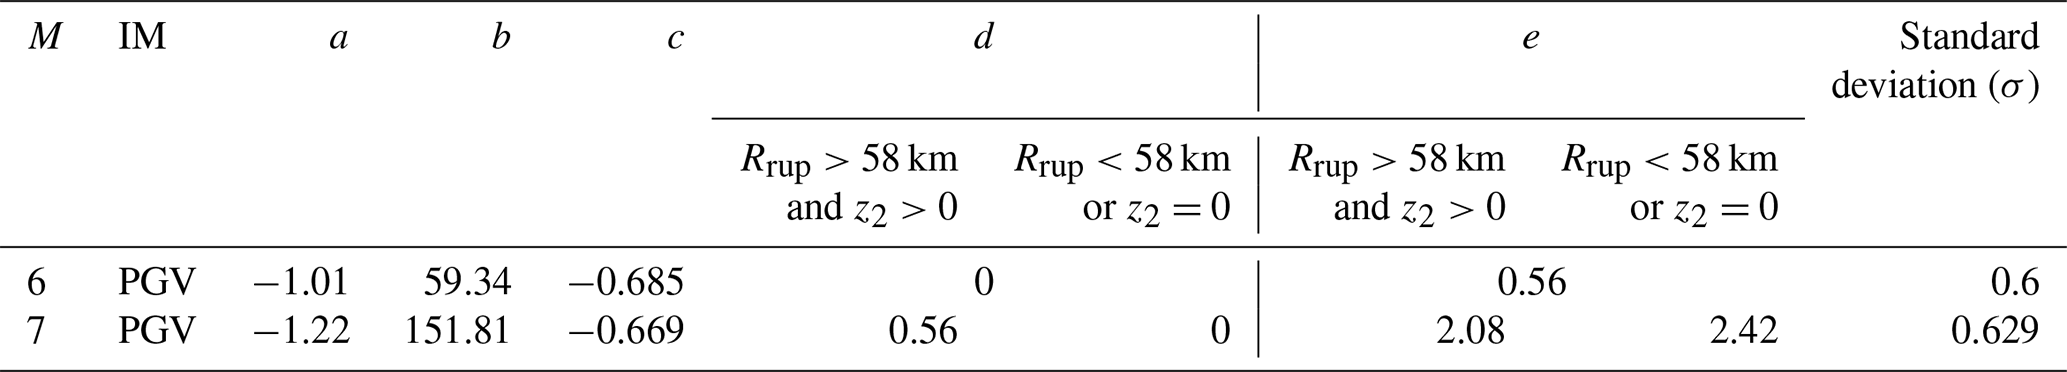
The next step was to formulate a parametric ground motion attenuation model (AM) for the two magnitudes based on our simulations. Such a model will provide an estimate for the median ground motions and their variability. The general parametric form of the AM for both M 6 and M 7 is based on the CB14 function and presented in Eq. (1):
where Y is ground motion intensity measure (IM). Due to the bandwidth of our numerical models (0.1 to 1 Hz), we formulated the AM in terms of PGV. We used the closest distance to the fault rupture plane (RRUP as defined in CB14) as the initial explanatory variable. To improve the accuracy of the model, we incorporated two additional variables into the regressions: surface shear wave velocity at the site (VS,surf) and the depth to VS=2 km s−1 (Z2), which is the depth to the hard Mesozoic sediments (top Judea group) considered the primary reflector in the region. Model coefficients are denoted a, b, c, d, and e, and σ is the standard deviation. The VS,ref is the shear wave velocity corresponding to the Judea group in the computational domain, which in our model equals 2000 m s−1.
The process of minimizing the residuals as a function of each explanatory variable can be found in the Supplement (Fig. S3 in the Supplement). We used VS,surf instead of the more common VS30 as our grid resolution is 76 m, preventing us from accurately determining the time-averaged shear wave velocity in the top 30 m of each site in our model. The coefficients and the total standard deviation for each model are summarized in Table 4.
Table 4Regression coefficients for the attenuation model (AM).
4.3 AM variability
We then examined the simulated data and the contribution of each scenario to the AM variability. We calculated the within-event (δW) and between-event (δB) residuals (see Al Atik et al., 2010) for each magnitude and distance:
where is the simulation value for event i and recording j, is the median for event i, and PGVAM is the AM median value. The total residual is the sum of the within- and between-event residuals.
The residuals are presented in Fig. 6: total (Fig. 6a and b), within-event (Fig. 6c and d), and between-events (Fig. 6e and f). The total residuals (Fig. 6a and b) show a large underprediction of the PGV from the JVF scenario (orange) on which we modeled a super-shear rupture, up to a ratio of 2.5 and 2 in the Zevulun Valley (orange triangles), for M 6 and M 7, respectively. However, the AM also exhibits overpredictions: the PGVs from the scenarios nucleated in the crystalline basement (SF, JF, and CFZ), with rupture speed=3195 m s−1, are overpredicted down to a ratio of more than −1 (in natural logarithm, ln, units).

Figure 6Residuals between simulated and attenuation model (AM) PGVs as a function of rupture distance (RRUP) for bilateral rupture on the Jordan Gorge Fault (JGF-B), Jericho Fault (JF), Carmel Fault Zone (CFZ; for M 6), and the Shemona Fault (SF; for M 7), a southward unilateral rupture on the JGF (JGF-U), and a super-shear rupture on the Jordan Valley Fault (JVF) for M 6 (left) and M 7 (right): (a, b) total residuals, (c, d) within-event (δW) residuals, and (e, f) between-event (δB) residuals. The records from Zevulun Valley and the sedimentary wedge (SW) are marked with triangles and rectangles, respectively. The other records are marked with circles. Residuals are in ln units.
Some within-event residuals exhibit distance dependency; for M 7, the JVF (super-shear) and JGF-U (directivity model) residuals increase with rupture distances greater than 20 km. The JVF residuals also demonstrate the same distance dependency for M 6; however, the effect is less prominent when compared to M 7.
The effect of the rupture directivity (JGF-U) is demonstrated by comparing the Zevulun Valley and the sedimentary wedge within-event residuals (Fig. 6c and d). While in a symmetric rupture (JGF-B) the seismic energy dissipates equally into the northern and southern parts of the model, in an asymmetric rupture (JGF-U), more energy propagates toward the south, resulting in stronger ground motions at the sedimentary wedge (Fig. 5). However, the ground motions are less intensive at the Zevulun Valley compared to the symmetric rupture. As a result, the within-event residuals for Zevulun Valley are higher for the JGF-B scenario compared to the JGF-U scenario, while for the sedimentary wedge, the opposite is true. Most clearly, the JVF between-event residuals are the highest for both M 6 and M 7 with a ratio of 1 (Fig. 6e and f).
We further studied the single station variation of ground motions and quantified the misfit between the simulated PGV and the AM PGV. We calculated the mean ground motion and its standard deviation at each station. The residuals for single station k were calculated as follows:
where and are the simulated and predicted mean PGV at station k, respectively. Figures 7 and 8 show the mean simulated and mean AM PGVs for M 6 and M 7, respectively. For each station, we also plotted the standard deviation using a scaled diameter circle.
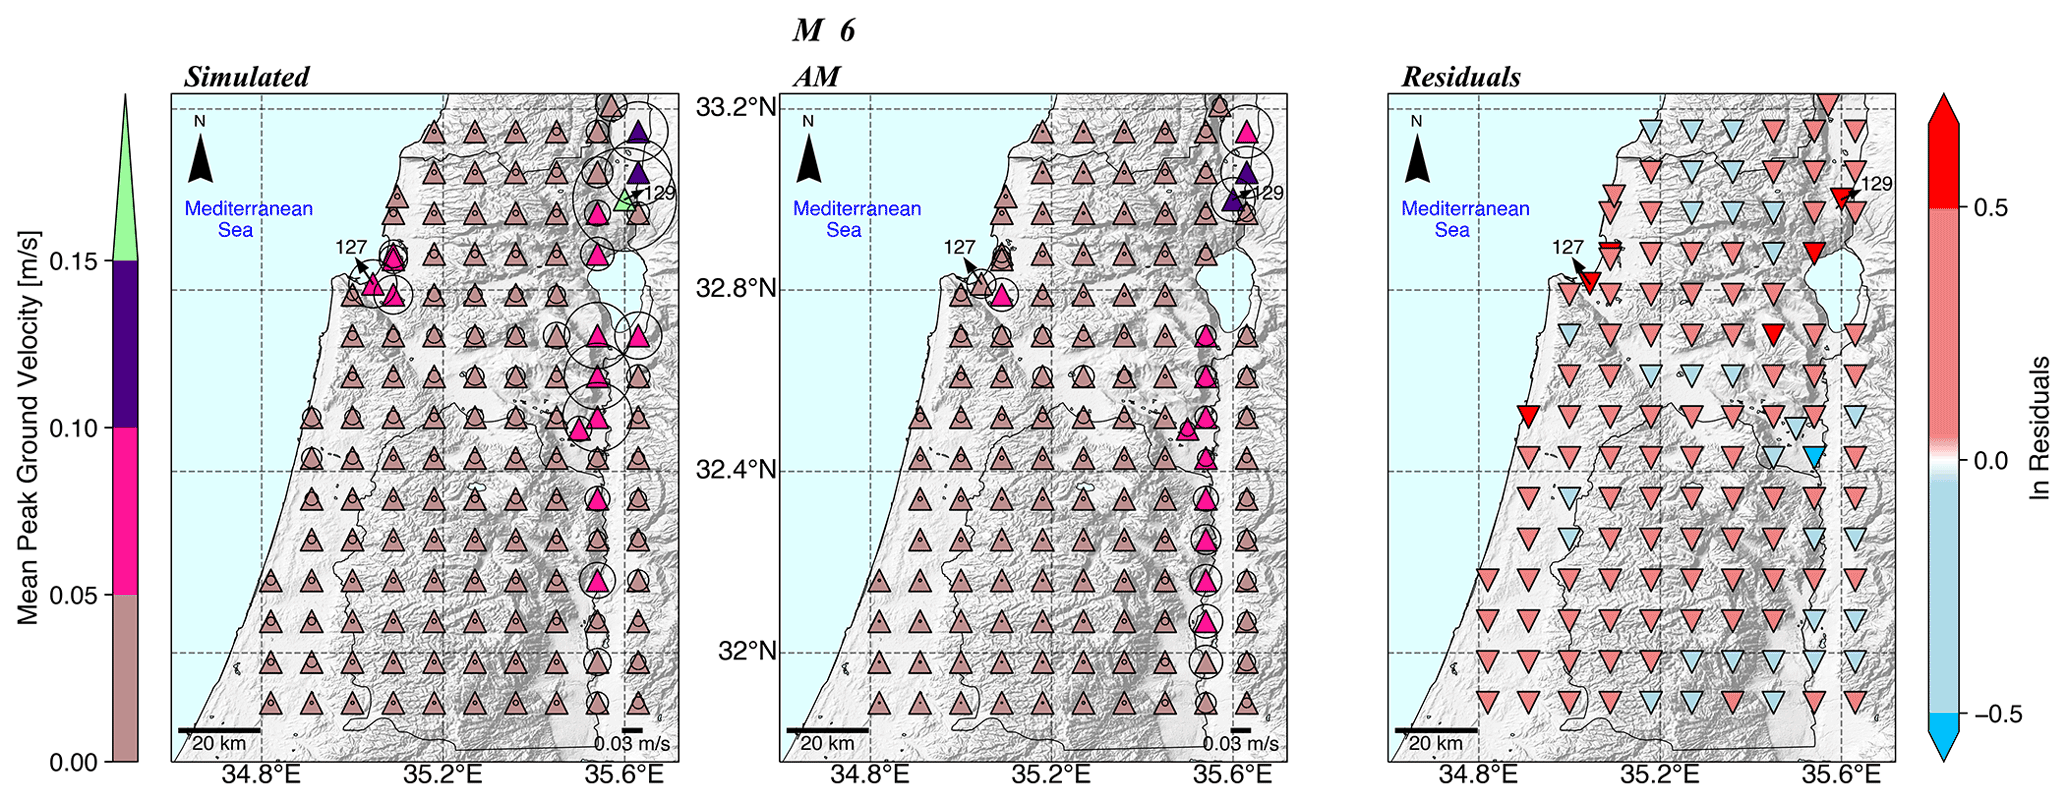
Figure 7Map view of simulated and AM mean PGVs (triangles) for M 6 and their standard deviation (diameter of the circles) at each station, with the respective residuals in ln units (inverted triangles).
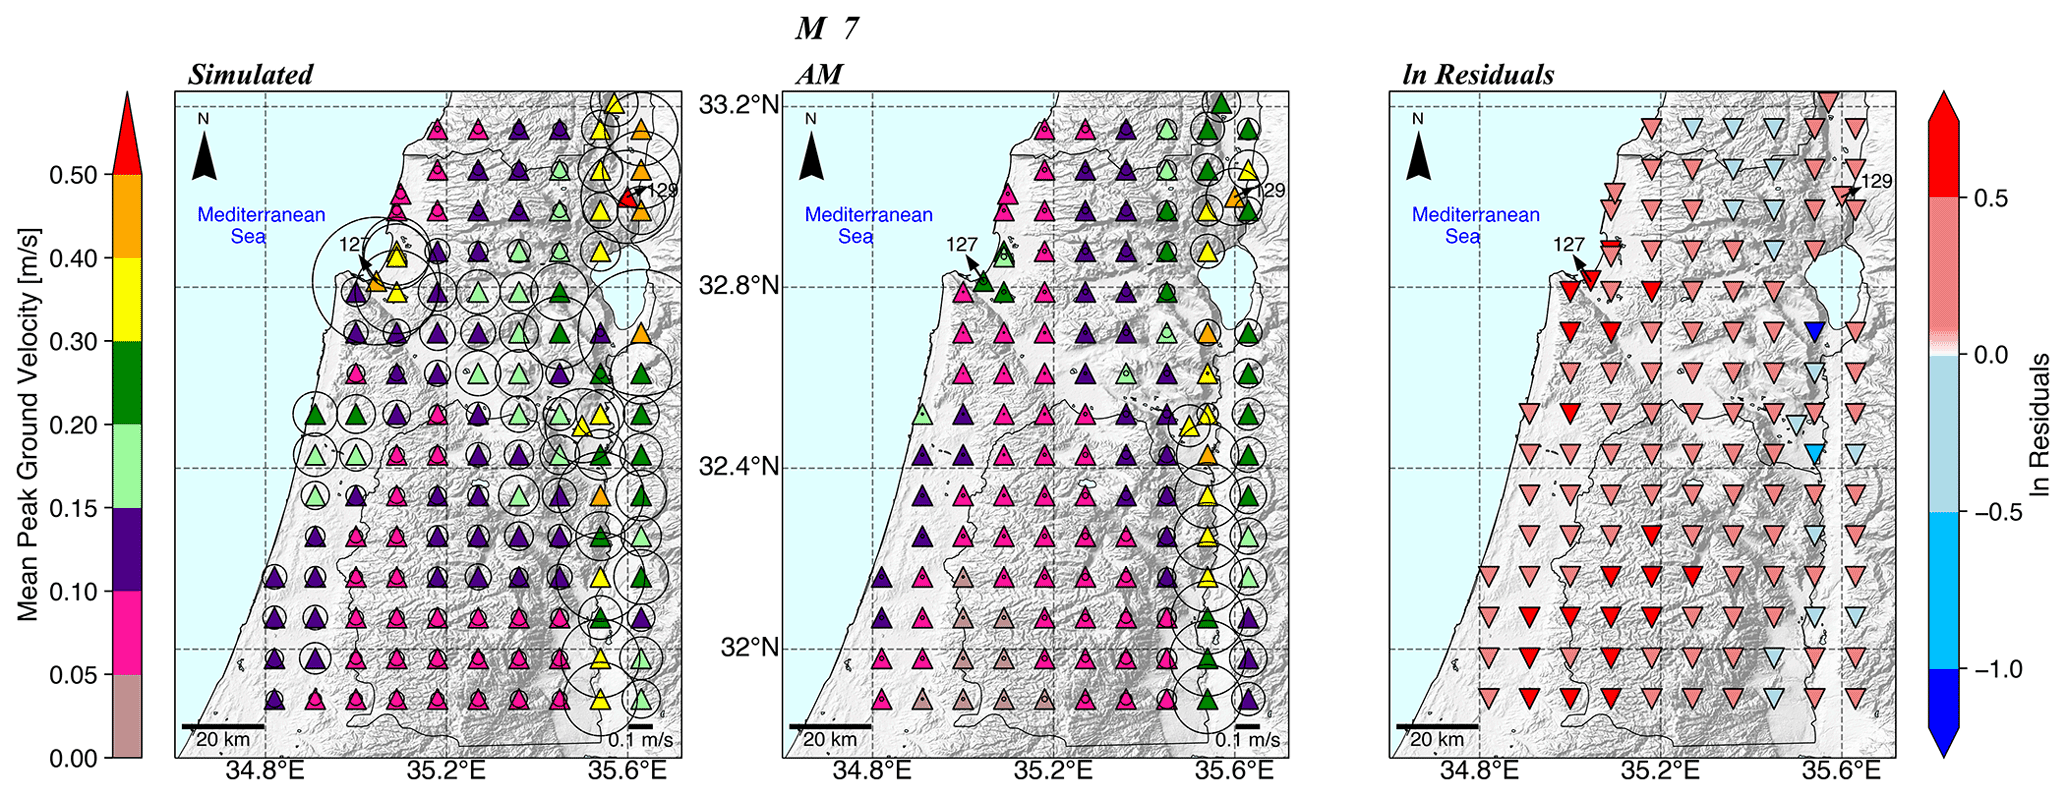
Figure 8Map view of simulated and AM mean PGVs (triangles) for M 7 and their standard deviation (diameters of the circles) at each station, with the respective residuals in ln units (inverted triangles).
Both figures show that simulated ground motion variability at a single station is large and not fully covered by the AM. For example, simulated ground motions at station 129 located on the Hula Valley exhibit a significant standard deviation. For M 6, it is the largest value (green triangle) of 0.17 m s−1 compared to 0.09 m s−1 (indigo) predicted by the AM, while for M 7, the largest standard deviation is 0.59 m s−1 (orange triangle) compared to 0.02 m s−1 (light green triangle) observed at station 127 located on the Zevulun Valley. As a result, there is a large discrepancy between the simulated and AM values at specific stations.
In general, as expected from normal log distribution, higher mean PGV values are accompanied by a larger standard deviation for both magnitudes. It is of significance for seismic hazard assessment as outlier ground motions at specific sites, mainly from M<7 earthquakes, could be a significant source of damage (Minson et al., 2020)
4.4 Comparison with global models
To examine the agreement between our simulations and an instrumental, global GMM, we calculated the total residuals between PGVs from our simulations and PGVs predicted by the CB14 model. We chose the CB14 model as it is planned to supersede the CB08 model used in the Israel Building Code (413). The CB14 PGVs were calculated for a strike-slip fault, for which we used the surface shear wave velocity as the Vs30 parameter and the basin response term Z2 as Z2.5. Figure 9 shows the total residuals for the AM and CB14 models as a function of distance (RRUP). For both magnitudes, the AM (mean and standard deviation) oscillates near the zero-model bias (dotted horizontal black line). However, it deviates when approaching the region containing rupture distances typical of the Zevulun Valley. The effect is more noticeable for M 7. Figure 9 also shows that the CB14 is less consistent and performs differently for each magnitude. While for M 6 the GMM mostly overpredicts (negative values) the simulated PGV (until reaching ZV and SW rupture distances zones), for M 7 it mostly underpredicts them (positive values), except for large distances, by up to a factor of 2 and above. In addition, the residuals calculated with respect to CB14 exhibit a significant standard deviation of the mean ground motion, with considerably larger variability for M 7.
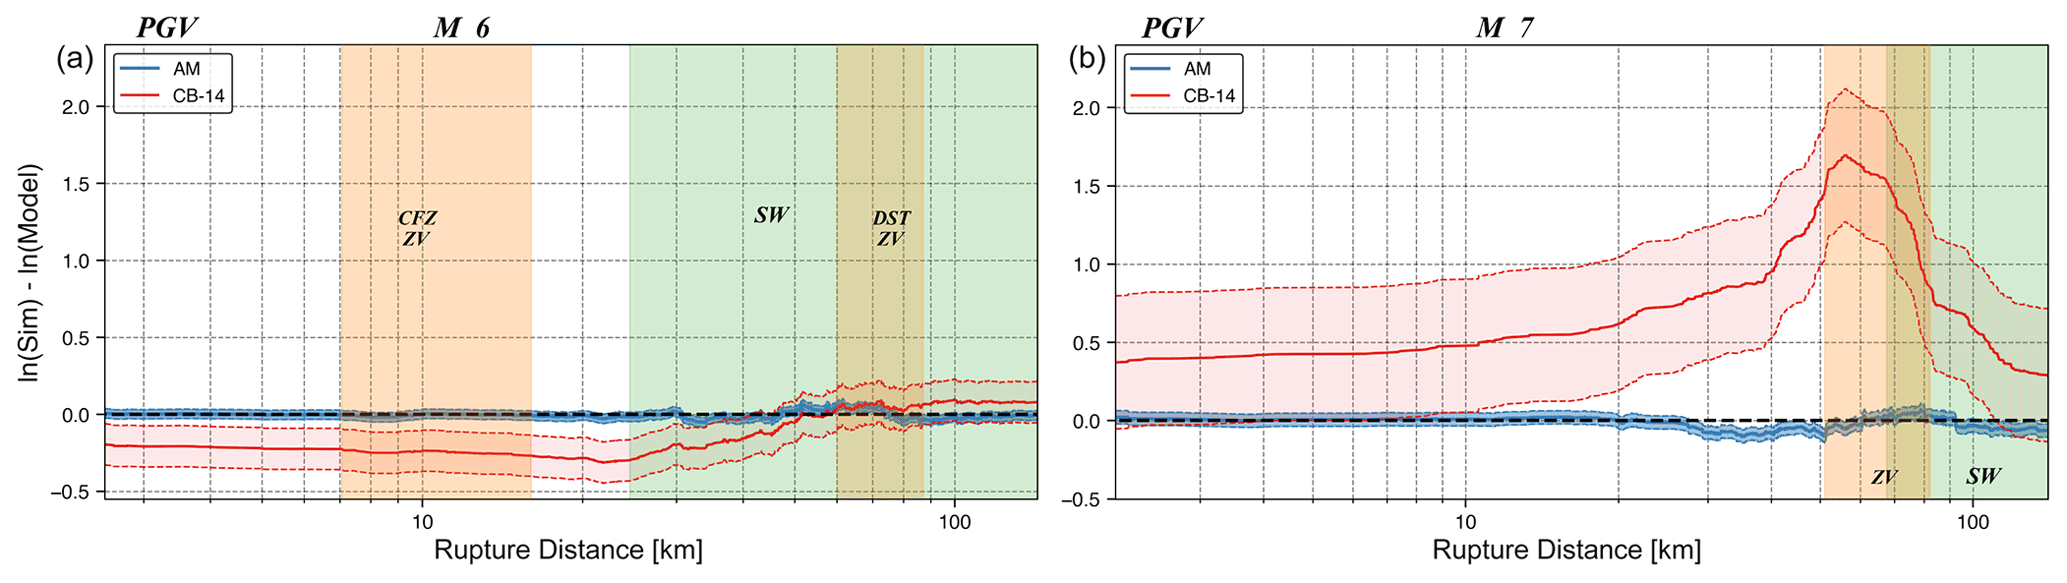
Figure 9PGV residuals between those simulated (Sim) and predicted by the AM (blue) and CB14 (red) models as a function of rupture distance (RRUP) for M 6 (a) and M 7 (b). Thick lines represent the mean, and the shaded region denotes the standard deviation at each distance. The green and yellow shaded regions indicate the range of rupture distances related to the sedimentary wedge (SW) and the Zevulun Valley (ZV), respectively. Residuals are in ln units.
It is important to note that, by averaging the PGVs, we subdue the performance of both models at individual stations/rupture distances; thus, we cannot analyze the residual's spatial variations at a specific location. However, it is sufficient to demonstrate that the global model deviates considerably from simulated ground motions.
4.5 Significant duration
Another important intensity measure is the significant duration (Ds 595), the time interval between 5 % to 95 % of the cumulative seismic energy (Arias Intensity) at a site. Figure 10 shows the simulated and empirical Ds 595 values as a function of rupture distance. The typical increase in the empirical model with distance is captured in the reference (laterally homogenous) model. However, for all other models, the significant duration remains nearly constant at rupture distances larger than 20 km. In addition, the empirical GMM mostly underpredicts the simulated values between 2 and 50 km for both magnitudes.
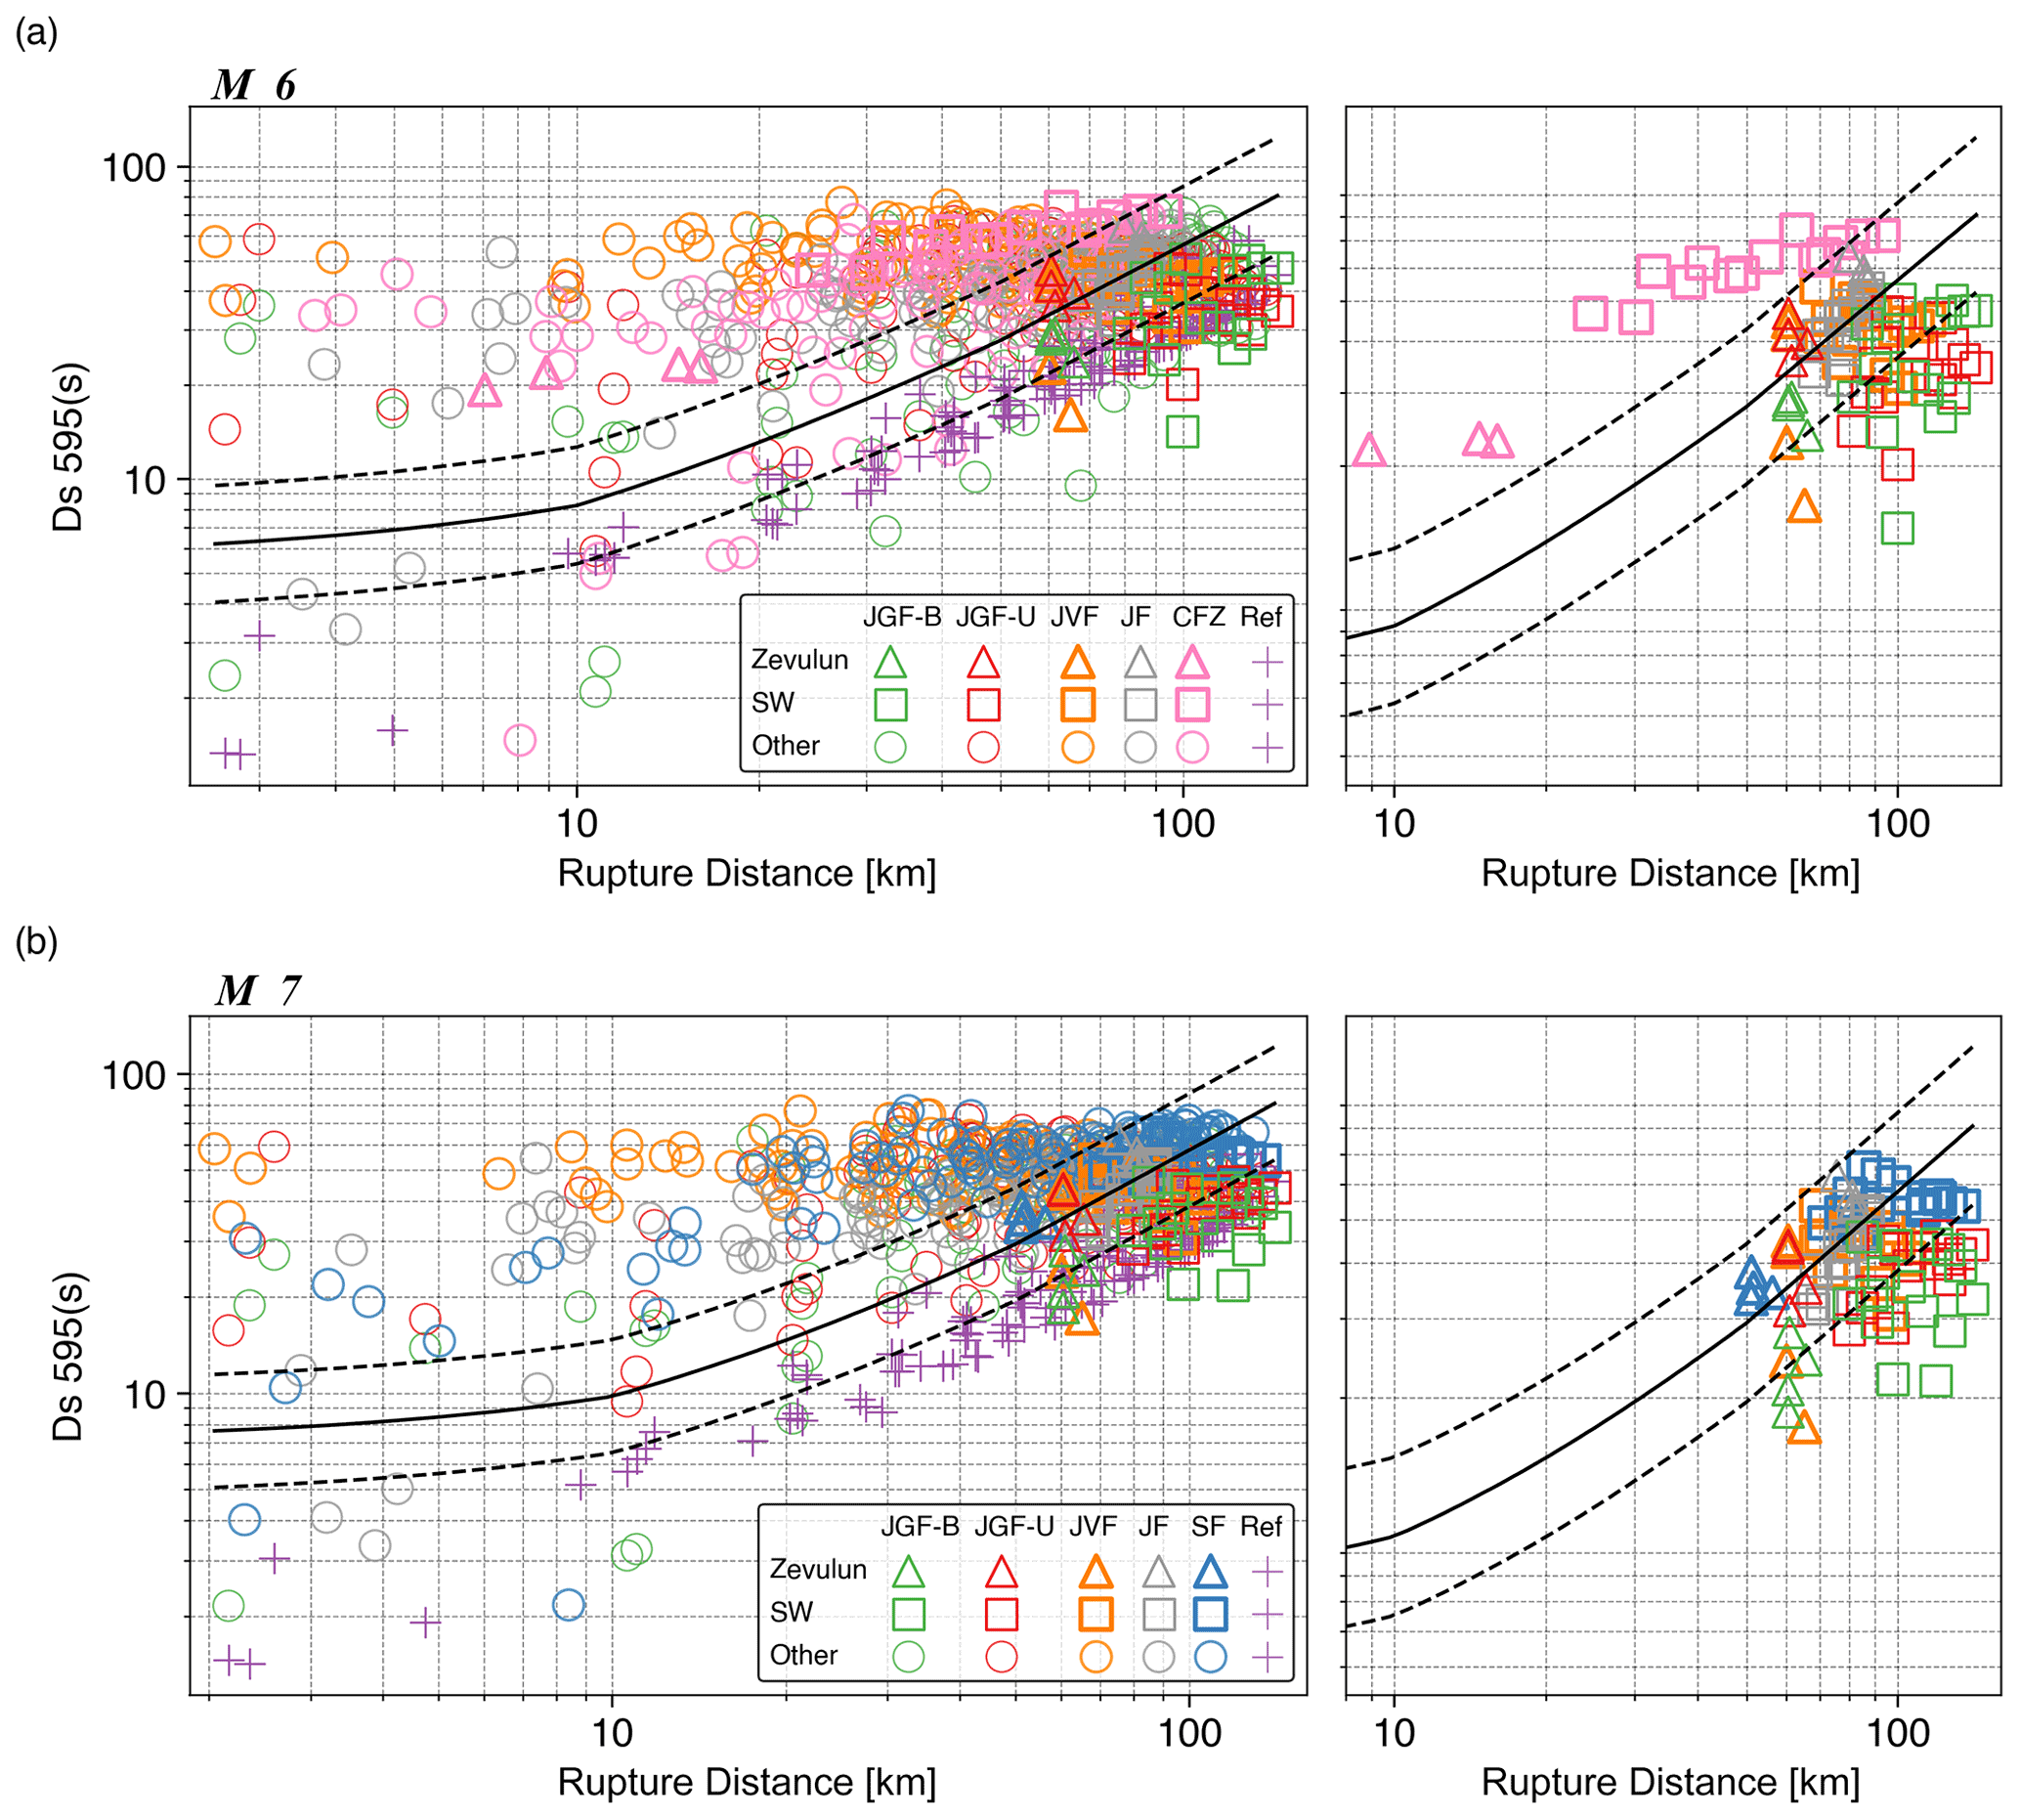
Figure 10The 5 % to 95 % ground motion significant duration (Ds 595) comparison between simulated and empirical GMMs (Afshari and Stewart, 2016) for bilateral rupture on the Jordan Gorge Fault (JGF-B), Jericho Fault (JF), Carmel Fault Zone (CFZ; for M 6), and Shemona Fault (SF; for M 7), a southward unilateral rupture on the JGF (JGF-U), and a super-shear rupture on the Jordan Valley Fault (JVF) for M 6 (a) and M 7 (b). Main plots (left) accompanied with subplots showing only the records from the Zevulun Valley and the sedimentary wedge (right). Solid and dashed lines represent the median and the standard deviation of the empirical GMM, respectively. The records from Zevulun Valley and the sedimentary wedge (SW) are marked with triangles and rectangles, respectively. The other records are marked with circles.
We postulate that this is caused by the complex geological setting of our model. The impact of geological complexity is reflected in Ds 595 values from near-source stations, Zevulun Valley (triangles), and the sedimentary wedge (rectangles). At near-source stations, the significant duration is large due to the effects of deep sedimentary structures along the DST, which also prolongs the path duration of the ground motions in other sites (Shimony et al., 2021), resulting in long significant duration with almost no path dependency. On the contrary at the Zevulun Valley and the SW, the energy accumulates faster than in other sites as the ground motions are amplified, reaching 95 % of the total energy over a shorter duration. Interestingly, the significant duration in Zevulun Valley is lower than in the sedimentary wedge. As we expect deep sedimentary structures to prolong shaking duration, it may sound counterintuitive. However, it is explained by the relative proximity of the Zevulun Valley to the rupture. Whereas in Zevulun Valley, most of the energy arrives as a pulse at the beginning of the record, the energy at the more distant sedimentary wedge accumulates more gradually and reaches its maximum almost at the end of the record, resulting in longer Ds 595 values. In general, there is no large deviation between the simulated significant duration for M 6 and M 7. However, the empirical model shows a longer duration for M 7. This resemblance in source duration is related to the DSM settings and more specifically to the source fundamental frequency, which in our study is the same for both magnitudes and is a subject for testing in future works.
A strong earthquake in Israel is imminent. However, up to date, a comprehensive regional GMM describing the spatial variability in ground motions has not yet been developed. This is mainly due to low seismicity rates and a magnitude-bounded strong motion database coupled with sparse instrumental coverage. The current ground motion database lacks events with magnitude M>6. To examine different source and path effects on ground motion variability, we simulated M 6 and M 7 earthquakes with different source and path properties. Subsequently, to study the ground motion variability, we developed a parametric attenuation model (AM) of PGV for M 6 and M 7 earthquakes, based on RRUP, Z2, and VS,surf explanatory values.
Our analysis showed that the AM was unable to fully capture the variability in the simulated ground motions. Except for the Jordan Valley Fault (JVF) scenarios, the AM overestimates most of the modeled ground motions. We postulate that this overestimation results from the outlier, higher PGV values from the JVF scenario (Fig. 5), shifting the average ground motion toward them. Also, the within-event residuals for the JVF scenario show a distance dependency for RRUP>20 km, continuing to grow away from the fault. We describe this scenario as a “black swan” of our simulations and account its outlier behavior to the effects of the super-shear rupture, specific to this model, affecting both the source (between-event residuals) and path (within-event residuals) terms of the ground motions (Fig. 6). Super-shear ruptures behave differently from sub-shear ruptures in many aspects. Most pertinent to our analysis is the slow energy decay of the super-shears relative to sub-shears (Bhat et al., 2007); thus, it cannot be fully captured by our AM, which is based mainly on sub-shear ruptures. In addition, it was found that Z2, depth to Mesozoic rock, has a very small impact (<0.001) on the standard deviation for the M 6 model, reducing it from 0.5998 to 0.5988 (Fig. S3). As a result, the M 6 model depends only on rupture distance and VS,surf. For M 7, Z2 is a good predictor for soil sites (Z2>0) located >58 km from the source, including the Zevulun Valley and the sedimentary wedge (Fig. 6d), imposing a great seismic hazard. We do not see a clear dependence of the deep sedimentary structures with Z2 along the DST. We speculate that the site response may be masked by nearby source effects, and this requires additional analysis.
For each scenario, both magnitudes considered, we observed high PGV values at the Zevulun Valley and the sedimentary wedge associated with local site effects. These sedimentary structures exhibit a larger discrepancy between the simulated and AM PGV values when compared with other sites. Such deviation indicates that the AM does not fully capture the site effects of these complex structures, and future model refinements are required. Likewise, the single station variability shows that the simulated values' highest mean and standard deviation were in Zevulun Valley and at near-source stations. In addition, a relatively high standard deviation was also found in the sedimentary wedge for M 7. This large single station variability is, apparently, the impact of the outlier JVF PGV values. The AM does not account for the standard deviation at near-source and Zevulun Valley stations for the M 6 model and almost at all stations for the M 7. In fact, as the AM was unable to capture the simulated JVF PGV values, it is expected that the single station variability cannot be captured either. Furthermore, the larger discrepancy for M 7 is due to the larger deviation of the JVF's ground motions from those of sub-shear ruptures (Fig. 5), on which the AM is mainly based.
Noteworthy to mention is that while the effect of the super-shear rupture on the AM performance is systematic over the entire computational domain, comprised of both source and path effects (Fig. 6), the effect of the southward directivity is a distance-dependent path effect, increasing towards the south and related to a larger amount of energy discharged in this direction. Additional records of super-shear and directivity ruptures and accounting for these source effects by additional model terms will improve the performance of the AM and will assist in better understanding the implications of these phenomena on the seismic hazard in Israel.
The comparison of the simulated ground motions with a global GMM (CB14) showed that this model is not well constrained for the simulated ground motions and does not capture their total variability. We note that the comparison was performed on a single IM, the PGV values, one of several intensity measures provided by the CB14. Thus, our findings are pertinent to the variability in PGV solely. It should be noted that PGV is a good proxy for structural damage (e.g., to Kaestli and Fäh, 2006; Wald et al., 1999) and hence a crucial parameter for seismic hazard mitigation. This discrepancy between modeled PGV and CB14 PGVs will inevitably result in a discrepancy in the evaluation of structural damage.
The significant duration (Ds 595) comparison showed again that the imported model performs differently than the simulated ground motion and cannot explain the local variability due to complex geological structure, affecting the source, path, and site terms of the ground motions, such as the path independence of the significant duration. However, we note that the Ds 595 values from our simulations were calculated based on low-frequency content (<1 Hz) and may be biased from Ds 595 calculated based on the complete spectrum comprised of both low and high frequencies. The effects of the frequency content on significant duration may be a potential topic for research in future works.
Regional simulations of near-fault ground motions from large Mw 7 earthquakes in Lebanon, based on a 1-D velocity approximation, were presented by Fayjaloun et al. (2021). A comparison between the results reported by Fayjaloun et al. (2021) with our results is somewhat limited. Specifically, it was shown that structural and material heterogeneity of the crust in Israel results in regional ground motion variability (Volk et al., 2017; Shani-Kadmiel et al., 2020; Shimony et al., 2021). These effects could only be captured by 3-D modeling.
We acknowledge that our AM is not independent of the evaluated models, thus describing both their explanatory and predictive power (Mak et al., 2017). However, our goal was not to develop an independent and comprehensive GMM but to study the ground motion variability through a parametric model.
Recently, Maiti et al. (2021) developed a suite of nine GMMs for Israel in the magnitude range of 3 to 8 and distance range of 1 to 300 km. These models are formulated in Fourier amplitude spectra (FAS) and are based on one empirical and four simulated ground motion datasets and two empirical host models. The simulated ground motions were generated using the stochastic method simulation (SMSIM) model of Boore (2003), with a unique set of parameters for each simulation, calibrated with the empirical ground motion dataset (discussed in detail in Yagoda-Biran et al., 2021a). However, the GMMs do not fully account for local source, path, and site effects due to a sparse empirical database at large magnitudes (M>6) and the utilization of a point-source stochastic simulation method. This method is useful for simulating mean ground motions. Yet, it is less appropriate for simulating site-specific and earthquake-specific ground motions and low-frequency ground motions, which are affected by the 3-D geometry of the computational domain. The AM presented in this work is based on 3-D simulations and incorporates a finite fault source with different rupture properties. This is the first step toward developing a regional GMM accounting for local source, path, and site effects. In subsequent work, which is beyond the scope of the current research, we intend to develop a complete GMM for Israel, which will include all the magnitudes and will be based on empirical (M<6) as well as on synthetic (M>6) databases. In addition, we plan to incorporate new path and site terms such as Z0.8 for the Zevulun Valley and the sedimentary wedge and distance-dependent and rupture-velocity-dependent attenuation for directivity and super-shear ruptures, among others, as well as a source term for super-shear ruptures. Such a model is expected to perform better than imported global models by maintaining both a lower aleatory variability and, as new synthetic data will be added to the database, reduced epistemic uncertainty of the median ground motions (Abrahamson et al., 2019).
The population of Israel is fast-growing, with an annual rate of 1.8 % (OECD 2020 data), compared with the 0.4 % average of the Organisation for Economic Co-operation and Development (OECD). Coupled with fast economic growth of 4.5 % (OECD 2019 data), the demand for housing and infrastructure constantly elevates the seismic risk in Israel. Our work shows that the ground motions in Israel from M 6 and M 7 earthquakes are expected to be very damaging, up to 8–9 EMS (Fig. S4 in the Supplement). Furthermore, the modeled ground motions exhibit considerable spatial variability which imported GMMs do not fully capture. The development of a local comprehensive GMM model is therefore critical for the mitigation of seismic risk. In the foreseeable future, the moderate–strong ground motion data gap will be filled by synthetic ground motion records from systematic numerical simulations.
Israel seismic catalog (Fig. 1a), expanded based on the Wetzler and Kurzon (2016a) catalog and the configuration of the Israel Seismic Network (Fig. 1b) based on Kurzon et al. (2020a), can be found at https://earthquake.co.il/en/earthquake/searchEQS.php (Wetzler and Kurzon, 2016b) and https://earthquake.co.il/en/network/accNetwork.php (Kurzon et al., 2020b), respectively. The ground motion database of Israel (Fig. 2) discussed in Yagoda-Biran et al. (2021a) is available at https://earthquake.co.il/en/hazards/EngSeismology.php (Yagoda-Biran et al., 2021b). The Taub Center population projections for Israel are accessible at https://www.taubcenter.org.il/en/pr/population-projections-for-israel-2017-2040/ (Weinreb, 2021). OECD population and economic growth rates can be found at https://data.oecd.org/israel.htm#profile-economy (The Organisation for Economic Co-operation and Development, 2021). Simulations were performed using SW4 version 2.0 (v2.0; Petersson and Sjögreen, 2017a), an open-source package for wave propagation simulations, available at https://github.com/geodynamics/sw4 (Petersson and Sjogreen, 2021). Data processing was done with the pySW4 package from Shahar Shani-Kadmiel, available at https://github.com/shaharkadmiel/pySW4 (Shani-Kadmiel, 2021), and “obspy” (Beyreuther et al., 2010), developed for numerical seismology. Figures were prepared with Matplotlib (Hunter, 2007) and Cartopy (Met Office, 2016). Peak ground velocity (PGV) values, according to Campbell and Bozorgnia (2014), were calculated using the Next Generation Attenuation West Project (NGA-West2) ground motion prediction equations (GMPEs) Excel file, available at https://apps.peer.berkeley.edu/ngawest2/databases/ (Seyhan, 2021). The Supplement includes the following: (1) synthetic station network deployed in our models (Fig. S1), (2) distributed slip model (DSM) slip distribution and rupture time (Fig. S2), (3) the evolution of the residuals between simulated and attenuation model (AM) PGV for M 6 and M 7 (Fig. S3), and (4) map view of simulated mean EMS intensity calculated according to Kaestli and Fäh (2006).
The supplement related to this article is available online at: https://doi.org/10.5194/nhess-22-1451-2022-supplement.
The authors confirm the contribution to the paper as follows: study conception: JG and MT; numerical simulations and data processing: JG; design (figures): JG and MT; interpretation of results: JG and MT; and draft manuscript preparation: JG and MT.
The contact author has declared that neither they nor their co-author has any competing interests.
Publisher's note: Copernicus Publications remains neutral with regard to jurisdictional claims in published maps and institutional affiliations.
This article is part of the special issue “Earthquake-induced hazards: ground motion amplification and ground failures”. It is not associated with a conference.
This research was partially funded by the Ministry of Energy, Israel (grant number 219-17-02). Co-author Jonatan Glehman was partially supported by the Ministry of Energy scholarship for graduate studies (tender 76/19). We would like to thank Ronnie Kamai for her assistance in formulating the AM.
This research has been supported by the Ministry of Energy, Israel (grant no. 219-17-02). Co-author Jonatan Glehman was partially supported by the Ministry of Energy scholarship for graduate studies (tender 76/19).
This paper was edited by Paolo Frattini and reviewed by two anonymous referees.
Abrahamson, N. A., Kuehn, N. M., Walling, M., and Landwehr, N.: Probabilistic seismic hazard analysis in california using nonergodic ground-motion models, B. Seismol. Soc. Am., 109, 1235–1249, https://doi.org/10.1785/0120190030, 2019.
Afshari, K. and Stewart, J. P.: Physically parameterized prediction equations for significant duration in active crustal regions, Earthq. Spectra, 32, 2057–2081, https://doi.org/10.1193/063015EQS106M, 2016.
Agnon, A.: Pre-instrumental earthquakes along the Dead Sea rift, in: Modern Approaches in Solid Earth Sciences, vol. 6, Springer, 207–261, https://doi.org/10.1007/978-94-017-8872-4_8, 2014.
Al Atik, L., Abrahamson, N., Bommer, J. J., Scherbaum, F., Cotton, F., and Kuehn, N.: The variability of ground-motion prediction models and its components, Seismol. Res. Lett., 81, 794–801, https://doi.org/10.1785/gssrl.81.5.794, 2010.
Aldersons, F., Ben-Avraham, Z., Hofstetter, A., Kissling, E., and Al-Yazjeen, T.: Lower-crustal strength under the Dead Sea basin from local earthquake data and rheological modeling, Earth Planet. Sc. Lett., 214, 129–142, https://doi.org/10.1016/S0012-821X(03)00381-9, 2003.
Ambraseys, N. N.: Comparison of frequency of occurrence of earthquakes with slip rates from long-term seismicity data: The cases of Gulf of Corinth, Sea of Marmara and Dead Sea Fault Zone, Geophys. J. Int., 165, 516–526, https://doi.org/10.1111/j.1365-246X.2006.02858.x, 2006.
Anderson, J. G. and Brune, J. N.: Probabilistic seismic hazard analysis without the ergodic assumption, Seismol. Res. Lett., 70, 19–28, https://doi.org/10.1785/gssrl.70.1.19, 1999.
Bartov, Y., Steinitz, G., Eyal, M., and Eyal, Y.: Sinistral movement along the Gulf of Aqaba – Its age and relation to the opening of the Red Sea, Nature, 285, 220–222, https://doi.org/10.1038/285220a0, 1980.
Ben-Avraham, Z., Ginzburg, A., Makris, J., and Eppelbaum, L.: Crustal structure of the Levant Basin, eastern Mediterranean, Tectonophysics, 346, 23–43, https://doi.org/10.1016/S0040-1951(01)00226-8, 2002.
Beyreuther, M., Barsch, R., Krischer, L., Megies, T., Behr, Y., and Wassermann, J.: ObsPy: A python toolbox for seismology, Seismol. Res. Lett., 81, 530–533, https://doi.org/10.1785/gssrl.81.3.530, 2010.
Bhat, H. S., Dmowska, R., King, G. C. P., Klinger, Y., and Rice, J. R.: Off-fault damage patterns due to supershear ruptures with application to the 2001 Mw 8.1 Kokoxili (Kunlun) Tibet earthquake, J. Geophys. Res.-Sol. Ea., 112, 1–19, https://doi.org/10.1029/2006JB004425, 2007.
Boore, D. M.: Simulation of ground motion using the stochastic method, Pure Appl. Geophys., 160, 635–676, https://doi.org/10.1007/PL00012553, 2003.
Brocher, T. M.: Key elements of regional seismic velocity models for long period ground motion simulations, J. Seismol., 12, 217–221, https://doi.org/10.1007/s10950-007-9061-3, 2008.
Campbell, K. W. and Bozorgnia, Y.: NGA ground motion model for the geometric mean horizontal component of PGA, PGV, PGD and 5 % damped linear elastic response spectra for periods ranging from 0.01 to 10 s, Earthq. Spectra, 24, 139–171, https://doi.org/10.1193/1.2857546, 2008.
Campbell, K. W. and Bozorgnia, Y.: NGA-West2 ground motion model for the average horizontal components of PGA, PGV, and 5 % damped linear acceleration response spectra, Earthq. Spectra, 30, 1087–1114, https://doi.org/10.1193/062913EQS175M, 2014.
Chaljub, E., Moczo, P., Tsuno, S., Bard, P. Y., Kristek, J., Käser, M., Stupazzini, M., and Kristekova, M.: Quantitative comparison of four numerical predictions of 3D ground motion in the Grenoble Valley, France, B. Seismol. Soc. Am., 100, 1427–1455, https://doi.org/10.1785/0120090052, 2010.
Douglas, J. and Aochi, H.: A survey of techniques for predicting earthquake ground motions for engineering purposes, Surv. Geophys., 29, 187–220, https://doi.org/10.1007/s10712-008-9046-y, 2008.
Fayjaloun, R., Dabaghi, M., Cornou, C., Causse, M., Lu, Y., Stehly, L., Voisin, C., and Mariscal, A.: Hybrid Simulation of Near-Fault Ground Motion for a Potential Mw 7 Earthquake in Lebanon, B. Seismol. Soc. Am., 111, 2441–2462, https://doi.org/10.1785/0120210091, 2021.
Garfunkel, Z.: Lateral motion and deformation along the Dead Sea transform, in: Modern Approaches in Solid Earth Sciences, vol. 6, Springer International Publishing, 109–150, https://doi.org/10.1007/978-94-017-8872-4_5, 2014.
Graves, R. and Pitarka, A.: Refinements to the Graves and Pitarka (2010) broadband ground-motion simulation method, Seismol. Res. Lett., 86, 75–80, https://doi.org/10.1785/0220140101, 2015.
Graves, R., Jordan, T. H., Callaghan, S., Deelman, E., Field, E., Juve, G., Kesselman, C., Maechling, P., Mehta, G., Milner, K., Okaya, D., Small, P., and Vahi, K.: CyberShake: A Physics-Based Seismic Hazard Model for Southern California, Pure Appl. Geophys., 168, 367–381, https://doi.org/10.1007/s00024-010-0161-6, 2011.
Grünthal, G., Hakimhashemi, A., Schelle, H., Bosse, C., and Wahlström, R.: The long-term temporal behaviour of the seismicity of the Dead Sea Fault Zone and its implication for time-dependent seismic hazard assessments, Scientific Technical Report STR, 09/09), Potsdam: Deutsches GeoForschungsZentrum GFZ, 45 S.: Ill., graph. Darst., https://doi.org/10.2312/GFZ.b103-09098, 2009.
Gvitzman, Z. and Zaslavsky, Y.: Map of Zones with Potentially High Ground Motion Amplification: Explanatory Notes, Rep. Num. GSI/15/2009, https://www.gov.il/he/Departments/publications/reports/gvirtzman-zaslavsky-report-2009 (last access: June 2021), 2009 (in Hebrew).
Gvirtzman, Z., Zilberman, E., and Folkman, Y.: Reactivation of the Levant passive margin during the late Tertiary and formation of the Jaffa Basin offshore central Israel, J. Geol. Soc. London, 165, 563–578, https://doi.org/10.1144/0016-76492006-200, 2008.
Gvirtzman Z., Makowski, I., and Sagee, Y.: Re-processing and geological re-interpretation of old seismic lines of Haifa bay, Geological Survey of Israel, GSI/27/2011, https://www.mapi.gov.il/earthquake/documents/gsi_27_2011.pdf (last access: June 2021), 2011 (in Hebrew).
Hamiel, Y., Amit, R., Begin, Z. B., Marco, S., Katz, O., Salamon, A., Zilberman, E., and Porat, N.: The seismicity along the dead sea fault during the last 60 000 years, B. Seismol. Soc. Am., 99, 2020–2026, https://doi.org/10.1785/0120080218, 2009.
Hamiel, Y., Piatibratova, O., and Mizrahi, Y.: Creep along the northern Jordan Valley section of the Dead Sea Fault, Geophys. Res. Lett., 43, 2494–2501, https://doi.org/10.1002/2016GL067913, 2016.
Hunter, J. D.: Matplotlib: A 2D graphics environment, Comput. Sci. Eng., 9, 90–95, https://doi.org/10.1109/MCSE.2007.55, 2007.
Israel Standards Institution: Standard SI 413, Design Provisions for Earthquake Resistance of Structures, Amendment No. 5, 2013.
Kaestli, P. and Fäh, D.: Rapid estimation of macroseismic effects and Shakemaps using macroseismic data, in: 1st European Conf. Earthquake Engineering and Seismology, Geneva, Switzerland, 3–8 September 1535, p. 137, ISBN 9782839901901, 2839901900, 2006.
Kuehn, N. M., Abrahamson, N. A., and Walling, M. A.: Incorporating nonergodic path effects into the NGA-west2 ground-motion prediction equations, B. Seismol. Soc. Am., 109, 575–585, https://doi.org/10.1785/0120180260, 2019.
Kurzon, I., Nof, R. N., Laporte, M., Lutzky, H., Polozov, A., Zakosky, D., Shulman, H., Goldenberg, A., Tatham, B., and Hamiel, Y.: The “TRUAA” seismic network: Upgrading the Israel Seismic Network-toward national earthquake early warning system, Seismol. Res. Lett., 91, 3236–3255, https://doi.org/10.1785/0220200169, 2020a.
Kurzon, I., Nof, R. N., Laporte, M., Lutzky, H., Polozov, A., Zakosky, D., Shulman, H., Goldenberg, A., Tatham, B., and Hamiel, Y.: Configuration of the Israel Seismic Network, https://earthquake.co.il/en/network/accNetwork.php (last access: September 2021), Geological Survey of Israel (GSI) [data set], 2020b.
Lan, X., Xing, H., Zhou, J., and Zhao, J. X.: A comparison of the source, path, and site effects of the strong-motion records from the western and the southwestern parts of China with modern ground-motion prediction equations, B. Seismol. Soc. Am., 109, 2691–2709, https://doi.org/10.1785/0120180293, 2019.
Maiti, S. K., Yagoda-Biran, G., and Kamai, R.: A Suite of Alternative Ground-Motion Models (GMMs) for Israel, B. Seismol. Soc. Am., 111, 2177–2194, https://doi.org/10.1785/0120210003, 2021.
Mak, S., Cotton, F., and Schorlemmer, D.: Measuring the performance of ground-motion models: The importance of being independent, Seismol. Res. Lett., 88, 1212–1217, https://doi.org/10.1785/0220170097, 2017.
Met Office: Cartopy: a cartographic python library with a matplotlib interface, http://scitools.org.uk/cartopy (last access: September 2021), 2016.
Minson, S. E., Baltay, A. S., Cochran, E. S., McBride, S. K., and Milner, K. R.: Shaking is almost always a surprise: The earthquakes that produce significant ground motion, Seismol. Res. Lett., 92, 460–468, https://doi.org/10.1785/0220200165, 2020.
Mizutori, M. and D'ebarati, G.: The human cost of disasters: an overview of the last 20 years (2000–2019), UN Office for Disaster Risk Reduction, https://doi.org/10.18356/79b92774-en, 2020.
Pesaresi, M., Ehrlich, D., Kemper, T., Siragusa, A., Florczyk, A., Freire, S., and Corbane, C.: Atlas of the Human Planet 2017. Global Exposure to Natural Hazards, 92 pp., EUR 28556 EN, https://doi.org/10.18356/79b92774-en, 2017.
Petersson, N. A. and Sjogreen, B.: SW4 Users Guide, Lawrence Livermore Natl. Lab. Tech. Rep. LLNL-SM, 662014, 2014.
Petersson, N. A. and Sjogreen, B.: SW4, version 2.0, Computational Infrastructure of Geodynamics, Zenodo, https://doi.org/10.5281/zenodo.1045297, 2017a.
Petersson, N. A. and Sjogreen, B.: User's guide to SW4, version 2.0, LLNL-SM-741439, https://geodynamics.org/resources/1767/download/SW4-UsersGuide-2.0.pdf (last access: September 2021), 2017b.
Petersson, N. A. and Sjogreen, B.: SW4 – Seismic Waves, 4th order accuracy, GitHub [code], https://github.com/geodynamics/sw4, last access: June 2021.
Pitarka, A., Akinci, A., De Gori, P., and Buttinelli, M.: Deterministic 3D Ground-Motion Simulations (0–5 Hz) and Surface Topography Effects of the 30 October 2016 Mw 6.5 Norcia, Italy, Earthquake, B. Seismol. Soc. Am., 112, 262–286, https://doi.org/10.1785/0120210133, 2021.
Rosenthal, M., Ben-Avraham, Z., and Schattner, U.: Almost a sharp cut – A case study of the cross point between a continental transform and a rift, based on 3D gravity modeling, Tectonophysics, 761, 46–64, https://doi.org/10.1016/j.tecto.2019.04.012, 2019.
Rybakov, M., Fleischer, L., and ten Brink, U.: The Hula Valley subsurface structure inferred from gravity data, Isr. J. Earth Sci., 52, 113–122, https://www.researchgate.net/publication/228560796_The_Hula_Valley_subsurface_structure_inferred_from_gravity_data (last access: June 2021), 2003.
Sadeh, M., Hamiel, Y., Ziv, A., Bock, Y., Fang, P., and Wdowinski, S.: Crustal deformation along the Dead Sea Transform and the Carmel Fault inferred from 12 years of GPS measurements, J. Geophys. Res.-Sol. Ea., 117, B08410, https://doi.org/10.1029/2012JB009241, 2012.
Seyhan, E.: NGAW2_GMPE_Spreadsheets v5.7_041415, Pacific Earthquake Engineering Research Center (PEER) [data set] https://apps.peer.berkeley.edu/ngawest2/databases/, last access: September 2021.
Shamir, G., Bartov, Y., Sneh, A., Fleisher, L., Arad, V., and Rosensaft, M.: Preliminary seismic zonation in Israel, Israel Geological Survey Report GSI/12/2001, 2001.
Shani-Kadmiel, S.: pySW4 package, GitHub [code], https://github.com/shaharkadmiel/pySW4, last access: September 2021.
Shani-Kadmiel, S., Tsesarsky, M., and Gvirtzman, Z.: Distributed slip model for forward modeling strong Earthquakes, B. Seismol. Soc. Am., 106, 93–103, https://doi.org/10.1785/0120150102, 2016.
Shani-Kadmiel, S., Volk, O., Gvirtzman, Z., and Tsesarsky, M.: Ground motion amplification atop the complex sedimentary basin of Haifa Bay (Israel), B. Earthq. Eng., 18, 821–836, https://doi.org/10.1007/s10518-018-00533-9, 2020.
Shi, Z. and Ben-Zion, Y.: Dynamic rupture on a bimaterial interface governed by slip-weakening friction, Geophys. J. Int., 165, 469–484, https://doi.org/10.1111/j.1365-246X.2006.02853.x, 2006.
Shimony, R., Gvirtzman, Z., and Tsesarsky, M.: Seismic energy release from intra-basin sources along the dead sea transform and its influence on regional ground motions, B. Seismol. Soc. Am., 111, 295–308, https://doi.org/10.1785/0120200215, 2021.
The Organisation for Economic Co-operation and Development (OECD): OECD population and economic growth rates for Israel, OECD [data set], https://data.oecd.org/israel.htm#profile-economy, last access: June 2021.
Volk, O., Shani-Kadmiel, S., Gvirtzman, Z., and Tsesarsky, M.: 3D effects of sedimentary wedges and subsurface canyons: Ground-motion amplification in the Israeli coastal plain, B. Seismol. Soc. Am., 107, 1324–1335, https://doi.org/10.1785/0120160349, 2017.
Wald, D. J., Quitoriano, V., Heaton, T. H., and Kanamori, H.: Relationships between peak ground acceleration, peak ground velocity, and modified mercalli intensity in California, Earthq. Spectra, 15, 557–564, https://doi.org/10.1193/1.1586058, 1999.
Walling, M. and Abrahamson, N.: Non-Ergodic Probabilistic Seismic Hazard Analyses, in: 15th World Conference on Earthquake Engineering (15WCEE), Lisbon, Portugal, 24–28 September 2012, 12, 9520–9530, ISBN 978-1-63439-651-6, 2012.
Wang, Z.: A Clear Definition of Seismic Hazard and Risk: A Basis for Hazard and Risk Assessment, Communication, and Management, Am. Geophys. Union, S53B-1110, 2005.
Weinreb, A.: The Taub Center population projections for Israel, Policy Paper N0. 02.2020, https://www.taubcenter.org.il/en/pr/population-projections-for-israel-2017-2040/, last access: June 2021.
Wells, D. L. and Coppersmith, K. J.: New empirical relationships among magnitude, rupture length, rupture width, rupture area, and surface displacement, B. Seismol. Soc. Am., 84, 974–1002, 1994.
Wetzler, N. and Kurzon, I.: The earthquake activity of Israel: Revisiting 30 years of local and regional seismic records along the dead sea transform, Seismol. Res. Lett., 87, 47–58, https://doi.org/10.1785/0220150157, 2016a.
Wetzler, N. and Kurzon, I.: Israel Seismic Catalog, https://earthquake.co.il/en/earthquake/searchEQS.php, Geological Survey of Israel (GSI) [data set], 2016b.
Yagoda-Biran, G., Maiti, S. K., Wetzler, N., Nof, R. N., Pashcur, Y., and Kamai, R.: A ground-motion database for Israel with its corresponding point-source parameters, for engineering seismology applications, Seismol. Res. Lett., 92, 2679–2690, https://doi.org/10.1785/0220200477, 2021a.
Yagoda-Biran, G., Maiti, S. K., Wetzler, N., Nof, R. N., Pashcur, Y., and Kamai, R.: Ground motion database of Israel, https://earthquake.co.il/en/hazards/EngSeismology.php, Geological Survey of Israel (GSI) [data set], last access: September 2021b.
Zohar, M.: Temporal and spatial patterns of seismic activity associated with the Dead Sea transform (DST) during the past 3000 yr, Seismol. Res. Lett., 91, 207–221, https://doi.org/10.1785/0220190124, 2019.