the Creative Commons Attribution 4.0 License.
the Creative Commons Attribution 4.0 License.
 | 25 Jan 2022
A sanity check for earthquake recurrence models used in PSHA of slowly deforming regions: the case of SW Iberia
Margarida Ramalho
Luis Matias
Marta Neres
Michele M. C. Carafa
Alexandra Carvalho
Paula Teves-Costa
Probabilistic seismic hazard assessment (PSHA), despite its deep criticism, is still the most common tool used to decide on the acceptable seismic risk and corresponding mitigation measures. We propose two consistency tests to address the variability of earthquake generation models found in PSHA studies: (i) one rule-of-thumb test where the seismic moment release from the model is converted to an average slip on a typical fault and compared with known plate kinematics or GNSS deformation field and (ii) a test where using a neotectonic model the computed deformation is converted into seismic moment release and to a synthetic earthquake catalogue. We apply these tests to W and SW Iberia slowly deforming region, where two earthquake source areas are investigated: (1) the Lower Tagus Valley, one of the largest seismic risk zones of Portugal; and (2) the offshore SW Iberia area, considered to be the source for the 1 November 1755 event (M ∼ 8.7). Results show that some of the earthquake source models should be considered suspicious, given their high/low moment release when compared to the expected values from GNSS observations or neotectonic modelling. This analysis allowed for a downgrade of the weight of poorly compliant models in the PSHA analysis, and thus for a more realistic hazard assessment, and can be integrated in other studies of similar settings.
- Article
(5563 KB) - Full-text XML
-
Supplement
(609 KB) - BibTeX
- EndNote


In earthquake-prone areas modern societies with limited available resources must decide on the level of acceptable risk to define the appropriate mitigation measures. Probabilistic seismic hazard assessment (PSHA) is the most common tool used by decision makers to attain this equilibrium between risk and protection. Many PSHA studies have been conducted for emergency planning, for land use management, or to help establishing or revising building codes. Engineers use PSHA to help define the ground motion levels in building codes that will avoid failure or collapse of structures in the event that some expected earthquake occurs. PSHA was established by Cornell (1968) and since then has seen a large evolution and widespread application. PSHA is a technical methodology in seismology, but its use has political and economic constraints that must be addressed by society as a whole.
PSHA, in its simpler description, provides the probability that a given level of ground motion, U0, may be exceeded at a given location in a specific time period T, usually taken as the lifetime of the structures concerned. For a single site with a single earthquake source at a fixed distance, the result of PSHA is the product of two probabilities (e.g. Frankel, 2004),
Here P(E|T) is the probability that the earthquake occurs during the time period T, and P(U≥U0|E) is the probability of ground shaking exceeding the reference value U0 if the earthquake occurs. This simple description is useful since it splits the PSHA work in two different problems. The first factor is controlled by our knowledge of earthquake generation, while the second factor is addressed by the choice of ground motion prediction equations (GMPEs) and its associated uncertainties. One full PSHA study must consider all the possible earthquake sources affecting each site, and Eq. (1) becomes an integral of all possible contributions.
Despite PSHA limitations and flaws (e.g. Stein et al., 2012; Mulargia et al., 2017) it is the still most used method by society and the scientific community, and this work intends to be a contribution to its improvement. One of the evolutions suffered by PSHA studies and now recognized as essential is the evaluation of the uncertainties in the results (e.g. Stein and Stein, 2012). One contribution to the uncertainty of PSHA outputs results from our incomplete knowledge of the earthquake generation and propagation mechanisms. This lack of knowledge can be classified as aleatory, the uncertainty in random effects, and epistemic, the uncertainty in knowledge (uncertainty about the best model to use in PSHA computations when several models are possible). Uncertainties are already included in standard PSHA, where GMPEs are defined as statistical laws and the standard deviation of the logarithm of the predicted parameter is usually computed. Aleatory uncertainties in other parameters can be included by Monte Carlo simulations, and epistemic uncertainty is depicted through a logic tree, where each alternative model is ascribed some weight for PSHA computation. It is important to say that the weighting factors are usually assigned subjectively, often using expert opinion.
As pointed out by several authors (e.g. Stein et al., 2012; Mulargia et al., 2017) recent large earthquakes have occurred in areas where the seismic hazard was considered low or they caused ground shaking much greater than the one expected by PSHA studies. These events have demonstrated the weaknesses of PSHA and a deficit in the evaluation of its uncertainties. Mulargia et al. (2017) point out that PSHA assumes that frequencies of past earthquakes can be conflated with probabilities of future earthquakes but that this assumption appears to be incorrect. All researchers should be aware of this issue. While Mulargia et al. (2017) advocates the complete abandonment of PSHA, Stein et al. (2012), while questioning the foundations of PSHA, suggested two changes to PSHA to improve its practice. The work presented in this paper is a contribution to the improvement of PSHA studies particularly suited for slowly deforming regions that we consider to follow one of Stein et al.'s (2012) suggestions: “objective testing to compare their predictions to those of null hypotheses”.
The results of the PSHA studies are expressed as a statistical parameter on the exceedance probability for the ground motion parameter chosen. Results from different studies can only be compared if the final parameters to express PSHA are the same (e.g. peak ground motion with 10 % probability of being exceed in 50 years). When comparable, the differences among different studies' results can be huge. This brings confusion and uncertainty to the users of these studies, who use results for emergency management or land use planning and question the foundations for establishing or revising building codes. This large diversity is usually ascribed to the large uncertainty on the second term of Eq. (1), the uncertainty and differences in the ground motion prediction equations (GMPEs) used in the studies. However, there is also a large diversity on the earthquake generation models (first term of Eq. 1) and on the ways that the related uncertainties are assessed, but their consequences on the final PSHA results are difficult to assess and usually overlooked.
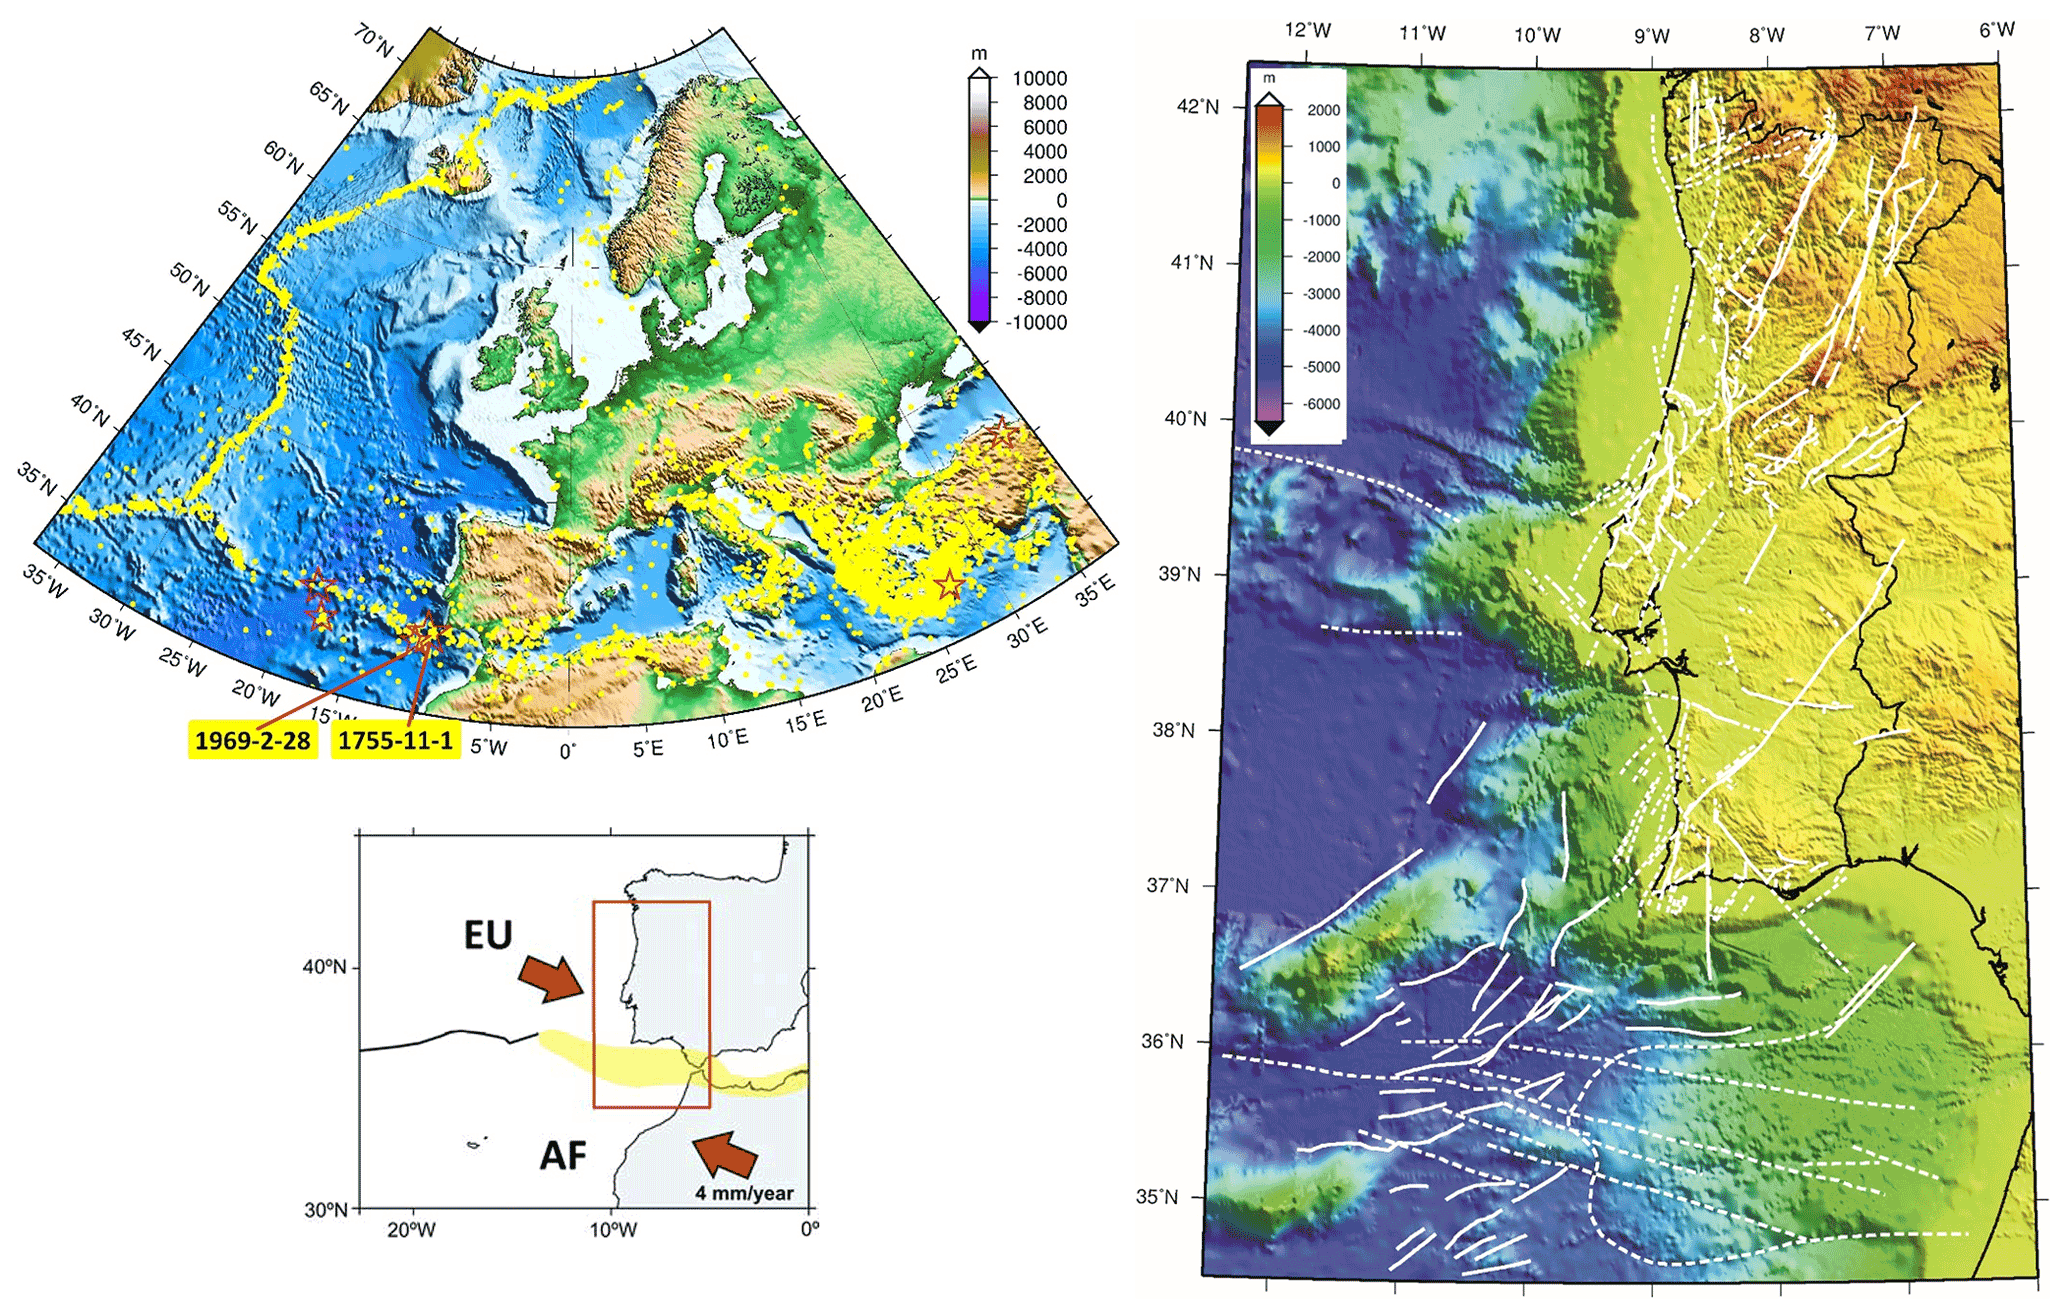
Figure 1Geodynamic setting of the investigated area. (a) Seismicity in and around Europe. Yellow dots show earthquake epicentres with M ≥ 5.0 from ISC (2018) for the period 1900–2018. Red stars show epicentres of events with M ≥ 8.0 according to the European instrumental (Grünthal and Wahlström, 2012) and historical catalogues (Stucchi et al., 2013). (b) The plate boundary setting of the studied area. The light-yellow domain indicates a diffuse plate boundary. (c) Active and probable active faults identified in the western Iberian mainland and offshore areas (modified from Cabral, 2012 and Duarte et al., 2013).
In this paper, we address the first factor of Eq. (1), the earthquake generation process, and propose a methodology to evaluate and validate earthquake generation models that are used for PSHA studies. This methodology is applied to western Iberia (Fig. 1), which is the source area of the largest earthquakes felt in Europe since year 1000. This area can be considered a typical example of slowly deforming regions (SDRs) where the instrumental and historical catalogues are incomplete when compared to the large (and uncertain) return periods of the large earthquakes and where active faults are challenging to identify since erosional processes exceed the tectonic activity. Furthermore, reverse faults may develop as splays or blind thrusts that rarely reach the surface. Therefore, SDRs are the most challenging domains to make PSHA studies and where they are more likely to fail. However, if it is possible to measure or estimate the rate of strain accumulation, then the earthquake generation models used in PSHA that exceed that rate or that are far below should be considered suspicious and its likelihood degraded accordingly.
Despite the recent failures and criticisms on PSHA and its foundations, we consider that the earthquake generation models used in PSHA studies can be evaluated using the elastic rebound principles; i.e. earthquakes are generated by accumulated strain in the lithosphere. We understand that even this basic postulate can be criticized, but global studies (Bird and Kagan, 2004) demonstrated that seismic coupling coefficients can be reliably computed for plate boundaries from the comparison of relative plate velocity and seismic moment release.
In more active areas, like subduction zones, a more complex interplay between seismicity and strain is possible. Carafa et al. (2018) investigating the Calabrian Arc proposed that the low strain rates observed by GPS together with large seismic moment release may be explained by a model with high interseismic coupling and low seismic coupling of the subduction interface. Meaning that some of the regional seismic strain is released by slow earthquakes that could induce clustered normal fault events on the upper plate.
Strain rates can result from tectonic stresses due to plate motions (near or far from plate boundaries), can result from glacial isostatic adjustment (GIA, Peltier et al., 2015) or may be due to gravity potential energy (GPE) differences. GPE contribution to the state of stress in Iberia was evaluated by Neres et al. (2018), and they conclude that GPE is a second-order effect that is mostly identified in high-relief areas, like the Pyrenees and Cantabria mountain ranges. In this work, we consider that in the investigated domains of W and SW Iberia, earthquakes are generated only by tectonic stresses controlled by the horizontal strain rate. If the strain rate is estimated, it can be used as a scale to compare with the earthquake generation models that are proposed in PSHA studies, thus providing a geodynamic constraint. We argue that the proposed methodology should be implemented in PSHA studies as a sanity test for competing earthquake generation models, in particular for other areas of the globe characterized by slow and/or diffuse deformation.
In the paper the term “sanity check” is used with the same meaning that was used, for example, for probabilistic tsunami hazard assessment in Basili et al. (2021). It means that the model predictions are tested (validated) against observations and/or independent parameter estimates.
The tectonic activity affecting western and southwestern Iberia is mainly caused by the slow convergence between Eurasia and Africa (Nubia) plates at a rate ∼ 4 mm yr−1 (e.g. Fernandes et al., 2003, Fig. 1a; Neres et al., 2016). The relative plate movement is accommodated by several tectonic features in what can be considered a diffuse plate boundary (e.g. Duarte et al., 2013; Neres et al., 2016, Fig. 1c). Despite the slow convergence rate, SW Iberia has been the locus of the largest-magnitude earthquakes that destroyed Europe, like the 28 February 1969 (Mw = 8.0, Grünthal and Wahlström, 2012) and the 1 November 1755 Lisbon earthquake with magnitude of 8.7 (Stucchi et al., 2013, Fig. 1a). The tectonic complexity of the area is compounded by another stress engine that has been invoked to affect SW Iberia, namely the westward movement of the Alboran domain, driven by subduction rollback in the Gulf of Cádiz (e.g. Neres et al., 2016, and references therein). The tectonic stresses generated by the plate convergence and slab rollback propagate inland, generating also some significant earthquakes, like the 23 April 1909 earthquake with M ∼ 6.1 (e.g. Teves-Costa et al., 2019).
Western and southwestern Iberia are usually considered one stable continental region (SCR) onshore domain (Johnston, 1989) in the sense that the most recent active tectonic event, the Alpine orogeny that led to the formation of the Pyrenees and the Betics in Iberia, attained its activity peak in Eocene and Miocene times (e.g. Terrinha et al., 2019). In W and SW Iberia, the Alpine orogeny resulted in the inversion of Meso-Cenozoic basins in central Portugal (the Lusitanian Basin) and in southern Portugal (the Algarve Basin) with a geographically limited expression (ibid.). The current tectonic activity observed inland is thus typical of slowly deforming regions (Custódio et al., 2015) with fault slip rates smaller than 1 mm yr−1.
Geologists consider as active faults the structures that show evidence of recent displacement (geological, geophysical, historical) so that new displacements may be expected in the future. In W and SW Iberia, the slip rate measurements in the identified active faults are small, from 0.005 mm yr−1 to a maximum of 0.2 mm yr−1 (Cabral, 1995, 2012). This implies that the classification of tectonic features as active is very conservative. Any structure showing activity since the upper Pliocene or Quaternary is considered to be active (roughly since the last 3 Myr, Fig. 1c). In the offshore domain, closer to the plate boundary between Eurasia and Africa (Nubia), the identified active or probable faults (Duarte et al., 2013, Fig. 1c) display evidence of more recent activity, probably since the Holocene (last 10 ky).
The last decade has seen a considerable improvement in the seismic monitoring network allowing for a very detailed location of earthquakes to magnitudes down to 1 (Custódio et al., 2015). The seismicity pattern that emerged from the more recent and best-located events shows that most of the earthquakes occur in clusters and seismic belts roughly oriented NNE–SSW and WNW–ESE. However, the relationship between these events and geologically mapped faults remains elusive (ibid.) in most cases, even after a 3D relocation using a regional tomographic model (Veludo et al., 2017). In offshore SW Iberia, the source area for the large 1755 and 1969 magnitude earthquakes (Fig. 1a), seismicity relocated by ocean bottom seismometers (OBSs) has shown that most of the small-magnitude events are occurring at mantle depths, down to 50 km focal depths, again without a clear relationship with the known active tectonic features identified by geological and geophysical surveys (Geissler et al., 2010; Grevemeyer et al., 2016; Silva et al., 2017).
Despite the high detail of the tectonic map in the Gulf of Cádiz, SW Iberia, that resulted from the extensive investigation by geological and geophysical surveys (e.g. Duarte et al., 2013, Fig. 1c), the origin of the 1 November 1755 destructive earthquake and tsunami remains uncertain with several proposals made by different authors (see Ribeiro et al., 2006, for a revision). The other large earthquake originated in the region, the 28 February 1969 (Mw = 8.0) event, despite the well-constrained epicentre, focal depth and source mechanism (Fukao, 1973), could not be ascribed to any active fault identified in the area (Martínez-Loriente et al., 2013).
Probabilistic seismic hazard assessment studies have been used in the last decades in W and SW Iberia as a tool for emergency planning, for land use management and as an input to be considered in the elaboration of building codes (e.g. Vilanova and Fonseca, 2007; Campos Costa et al., 2008; Mezcua et al., 2011; IGN-UPM, 2013; Woessner et al., 2015). Some of these studies had a global scope, like the GSHAP (Giardini, 1999) or the 2013 European Seismic Hazard Model (ESHM13, Woessner et al., 2015, Fig. 2a); others were conducted to support the elaboration or revision of national building codes (Campos Costa et al., 2008; IGN-UPM, 2013, Fig. 2b). For land use management and emergency planning, more local and regional studies have been conducted (e.g. for Portugal, Carrilho et al., 2010; Matias and Teves-Costa, 2011a, b; for SE Spain, Rivas-Medina et al., 2018). All the above-mentioned PSHA studies use different earthquake generation models with a common feature, time independence. In active seismic zones, such as those associated with subduction, or in areas where there is almost complete knowledge of the active structures, it is possible to carry out PSHA studies in which the earthquake recurrence is a function of time. This is not true for the slowly deforming region of W and SW Iberia.

Figure 2Seismic hazard maps expressed as peak ground acceleration (PGA) expected to be exceeded in 50 years with 10 % probability. (a) From the ESHM13 model by Woessner et al. (2015), units scaled to gravity acceleration (g=9.8 m s−2). (b) From the PSHA study used in Portugal for the revision of the building codes according to EC8 guidelines (Campos Costa et al., 2008), units in centimetres per second squared (cm s−2). Type 1 refers to a “far” (offshore) source, while type 2 refers to a “near” source. These maps show the inconsistency of PSHA models, as two options for the chosen models.
Another consequence of the geodynamic setting of the study area is that the preferred earthquake source model is the zone source where earthquakes are assumed to occur with a uniform probability anywhere inside the area considered. This approach is justified for the onshore domain where the known fault slip rates are very low (see Sect. 2). On the offshore domain the plate boundary is complex without a clear relationship between current seismicity and the tectonic faults identified by geological and geophysical campaigns (e.g. Zitellini et al., 2009; Custódio et al., 2015; Neres et al., 2016), as detailed in Sect. 2. Recently, in smaller domains where the fault geometry and activity are considered to be well known, like in SE Spain, a mixed source model has been proposed (Rivas-Medina et al., 2018), where the earthquake potential is distributed between the faults and the zone. This is an exceptional case that cannot be extended to the whole W and SW Iberia.
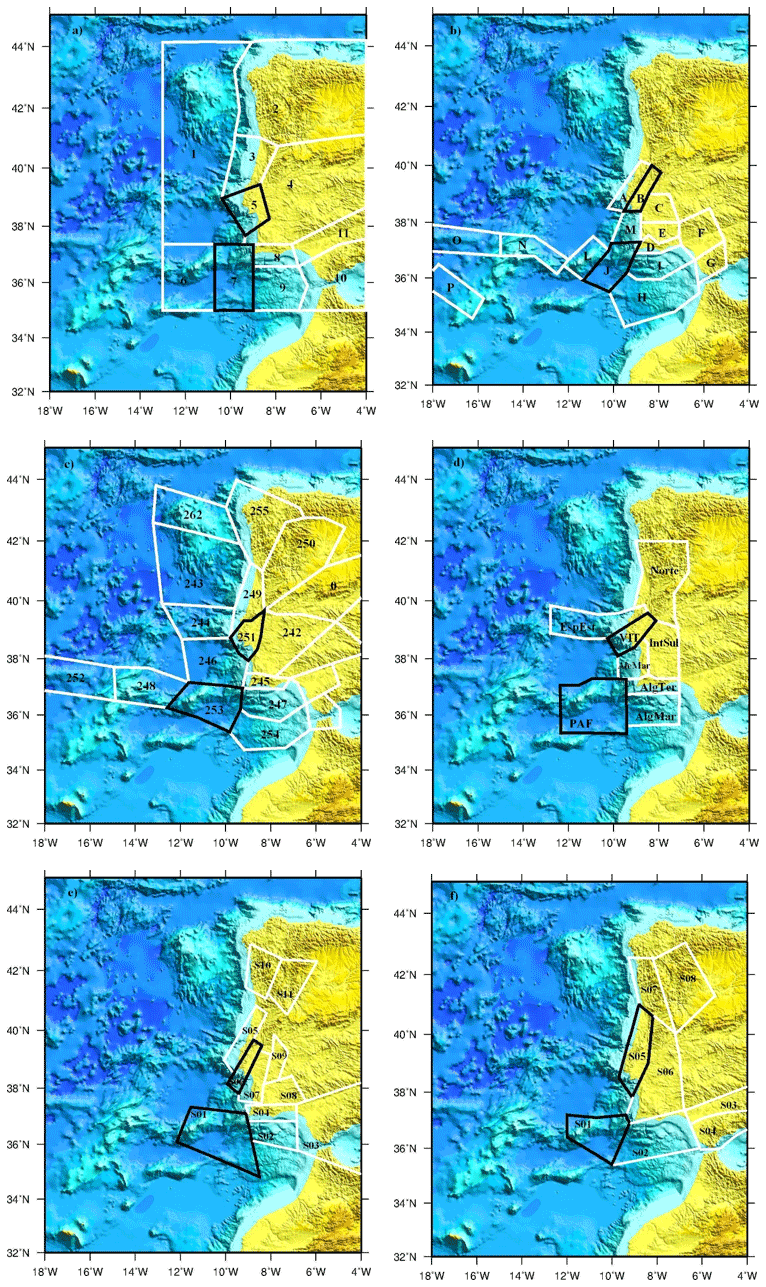
Figure 3Seismogenic zones proposed for the five PSHA studies analysed in this work. The zones corresponding to Lower Tagus Valley (LTV) sources and 1755 earthquake selected for sanity check are outlined in black. (a) The National Annexes of Eurocode 8 (EC8), adapted from Campos Costa et al. (2008). (b) The ERSTA study, adapted from Carrilho et al. (2010). (c) The SHARE study, adapted from Woessner et al. (2015). (d) The QREN study, adapted from Matias and Teves-Costa (2011a, b). (e, f) Adapted from the Vilanova and Fonseca (2007) study. Panel (e) is seismic zonation SA and panel (f) is seismic zonation SB.
The choice of the source generation zones for PSHA is made using geological criteria, distribution of active faults, nature and thickness of the crust, and geophysical criteria, such as earthquake epicentre distribution, location and macroseismic fields of historical earthquakes. However, there is no common agreement on the geological and geophysical information to be used, nor on the weight that is applied to each criterion, resulting in a wide diversity of source zones for W and SW Iberia (Fig. 3).
On each source zone, the earthquake recurrence is expressed by the double truncated Gutenberg–Richter law (DTGR)
where is the number of earthquakes with magnitude ≥ m per year, mmin is the minimum magnitude to be considered, λ is the number of earthquakes per year with magnitude ≥ mmin, a and b are the usual parameters for the Gutenberg–Richter law, . a can refer to or to m=0. In the first case we have . In the second case we have , with α=aln (10). mmax is the maximum magnitude considered for the source zone, and β is the asymptotic slope for the DTGR law. β=bln 10.
The definition of earthquake recurrence on each source zone requires the definition of the set of parameters (mmin, mmax, α, β) or (mmin, mmax, a, b). These parameters are estimated by criteria defined on each PSHA study and may vary considerably depending on the choice of the earthquake catalogues to use (instrumental and historical, declustered or not, and declustering methods), the methods used to obtain the (a, b) from an incomplete seismic catalogue (least squares, maximum likelihood, etc.) and the approach used to define the maximum magnitude to be considered.
Some of the PSHA studies mentioned above do not consider the uncertainty in the definition of the earthquake generation model (zoning and earthquake recurrence); others consider that different models can be accepted with some weights, with uncertainty assessed by the logic tree method (e.g. Vilanova and Fonseca, 2007; Woessner et al., 2015); and others also consider that the DTGR parameters have a statistical uncertainty that is assessed by Monte Carlo simulations (e.g. IGN-UPM, 2013; Gaspar-Escribano et al., 2015).
In this paper we will not discuss or compare the methodologies used in defining the earthquake generation models that have been published for W and SW Iberia. Instead, we will use the published parameters to make a sanity check by comparing the seismic moment release that results from them with the presumed tectonic deformation. For this investigation we consider five different PSHA studies: (i) the study used in Portugal for the revision of the building codes according to EC8 guidelines (Campos Costa et al., 2008; hereafter referred to as EC8), (ii) the regional study by Carrilho et al. (2010) used for emergency management in southern Portugal (hereafter referred to as ERSTA), (iii) the European scale ESHM13 model by Woessner et al. (2015) (hereafter referred to as SHARE), (iv) the local study by Matias and Teves-Costa (2011a, b) used for emergency management in Lisbon and Cascais (hereafter referred to as QREN), and (v) the Vilanova and Fonseca (2007) study used for the evaluation of seismic risk in mainland Portugal by Silva et al. (2015) (hereafter referred to as VF2007). We will concentrate our efforts only on two earthquake generation zones: the one that affects Lisbon, for the high risk implied and because it is the area where large differences in PSHA are evident (Fig. 2); and the offshore domain in the Gulf of Cádiz that is considered by different studies as the source area for the M ∼ 8.7 1 November 1755 earthquake.
3.1 The EC8 model
In 2006, for the preparation of the National Annex of Eurocode 8 (project regulation for the construction of structures for earthquake resistance), the seismic hazard was assessed considering 11 seismogenic zones for mainland Portugal (Fig. 3a), and the PSHA results for mainland Portugal, the Azores archipelago and the Madeira archipelago are presented in Campos Costa et al. (2008). For mainland Portugal the main criterion used for the definition of seismic source areas was the distribution of historical and instrumental seismicity, with seismotectonic considerations as secondary criteria.
The details of the seismogenic zoning can be found in Sousa (1996), but, in general, the outlined zones fall into two wide categories: interplate zones (zones 6, 7 and 9 of Fig. 3a), which originate earthquakes with an epicentre mainly located on the plate, and the intraplate zones, which originate earthquakes with an epicentre located predominantly inside the Eurasian plate (zones 1, 2, 3, 4, 5, 8, 10 and 11 of Fig. 3a). The parameters that characterize these zones were obtained after studying the completeness of the catalogue (where the minimum magnitude is defined), considering earthquakes with a magnitude equal to or greater than 3.5.
3.2 The ERSTA model
For the project ERSTA, Estudo do Risco sísmico e de Tsunamis do Algarve, financed by the Portuguese Civil Protection Authority (ANEPC), a concerted work was carried out by several national entities that, after reviewing the seismic, tectonic and geological information of the Algarve region, allowed the redesign of the seismogenic zones (15 zones in total) that potentially affect the region (Carrilho et al., 2010). These zones are shown in Fig. 3b. With the idea of considering seismic hazard for the entire continental territory and in the scope of other local studies (Jeremias et al., 2012), four more seismogenic zones were defined, modelled by large areas due to the difficulty in connecting the epicentres to the mapped faults in the neotectonic map.
A completeness study was carried out (Rodrigues et al., 2009) for the new seismic catalogue, reviewed by the IPMA (Instituto Português do Mar e da Atmosfera), and the parameters that characterize these areas were determined (Rodrigues et al., 2009; Jeremias et al., 2012). In this model of seismic sources, area B (Fig. 3b) is part of the Cenozoic basin of the Lower Tagus Valley, and zone J comprises the Horseshoe Fault, the Marquês de Pombal Fault and the São Vicente Fault. In area J some of the most important earthquakes were generated, such as the one on 28 February 1969 and, most likely, the one on 1 November 1755.
3.3 The SHARE models
In 2013, the European Seismic Hazard Model (ESHM13) resulted from a probabilistic hazard assessment supported by the EU-FP7 project SHARE (2009–2013). The ESHM13 is a consistent seismic hazard model for Europe and Turkey that overcomes the limitation of national borders and includes a complete quantification of uncertainties. It is the first complete contribution to the initiative called the Global Earthquake Model. And it can serve as a reference model for various applications, from preparing for an earthquake to strategies to mitigate seismic risk (Woessner et al., 2015) and, according to Carvalho and Malfeito (2016), to serve as the basis of the review of the National Annexes of Eurocode 8. Figure 3c shows the source areas defined for W and SW Iberia by the SHARE project.
The earthquake recurrence laws used by SHARE, namely the a and b parameters of the Gutenberg–Richter law and the maximum magnitude for each zone, were proposed with an integrated and homogenization perspective of the model across Europe. In this project, the epistemic uncertainties of the model components and the hazard results were accounted using a logic tree (Woessner et al., 2015). On each zone three values for the maximum magnitudes were considered – minimum, mean and maximum – that we incorporate in our sanity check evaluation as SHAREmin, SHAREmed and SHAREmax, respectively.
3.4 QREN model
The seismic zonation referred to in this model was established in the study carried out for the Assessment of Natural and Technological Risks in the city of Lisbon, named QREN (Quadro de Referência Estratégico Nacional). In that work (Matias and Teves-Costa, 2011a, b), the determination of the earthquake recurrence parameters was obtained considering the working earthquake catalogue declustered and decomposed into one historical catalogue and three instrumental catalogues, selected according to the completeness magnitude estimated. The definition of the source areas took into consideration both the seismic activity and the distribution of the main active tectonic structures identified in the mainland territory of Portugal (Teves-Costa et al., 2001). Thus, it was proposed to distinguish eight seismogenic zones (Matias and Teves-Costa, 2011a, b) shown in Fig. 3d.
In this model, the earthquake recurrence model was obtained using the HA2 application developed in MATLAB by Andrezej Kijko (Kijko and Sellevoll, 1992; Kijko, 2004). The HA2 application combines information from several catalogues, using a Bayesian model, applying a Poisson–gamma distribution for the occurrence of earthquakes in time and an exponential-gamma distribution for the magnitude distribution. The determination of mmax magnitude is obtained by an iterative process, with the parameters λ and β obtained by maximum likelihood. The HA2 algorithm results in a probability distribution that does not follow exactly the DTGR, and thus to make it comparable with the others, a fit to DTGR had to be made.
3.5 The Vilanova and Fonseca (2007) models
Vilanova and Fonseca (2007) presented two proposals for dividing the territory into seismogenic zones: SA and SB (Fig. 3e and f). SA encompasses 11 seismogenic zones chosen based on seismicity criteria: in regions with moderate to large local historical earthquakes, the boundaries of the seismogenic areas follow the VII (MMI scale) isoseismal considering that the area delimited by this relatively higher damage distribution includes most probably its geological source. In all other regions the source zones encompass areas of diffuse seismicity. The SB proposal consists of eight seismogenic zones adapted from Peláez and López Casado (2002).
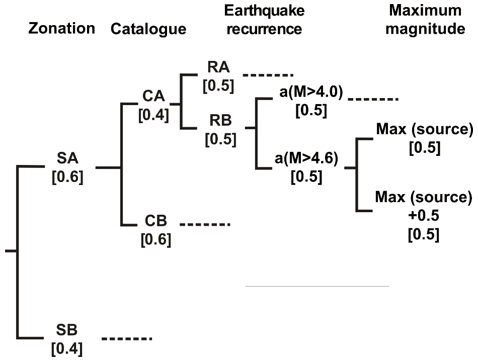
Figure 4Logic tree used for hazard calculation. The weight of each branch is shown in square brackets (modified from Vilanova and Fonseca, 2007).
Vilanova and Fonseca (2007) used a logic tree scheme to deal with epistemic uncertainties on ground motion prediction equations, source areas, the catalogue used, the type or earthquake recurrence, and the maximum magnitude. For the sanity check we deal only with the parameters that influence the earthquake recurrence, which are the ones presented in Fig. 4. Considering all possible branches, we will test 32 zoning and earthquake recurrence combinations. Each branch will be identified by its components, SA or SB, RA or RB, a1 (M > 4.0) or a2 (M > 4.6), and max0 or max+. When referred to collectively, these models will be identified as VF2007.
Table 1Earthquake recurrence parameters (a, b, mmax) for the Lower Tagus Valley (LTV) source zone from four of the models investigated. a and b are constants, and mmax represents the maximum magnitude.

∗ Best fit to DTGR law.
Table 2Earthquake recurrence parameters (a, b, mmax) for the Lower Tagus Valley (LTV) source zone for the 16 combinations (column “Sub-models”) in the logic tree proposed by Vilanova and Fonseca (2007). Each combination has, in addition, two possible maximum magnitudes, resulting in 32 possible recurrence models. Note that a and b are constants and mmax represents the maximum magnitude.
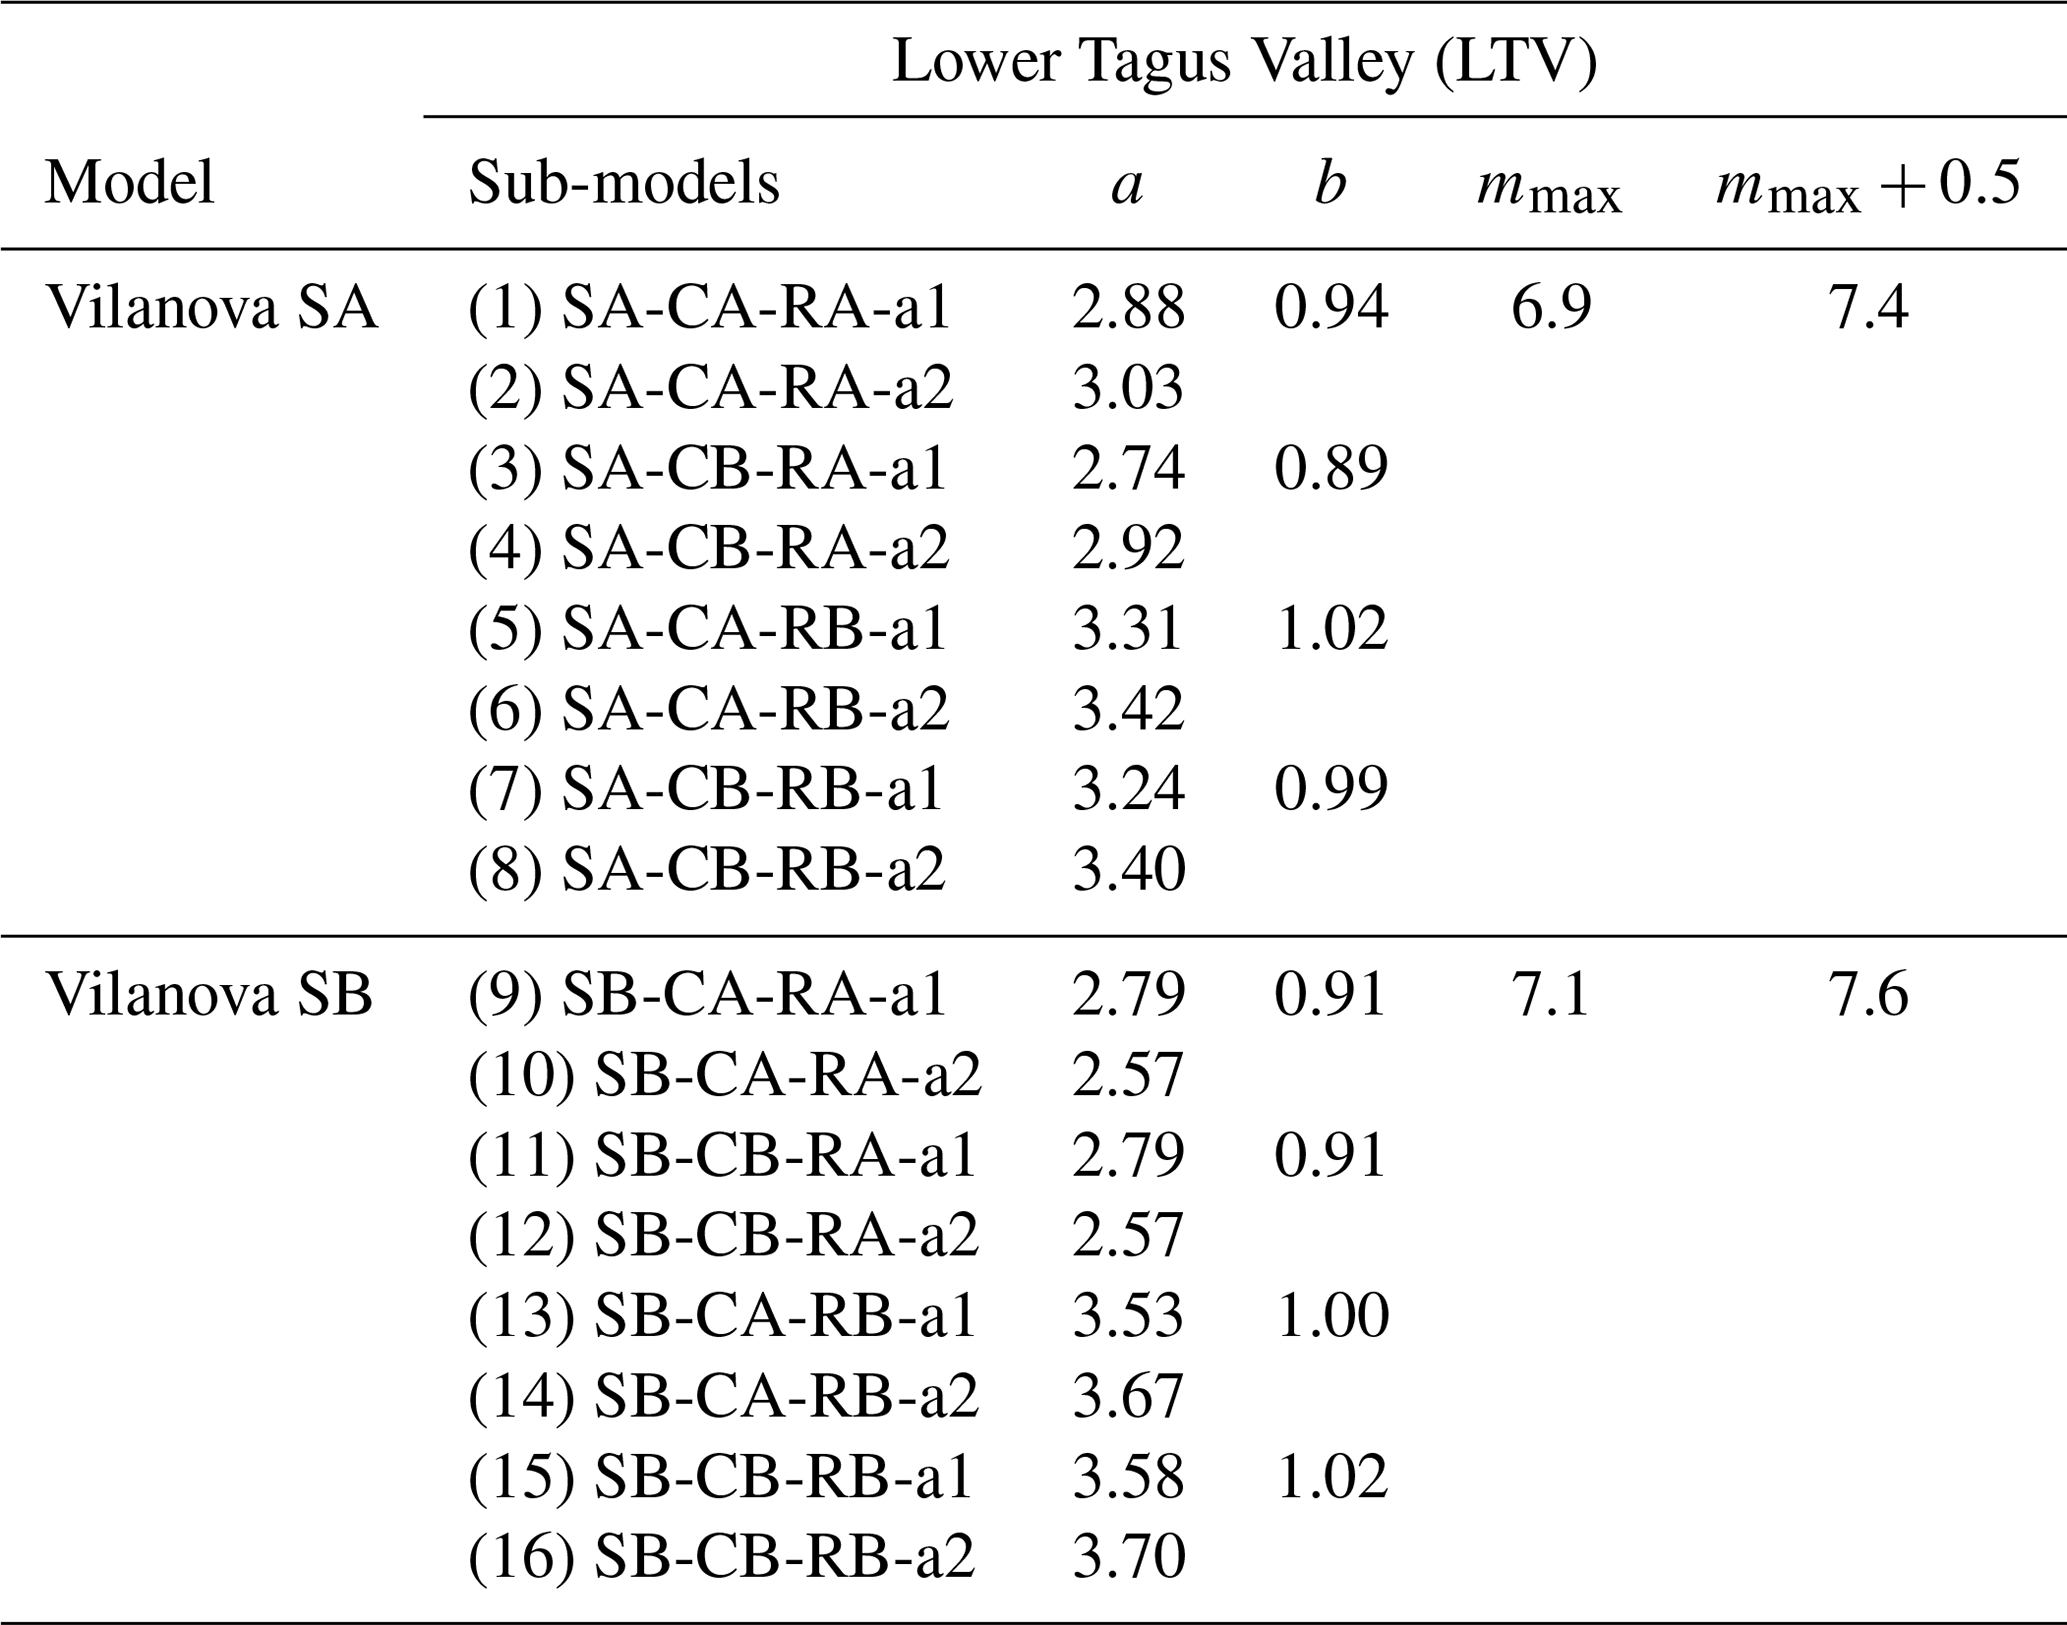
SA/SB – relative to the zonation used; CA/CB – relative to the catalogue used; RA/RB – recurrence model used; the a1 values were calculated for m≥4.0 and the a2 for m≥4.6; considering two values of maximum magnitude.
Table 3Earthquake recurrence parameters (a, b, mmax) for the 1755 source zone from four of the models investigated. Note that a and b are constants and mmax represents the maximum magnitude.
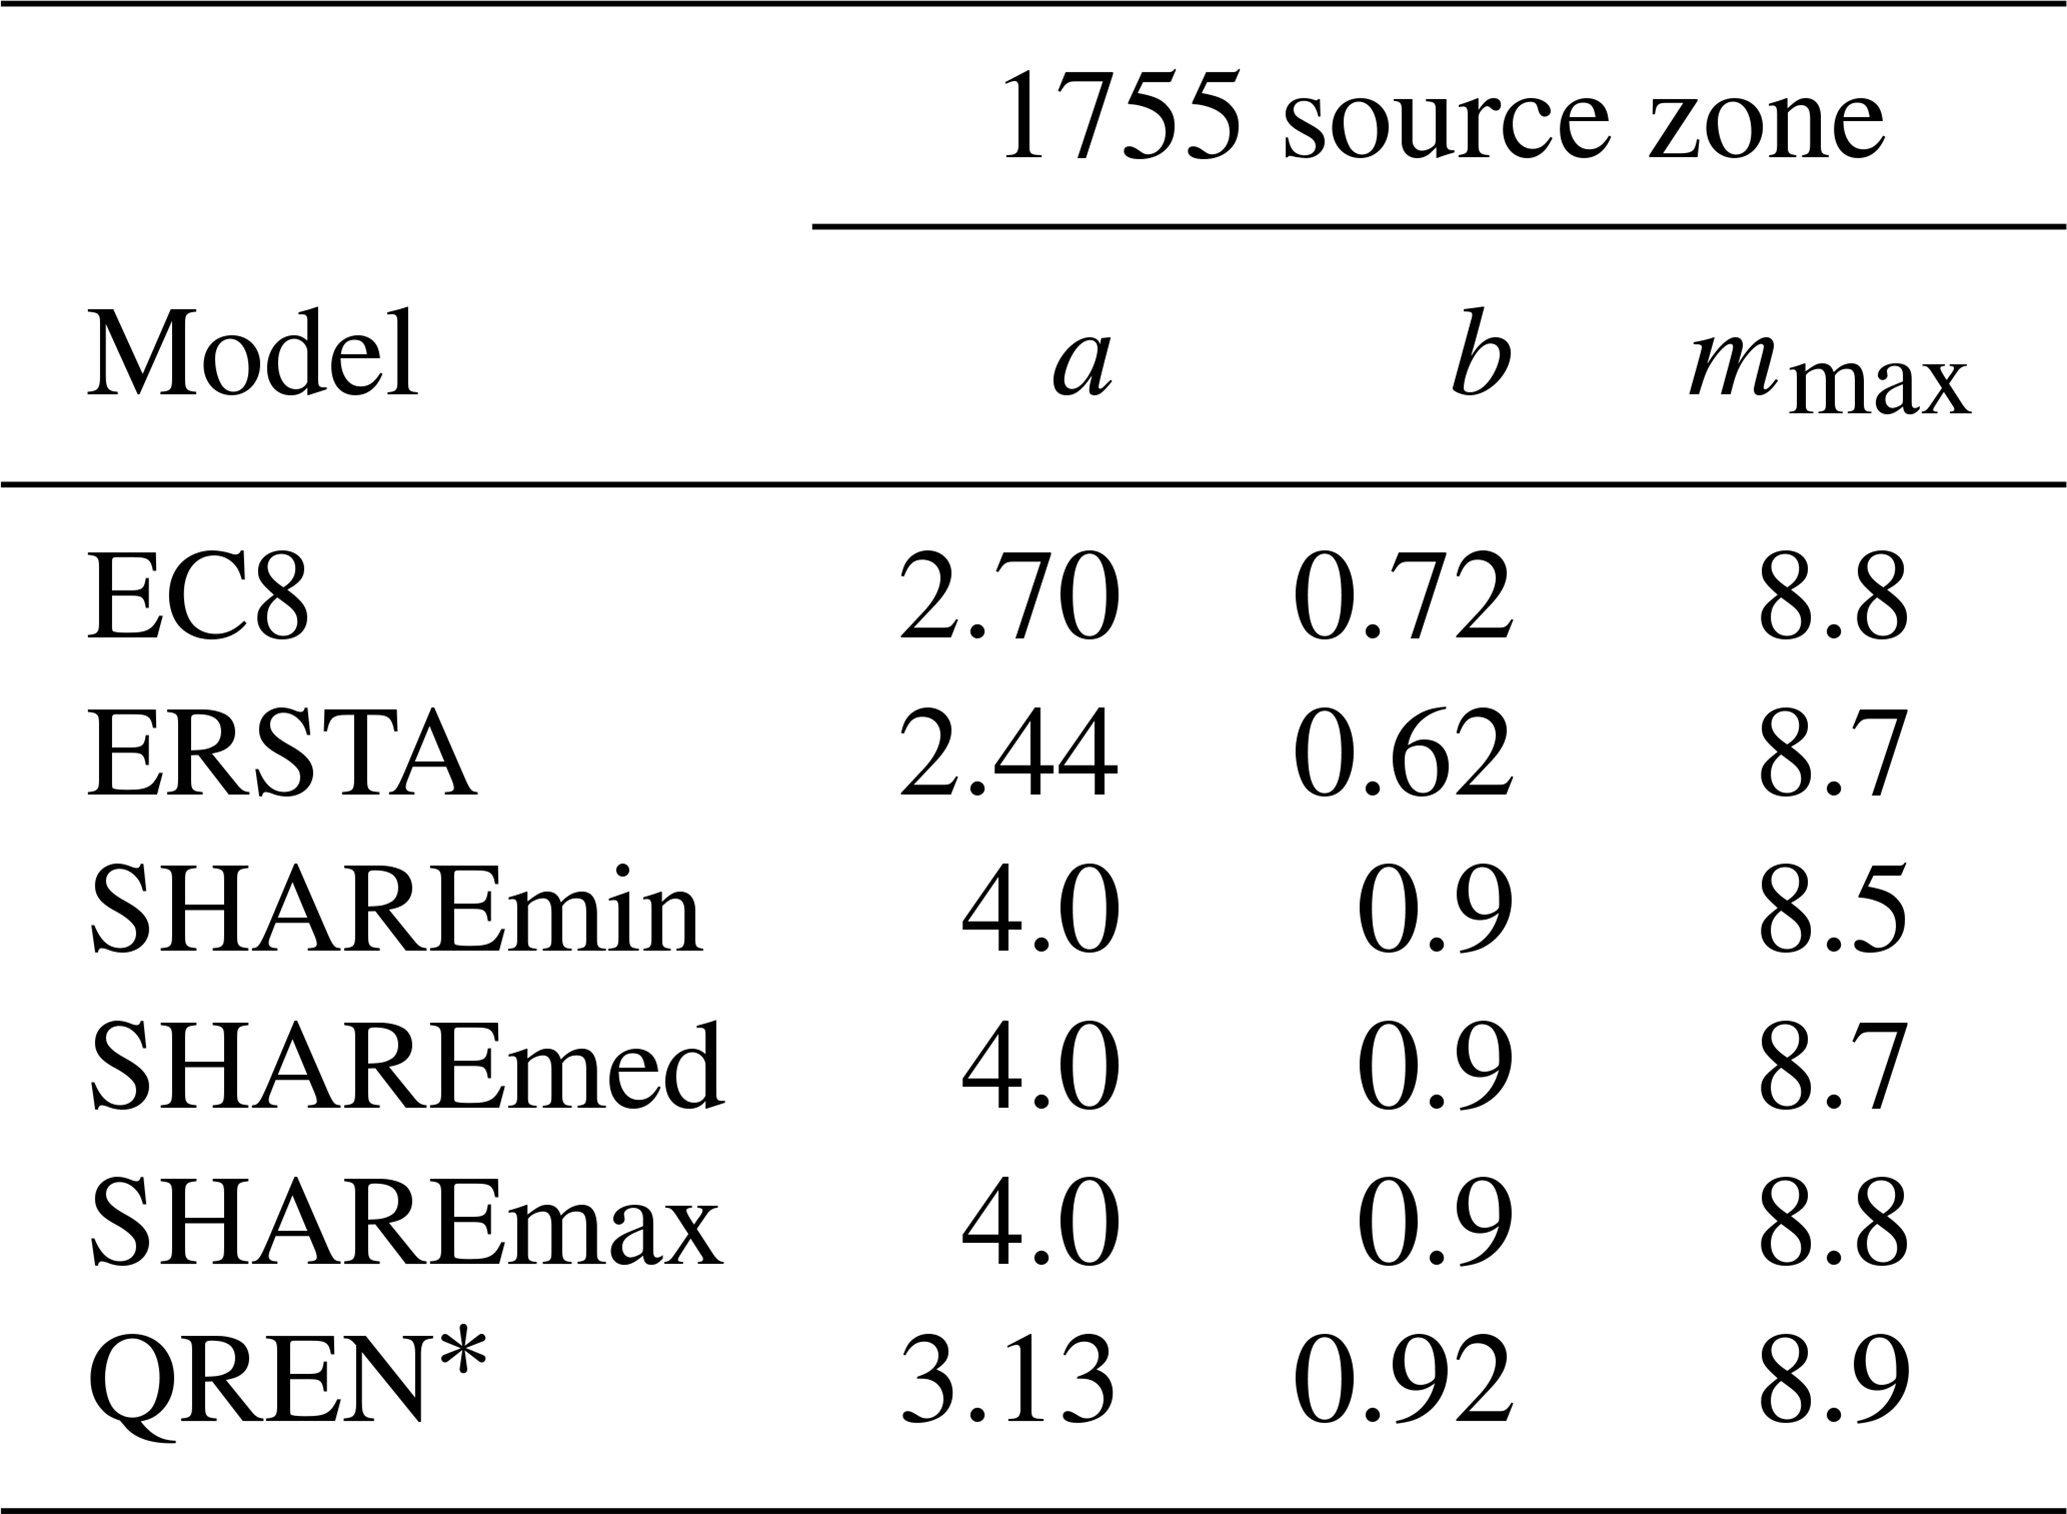
∗ Best fit to DTGR law.
Table 4Earthquake recurrence parameters (a, b, mmax) for the 1755 source zone for the 16 combinations (column “Sub-models”) in the logic tree proposed by Vilanova and Fonseca (2007). Each combination has, in addition, two possible maximum magnitudes, resulting in 32 possible recurrence models. Note that a and b are constants and mmax represents the maximum magnitude.
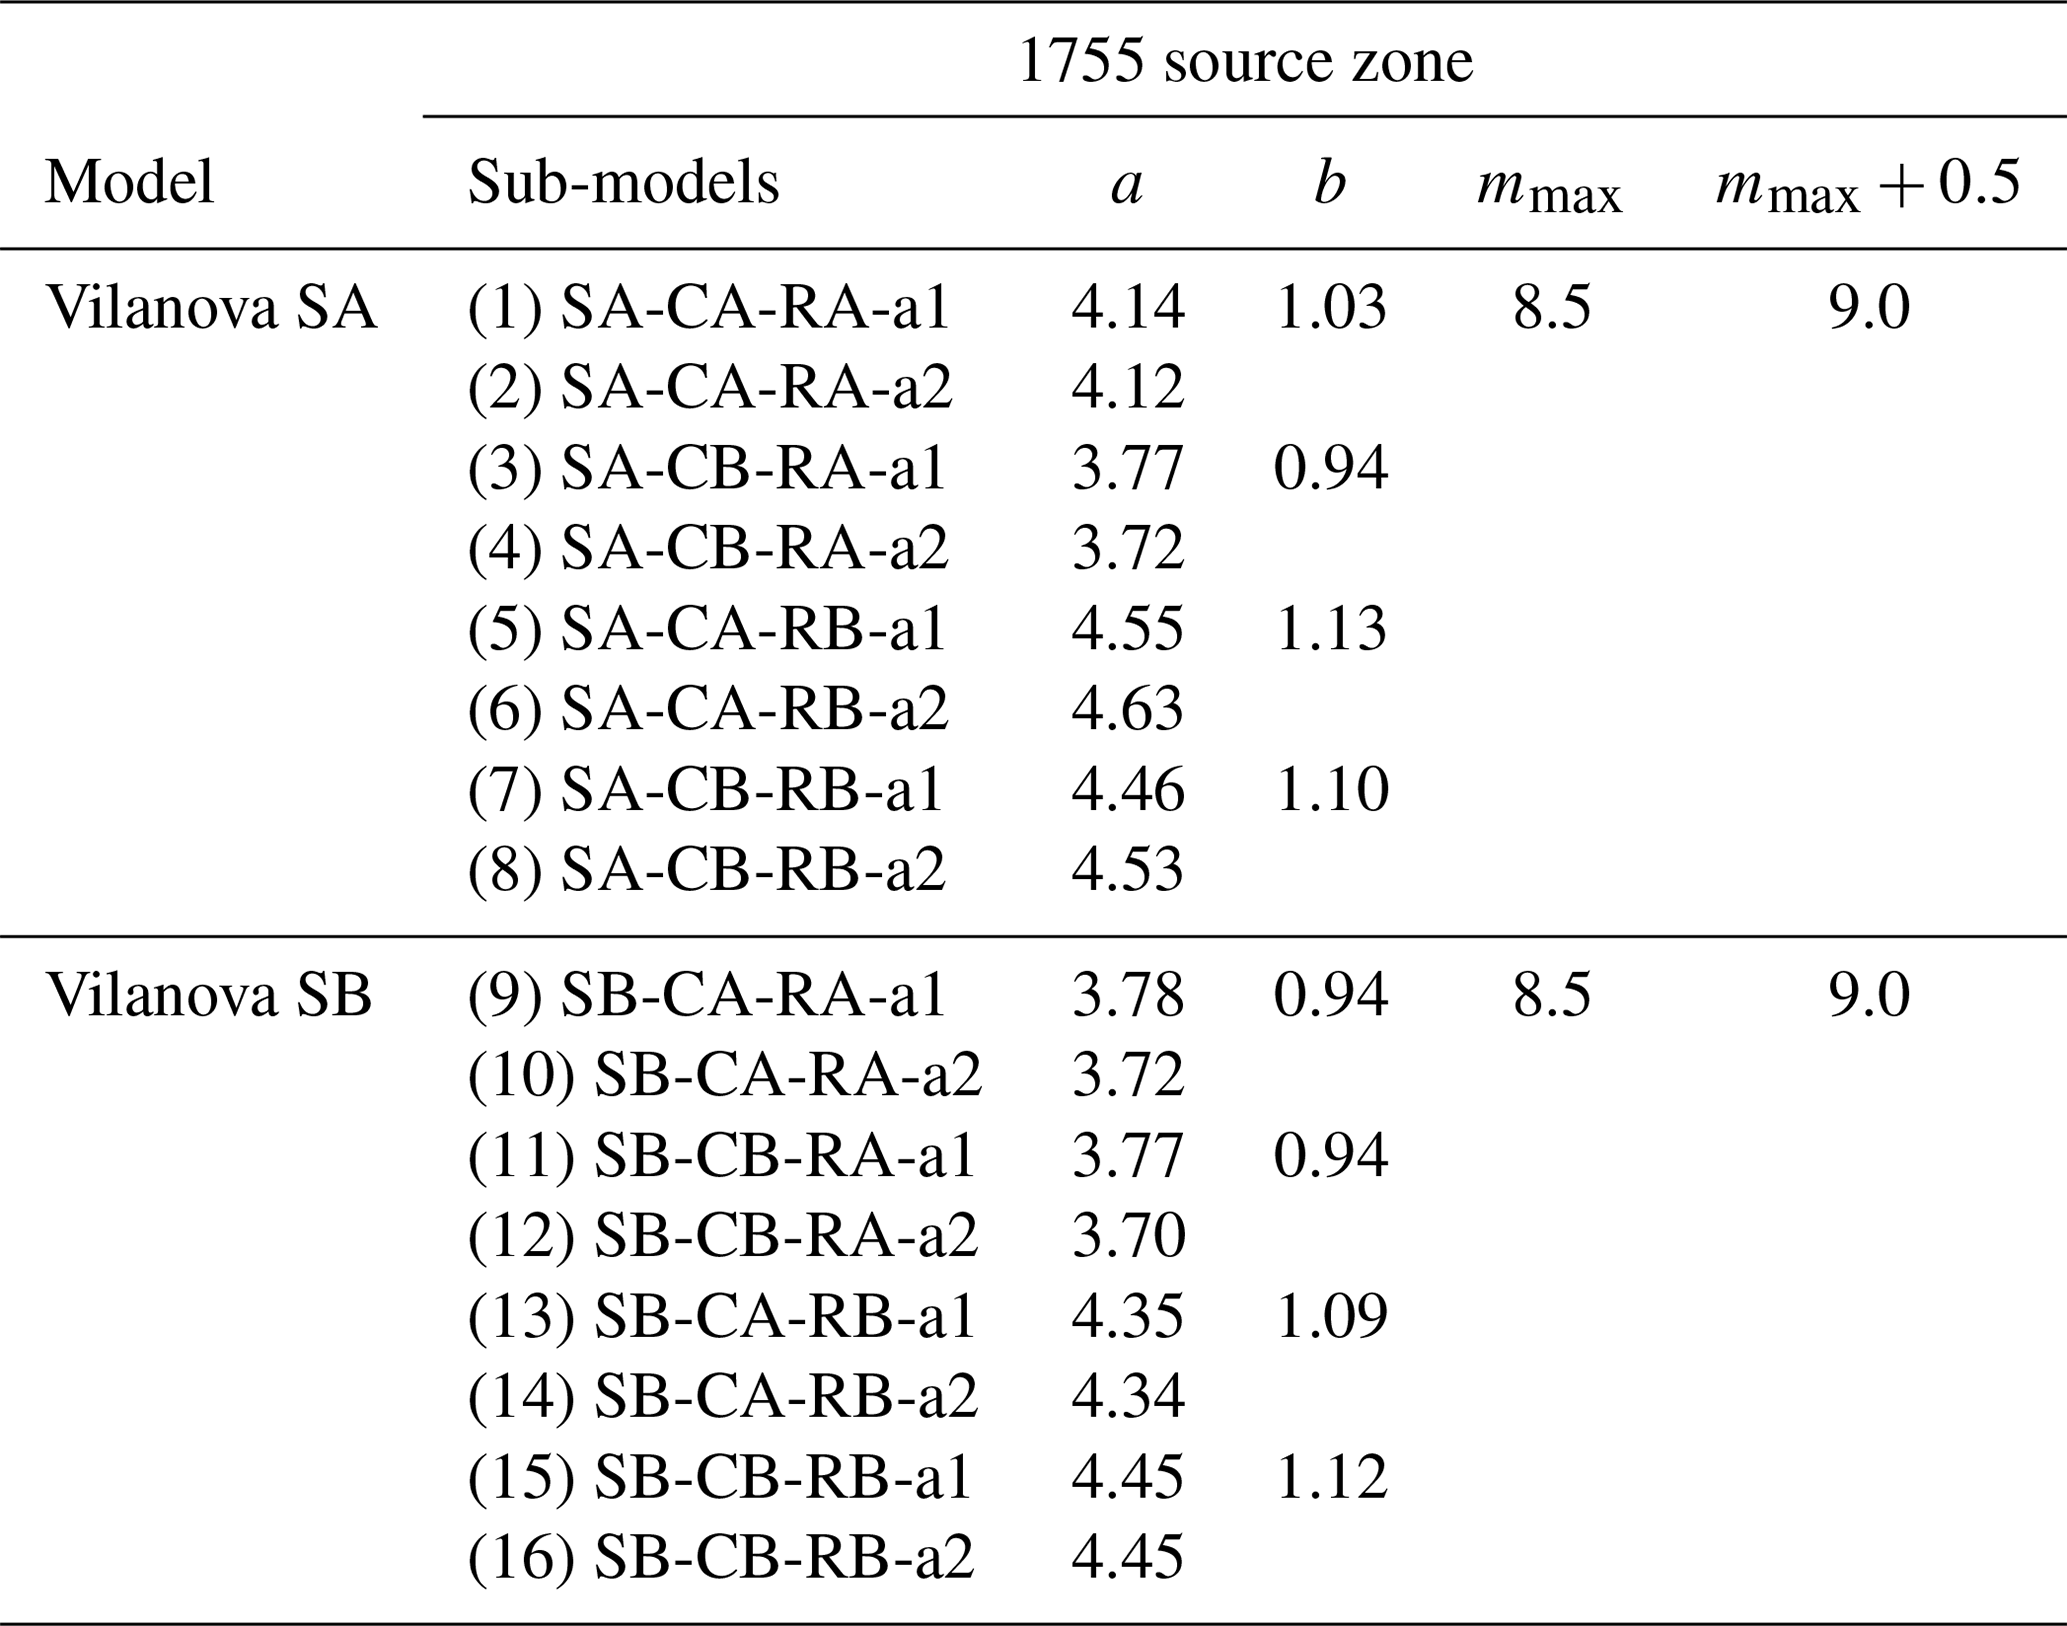
SA/SB – relative to the zonation used; CA/CB – relative to the catalogue used; RA/RB – recurrence model used; the a1 values were calculated for m ≥ 4.0 and the a2 for m ≥ 4.6; considering two values of maximum magnitude.
3.6 Synthesis of earthquake recurrence models to be tested
For the five analysed PSHA studies we selected from each one the source zones that correspond to the LTV and 1755 areas to be investigated (outlined in black in Fig. 3). The respective recurrence model parameters are summarized in Tables 1–4.
There are two main ways of modelling lithospheric deformation: the kinematic approach and the dynamic approach. In kinematic modelling long-term horizontal velocity field is constrained by simultaneously inverting all available geophysical information, such as GPS-derived velocities and stress data records. Models of this type rarely explain the fundamental tectonic mechanisms and leave no independent data sets available for postprocessing testing. Because kinematic modelling emphasizes the role of geodetic data, it is often the preferred method for modelling on-land deformation (Bird, 2009; Carafa et al., 2020). However, it does not allow consistent estimation of the offshore long-term deformation, where the subjective choice of the active faults to insert into the model strongly determines the localization of deformation, with negligible influence left to other geophysical data. On the other hand, in the dynamic modelling approach the stress equilibrium equation is solved using estimated rock rheologies, layer thicknesses and boundary conditions; i.e. the velocity field is calculated from the known structure and physics of the Earth. In this case, several data sets – e.g. geodetic velocities, fault slip rates, seismic activity and stress directions – can be used to assess the accuracy of the model predictions (Neres et al., 2016).
In this work, we propose two tests on the earthquake recurrence models used to make PSHA studies, one simple, rule-of-thumb type and the other based on numerical modelling. Both relate the seismic moment release predicted by the models and the knowledge of lithospheric deformation inferred from dynamic modelling and geological and geodetic observations.
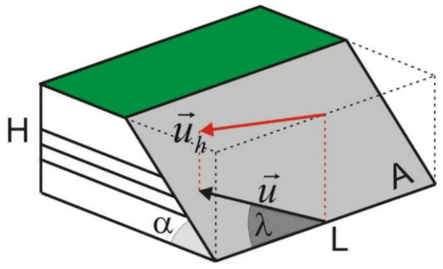
Figure 5Simple earthquake generation model used to calculate the seismic strain rate. A is the area of the fault, L is the length of the fault, H is the thickness of the seismogenic layer and α is the dip of fault (Matias and Teves-Costa, 2011a, b).
4.1 Simple consistency test
For the application of the simple consistency test, the double truncated Gutenberg–Richter law is used, and the seismic strain is converted into a relative velocity between blocks, in millimetres per year (mm yr−1), as in Bird and Kagan (2004) and Mazzotti et al. (2008). The obtained values should be compared with the convergence rate between the Nubia and Eurasia plates, with a relative velocity of ∼ 4 mm yr−1 (Fernandes et al., 2003). For this purpose, a simplified seismic generation model is used, with seismic strain concentrated on a single fault, representative of the zone under study, as shown in Fig. 5.
Considering that all earthquakes occur on a single fault plane with the same mechanism, then the relative velocity between blocks is given by
Here Mi is the seismic moment of a single earthquake, T is the period considered and μ is the mean shear modulus for the seismogenic layer.
Equation (S4) in the Supplement is valid for a perfect seismic coupling, the fraction of frictional sliding that occurs as earthquakes. If the seismic coupling, c, is not perfect (c<1), then the slip rate between the blocks should be corrected by this factor:
The values obtained by the Eq. (4) (for c=1) must, therefore, be considered to be the lower limits of the tectonic deformation inferred by the earthquake generation models. In Bird and Kagan (2004) the seismic coupling is very variable for the different plate boundaries investigated; it varies from 0.05 in oceanic rifts in strike-slip faults to 1.0 in continental convergence regions.
To apply the simplified consistency test to the earthquake generation models presented earlier, it is necessary to assign for each generation zone the following parameters: μ, L and H. While L is taken from the geometry of each source zone, the values of μ, the mean shear modulus for the seismogenic layer and the thickness of the seismogenic layer (H) must be inferred from our best knowledge on the source areas. For the LTV we consider that it comprises typical continental crust, and we used μ = 4.0 × 10¹⁰ Pa (e.g. Sørensen et al., 2012). For the 1755 earthquake source zone, we used a typical value for oceanic lithosphere (e.g. Johnston, 1996 and Matias et al., 2013), μ = 6.5 × 10¹⁰ Pa.
Table 5Source zone parameters for the simplified sanity check. L stands for the source zone geometry; H and μ are the thickness and the mean shear modulus for the seismogenic layer, respectively. α is the dip of the fault.

For the value of the brittle thickness of the lithosphere, H, we assume that it is 20 km in the LTV where it includes only the upper and middle continental crust. For the 1755 zone we used H = 60 km from Matias et al. (2013). A summary of the parameters used in the application of the simple consistency test is presented in Table 5. The cumulative seismic moment to be used in Eq. (4) is computed from the seismic hazard model investigated.
To have a perception of the sensitivity of the results to the simple model parameters proposed, which are inversely related, observing Eq. (4), we see that an increase in the length of the zone (L) or the thickness of the layer (H) would imply a proportional decrease in the seismic tectonic velocity (), and a decrease in these parameters would imply a corresponding increase. The values chosen for each PSHA model, together with c=1, are conservative, and so the results obtained should be considered to be the lower limits for the tectonic deformation inferred by the earthquake recurrence models.
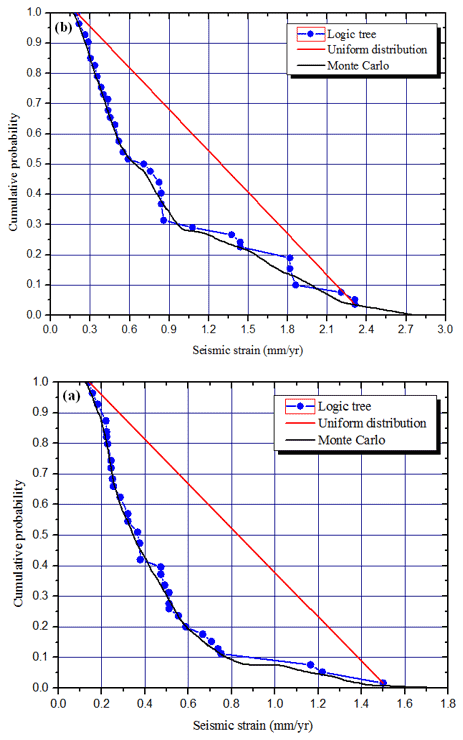
Figure 6Monte Carlo method applied to Vilanova and Fonseca (2007) logic tree models, compared with a uniform probability distribution. (a) The LTV source zone. (b) The 1755 source zone.
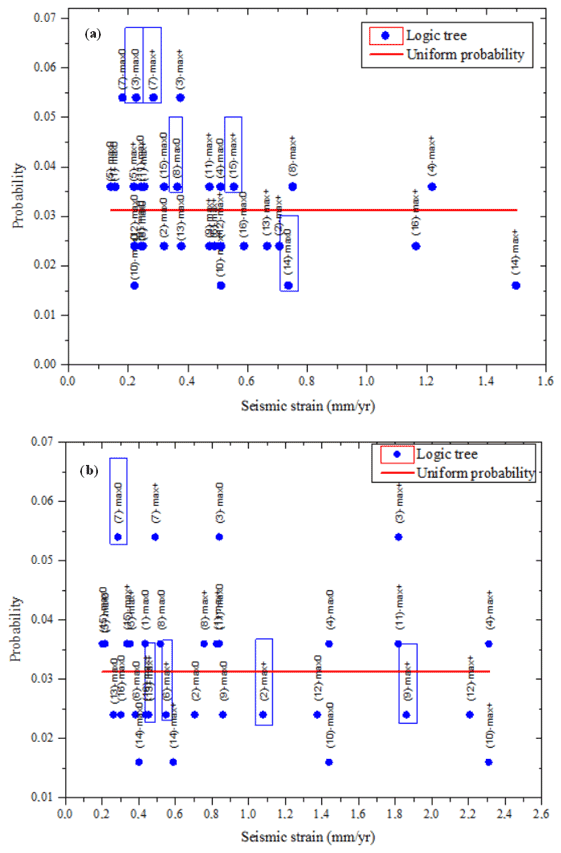
Figure 7Seismic strain and probability for each of the 32 models that result from the logic tree proposal of Vilanova and Fonseca (2007). The scenarios outlined are the ones chosen to be tested with neotectonics modelling. (a) The LTV source zone. (b) The 1755 source zone.
4.2 Uncertainties: logic tree and Monte Carlo simulation
Among the five PSHA models investigated, the Vilanova and Fonseca (2007) model is the only one that addresses epistemic uncertainties on the source definition and earthquake recurrence laws using a logic tree (Fig. 4). This results in 32 possible earthquake generation scenarios, each with a fixed probability given by the sequence of branches in the logic tree. We will expand the resulting discrete probability distribution into a continuous probability distribution through a Monte Carlo simulation (Fig. 6), considering a probability distribution for parameters a and b of the Gutenberg–Richter law. The Monte Carlo simulation is implemented to address aleatory uncertainties, to evaluate the variability of the composed set of parameters for which the different characteristics of each scenario are selected stochastically according to its uncertainty distribution (Gaspar-Escribano et al., 2015). This simulation will allow us to illustrate how the simplified, and complex, sanity checks can be applied to models where the uncertainty in the DTGR laws is provided. Furthermore, it will help us to choose from the 32 possible scenarios those that are representative of five classes to be defined by 20 % probability intervals on the continuous probability distribution of seismic velocity (Fig. 7). These five scenarios will be also investigated by the complex sanity test described below.
4.3 Complex sanity test: seismicity rates with “long-term seismicity”
In slowly deforming areas where significant seismic hazard is generated offshore, neotectonic modelling is a very useful tool to infer the long-term deformation rates of the brittle lithosphere. That work was performed for the Africa–Eurasia plate boundary extending from the Gloria Fault to the northern Algerian margin by Neres et al. (2016). These authors improved the broader Mediterranean model (Carafa et al., 2015), compiling an up-to-date simplified tectonic map of the Africa–Iberia plate boundary, and used the code SHELLS (Bird, 1999; Bird et al., 2008), which solves the stress equilibrium equation for a finite element grid, based on vertically integrated and laterally varying lithospheric data, estimated rock strengths and densities, and lateral, basal, and/or internal boundary conditions. SHELLS determines the long-term averages of tectonic strain and motion over many earthquake cycles and outputs results such as horizontal surface velocities, slip rates on faults, strain rates in the continuum elements and stress orientation. The finite element grid used for the study of Neres et al. (2016) comprised almost equilateral spherical triangles with about 27 km of side length. More details on the modelling can be found in Neres et al. (2016).
In the present work, the inferred lithospheric deformation, diffuse and concentrated along fault planes, is converted to earthquake generation rates by a modified version of the code “long-term seismicity” (Bird and Liu, 2007; Bird et al., 2010) (see Supplement).
In its original form the long-term seismicity algorithm applies the two hypotheses of the SHIFT model (Seismic Hazard Inferred From Tectonics) proposed by Bird and Liu (2007) and Bird et al. (2010): (a) the calculation of the long-term seismic moment rate in a deformed volume uses the coupled seismogenic thickness defined by the plate boundary closest to the zone; (b) calculating the earthquake frequency, as well as their magnitude distribution, follows the recurrence law of the closest and most comparable type of plate boundary. For this purpose, the code uses the plate boundary classification proposed by Bird and Kagan (2004) that considered seven different types of plate boundary: CRB, continental rift boundary; CTF, continental transform fault; CCB, continental convergent boundary; OSR, oceanic spreading ridge; OTF, oceanic transform fault; OCB, oceanic convergent boundary; and SUB, subduction zone. Using the global CMT catalogue, Bird and Kagan in 2004 estimated the seismicity parameters for each plate boundary type. Instead of using the DTGR recurrence law described above, these authors used the “tapered Gutenberg–Richter” law (TGR), which is expressed in terms of seismic moment and not magnitude:
is the earthquake rate of events with magnitude greater than or equal to the magnitude of interest, mT, with seismic moment MT. Mc is the seismic moment corresponding to the corner magnitude, mc, which is a magnitude close but not equal to the maximum magnitude of the DTGR law. The βtGR is the asymptotic spectral slope in the low magnitudes of the tapered Gutenberg–Richter law and should not be confused with the β of the DTGR; the relation between the two is given by
MComp is the seismic moment corresponding to the magnitude of completeness, mComp, equivalent to the minimum magnitude defined earlier for the DTGR. is the earthquake rate for events with magnitude greater than or equal to the magnitude of completeness.
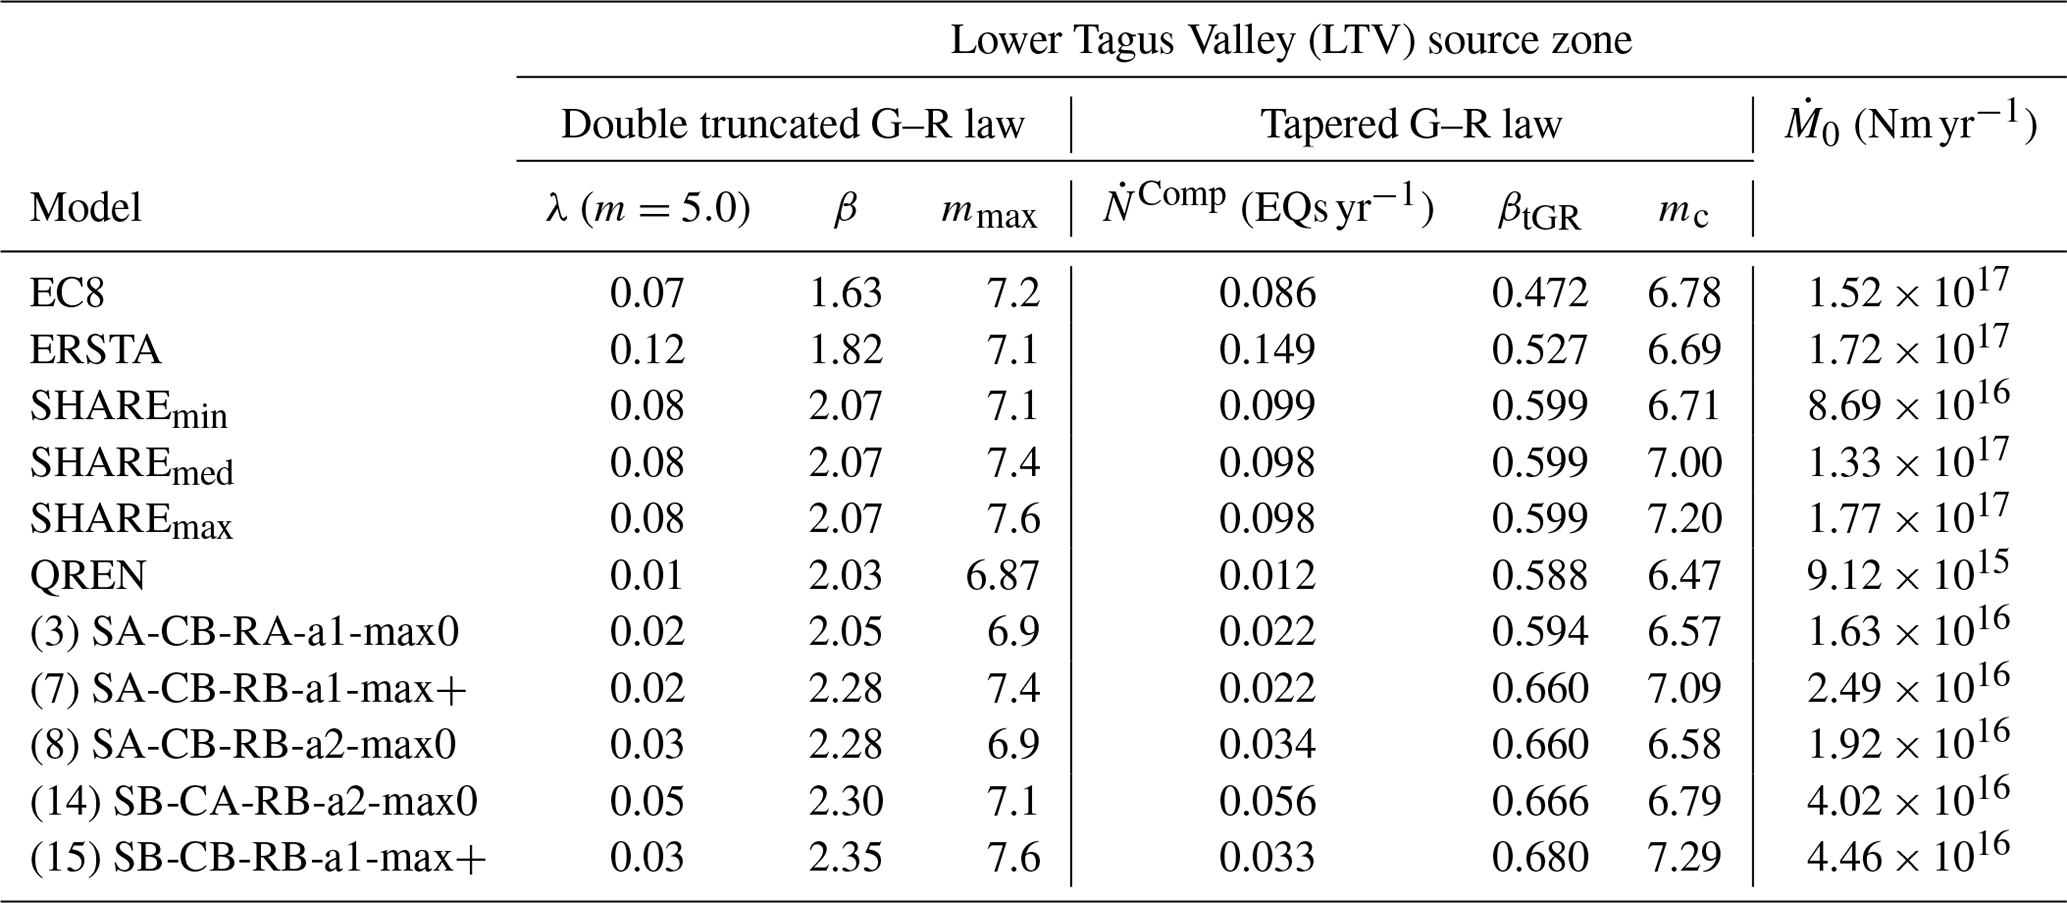
Table 6Earthquake recurrence parameters for the Lower Tagus Valley source zones expressed as DTGR (λ, β, mmax) and TGR ( in number of earthquakes per year (EQs yr−1), βtGR, mc) laws, for the minimum magnitude of 5.0. is the seismic moment rate.
Once the long-term seismic moment rate () of a grid cell is determined, its expected long-term shallow seismicity rate is obtained in two steps. First the long-term moment rate is divided by the model moment rate (integral of best-fitting tapered Gutenberg–Richter distribution, ) of the appropriate Bird and Kagan (2004) CMT subcatalogue, and then it is multiplied by the number of events in that subcatalogue, , to determine the rate of earthquakes at the grid cell that will exceed the threshold magnitude of that subcatalogue:
Then the forecasted earthquake rate adjusted to any desired threshold magnitude (mT) using the TGR law is given by
The main parameters required to use the long-term seismicity code to estimate seismic moment release for a particular zone are the coupled thickness of seismogenic lithosphere, 〈cz〉; the shear modulus, μ; the corner magnitude, mc; the asymptotic spectral slope, βtGR, of the TGR law; the number of shallow earthquakes in the catalogue, NComp; and the threshold magnitude, mT, used in counting those events.
Table 7Earthquake recurrence parameters for the 1755 source zones expressed as DTGR (λ, β, mmax) and TGR (, βtGR, mc) laws, for the minimum magnitude of 5.0. is the seismic moment rate.
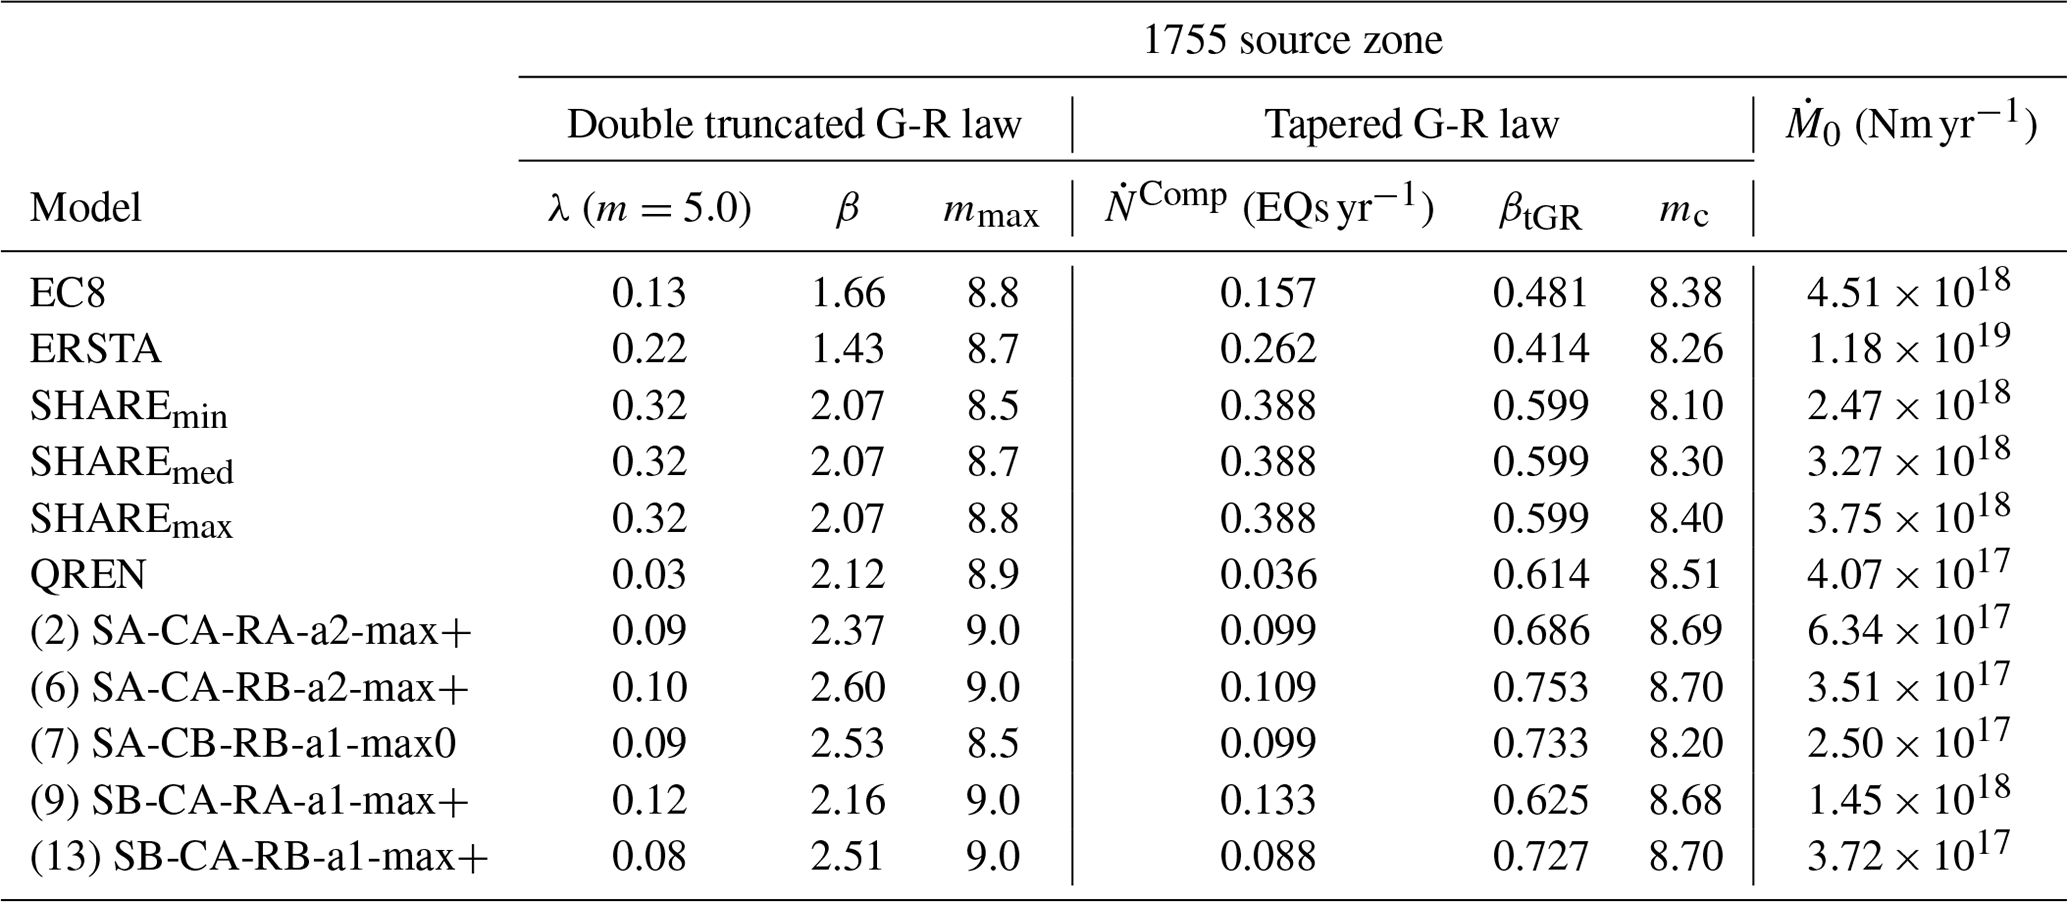
To establish a sanity check on the earthquake source models used for PSHA in W and SW Iberia, a complex tectonic domain with slow deformation, several modifications had to be done to the main algorithm of long-term seismicity. Firstly, we introduced the parametrization of zones, instead of plate boundaries. Each finite element cell was identified as belonging to one source zone. Secondly, instead of using the default plate boundary parameters defined by Bird and Kagan (2004) we introduced the recurrence parameters of the PSHA models to be investigated. These parameters are given for the source zones, LTV and 1755, respectively, in Tables 6 and 7.
However, some preliminary work had to be done to translate the published DTGR law parameters into the TGR law parameters that are used by long-term seismicity. This task was performed by a non-linear fit, adjusting the corner magnitude and the completeness earthquake rate , and fixing the asymptotic spectral slope βtGR to its theoretical value given by Eq. (6). The quality of the fit was assessed by comparing the total seismic moment release computed for both models, DTGR and fitted TGR. The details of this computation are shown in the Supplement (Sect. S3).
To facilitate the interpretation of results, all recurrence parameters are scaled to an observation period of 100 years. As regards the coupled thickness, we consider that seismic coupling was perfect and used 20 and 60 km as seismogenic thickness for LTV and 1755 zones, respectively. The output tectonic seismicity rates are finally compared to observations to check the consistency of the proposed source zones and earthquake recurrence models.
Table 8Simple test: seismic deformation rates () in millimetres per year (mm yr−1) for the LTV and 1755 source zones considering four earthquake recurrence models. is the long-term seismic moment rate.
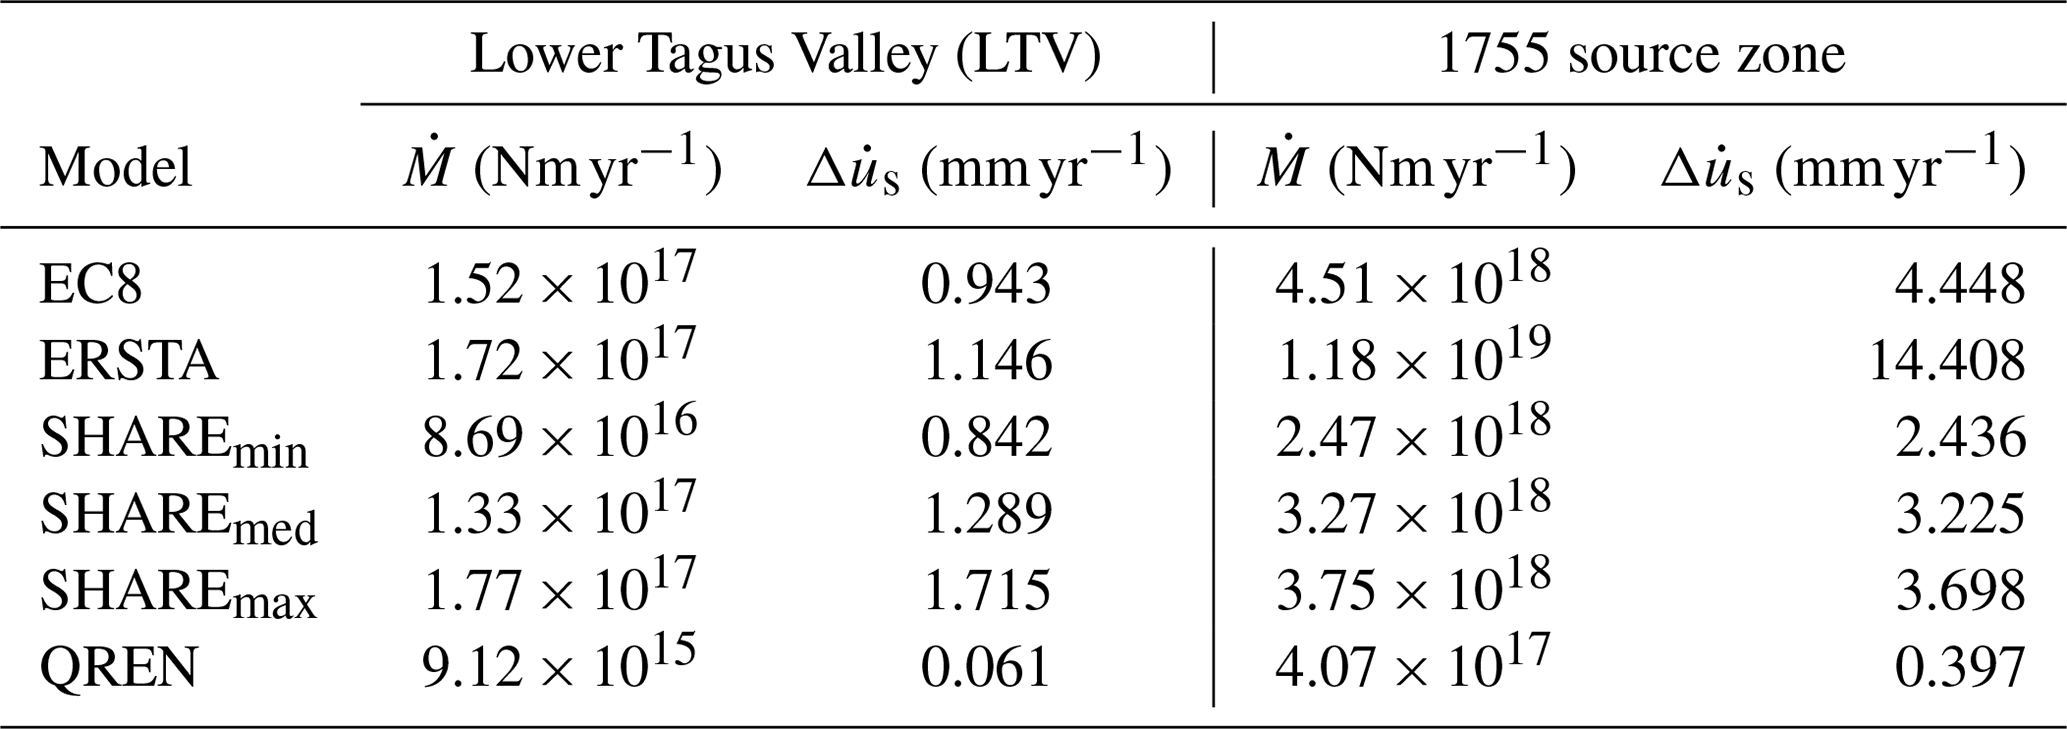
Table 9Simple test: seismic deformation rates () in millimetres per year (mm yr−1) for the LTV and 1755 source zones, considering Vilanova and Fonseca's (2007) 32 models resulting from the logic tree proposal. In bold we identify the recurrence models and values that will be checked by the complex sanity test. is the long-term seismic moment rate.
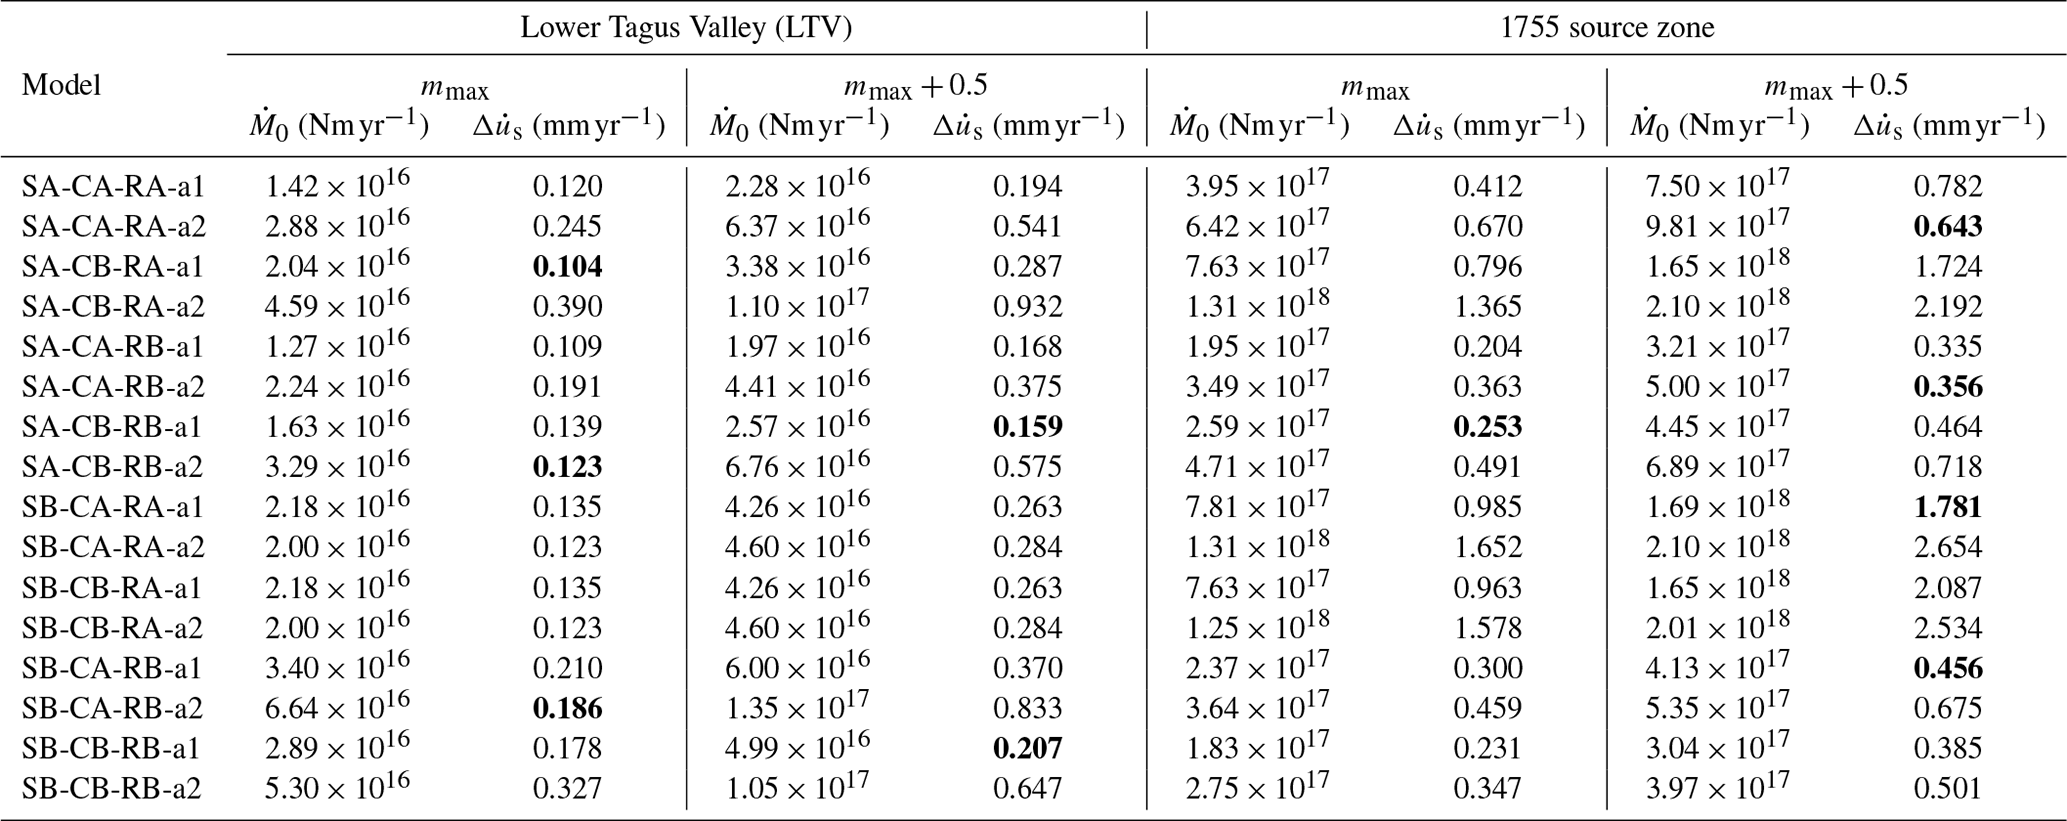
5.1 Simplified test
This test consisted in computing the fault slip rate that would explain the seismicity from the earthquake recurrence models proposed for PSHA, as described in Sect. 4.1. The slip rates and moment release rates for EC8, ERSTA, SHARE and QREN models considered on the LTV and 1755 source zones are shown in Table 8, and due to the use of a logic tree, also to simplify, the VF2007 model is shown in Table 9.
As already mentioned, the logic tree proposed by Vilanova and Fonseca (2007) generates 32 possible source zone and recurrence models, which define a discrete probability distribution. This can be converted into a continuous probability distribution considering that the a and b parameters from the proposed recurrence models are affected by uncertainty. Using Monte Carlo simulation, the seismic slip rate probability distributions obtained are shown in Fig. 6 for the LTV and 1755 source zones. Splitting the continuous probability distribution in five sections 20 % wide, it is then possible to select from each section one representative model to be tested against neotectonic modelling. These selected models are graphically displayed in Fig. 7.
The consistency tests provide geodynamic constraints for evaluating PSHA models, allowing us to identify suspect models, either for generating far more or far fewer earthquakes than predicted. The slip rate on an idealized fault that accumulates all the seismic strain released on that zone generated by the simple test must now be compared with our knowledge of lithospheric deformation and fault slip rates.
The geodynamic setting of W and SW Iberia is dominated by the WNW–ESE oblique dextral convergence between Nubia and Eurasia plates at ∼ 4 mm yr−1 (Fernandes et al., 2003). Spatial geodesy provides information on how this convergence is propagated on land causing distributed deformation. Palano et al. (2015) analysis of GNSS (Global Navigation Satellite System) data showed in SW Iberia a gradient in the measured velocities relative to fixed Eurasia, from ∼ 2 mm yr−1 in the SE to ∼ 0.5 mm yr−1 in the NW. The authors interpreted these results as evidence for a rigid rotation of the Iberian Peninsula around a pole located north of Madrid. Once this rotation is removed, the intraplate deformation is less than 1 mm yr−1 everywhere (ibid.).
Cabral et al. (2017) made a detailed analysis of spatial geodesy data in southern mainland Portugal. These authors identified a shear zone that separates a faster SW domain from a slower NE domain. This shear zone would accommodate part of the velocity gradient already mentioned by Palano et al. (2015) with a relative velocity change of less than 1 mm yr−1.
Cabral (2012) investigated the intraplate deformation using geological criteria. His synthesis recognizes the existence of several active faults in mainland Portugal (active in the sense that they show movement evidence in the last 3 Myr) but with very low slip rates of less than 0.1 mm yr−1. The most active faults can reach slip rates of 0.5 mm yr−1. Neotectonic modelling works (Cunha et al., 2012; Neres et al., 2016) confirm these results, as they point to slip rates in intraplate faults less than 0.1 mm yr−1.
Both space geodesy data and neotectonic modelling results show that the convergence between the African and Eurasian plates, at ∼ 4 mm yr−1, is localized mainly in the ocean domain and must be accommodated there by active faults, some of them already identified through geological and geophysical studies.
Taking all this information into consideration, we assume 1 mm yr−1 as a reasonable kinematic reference value for the simple sanity check (Tables 8 and 9) for the intraplate Lower Tagus Valley source zone (LTV). For the interplate region where the 1755 earthquake might have been generated, the reference value should be 4 mm yr−1. Both of these values represent upper limits. Seismic slip rates smaller than 0.1 or 0.5 mm yr−1 for LTV and 1755 zones, respectively, should also be considered suspect for they would represent too few seismic deformations. The evaluation of recurrence models from both sanity tests is deferred to the discussion section.
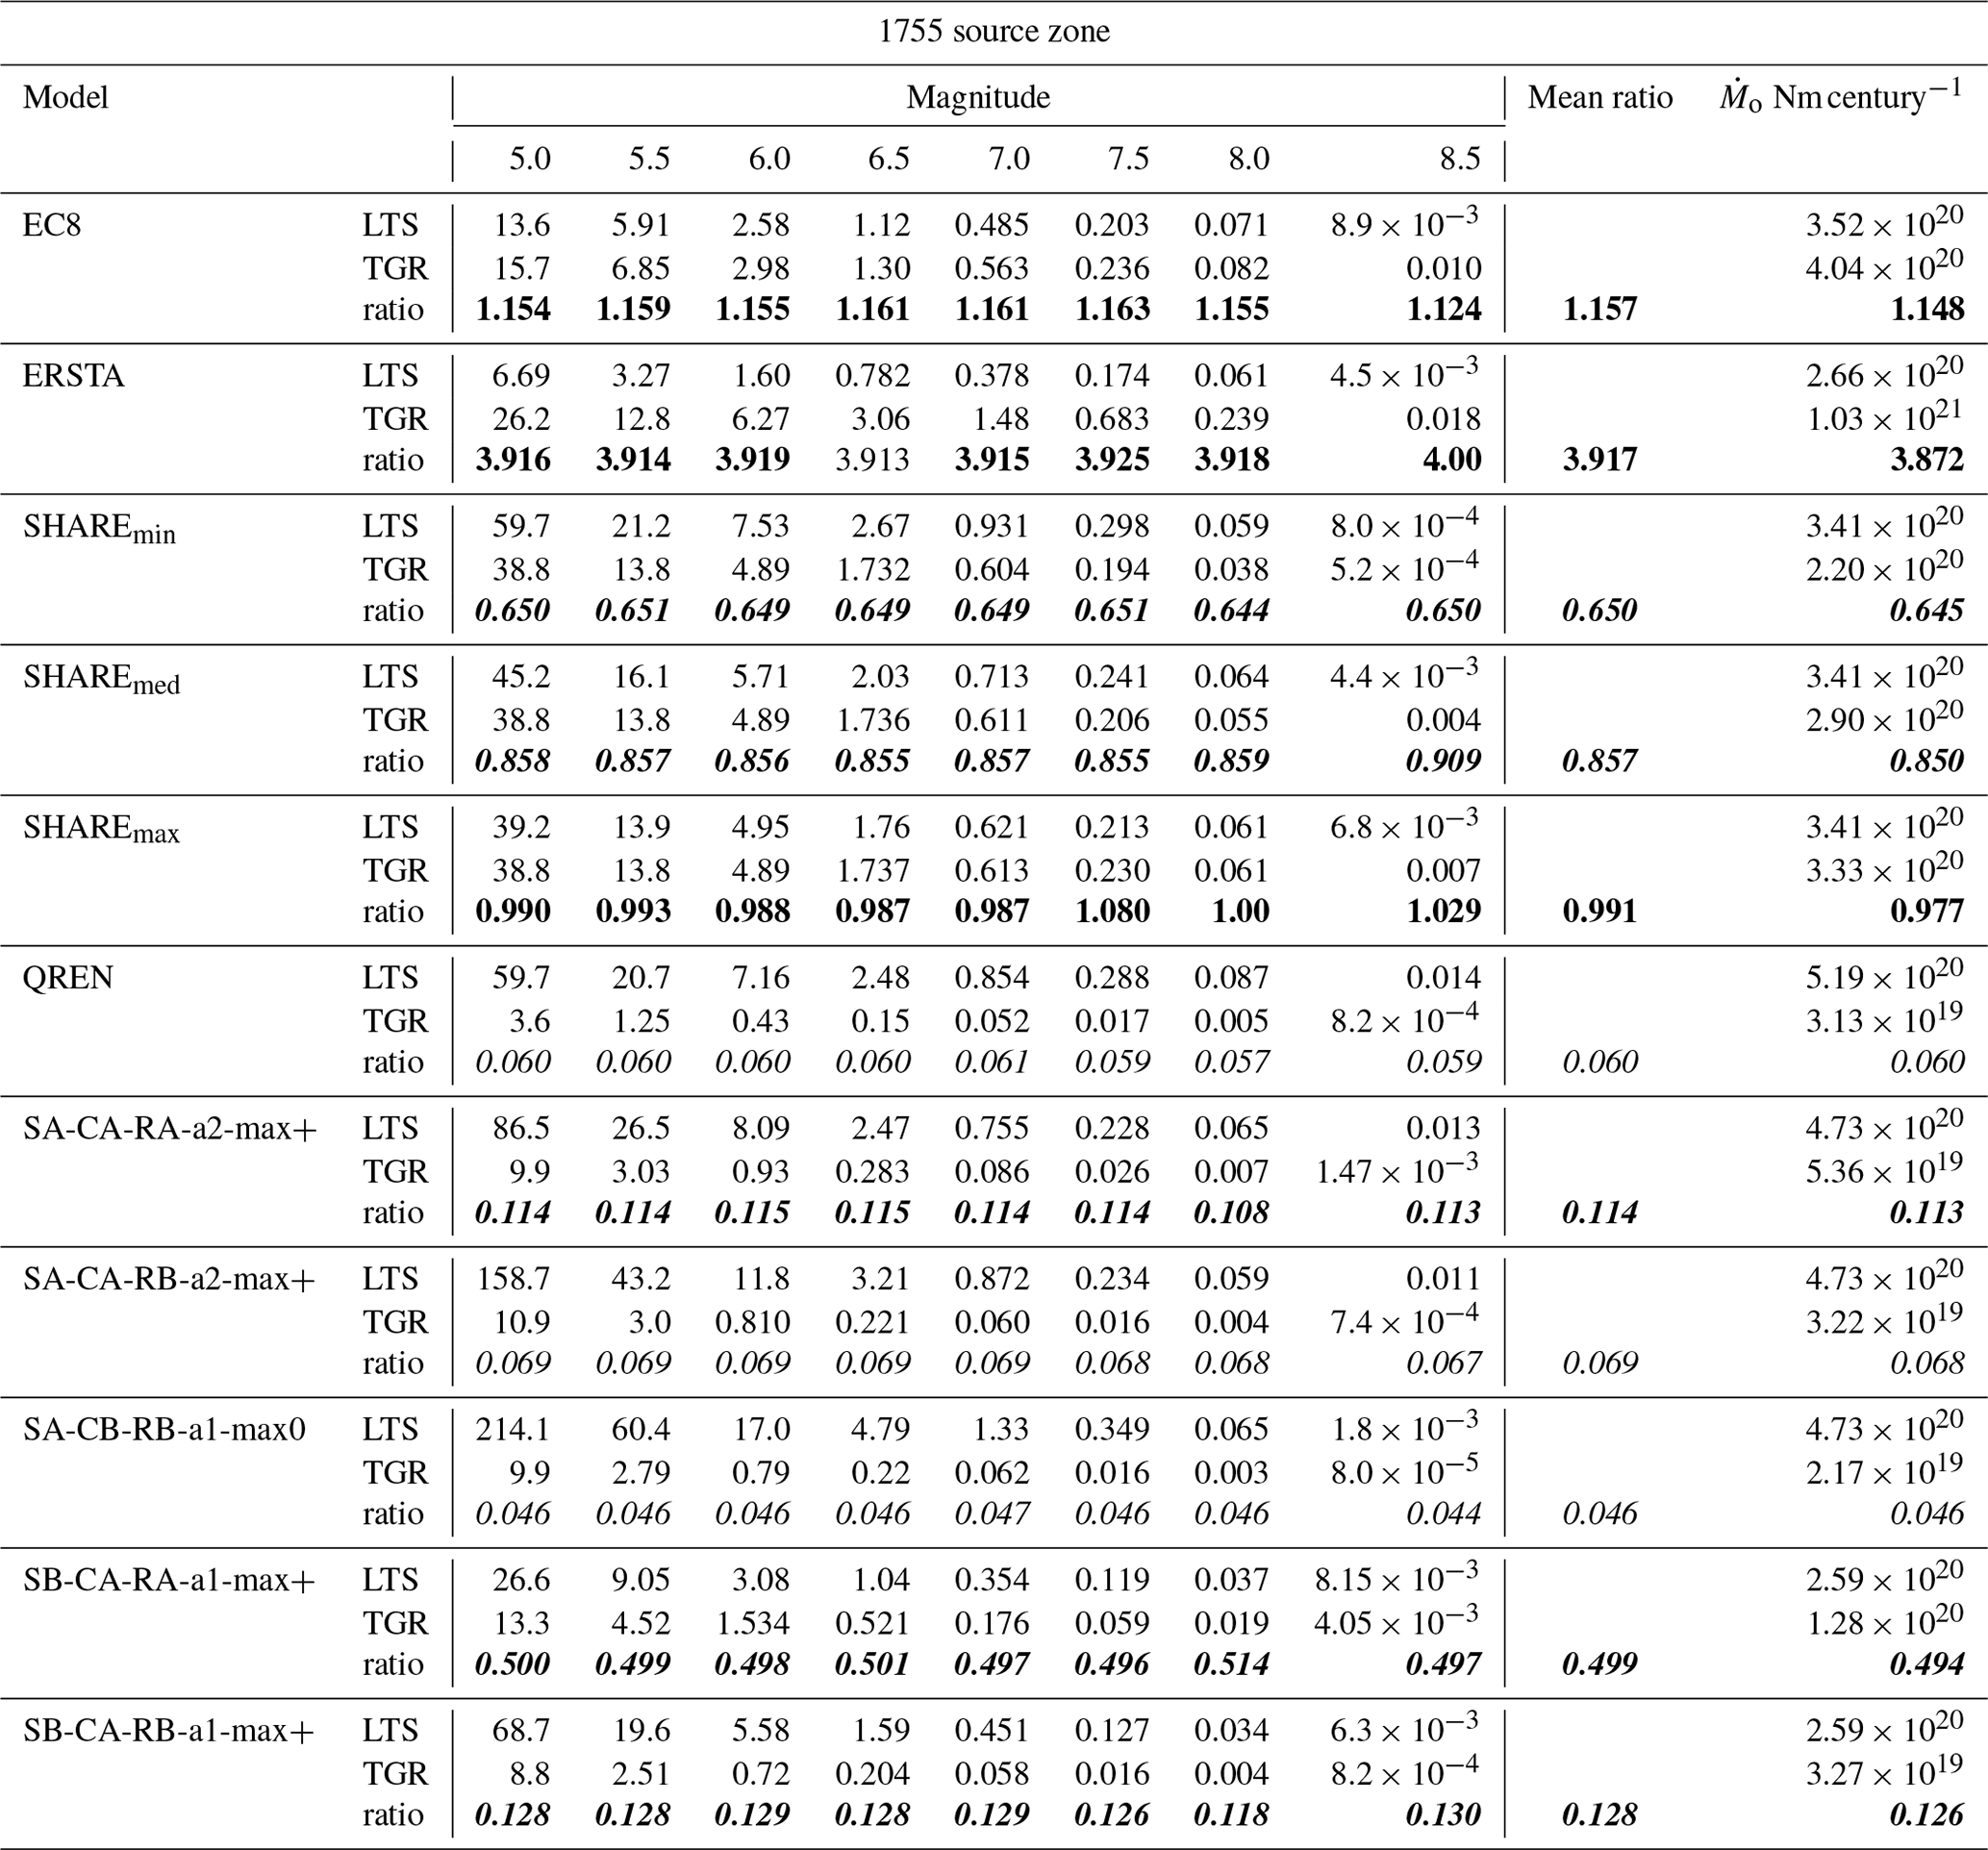
Table 10Complex test: activity rates in earthquakes per century for the LTV source zone. Two sets of seismicity parameters were used: (1) LTS obtained with the long-term seismicity program and (2) PSHA models expressed as tapered Gutenberg–Richter laws (TGR). Ratio represents the ratio between TGR and LTS. The number of earthquakes consider a catalogue period of 100 years. Ratios suspected to be too high are in bold and too low in italic. Acceptable ratios are in bold and italic. is the long-term seismic moment rate.
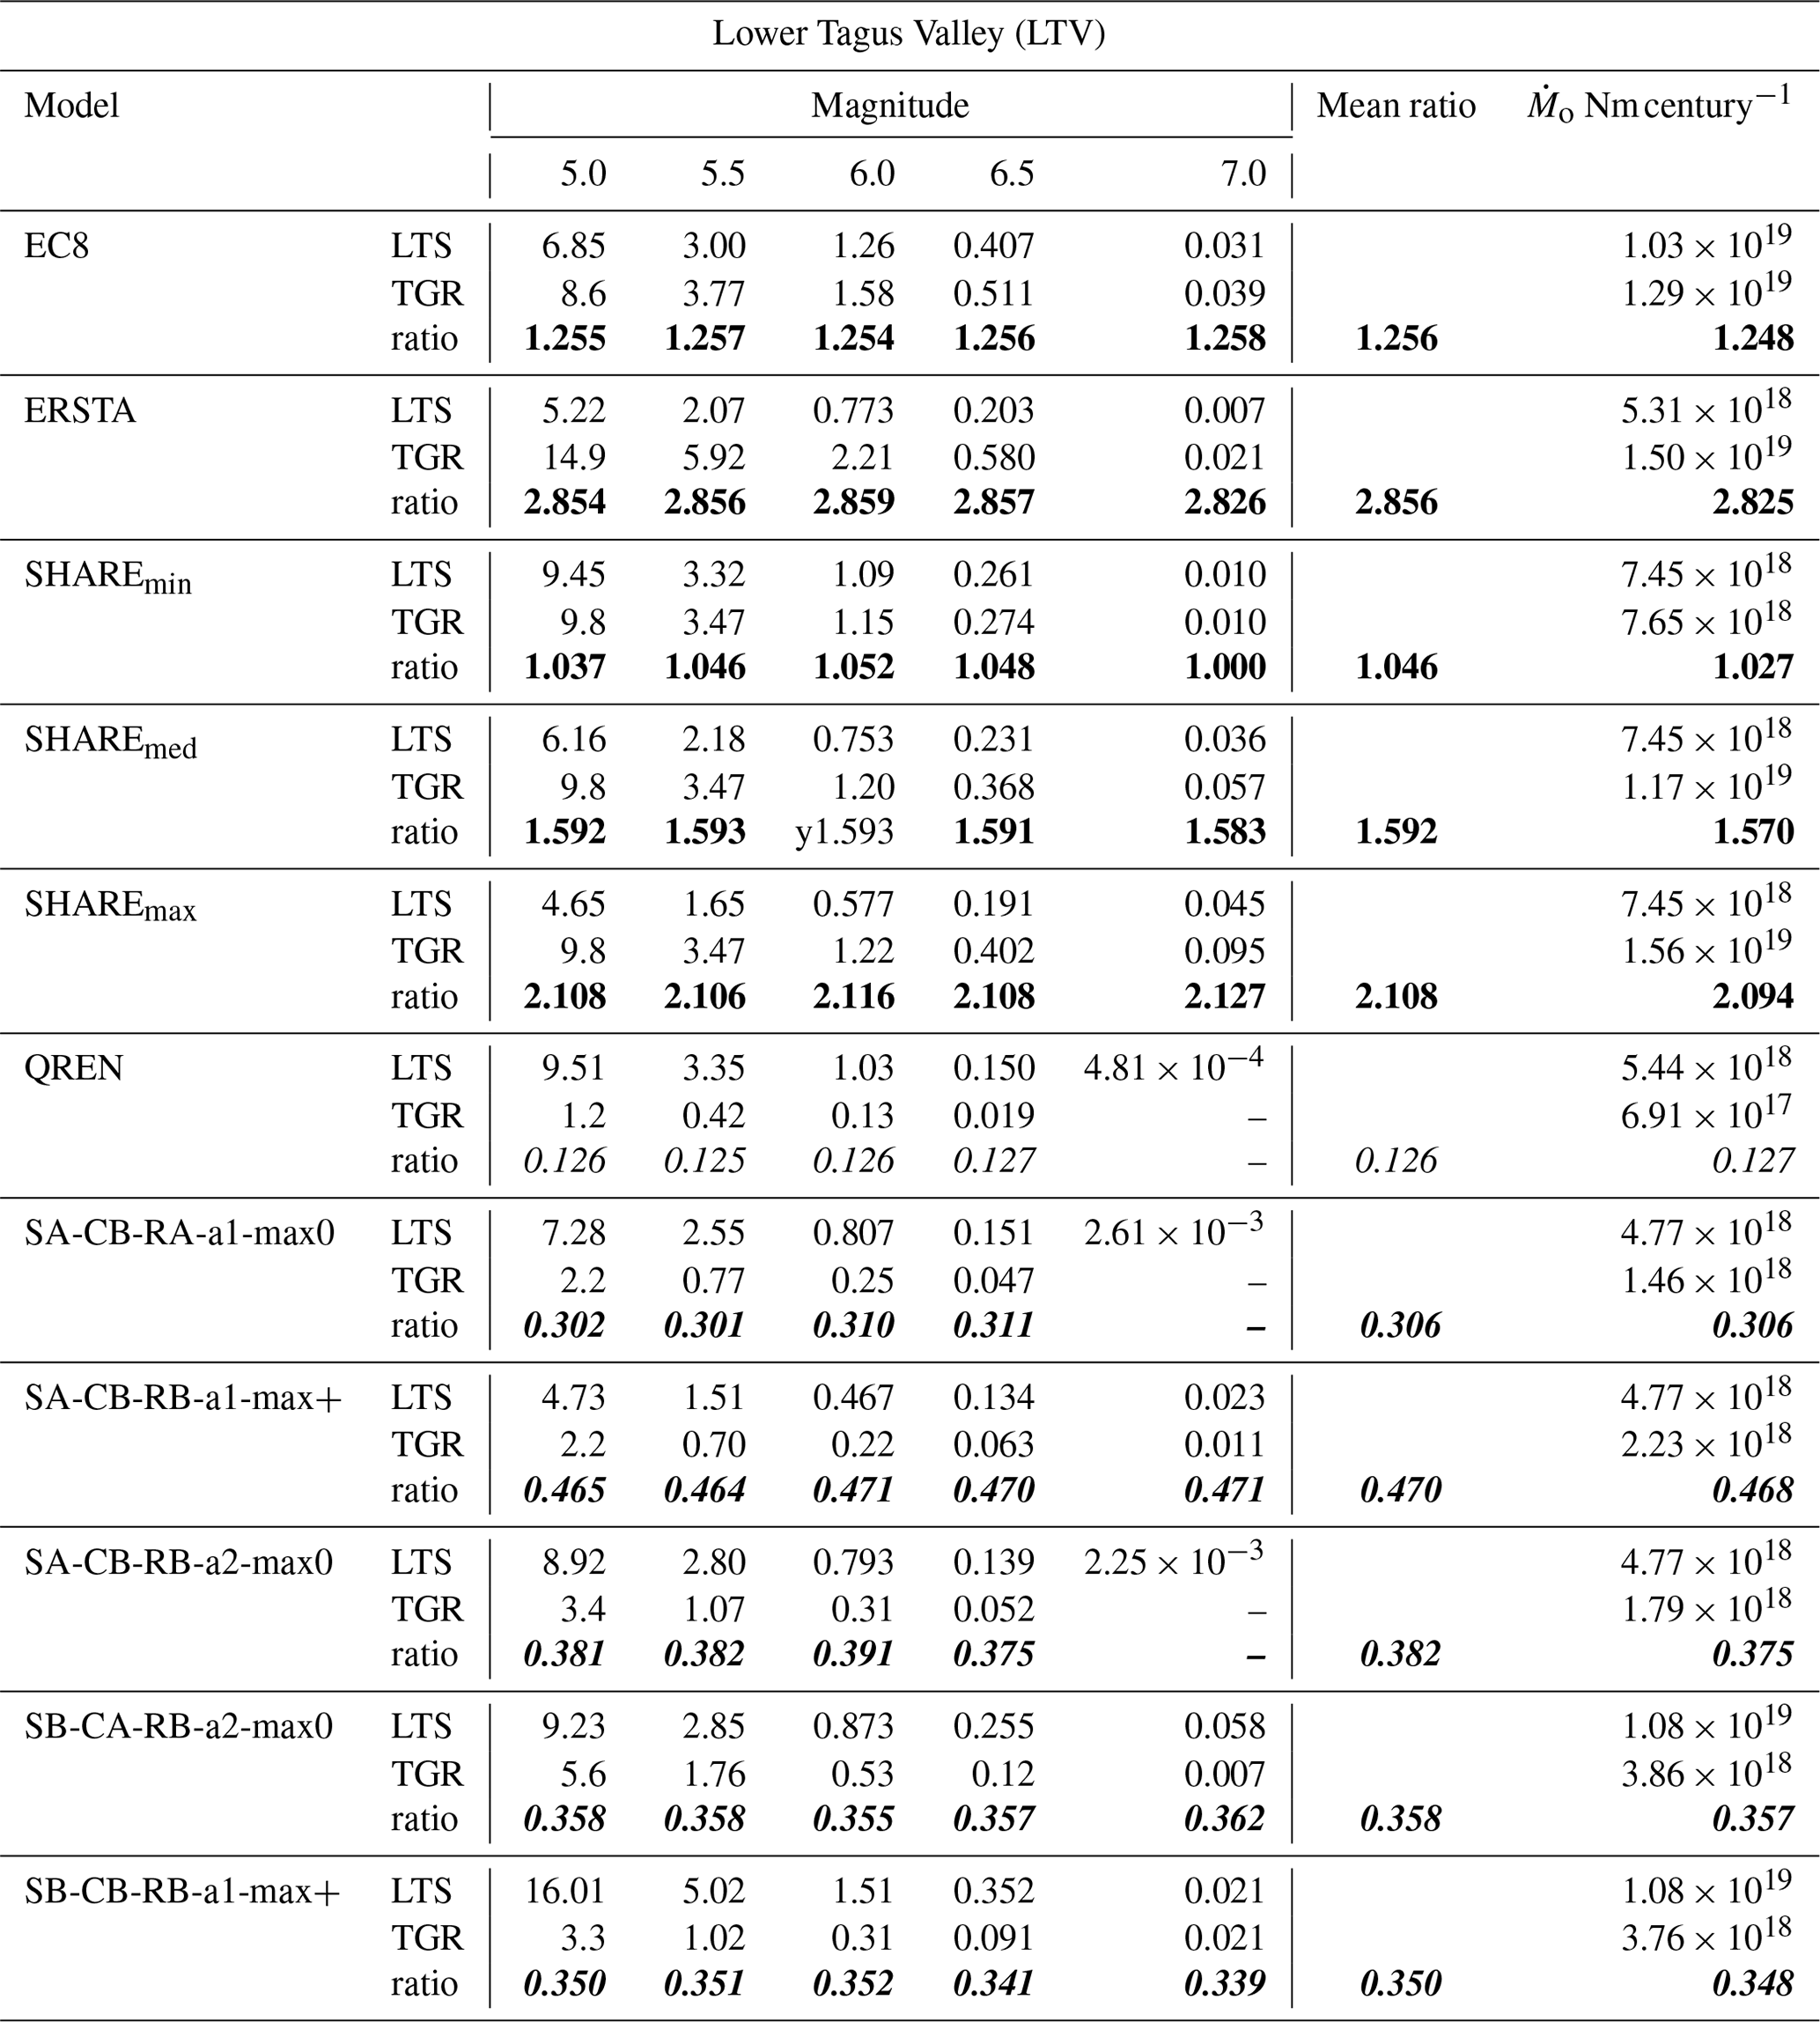
Table 11Complex test: activity rates in earthquakes per century for the 1755 source zone. Two sets of seismicity parameters were used: (1) LTS obtained with the long-term seismicity program and (2) PSHA models expressed as tapered Gutenberg–Richter laws (TGR). Ratio represents the ratio between TGR and LTS. The number of earthquakes consider a catalogue period of 100 years. Ratios suspected to be too high are in bold and too low in italic. Acceptable ratios are in bold and italic. is the long-term seismic moment rate.
5.2 Seismicity rates compared with long-term seismicity
According to Sect. 4.3, in slowly deforming areas and earthquake offshore domains, neotectonic modelling constrained by geology, seismicity and geodesy is a very useful tool to infer lithospheric deformation, as it was done by Neres et al. (2016) for W and SW Iberia. Then, lithospheric deformation can be converted to earthquake rates on the source zones used for PSHA using a modified version of the long-term seismicity code of Bird and Liu (2007) and Bird et al. (2010). The earthquake rates computed assuming a perfect coupling can then be compared to observations, either by the number of earthquakes generated by magnitude classes or by the total moment rate released. This comparison is shown in Tables 10 and 11 for the LTV and 1755 source zones, respectively. It is expressed by the ratio of PSHA recurrence model parameters over the long-term seismicity estimate. Keeping all other modelling parameters, this ratio can be interpreted as the seismic coupling required to fit PSHA recurrence models with neotectonics modelling. These ratios should be considered suspect if they are close to 1 or greater than 1, meaning that the recurrence models predict more earthquakes and seismic strain than what would be expected from the neotectonic modelling. On the other hand, very small values of the ratio (smaller than 0.1) should also be considered suspect because they might indicate a very small and unrealistic seismic coupling.
Table 12Summary of the simple () and complex (Ratio ) sanity tests applied to PSHA earthquake generation models. Bold indicates that the PSHA model generates too many earthquakes, while italic shows that the model generates too few earthquakes, according to criteria defined in the text. In bold and italic, we show acceptable values. Average ratios between earthquake generation are shown in the “Mean ratio LTS” column.
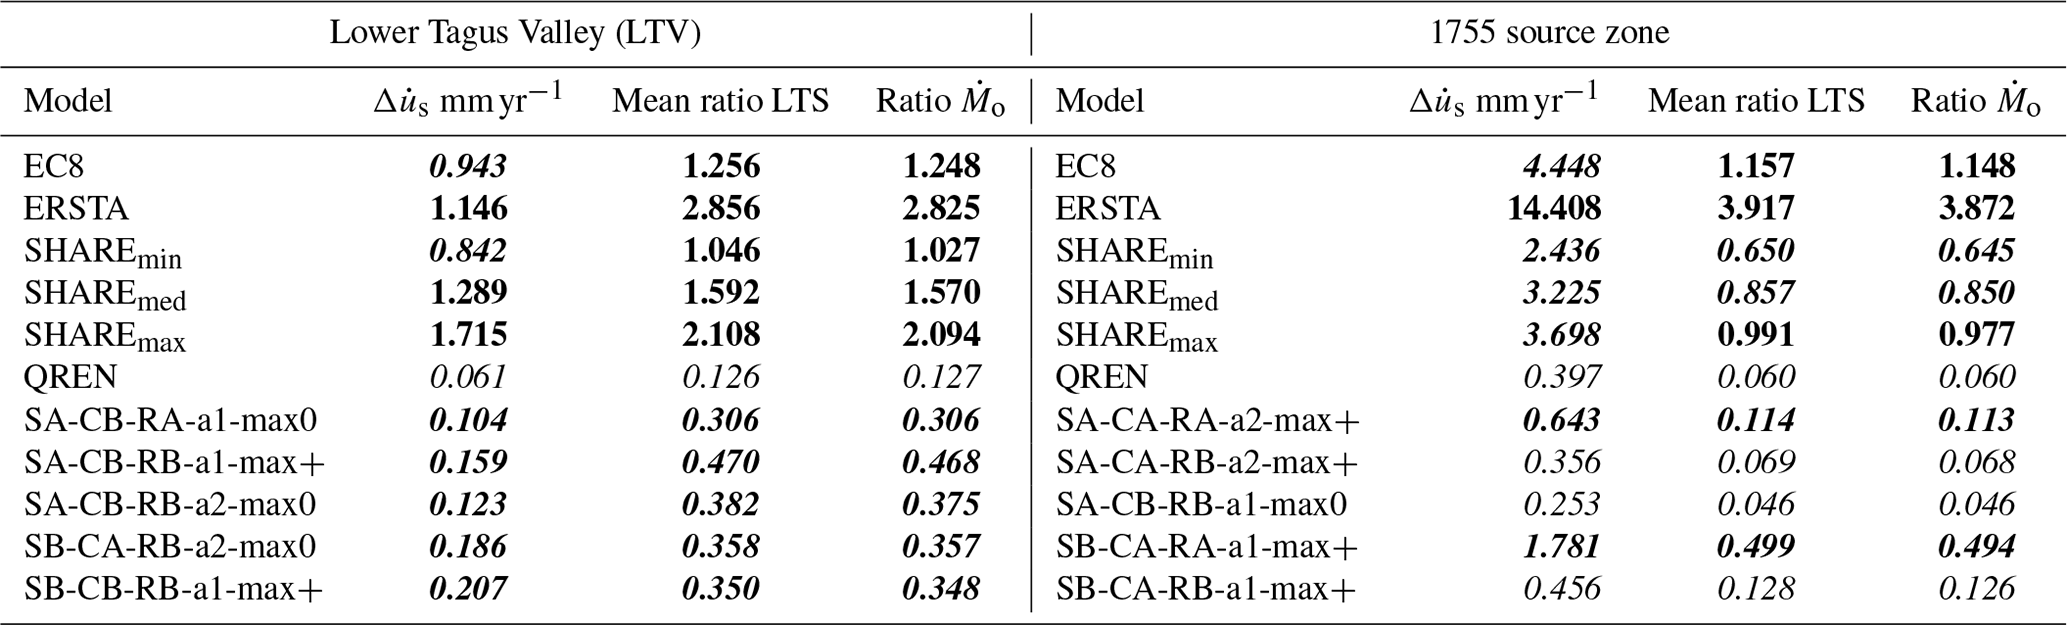
We present in Table 12 a summary of the sanity tests (simple and complex) performed on the 11 PSHA earthquake generation models, expressed as seismic slip rates () on a single fault and average ratios between earthquake generation (Mean ratio LTS) and seismic moment release ratios (Ratio ) computed by neotectonic modelling with the long-term seismicity algorithm.
5.3 Joint evaluation of earthquake generation models
The most realistic test, the comparison between PSHA earthquake generation models and neotectonic modelling for the LTV source zone, clearly identifies three models with excessive earthquake generation, EC8, ERSTA, and SHAREmin, SHAREmax, and one suspect, SHAREmed. These three models were also considered suspect by the simplified consistency test. The QREN model shows too little earthquake generation, confirmed by both sanity checks, simple and complex. All five VF2007 earthquake generation models studied satisfy both consistency tests.
Considering the 1755 source zone, only three PSHA scenarios pass both sanity tests, SHAREmin, SHAREmed and one of the VF2002 models. The complex consistency test identifies scenarios EC8 and ERSTA as being clearly excessive in earthquake generation, while SHAREmax may be considered suspect. Models that generate too little seismic activity or are suspected of that are QREN and four of the five VF2007 models investigated. In this source zone, the simplified test confirms 9 of the 11 evaluations done by the complex test, disagreeing the diagnostic on one of the VF2007 models and SHAREmax.
All considered, despite its simplicity, we remark that the simplified consistency check evaluation agrees with the more elaborate one on 20 out of the 22 PSHA earthquake generation models. While in the LTV source zone, an intraplate domain, 6 of 11 PSHA models fail the tests or are considered suspect; in the 1755 source zone, an interplate domain, the score is lower, and only 4 of 11 models pass the complex sanity check. The poor performance of PSHA models in the source areas that include the large 1755 earthquake may be explained by the poor geological control used on its definition, a diffuse plate boundary with large identified geological faults with mostly unknown activity.
Revisiting Figs. 6 and 7 where all 32 VF2007 models are analysed by the simple sanity test, we see that for the LTV source zone, three models exceed 1 mm yr−1 seismic slip rates and must be considered suspect. Using Monte Carlo simulation to account for uncertainties in the DTGR law parameters, 10 % of those models generated earthquakes in excess. Differently, for the 1755 source zone, 40 % of the investigated models should be considered suspect for generating too few earthquakes.
It may be argued that the reference values used to identify PSHA models as suspect or unrealistic depend on a few critical parameters that were subjectively defined in this work, like the thickness of the brittle lithosphere, the seismic coupling, and the dip and length of the typical fault. The seismic moment release and earthquake generation rates are linear functions of these parameters, directly or inversely related, and it is a simple algebraic exercise to compute other reference values to suit the researcher's preferences.
Earthquake catalogues in slowly deforming regions are mostly incomplete and have large return periods, and the maximum magnitude is usually determined by subjective and/or geological criteria with large uncertainties. Taking into consideration the space geodetic information, the New Madrid seismic zone also classifies as a slowly deforming region (e.g. Newman et al., 1999). If the 1811 and 1812 New Madrid earthquakes have magnitude 8, then the inferred tectonic strain implies that these events have a very low probability of occurrence (ibid.). The interpretation of this earthquake sequence generated a long-standing debate (e.g. Frankel, 2004; Stein, 2005, Frankel, 2005). The New Madrid events show that time ergodicity, a common assumption for earthquake generation in slowly deforming regions, can fail dramatically. Instead, the consistency between earthquake generation models from PSHA and tectonic deformation converted into seismic moment release rates with the long-term seismicity algorithm was expressed in two ways: (i) by the ratio of seismic activity for different magnitude classes and (ii) by the ratio between seismic moment release rates, which can be interpreted as the mean seismic coupling coefficient needed for perfect consistency. The results obtained show that both indicators result in the same classification of the PSHA models.
In areas of slow deformation and/or where the seismogenic structures cannot be clearly related to instrumental and historical seismicity (e.g. in offshore domains), researchers use the concept of area source to characterize the earthquake generation process. Given the several subjective judgements that are needed to establish these zones and to define the earthquake recurrence laws, it is common that different authors reach different PSHA results, which cannot be ascribed only to the choice of the ground motion prediction equations. We proposed a methodology to objectively evaluate the chosen earthquake generation models by comparing the seismic moment release with the knowledge on tectonic deformation, by space geodesy and geology, or by neotectonic modelling.
One of the areas investigated in W and SW Iberia, a typical slowly deforming region, was the Lower Tagus Valley, an area with very high seismic risk since it includes Lisbon and has a large concentration of population, services and industry. This is an intraplate domain where space geodesy hints at a strain rate smaller than 1 mm yr−1. The other source area chosen is offshore SW Iberia, an interplate setting, where several studies locate the source of the 1 November 1755 destructive earthquake.
The first sanity check proposed, the simple one, compares the seismic slip rate to kinematic knowledge from space geodesy and geology. In the absence of space geodetic and reliable geological observations, as in offshore domains, lithospheric deformation can be modelled by numerical methods, with results validated by comparison with geological, geodetic and seismic observations. The inferred lithospheric strain can be converted to earthquake and seismic moment release rates using the long-term seismicity algorithm. The second sanity test proposed compares the PSHA earthquake generation models with the ones from neotectonic modelling. Both tests can be used to assess the consistency of PSHA models. The simple test provided the same classification as the complex test on 20 of the 22 scrutinized models.
We suggest that the consistency tests proposed in this work should be part of the PSHA studies in regions of slow deformation and/or with offshore complex earthquake generation mechanisms. In the examples investigated only area earthquake source zones were tested but the methodology can be easily extended to PSHA studies that use more detailed source parametrization (e.g. Rivas-Medina et al., 2018). When logic tree and/or Monte Carlo methods are used to characterize the epistemic and aleatoric uncertainties in PSHA, it is recommended that the outcome of the sanity tests should be used on a weighing scheme, as it is already used in probabilistic tsunami hazard assessment (Davies et al., 2017, Basili et al., 2019).
“Society's goal is to choose a level of safety that makes economic sense, because such mitigation diverts resources from other uses. Ideally mitigation should not be too weak, permitting undue risks, or too strong, imposing unneeded costs” (in Stein et al., 2012). This means that, at the end of the day, some decision must be made, so that buildings are built or renewed to withstand ground shaking. We do not follow Mulargia et al.'s (2017) proposal to completely abandon PSHA due to its faulty assumptions at odds with earthquake physics. Even if PSHA is not the only tool used to make the required assessments for land use management and for the establishment of building codes, it will still remain as one of the tools to be used. As regards earthquake physics, the scientific literature is full of contradictory results. For example, the claim made by Corral (2004) that the earthquake recurrence measured by the waiting time between events follows a universal distribution with naturally occurring clusters of main shocks was disputed by Hainzl et al. (2006), who showed that the earthquake catalogue in California can be explained by a Poisson distribution for the main shocks and a Omori law for aftershocks.
It is an indisputable fact that the occurrence of too many large earthquakes (and associated ground motion) in areas of low hazard, as pointed out by Stein et al. (2012), questions the validity of the PSHA used to establish it. We may split the anomalies as resulting from two main causes: (i) the event magnitude is larger than the maximum earthquake used in the model; (ii) the estimated frequency for the large magnitude (ground motion) observed was underestimated.
Given that for common buildings the Poissonian distribution used for PSHA requires the integration of earthquakes with recurrence intervals several times larger than 500 years (∼ 10 % exceedance probability in 50 years) or 2500 years (2 % exceedance probability in 50 years), it is recognized (e.g. Stein et al., 2012) that the human observation period is too short to assess the correctness of such models. In fact, for short periods of time, the absence of a large earthquake or its occurrence can always be considered a failure of the model. One possible hope for objectively evaluating the results of PSHA would be aggregating results globally, as was done by Rong et al. (2003) to evaluate the seismic gap model and show that its predictions were not statistically significant. In any case, policy makers and stakeholders should be aware that although PSHA is widely used, it has not yet been validated by objective testing. Thus PSHA should not be relied on as a black box.
Incidentally, these anomalies result from smoothed-catalogue methods, and for this reason, in recent years, as the unexpected by PSHA events (ground motion) accumulated, and as a response to the acknowledgement of the earthquake generation complexities and our incomplete knowledge, uncertainty has been more and more incorporated in PSHA studies. Although uncertainties are still not fully included in the decision making (e.g. building codes), their evaluation may help to assess if, and when, the PSHA studies fail. The PSHA map provides one simple figure to be used by the engineers, but many examples of failure may well fall inside the large uncertainty that is associated with that number, if properly computed. This is particularly so if the failure is due to cause (ii) mentioned above, recurrence model underestimation. The current work intends to be a contribution to PSHA in slowly deforming regions by incorporating physical constrains related to plate tectonics.
The need for additional physical control on PSHA studies can be compared to an analogous problem in hydrology, as pointed out by Klemeš (1986, 1989). In hydrology, researchers are expected to forecast large flood events with recurrence periods of 100 years or more based on short-term observations. The statistical models used fail to completely account for the high variability of physical conditions that concur to generate a large flood (Klemeš, 1986). Even if the shortcoming of small observation periods (which can be extended by paleo-geological studies) is common to smoothed-catalogue methods, we must mention a crucial difference between hydrology and seismology that is at the hearth of the paper: in our work, the seismic moment release is ultimately constrained by plate tectonics or long-term plate deformation. The global studies made by Bird and Kagan (2004) showed that seismic coupling coefficients can be reliably computed for all plate boundaries using the seismic moment conservation principle.
This work used only published or public domain data sets.
The supplement related to this article is available online at: https://doi.org/10.5194/nhess-22-117-2022-supplement.
LM provided the initial concept. MR and LM developed the methodology with contributions from MC and MN. MN provided the neotectonic modelling. AC and PTC provided the PSHA input. The manuscript was prepared by MR with supervision and contribution from all authors.
The contact author has declared that neither she nor her co-authors have any competing interests.
Publisher's note: Copernicus Publications remains neutral with regard to jurisdictional claims in published maps and institutional affiliations.
This publication was supported by FCT project no. UIDB/50019/2020 – IDL. We address a special thanks to the journal handling editor Oded Katz and the reviewers Roberto Cabieces and Robert J. Geller for their constructive reviews. This study was developed for the MSc thesis of Margarida Ramalho.
This research was supported by FCT project no. UIDB/50019/2020 – IDL.
This paper was edited by Oded Katz and reviewed by Robert J. Geller and Roberto Cabieces.
Basili, R., Brizuela, B., Herrero, A., Iqbal, S., Lorito, S., Maesano, F. E., Murphy, S., Perfetti, P., Romano, F., Scala, A., Selva, J., Taroni, M., Thio, H. K., Tiberti, M. M., Tonini, R., Volpe, M., Glimsdal, S., Harbitz, C. B., Løvholt, F., Baptista, M. A., Carrilho, F., Matias, L. M., Omira, R., Babeyko, A., Hoechner, A., Gurbuz, M., Pekcan, O., Yalçıner, A., Canals, M., Lastras, G., Agalos, A., Papadopoulos, G., Triantafyllou, I., Benchekroun, S., Agrebi Jaouadi, H., Attafi, K., Ben Abdallah, S., Bouallegue, A., Hamdi, H., and Oueslati, F.: NEAMTHM18 Documentation: the making of the TSUMAPS-NEAM Tsunami Hazard Model 2018, Istituto Nazionale di Geofisica e Vulcanologia (INGV), Zenodo, https://doi.org/10.5281/zenodo.3406625, 2019.
Basili, R., Brizuela, B., Herrero, A., Iqbal, S., Lorito, S., Maesano, F. E., Murphy, S., Perfetti, P., Romano, F., Scala, A., Selva, J., Taroni, M., Tiberti, M. M., Thio, H. K., Tonini, R., Volpe, M., Glimsdal, S., Harbitz, C. B., Løvholt, F., Baptista, M. A., Carrilho, F., Matias, L. M., Omira, R., 9, Babeyko, A., Hoechner, A., Gürbüz, M., Pekcan, O., Yalçıner, A., Canals, M., Lastras, G., Agalos, A., Papadopoulos, G., Triantafyllou, I., Benchekroun, S., Jaouadi, H. A., Abdallah, S. B., Bouallegue, A., Hamdi, H., Oueslati, F., Amato, A., Armigliato, A., Behrens, J., Davies, G., Bucci, D. D., Dolce, M., Geist, E., Vida, J. M. G., González, M., Sánchez, J. M., Meletti, C., Sozdinler, C. O., Pagani, M., Parsons, T., Polet, J., Power, W., Sørensen, M., and Zaytsev, A.: The making of the NEAM tsunami hazard model 2018 (NEAMTHM18), Front. Earth Sci., 8, 616594, https://doi.org/10.3389/feart.2020.616594, 2021.
Bird, P.: Thin-plate and thin-shell finite-element programs for forward dynamic modelling of plate deformation and faulting, Comput. Geosci., 25, 383–394, https://doi.org/10.1016/s0098-3004(98)00142-3, 1999.
Bird, P.: Long-term fault slip rates, distributed deformation rates, and forecast of seismicity in the western United States from joint fitting of community geologic, geodetic, and stress direction data sets, J. Geophys. Res.-Sol. Ea., 114, B11403, https://doi.org/10.1029/2009JB006317, 2009.
Bird, P. and Kagan, Y. Y.: Plate-tectonic analysis of shallow seismicity: Apparent boundary width, beta, corner magnitude, coupled lithosphere thickness, and coupling in seven tectonic settings, B. Seismol. Soc. Am., 94, 2380–2399, 2004.
Bird, P. and Liu, Z.: Seismic hazard inferred from tectonics: California, Seismol. Res. Lett., 78, 37–48, 2007.
Bird, P., Liu, Z., and Rucker, W. K.: Stresses that drive the plates from below: Definitions, computational path, model optimization, and error analysis, J. Geophys. Res.-Sol. Ea., 113, B11406, https://doi.org/10.1029/2007JB005460, 2008.
Bird, P., Kreemer, C., and Holt, W. E.: A long-term forecast of shallow seismicity based on the Global Strain Rate Map, Seismol. Res. Lett., 81, 184–194, 2010.
Cabral, J.: Neotectónica em Portugal Continental, Memórias do Instituto Geológico e Mineiro, Lisboa, 31, 265 p, 1995.
Cabral, J.: Neotectonics of mainland Portugal: state of the art and future perspectives, J. Iber. Geol., 38, 71–84, 2012.
Cabral, J., Mendes, V. B., Figueiredo, P., da Silveira, A. B., Pagarete, J., Ribeiro, A., Dias, R., and Ressurreição, R.: Active tectonics in Southern Portugal (SW Iberia) inferred from GPS data. Implications on the regional geodynamics, J. Geodyn., 112, 1–11, 2017.
Campos Costa, A. C., Sousa, M. L., and Carvalho, A.: Seismic zonation for Portuguese national annex of Eurocode 8, in: Proceedings of the 14th World Conference on Earthquake Engineering, 12–17 October 2008, Beijing, China, 14_07-0167, 2008.
Carafa, M. M., Barba, S., and Bird, P.: Neotectonics and long-term seismicity in Europe and the Mediterranean region, J. Geophys. Res.-Sol. Ea., 120, 5311–5342, 2015.
Carafa, M. M. C., Kastelic, V., Bird, P., Maesano, F. E., and Valensise, G.: A “Geodetic Gap” in the Calabrian Arc: Evidence for a locked subduction megathrust?, Geophys. Res. Lett., 45, 1794–1804, 2018.
Carafa, M. M. C., Galvani, A., Di Naccio, D., Kastelic, V., Di Lorenzo, C., Miccolis, S., Sepe, V., Pietrantonio, G., Gizzi, C., Massucci, A., Valensise, G., and Bird, P.: Partitioning the ongoing extension of the central Apennines (Italy): Fault slip rates and bulk deformation rates from geodetic and stress data, J. Geophys. Res.-Sol. Ea., 125, e2019JB018956, https://doi.org/10.1029/2019JB018956, 2020.
Carrilho, F., Pena, J. A., and Nunes, J. C.: Sismicidade in Estudo do Risco Sísmico e de tsunamis no Algarve, Edição: Autoridade Nacional de Protecção Civil (ANPC), 29–43, ISBN 978-989-8343-06-2, 2010.
Carvalho, A. and Malfeito, N.: Zonas sísmicas e respectivos parâmetros para Portugal continental: comparação de várias propostas e análise de implicações nos estudos de perigosidade sísmica, 10∘ Congresso Nacional de Sismologia e Engenharia Sísmica, 20–22 April 2016, Ponta Delgada, Portugal, https://doi.org/10.13140/RG.2.1.2558.2960, 2016.
Cornell, C. A.: Engineering seismic risk analysis, B. Seismol. Soc. Am., 58, 1583–1606, 1968.
Corral, A.: Long-term clustering, scaling, and universality in the temporal occurrence of earthquakes, Phys. Rev. Lett., 92, 108501, https://doi.org/10.1103/PhysRevLett.92.108501, 2004.
Cunha, T. A., Matias, L. M., Terrinha, P., Negredo, A. M., Rosas, F., Fernandes, R. M. S., and Pinheiro, L. M.: Neotectonics of the SW Iberia margin, Gulf of Cadiz and Alboran Sea: a reassessment including recent structural, seismic and geodetic data, Geophys. J. Int., 188, 850–872, 2012.
Custódio, S., Dias, N. A., Carrilho, F., Góngora, E., Rio, I., Marreiros, C., Morais, I., Alves, P., and Matias, L.: Earthquakes in western Iberia: Improving the understanding of lithospheric deformation in a slowly deforming region, Geophys. J. Int., 203, 127–145, 2015.
Davies, G., Griffin, J., Løvholt, F., Glimsdal, S., Harbitz, C., Thio, H. K., Lorito, S., Basili, R., Selva, S. J., Geist, E., and Baptista, M. A.: A global probabilistic tsunami hazard assessment from earthquake sources, Geological Society, London, Special Publications, 456, 219–244, 2017.
Duarte, J. C., Rosas, F. M., Terrinha, P., Schellart, W. P., Boutelier, D., Gutscher, M. A., and Ribeiro, A.: Are subduction zones invading the Atlantic? Evidence from the southwest Iberia margin, Geology, 41, 839–842, 2013.
Fernandes, R. M. S., Ambrosius, B. A. C., Noomen, R., Bastos, L., Wortel, M. J. R., Spakman, W., and Govers, R.: The relative motion between Africa and Eurasia as derived from ITRF2000 and GPS data, Geophys. Res. Lett., 30, 1828, https://doi.org/10.1029/2003GL017089, 2003.
Frankel, A.: How can seismic hazard around the New Madrid seismic zone be similar to that in California?, Seismol. Res. Lett., 75, 575–586, 2004.
Frankel, A.: Reply to “Comment on How Can Seismic Hazard in the New Madrid Seismic Zone Be Similar to That in California? 'by Arthur Frankel”, Seismol. Res. Lett., 76, 366–367, 2005.
Fukao, Y.: Thrust faulting at a lithospheric plate boundary the Portugal earthquake of 1969, Earth Planet. Sc. Lett., 18, 205–216, 1973.
Gaspar-Escribano, J. M., Rivas-Medina, A., Parra, H., Cabañas, L., Benito, B., Barajas, S. R., and Solares, J. M.: Uncertainty assessment for the seismic hazard map of Spain, Eng. Geol., 199, 62–73, 2015.
Geissler, W. H., Matias, L., Stich, D., Carrilho, F., Jokat, W., Monna, S., IbenBrahim, A., Mancilla, F., Gutscher, M.-A., Sallarès, V., and Zitellini, N.: Focal mechanisms for sub-crustal earthquakes in the Gulf of Cadiz from a dense OBS deployment, Geophys. Res. Lett., 37, L18309, https://doi.org/10.1029/2010GL044289, 2010.
Giardini, D.: The global seismic hazard assessment program (GSHAP) – 1992/1999, Ann. Geophys., 42, 957–974, 1999.
Grevemeyer, I., Matias, L., and Silva, S.: Mantle earthquakes beneath the South Iberia continental margin and Gulf of Cadiz–constraints from an onshore-offshore seismological network, J. Geodyn., 99, 39–50, 2016.
Grünthal, G. and Wahlström, R.: The European-Mediterranean earthquake catalogue (EMEC) for the last millennium, J. Seismol., 16, 535–570, 2012.
Hainzl, S., Scherbaum, F., and Beauval, C.: Estimating background activity based on interevent-time distribution, B. Seismol. Soc. Am., 96, 313–320, 2006.
IGN-UPM: Actualización de Mapas de Peligrosidad Sísmica de España 2012, Editorial Centro Nacional de Información Geográfica, Madrid, ISBN: 978-84-416-2685-0, 267 pp, 2013.
ISC: International Seismological Centre, On-line Bulletin, Internatl. Seismol. Cent., Thatcham, UK, https://doi.org/10.31905/D808B830, 2018.
Jeremias, F. T., Carvalho, A., Coelho, A. G., and Campos Costa, A.: Estudos sismológicos para definição das ações sísmicas para o local de implantação do aproveitamento hidroeléctrico de Foz Tua, in: XIII Congresso Nacional de Geotecnia, April 2012, Lisboa, p. 16, 2012.
Johnston, A. C.: The Seismicity of 'Stable Continental Interiors', in: Earthquakes at North-Atlantic Passive Margins: Neotectonics and Postglacial Rebound, NATO ASI Series, Series C: Mathematical and Physical Sciences,, vol 266, Springer, Dordrecht, https://doi.org/10.1007/978-94-009-2311-9_18, 1989.
Johnston, A. C.: Seismic moment assessment of earthquakes in stable continental regions—III. New Madrid 1811–1812, Charleston 1886 and Lisbon 1755, Geophys. J. Int., 126, 314–344, 1996.
Kijko, A.: Estimation of maximum earthquake magnitude Mmax, Pure Appl. Geophys., 161, 1655–1681, 2004.
Kijko, A. and Sellevoll, M. A.: Estimation of Earthquake Hazard Parameters from Incomplete Data Files. Part II. Incorporation of Magnitude Heterogeneity, B. Seismol. Soc. Am., 82, 120–134, 1992.
Klemeš, V.: Dilettantism in Hydrology: Transition or Destiny?, Water Resour. Res., 22, 177S–188S, 1986.
Klemeš, V.: The improbable probabilities of extreme floods and droughts, in: Hydrology of Disasters, edited by: Starosolszky, O. and Medler, O. M., James and James, London, 43–51, 1989.
Martínez-Loriente, S., Gracia, E., Bartolome, R., Sallarès, V., Connors, C., Perea, H., Lo Iacono, C., Klaeschen, D., Terrinha, P., Dañobeitia, J. J., and Zitellini, N.: Active deformation in old oceanic lithosphere and significance for earthquake hazard: Seismic imaging of the Coral Patch Ridge area and neighboring abyssal plains (SW Iberian Margin), Geochem. Geophy. Geosy., 14, 2206–2231, 2013.
Matias, L. M. and Teves-Costa, P.: Mapa de perigosidade sísmica. Avaliação de Riscos Naturais e Tecnológicos na Cidade de Lisboa, Relatório IE16, 26 de Julho de 2011, Faculdade de Ciências da Universidade de Lisboa, Lisboa, 2011a.
Matias, L. M. and Teves-Costa, P.: Relatório de perigosidade sísmica. Avaliação de Riscos Naturais e Tecnológicos na Cidade de Lisboa, Relatório IE17, 26 de Julho de 2011, Faculdade de Ciências da Universidade de Lisboa, Lisboa, 2011b.
Matias, L. M., Cunha, T., Annunziato, A., Baptista, M. A., and Carrilho, F.: Tsunamigenic earthquakes in the Gulf of Cadiz: fault model and recurrence, Nat. Hazards Earth Syst. Sci., 13, 1–13, https://doi.org/10.5194/nhess-13-1-2013, 2013.
Mazzotti, S., Leonard, L. J., Hyndman, R. D., and Cassidy, J. F.: Tectonics, dynamics, and seismic hazard in the Canada-Alaska Cordillera, in: Active tectonics and seismic potential of Alaska, vol. 179, 297–319, https://doi.org/10.1029/179GM17, 2008.
Mezcua, J., Rueda, J., and Blanco, R. M. G.: A new probabilistic seismic hazard study of Spain, Nat. Hazards, 59, 1087–1108, 2011.
Mulargia, F., Stark, P. B., and Geller, R. J.: Why is probabilistic seismic hazard analysis (PSHA) still used?, Phys. Earth Planet. In., 264, 63–75, 2017.
Neres, M., Carafa, M. M. C., Fernandes, R. M. S., Matias, L., Duarte, J. C., Barba, S., and Terrinha, P.: Lithospheric deformation in the Africa-Iberia plate boundary: Improved neotectonic modeling testing a basal-driven Alboran plate, J. Geophys. Res.-Sol. Ea., 121, 6566–6596, 2016.
Neres, M., Neves, M. C., Custódio, S., Palano, M., Fernandes, R., Matias, L., Carafa, M., and Terrinha, P.: Gravitational Potential Energy in Iberia: A Driver of Active Deformation in High-Topography Regions, J. Geophys. Res.-Sol. Ea., 123, 10–277, 2018.
Newman, A., Stein, S., Weber, J., Engeln, J., Mao, A., and Dixon, T.: Slow deformation and lower seismic hazard at the New Madrid seismic zone, Science, 284, 619–621, 1999.
Palano, M., González, P. J., and Fernández, J.: The Diffuse Plate boundary of Nubia and Iberia in the Western Mediterranean: Crustal deformation evidence for viscous coupling and fragmented lithosphere, Earth Planet. Sc. Lett., 430, 439–447, 2015.
Peláez, J. and López Casado, C.: Seismic hazard estimate at the Iberian Peninsula, Pure Appl. Geophys., 159, 2699–2713, 2002.
Peltier, W. R., Argus, D. F., and Drummond, R.: Space geodesy constrains ice-age terminal deglaciation: The global ICE-6G_C (VM5a) model, J. Geophys. Res.-Sol. Ea., 120, 450–487, https://doi.org/10.1002/2014JB011176, 2015.
Ribeiro, A., Mendes-Victor, L., Cabral, J. M. L. C., Matias, L., and Terrinha, P.: The 1755 Lisbon earthquake and the beginning of closure of the Atlantic, Eur. Rev., 14, 193–205, 2006.
Rivas-Medina, A., Benito, B., and Gaspar-Escribano, J. M.: Approach for combining fault and area sources in seismic hazard assessment: application in south-eastern Spain, Nat. Hazards Earth Syst. Sci., 18, 2809–2823, https://doi.org/10.5194/nhess-18-2809-2018, 2018.
Rodrigues, I., Sousa, M. L., Carvalho, A., and Carrilho, F.: Parâmetros das leis de frequência-magnitude para as novas zonas de sismogénese delineadas para a região do Algarve. APMG 2009, 6∘ Simpósio de Meteorologia e Geofísica/10∘ Encontro Luso-Espanhol de Meteorologia, Costa da Caparica, Portugal, 2009.
Rong, Y.-F., Jackson, D. D., and Kagan, Y. Y.: Seismic gaps and earthquakes, J. Geophys. Res., 108, 2471, https://doi.org/10.1029/2002JB002334, 2003.
Silva, S., Terrinha, P., Matias, L., Duarte, J. C., Roque, C., Ranero, C. R., Geissler, W. H., and Zitellini, N.: Micro-seismicity in the Gulf of Cadiz: Is there a link between micro-seismicity, high magnitude earthquakes and active faults?, Tectonophysics, 717, 226–241, 2017.
Silva, V., Crowley, H., Varum, H., and Pinho, R.: Seismic risk assessment for mainland Portugal, B. Earthq. Eng., 13, 429–457, 2015.
Sørensen, M. B., Spada, M., Babeyko, A., Wiemer, S., and Grünthal, G.: Probabilistic tsunami hazard in the Mediterranean Sea, J. Geophys. Res., 117, B01305, https://doi.org/10.1029/2010JB008169, 2012.
Sousa, M. L.: Modelos probabilistas para avaliação da casualidade sísmica em Portugal Continental, Tese de Doutoramento, Universidade Técnica de Lisboa, Instituto Superior Técnico, available at: https://sapientia.ualg.pt/bitstream/10400.1/72/1/ESTMod.pdf (last access: 14 January 2022), 1996.
Stein, J. and Stein, S.: Rebuilding Tohoku: A joint geophysical and economic framework for hazard mitigation, GSA Today, 22, 42–44, 2012.
Stein, S.: Comment on “How can seismic hazard in the New Madrid Seismic Zone be similar to that in California?” by Arthur Frankel, Seismol. Res. Lett., 76, 364–365, 2005.
Stein, S., Geller, R. J., and Liu, M.: Why earthquake hazard maps often fail and what to do about it, Tectonophysics, 562, 1–25, 2012.
Stucchi, M., Rovida, A., Capera, A. G., Alexandre, P., Camelbeeck, T., Demircioglu, M. B., Gasperini, P., Kouskouna, V., Musson, R. M. W., Radulian, M., Sesetyan, K., Vilanova, S., Baumont, D., Bungum, H., Fäh, D., Lenhardt, W., Makropoulos, K., Martinez Solares, J. M., Scotti, O., Živčić, M., Albini, P., Batllo, J., Papaioannou, C., Tatevossian, R., Locati, M., Meletti, C., Viganò, D., and Giardini, D.: The SHARE European earthquake catalogue (SHEEC) 1000–1899, J. Seismol., 17, 523–544, 2013.
Terrinha, P., Ramos, A., Neres, M., Valadares, V., Duarte, J., Martínez-Loriente, S., Silva, S., Mata, J., Kullberg, J. C., Casas-Sainz, A., Matias, L., Fernández, O., Muñoz, J. A., Ribeiro, C., Font, E., Neves, C., Roque, C., Rosas, F., Pinheiro, L., Bartolomé, R., Sallarès, V., Magalhães, V., Medialdea, T., Somoza, L., Gràcia, E., Hensen, C., Gutscher, M.-A., Ribeiro, A., and Zitellini. N.: The Alpine Orogeny in the West and Southwest Iberia Margins, in: The Geology of Iberia: A Geodynamic Approach, Series Title: Regional Geology edited by: Quesada, C. and Oliveira, J., Reviews, Springer, https://doi.org/10.1007/978-3-030-11295-0_11, 2019.
Teves-Costa, P., Ribeiro, A., Cabral, J., Ribeiro, P., Moniz, C., Matias, L., Carvalho, A., Silva, P., Moitinho, I., Marques, F. M. S. F., Carneiro, A. L., and Caetano, H.: Estudo de Risco Sísmico da Área Metropolitana de Lisboa e Concelhos Limítrofes. Relatório Final (Vol. I e Vol. II, Anexos), Instituto de Ciências da Terra e do Espaço, July 2001, 190 pp., https://doi.org/10.13140/RG.2.2.14711.96160 2001.
Teves-Costa, P., Batlló, J., Matias, L., Catita, C., Jiménez, M. J., and García-Fernández, M.: Maximum intensity maps (MIM) for Portugal mainland, J. Seismol., 23, 417–440, https://doi.org/10.1007/s10950-019-09814-5, 2019.
Veludo, I., Dias, N. A., Fonseca, P. E., Matias, L., Carrilho, F., Haberland, C., and Villaseñor, A.: Crustal seismic structure beneath Portugal and southern Galicia (western Iberia) and the role of Variscan inheritance, Tectonophysics, 717, 645–664, 2017.
Vilanova, S. P. and Fonseca, J. F.: Probabilistic seismic-hazard assessment for Portugal, B. Seismol. Soc. Am., 97, 1702–1717, 2007.
Woessner, J., Laurentiu, D., Giardini, D., Crowley, H., Cotton, F., Grünthal, G., Valensise, G., Arvidsson, R., Basili, R., Demircioglu, M. B., Hiemer, S., Meletti, C., Musson, R. W., Rovida, A. N., Sesetyan, K., Stucchi, M., and The SHARE Consortium: The 2013 European seismic hazard model: key components and results, B. Earthq. Eng., 13, 3553–3596, 2015.
Zitellini, N., Gràcia, E., Matias, L., Terrinha, P., Abreu, M. A., DeAlteriis, G., Henriet, J. P., Dañobeitia, J. J., Masson, D. G., Mulder, T., Ramella, R., Somoza, L., and Diez, S.: The quest for the Africa-Eurasia plate boundary west of the Strait of Gibraltar, Earth Planet. Sc. Lett., 280, 13–50, 2009.
- Abstract
- Introduction
- Geodynamic setting
- Earthquake generation models used in PSHA studies for W and SW Iberia
- Methodologies to evaluate the consistency between tectonic and seismic deformation
- Seismic deformation consistency tests: results and discussion
- Conclusions
- Discussion
- Data availability
- Author contributions
- Competing interests
- Disclaimer
- Acknowledgements
- Financial support
- Review statement
- References
- Supplement