the Creative Commons Attribution 4.0 License.
the Creative Commons Attribution 4.0 License.
 | 04 Apr 2022
Hydrometeorological analysis of the 12 and 13 September 2019 widespread flash flooding in eastern Spain
On 12 and 13 September 2019, a long-lasting heavy precipitation episode (HPE) affected the València, Murcia and Almería regions in eastern Spain. Observed rainfall amounts were close to 500 mm in 48 h, being the highest cumulative precipitation registered in some rain gauges for the last century. Subsequent widespread flash flooding caused seven fatalities and estimated economical losses above EUR 425 million. High-resolution precipitation estimates from weather radar observations and flood response from stream gauges are used in combination with a fully distributed hydrological model to examine the main hydrometeorological processes within the HyMeX programme. This HPE was characterized by successive, well-organized convective structures that impacted a spatial extent of 7500 km2, with rainfall amounts equal to or larger than 200 mm. The main factors driving the flood response were quasi-stationarity of heavy precipitation, very dry initial soil moisture conditions and large storage capacities. Most of the examined catchments exhibited a dampened and delayed hydrological response to cumulative precipitation: until runoff thresholds were exceeded, infiltration-excess runoff generation did not start. This threshold-based hydrological behaviour may impact the shape of flood peak distributions, hindering strict flood frequency statistical analysis due to the generally limited lengths of data records in arid and semi-arid catchments. As an alternative, a power-law relationship is analytically derived to specifically link flood magnitude to rainfall amount, with the parameters depending on basin and precipitation features. This power law could aid in developing empirical envelope curves so as to assess hydrologic risk in arid and semi-arid catchments with a threshold-based hydrological behaviour.
- Article
(1572 KB) - Full-text XML
- BibTeX
- EndNote


Flash floods are among the most devastating natural hazards in terms of economic losses and death toll worldwide (e.g., CRED 2016; Petrucci et al., 2019). In addition, the potential of flash-flood-related casualties and damages are steadily increasing in many regions due to the synergies between social and economic pressures on land use and global warming. Among other scientific goals, the Hydrological Cycle in the Mediterranean Experiment (HyMeX; http://www.hymex.org, last access: 1 April 2022) programme aims at a better understanding, modelling and forecasting of hydrometeorological extremes over the flood-prone Mediterranean region in an era of climate change (Drobinski et al., 2014).
Mediterranean Spain is impacted by heavy precipitation episodes (HPEs) that result in hazardous flash floods every year. During late summer and early autumn, the relatively high sea surface temperature is a source of heat and moisture for low-level air masses. Strong convective instability is fostered by the early entrance of mid-level cold disturbances. Subsequent deep convective systems are often anchored by the prominent orography of the region, resulting in quasi-stationary heavy rainfall over specific watersheds (Romero et al., 2000; Llasat et al., 2003; García-Herrera et al., 2005; Martín et al., 2007; Pastor et al., 2010; Hermoso et al., 2021).
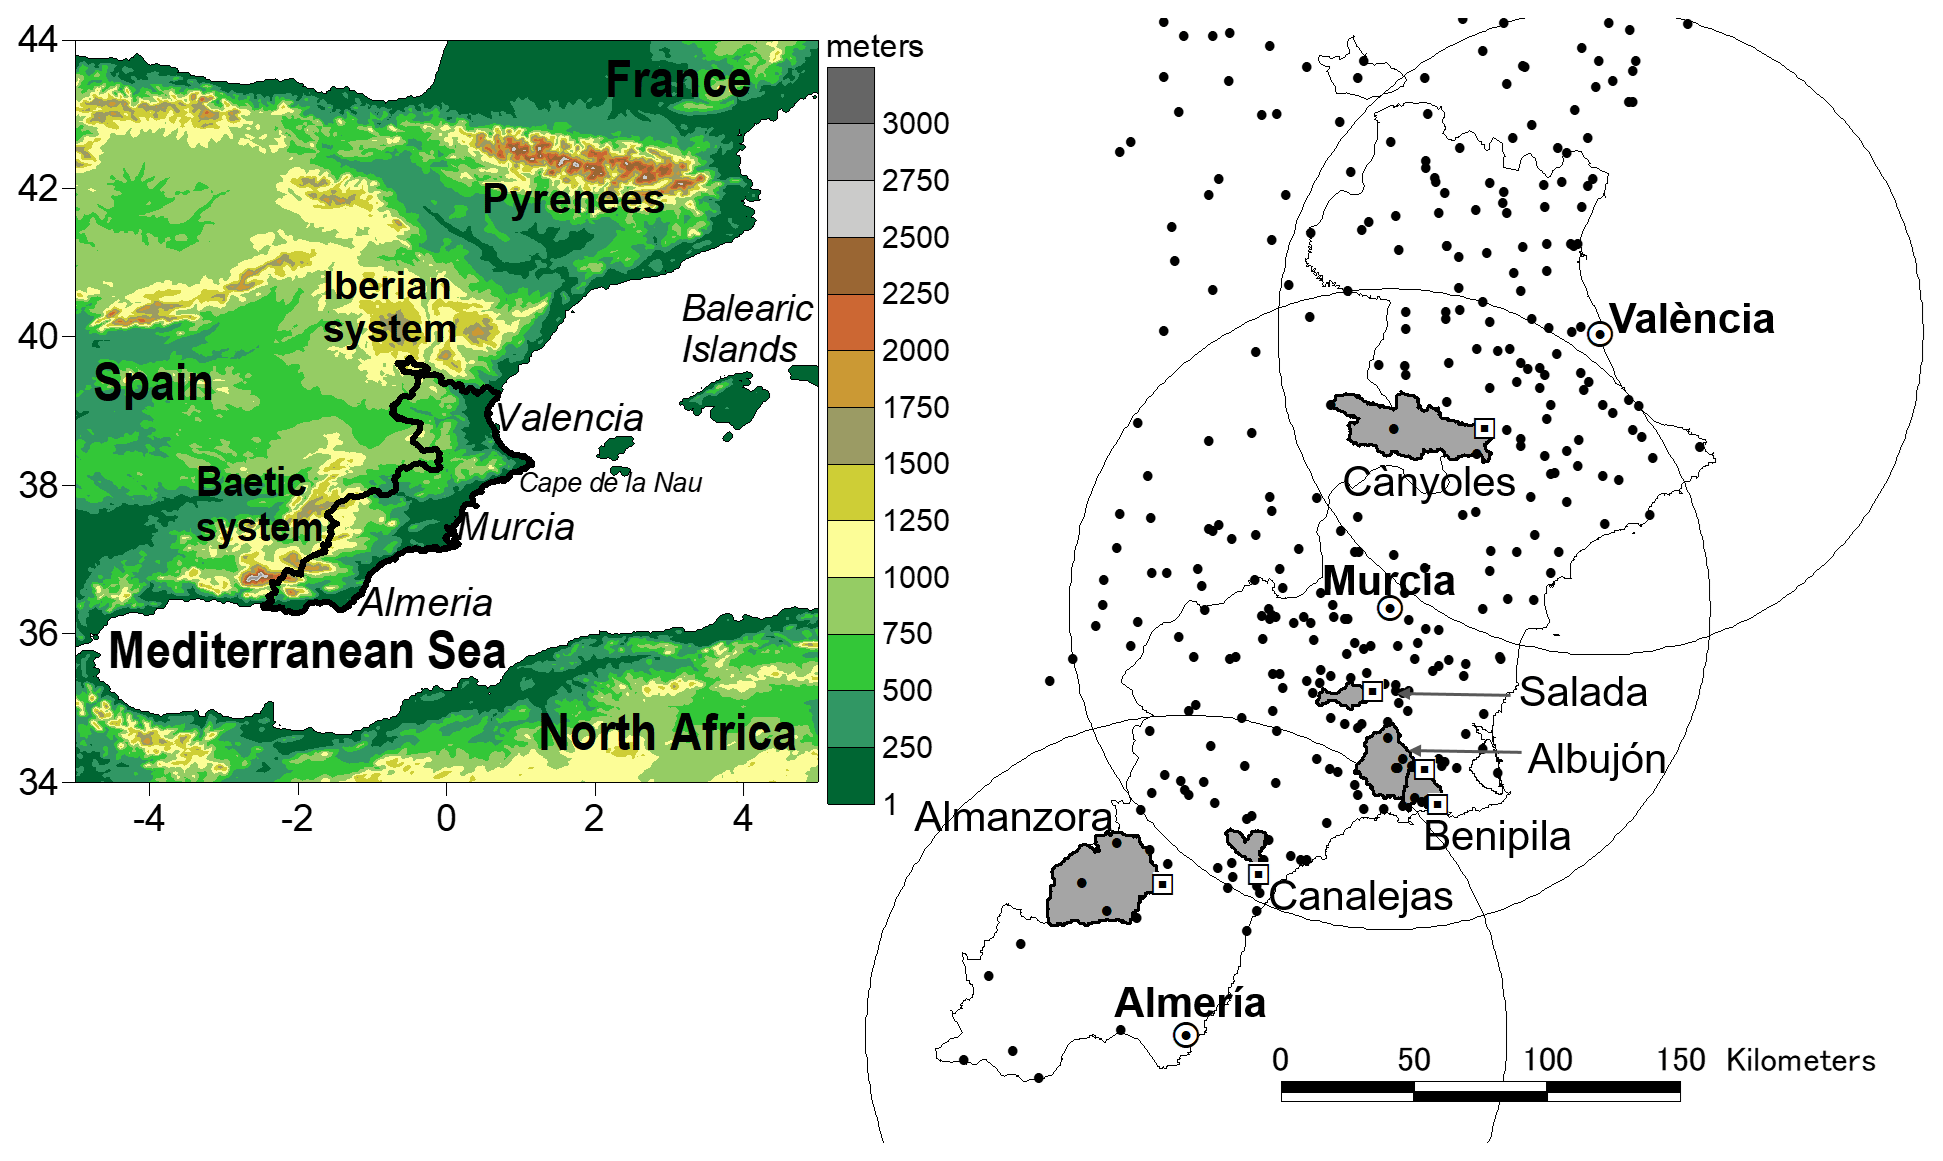
Figure 1Top left: main geographical features of the Spanish Mediterranean region. The thick black line delineates the study area. Centre right: location of the València, Murcia, and Almería radars (white dots) and the selected catchments (light grey shaded areas). Radii of the radar circles are 120 km. The 369 available automatic pluviometric stations are shown as black dots. Automatic stream gauges are depicted as white squares.
The complex and steep orography of the Spanish Mediterranean region is near the coast, shaping numerous small-to-medium, semi-arid basins (Fig. 1). These ephemeral catchments feature hydrological responses to extreme precipitation of only a few hours, reacting with an acute spatial and temporal variability. On the one hand, deep convection can lead to large rainfall rates and accumulations with an intrinsically high heterogeneity in space and time. On the other hand, thin soils, sparse vegetation, abrupt slopes and urban development can result in fast infiltration-excess runoff generation, overland and channel flows. After the long dry and warm summer, extreme rainfall rates can certainly overwhelm the initially large soil infiltrabilities, resulting in sudden flood bores routing through normally dry river beds with catastrophic effects downstream (Amengual et al., 2007, 2015; Martín-Vide and Llasat, 2018; Lorenzo-Lacruz et al., 2019).
Rainfall amount can also be an important flash-flood-triggering factor in arid and semi-arid watersheds: until runoff thresholds are exceeded, sudden infiltration-excess runoff generation is not triggered (Smith et al., 1996; Camarasa-Belmonte and Beltrán Segura, 2001; Gaume et al., 2003; Delrieu et al., 2005; Zanon et al., 2010). This threshold-type hydrological behaviour leads to a belatedly but then sudden runoff production. The catchment reacts as a system that becomes progressively saturated or as a tip-over system, with a sudden rise of runoff coefficients. Nonlinearities related to this wetting-up process result in even greater spatial heterogeneity than the conducive rainfall (Gaume et al., 2004; Borga et al., 2007). Admittedly, the physiographic and morphological properties of the Spanish Mediterranean region are also dominant factors when modulating complexity in hydrological response. Besides very dry initial soil moisture conditions, many catchments lie on very fractured and karstified bedrock. These substrates favour large water storage capacities that recharge deep aquifers via infiltration, percolation and transmission losses (Camarasa-Belmonte and Beltrán Segura, 2001; Camarasa-Belmonte, 2016; Amengual et al., 2017).
A better understanding of the impact of the geomorphological characteristics of arid and semi-arid catchments under flash-flood conditions could help to build up more homogeneous datasets for regional frequency studies. In Spain, hydrological design and flood risk management rely on estimating quantiles of peak discharges characterized by low annual exceedance probabilities. That is, flood frequency analysis is carried out by identifying which analytical statistical distributions reproduce better the cumulative distribution functions of extreme flood peaks based on long-term observations of annual maximum discharges (Álvarez et al., 2012). The better fit is mainly observed for the generalized extreme value (GEV) distribution, which is also extensively used for flood frequency analysis in many other regions worldwide (Hosking et al., 1985; Martins and Stedinger, 2000; Katz, 2002; Villarini and Smith, 2010; Rahman et al., 2013; Solari et al., 2017). However, dense observational networks with long-term discharge series are scarce in arid and semi-arid basins. When flow records are not long enough to perform a strict statistical analysis or basins are ungauged, multiple regression analysis or hydrometeorological simulations can be used to transfer flood quantiles from catchments with long-term data records to watersheds with hydrological similarity. This procedure aims at providing a continuous and useful mapping of flood risks for civil protection decision makers.
Admittedly, hydrological response based on a threshold-type behaviour may affect the shape of flood peak distributions. Moreover, arid and semi-arid watersheds feature a very limited number of floods per year but exhibit a large variability in peak discharge as different rainfall rates and amounts trigger floods with uneven specific peak discharges (Gaume et al., 2004). Therefore, it is difficult to extrapolate flood quantile data from well-monitored basins to similar catchments with limited observations. In addition, Metzger et al. (2020) concluded that the GEV and Pareto distributions for estimating flood frequency over arid and semi-arid watersheds provide poorer estimates of extreme quantiles when compared with those derived over basins in more humid climates. That is, hydrological response appears to be further away from this asymptotic behaviour, exacerbating the challenges faced by practitioners in flood design and risk management through frequency analysis. In this context, the metastatistical extreme value (MEV) framework has arisen as an emerging approach to overcome these limitations (Marani and Ignaccolo, 2015). This methodology lessens the asymptotic assumption on the number of floods per year and allows the identification of the statistical model parameters from a largely increased data sample, ameliorating difficulties associated with short record lengths (Zorzetto et al., 2016; Marra et al., 2018; Miniussi et al., 2020). More recently, Marra et al. (2019) has presented a simplified version of the MEV, in which inter-annual variations are neglected and extremes are described as functions of the average properties of multiple underlying processes, resulting in enhanced estimates of flood peak discharge distributions in the presence of a limited number of floods per year.
Another approach is to delve into scale-invariant behaviours that allow the prediction of peak magnitude as an alternative to flood frequency analysis when long-term stream flow records are not available. In effect, some authors have pointed out that although rainfall–runoff processes governing flash floods in arid and semi-arid basins, such as convectively driven precipitation, infiltration-excess runoff, and surface water movement in hillslopes and channels, are highly variable in space and time, the aggregated behaviour of peak flows exhibits certain scale invariances with the parameters representing catchment and rainfall properties (e.g., Gupta and Dawdy, 1995; Ogden and Dawdy, 2003; Gupta, 2004; Furey and Gupta, 2005, 2007; Gaume et al., 2009; Marchi et al., 2010; Schumer et al., 2014). For instance, Ogden and Dawdy (2003) observed that flood peak quantiles exhibit self-similarity with catchment area on an event-by-event basis for a small watershed with an infiltration-excess runoff response to convective precipitation. After examining long-term flow series in 28 arid and semi-arid basins across the southwestern United States, with areas ranging from 2 to 1256 km2, Schumer et al. (2014) showed the existence of an empirical power law relating peak discharge to direct runoff volume for a given event duration. Both studies empirically derived envelope curves so as to appraise the upper bound of flood magnitudes depending on the selected physical variable. Envelope curves have the advantage of being relatively unaffected by data limitations as they are determined by the maximum values of a sample.
The case under study unfolded from 11 to 14 September 2019, although the heaviest precipitation took place on 12 and 13 September: 10 min rainfall amounts were above 25 mm in several automatic rain gauges, with a maximum 48 h observed amount of 492 mm (Hermoso et al., 2021). Subsequent widespread flash flooding devastated wide areas of the València, Murcia and Almería regions in eastern Spain (Fig. 1): the death toll was seven, hundreds of dwellings were evacuated and economic losses were estimated above EUR 425 million (CCS, 2019). The 12–13 September 2019 HPE represents a prototype in terms of well-organized and sustained convective systems leading to the most catastrophic flash floods over the Spanish Mediterranean area. In line with previous flash-flood monographs (e.g., Smith el at., 1996, 2000; Ogden et al., 2000; Gaume et al., 2003, 2004; Delrieu et al., 2005; Borga et al., 2007, Zanon et al., 2010), the first objective is to examine the main rainfall and runoff processes that concurred in the unfolding of this extreme episode. To this aim, high-resolution quantitative precipitation estimates (QPEs) derived from weather radar observations and flood measurements from automatic stream gauges are used together with a fully distributed hydrological model.
A remarkable characteristic of the 12–13 September 2019 extreme episode was the dampened and delayed hydrological response to heavy precipitation of most catchments examined, pointing out cumulative precipitation as the dominant flash-flood-triggering mechanism. Within the framework of previous research, the second objective is to delve into simple scaling theory between flood magnitude and rainfall amount. Next, the potential of this approach is preliminarily examined for hydrological risk assessment over the selected semi-arid catchments. In addition, the large spatial extension of this long-lasting HPE together with the contrasting physiography and morphology of the selected basins also permits cross-validations and inter-comparisons among their hydrological responses (Fig. 2). Both objectives are framed within the main scientific goals of the heavy-rainfall, flash-floods and floods section of HyMeX.

Figure 2Top left: main physical features and climatological water balance of the catchments at the examined stream gauges. L stands for the length of the main river channel. Tc is the time of concentration computed according to Amengual et al. (2021). Data for hydrologic balance come from the Spanish Ministry of Agriculture. Water balance was calculated for the 1941–2006 period. Further information can be found at https://www.miteco.gob.es/es/cartografia-y-sig/ide/descargas/agua/simpa.aspx (last access: 1 April 2022). Centre right: the selected catchments are shown as light grey shaded areas. Automatic stream gauges are depicted as white squares.
2.1 Selected catchments: an overview
The region of interest extends over 36 700 km2, dominated by the Baetic mountainous system (Fig. 1). This highly rugged relief is very close to the coast, directly sinking into the Mediterranean Sea. As a result, many small-to-medium ephemeral catchments – called Ramblas in eastern Spain – spread over the selected area. Annual rainfall amounts are characterized by a decrease from north to south, passing from nearly 700 mm to less than 300 mm (Fig. 2). Conversely, annual mean temperature increases from 16 ∘C in the north to 18 ∘C in the south. According to the Köppen–Geiger classification, the dominant climate is either hot or cold semi-arid (BSh/BSk), although the northernmost part is categorized as hot- and dry-summer Mediterranean (CSa) while some limited areas of the Almería coast are classified as hot desert (BWh; Chazarra-Bernabé et al., 2018).
The northernmost Cànyoles watershed settles over extensive karstified limestone, carbonate and dolomitic fractured bedrock, favouring the recharge of deep calcareous aquifers (Sese-Minguez et al., 2017). The Rambla Salada basin lies on bedrock weakness primarily made up of marls in a badland area. Being located in a semi-arid climate, the long and recurrent drought periods produce the generation of a dense network of desiccation cracks on the surface. As a consequence, the hydrological response of the Rambla Salada is strongly modulated by (i) exacerbating infiltration rates and (ii) stemming overland flow (Cerdà, 1995). The Rambla del Albujón features deep and silty soils with low perviousness (Fig. 2). However, current intensive agricultural practices have notably increased soil drainage and water storage (García-Pintado et al., 2009).
Soil profiles are profound and have medium to high permeability over the Rambla de Benipila. Nowadays, its eastern part is also devoted to intensive agricultural production. This watershed lies over marble, mica schist, quartzite, gneiss, phyllite and plaster bedrock. The Rambla de Canalejas is mainly located on dendritic and quaternary formations with medium-to-high perviousness. Other portions of the drainage area lie on mica schist, quartzite, phyllite and plaster bedrock (IGME, 1993). The mountainous headwaters of the Almanzora catchment are also settled over carbonate, limestone and dolomitic fractured bedrock, leading to large infiltrabilities that feed deep aquifers (Vallejos et al., 1994). Being hydraulically disconnected of the underlying aquifers, all these river basins feature very irregular regimes. Most of their tributaries are dry and hydrologically active during flash floods. Note that for discussion purposes the Ramblas Salada, del Albujón and de Benipila are grouped as the central catchments. Accordingly, the Rambla de Canalejas and Almanzora watersheds are labelled as the southern basins (Fig. 2).
2.2 Quantitative precipitation estimates
QPEs are derived from the reflectivity volume scans of the Almería, Murcia and València Doppler C-band radars from 11 to 14 September at 00:00 UTC (Fig. 1). Spatial resolution is 1 km in range and 0.8∘ in azimuth. A complete volume scanning is performed every 10 min, with a maximum range of 240 km. Volume scanning is affected by the complex orography of the region. Therefore, partial beam occlusion is amended by numerically simulating the beam power percentage blocked by the rugged topography. This amelioration is carried out by numerically modelling beam propagation over a high-resolution digital terrain model (Pellarin et al., 2002). Signal attenuation by heavy rain is also corrected by means of the mountain reference technique (Bouilloud et al., 2009). Next, quantitative rainfall estimations are obtained by applying the standard WSR-88D convective rainfall-rate–reflectivity relationship (i.e., ; Hunter, 1996; Fulton et al., 1998).
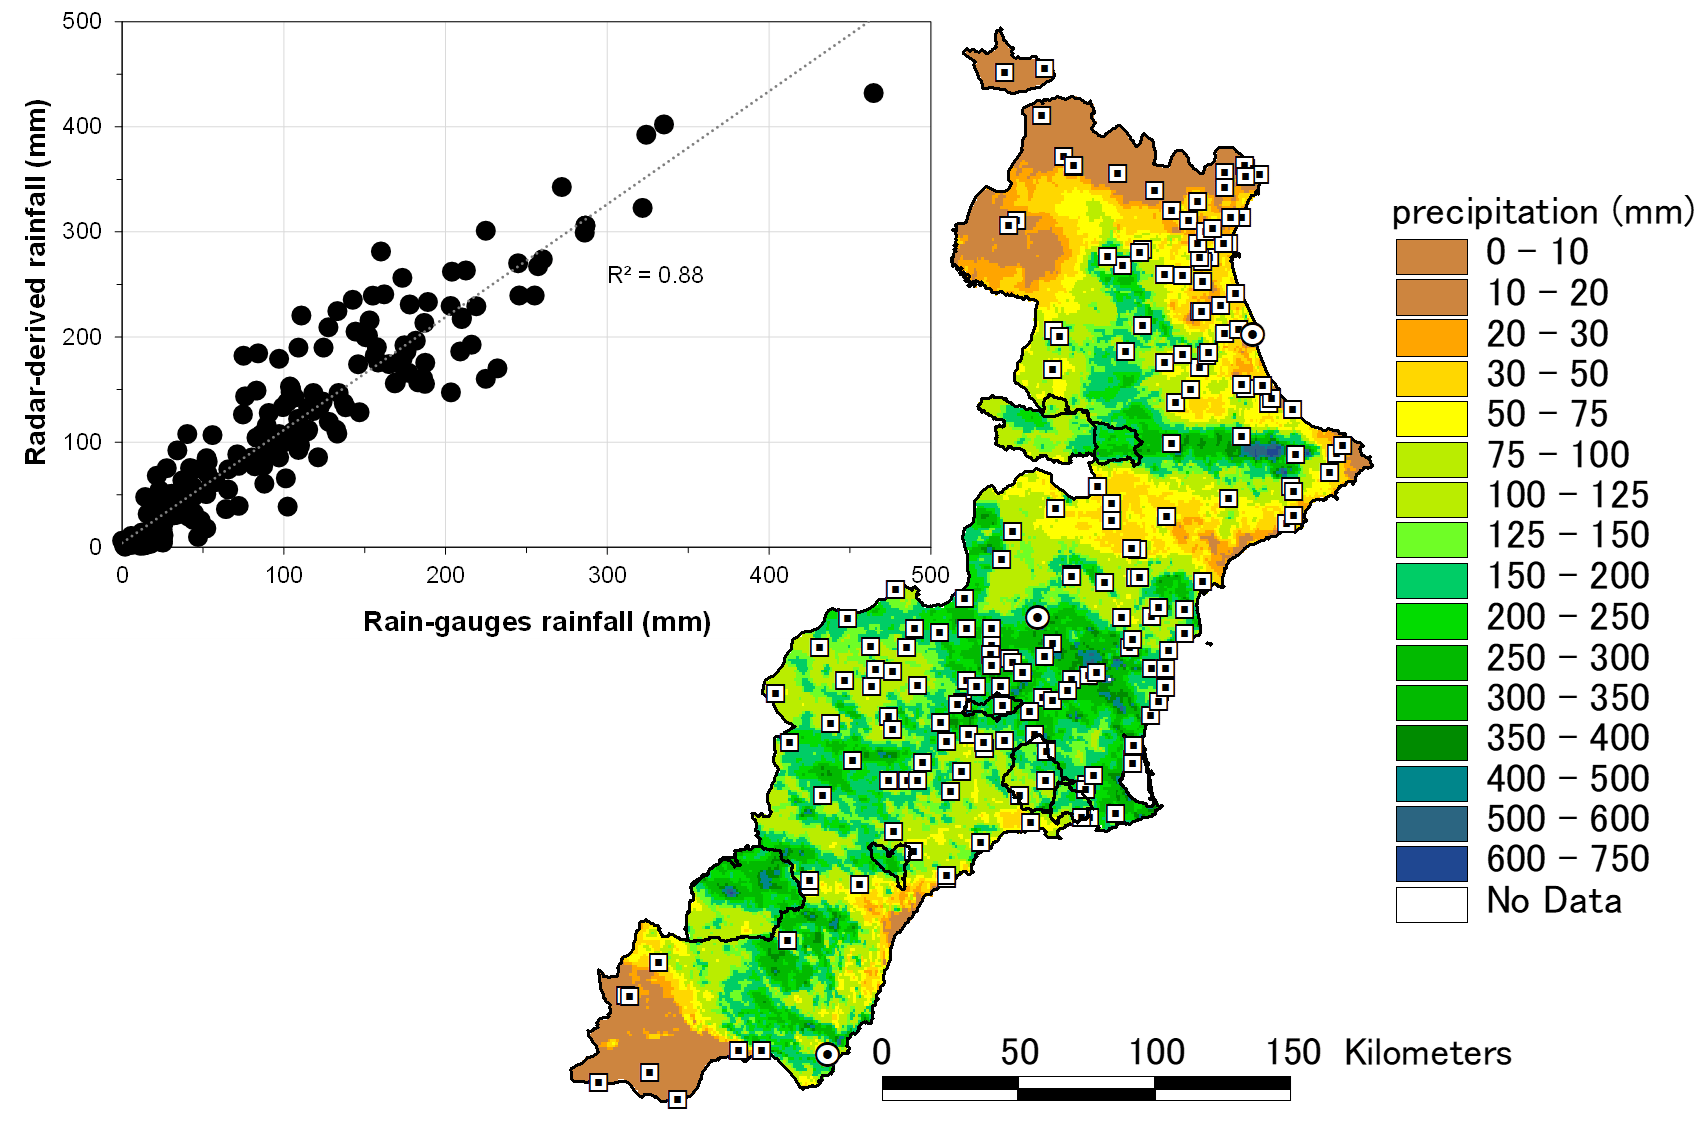
Figure 3Top left: scatterplot of the 48 h radar rainfall estimates against observed accumulations by the daily rain-gauge network. Centre right: spatial distribution of the 48 h accumulated radar-estimated precipitation from 12 to 14 September 2019 at 00:00 UTC over the study region. Thick black lines denote hydrographic basins. White squares stand for daily pluviometric stations. White dots show the position of weather radars.
As radar quantitative precipitation estimation entails large uncertainties (e.g., Gochis et al., 2015), additional inaccuracies in the hourly cumulative rains and patterns are amended by using a dynamical fitting to the 369 automatic pluviometers available over the region of interest (Fig. 1). This dynamic method consists of a pluviometer-adjusted radar rainfall estimator by employing a gridded multi-quadric surface fitting which varies in time and space. The gauge-adjustment factors are computed as the modified ratio of the observed and radar-estimated rainfall rates at a certain rain gauge by using two incidental parameters (Cole and Moore, 2008). Finally, an independent safety check is performed by comparing the 48 h radar-derived precipitation against observations by 227 independent daily pluviometers belonging to a different rain-gauge network than those measuring the automatic pluviometric data (Figs. 1 and 3). Statistical comparison between both databases exhibits a strong positive correlation (R2=0.88; Fig. 3), even if QPEs feature a slight mean underestimation of 11.1 %.
3.1 Quantification of the spatial and temporal variability in rainfall
The role of the spatial and temporal variability of rainfall in controlling flood response at the catchment scale is assessed by means of the spatial moments of catchment rainfall (Zoccatelli et al., 2011). The spatial moments detail the rainfall organization over the basin in terms of concentration and dispersion statistics, as a function of the distance measured along the flow path. Next, the mathematical formulation of the spatial moments of catchment rainfall is briefly revised.
The flow distance (d(x,y)) is defined as the path length from a given position (x,y) to the catchment outlet. The nth spatial moment of the rainfall field () is introduced as
where A stands for the drainage area and t for time. The zeroth-order spatial moment (p0(t)) renders the average catchment rainfall intensity at time t. Likewise, the nth-order moment of the flow distance (gn) is introduced as
The first two orders of the non-dimensional spatial moments of catchment rainfall are given by
The first-order scaled moment (δ1(t)) measures the distance between the catchment rainfall and basin centroids. Values of δ1(t) close to 1 indicate either a rainfall distribution located near the position of the watershed centroid or spatially uniform. δ1(t) smaller (greater) than unity reflects that rainfall is distributed near the basin outlet (headwaters). The second-order scaled moment (δ2(t)) accounts for the dispersion of the precipitation-weighted flow distances about their mean value with respect to the scattering of the flow distances. Values of δ2(t) close to the unity point out to a uniform-like precipitation pattern, with values less (greater) than 1 indicating that the rainfall pattern features a unimodal (multimodal) distribution along the flow distance (Zoccatelli et al., 2011).
3.2 The distributed hydrological model and calibration strategy
Hydrologic response is analysed by using the event-based and fully distributed kinematic local excess model (KLEM; Da Ros and Borga, 1997). This hydrological model accounts for properties in topography, soil and vegetation. Runoff rate () at a given location and time () is computed from precipitation rate () by employing the Soil Conservation Service curve number method (CN; USDA, 1986). The identification of the drainage network requires the characterization of hillslope and channelled paths by means of a threshold area procedure for catchment channelization. Next, the description of drainage system response is used to represent runoff routing (Giannoni et al., 2003). Discharge (Q(t)) at any location along the stream is calculated as
where A represents the drainage area to the specific outlet location and τ(x,y) is the routing time from point (x,y) to the outlet of the catchment. τ(x,y) is defined as
where Lh(x,y) stands for the distance from the generic basin location (x,y) to the channel network following the steepest descent path and Lc(x,y) is the length of the subsequent channel path to basin outlet. That is, surface and channel flow routing depend on two constant velocities along the hillslopes (vh) and channels (vc) of the drainage network. KLEM models baseflow by using a linear conceptual reservoir based on the Horton–Izzard equation (Moore and Bell, 2002).
Landscape morphologies and soil properties are described by a 25 m grid size cell. Curve numbers are derived from lithology and land use maps, set to dry antecedent moisture conditions (i.e., AMC I) and kept constant during the calibration process (Table 2). The hydrological model is driven by the 10 min radar-derived QPEs from 18:00 UTC on 11 September to 00:00 UTC on 15 September. The computational model time step is the same that the 10 min radar-observing frequency.
Calibration tasks addresses peak discharge, time to peak and runoff volume, which are mainly modulated by the infiltration and the hillslope and channel flow velocities. The CN model is considered as a suitable conceptual scheme to describe the runoff-generating processes associated with the 12–13 September 2019 episode. Recall that direct runoff volume (Vr(t)) only depends on cumulative precipitation (P(t)) at a specific time from the beginning of the storm (t; Maidment, 1993):
where Ia denotes the runoff threshold and S represents the soil retention capacity. S is a site storage parameter described by the curve number, while Ia is defined as a fraction of S (Ponce and Hawkins, 1996):
where S0 stands for the infiltration storativity and λ is the initial abstraction ratio. S0 and λ are considered as adjustment parameters so as to better deal with the initial very dry soil conditions and large storage capacities. Calibration of S0 and λ enables the correct simulation of the observed water balance (Borga et al., 2007). Heterogeneities in hydraulics have been encompassed by calibrating the hillslope and channel flow velocities (Table 2).
3.3 Scale dependency between flood magnitude and rainfall amount: analytical framework
A fundamental research topic in hydrometeorology is to delve into the physical basis of observed self-similarity linking peak discharge to other physical variables. As runoff and flow routing processes are scale-dependent on cumulative precipitation in extreme flash flooding, the connection between flood magnitude and total rainfall amount is investigated through scale invariance. Schumer et al. (2014) observed that a power-law relationship links peak discharge (Qp [m3 s−1]) to total flow volume (Vr [m3]) for a given episode duration in arid and semi-arid basins dominated by infiltration-excess runoff generation:
where the regression coefficient (a, [sb m]) is the reduced discharge volume and b is the flood-scaling exponent. Direct runoff volume and cumulative precipitation for the same episode and duration are also related as
where A [km2] is the drainage basin, Cr [–] is the event runoff coefficient, P [mm] is the total catchment-average rainfall amount and is for unit conversion. By combining Eqs. (10) and (11), specific peak discharge (qp [m3 s−1 km−2]) is related to cumulative precipitation by the following scaling law:
where the regression coefficient (α [m3 s−1 km−2 mm−β]) is the reduced specific peak discharge and β is the flood-scaling exponent. Equations (10) and (12) exhibit an inverse relationship between the algebraic exponents of both power laws. Schumer et al. (2014) also indicated that parameters a and b are related to catchment and rainfall properties. This assumption can be readily checked by considering the limiting case of a linear dependence between flood magnitude and total precipitation (i.e., β=1). In this particular limit, Eqs. (10) and (12) become
where a in Eq. (13) matches the definition of flood timescale (TQ [s]) introduced by Gaál et al. (2012):
Therefore, Eq,~̇(14) can be expressed as follows:
where I [mm s−1] is the storm- and basin-average rainfall rate and Tm [s] denotes the storm duration. R [mm s−1] stands for the storm- and catchment-average excess rainfall, tQ [s] corresponds to the timing of runoff (i.e., the characteristic time over which runoff is distributed), and Var(tQ) is the temporal dispersion of the runoff hydrograph. The inverse of the temporal dispersion of the runoff hydrograph measures the peakedness of the hydrograph. Viglione et al. (2010) found that an almost mathematical equality stands between the flood timescale and standard deviation of timing in runoff. Equation (16) is the response number, a measure of flood peak magnitude also defined by Viglione et al. (2010). In this limiting case, the scaling relationship becomes the response number, which integrates the joint effect of runoff coefficient and hydrograph peakedness in determining flood peak.
In the general case, Eq. (12) assesses the nonlinear interaction between storm properties and hydrologic processes for particular arid or semi-arid catchment specificities by only considering two integrated variables: specific peak discharge and cumulative precipitation. Regression coefficients and flood-scaling exponents differing from unity quantify the degree at which basins filter spatial and temporal variability in rainfall. On the one hand, as an increased precipitation amount results in an enhanced efficiency of the rainfall–runoff processes, basins are expected to have flood-scaling exponents greater than 1. On the other hand, heterogeneities in soil and underlying substrate anticipate regression coefficients much smaller than unity. The smaller the reduced specific peak discharge, the larger the impact of these features on the nonlinear hydrological response. Finally, the power-law relationship also allows examining how precipitation amount modulates flood magnitude for different return periods.
4.1 Precipitation analyses
4.1.1 Spatial and temporal distribution of rainfall at a large scale
According to the 48 h radar-derived rainfall, maximum cumulative precipitation is well above 200 mm in all the concerned basins (Fig. 3b). The highest rainfall amounts are located in the Cànyoles and Almanzora catchments, where the lifting associated with topographic forcing enhances precipitation, with values well above 500 mm. In terms of the area sizes over which a given amount of rainfall is exceeded, the spatial extents above the 200, 400 and 600 mm thresholds are roughly of 7500, 375 and 20 km2, respectively. A striking characteristic of this HPE is the vast extension of the precipitation amounts equal to or greater than 200 mm, as a consequence of the convection activity being exceptionally active and long-lasting. For instance, the spatial extent impacted by precipitation amounts above 200 mm was about 5500 km2 for the flash-flood episode on 8–9 September 2002 in the French region of Gard (Delrieu et al., 2005). However, this episode featured areas over which the 400 and 600 mm thresholds were exceeded considerably, of 1600 and 170 km2, respectively.
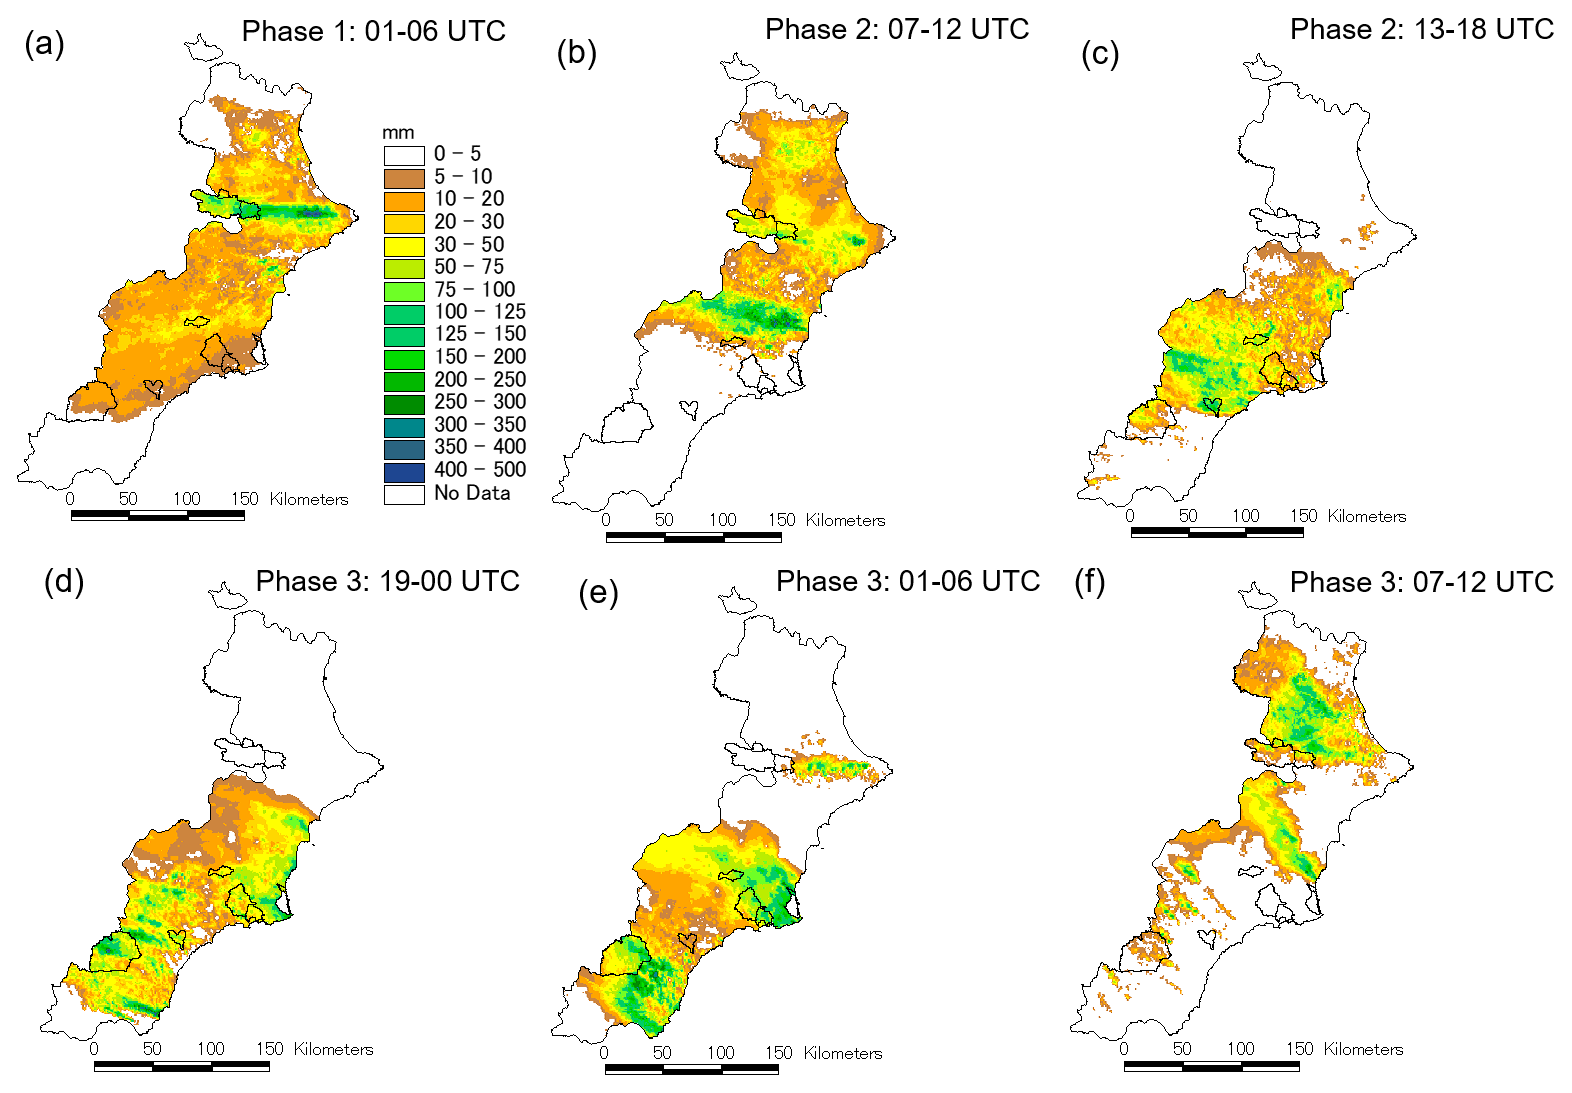
Figure 4Spatial distribution of 6 h cumulative radar-estimated rainfall corresponding to (a) 01:00–06:00 UTC, (b) 07:00–12:00 UTC, and (c) 13:00–18:00 UTC on 12 September 2019; (d) from 19:00 UTC on 12 September 2019 to 00:00 UTC on 13 September 2019; and (e) 01:00–06:00 UTC and (f) 07:00–12:00 UTC on 13 September 2019. Thick black lines denote the catchments of interest.
Hermoso et al. (2021) divided the 12–13 September 2019 episode in the following three distinct phases.
-
Phase 1 (00:00–06:00 UTC on 12 September). The spatial signature of the thin convective band responsible of heavy rainfall over the northern part of the region of interest is clearly visible in the 6 h cumulative radar-derived rainfall amounts (Fig. 4a). Torrential precipitation exhibited maximum 10 min and 6 h accumulations of 16 and 210 mm, respectively. This persistent and elongated convective system produced extreme rainfall that lasted for approximately 6 h.
-
Phase 2 (06:00–18:00 UTC on 12 September). A linear structure of convection resulted in intense rainfall over the central part of the domain. This prominent convective system brought a maximum precipitation of 180 mm in 6 h, whereas peak 10 min intensity was above 20 mm, according to the automatic pluviometric stations. In the afternoon, moderate rainfall rates persisted over southern València and western Murcia and Almería (Fig. 4b and c).
-
Phase 3 (19:00 UTC on 12 September to 12:00 UTC on 13 September). The most intense convective activity formed during this phase, including a quasi-stationary and V-shaped mesoscale convective system (MCS). During its mature stage, the coastal lands of Murcia were affected by hourly intensities up to 146 mm and 10 min recordings exceeding 30 mm. In western Almería, rainfall-band structures led to maximum 6 h amounts above 200 mm (Fig. 4d and f).
Hermoso et al. (2021) also examined the main torrential features of this HPE over the studied basins. To this end, this work explored (i) the link between maximum 30 min rainfall rates and cumulative precipitation and (ii) the percentage of total rainfall amount with 30 min rates > 20 mm h−1. The northern and central catchments were impacted by the strongest and lasting rains during phases 1 and 3. The large values of the total precipitation percentage exhibiting large intensities revealed the quasi-stationary aspect of the convective bands. Another striking property is that some automatic rain gauges were affected by major convective precipitation for most of the complete duration of the 12–13 September 2019 HPE. That is, eight pluviometers measured the 60 percent of rainfall amounts above 300 mm under heavy-rainfall conditions over the northern and central watersheds. The southern basins were also impacted by extreme rainfall rates but were short-lived.
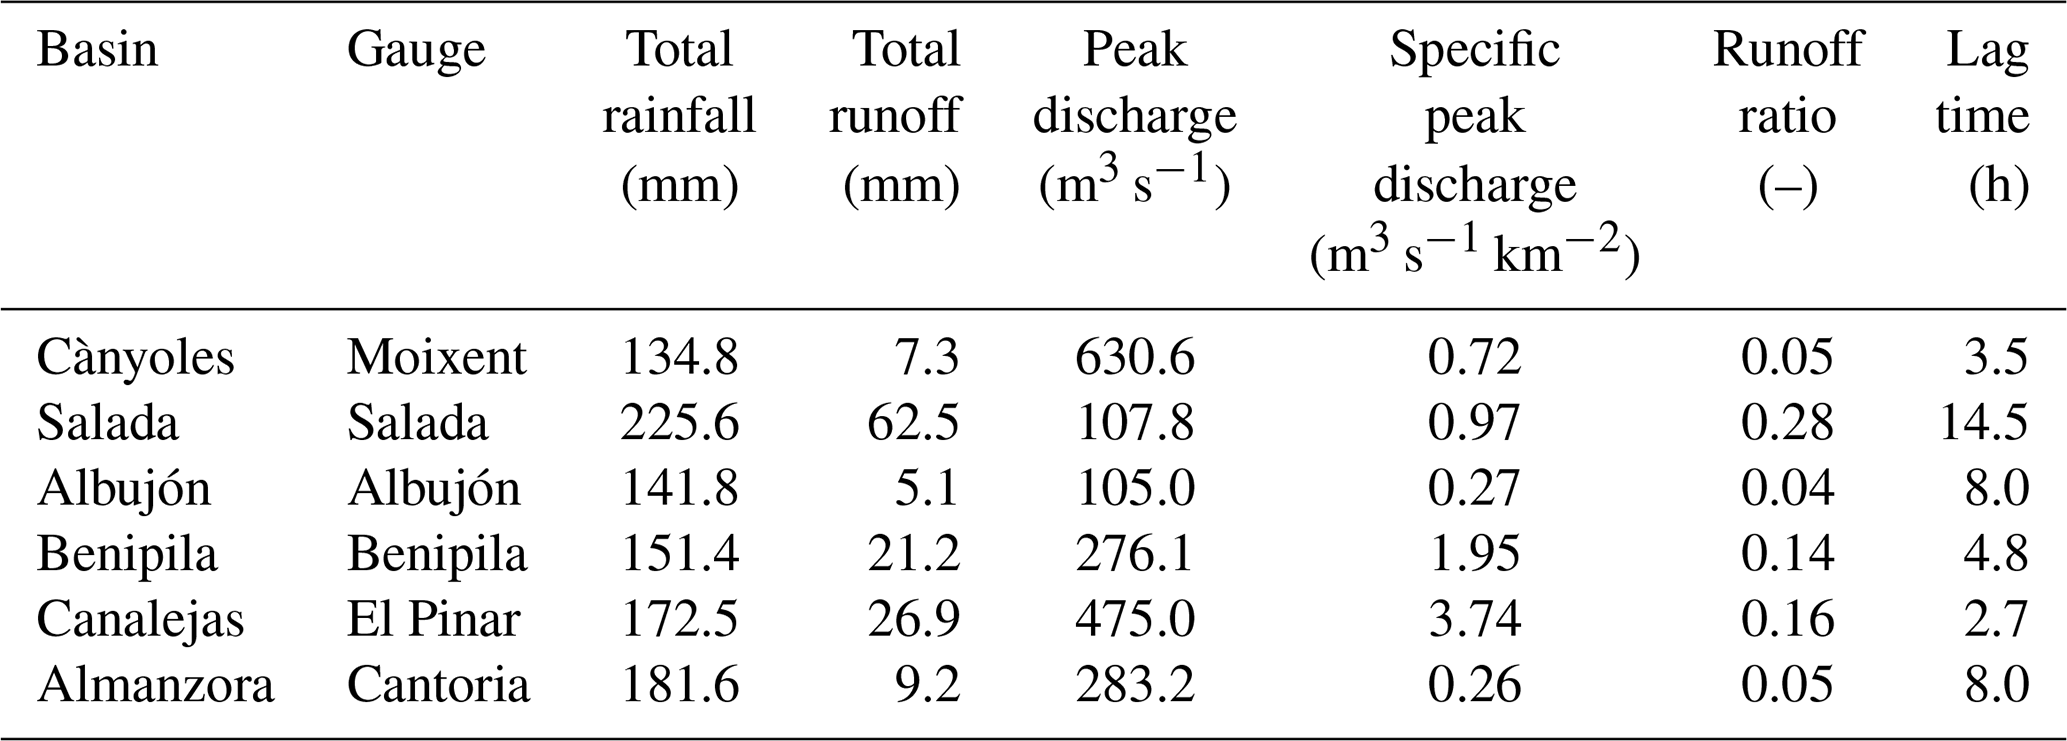
Table 1Main hydrometeorological features of the 12–13 September 2019 widespread flash flooding for the different hydrometric sections of the selected catchments. Total rainfall amounts are radar-derived and are expressed as area-averaged values over the basins. Lag time is computed as the temporal difference between the rainfall and runoff centres of mass.
The different spatial and temporal scales of strong convective activity resulted in a self-similar organization between maximum 30 min rainfall rates and total precipitation amounts over the region (Fig. 5). This scale-invariant behaviour is related to the spatial structure, temporal evolution, orographic enhancement and quasi-stationarity of the rainfall patterns. It is also likely that particular rainfall organizations, in which long-lasting convective clusters of very high rainfall rate were embedded in not-so-persistent convective clusters of lower precipitation intensity, which were, in turn, embedded in still shorter convective cells of even lower rainfall rate, contribute to self-similarity. After applying an ordinary-least-squares (OLS) regression, the scaling intercept and exponent are 1.02 [mm1−b h−1] and 0.72, respectively, with a squared correlation coefficient of 0.86 (Fig. 5). The statistical significance of the OLS regression model is checked by means of the p value, while uncertainty is quantified by using a non-parametric bootstrapping method (Hall et al., 2004). To this end, 1000 samples with replacement among the data are performed. Both tests confirm the robustness of the scaling relationship between maximum 30 min rainfall intensity and cumulative precipitation for the 12–13 September 2019 HPE, with a p value less than 0.01. Furthermore, the 95 % confidence interval of the reduced rainfall rate is (0.95–1.01) [mm1−b h−1], while for the scaling exponent is (0.69–0.75).
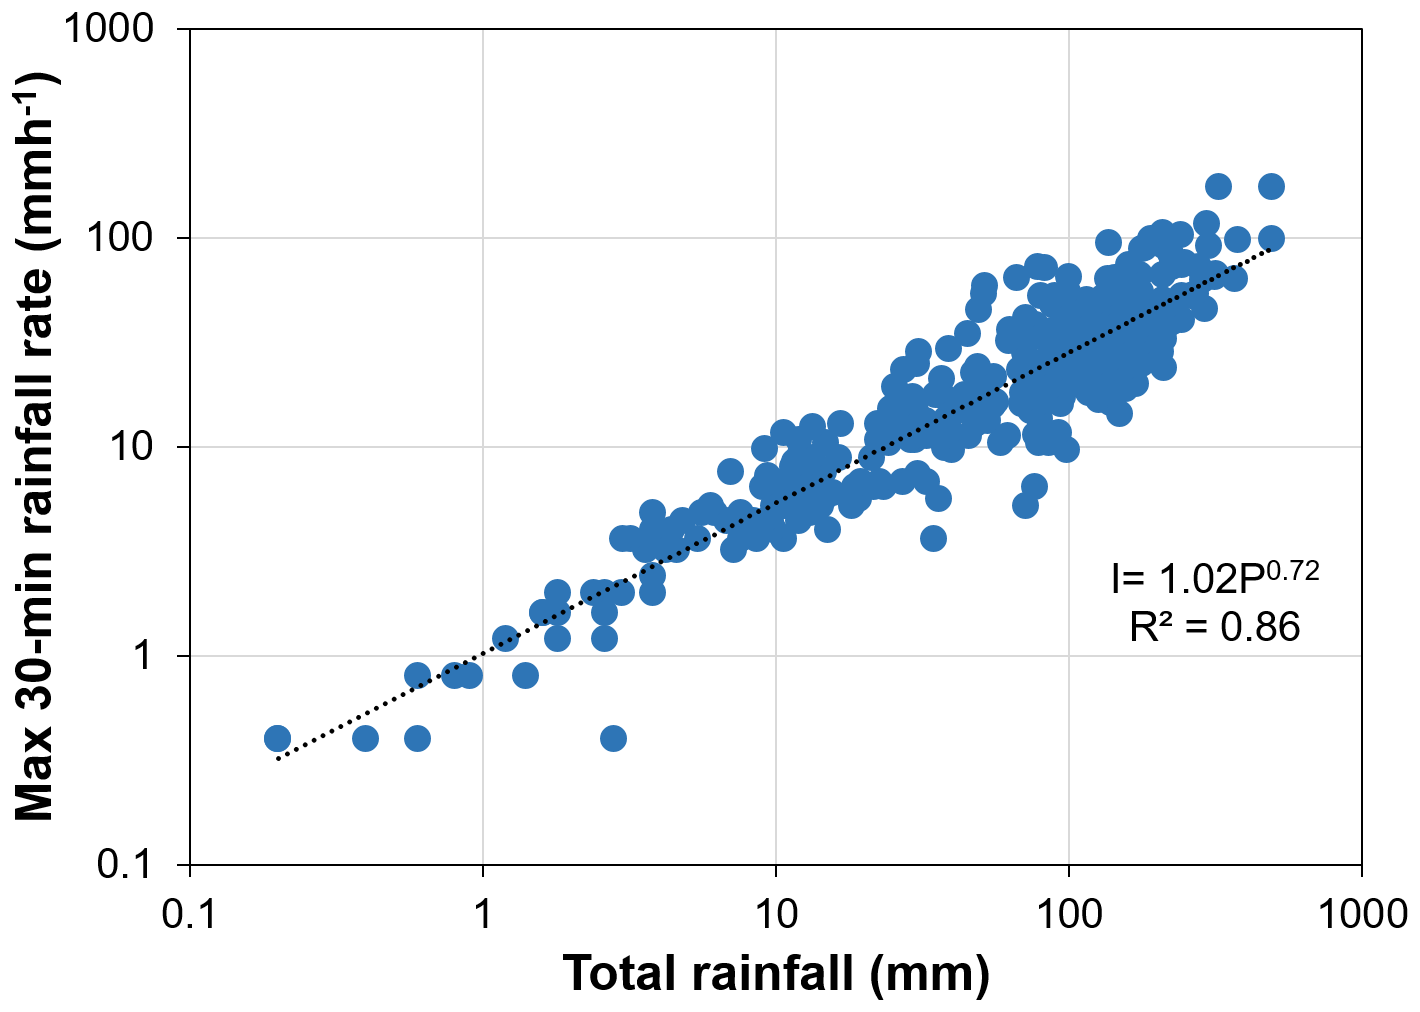
Figure 5Maximum 30 min rainfall rates versus total rainfall amounts from 12 to 14 September 2019 at 00:00 UTC for the 369 automatic rain gauges located inside the area of interest.
4.1.2 Spatial and temporal distribution of rainfall at the catchment scale
Besides the spatio-temporal distribution of rainfall at the catchment scale given by the spatial moments of catchment rainfall, the temporal sequence of the spatial arrangement in precipitation with respect to catchment morphology is also assessed (Figs. 6 and 7). To this end, the hourly time series of the basin-area average precipitation, the fractional coverages of each catchment impacted by hourly rainfall rates larger than 20 mm h−1, and the first and second spatial moments are computed for the selected watersheds. Note that the fraction of a basin affected by intense downpours links the precipitation and watershed scales, being an essential promoter to flood response (Smith et al., 2002; ten Veldhuis et al., 2018).
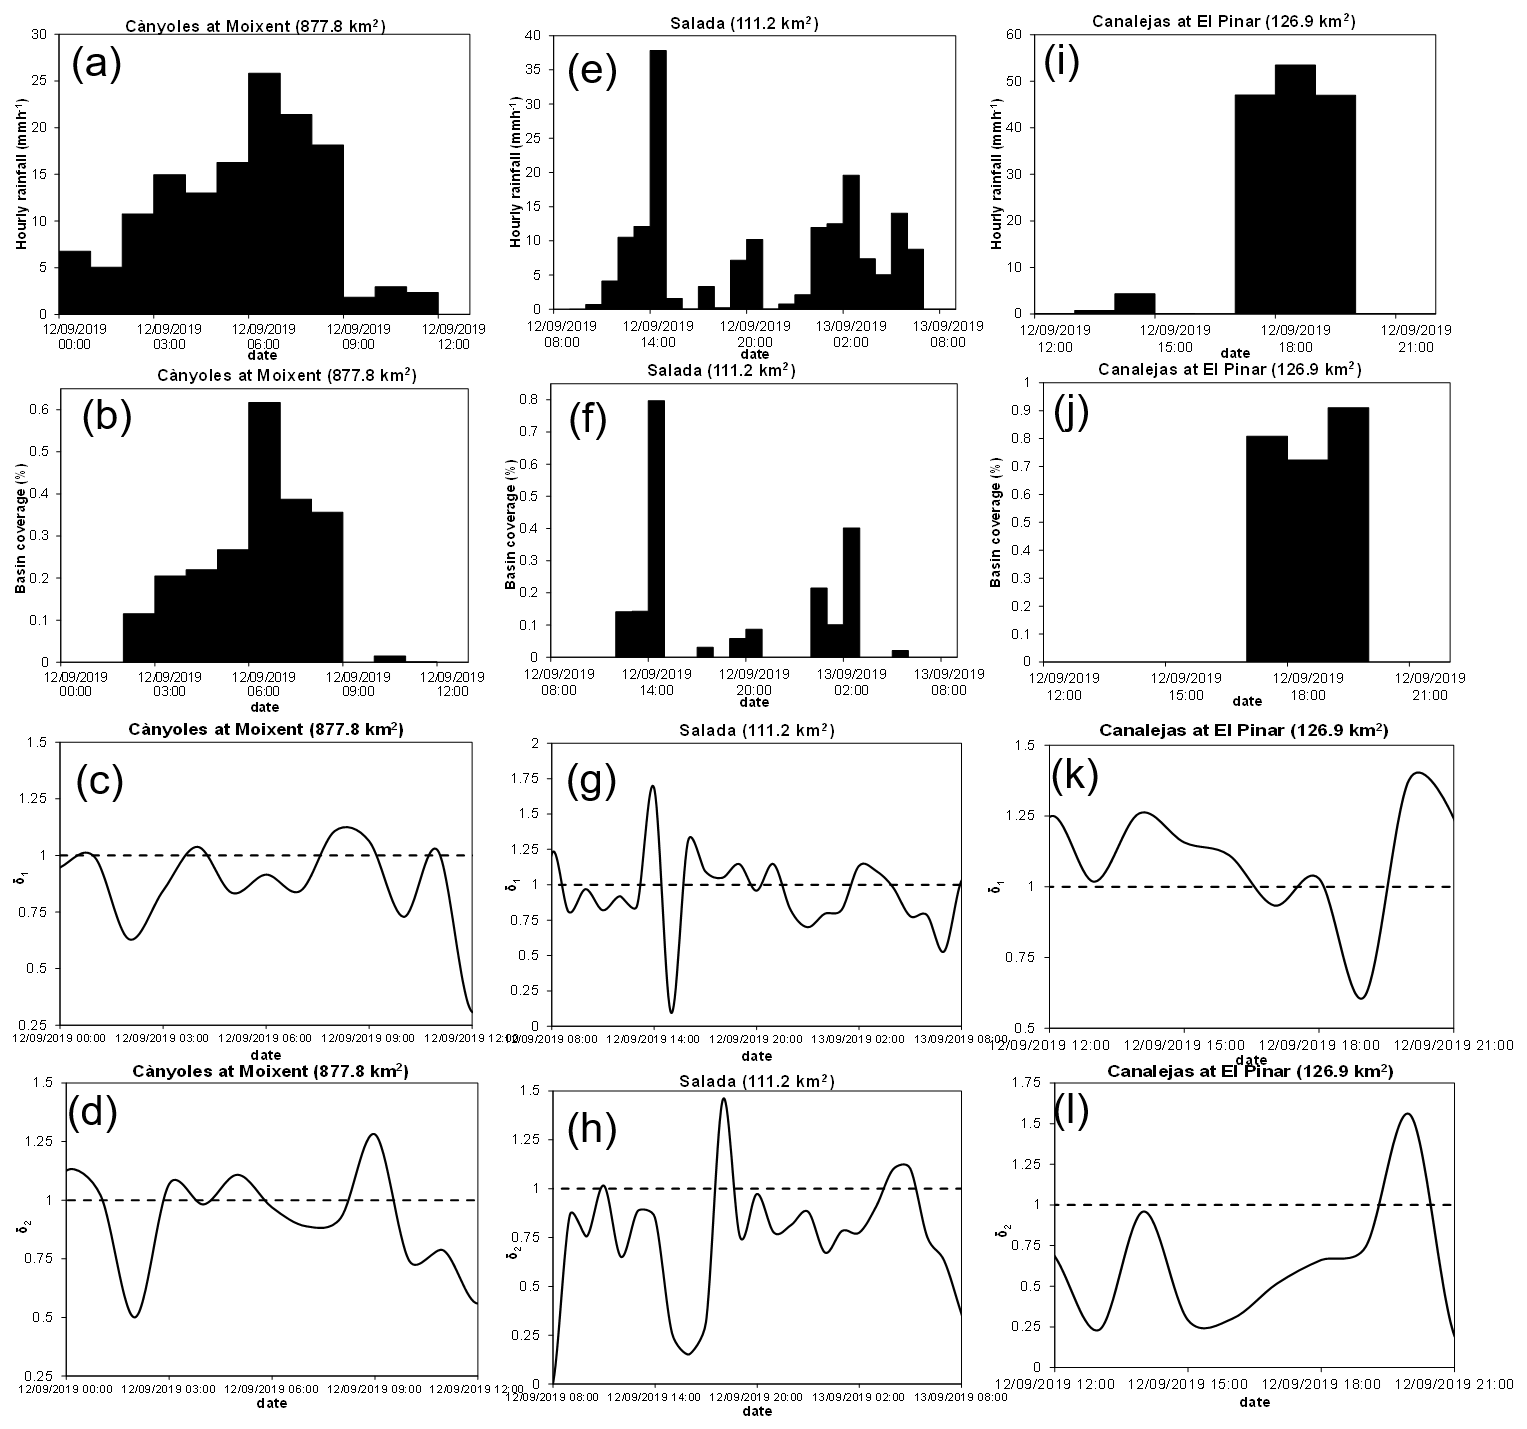
Figure 6Hourly time series over the most intense rainfall periods showing the catchment-area average rainfall, fractional basin area covered by hourly precipitation > 20 mm, and δ1 and δ2 for the Moixent (a, d), Rambla Salada (e–h) and Rambla de Canalejas (i–l) watersheds.
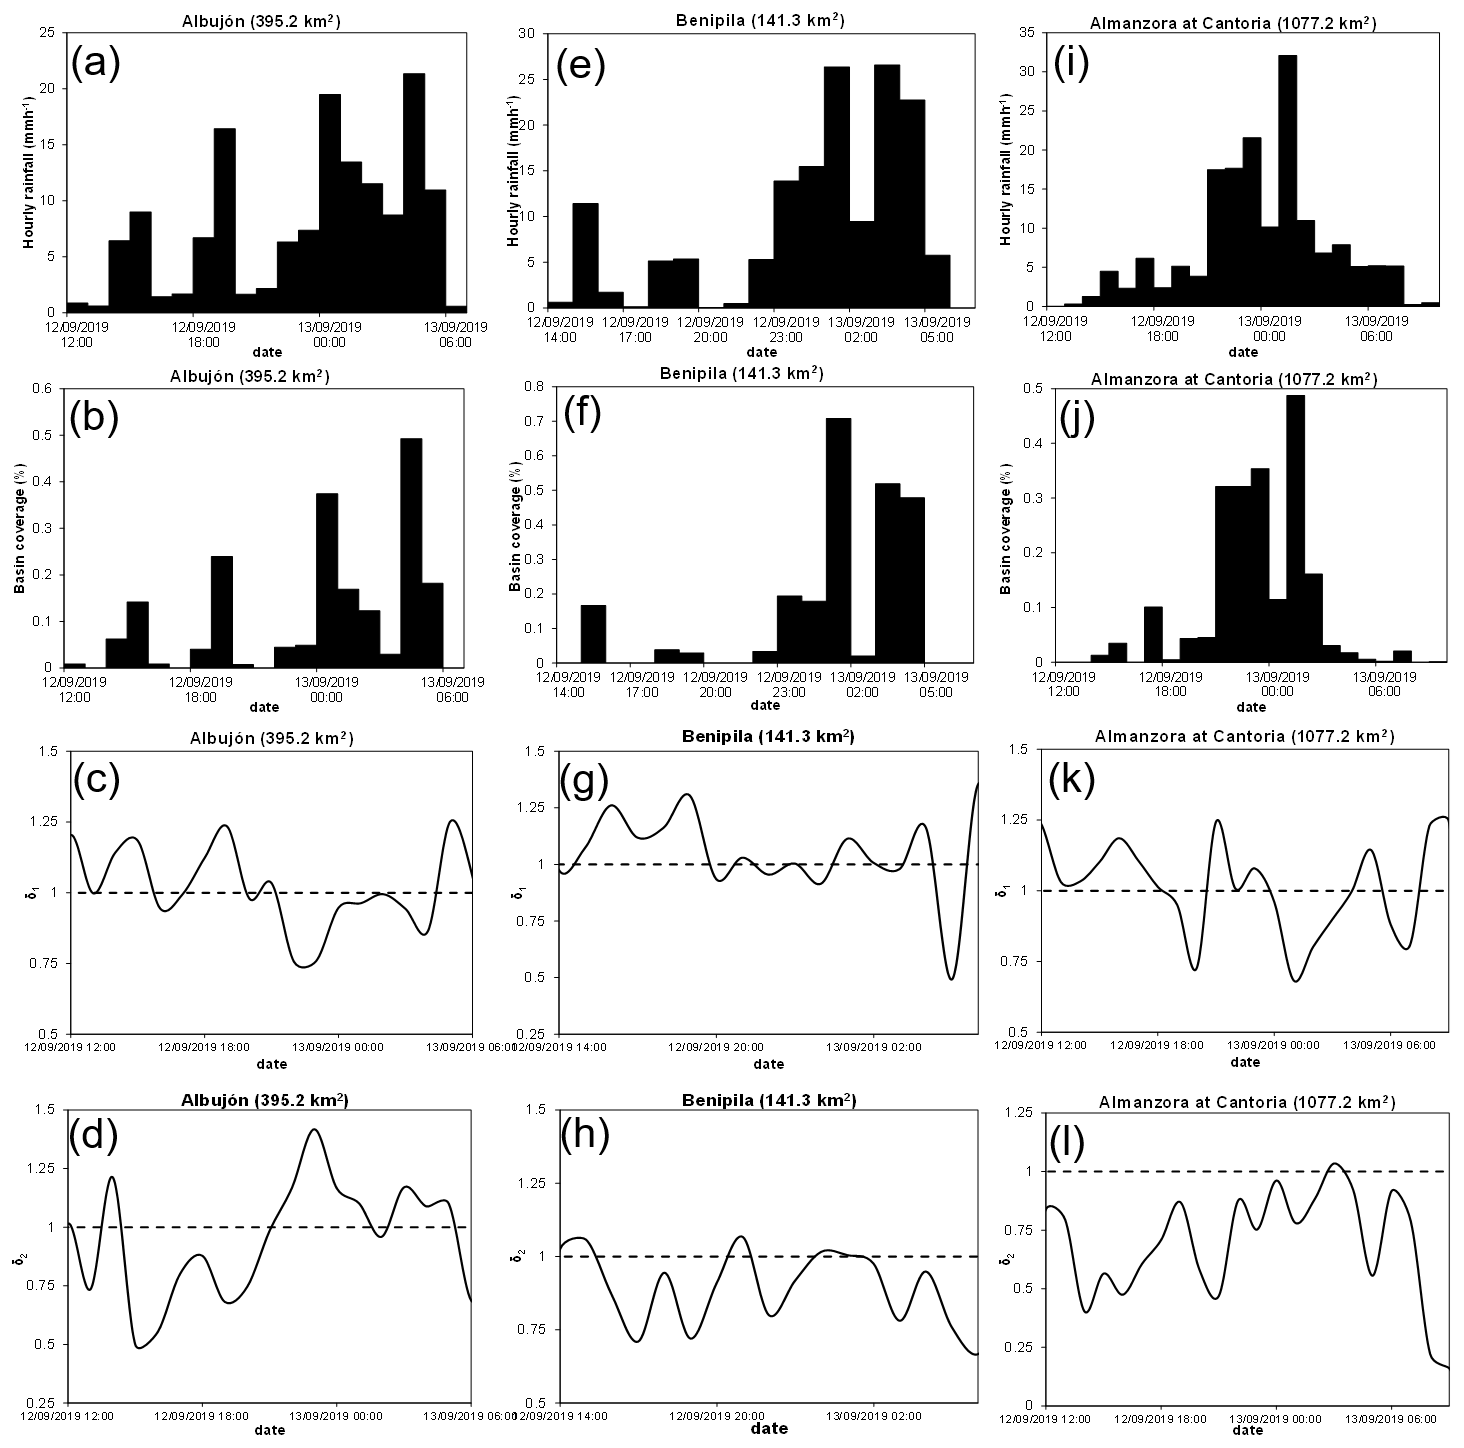
Figure 7As in Fig. 6 but for the Rambla del Albujón (a–d), Rambla de Benipila (e–h) and Almanzora (i–l) watersheds.
The northernmost Cànyoles basin was impacted by the thin and persistent convective band during phase 1 (Fig. 4a). In consequence, the hourly catchment-area average rains were above 15 mm from 05:00 to 08:00 UTC on 12 September, while the fractional basin coverage of the heaviest hourly precipitation was slightly above 0.6, affecting an area somewhat larger than 525 km2 (Fig. 6a and b). δ1 reflects that the torrential precipitation was mainly distributed close to the basin outlet (Fig. 6c). The temporal variation of δ2 shows fluctuations from uni- to multimodal rainfall distributions along the flow distance (Fig. 6d). In the town of Moixent, the automatic stream gauge recorded a peak discharge of 630.6 m3 s−1 at 08:20 UTC on 12 September (Table 1; Figs. 2 and 8a).
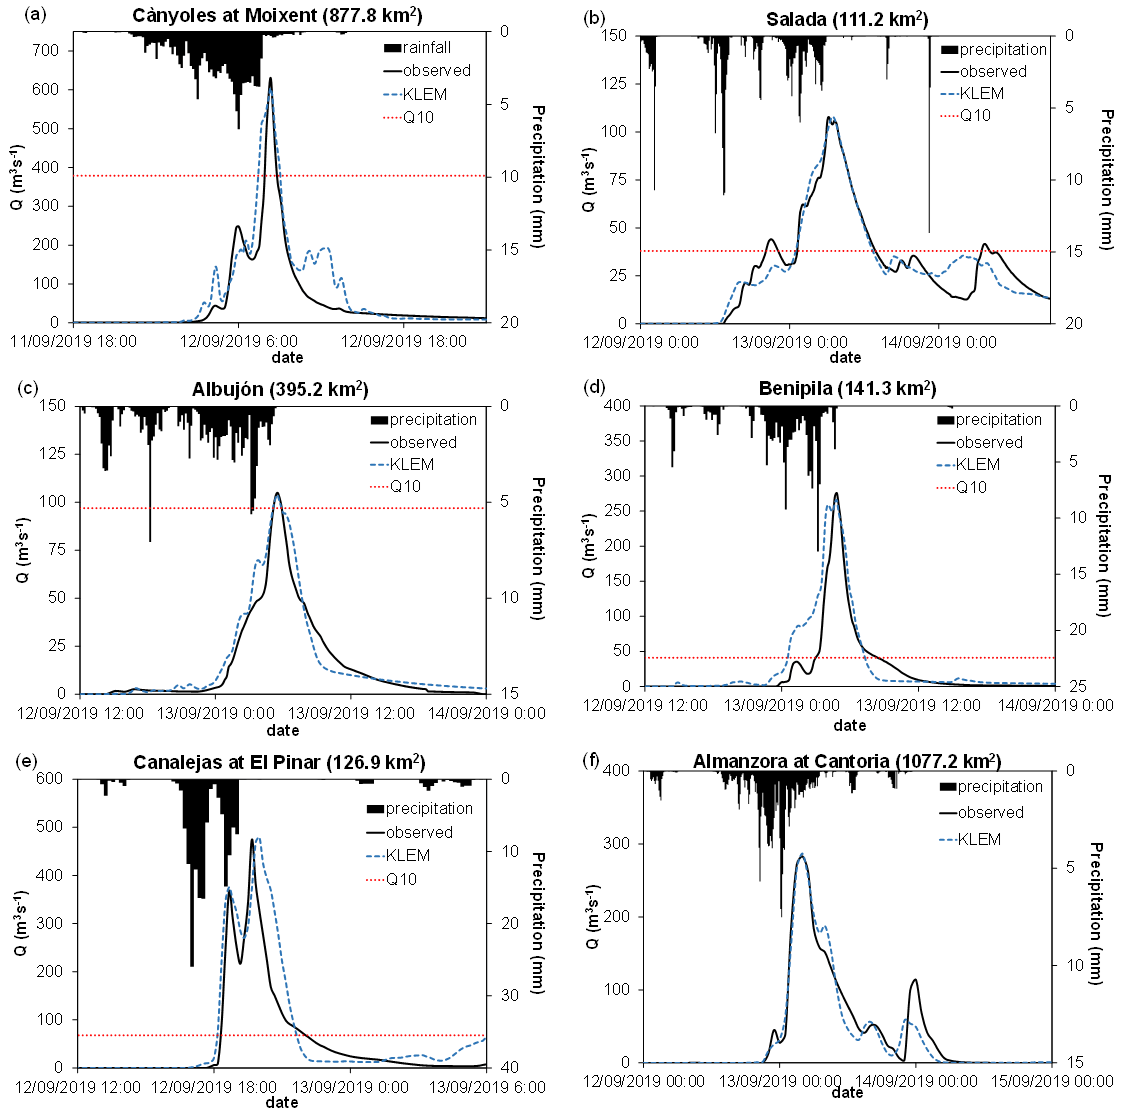
Figure 8Observed and KLEM radar-driven discharge simulations for the 12–13 September widespread flash flooding at (a) Moixent, (b) Salada, (c) Albujón, (d) Benipila, (e) Pinar and (f) Cantoria flow gauges. Also shown are the 10 min area-averaged precipitations enclosed by the different hydrometric sections. Red dashed lines indicate 10-year return periods for peak discharges where available (labelled as Q10).
During phase 2, a prominent and organized convective band moved from northeast to southwest of the domain, mainly impacting the Ramblas Salada, del Albujón, de Benipila and de Canalejas from 10:00 to 19:00 UTC on 12 September (Fig. 4b and c). During its passage, the most affected basins were the Ramblas Salada and de Canalejas. Maximum hourly basin-area average rainfall accumulation was close to 40 mm over the former basin at 14:00 UTC, with a fractional coverage close to 80 %. The kinematics of the convective structure over the Rambla Salada is clearly described by the strong change in sign of δ1, indicating a clear upstream-to-downstream movement of the heavy rain while featuring an acute unimodal distribution (Fig. 6e–h). Regarding the Rambla de Canalejas, the passage of the convective structure brought hourly catchment-area average rainfall accumulations ≥ 50 mm between 17:00–19:00 UTC, with fractional basin coverages above 70 % (Fig. 6i and j). Again, the spatial moments describe the motion of the linear precipitation structure, with a fast downstream translation and a marked unimodal distribution (Fig. 5k and l). The burst of heavy precipitation led to an extraordinary flash flooding: two almost consecutive maximum discharges of 367.4 and 475.0 m3 s−1 were recorded in the town of El Pinar at 18:40 and 19:40 UTC on 12 September, respectively (Fig. 8e).
During phase 3, intense and long-lasting rainfall affected the Ramblas Salada, de Benipila, de Albujón and Almanzora basins from 19:00 UTC on 12 September to 06:00 UTC on 13 September (Fig. 4d–f). The Rambla Salada was partially impacted by hourly basin-area average rainfall accumulations up to 20 mm (Fig. 6e and f). First, rains mainly affected the headwaters. Subsequent convectively driven precipitation impacted the catchment following an upstream direction. The rainfall distributions were mostly unimodal (Fig. 6g and h). As a result of the intense and copious precipitation during phases 2 and 3, two successive maximum flows of 107.8 and 105.4 m3 s−1 were observed at 06:20 and 07:30 UTC on 13 September (Table 1; Figs. 2 and 8b).
The Ramblas del Albujón and de Benipila were first partially affected by the passage of the linear structure of precipitation generated during phase 2 (12:00–16:00 UTC on 12 September), which resulted in maximum hourly basin-area average rainfall accumulations ≥ 10 mm, mainly distributed over the headwaters for both basins (Fig. 7a, b, e and f). Scattered and convectively driven precipitation impacted the watersheds during the next 3 h, with a maximum cumulative precipitation above 15 mm over the Rambla del Albujón at 19:00 UTC. Finally, the MCS overwhelmed both catchments from 21:00 UTC onwards. During its mature stage, hourly basin-area average rains were above 20 and 25 mm in the Ramblas del Albujón and de Benipila, respectively. The catchment percentages covered by heavy precipitation during this 9 h period were of up to 50 % and 70 % of the basin sizes, respectively. The quasi-stationary MCSs mostly impacted the lower areas of the Rambla del Albujón, with an accentuated multimodal distribution (Fig. 7c and d). Regarding the Rambla de Benipila, the spatial moments indicate slight upstream and downstream oscillations of the unimodal spatial distributions of the intense downpours during the passage of the MCS (Figs. 4e and 7g, h). The observed peak discharges were of 276.1 m3 s−1 at 04:50 UTC in the Rambla de Benipila and of 105.0 m3 s−1 at 05:30 UTC over the Rambla del Albujón (Fig. 8c and d).
The passage of the linear convective structure across the Almanzora catchment brought copious precipitation from 19:00 to 23:00 UTC on 12 September, with hourly basin-area average rainfall accumulations about 20 mm and a maximum spatial coverage above one-third of the basin extension (Fig. 7i and j). Finally, the triggering of intense convective bands in western Almería that moved northwest impacted the Almanzora basin from 00:00 UTC on 13 September. Convective activity persisted over the catchment during the next 7 h (Fig. 4d–f). The lifting associated with topographic forcing enhanced rainfall efficiency, giving rise to quasi-stationary precipitation: the maximum hourly basin-area average rain was above 30 mm at 01:00 UTC, with a fractional basin coverage close to 50 %. δ1 reflects the successive passages of the different convective systems, while δ2 denotes marked unimodal rainfall distributions (Fig. 7k and l). A maximum peak discharge of 283.2 m3 s−1 was recorded in the town of Cantoria at 04:00 UTC on 13 September (Fig. 8f).
4.2 Flood response and catchment dynamics
The total basin-average cumulative precipitation fluctuated roughly from 135 to 226 mm, while runoff ratios were remarkably small, varying from 0.04 to 0.16 (except for the Rambla Salada; Table 1). The runoff coefficients do not exhibit any clear relationship with maximum hourly rainfall rate or total accumulation across the examined basins. These highly nonlinear hydrological responses can be ascribed to the combination of very dry initial soil conditions and large soil water capacities. Indeed, runoff deficits were especially severe on these basins with underlying fractured and karstified bedrock (i.e., the Cànyoles and Almanzora catchments) or with soils strongly altered by anthropogenic pressures (i.e., the Rambla del Albujón). As a result, specific peak discharges were uneven and rather small at the basin scale, being only notable on the Ramblas de Benipila and de Canalejas. Similar hydrologic behaviour has been reported in previous flash floods over the western Mediterranean region. For instance, the Verdouble basin featured a very dampened hydrologic response during the 12 and 13 November 1999 flash flood over the Aude river, France. The runoff ratio was probably much lower than 10 % throughout the entire episode (Gaume et al., 2004). When analysing the 29 September 2003 flash flood in the eastern Italian Alps, a region characterized by karstified limestone, Borga et al. (2007) reported runoff ratios ranging from less than 0.1 to 0.25, strongly depending on the initial soil moisture conditions.
The catchment response time is linked to basin size, runoff generation, and hillslope and channel network routing. In turn, runoff triggering is intimately connected to the spatial and temporal distribution of the rainfall patterns. Herein, lag time is used as a proxy to characterize basin dynamics (Creutin et al., 2009). It is defined as the temporal difference between the centres of mass of the rainfall hyetograph and hydrograph, measuring the catchment response time from the beginning of precipitation. Besides acute heterogeneities in the rainfall–runoff transformation, pronounced nonlinearities also arose in the hydraulics of the selected basins. Lag times were a little sensitive to drainage area, being more dependent on features in rainfall (Fig. 9a–d). This behaviour would reflect the composite effects of several factors: an increased amount of sheet flows on the hillslopes with cumulative precipitation, an expansion of the stream networks to previously unchannelled topographic elements and an increase in flow velocity with discharge (Borga et al., 2007).
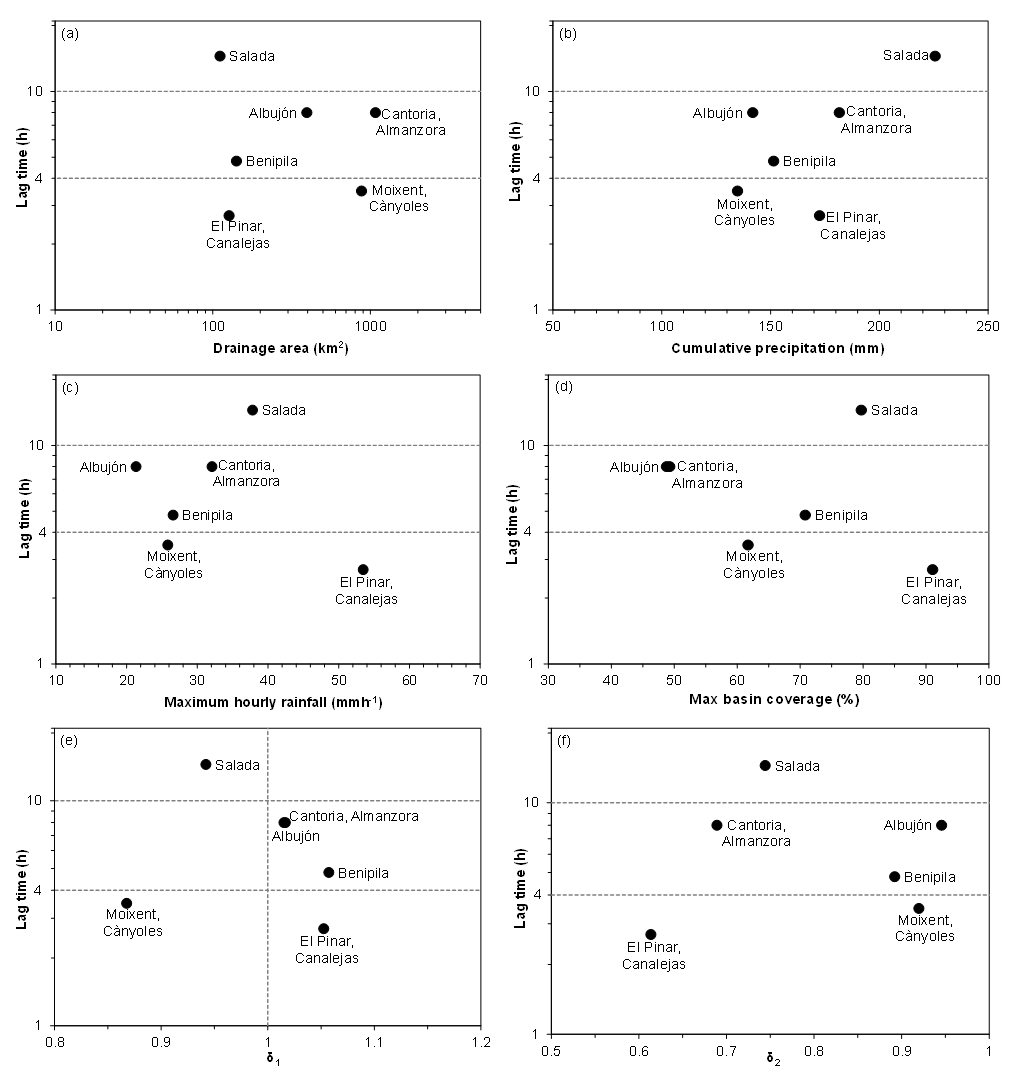
Figure 9Lag time with respect to the (a) basin size, (b) total catchment-area average precipitation, (c) maximum hourly rainfall rate, (d) maximum fractional basin coverage, and (e, f) first and second temporal-average spatial moments over the most intense rainfall period.
According to the lag time as function of basin size, three different modes of hydrological response were present during the unfolding of the 12–13 September 2019 widespread flash flooding (Fig. 9a). Despite the initial high abstractions, the Rambla de Canalejas and Cànyoles watersheds exhibited fast hydrological responses, with lag times of 2.7 and 3.5 h, respectively. For the latter catchment, features in precipitation did not stand out in comparison to the Almanzora basin, with similar size and physiography (Fig. 9b–d). However, heavy rainfall impacted the Cànyoles watershed during 7 consecutive hours, being mostly focused on its lower part, according to the temporal average of δ1 over the most intense period (i.e., 00:00–12:00 UTC on 12 September; Figs. 6c, d and 9e, f). In the end, the rapid response of this basin can be mainly attributed to the particular spatial and temporal distributions of the rainfall patterns. The Rambla de Canalejas offered an exemplary case of fast infiltration-excess runoff generation to extreme precipitation rate: rainfall was concentrated in just 3 h, leading to a total catchment-average amount of 147.6 mm, with relative basin coverages above 70 % and a strong unimodal distribution along the flow path (Figs. 6i. j and 9b–f).
After the end of phase 2, the catchment-average total rains were of 44.4 mm in the Rambla de Benipila, 61.6 mm over the Rambla de Albujón, and 37.5 mm in the Almanzora watershed, but no appreciable runoff had yet been produced. Subsequent bursts of heavy precipitation during phase 3 led to fast infiltration-excess production, resulting in widespread flooding on these watersheds. Their hydrological responses were relatively slower than these observed in the Cànyoles and Rambla de Canalejas catchments, with lag times ranging from almost 5 to 8 h (Table 1; Fig. 9a). The delay in runoff activation points to cumulative precipitation as another essential factor for flood control during this episode: as long as the runoff thresholds were not surpassed, sudden hydrological response did not start. It is likely that total rainfall amount was also the main ingredient triggering sudden infiltration-excess runoff generation on the Cànyoles basin. Camarasa-Belmonte and Beltrán Segura (2001), Gaume et al. (2004), Borga et al. (2007) and Zanon et al. (2010) have also reported rainfall accumulation as a paramount ingredient to trigger other flash floods in the western Mediterranean region.
The Rambla Salada basin had a very different hydrological response owing to its particular physiography. The total basin-average rainfall estimates were of 31.4, 77.5 and 116.7 mm during phases 1, 2 and 3, respectively. In spite of featuring the largest amount of precipitated water, the second largest hourly rainfall rate and basin coverage, and the highest runoff coefficient, lag time was 14.5 h (Table 1; Fig. 9). The rising and recession limbs of the observed hydrograph were more gradual (Fig. 8). The catchment response departed from the paroxysmal runoff processes and overland and channel flows typical of flash floods, as subsurface processes modulated flux dynamics (Table 1; Fig. 9). Owing to the important contribution of subsurface flow, it took around 8 h for the flow to recede to 30 % of the second peak discharge. The exponential decay of the remaining recession limbs was much faster. As an illustrative example, it only took 1.2 h for the observed hydrographs to recede in the same proportion over the Cànyoles and Rambla de Canalejas watersheds, exemplifying the predominant contribution of fast overland flow during the 12–13 September 2019 episode.
4.3 Hydrological model performance and water balance
The performance of QPE-driven runoff simulations is evaluated by means of the Nash–Sutcliffe efficiency criterion (NSE; Nash and Sutcliffe, 1970). The skill of the hydrological experiments is also analysed in terms of the relative errors in peak discharge and total direct runoff volume, expressed as a percentage. The calibrated KLEM simulations succeed when performing the different hydrological responses (Tables 2 and 3, and Fig. 8). The remarkably high NSE scores indicate a good general reproduction of the observed hydrographs in terms of peak discharge and timing. However, the observed water balances are considerably overestimated in the Cànyoles, Rambla de Benipila and Rambla de Canalejas catchments. The overall successful performance of the numerical experiments can be partially ascribed to the strong role of the heavy rainfall when modulating flood response for the case under study, as QPEs have been estimated with a relatively good accuracy over the region of interest (Figs. 3 and 4). It seems unlikely that imprecisions in the simulated water balances emerge from large errors in rainfall estimates over the concerned watersheds. Automatic rain-gauge density is relatively high on and around the catchments, minimizing possible biases. As pointed out by Zanon et al. (2010), these inaccuracies would be more attributable to errors in the precise description of soil and geological properties, which are always more difficult to assess.
Table 2KLEM parameters for infiltration and dynamical processes and the different hydrometric sections of the selected catchments. Curve numbers are expressed as area-averaged values, while their standard deviations are shown in brackets. Note that curve numbers correspond to dry antecedent conditions and that the calibrated parameters were S0, λ, Vh and Vc.
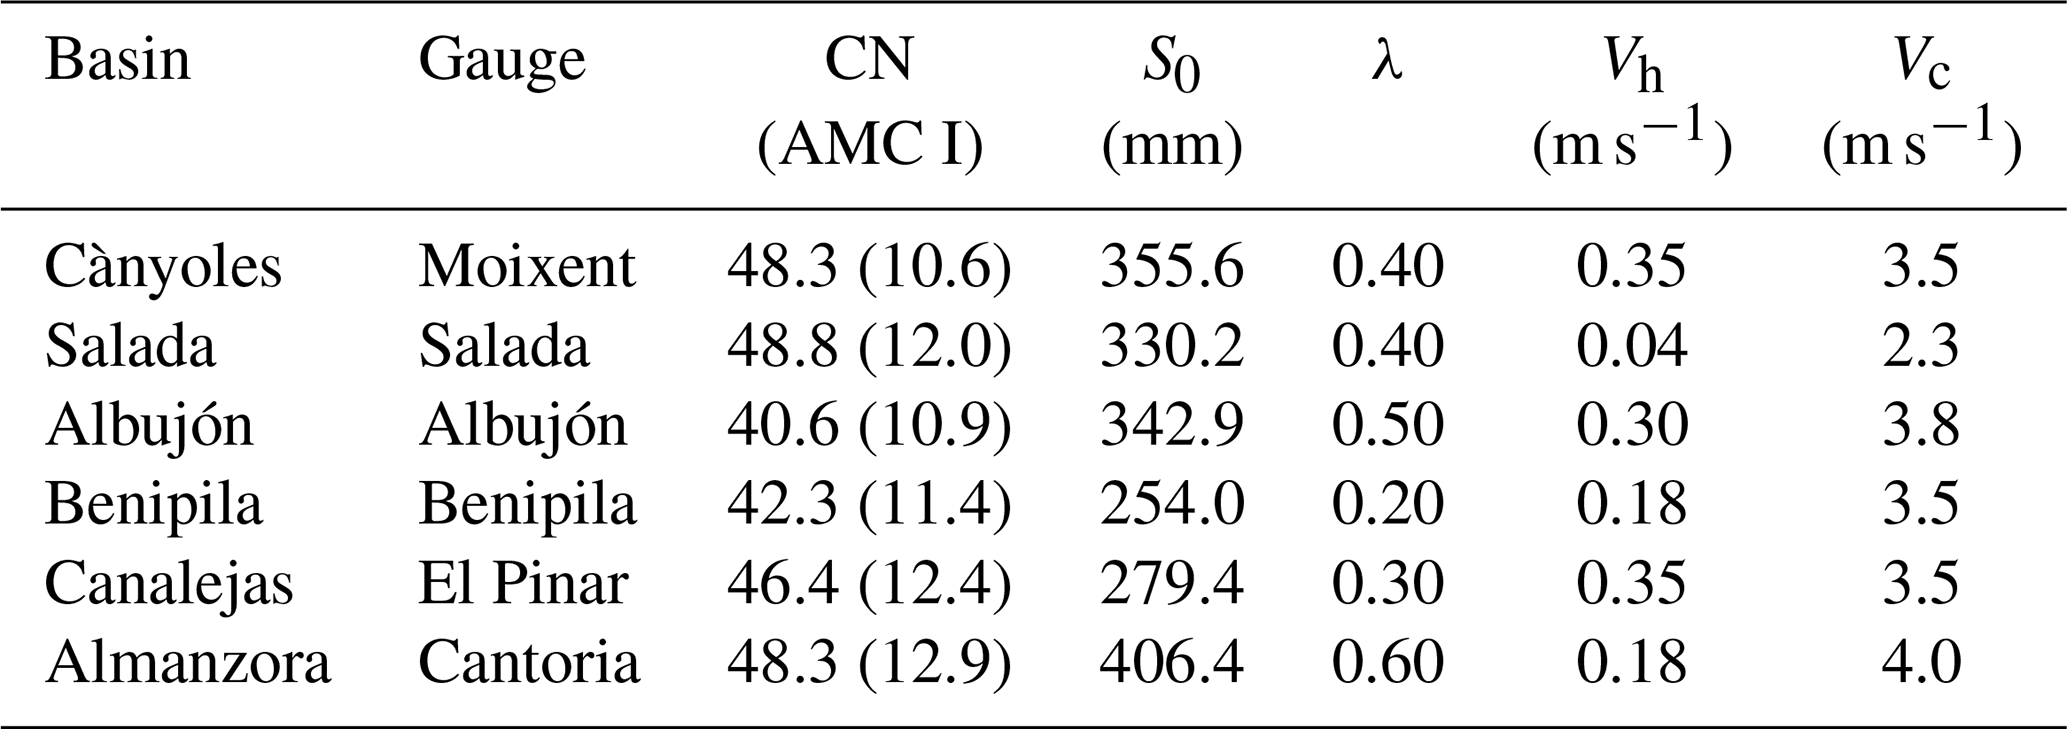
Table 3Observed and radar-driven simulated flow volumes and peak discharges for the different hydrometric sections of the selected catchments. Model performance also shown in terms of the different skill scores. Negative values in relative errors denote model underestimation.
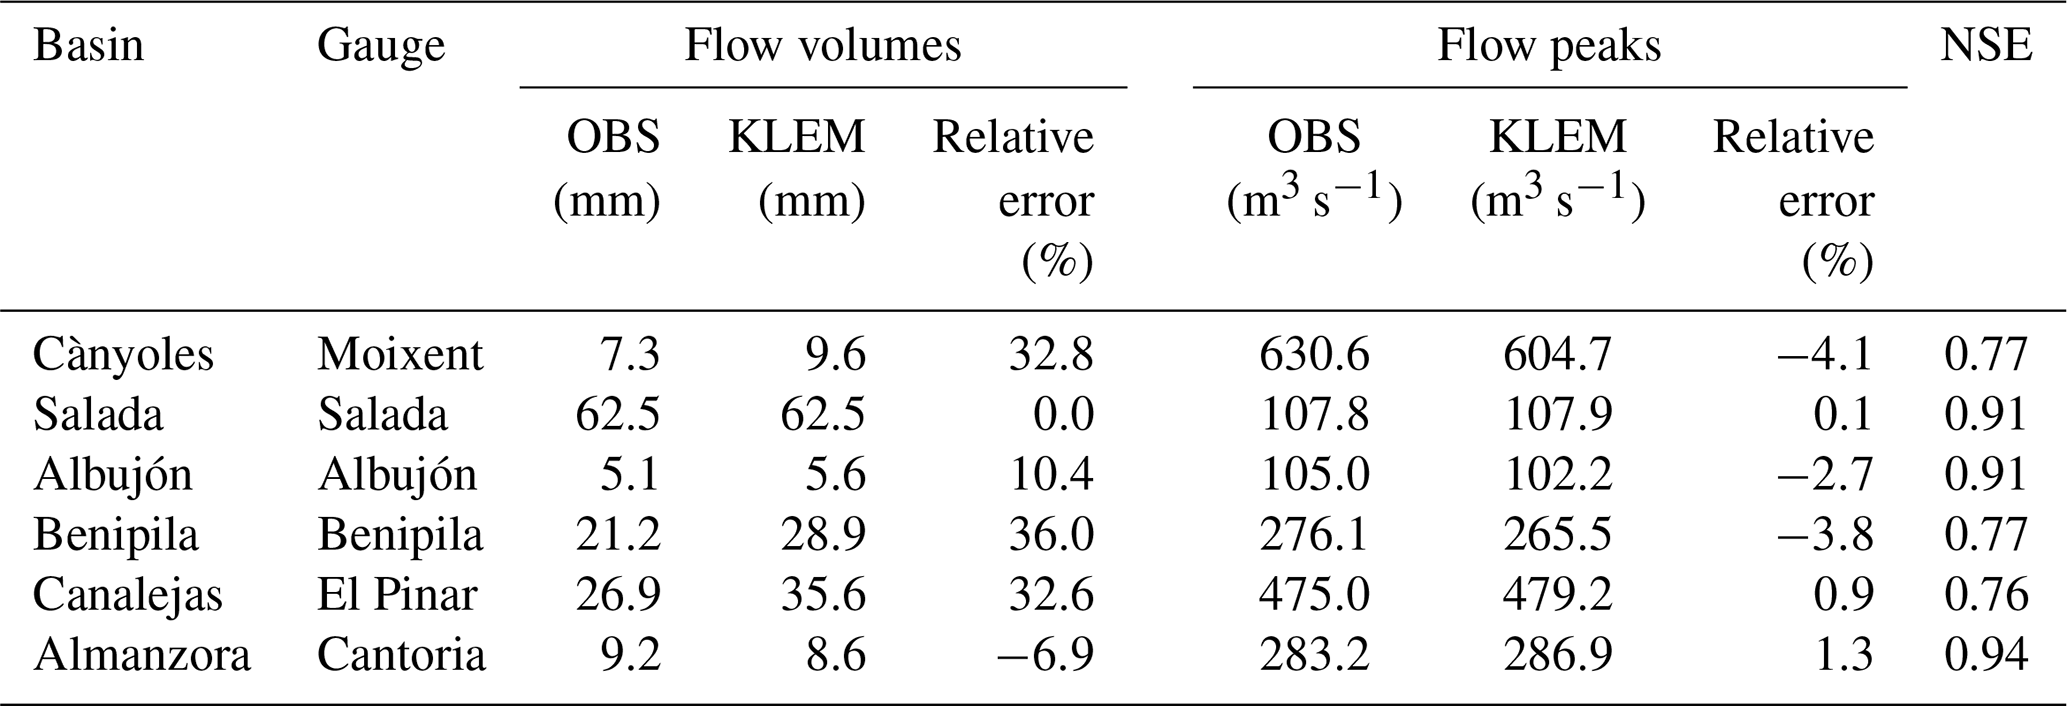
Imprecisions in the simulated water balances mainly arise due to inaccuracies in the reproduction of the observed hydrograph limbs (Table 3 and Fig. 8). Errors in the simulated recession branches for the Cànyoles and Rambla de Canalejas basins would denote that soil did not reach saturation. Abstractions remained despite the large volume of water previously precipitated on both watersheds. For the former watershed, these losses may be ascribed to the underlying karst geology over large portions of the basin. Imprecisions also emerge when simulating the observed rising limb in the Rambla de Benipila, resulting in an excessive initial runoff volume and a double-peak discharge (Fig. 8d). This watershed combined high initial abstractions with a sudden subsequent overflow production, resulting in a remarkable peak discharge once runoff thresholds were exceeded. These outcomes are in line with the information reported for the 12–13 November 1999 and 8–9 September 2002 floods in France. For the former, the runoff ratio was lower than 10 % on the Verdouble basin during the height of the flood (Gaume et al., 2004). For the latter, the Vidourle catchment featured a notable rainfall water retention capacity, with a runoff coefficient not exceeding 50 % during the peak of the flood (Gaume and Borga, 2008). In addition, it is arduous to accurately reproduce the fast processes involved in increasing the efficiency of the rainfall–runoff transformation and flow routing, while notable abstractions still remain. According to the observed hydrograph in the Rambla de Canalejas, a sharp decrease in catchment response to increased rainfall amount occurred: the main peak discharge was just 1 h apart from the previous relative maximum, being quite sudden and narrow (Fig. 8e).
With the exception of the Rambla Salada, the simulated overland flow speeds vary from 0.18 to 0.35 m s−1, whereas channel flow velocities range from 3.5 to 4.0 m s−1 (Table 2). The overland flow velocities are high as a result of the sparse vegetation and large amounts of sheet flow produced on the hillslopes during flash flooding. Since KLEM assumes the overland flow to be constant in space and time, high overland flow speeds allow accounting for sheet flow as well as concentrated overland flow in not previously channelized areas (Borga et al., 2007). Channel flow velocities are also high, as a consequence of the lack of vegetation in ephemeral stream beds and on banks, relatively steep slopes, and increase in flow velocity with discharge.
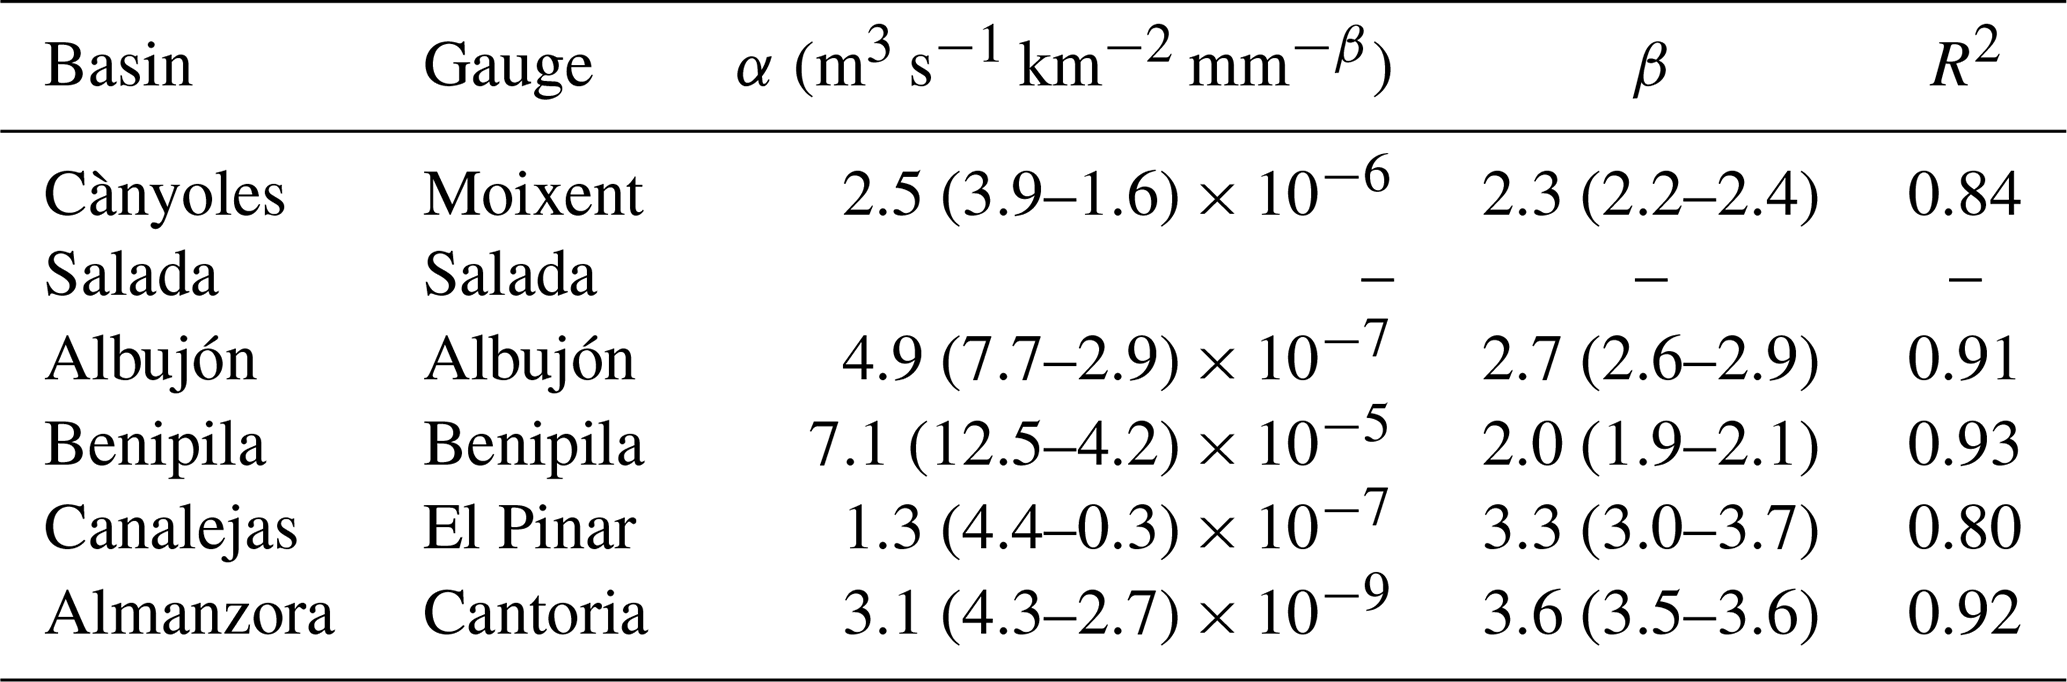
Table 4Reduced discharges (α), flood-scaling exponents (β) and squared correlation coefficients (R2) for the selected basins at the indicated stream gauges. Note that hydrological response does not follow a power-law relationship in the Rambla Salada. Also note that p values are less than 0.01 for all the regressions. The 95 % confidence intervals for α and β are shown between parentheses.
4.4 Scale dependency between flood magnitude and rainfall amount: a numerical exploration
The 12–13 September 2019 episode offers a suitable benchmark to preliminarily explore the general features in the scale dependency between flood peak and rainfall amount. The unusual spatial and temporal extension of the responsible HPE, together with the contrasting physical features of the examined watersheds, permits cross-validations and inter-comparisons. Amengual et al. (2021) devised a set of distinct ensemble prediction systems (EPSs) based on a convection-permitting numerical weather prediction model in order to examine predictability of the 12 and 13 September 2019 HPE at the regional and catchment scale. These ensemble strategies also provide valuable information about plausible and equally likely rainfall scenarios for this particular episode. Therefore, it is possible to examine how each basin integrates the diverse collection of rainfall intensities and amounts. Consequently, all the quantitative precipitation forecast (QPF)-driven runoff simulations are used to further examine the scaling properties linking peak discharge and total rainfall amount.
In the end, five different 50-member EPSs were generated for two consecutive 24 h periods aiming to cope with all meteorological uncertainties. Next, the QPFs were used to force the KLEM model. Note that this procedure considered up to 500 different rainfall scenarios (i.e., 5 EPSs × 50 ensemble members each × 2 initialization days) impacting on each individual watershed. Again, regression coefficients and flood-scaling exponents are calculated by using OLS regression; uncertainty is quantified by applying a 1000-sample bootstrap with replacement, while statistical significance is checked by means of the p value. Certainly, although this numerical exploration is exclusively limited to the fixed set of hydrological model parameters describing each basin response for the 12–13 September 2019 episode (Table 2), it can be considered as a valuable experiment so as to provide some guidance in relation with the different basin responses.
The Rambla de Canalejas and Almanzora watersheds feature the most efficient hydrological responses to large cumulative precipitation (Table 4 and Fig. 10). As expected, the most effective catchments are the steepest (Fig. 2), as they promote a fast generation of runoff, sheet flow, and concentrated overland flow, as well as a quick flow channel routing. Despite being the most effective, these catchments evidence the largest nonlinear rainfall–runoff transformations: besides having the highest flood-scaling exponents, they also exhibit very low regression coefficients. The acute nonlinearity of the Almanzora response may be ascribed to the dominant presence of highly karstified and fractured bedrock. The efficient rainfall–runoff conversion for the Rambla de Canalejas is probably related to the fast processes involved in increasing runoff generation and propagation with enhanced cumulative precipitation. Nevertheless, it also features the weakest squared correlation coefficient, as a high variability is found for the smallest specific peak discharges in terms of rainfall amount (Table 4, Fig. 10e).

Figure 10Specific peak discharges (qp) versus total rainfall amounts (P) for radar-derived (black rhombus) and ensemble experiments (blue dots) at the (a) Moixent, (b) Salada, (c) Albujón, (d) Benipila, (e) Pinar, and (f) Cantoria hydrometric sections. Red dashed lines denote specific peak flow and total rainfall quantiles for a 10-year return period.
The Ramblas del Albujón and de Benipila feature a smaller enhancement in the effectiveness of the runoff and routing processes at increased precipitation, partially because both watersheds are flatter (Table 4; Fig. 2). In addition, the Rambla del Albujón has a comparatively small scaling coefficient, probably because it is a highly human modified basin. The hydrological response over the Cànyoles basin is halfway to the behaviour of the previous watersheds. Besides having comparable mean slopes, this outcome may also be attributed to the fact that rainfall amounts are not so extreme over this catchment. Indeed, only one rainfall scenario renders cumulative precipitation above the 10-year return period (Fig. 10a).
The Rambla de Benipila yields more substantial peak discharges for a particular rainfall amount than the remaining basins. Specific peak discharges are always above 0.02 m3 −1 km−2, independently of the cumulative precipitation (Fig. 10d). This output reflects the aforementioned difficulties when simulating high initial abstractions and sudden subsequent runoff productions in this watershed. The Rambla Salada departs from the paroxysmal dynamics of arid and semi-arid basins under flash-flood conditions owing to the dominance of subsurface processes (Tables 1 and 2). Accordingly, this watershed does not follow a scaling flood law with cumulative precipitation, as its internal hydrological processes result in less efficient rainfall–runoff conversion and flow propagation at enlarged rainfall amount (Fig. 10b). When subsurface flow processes are dominant, the scaling law no longer remains.
In line with previously published flash-flood monographs, this work analyses the main hydrometeorological characteristics of the 12–13 September 2019 extreme HPE that impacted the central and southern part of Mediterranean Spain. This episode offers a valuable benchmark to examine the main rainfall and runoff processes in the context of similar observational studies of catastrophic flash flooding in the western Mediterranean region, within the heavy-rainfall, flash-floods and floods section of HyMeX.
The HPE was divided into three stages from an evaluation of the different convective structures: phase 1 consisted of a quasi-stationary and elongated area of anchored convection, resulting in long-lasting precipitation over the northernmost watershed; phase 2 was the result of a linear convective system impacting the central and southern basins; and, in phase 3, the formation and subsequent evolution of a V-shaped MCS overwhelmed the central catchments, while intense convective band activity affected the southernmost basin. One of the most striking characteristics of this HPE was the large spatial extent of rainfall accumulations ≥ 200 mm. According to the QPEs, while the areas of cumulative precipitation equal to or larger than 400 mm were very limited, cumulative precipitation ≥ 200 mm extended up to 7500 km2. This vast spatial extension resulted in fractional basin coverages ranging from 0.5 to 0.9 during the most intense rainfall periods. Besides quasi-stationarity, another striking feature was the acute and persistent convective activity during the unfolding of this episode. The different spatial and temporal scales of convectively driven rainfall resulted in a self-similar organization between maximum 30 min rainfall rate and cumulative precipitation.
Despite the impressive spatial and temporal extension of the heavy rains, very low antecedent soil moisture contents together with large infiltrabilities resulted in a remarkable damping of the flood response. The strong role of the initial conditions was another noticeable characteristic of the 12–13 September 2019 hydrometeorological episode: runoff coefficients ranged between 0.04–0.16 over the flashiest basins, resulting in highly nonlinear hydrological responses. Besides precipitation rate, rainfall amount arose as another major control in flood magnitude and dynamics over most catchments. As long as runoff thresholds were not exceeded, no sudden infiltration-excess runoff generation started. This flood-triggering process resulted in a delayed hydrological response, but once runoff started, the rainfall–runoff and dynamical processes became more efficient at increased rainfall amount.
As cumulative precipitation can also be an important factor when modulating flood magnitude, how rainfall amount translates into scale-dependent peak discharge was investigated through simple scaling theory. A power-law relationship was analytically derived from previous research in arid and semi-arid basins controlled by surface flow dynamics under flash-flood conditions. Subsequent numerical exploration confirmed the statistical robustness of the adjusted power-law relationships for the selected catchments under a particular set of parameterizations. Intercomparisons suggest that the flood-scaling coefficient and exponent may be mostly dependent on the spatial and temporal variability in soil physiography and rainfall, as well as on basin morphology. These findings could serve as basis to obtain empirically derived envelope curves for flood risk assessment when hydrological response is linked to the exceedance of runoff thresholds in arid and semi-arid basins.
Recognizably, this work is just a first step to further delve into self-similarity between flood magnitude and cumulative precipitation over arid and semi-arid basins, as it only relies on this particular case study. The intercept and flood-scaling parameters are expected to be case-dependent. Future research based on long-term, high-resolution observations should establish how this relationship varies for a larger sample of extreme episodes in terms of properties in rainfall (i.e., intensity and type), catchment (i.e., physiography and morphology) and initial soil moisture conditions (i.e., seasonality). The successful fulfilment of these tasks would allow the derivation of suitable envelope curves to better appraise the upper bound of flood events depending on total rainfall amount. For instance, these empirically derived envelope curves may be useful for hydrological design purposes and flood risk management. In this sense, Ewea et al. (2020) has recently shed some light on these issues after analysing several envelope curves derived from long-term daily series of maximum flood records in the arid environment of Saudi Arabia.
The primary data used in this study (rain-gauge, stream-gauge and weather radar data) can be obtained under request to the Confederaciones Hidrográficas del Júcar y del Segura, the Demarcación Hidrográfica de las Cuencas Mediterráneas Andaluzas, and the Spanish Agency of Meteorology.
The author has declared that there are no competing interests.
Publisher's note: Copernicus Publications remains neutral with regard to jurisdictional claims in published maps and institutional affiliations.
This article is part of the special issue “Hydrological cycle in the Mediterranean (ACP/AMT/GMD/HESS/NHESS/OS inter-journal SI)”. It is not associated with a conference.
Christian Barthlott, scientific editor of Natural Hazards and Earth System Sciences, and two anonymous reviewers are deeply acknowledged for their valuable comments that helped to improve the quality of this work. Arnau Amengual is grateful to Marco Borga for his helpful comments during the elaboration of this work. The Confederaciones Hidrográficas del Júcar y del Segura, the Demarcación Hidrográfica de las Cuencas Mediterráneas Andaluzas, and the Spanish Agency of Meteorology are acknowledged for providing the data needed to perform this work.
This research has been supported by the Ministerio de Ciencia, Innovación y Universidades (CGL2017-82868-R and PID2020-113036RB-I00/AEI/10.13039/501100011033 research projects, which are partially supported by the European Regional Development Funds).
This paper was edited by Christian Barthlott and reviewed by two anonymous referees.
Álvarez, A. J., Montañés, C. G., Orduña, L. M., Caballer, L. I., and Revilla, J. G.: Map of maximum flows of intercommunity basins, Revista de obras públicas, 3533, 7–32, 2012.
Amengual, A., Romero, R., Gómez, M., Martín, A., and Alonso, S.: A hydrometeorological modeling study of a flash-flood event over Catalonia, Spain, J. Hydrometeorol., 8, 282–303, 2007.
Amengual, A., Homar, V., and Jaume, O.: Potential of a probabilistic hydrometeorological forecasting approach for the 28 September 2012 extreme flash flood in Murcia, Spain, Atmos. Res., 166, 10–23, https://doi.org/10.1016/j.atmosres.2015.06.012, 2015.
Amengual, A., Carrió, D. S., Ravazzani, G., and Homar, V.: A comparison of ensemble strategies for flash flood forecasting: The 12 october 2007 case study in Valencia, Spain, J. Hydrometeorol., 18, 1143–1166, 2017.
Amengual, A., Hermoso, A., Carrió, D. S., and Homar, V.: The Sequence of Heavy Precipitation and Flash Flooding of 12 and 13 September 2019 in Eastern Spain. Part II: A Hydrometeorological Predictability Analysis Based on Convection-Permitting Ensemble Strategies, J. Hydrometeorol., 22, 2153–2177, 2021.
Borga, M., Boscolo, P., Zanon, F., and Sangati, M.: Hydrometeorological analysis of the 29 August 2003 flash flood in the Eastern Italian Alps, J. Hydrometeorol., 8, 1049–1067, 2007.
Bouilloud, L., Delrieu, B., Boudevillain, B., Borga, M., and Zanon, F.: Radar rainfall estimation for the post-event analysis of a Slovenian flash-flood case: Application of the Mountain Reference Technique at C-band frequency, Hydrol. Earth Syst. Sci., 13, 1349–1360, https://doi.org/10.5194/hess-13-1349-2009, 2009.
Camarasa-Belmonte, A. M.: Flash floods in Mediterranean ephemeral streams in Valencia Region (Spain), J. Hydrol., 541, 99–115, 2016.
Camarasa-Belmonte, A. M. and Beltrán Segura, F.: Flood events in Mediterranean ephemeral streams (ramblas) in Valencia region, Spain, Catena, 45, 229–249, https://doi.org/10.1016/S0341-8162(01)00146-1, 2001.
CCS – Consorcio de Compensación de Seguros: Cuarta nota informativa del Consorcio de Compensación de Seguros sobre las inundaciones producidas entre los días 11 y 15 de septiembre en el sureste principalmente, https://www.consorseguros.es/web/noticias (last access: 1 April 2022), 2019.
Cerdà, A.: Factores y variaciones espacio-temporales de la infiltración en los ecosistemas mediterráneos, SEG, Geoforma Ediciones, Logroño, 151 pp., ISBN 978-84-87779-18-3, 1995.
Chazarra-Bernabé, A., Flórez-García, E., Peraza-Sánchez, B., Tohá-Rebull, T., Lorenzo-Mariño, B., Criado-Pinto, E., Moreno-García, J. V., Romero-Fresneda, R., and Botery-Fullat, R.: Mapas climáticos de España (1981–2010) y ETo (1996–2016), Ministerio de Transición Ecológica, Agencia Estatal de Meteorología, Madrid, Spain, http://www.aemet.es/ (last access: 1 April 2022), 2018.
Cole, S. and Moore, R.: Hydrological modelling using rain-gauge and radar-based estimators of areal rainfall, J. Hydrol., 358, 159–181, https://doi.org/10.1016/j.jhydrol.2008.05.025, 2008.
CRED – Centre for Research on the Epidemiology of Disasters: Annual disaster statistical review 2016: The numbers and trends, https://reliefweb.int/report/world/annual-disaster-statistical-review-2016-numbers-and-trends (last access: 1 April 2022), 2016.
Creutin, J. D., Borga, M., Lutoff, C., Scolobig, A., Ruin, I., and Créton-Cazanave, L.: Catchment dynamics and social response during flash floods: the potential of radar rainfall monitoring for warning procedures, Meteorol. Appl., 16, 115–125, 2009.
Da Ros, D. and Borga, M.: Use of digital elevation model data for the derivation of the geomorphological instantaneous unit hydrograph, Hydrol. Process., 11, 13–33, https://doi.org/10.1002/(SICI)1099-1085(199701)11:1<13::AID-HYP400>3.0.CO;2-M, 1997.
Delrieu, G., Nicol, J., Yates, E., Kirstetter, P. E., Creutin, J. D., Anquetin, S., Obled, C., Saulnier, J .M., Ducrocq, V., Gaume, E., Payrastre, O., Andrieu, H., Ayral, P. A., Bouvier, C., Neppel, L., Livet, M., Lang, M., Parent du-Châtelet, J., Walpersdorf, A., and Wobrock, W.: The catastrophic flash-flood event of 8–9 September 2002 in the Gard Region, France: a first case study for the Cévennes–Vivarais Mediterranean Hydrometeorological Observatory, J. Hydrometeorol., 6, 34–52, 2005.
Drobinski, P., Ducrocq, V., Alpert, P., Anagnostou, E., Béranger, K., Borga, M., Braud, I., Chanzy, A., Davolio, S., Delrieu, G., Estournel, C., Filali Boubrahmi, N., Font, J., Grubišić, V., Gualdi, S., Homar, V., Ivančan-Picek, B., Kottmeier, C., Kotroni, V., Lagouvardos, K., Lionello, P., Llasat, M. C., Ludwig, W., Lutoff, C., Mariott, A., Richard, E., Romero, R., Rotunno, R., Roussot, O., Ruin, I., Somot, S., Taupier-Letage, I., Tintore, J., Uijlenhoet, R., and Wernl, H.: HyMeX A 10-year multidisciplinary program on the Mediterranean water cycle, B. Am. Meteorol. Soc., 95, 1063–1082, https://doi.org/10.1175/BAMS-D-12-00242.1, 2014.
Ewea, H. A., Al-Amri, N. S., and Elfeki, A. M.: Analysis of maximum flood records in the arid environment of Saudi Arabia, Geomat. Nat. Hazards Risk, 11, 1743–1759, 2020.
Fulton, R., Breidenbach J., Seo D., Miller D., and O'Bannon T.: The WSR-88D rainfall algorithm, Weather Forecast., 13, 377–395, https://doi.org/10.1175/1520-0434(1998)013<0377:TWRA>2.0.CO;2, 1998.
Furey, P. R. and Gupta, V. J.: Effects of excess rainfall on the temporal variability of observed peak-discharge power laws, Adv. Water Resour., 28, 1240–1253, 2005.
Furey, P. R. and Gupta, V. J.: Diagnosing peak-discharge power laws observed in rainfall–runoff events in Goodwin Creek experimental watershed, Adv. Water Resour., 30, 2387–2399, 2007.
Gaál, L., Szolgay, J., Kohnová, S., Parajka, J., Merz, R., Viglione, A., and Blöschl, G.: Flood timescales: Understanding the interplay of climate and catchment processes through comparative hydrology, Water Resour. Res., 48, W04511, https://doi.org/10.1029/2011WR011509, 2012.
García-Herrera, R., Barropedro, D., Hernández, E., Paredes, D., Correoso, J. F., and Prieto, L.: The 2001 mesoscale convective systems over iberia and the Balearic Islands, Meteorol. Atmos. Phys., 90, 225–243, https://doi.org/10.1007/s00703-005-0114-2, 2005.
García-Pintado, J., Barberá, G. G., Erena, M., and Castillo, V. M.: Calibration of structure in a distributed forecasting model for a semiarid flash flood: Dynamic surface storage and channel roughness, J. Hydrol., 377, 165–184, 2009.
Gaume, E. and Borga, M.: Post-flood field investigations in upland catchments after major flash floods: Proposal of a methodology and illustrations, J. Flood Risk Manage., 1, 175–189, 2008.
Gaume, E., Livet, M., and Desbordes, M.: Study of the hydrological processes during the Avene river extraordinary flood (south of France): 6–7 October 1997, Phys. Chem. Earth Pt. A/B/C, 28, 263–267, 2003.
Gaume, E., Livet, M., Desbordes, M., and Villeneuve, J. P.: Hydrological analysis of the river Aude, France, flash flood on 12 and 13 November 1999, J. Hydrol., 286, 135–154, 2004.
Gaume, E., Bain, V., Bernardara, P., Newinger, O., Barbuc, M., Bateman, A., Blaškovičová, L., Blöschl, G., Borga, M., Dumitrescu, A., Daliakopoulos, I., Garcia, J., Irimescu, A., Kohnova, S., Koutroulis, A., Marchi, L., Matreata, S., Medina, V., Preciso, E., Sempere-Torres, D., Stancalie, G., Szolgay, J., Tsanis, I., Velasco, D., and Viglione, A.: A compilation of data on European flash floods, J. Hydrol., 367, 70–78, 2009.
Giannoni, F., Smith, J. A., Zhang, Y., and Roth, G.: Hydrologic modeling of extreme floods using radar rainfall estimates, Adv. Water Resour., 26, 195–203, https://doi.org/10.1016/S0309-1708(02)00091-X, 2003.
Gochis, D., Schumacher, R., Friedrich, K., Doesken, N., Kelsch, M., Sun, J., Ikeda, K., Lindsey, D., Wood, A., Dolan, B., Matrosov, S., Newman, A., Mahoney, K., Rutledge, S., Johnson, R., Kucera, P., Kennedy, P., Sempere-Torres, D., Steiner, M., Roberts, R., Wilson, J., Yu, W., Chandrasekar, V., Rasmussen, R., Anderson, A., and Brown, B.: The great Colorado flood of September 2013, B. Am. Meteorol. Soc., 96, 1461–1487, https://doi.org/10.1175/BAMS-D-13-00241.1, 2015.
Gupta, V. K.: Emergence of statistical scaling in floods on channel networks from complex runoff dynamics, Chaos Solit. Fract., 19, 357–365, 2004.
Gupta, V. K. and Dawdy, D. R.: Physical interpretations of regional variations in the scaling exponents of flood quantiles, Hydrol. Process., 9, 347–361, 1995.
Hall, M. J., van den Boogaard, H. F. P., Fernando, R. C., and Mynett, A. E.: The construction of confidence intervals for frequency analysis using resampling techniques, Hydrol. Earth Syst. Sci., 8, 235–246, https://doi.org/10.5194/hess-8-235-2004, 2004.
Hermoso, A., Homar, V., and Amengual, A.: The sequence of heavy precipitation and flash flooding of 12 and 13 September 2019 in eastern Spain. Part I: Mesoscale diagnostic and sensitivity analysis of precipitation, J. Hydrometeorol., 22, 1117–1138, 2021.
Hosking, J. R. M., Wallis, J. R., and Woo, E. F.: Estimation of the generalized extreme value distribution by the method of probability weighted moments, Technometrics, 27, 251–261, https://doi.org/10.1080/00401706.1985.10488049, 1985.
Hunter, S.: WSR-88D radar rainfall estimation: Capabilities, limitations and potential improvements, Natl. Weather Dig., 20, 26–36, 1996.
IGME – Instituto Geológico y Minero de España: Mapa Geológico de España: Cartagena, Instituto Tecnológico Geominero de España, Madrid, Spain, ISBN 84-7840-171-7, 1993.
Katz, R.: Statistics of extremes in climatology and hydrology, Adv. Water Resour., 25, 1287–1304, 2002.
Llasat, M. D. C., Rigo, T., and Barriendos, M.: The `Montserrat-2000' flash-flood event: a comparison with the floods that have occurred in the northeastern Iberian Peninsula since the 14th century, Int. J. Climatol., 23, 453–469, 2003.
Lorenzo-Lacruz, J., Amengual, A., Garcia, C., Morán-Tejeda, E., Homar, V., Maimó-Far, A., Hermoso, A., Ramis, C., and Romero, R.: Hydro-meteorological reconstruction and geomorphological impact assessment of the October 2018 catastrophic flash flood at Sant Llorenç, Mallorca (Spain), Nat. Hazards Earth Syst. Sci., 19, 2597–2617, https://doi.org/10.5194/nhess-19-2597-2019, 2019.
Maidment, D. R.: Handbook of hydrology, in: Vol. 9780070, McGraw-Hill, New York, p. 397323, ISBN 0070397325, 1993.
Marani, M. and Ignaccolo, M.: A metastatistical approach to rainfall extremes, Adv. Water Resour., 79, 121–126, https://doi.org/10.1016/j.advwatres.2015.03.001, 2015.
Marchi, L., Borga, M., Preciso, E., and Gaume, E.: Characterisation of selected extreme flash floods in Europe and implications for flood risk management, J. Hydrol., 394, 118–133, 2010.
Marra, F., Nikolopoulos, E. I., Anagnostou, E. N., and Morin, E.: Metastatistical extreme value analysis of hourly rainfall from short records: estimation of high quantiles and impact of measurement errors, Adv. Water Resour. 117, 27–39, https://doi.org/10.1016/j.advwatres.2018.05.001, 2018.
Marra, F., Zoccatelli, D., Armon, M., and Morin, E.: A simplified MEV formulation to model extremes emerging from multiple nonstationary underlying processes, Adv. Water Resour., 127, 280–290, https://doi.org/10.1016/j.advwatres.2019.04.002, 2019.
Martín, A., Romero, R., De Luque, A., Alonso, S., Rigo, T., and Llasat, M. C.: Sensitivities of a flash flood event over Catalonia: a numerical analysis, Mon. Weather Rev., 135, 651–669, 2007.
Martins, E. S. and Stedinger, J. R.: Generalized maximum-likelihood generalized extreme-value quantile estimators for hydrologic data, Water Resour. Res., 36, 737–744, https://doi.org/10.1029/1999WR900330, 2000.
Martín-Vide, J. P. and Llasat, M. C.: The 1962 flash flood in the Rubí stream (Barcelona, Spain), J. Hydrol., 566, 441–454, https://doi.org/10.1016/J.JHYDROL.2018.09.028, 2018.
Metzger, A., Marra, F., Smith, J. A., and Morin, E.: Flood frequency estimation and uncertainty in arid/semi-arid regions, J. Hydrol., 590, 125254, https://doi.org/10.1016/j.jhydrol.2020.125254, 2020.
Miniussi, A., Marani, M., and Villarini, G.: Metastatistical Extreme Value Distribution applied to floods across the continental United States, Adv. Water Resour., 136, 103498, https://doi.org/10.1016/j.advwatres.2019.103498, 2020.
Moore, R. J. and Bell, V. A.: Incorporation of groundwater losses and well level data in rainfall-runoff models illustrated using the PDM, Hydrol. Earth Syst. Sci., 6, 25–38, https://doi.org/10.5194/hess-6-25-2002, 2002.
Nash, J. E. and Sutcliffe, J. V.: River flow forecasting through conceptual models. Part I: A discussion of principles, J. Hydrol., 10, 282–290, 1970.
Ogden, F. L. and Dawdy, D. R.: Peak discharge scaling in small Hortonian watershed, J. Hydrol. Eng., 8, 64–73, 2003.
Ogden, F. L., Sharif, H. O., Senarath, S. U. S., Smith, J. A., Baeck, M. L., and Richardson, J. R.: Hydrologic analysis of the Fort Collins, Colorado, flash flood of 1997, J. Hydrol., 228, 82–100, 2000.
Pastor, F., Gómez, I., and Estrela, M.: Numerical study of the October 2007 flash flood in the Valencia region (Eastern Spain): The role of orography, Nat. Hazards Earth Syst. Sci., 10, 1331–1345, https://doi.org/10.5194/nhess-10-1331-2010, 2010.
Pellarin, T., Delrieu, G., Saulnier, G., Andrieu, H., Vignal, B., and Creutin, J.: Hydrologic visibility of weather radar systems operating in mountainous regions: Case study for the Ardèche Catchment (France), J. Hydrometeorol., 3, 539–555, https://doi.org/10.1175/1525-7541(2002)003<0539:HVOWRS>2.0.CO;2, 2002.
Petrucci, O., Aceto, L., Bianchi, C., Bigot, V., Brázdil, R., Pereira, S., Kahraman, A., Kılıç, Ö., Kotroni, V., Llasat, M. C., Llasat-Botija, M., Papagiannaki, K., Pasqua, A., Řehoř, J., Rossello Geli, J., Salvati, P., Vinet, F., and Zêzere, J. L.: Flood fatalities in Europe, 1980–2018: Variability, features, and lessons to learn, Water, 11, 1682, https://doi.org/10.3390/w11081682, 2019.
Ponce, V. M. and Hawkins, R. H.: Runoff curve number: Has it reached maturity?, J. Hydrol. Eng., 1, 11–19, https://doi.org/10.1061/(ASCE)1084-0699(1996)1:1(11), 1996.
Rahman, A. S., Rahman, A., Zaman, M.A., Haddad, K., Ahsan, A., and Imteaz, M.: A study on selection of probability distributions for at-site flood frequency analysis in Australia, Nat. Hazards, 69, 1803–1813, https://doi.org/10.1007/s11069-013-0775-y, 2013.
Romero, R., Doswell III, C. A., and Ramis, C.: Mesoscale numerical study of two cases of long-lived quasi-stationary convective systems over eastern Spain, Mon. Weather Rev., 128, 3731–3751, 2000.
Schumer, R., Knust, A., and Boyle, D. P.: Characteristics of ephemeral hydrographs in the Southwestern United States, J. Hydrol. Eng., 19, 10–17, https://doi.org/10.1061/(ASCE)HE.1943-5584.0000643, 2014.
Sese-Minguez, S., Boesveld, H., Asins-Velis, S., Van der Kooij, S., and Maroulis, J.: Transformations accompanying a shift from surface to drip irrigation in the Cànyoles watershed, Valencia, Spain, Water Alternativ., https://www.water-alternatives.org/index.php/alldoc/articles/vol10/v10issue1/343-a10-1-5/file (last access: 1 April 2022), 2017.
Smith, J. A., Baeck, M. L., Steiner, M., and Miller, A. J.: Catastrophic rainfall from an up-slope thunderstorm in the central Appalachians: The Rapidan storm of June 27, 1995, Water Resour. Res., 32, 3099–3113, 1996.
Smith, J. A., Baeck, M. L., Morrison, J. E., and Sturdevant-Rees, P.: Catastrophic rainfall and flooding in Texas, J. Hydrometeorol., 1, 5–25, 2000.
Smith, J. A., Baeck, M. L., Morrison, J. E., Sturdevant-Rees, P., Turner-Gillespie, D. F., and Bates, P. D.: The regional hydrology of extreme floods in an urbanizing drainage basin, J. Hydrometeorol., 3, 267–282, 2002.
Solari, S., Egüen, M., Polo, M. J., and Losada, M. A.: Peaks Over Threshold (POT): a methodology for automatic threshold estimation using goodness of fit p-value, Water Resour. Res. 53, 2833–2849, https://doi.org/10.1002/2016WR019426, 2017.
ten Veldhuis, M.-C., Zhou, Z., Yang, L., Liu, S., and Smith, J.: The role of storm scale, position and movement in controlling urban flood response, Hydrol. Earth Syst. Sci., 22, 417–436, https://doi.org/10.5194/hess-22-417-2018, 2018.
USDA: Urban hydrology for small watersheds, USDA TR-55, 164 pp., https://www.nrcs.usda.gov/Internet/FSE_DOCUMENTS/stelprdb1044171.pdf (last access: 1 April 2022), 1986.
Vallejos, A., Pulido, A., and Castillo, A.: Consideraciones sobre la hidrogeología de la cuenca del río Almanzora (SE peninsular), Estud. Geol., 50, 103–117, 1994.
Viglione, A., Chirico, G. B., Komma, J., Woods, R., Borga, M., and Blöschl, G.: Quantifying space-time dynamics of flood event types, J. Hydrol., 394, 213–229, 2010.
Villarini, G. and Smith, J. A.: Flood peak distributions for the eastern United States, Water Resour. Res., 46, 1–17, https://doi.org/10.1029/2009WR008395, 2010.
Zanon, F., Borga, M., Zoccatelli, D., Marchi, L., Gaume, E., Bonnifait, L., and Delrieu, G.: Hydrological analysis of a flash flood across a climatic and geologic gradient: The September 18, 2007 event in Western Slovenia, J. Hydrol., 394, 182–197, 2010.
Zoccatelli, D., Borga, M., Viglione, A., Chirico, G. B., and Blöschl, G.: Spatial moments of catchment rainfall: rainfall spatial organisation, basin morphology, and flood response, Hydrol. Earth Syst. Sci., 15, 3767–3783, https://doi.org/10.5194/hess-15-3767-2011, 2011.
Zorzetto, E., Botter, G., and Marani, M.: On the emergence of rainfall extremes from ordinary events, Geophys. Res. Lett., 43, 8076–8082, https://doi.org/10.1002/2016GL069445, 2016.