the Creative Commons Attribution 4.0 License.
the Creative Commons Attribution 4.0 License.
 | 14 Jan 2021
Design of parametric risk transfer solutions for volcanic eruptions: an application to Japanese volcanoes
Delioma Oramas-Dorta
Giulio Tirabassi
Guillermo Franco
Christina Magill
Volcanic eruptions are rare but potentially catastrophic phenomena, affecting societies and economies through different pathways. The 2010 Eyjafjallajökull eruption in Iceland, a medium-sized ash-fall-producing eruption, caused losses in the range of billions of dollars, mainly to the aviation and tourism industries. Financial risk transfer mechanisms such as insurance are used by individuals, companies, governments, etc., to protect themselves from losses associated with natural catastrophes. In this work, we conceptualize and design a parametric risk transfer mechanism to offset losses to building structures arising from large, ash-fall-producing volcanic eruptions. Such a transfer mechanism relies on the objective measurement of physical characteristics of volcanic eruptions that are correlated with the size of resulting losses (in this case, height of the eruptive column and predominant direction of ash dispersal) in order to pre-determine payments to the risk cedent concerned. We apply this risk transfer mechanism to the case of Mount Fuji in Japan by considering a potential risk cedent such as a regional government interested in offsetting losses to dwellings in the heavily populated prefectures of Tokyo and Kanagawa. The simplicity in determining eruptive column height and ash fall dispersal direction makes this design suitable for extrapolation to other volcanic settings worldwide where significant ash-fall-producing eruptions may occur, provided these parameters are reported by an official, reputable agency and a suitable loss model is available for the volcanoes of interest.
- Article
(1466 KB) - Full-text XML
- BibTeX
- EndNote


Volcanic eruptions are complex phenomena that generate a variety of hazards such as lava flows, ash fall, pyroclastic flows, lahars, and volcanic earthquakes. These may in turn cause physical damage to man-made structures and the discontinuation of activities related to aviation, tourism, and agriculture, among others.
Although rare, large volcanic eruptions pose significant destructive and disruptive potential. A medium-sized eruption like the 2010 Eyjafjallajökull eruption in Iceland (VEI1 4) caused the cancellation of about 100 000 flights and carried an estimated global cost of USD 4.7 billion (Oxford Economics, 2010). According to estimates by the Government of Japan, a repeat of the December 1707 Mt Fuji eruption (VEI 5) could result in national losses over USD 22.5 billion (Cabinet Office of Japan, 2002), not including impacts on transportation and power transmission facilities that could effectively paralyse the Tokyo metropolitan area. Mt Tambora's 1815 eruption in Indonesia (VEI 7) is regarded as the greatest eruption in historic time, ejecting as much as 175 km3 of pyroclastic material that reached heights of over 40 km into the atmosphere (Self et al., 1984). It caused an estimated death toll of 71 000 people, some of which due to the immediate explosion that killed around 12 000 people on Sumbawa island (Oppenheimer, 2003). The event triggered tsunami waves striking several Indonesian islands and a famine related to eruptive fallout ruining crops in the region (Stothers, 1984; Oppenheimer, 2003). At present, over one million people live within 100 km of Mt Tambora (GVP, 2019).
Insurance is a mechanism to protect against financial losses from natural perils. Through insurance, people and entities transfer risks to insurance companies in return for the payment of an annual premium. These premiums are accumulated in order to build up reserves that enable them to pay claims in case of need. Insurance companies, similarly, can accept only a certain amount of risk, after which they may themselves seek protection through reinsurance. Companies who sell reinsurance are typically global in nature, hedging their risk in one region by selling products in another or by seeking insurance mechanisms themselves for their own portfolios (this is called “retrocession”). Through this chain of risk transfer, accumulations of risk are successfully shared among many parties across the world, ideally enabling our society to cope with potentially large losses without any particular entity in this chain suffering unrecoverable losses.
As concentrations of risks grew, the capital available to supply global reinsurance products was in more demand, which had the consequence of raising prices. A larger supply of capital was necessary and there were large yields available for those interested. This gave rise to the appearance of insurance-linked securities (ILSs), a type of financial instrument that allowed the capital markets to enter the insurance space in what has been referred to as “the convergence market”, thus increasing the amount of capital available for insurance-related operations. One tool that falls into this category is a catastrophe (cat) bond, a means of fragmenting risk into coupon bonds that can be sold to qualified investors (Cummins, 2008; Swiss Re, 2011).
As new investors in this space lack familiarity with traditional insurance operations, there has been an interest in devising some of these instruments as a form of derivative that simplifies the process of settling a claim (World Economic Forum, 2008). This motivation gave rise to “parametric cat bonds” in which recoveries after a catastrophe event are tied to the occurrence of a set of measurable physical characteristics, such as the magnitude of an earthquake or the category of a hurricane, rather than to actual losses or indemnity. Properly chosen parameters that are easy to measure transparently and with accuracy can provide parametric cat bonds with a speed of payment unparalleled in the domain of insurance. The choice of parameters has evolved since the 1990s when these tools first appeared, resulting in different choices of design. For instance, in the case of earthquakes two types of solutions have been used in the market successfully: first-generation cat-in-a-box triggers and second-generation parametric indices. The first type is based on the magnitude, epicentre location, and focal depth of the event, whereas the second type is based on geographically distributed earthquake parameters such as ground motions. Second-generation indices can be, in general, considered to be superior to first-generation triggers owing to a potentially better correlation between the distributed parameters and resulting losses, although the performance ultimately depends on many design considerations. In the case of tsunami losses, for instance, Goda et al. (2019) found the forecasting errors in second-generation indices were slightly inferior to those for first-generation triggers. Progressively, as sensors become more ubiquitous and precise, and as technology facilitates communication of measurements, parametric insurance mechanisms are becoming more widespread.
Earthquake parametric cat bond transactions appeared first in 1997 and grew in number throughout the following years, supported by what were then relatively novel techniques to model earthquake risk in the insurance market (Franco, 2014). Since then, these earthquake solutions have taken many forms depending on the parameters chosen for their design and on whether they are binary (pay or no pay) or index based, indicating a payment somewhat correlated with the intensity of the event (Wald and Franco, 2016, 2017). A similar development in the field of volcanic risks has not yet taken place. Only one product exists in the market, offered by Sompo Japan Nipponkoa Insurance that provides coverage on a parametric basis for volcanic eruptions. This product is addressed to commercial corporations in Japan at risk of experiencing losses derived from a volcanic eruption (Artemis, 2016). Tailored in particular to the tourism industry, it grants coverage of losses up to USD 10 million from business interruption caused by the onset of a level 3 or above eruption alert as determined by the Japan Meteorological Agency (JMA) (Yamasato et al., 2013).
The dearth of insurance derivative products linked to physical characteristics of volcanic eruptions may be partly explained by the lack of fully probabilistic volcano loss models, which are a pre-requisite for the design and calibration of these products. In this paper we present a stochastic volcanic risk model for six Japanese volcanoes on which we base the construction of a parametric risk transfer tool. First, in Sect. 2 we describe the components of the risk model; i.e. hazard, vulnerability, exposure, and loss computation. In Sect. 3, we discuss the conceptualization and the mathematical design of a plausible parametric risk transfer tool leveraging physical descriptors of the eruptive events that are both simulated in the risk model as well as reported by public entities during the course of an actual event. The work draws from efforts carried out in the development of parametric triggers for other perils, fundamentally earthquake (Franco, 2010, 2013; Goda, 2013, 2014; Pucciano et al., 2017; Franco et al., 2018) and tsunami (Goda et al., 2019). Section 4 applies the framework presented to an application case study in Japan where a regional (or national) entity may desire to adopt this type of risk transfer mechanism to help offset costs associated with ash fall generated by an eruption of Mt Fuji. Conclusions and final remarks are collected in Sect. 5 where we elaborate on the potential application of this type of tool in a generalized, volcanic, global setting.
Japan is one of the most volcanically active countries in the world. There are 111 active volcanoes in Japan; on average, a total of 15 volcanic events (including eruptions) occur every year, some of which seriously hinder human life (JMA, 2019). Five Japanese cities, Tokyo, Osaka, Nagoya, Sapporo, and Fukuoka, are ranked among the top-20 cities most at risk from volcanic eruptions according to the Lloyd's City Risk Index (Lloyd's and Cambridge Centre for Risk Studies, 2018).
The development of a volcanic risk model for Japanese volcanoes allows for improving our ability to quantify said risk as a preliminary step to transferring it to the capital markets. The model focuses on physical damage of buildings arising from significant deposition of volcanic ash (tephra). The geographic scope is limited to the highly populated and industrialized prefectures of Tokyo and Kanagawa, potentially affected by the surrounding six major volcanoes: Fuji, Hakone, Asama, Haruna, Kita-Yatsugatake, and Kusatsu-Shirane (see Fig. 1). The model presented does not consider damage to contents, business interruption, or costs associated with ash fall clean-up. Neither does it consider other volcanic hazards such as lava flows, pyroclastic density currents, debris flows, or avalanches. The model is structured into four modules – hazard, vulnerability, built environment (or exposure), and loss calculation – which are described in more detail in the following subsections.
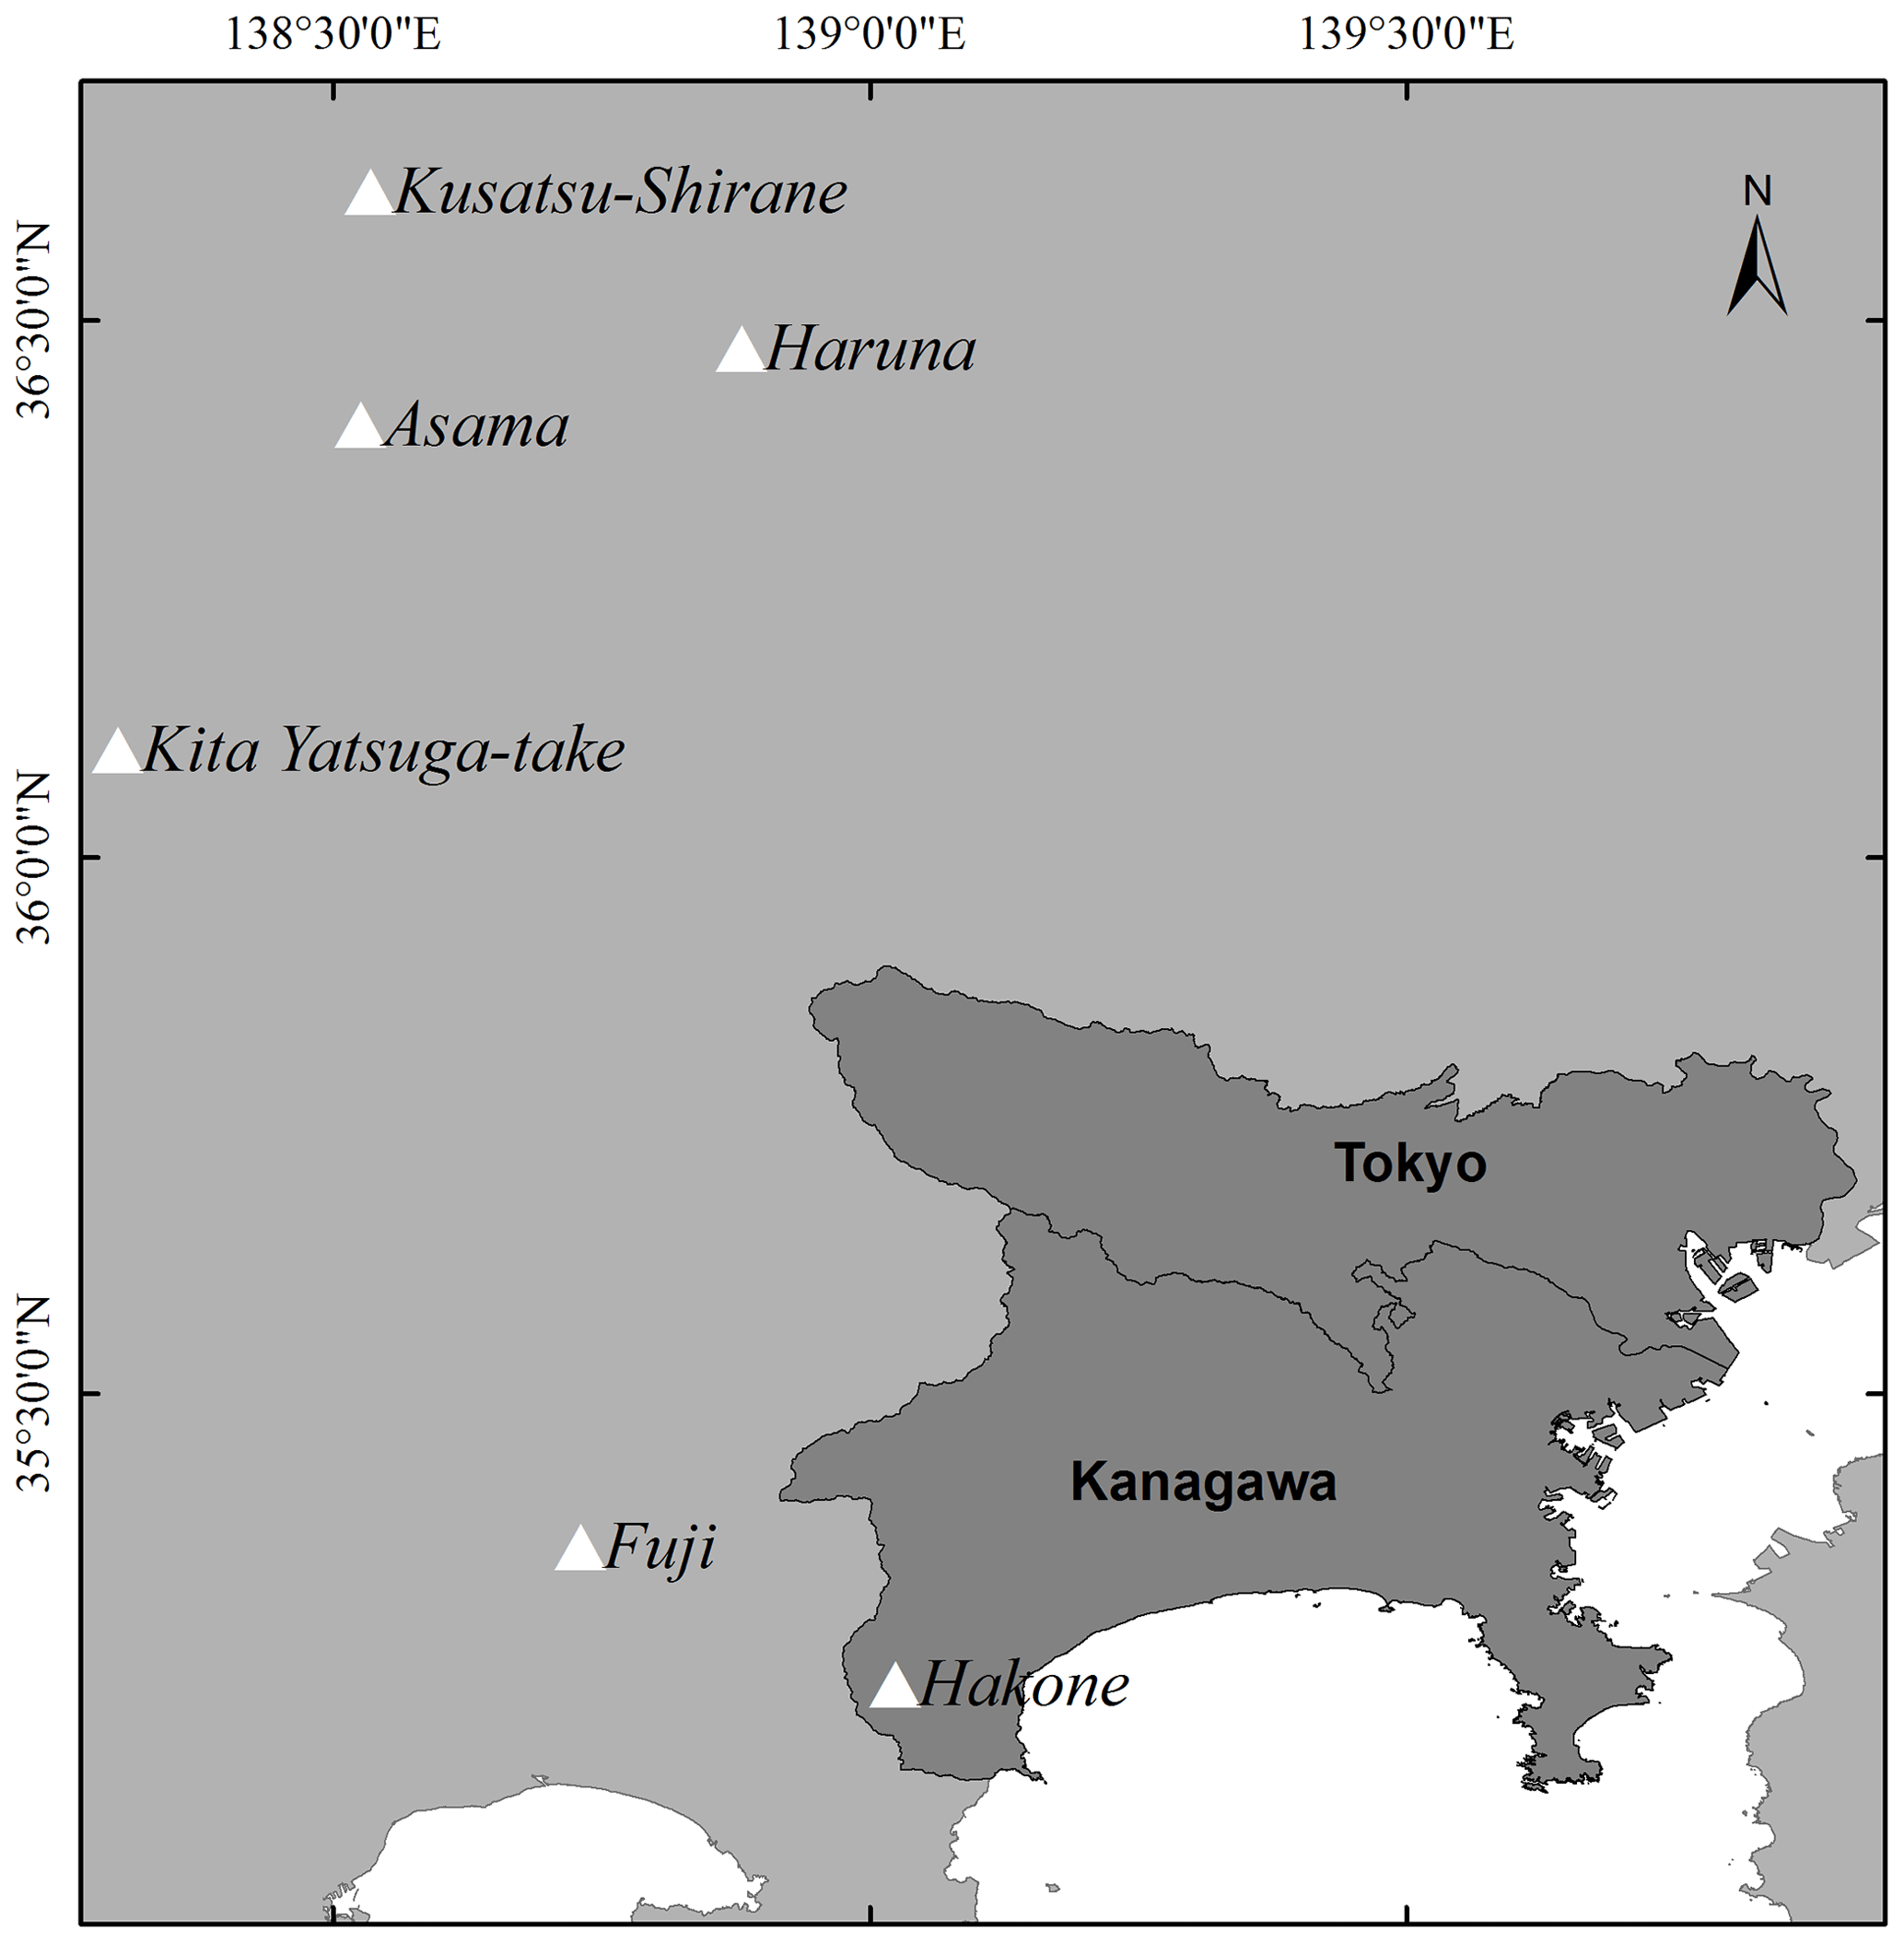
Figure 1The geographic domain of the volcano ash fall model presented in this paper includes the Tokyo and Kanagawa prefectures in Japan and the six major volcanoes that can affect them: Fuji, Hakone, Asama, Haruna, Kita-Yatsugatake, and Kusatsu-Shirane.
2.1 The hazard module
The hazard module consists of a collection of 26 807 volcanic ash fall footprints, each of them associated with one of the six modelled volcanoes and with an annual probability of occurrence (see Table 1).
Table 1Number of volcanic ash fall events included in the model (i.e. those ash fall events that impact the model's geographical domain of the Tokyo and Kanagawa prefectures) and associated annual probabilities of occurrence by volcano. Ash fall events originated by these volcanoes that do not impact the model domain have been excluded from the counts.

This original set of footprints was produced by Risk Frontiers in 2017 and was provided specifically for the purpose of building the volcano risk model that we present in this paper, on an exclusive basis. Modelling was performed using the Tephra2 numerical model, which simulates the dispersion of ash fall from a volcanic source using mass conservation and advection–diffusion equations (Bonadonna et al., 2015; Connor and Connor, 2006; Magill et al., 2015). Tephra accumulation is computed for specified locations surrounding a volcano in load units (kg m−2). The model takes into account vertical atmospheric profiles of both wind speed and direction, which in this case were generated from reanalysis wind data (NCEP–DOE Reanalysis 2; Physical Sciences Laboratory – NOAA).
The interaction of volcanic ash fall with rainfall may lead to an increase in the weight of the former due to absorption of water, leading to increased loads and consequently to potentially more severe damages of affected structures. In order to consider the possibility of ash-fall-producing eruptions being concurrent to rainfall, “wet” versions of the footprints were produced, respecting the rainfall patterns in the region of interest. The methodology used to create wet footprints follows that described by Macedonio and Costa (2012), whereby deposited ash fall increases its weight up to the point it becomes saturated with rainfall water, assuming a density of 1000 kg m−3 and a total porosity of 60 % for deposited ash fall from Mt Fuji. Following Macedonio and Costa (2012), we assume that all pores and interstices of the deposit are filled with water (water saturation), if enough water is available from a specific rainfall event. Rainfall data were supplied by JBA Risk Management in the form of 10 000 years of simulated daily precipitation that incorporates tropical cyclone and non-tropical cyclone precipitation.
2.2 The vulnerability module
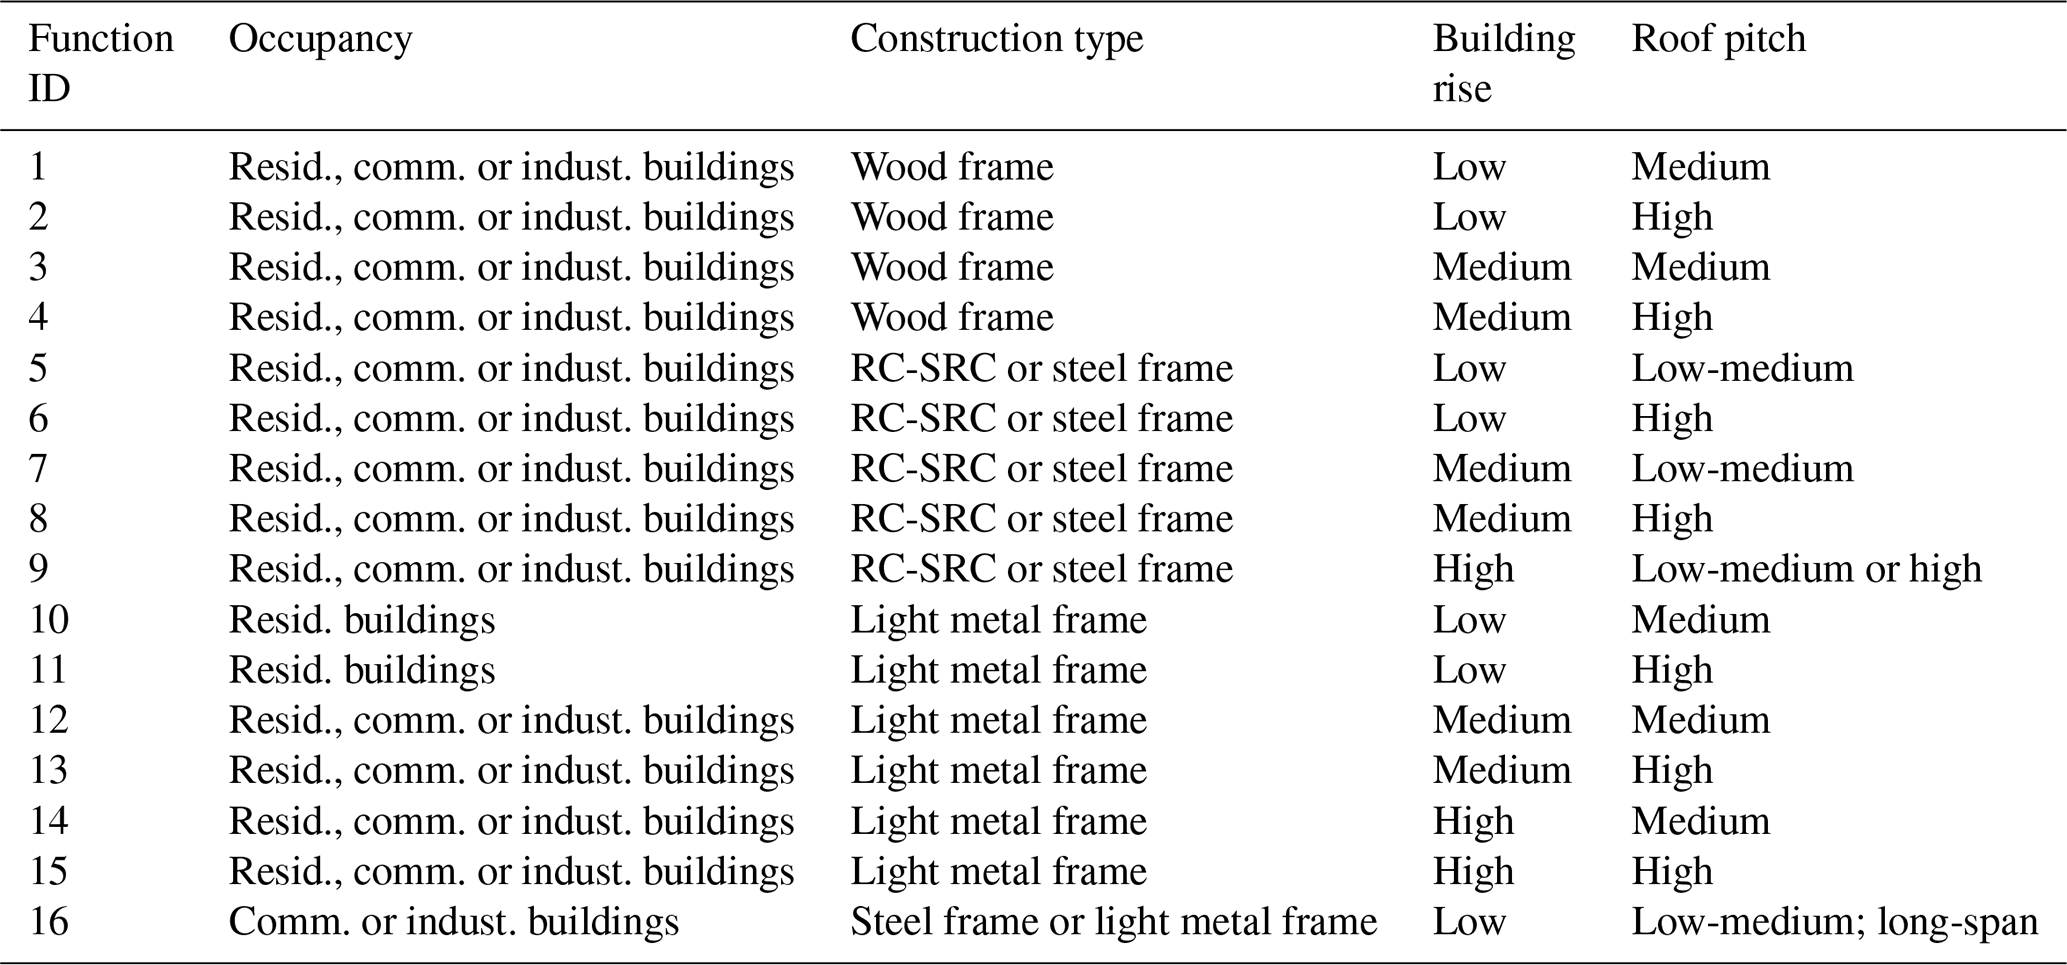
As mentioned previously, the model considers damage to buildings only (residential, commercial, or industrial), arising from the vertical loads imposed by tephra on the structures. The level of damage to a specific building depends on the total ash load and on the structural characteristics of the building. For each building type (i.e. a defined combination of construction type, building rise, and roof pitch) the model uses a specific vulnerability function that computes the probability of experiencing a certain level of damage (expressed as a damage ratio of cost of repair versus total cost of replacement) for a given physical load value upon that structure. The vulnerability functions were developed on the basis of several studies on the subject (Spence et al., 2005; Maqsood et al., 2014; Jenkins et al., 2014a, b; Blong et al., 2017a) for building typologies common in the area (see Table 2). Given the lack of data on roof type for individual structures, the model assumes probabilities of different roof types within the exposure set (low, medium, or high pitch) depending on the building occupancy, construction typology and building rise.
Table 2Building types common in the Tokyo and Kanagawa prefectures of Japan, for which specific vulnerability functions were developed in the volcano risk model. RC-SRC stands for “reinforced concrete – steel reinforced concrete”. “Resid.” stands for residential, “comm.” stands for commercial, and “indust.” stands for industrial.
Examples of damage functions used in the volcano risk model are provided in Fig. 2 for two contrasting building types (different construction type, building rise, and roof pitch).
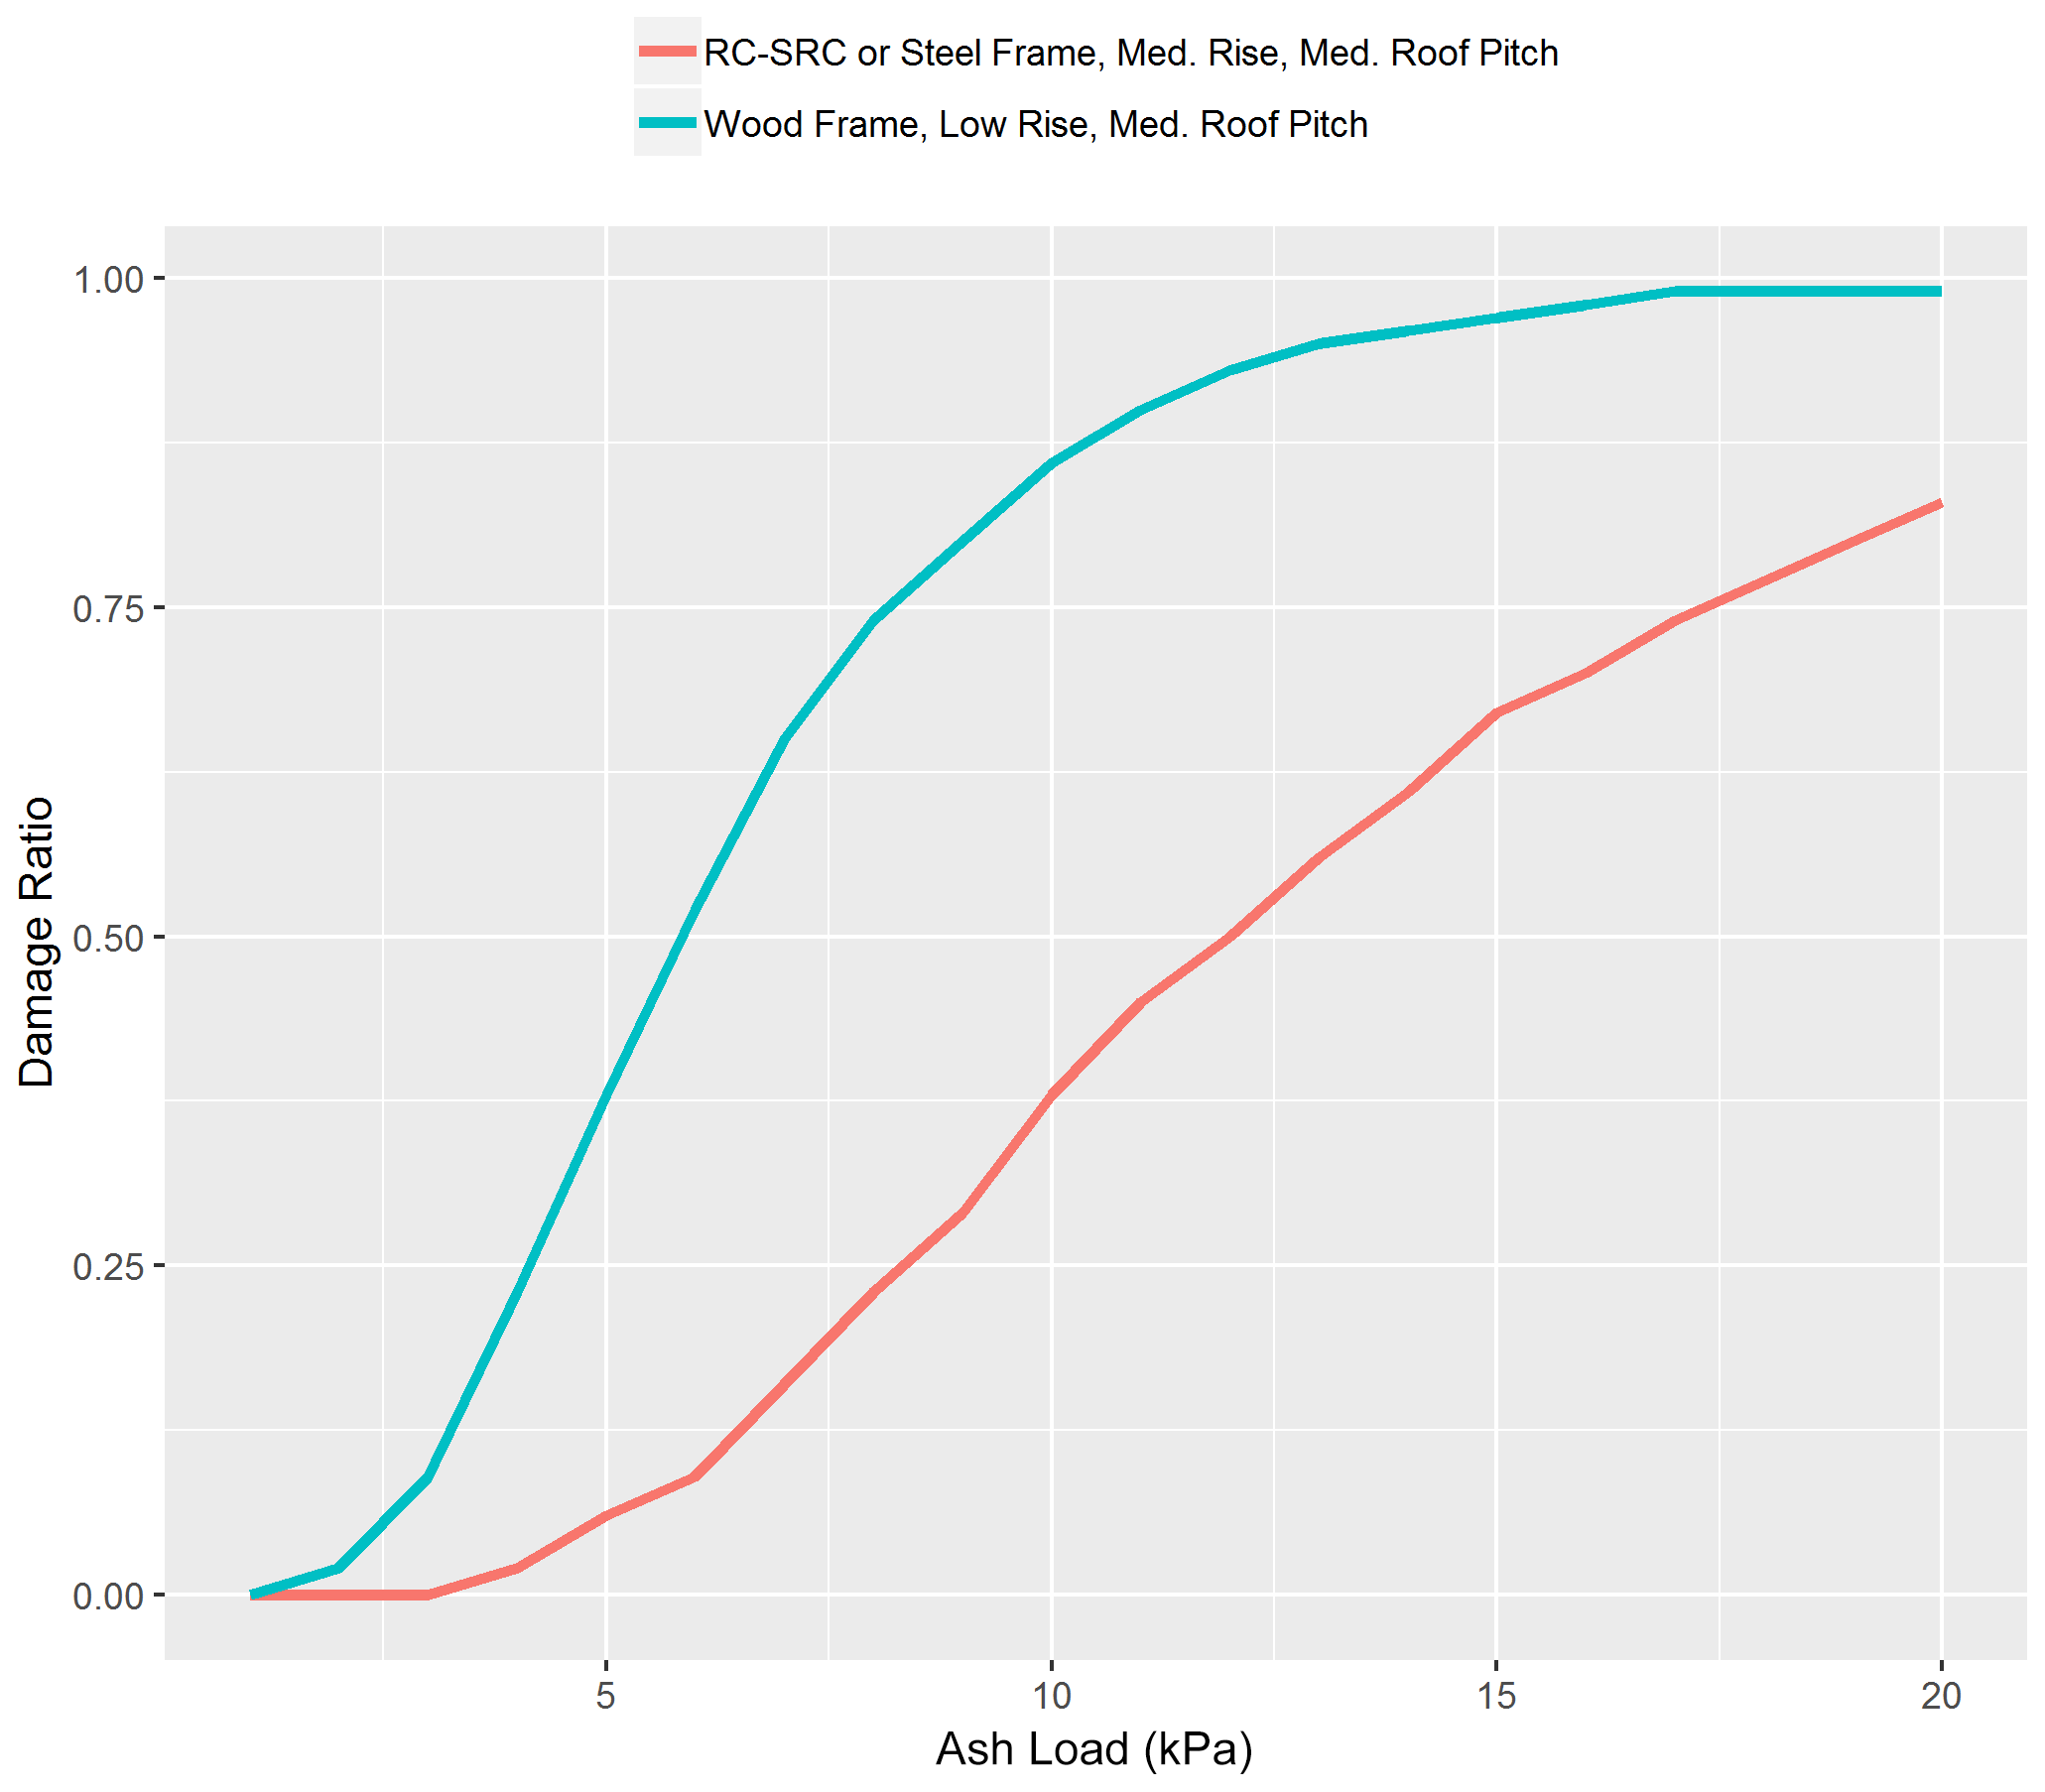
Figure 2Damage functions for two different building types considered in the volcano risk model (“RC-SRC” stands for reinforced concrete – steel reinforced concrete; “Med.” stands for medium); the source of these damage functions is Maqsood et al. (2014).
2.3 The exposure and the built environment (BE) modules
These two closely related modules jointly define the characteristics and monetary values of the group of buildings (“portfolio”) for which the model will produce risk metrics.
-
The exposure module consists of a database structure that allows the user to characterize the portfolio of interest and upload those details to the risk model in a structured manner, to subsequently run it. The main database fields relate to number of buildings and associated values (i.e. building replacement values), geographical location of the buildings (supported geocoding levels include geographical coordinates, five- and seven-digit postal codes, and prefecture), occupancy, construction type and building rise.
-
The built environment (BE) module is a database that completes the information provided by the user, wherever it is incomplete or not accurate enough. This database represents the built environment across the model geographical domain, specifically, the number, characteristics, and spatial distribution of the different building types as described in Table 2. The purpose of this module is twofold. On one hand it allows defining the likely location of buildings geo-located at resolutions coarser than the geographical coordinate in order to better characterize their relationship with the spatial distribution of the hazard. The BE distributes buildings into a finer spatial resolution on a probabilistic basis, using weights that are specific to each building type. Weights were computed on the basis of information such as land use and land cover type and census data. In the case of our model, data sources included the 2013 Housing and Land Survey (Statistics Bureau, Government of Japan), the 2014 Tokyo Statistical Yearbook (Tokyo Metropolitan Government), and Japan e-Stat (Ministry of Land, Infrastructure, Transport and Tourism), among others. The second purpose of the BE is to infer damage-relevant characteristics of buildings (e.g. building rise and construction type) if this information is not captured in the description of the buildings we want to model. This is again done on a probabilistic basis, depending on the location of the building and any known characteristics (e.g. building occupancy). To illustrate how the BE works, let us take an example of a residential building in a postal code in Kanagawa Prefecture. If that is all the information we know about this asset, the BE module will use the weights corresponding to residential buildings in that postal code to assign a specific location within the postal code and a set of characteristics (e.g. construction type) to this residential building (please see Table 2 for a list of possible residential building types). Such an assignation is probabilistic in the sense that a distribution of likely locations and characteristics will be generated for each risk, through iterative sampling based on those weights. Such a distribution will eventually be propagated to the loss calculation part of the model in order to produce a final loss distribution for this building.
2.4 The loss calculation module
The loss calculation module or engine estimates the monetary loss associated with each building for the different events that can potentially affect it. This is attained (for each event–building interaction) by multiplying the damage ratio prescribed by the corresponding vulnerability function and the replacement value of the building, which needs to be provided by the modeller. The loss calculation module allows reporting losses by building and by event (aggregate event loss).
Volcanic loss data are very scarce due to the low frequencies of damaging eruptions. We used a few independent sources to validate modelled losses. These included two studies on damage estimations of a repeat of the 1707 Fuji eruption (Kuge et al., 2016; Cabinet Office of Japan, 2002) that were used to validate modelled losses from severe eruptions. To validate modelled losses from less severe eruptions, we used as a proxy data on insured building losses caused by loading of snow in Toyo and nearby prefectures in February 2014 (General Insurance Association of Japan, 2015). Kuge et al. (2016) modelled losses for industrial buildings (with an assumed value of JPY 1 billion per building) if there was a repeat of the Fuji 1707 eruption. Estimated individual building losses ranged between JPY 35 and 180 million (Kotaro Kuge, personal communication, 2017). This compares well with our modelled losses between JPY 28.6 and 138.4 million for industrial buildings, under a reconstruction of the Fuji 1707 eruption. Regarding residential buildings, the reported average building loss value for the February 2014 snowfall event in Japan was JPY 1.2 million (General Insurance Association of Japan, 2015). Assuming a snow density value of 200 kg m−3, we identified ash fall events in the volcano model producing equivalent loads and calculated an average residential building loss of JPY 1.7 million.
A parametric trigger refers to a specific value or threshold of a physical, measurable characteristic associated with the natural phenomenon in question (e.g. to ash-fall-producing volcanic eruptions in this case, or earthquakes and hurricanes), above which a significant level of damage of exposed assets (e.g. damage to buildings) is likely to occur. When the physical parameter exceeds that threshold for a particular event, it is considered that a risk cedent should receive a payment commensurate with the loss that their portfolio will likely incur as a result of being exposed to the event.
Therefore, when designing a parametric risk transfer mechanism, it is crucial to select a physical parameter that correlates well with potential losses. In the case of parametric earthquake risk transfer, for instance, it is common to select the magnitude of the earthquake as the main parameter and subsequently define the threshold value(s) for the magnitude scale, above which significant damages are likely to occur (Franco, 2010, 2013). Other alternatives used in practice consider shaking measurements such as peak ground accelerations or spectral accelerations at a set of locations (Goda, 2013, 2014; Pucciano et al. 2017).
There are three important requirements for the selection of a physical characteristic of a natural phenomenon to be used as a parametric trigger in the design of a risk transfer mechanism.
-
The parameter must exhibit strong correlation to losses incurred as a consequence of the physical phenomenon.
-
The parameter needs to be measured and reported by a reliable and impartial organization on a near-real-time basis. In the case of earthquakes, for instance, earthquake information is often obtained from reliable international bodies such as the US Geological Survey (Wald and Franco, 2017).
-
Finally, each of the stochastic events in the catastrophe risk model used as a basis to design the risk transfer solution must explicitly include the corresponding value for the selected physical parameter. In the case of earthquake risk transfer, for instance, each of the earthquake events in the catastrophe risk model needs to be described by its magnitude (if this is the metric of choice for the trigger conditions).
3.1 Choosing the trigger parameters for volcanic eruptions
In our case study, we have researched several physical parameters associated with the phenomenon of volcanic ash falls, as well as Japanese organizations reporting this type of information on a real-time basis while a volcanic eruption unfolds. In Japan, the Japanese Meteorological Agency (JMA) operationally monitors volcanic activity throughout the country and issues relevant warnings and information to mitigate related damages. To continuously monitor volcanic activity, JMA deploys seismographs and related observation instruments in the vicinity of 50 volcanoes that are remarkably active in Japan. When volcanic anomalies are detected, the agency steps up its monitoring/observation activities and publishes volcanic information and regular bulletins, mainly “Observation Reports on Eruption” and “Volcanic Ash Fall Forecasts” (VAFFs). The observation reports and VAFFs are published on a real-time basis for all active volcanoes in Japan; however they contain different types of information. Observation reports provide information on the ongoing eruption, such as eruption time, eruptive column height (in metres above the crater), the main direction of movement of the eruptive plume at the moment of the report (as per eight cardinal directions: N, NE, E, SE, S, SW, W, and NW), and the maximum plume height recorded from the onset of the eruption (Hasegawa et al., 2015). On the other hand, the VAFFs consist of modelled (not observed) ash fall areas and amounts and are produced when heavy (>1 mm) or moderate (0.1–1 mm) ash quantities are forecasted in principle. These maps correspond to the moment when the VAFF is issued, and cumulative ash fall map products (i.e. the total accumulated ash fall on the ground throughout the eruption) are not released by JMA.
Eruptive column height values are available for each eruptive event present in the volcano risk model. In addition, we estimate the predominant direction of movement of the eruptive plume for each event by assuming it coincides with the main axis of ash fall deposition on the ground. Therefore, we calculate the main direction of deposition of ash fall for each of the event footprints in the model by performing spatial analyses. Resulting azimuths were classified into eight directional sectors (N, NE, E, SE, S, SW, W, and NW) and used as a proxy for the main direction of movement of the generating eruptive ash plume.

Figure 3Relationship between the height of the eruptive column (in km, from crater rim) and modelled losses for all eruptive events in the volcano risk model. Each panel displays a subset of eruptions featuring a specific predominant direction of their eruptive plume (east, north, north-east, north-west, south, south-east, south-west, and west).
Based on the above, we selected a combination of two eruption-related parameters (reported eruptive column height and direction of movement of the eruptive plume) for the design of our parametric trigger, since
-
these two parameters are reported by JMA on a near-real-time basis when an eruption occurs;
-
the height of the eruptive column and preferential direction of movement of the eruptive plume for each of the stochastic events in the model can be assigned based on existing datasets; and
-
we found a significant relationship between eruptive column height and losses as modelled by the volcano risk model (Fig. 3). Pearson correlation tests were performed between eruptive column height and losses, for eight subsets of eruptive events with defined eruptive plume directions (i.e. E, N, NE, NW, S, SE, SW, W). Resulting p values were all smaller than α=0.05, indicating a significant correlation between eruptive column height and losses for all directional sectors.
Other eruption parameters that could be sensitive indicators of losses are total eruption mass and eruption duration; however they were found not to fulfil all the necessary conditions to become part of the trigger design. In the case of total eruption mass, this parameter does not fulfil the requisite of being obtainable on a near-real-time basis (condition number 2 in Sect. 3) – even though it does fulfil conditions 1 and 3 mentioned in the section. In particular, cumulative ash fall maps are typically not made available by JMA, and it is thus not straightforward to establish a relationship with losses. Regarding eruption duration, it does not fulfil condition number 3 in Sect. 3 (this parameter is not part of the stochastic event set in the catastrophe risk model developed). Future development of more complex and complete eruption catastrophe risk models should enable further investigation of alternative parametric designs for volcanic eruptions, using different – or a combination of different – triggers.
3.2 Choosing the trigger type
The next step consists of designing the parametric trigger on the basis of the two physical eruptive parameters selected. We have, however, several choices in the formulation of such a trigger (Wald and Franco, 2016; Pucciano et al., 2017). In this paper, we focus on two simple variants:
-
binary triggers, for which each event of the stochastic catalogue can either pay or not pay a fixed monetary amount, P, depending on whether it exceeds the parameter threshold defined by the specific design; and
-
multilayer triggers, for which each event can pay one of N predefined payment levels, associated with a series of defined parameter thresholds.
The binary trigger can be seen as a particular case of a multilayer trigger with N=1. As treatment of this case is easier, we start with the design of a binary parametric trigger and we later generalize it to N payment levels.
Since we are building a trigger using plume height and ash plume direction expressed as per eight wind sectors (N, NE, E, SE, S, SW, W, NW), it is natural to represent the trigger simply as a set of threshold plume height values for each wind sector, {Hs}s∈W, where W is the set of the possible wind sectors.
This means that if an event i has plume height hi and wind sector si, it triggers a payment if and only if , which is the trigger condition.
We can model the behaviour of the trigger using the stochastic events in the volcano risk model. Let us call T the set of the stochastic events fulfilling the trigger conditions. Since they are the only events releasing a payment, their exceedance rate, collectively, defines the payment occurrence rate.
where ri stands for the event occurrence rate. From the trigger rate we obtain the yearly triggering probability as as usual for a Poisson process. The expected payment in a year can be expressed either as or , but since we generally have p∼R the impact of the difference is minimal.
If we interpret the trigger as insurance, the EP would correspond to the pure premium of the policy, which is a quantity somewhat proportional to its price. Thus, the more often the trigger is activated the more expensive it is. Given a certain trigger payment and a certain yearly budget, we can thus derive a target triggering rate R*.
Since the trigger pays a fixed amount, it will always provide either too much money or too little, if compared to the actual event loss. This difference is expressed via the following quantity, called basis risk, which we define based on Franco (2010) as
where Pi=P if i∈T and 0 otherwise and represent the loss component in the loss layer of interest. The first (second) term is called positive (negative) basis risk.
3.3 Optimization of the trigger
The standard approach to trigger design consists of choosing the trigger thresholds such that basis risk is minimized (Franco, 2010; Goda, 2013, 2014; Pucciano et al., 2017). Since the budget and the trigger recovery do tend to change during the design process, recent approaches have considered the alternative objective that the trigger simply maximizes the amount of risk transfer (Franco et al., 2018, 2019), i.e. find T that maximizes the quantity defined as
where li is the loss for event i; that is, we want a trigger which is activated by those events in the catalogue that collectively have the greater expected annual loss. Maximizing the risk transfer is quite apt, since it states clearly that the trigger is designed to be activated on the set of events that affect the policy holder the most.
Using the trigger condition we can rewrite the risk transfer equation as a function of the trigger parameters as
where ρs(Hs) is the risk transferred by all the events in sector s, which is a function of the threshold value for that sector, Hs.
If we discretize the possible values of Hs in a vector, , and we compute all the possible values of rts for this vector, , we can rewrite the risk transferred per sector as
where is a vector of 0 and one single 1 placed at the index k′ such that . This means that we can write Hs as
When plugging Eq. (2) in Eq. (1), the risk transfer equation becomes
It seems an overcomplication of a previously simple equation, but actually we eliminated the sum over i∈T. Now the unknown is moved from the set T to the vectors xs, which resembles a problem of linear algebra (it is not, given the particular form of the vectors, but it is still easier to approach than before). We can now apply similar considerations to the rate equation obtaining an expression for the payment occurrence rate
where . At this point we can rewrite the trigger design as the following optimization problem:
where R* is the target trigger rate and ΔH is a maximum threshold difference between two adjacent wind sectors. Limiting this difference is a way to take into account epistemic risk, that is, risk induced by using a particular model. It is also a way to decrease trigger sensitivity to the wind sector parameter.
The last two constrains, instead, are just a way to express the peculiar form of the xs vectors.
The problem, thus stated, can be solved with linear programming techniques (Franco et al., 2019) or with other alternative methods (De Armas et al., 2016). The problem is solved in this paper using standard Python libraries for mixed integer linear programming.
As can be seen from the equations for K and R, these two quantities are non-decreasing when the number of trigger events increases. Thus, maximizing K involves increasing the number of events captured by the trigger (by decreasing the threshold values) up to a certain point where the critical value R* is reached. This constraint, as all the other constraints of the optimization, imposes a trade-off to the max(K). The curve described by max(K) as a function of R* is a Pareto front, an example of which is depicted in Fig. 4.
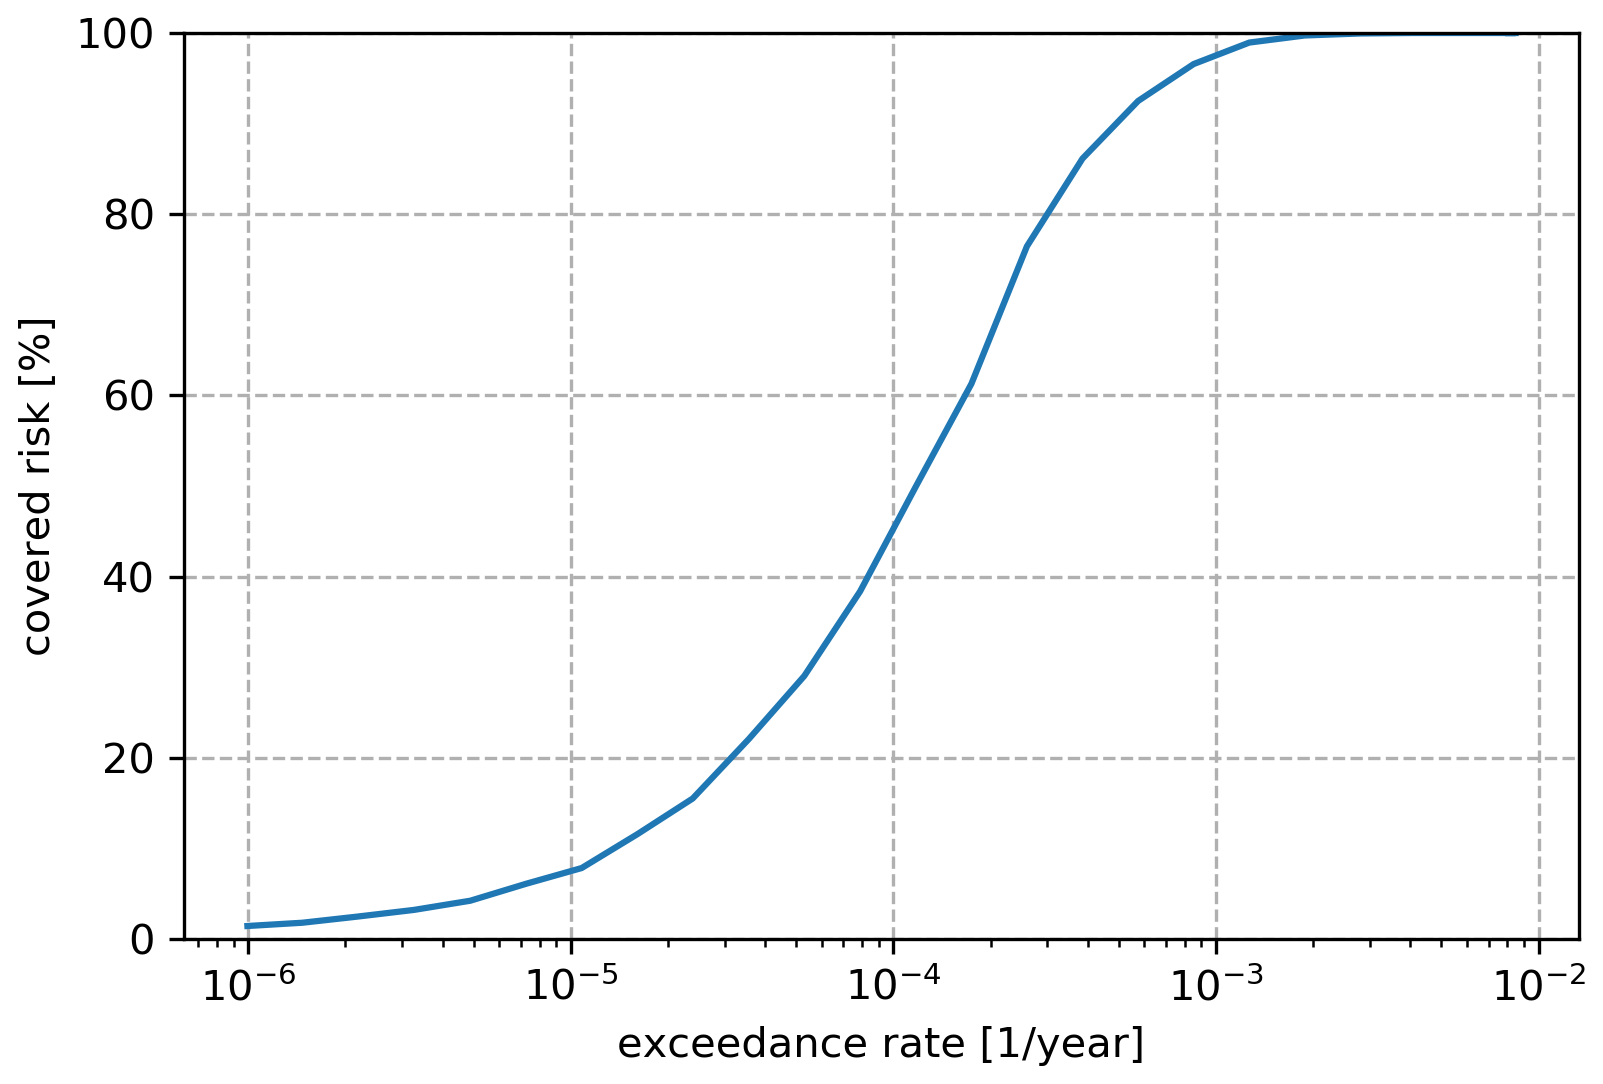
Figure 4Pareto front for a binary trigger design modelling stochastic losses for Mt Fuji. The transferred risk is displayed as percentage of the total risk.
In a multi-layer payment trigger, instead of having one single threshold height value we have a series of threshold values for each wind sector. Each threshold value pays a certain fraction of the maximum payment. Let us suppose we can generate a two-layer trigger. We decide in advance that the occurrence rate of the first and second payment will be and respectively, with .
To build the trigger we follow these steps.
-
We build a binary trigger, with occurrence rate .
-
We build a second trigger with occurrence rate . The problem is identical to the binary one, but with an additional constraint:
which means that each threshold must be greater than or equal to the threshold for that sector in the lower layer. It is easy to generalize to N layers imposing at each layer n the constraint .
For this application, we consider a case where a cedent such as a regional government may want to consider financing the risk of economic losses arising from damage to citizens' residential properties in the prefectures of Tokyo and Kanagawa, caused by the potential occurrence of damaging eruptive ash fall events. We assume that the government has an implicit need to help reconstruct citizens' dwellings after a catastrophic volcanic event and may therefore want to consider adopting a parametric risk transfer solution appropriately designed for these cases.
The first step consisted of putting together a comprehensive portfolio of residential properties for the modelled geographical area (Tokyo and Kanagawa prefectures). This portfolio is the input that needs to be provided to the volcano risk model, for it to calculate potential losses on a probabilistic basis. To do so, we used the census data incorporated in the model database, which consists of the number of dwellings by administrative unit (Shiku) and by type of residential occupancy (single family or condominium). The cost of rebuilding each of the properties also needs to be provided to the model, and we used different information sources to estimate representative rebuilding costs for single-family dwellings and condominiums in the prefectures of Tokyo and Kanagawa (Table 3).
Table 3Representative reconstruction values have been estimated on the basis of several sources of information, including data on building construction values from Japanese Government Statistics (https://www.e-stat.go.jp, last access: 12 March 2019) and insured building values from the General Insurance Rating Organization of Japan (https://www.giroj.or.jp, last access: 12 March 2019).
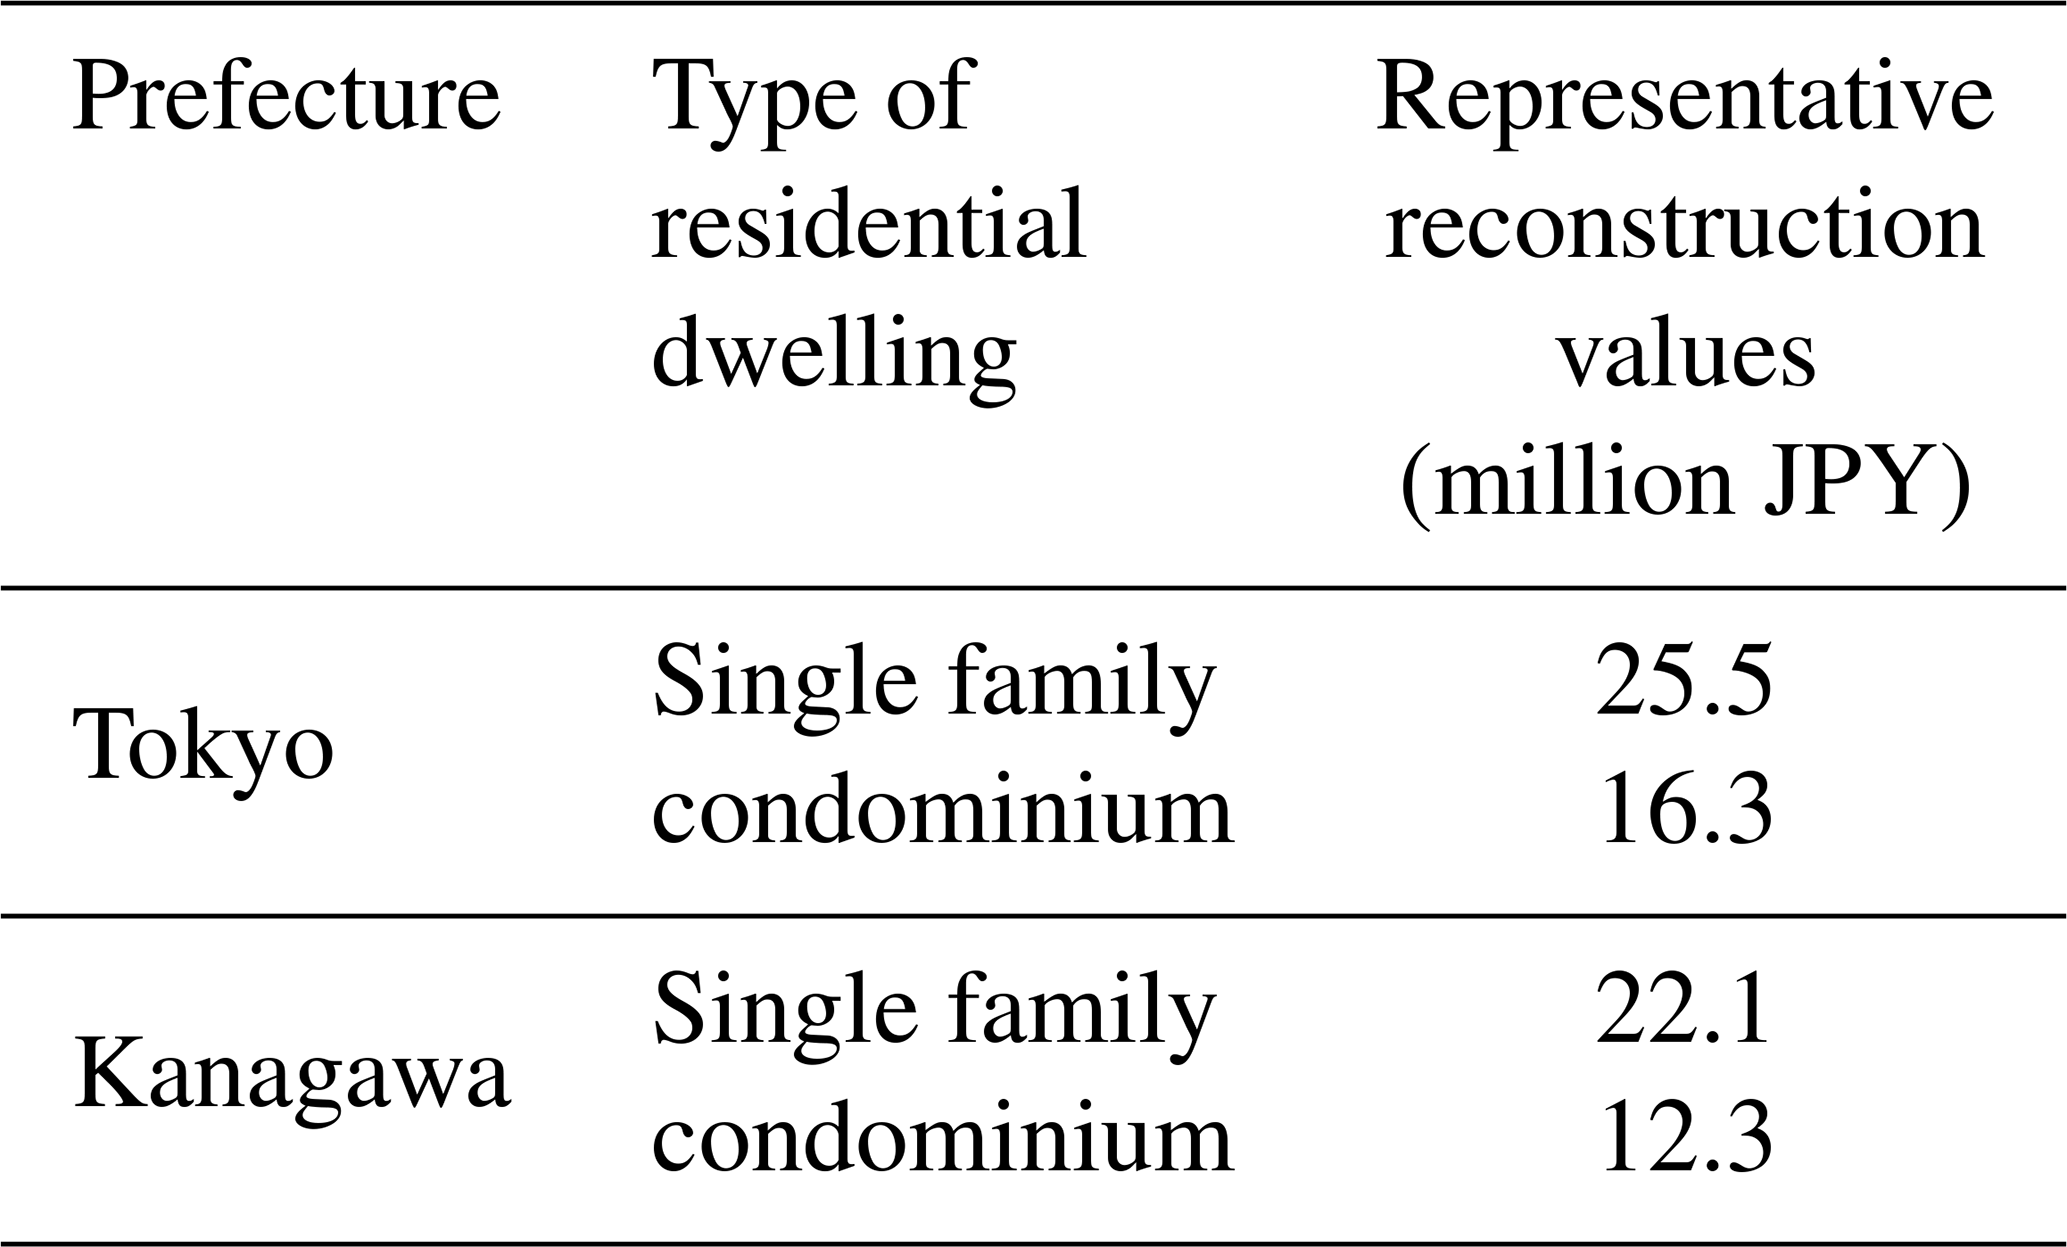
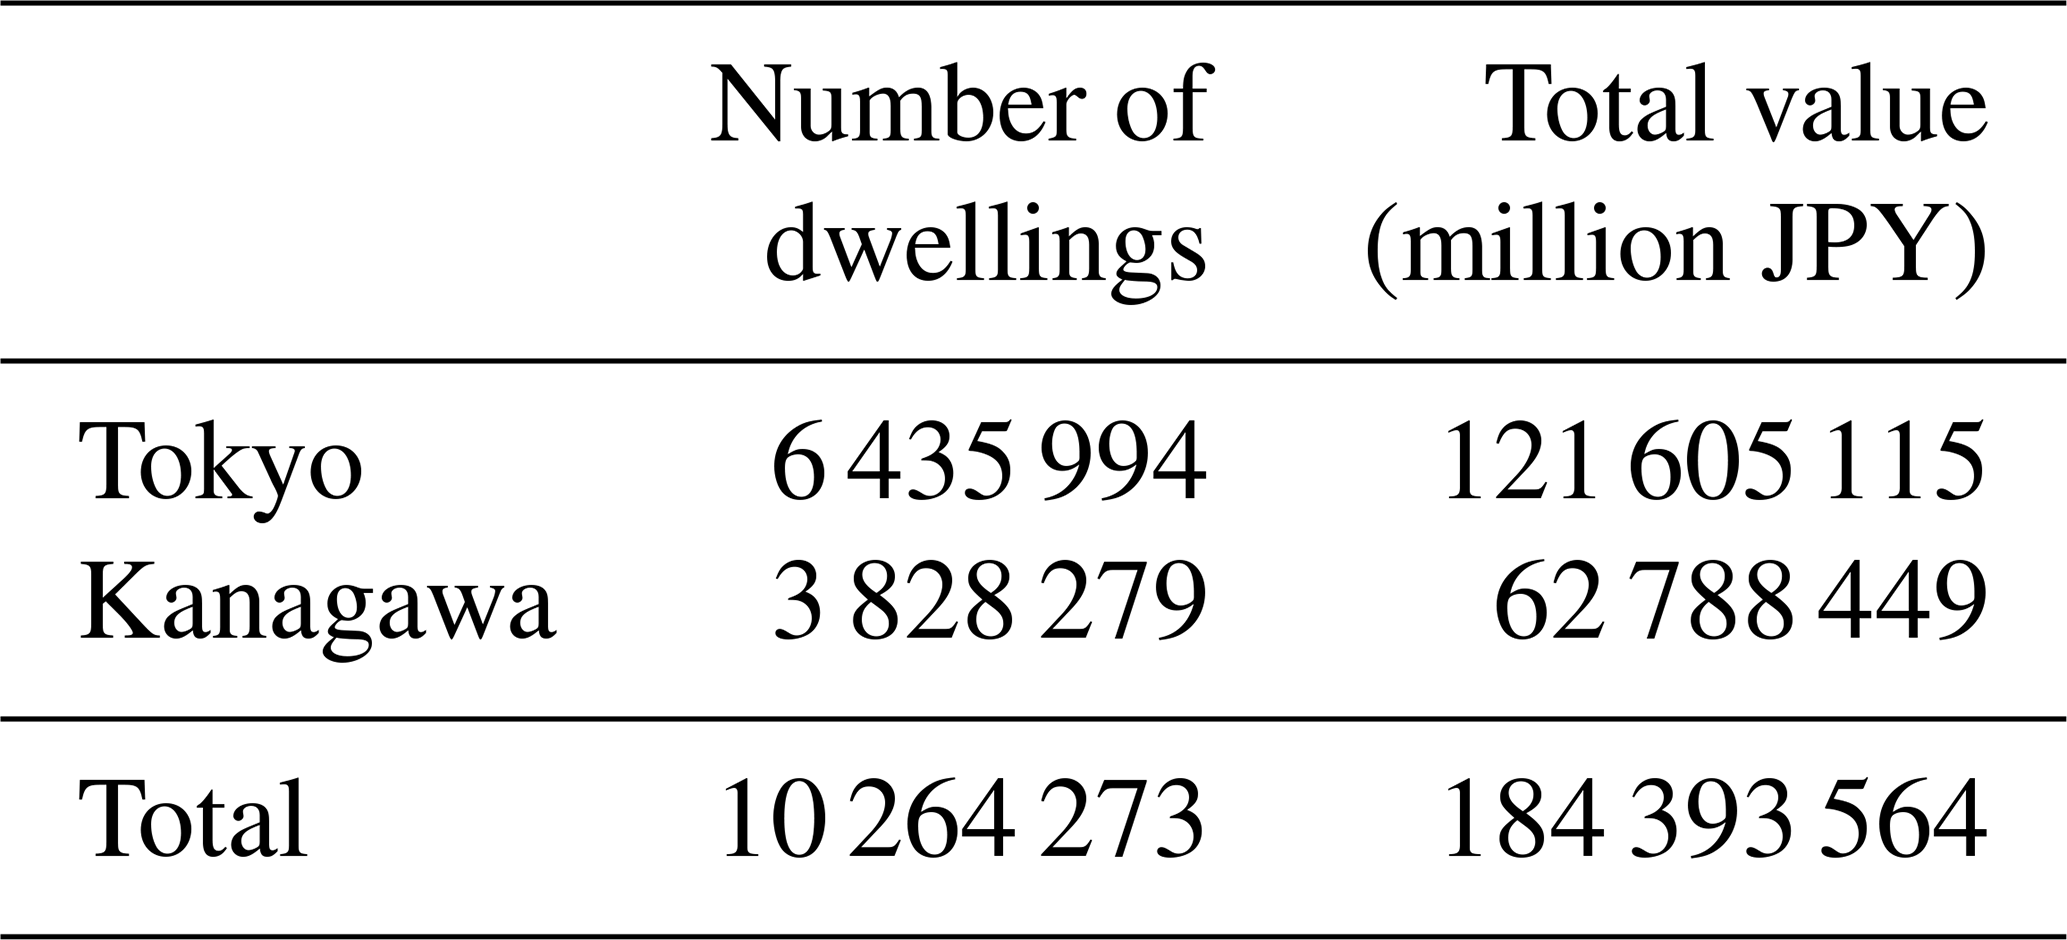
Table 4 provides a summary of the total number of dwellings and corresponding total reconstruction values for the modelled portfolio.
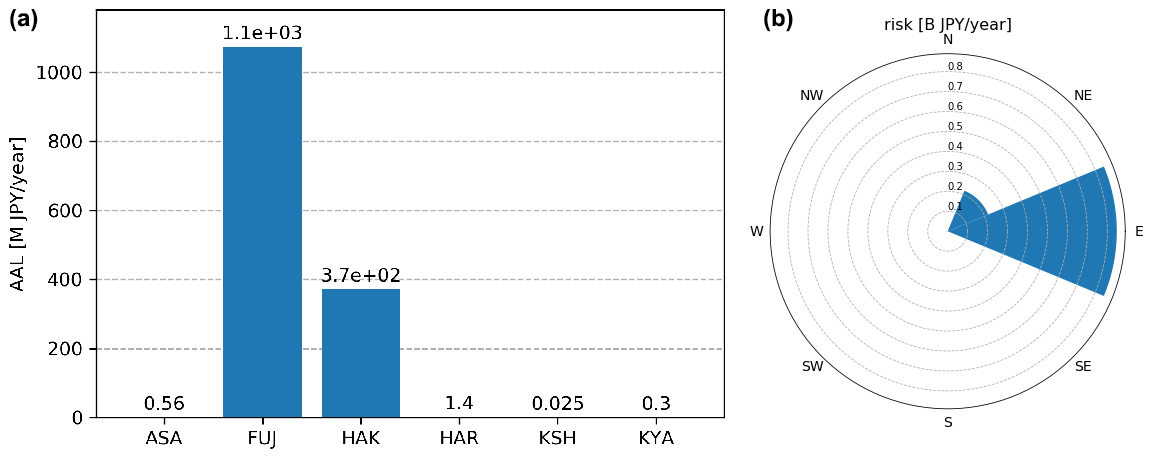
Figure 5(a) Modelled AAL for the six volcanoes included in the volcano risk model. (b) Breakdown of Mt Fuji risk by wind sector.
Table 4Total number of dwellings and total reconstruction values modelled in the volcano risk model for six Japanese volcanoes (by prefecture, and totals). Number of dwellings are from Japanese Government Statistics (https://www.e-stat.go.jp, last access: 12 March 2019); total Values have been calculated on the basis of representative reconstruction values in Table 3.
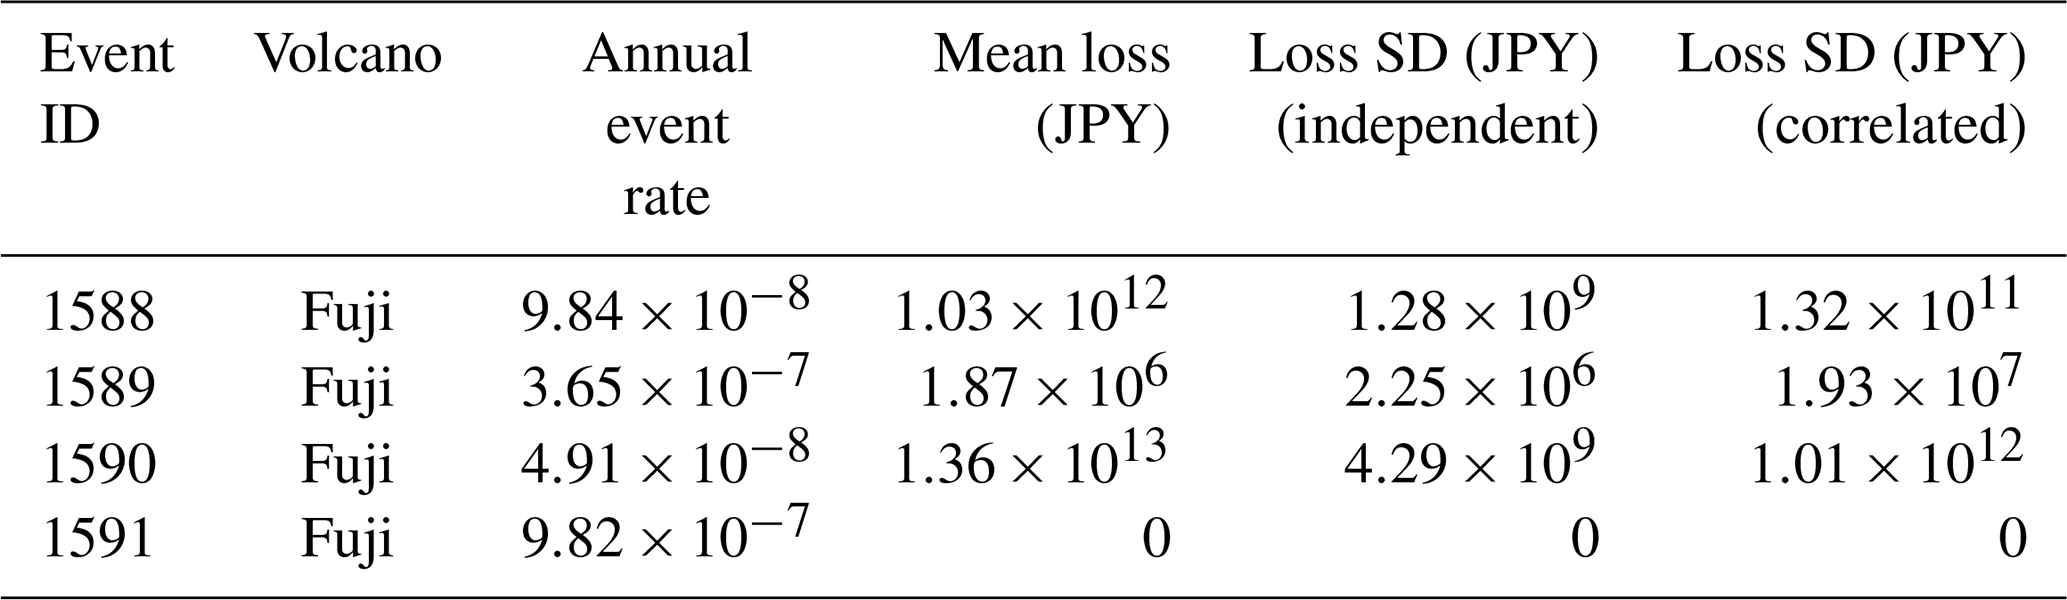
The volcano risk model was run and results were extracted as an event loss table, or ELT (i.e. losses produced by each of the volcanic ash fall events included the model, on the residential portfolio considered). Table 5 provides an example of results for a few ash fall events from Mt Fuji. Losses can be equal to zero for events either impacting areas outside the model's geographical domain (i.e. Tokyo and Kanagawa prefectures) or impacting geographical areas within the model domain that have no (modelled) buildings located in them.
Table 5Subset of ELT outputs from the volcano risk model, with the run of the residential portfolio described. The table shows losses on the portfolio caused by four of the model's ash fall events from Mt Fuji. The mean loss and the standard deviation of the loss distribution associated with each event (in JPY) are reported in the ELT.
The ELT results were used to analyse the correlation between the height of the eruptive column and modelled event losses (Fig. 3), which is a pre-requisite for the selection of this metric for the design of the parametric trigger. Figure 3 plots, for each modelled ash fall event, the height of the eruptive plume (x axis) versus the logarithm of the modelled loss (y axis), showing a strong correlation between the two. Each panel in Fig. 3 depicts eruptive events featuring a specific predominant dispersal direction of their eruptive plume (east, north, north-east, north-west, south, south-east, south-west, and west). The correlation between plume height and loss holds for all direction sectors. Dispersion in the plot is due to the fact that the severity of loss, despite being strongly correlated with plume height and plume direction, also depends on other factors, such as duration of the eruption and size distribution of eruptive particles.
Calculation of annual average losses (AALs) for the modelled portfolio on a per-volcano basis (Fig. 5, left) shows that Mont Fuji is the main risk source, with its average AAL amounting to more than 1 billion JPY per year. Therefore, we chose Mt Fuji for the calculation of the parametric risk transfer structure. Being located westward of the exposure domain, risk associated with Mt Fuji is mainly concentrated in the eastern wind sector. In particular, the only sectors containing risk are NE, E, SE, S and SW, even if the last three contain only a minimal part (Fig. 5, right).
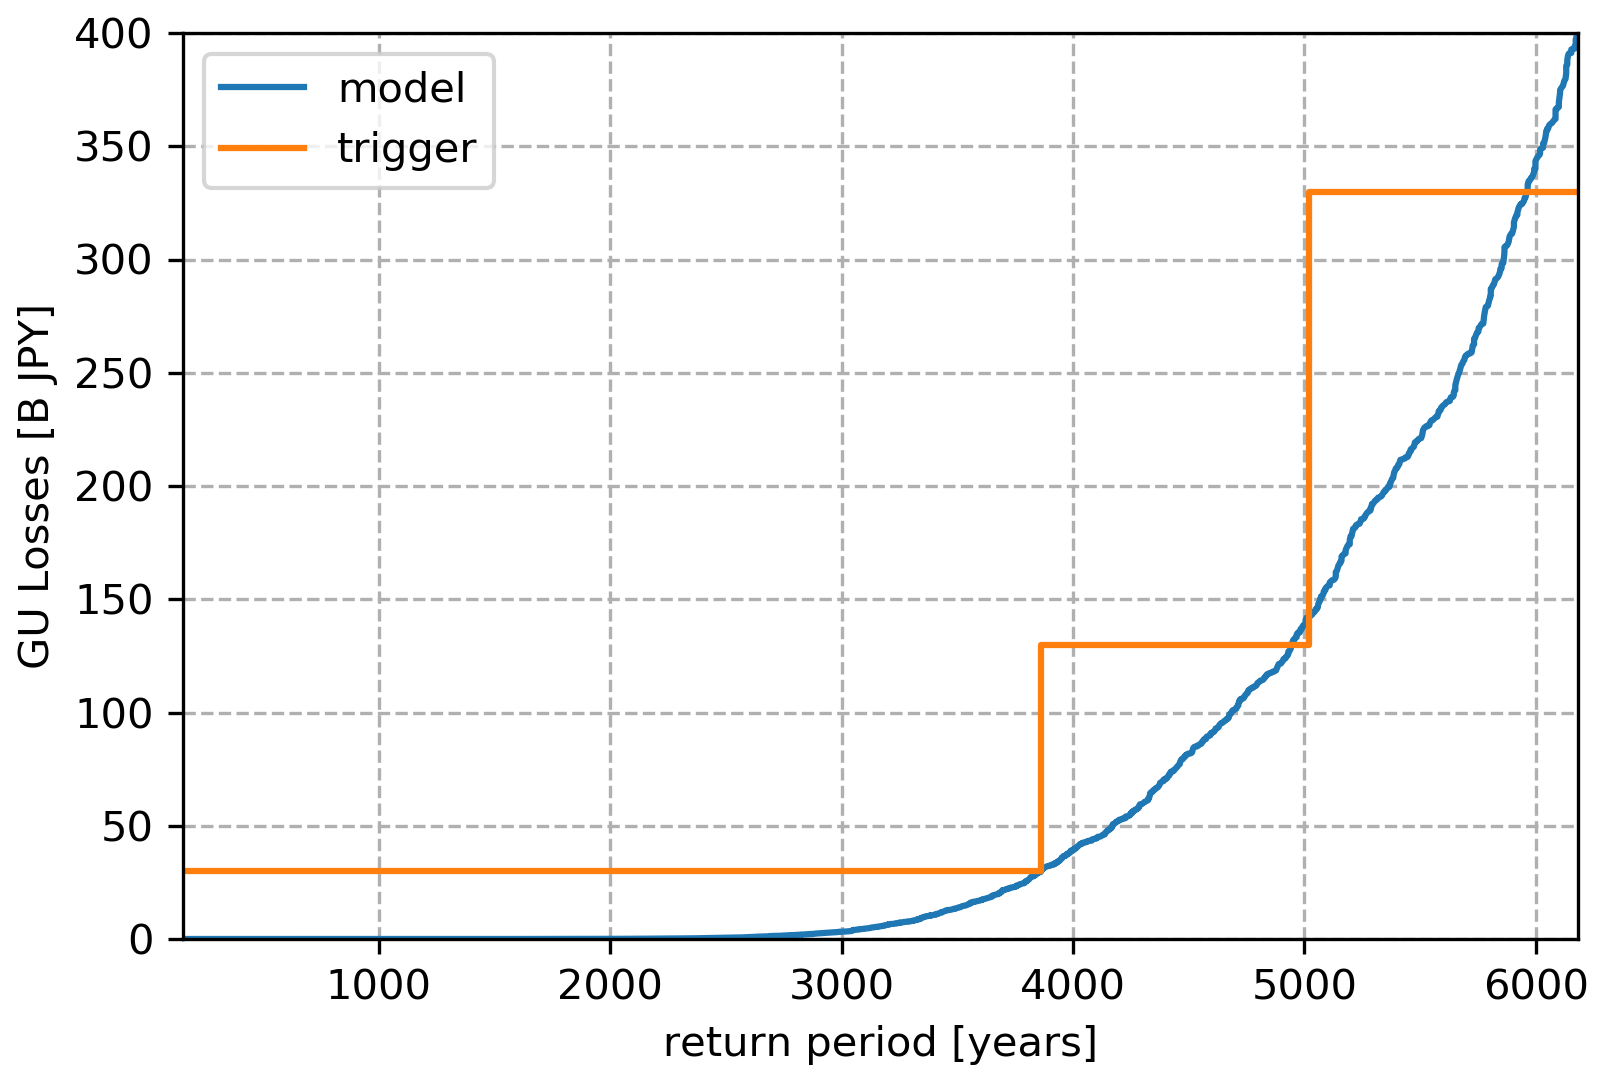
The occurrence exceeding probability curve (OEP) derived from the modelled losses for Mt Fuji is depicted in Fig. 6. As an example, we imagine that the policy holder might be interested in covering all losses exceeding JPY 30 billion with a parametric coverage releasing two possible payment levels of JPY 100 and 300 billion. This means
We choose the target exceedance rates for these layers to match the corresponding return period on the OEP curve, 3862 and 4944 years. In this way we end up with the trigger OEP curve depicted in Fig. 6.
We also imposed a plume height discretization of 1 km, i.e. , 2, … 50 km), and a maximum threshold difference between adjacent sectors ΔH=4 km.
Table 6Parametric trigger for Mt Fuji. The risk transferred by each layer is expressed as percentage over the total risk of Mt Fuji. The layer payment is expressed as fraction of the maximum payment (JPY 300 billion).
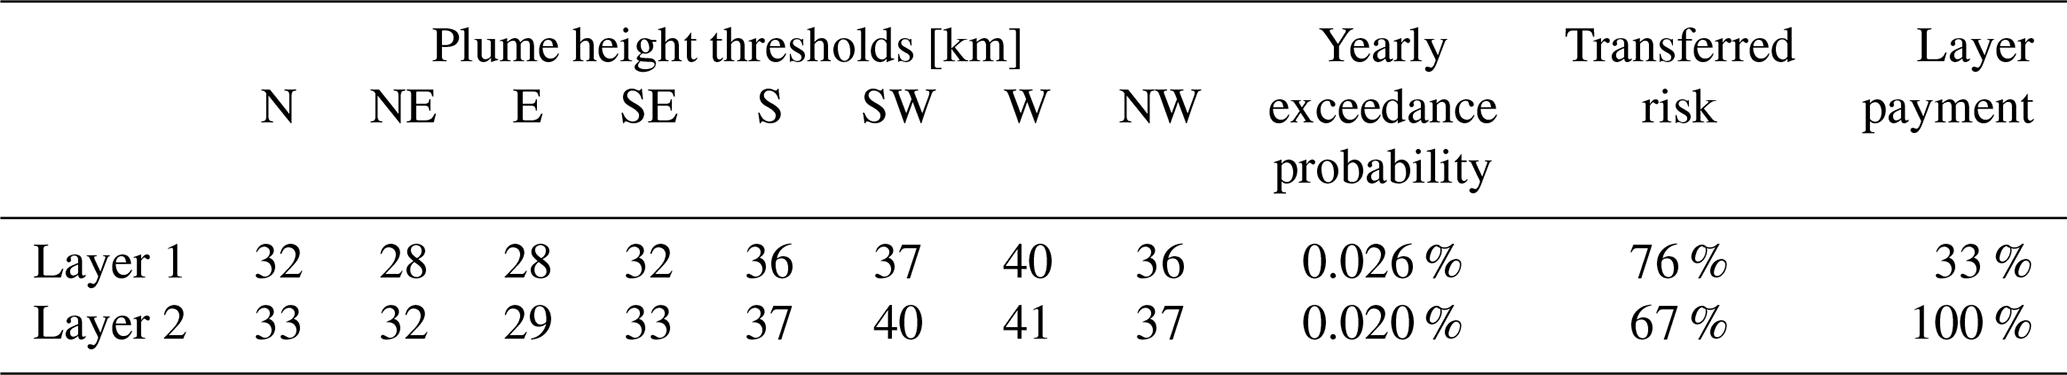
The result of the optimization algorithm is depicted in Fig. 7. The (wind sector, plume height) plane is divided into three payment regions, separated by the two trigger layers. As expected, the plume height thresholds are smaller for regions of high risk. The smoothing condition ensures that there is coverage also in the sectors that are adjacent to the sectors at risk, in case that an event has ash fall direction close to the border between two sectors and it is categorized wrongly.
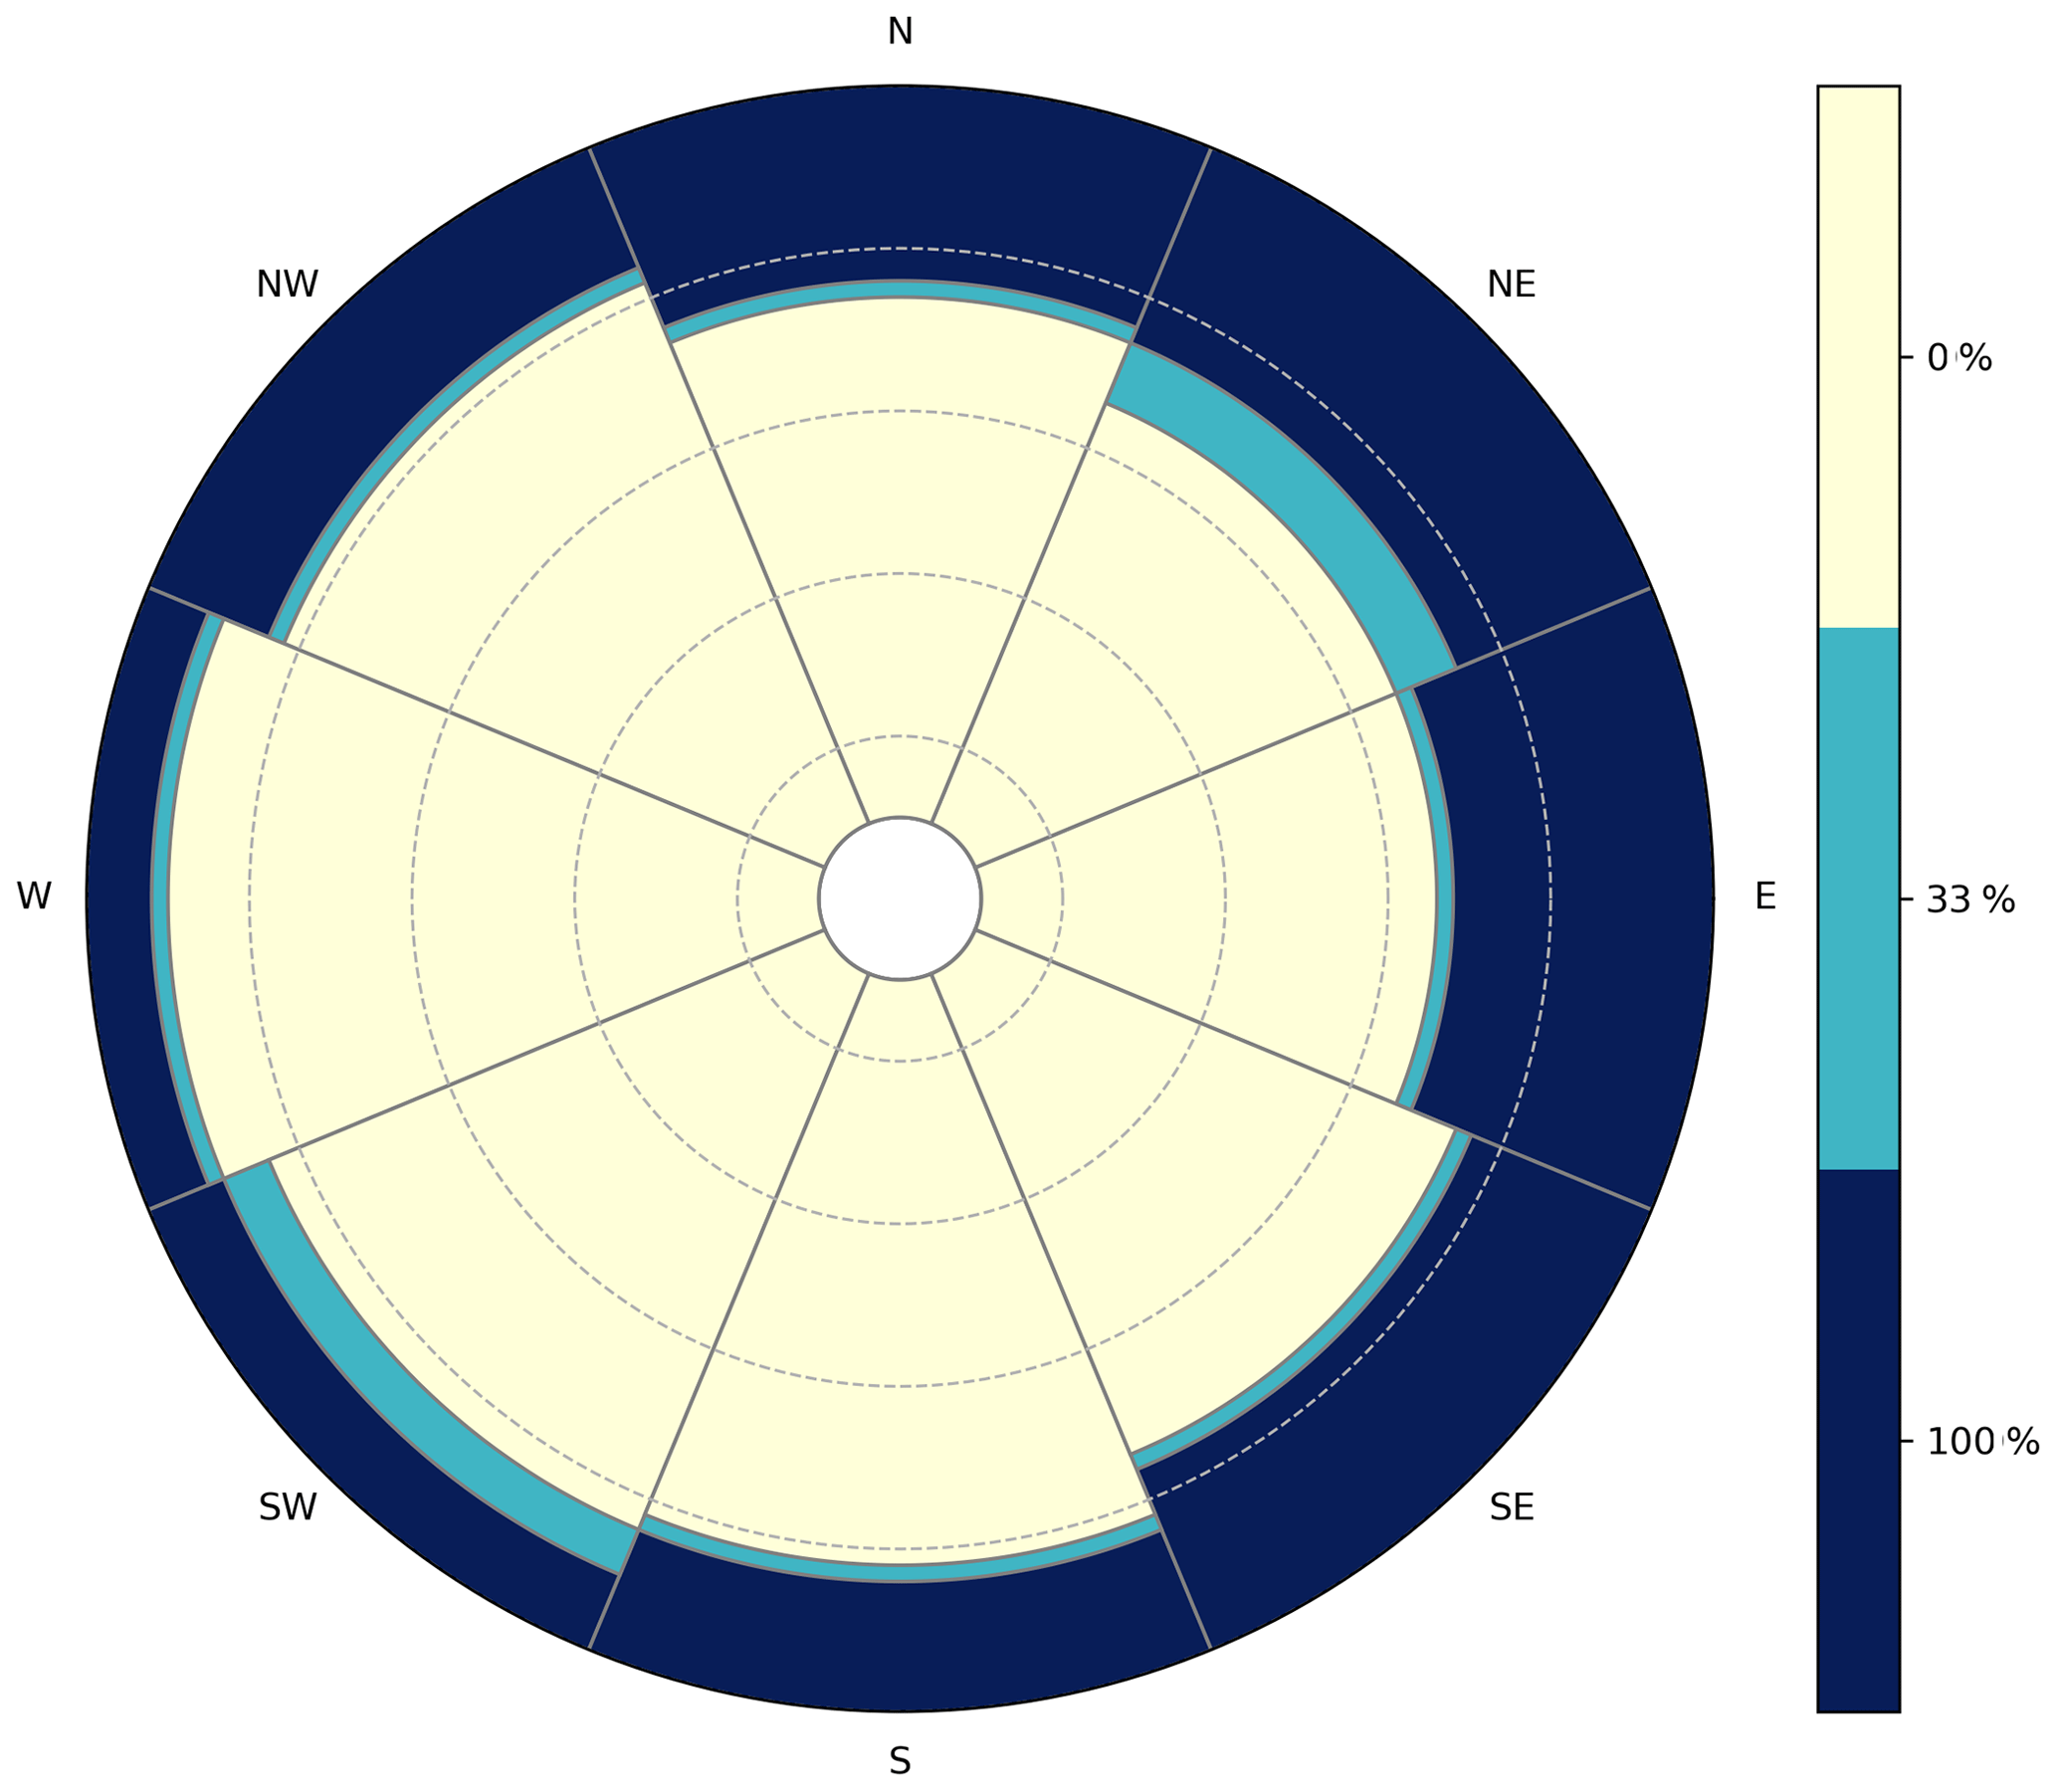
Table 6 summarizes the results of the parametric trigger design for the considered cover, including the plume height thresholds by wind sector for the two layers defined, as well as the corresponding proportion of risk transferred and layer payments.
The net basis risk of the trigger is JPY 7 million per year, with a sum of JPY 32 million per year of positive and JPY 25 million per year of negative basis risk, while the expected recovery is of JPY 87 million per year. The prevalence of basis risk is expected, since the OEP curve of the bond sits on top of the losses OEP in the layer of interest (JPY 30 billion–330 billion). This amount can be fine-tuned, increasing the return periods of the layers until comfortable levels of basis risk are reached.
We present a novel methodology to parameterize financial risk transfer instruments for explosive, tephra-fall-producing volcanic eruptions. The design of the parametric product relies on easily obtainable, observable physical parameters relating to explosive volcanic eruptions, namely maximum observed height of the eruptive column and the prevalent direction of dispersal of the associated ash plume.
We take as a case study Mount Fuji in Japan, the largest and closest active volcano to the populous Tokyo metropolitan area and the heavily industrialized Kanagawa Prefecture (Yamamoto and Nakada, 2015). In Japan, the JMA reports height of the eruptive column and the predominant direction of ash dispersal as part of the “Observation Reports on Eruption” that are released for any erupting volcano on a near-real-time basis. The design of the parametric risk transfer for our case study relies on Guy Carpenter's fully probabilistic model for volcanic eruptions potentially affecting the Tokyo and Kanagawa prefectures, which includes 10 000 simulated volcanic ash fall events arising from explosive eruptions of different sizes at Mount Fuji.
For the parametric design, we focused on explosive eruptions producing significant tephra loads capable of generating property damages (these are the type of eruptive events considered by the volcano risk model) and took as an example a portfolio of residential properties representing the existing residential building stock in the Tokyo and Kanagawa prefectures. These could be severely affected by a significant eruption from Mount Fuji – the last Fuji eruption in year 1707 is a good example – thus potentially generating a financial burden for the regional and/or national governments.
We designed a multi-layer trigger assuming that a policy holder might be interested in covering all losses exceeding JPY 30 billion, with a coverage releasing two possible payment levels of JPY 100 and 300 billion provided the appropriate trigger conditions of the eruptive column height and predominant plume direction are met (Table 6). This type of product would provide a policy holder such as a regional government a quick way to access cash to help repair damages incurred by dwellings as a consequence of a major volcanic eruption or provide the necessary cash flow to underwriters in these prefectures (insurance cover for volcanic eruptions is included as part of the standard earthquake policies in Japan).
There are several features of the design presented that make it potentially applicable to other volcanic settings where explosive volcanism is typical. In particular, the choice of eruption-related parameters (height of the eruptive column and preferential direction of dispersal of ash fall) means that no special monitoring equipment is needed for recordings. Implementation should be straightforward in countries with established volcano observatories; however, less than half of the potentially active volcanoes are monitored with ground-based sensors, and even less are considered well monitored (Brown et al., 2015). This aspect poses a challenge to the global implementation of such a product. In this sense, it would be interesting to explore and expand monitoring solutions like satellite-based remote sensing to report both column height and preferential direction of ash fall dispersal on a near-real-time basis (e.g. Prata and Grant, 2001; Merucci et al., 2016; Pardini et al., 2018; Valade et al., 2019). An example of such a system is HOTVOLC, developed and managed by the Observatoire de Physique du Globe de Clermont-Ferrand (OPGC) and currently operative for 50 volcanoes worldwide (Guéhenneux et al., 2015; https://hotvolc.opgc.fr, last access: 5 November 2020). HOTVOLC reports several eruption-related parameters on a real-time basis, including ash plume altitude. On the other hand, it is important that an official, reputable national or regional agency reports such observations in a reliable and timely manner, which could be national volcanological or meteorological agencies, global organizations such as the World Organization of Volcano Observatories (WOVO.org), or perhaps a bespoke global organization akin to Volcanic Ash Advisory Centers (https://www.icao.int/Pages/default.aspx, last access: 5 November 2020).
The other important requisite that needs to be in place for the successful design of an equivalent parametric product elsewhere is the availability of a suitable volcano risk model for the area of interest. Such a model must be able to generate stochastic loss outputs associated with ash-fall-producing eruptions, encompassing the range of all possible eruptive events of interest and incorporating information relating to plume height and the predominant direction of ash fall dispersal for each event. In an insurance context, availability of these models is still rare, since their development requires a non-negligible investment of time and resources, and volcanic eruptions are generally considered a “secondary peril” by the insurance industry (e.g. Blong et al., 2017b).
Further work on the design of volcano-related parametric risk transfer products may relate to different aspects. On one hand, and also considering ash-fall-producing volcanic eruptions, the design may be extended to consider other types of damages such as those to crops and livestock, costs arising from ash fall clean-up and disposal in urban areas and roads, business interruption costs arising from air traffic disruption, airport closures, and disruption of critical infrastructures including transportation networks, electricity, water supplies, and telecommunications (Wilson et al., 2012). For any of these types of losses, specific ash fall vulnerability functions must be incorporated in the fully probabilistic volcano model considered. The parametric design presented in this paper could be adapted to coverage of these types of losses, provided a strong correlation was also found between eruptive column height and main direction of ash dispersal and modelled losses.
On the other hand, despite the fact that ash fall is the volcanic peril with the largest potential for causing widespread losses (since it is by far the most widely distributed eruptive product), there are other volcanic perils that have a large destructive potential, albeit with a more constrained spatial reach. These include lava flows, pyroclastic density currents, lahars, volcano flank collapses, and ballistic blocks (e.g. Loughlin et al., 2015). Design of parametric transfer products for these volcano hazards would entail a rather different approach – concerning both the modelling of losses (starting with the incorporation of these specific hazard events to the fully probabilistic volcano model) to the selection and monitoring of hazard-related trigger parameters.
The design of the parametric risk transfer product described in this work displays features such as its reliance on easily obtainable, observable physical parameters relating to explosive volcanic eruptions, which makes it an attractive option for implementation on a regional or global basis. We believe that global volcano monitoring tools and platforms already in place could be adapted to this end. Notwithstanding the scarcity of fully probabilistic volcano risk models suitable for this purpose, the increased collaboration between academic experts and the insurance industry can bring all the necessary elements together for the creation of such models, as it has been in the case presented in this paper. The availability of open-source hazard simulation models such as Tephra2 and of global open databases (e.g. wind data and eruptive data) means that the ingredients needed for development are pretty much available on a worldwide basis. Scaling up such an approach in order to model a significantly larger number of volcanoes than presented in this paper is currently being looked into, with promising preliminary results.
These products could be of interest to a number of organizations, including regional and national governments but also insurers and other economic sectors. Increased interest in parametric risk transfer products from the insurance industry and capital markets is helping build momentum for the development of risk models of non-traditional perils such as volcanic eruptions, as well as the design of associated risk transfer mechanisms.
The code and the data underpinning this research are generally not available due to commercial IP held by Guy Carpenter & Company, LLC.
DOD built the volcano risk model, produced the risk results (ELT) associated with the portfolio of residential properties used in the application, and researched and defined the physical trigger parameters for the design of the volcano risk transfer mechanism presented in the paper. GT contributed to the definition of the physical trigger parameters and coded the mathematical design and optimization of the trigger. GF developed the original code as applied to earthquakes and oversaw the adaptation of the code to the case of volcanic eruptions. CM produced the tephra fall footprints used in the hazard module of the volcano risk model, while working at Risk Frontiers.
The authors declare that they have no conflict of interest.
This article is part of the special issue “Global- and continental-scale risk assessment for natural hazards: methods and practice”. It is a result of the European Geosciences Union General Assembly 2018, Vienna, Austria, 8–13 April 2018.
We would like to thank Guy Carpenter for permitting the use of its proprietary volcano risk model for six volcanoes in Japan in order to produce the risk/loss estimates this study used as a basis to design a parametric risk transfer solution for volcanic eruptions. We would like to acknowledge the providers of several datasets that form part of this volcano risk model. In particular, Risk Frontiers (https://riskfrontiers.com/, last access: 12 March 2019) provided the set of stochastic volcanic tephra fall footprints that are part of the volcano risk model's hazard module. These footprints were produced in 2017 following commission from Guy Carpenter to form part of its proprietary volcano risk model for six volcanoes in Japan. Development of volcanic tephra fall footprints by Risk Frontiers used wind reanalysis data (NCEP–DOE Reanalysis 2) from NOAA/OAR/ESRL PSD, Boulder, Colorado, USA (https://www.esrl.noaa.gov/psd/, last access: 12 March 2019). Rainfall data that also form part of the model's hazard module were provided by JBA Risk Management (https://www.jbarisk.com/, last access: 12 March 2019).
This paper was edited by Philip Ward and reviewed by two anonymous referees.
Artemis: Sompo Japan to launch parametric volcanic risk insurance, available at: http://www.artemis.bm/news/sompo-japan-to-launch-parametric-volcanic-risk-insurance/ (last access: 12 March 2019), 2016.
Blong, R., Tillyard, C., and Attard, G.: Insurance and a Volcanic Crisis – A Tale of One (Big) Eruption, Two Insurers, and Innumerable Insureds, in: Observing the Volcano World. Advances in Volcanology (An Official Book Series of the International Association of Volcanology and Chemistry of the Earth's Interior – IAVCEI, Barcelona, Spain), edited by: Fearnley, C. J., Bird, D. K., Haynes, K., McGuire, W. J., and Jolly, G., Springer, Cham, Switzerland, 585–599, https://doi.org/10.1007/11157_2016_42, 2017b.
Blong, R. J., Grasso, P., Jenkins, S. F., Magill, C. R., Wilson, T. M., McMullan, K. and Kandlbauer, J.: Estimating building vulnerability to volcanic ash fall for insurance and other purposes, J, Appl, Volcanol,, 6, 1–13, https://doi.org/10.1186/s13617-017-0054-9, 2017a.
Bonadonna, C., Costa, A., Folch, A., and Koyaguchi, T.: Tephra dispersal and sedimentation, in: Encyclopedia of volcanoes, 2nd Edn., edited by: Sigurdsson, H., Houghton, B., McNutt, S., Rymer, H., and Stix, J., Elsevier, 587–597, https://doi.org/10.1016/B978-0-12-385938-9.00033-X, 2015.
Brown, S. K., Loughlin, S.C., Sparks, R. S. J., Vye-Brown, C., Barclay, J., Calder, E., Cottrell, E., Jolly, G., Komorowski, J.-C., Mandeville, C., Newhall, C. G., Palma, J. L., Potter, S., and Valentine, G.: Global volcanic hazard and risk, in: Global Volcanic Hazards and Risk, edited by: Loughlin, S. C., Sparks, R. S. J., Brown, S. K., Jenkins, S., and Vye-Brown, C., Cambridge University Press, Cambridge, UK, 81–172, https://doi.org/10.1017/CBO9781316276273.004, 2015.
Cabinet Office of Japan: Damage estimation of a historic eruption of Mt. Fuji, Cabinet Office of Japan, Tokyo, 124 pp., available at: http://www.bousai.go.jp/kazan/fujisan-kyougikai/report/pdf/houkokusyo7.pdf (last access: 12 March 2019), 2002.
Connor, L. J. and Connor, C. B.: Inversion is the key to dispersion: understanding eruption dynamics by inverting tephra fallout, in: Statistics in Volcanology, edited by: Mader, H. M., Coles, S. G., Connor, C. B., and Connor, L. J., IAVCEI Publications, Geological Society of London, London, 231–242, https://doi.org/10.1144/IAVCEI001.18, 2006.
Cummins, J. D.: CAT Bonds and Other Risk-Linked Securities: State of the Market and Recent Developments, Risk Manage. Insur. Rev., 11, 23–47, https://doi.org/10.1111/j.1540-6296.2008.00127.x, 2008.
de Armas, J., Calvet, L., Franco, G., Lopeman, M., and Juan, A. A.: Minimizing Trigger Error in Parametric Earthquake Catastrophe Bonds via Statistical Approaches, in: Modeling and Simulation in Engineering, Economics and Management. Lecture Notes in Business Information Processing, edited by: León, R., Muñoz-Torres, M., and Moneva, J., Springer, Cham, Switzerland, 254, 167–175, https://doi.org/10.1007/978-3-319-40506-3_17, 2016.
Franco, G.: Minimization of Trigger Error in Cat-in-a-Box Parametric Earthquake Catastrophe Bonds with an Application to Costa Rica, Earthq. Spectra, 26, 983–998, https://doi.org/10.1193/1.3479932, 2010.
Franco, G.: Construction of customized payment tables for cat-in-a-box earthquake triggers as a basis risk reduction device, in: Proceedings of the 11th International Conference on Structural Safety & Reliability, Taylor & Francis Group, New York, https://doi.org/10.1201/b16387-793, 2013.
Franco, G.: Earthquake mitigation strategies through insurance, in: Encyclopedia of Earthquake Engineering, edited by: Beer, M., Kougioumtzoglou, I., Patelli, E., and Au, I. K., Springer, Berlin, Heidelberg, 1–18, https://doi.org/10.1007/978-3-642-36197-5_401-1, 2014.
Franco, G., Tirabassi, G., Lopeman, M., Wald, D. J., and Siembieda, W. J.: Increasing earthquake insurance coverage in California via parametric hedges, in: Proceedings, 11th National Conference on Earthquake Engineering, Los Angeles, California, 4792–4803, 2018.
Franco, G., Guidotti, R., Bayliss, C., Estrada, A., Juan, A. A., and Pomonis, A.: Earthquake Financial Protection for Greece: A Parametric Insurance Cover Prototype, in: Proceedings, 2nd International Conference on Natural Hazards & Infrastructure, 23–26 June 2019, Chania, Greece, 2019.
General Insurance Association of Japan: Claims associated to weather events, available at: http://www.sonpo.or.jp/news/statistics/disaster/weather/index.html#2016 (last access: 12 March 2019), 2015.
Goda, K.: Basis risk for earthquake catastrophe bond trigger using scenario-based versus station intensity-based approaches: A case study for southwestern British Columbia, Earthq. Spectra, 29, 757–775, https://doi.org/10.1193/1.4000164, 2013.
Goda, K.: Seismic risk management of insurance portfolio using catastrophe bonds, Comput-Aided Civ. Inf., 30, 570–582, https://doi.org/10.1193/1.4000164, 2014.
Goda, K., Franco, G., Song, J., and Radu, A.: Parametric catastrophe bonds for tsunamis: Cat-in-a-box trigger and intensity-based index trigger methods, Earthq. Spectra, 35, 113–136, https://doi.org/10.1193/030918EQS052M, 2019.
Guéhenneux, Y., Gouhier, M., and Labazuy, P.: Improved space borne detection of volcanic ash for real-time monitoring using 3-Band method, J. Volcanol. Geoth. Res., 293, 25–45, https://doi.org/10.1016/j.jvolgeores.2015.01.005, 2015.
GVP – Global Volcanism Program: Smithsonian Institution, available at: https://volcano.si.edu/volcano.cfm?vn=264040, last access: 12 March 2019.
Hasegawa, Y., Sugai, A., Hayashi, Y., Hayashi, Y., Saito, S. and Shimbori, T.: Improvements of volcanic ash fall forecasts issued by the Japan Meteorological Agency, J. Appl. Volcanol., 4, 1–12, https://doi.org/10.1186/s13617-014-0018-2, 2015.
Jenkins, S., Spence, R., Fonseca, J., Solidum, R., and Wilson, T.: Volcanic risk assessment: Quantifying physical vulnerability in the built environment, J. Volcanol. Geoth. Res., 276, 105–120, https://doi.org/10.1016/j.jvolgeores.2014.03.002, 2014a.
Jenkins, S., Wilson, T. M., Magill, C. R., Miller, V., Stewart, C., Marzocchi, W., and Boulton, M.: Volcanic ash fall hazard and risk: Technical Background Paper for the UNISDR 2015 Global Assessment Report on Disaster Risk Reduction. Global Volcano Model and IAVCEI, 39 pp., available at: https://www.preventionweb.net/sendai-framework/gar (last access: 12 March 2019), 2014b.
JMA – Japanese Meteorological Agency: Monitoring of Volcanic Activity, available at: https://www.jma.go.jp/jma/en/Activities/earthquake.html, last access: 12 March 2019.
Kuge, K., Kawabe, K., and Horie, K.: Proposal for Risk Assessment Method of Volcanic Eruption Damage Estimation of Industrial Facilities against 1707 Hoei Volcano Level (Part 2), Summaries of Technical Papers of Annual Meeting, Architectural Institute of Japan, Structure I, 08, 69–70, 2016.
Lloyd's and Cambridge Centre for Risk Studies: Lloyd's City Risk Index, available at: https://cityriskindex.lloyds.com/ (last access: 12 March 2019), 2018.
Loughlin, S., Sparks, S., Brown, S., Jenkins, S., and Vye-Brown, C. (Eds.): Global Volcanic Hazards and Risk, Cambridge University Press, Cambridge, UK, 2015.
Macedonio, G. and Costa, A.: Brief Communication “Rain effect on the load of tephra deposits”, Nat. Hazards Earth Syst. Sci., 12, 1229–1233, https://doi.org/10.5194/nhess-12-1229-2012, 2012.
Magill, C., Mannen, K., Connor, L., Bonadonna, C., and Connor, C.: Simulating a multi-phase tephra fall event: inversion modelling for the 1707 Hoei eruption of Mount Fuji, Japan, B. Volcanol., 77, 81, https://doi.org/10.1007/s00445-015-0967-2, 2015.
Maqsood, T., Wehner, M., Ryu, H., Edwards, M., Dale, K., and Miller, V.: GAR15 Regional Vulnerability Functions: Reporting on the UNISDR/GA SE Asian Regional Workshop on Structural Vulnerability Models for the GAR Global Risk Assessment, 11–14 November 2013, Geoscience Australia, Canberra, Australia, 614 pp., https://doi.org/10.11636/Record.2014.038, 2014.
Merucci, L., Zakšek, K., Carboni, E., and Corradini, S.: Stereoscopic estimation of volcanic ash cloud-top height from two geostationary satellites, Remote Sens., 8, 206, https://doi.org/10.3390/rs8030206, 2016.
Newhall, C. and Self, S.: The Volcanic Explosivity Index (VEI): An Estimate of Explosive Magnitude for Historical Volcanism, J. Geophys. Res., 87, 1231–1238, https://doi.org/10.1029/JC087iC02p01231, 1982.
Oppenheimer, C.: Climatic, environmental and human consequences of the largest known historic eruption: Tambora volcano (Indonesia) 1815, Prog. Phys. Geogr., 27, 230–259, https://doi.org/10.1191/0309133303pp379ra, 2003.
Oxford Economics: The economic impacts of air travel restrictions due to volcanic ash, Oxford Economics, Oxford, UK, 14 pp., 2010.
Pardini, F., Burton, M., Arzilli, F., La Spina, G., and Polacci, M.: SO2 emissions, plume heights and magmatic processes inferred from satellite data: The 2015 Calbuco eruptions, J. Volcanol. Geoth. Res., 361, 12–24, https://doi.org/10.1016/j.jvolgeores.2018.08.001, 2018.
Physical Sciences Laboratory (NOAA): NCEP-DOE Reanalysis 2 data, NOAA/OAR/ESRL PSL, Boulder, Colorado, USA, available at: https://psl.noaa.gov/data/gridded/data.ncep.reanalysis2.html, last access: 12 March 2019.
Prata, A. J. and Grant, I. F.: Retrieval of microphysical and morphological properties of volcanic ash plumes from satellite data: Application to Mt Ruapehu, New Zealand, Q. J. Roy. Meteorol. Soc., 127, 2153–2179, https://doi.org/10.1002/qj.49712757615, 2001.
Pucciano, P., Franco, G., and Bazzurro, P.: Loss Predictive Power of Strong Motion Networks for Usage in Parametric Risk Transfer: Istanbul as a Case Study, Earthq. Spectra, 33, 1513–1531, https://doi.org/10.1193/021517eqs032m, 2017.
Pyle, D. M.: Sizes of volcanic eruptions, in: The encyclopedia of volcanoes, 2nd Edn., edited by: Sigurdsson, H., Academic Press, 257–264, https://doi.org/10.1016/B978-0-12-385938-9.00013-4, 2015.
Rougier, J., Sparks, R. S. J., Cashman, K. V., and Brown, S. K.: The global magnitude–frequency relationship for large explosive volcanic eruptions, Earth Planet. Sc. Lett., 482, 621–629, https://doi.org/10.1016/j.epsl.2017.11.015, 2018.
Self, S., Rampino, M. R., Newton, M. S., and Wolff, J. A.: Volcanological study of the great Tambora eruption of 1815, Geology, 12, 659–663, https://doi.org/10.1130/0091-7613(1984)12<659:VSOTGT>2.0.CO;2, 1984.
Spence, R. J. S., Kelman, I., Calogero, E., Toyos, G., Baxter, P. J., and Komorowski, J. C.: Modelling expected physical impacts and human casualties from explosive volcanic eruptions, Nat. Hazards Earth Syst. Sci., 5, 1003–1015, https://doi.org/10.5194/nhess-5-1003-2005, 2005.
Stothers, R. B.: The great Tambora eruption in 1815 and its aftermath, Science, 224, 1191–1198, https://doi.org/10.1126/science.224.4654.1191, 1984.
Swiss Re and ILS Team: The Fundamentals of Insurance-Linked Securities, Swiss Re, Zurich, Switzerland, 40 pp., 2011.
Valade, S., Ley, A., Massimetti, F., D'Hondt, O., Laiolo, M., Coppola, D., Loibl, D., Hellwich, O., ans Walter, T. R.: Towards Global Volcano Monitoring Using Multisensor Sentinel Missions and Artificial Intelligence: The MOUNTS Monitoring System, Remote Sens., 11, 1528, https://doi.org/10.3390/rs11131528, 2019.
Wald, D. J. and Franco, G.: Money Matters: Rapid post-earthquake financial decision making, Nat. Hazards Observ., 40, 24–27, 2016.
Wald, D. J. and Franco, G.: Financial decision-making based on near-real-time earthquake information, paper #3625, in: 16th World Conference on Earthquake Engineering, 9–11 January 2017, Santiago, Chile, 2017.
Wilson, T. M., Stewart, C., Sword-Daniels, V., Leonard, G. S., Johnston, D. M., Cole, J. W., Wardman, J., Wilson, G., and Barnard, S. T.: Volcanic ash impacts on critical infrastructure, Phys. Chem. Earth Pt. A/B/C, 45–46, 5–23, https://doi.org/10.1016/j.pce.2011.06.006, 2012.
World Economic Forum: Convergence of Insurance and Capital Markets, REF: 091008, World Economic Forum, available at: https://www.weforum.org/reports/convergence-insurance-and-capital-markets (last access: 12 March 2019), 2008.
Yamamoto, T. and Nakada, S.: Extreme Volcanic Risks 2: Mount Fuji, in: Volcanic Hazards, Risks and Disasters, edited by: Shroder, J. F. and Papale, P., Elsevier, Amsterdam, 355–376, https://doi.org/10.1016/B978-0-12-396453-3.00014-9, 2015.
Yamasato, H., Funasaki, J., and Takagi, Y.: The Japan Meteorological Agency's Volcanic Disaster Mitigation Initiatives, Technical Note 380, NIED – National Research Institute for Earth Science and Disaster Prevention, Tokyo, 101–107, 2013.
The Volcanic Explosivity Index (VEI) is a relative measure of the explosiveness of volcanic eruptions devised by Chris Newhall and Stephen Self in 1982. The scale is open-ended, with the largest eruptions in history given magnitude 8. The scale is logarithmic from VEI 2 upwards, with each interval on the scale representing a 10-fold increase in volume of eruptive products. Another measure commonly used for eruption size is eruption magnitude (e.g. Pyle, 2015; Rougier et al., 2018).