the Creative Commons Attribution 4.0 License.
the Creative Commons Attribution 4.0 License.
 | 29 Jan 2021
Assessing and zoning of typhoon storm surge risk with a geographic information system (GIS) technique: a case study of the coastal area of Huizhou
Zhenfeng Yao
Jia Gao
Enjin Zhao
Lizhe Wang
Storm surge is one of the most destructive marine disasters to life and property for Chinese coastal regions, especially for Guangdong Province. In Huizhou city, Guangdong Province, due to the high concentrations of chemical and petroleum industries and the high population density, the low-lying coastal area is susceptible to the storm surge. Therefore, a comprehensive risk assessment of storm surge over the coastal area of Huizhou can delimit zones that could be affected to reduce disaster losses. In this paper, typhoon intensity for the minimum central pressure of 880, 910, 920, 930, and 940 hPa (corresponding to a 1000-, 100-, 50-, 20-, and 10-year return period) scenarios was designed to cover possible situations. The Jelesnianski method and the Advanced Circulation (ADCIRC) model coupled with the Simulating Waves Nearshore (SWAN) model were utilized to simulate inundation extents and depths of storm surge over the computational domain under these representative scenarios. Subsequently, the output data from the coupled simulation model (ADCIRC–SWAN) were imported to the geographic information system (GIS) software to conduct the hazard assessment for each of the designed scenarios. Then, the vulnerability assessment was made based on the dataset of land cover types in the coastal region. Consequently, the potential storm surge risk maps for the designed scenarios were produced by combining hazard assessment and vulnerability assessment with the risk matrix approach. The risk maps indicate that due to the protection given by storm surge barriers, only a small proportion of the petrochemical industrial zone and the densely populated communities in the coastal areas were at risk of storm surge for the scenarios of 10- and 20-year return period typhoon intensity. Moreover, some parts of the exposed zone and densely populated communities were subject to high and very high risk when typhoon intensities were set to a 50- or a 100-year return period. Besides, the scenario with the most intense typhoon (1000-year return period) induced a very high risk to the coastal area of Huizhou. Accordingly, the risk maps can help decision-makers to develop risk response plans and evacuation strategies in coastal communities with a high population density to minimize civilian casualties. The risk analysis can also be utilized to identify the risk zones with the high concentration of chemical and petroleum industries to reduce economic losses and prevent environmental damage caused by the chemical pollutants and oil spills from petroleum facilities and infrastructures that could be affected by storm surge.
- Article
(17934 KB) - Full-text XML
- BibTeX
- EndNote


Storm surge is the abnormal rise in sea level during tropical cyclones, and the surge is primarily produced by strong storm winds pushing water into shore. When a tropical cyclone makes landfall, the accompanying storm surge will lead to significant flooding in the surrounding coastal area. Therefore, storm surge associated with tropical cyclones is a devastating hazard and frequently causes considerable deaths and property damage in many coastal regions of the world. For example, in August 2005, Hurricane Katrina struck the United States, and the storm surge from Katrina along the Gulf Coast area was ranging from 3 m (10 ft) to 8.5 m (28 ft) high. It caused USD 108 billion in property damages and resulted in a death toll of 1833 persons (Hurricane Katrina: August 2005, 2020). In 2019, Typhoon Hagibis caused severe storm surge flooding that inundated southern areas of Honshu and killed at least 99 people in Japan (Japan: Typhoon: 2019/10/12, 2020).
In China, storm surge is regarded as one of the most serious marine disasters and inflicts tremendous losses to people's life and property. Every year, about 27 tropical cyclones are formed over the western North Pacific Ocean and the South China Sea, and one-fourth of them strike directly coastal regions of China. The tropical cyclone storm surge, from 2000 to 2018, caused a direct economic loss of RMB 10.82 billion and left a death toll of 46 on average annually in China (China Marine disaster bulletin, 2020). These economic damages and casualties will be further increased because of the explosive population growth and the rapid development of society in the coastal area of China (Seto et al., 2011; Lichter et al., 2011; McGranahan et al., 2007). Moreover, with considerably rising sea levels caused by continued global warming, tropical-cyclone-induced storm surge will be more destructive in the future (Zhai et al., 2018). Therefore, it is important to establish storm surge preparedness plans in advance to reduce economic losses and casualties for coastal cities.
Huizhou is the eastern city in the Pearl River Delta region in Guangdong Province, China. In Huizhou, the petrochemicals and electronic information have developed into the dominant industries. The Daya Bay Petrochemical Zone, located in the coastal area of Huizhou, is currently ranked the first in China in terms of the scale of integrating refinery and petrochemical production. The high concentrations of petroleum-refining facilities and energy infrastructures in the Petrochemical Zone and the high density of population in low-lying coastal communities make the coastal area of Huizhou especially vulnerable to storm surges. The storm surge risk that the coastal area of Huizhou faces could be increased with sea-level rise, population growth, and further petrochemical industry development. Thus, it is necessary to assess the potential risk of typhoon storm surge in advance in Huizhou to help decision-makers understand the affected regions and allow them to develop mitigation strategies and future land use planning.
The terminologies and methods for coastal risk assessment vary among different scholars and organizations. In most cases, the risk assessment of storm surge flooding is determined by the combination of hazard, exposure, and vulnerability (Crichton, 1999; Kaźmierczak and Cavan, 2011; Koks et al., 2015):
-
The hazard is defined as a natural event that causes impacts on people and infrastructures. The hydrodynamic models, wave models, and the statistical methods are applied to the qualitative evaluation of storm surge hazard. With the statistical methods, the relation between minimum central pressure and return period of typhoons can be constructed based on the historical storm records at specific zones. Then, the hydrodynamic models and the wave models are utilized to simulate potential inundation extents and depths under different typhoon intensity scenarios.
-
The exposure means the elements at risk in a given hazard event. The exposure assessment of storm surge is performed by measuring the counts of affected elements in the inundated region.
-
The vulnerability refers to the degree to which a natural element is susceptible to sustaining damage from a hazard event.
An empirical stage–damage curve is a common tool for assessing vulnerability. In order to develop stage–damage curves for elements, researchers need to observe and analyze the damage of elements in the disaster-affected area and assign the percentage damage to different types of elements according to the scale of damage and disaster degree.
The quantitative stage–damage curve method for the vulnerability assessment (Middelmann, 2010; de Moel et al., 2014; McGrath et al., 2015) is common in developed countries. However, because of lacking adequate damage-cost data collected through postdisaster surveys, constructing stage–damage curves is difficult in developing countries. Thus, the stage–damage curve method for assessing vulnerability is not appropriate for Chinese coastal regions. This limited data availability has led to other data utilized to assess vulnerability in China. In 2019, a panel of Chinese ocean disaster prevention and reduction researchers updated and published the latest guideline Technical directives for risk assessment and zoning of marine disaster – Part 1: storm surge (https://www.renrendoc.com/p-82139795.html, last access: 12 December 2020). The latest guideline provides the procedures and approaches for hazard, vulnerability, and risk assessment of storm surge (Sect. 3). According to the latest guideline, the land cover types and their corresponding vulnerability values rather than the stage–damage curve are recommended to conduct the vulnerability assessment in China.
In the past few years, the latest guideline has been taken and put into operation of storm surge risk assessment in the coastal areas of China (Fang et al., 2016; Zhang et al., 2016). However, few studies have made a risk assessment of storm surge in Huizhou city. This paper attempts to conduct a comprehensive assessment and zonation of storm surge risk in the coastal area of Huizhou city with the latest guideline. First, the relation between minimum central pressure and return period was constructed from historical tropical cyclone records in Huizhou with statistical approaches. Then, the typhoon intensities for the minimum central pressure of 880, 910, 920, 930, and 940 hPa (corresponding to a 1000-, 100-, 50-, 20-, and 10-year return period) scenarios were designed. Subsequently, the Jelesnianski method was utilized to generate wind field, and the Advanced Circulation (ADCIRC) hydrodynamic model coupled with the Simulating Waves Nearshore (SWAN) wave model was employed to simulate the storm surge for each of the designed typhoon intensity scenarios. The data of simulated storm surge over the computational domain under different typhoon intensity scenarios were generated from the coupled ADCIRC–SWAN model. Afterward, the inundation extents and depths of storm surge maps can be created from the simulated data in geographic information system (GIS)-integrated software to visualize and assess storm surge hazard levels. Eventually, combining hazard assessment with vulnerability assessment, the risk map during a specific typhoon intensity in the study area was obtained. The risk maps can help decision-makers to develop evacuation plans for the densely populated communities in the coastal area. The risk analysis can be utilized to identify the risk zones with the high concentrations of chemical and petroleum industries to prevent environmental damage caused by the chemical pollutants and oil spills from affected petroleum industries.
The rest of the paper is organized as follows: the study area and datasets are described in Sect. 2; Sect. 3 depicts the methodology and procedure, including the model description and validation, storm parameters and scenario design, and the procedure for conducting the risk assessment; results and discussion are stated in Sect. 4; the conclusion of the study is drawn and future research is provided in Sect. 5.
2.1 Study area
Guangdong is a coastal province, located in the southernmost part of China, and has a long coastline along the South China Sea, as shown in Fig. 1a. Guangdong is one of the most prosperous provinces in China, with the highest GDP of RMB 9.73 trillion and a population of 113.46 million in 2018. However, due to the geographical position, Guangdong is the most frequently affected province by tropical cyclones in China. The storm surge is regarded as the most serious marine disaster for Guangdong Province. During the period from 1949 to 2017, 263 tropical cyclones landed in Guangdong Province (Ying et al., 2014). In 2018, three different typhoons including Ewiniar, Bebinca, and Mangkhut made landfall on Guangdong Province, which left four people dead and caused a direct economic loss of RMB 2.37 billion.
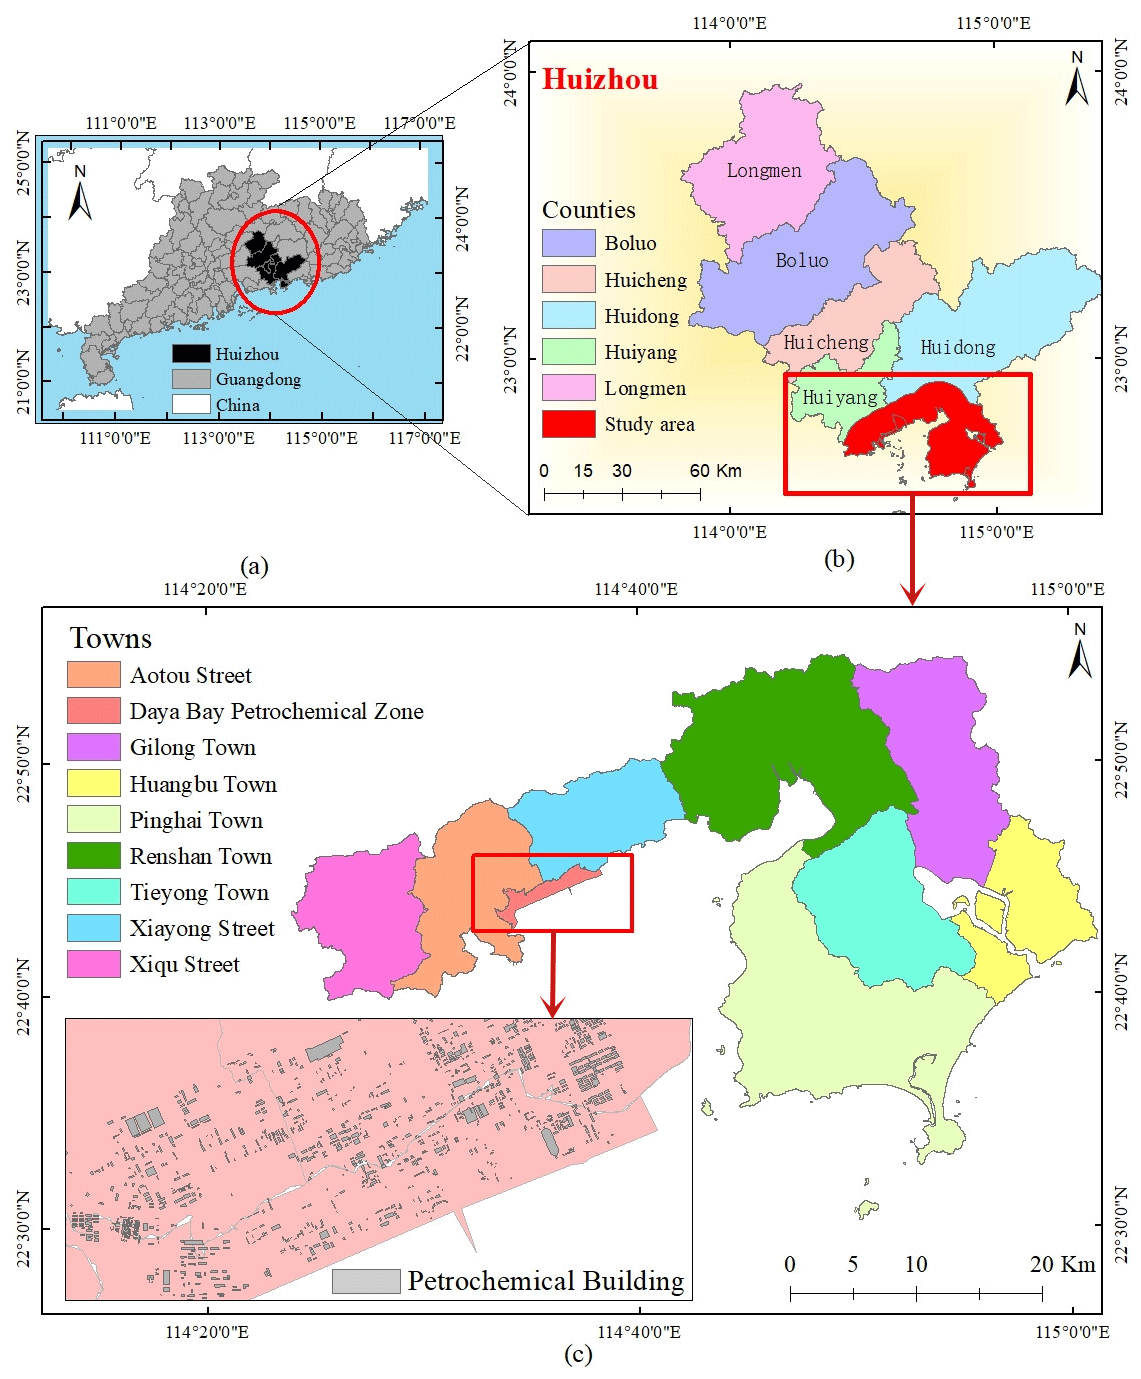
Figure 1The maps of observation locations used in the study: (a) the map of Guangdong Province in the southern area of China where the shapefile of administrative boundaries was obtained from the GADM database under © 2018 GADM license (https://gadm.org/data.html, last access: 19 January 2021), with academic publishing permission from Global Administrative Areas (https://gadm.org/license.html, last access: 19 January 2021); (b) the map of Huizhou city and the study area, which was made using the ArcGIS 10.5; (c) the map of towns and their boundaries in the study area and the petrochemical buildings are distributed in the Daya Bay Petrochemical Zone, which was made using the ArcGIS 10.5. The maps and satellite images obtained from © Google Earth or © Google Maps can be used and printed in the research papers with permission from Google's website (https://www.google.com/permissions/geoguidelines/, last access: 19 January 2021).
The Huizhou city is located in the southeastern area of Guangdong Province, and it occupies part of the Pearl River Delta megalopolis to the northeast of Hong Kong and Shenzhen. Spanning from 22∘4′ to 23∘57′ N and 113∘51′ to 115∘28′ W, it covers a land area of about 11 347 km2 and sea area of approximately 4520 km2. There are two districts (Huicheng and Huiyang) and three counties (Boluo, Huidong, and Longmen) in Huizhou, as shown in Fig. 1b. The coastal region of Huiyang district and Huidong county have been affected by the tropical cyclones during the season running from April to November.
In this paper, the region within a distance of 10 km from the coastline in Huiyang district and Huidong county is chosen as a study area to understand the potential risk of storm surge in this region, as shown in Fig. 1b and c. In addition to high population density in coastal communities, the main reason for choosing this region is that high concentrations of petroleum facilities and infrastructures in the Daya Bay Petrochemical Zone make the study area vulnerable to storm surges. The Daya Bay Petrochemical Zone has an area of about 27.8 km2, as shown in Fig. 1c, and is currently taking the first spot at the scale of petrochemical-refining integration in China. By the end of 2018, the Petrochemical Zone has attracted investment from many of the world’s top 500 companies and industry-leading enterprises. These world chemical and industrial giants including Exxon Mobil, Shell, and Clariant have invested RMB 131.6 billion to shape up the industrial chains of the oil refinery, ethylene, propylene, and butylene in Daya Bay Petrochemical Zone. In 2018, the oil-refining capacity and the ethylene production capacity have been enhanced to 22 million and 2.2 million t yr−1, respectively, and the petrochemical industrial output value reached RMB 270 billion (Huizhou, 2020a, b). Now, the Daya Bay Petrochemical Zone is striving to develop into the world-class petrochemical base and planning to be one of the world's top 10 petrochemical industrial zones in the subsequent few years. Therefore, with the growing population density and particularly the rapid development of petroleum and chemical industries, the storm surge risk over the study area will be increased. The risk assessment and risk analysis are considered to be important strategies to identify the risk regions in the Daya Bay Petrochemical Zone, which can minimize the loss of life and property and prevent environmental damage caused by affected coastal petroleum facilities and infrastructures.
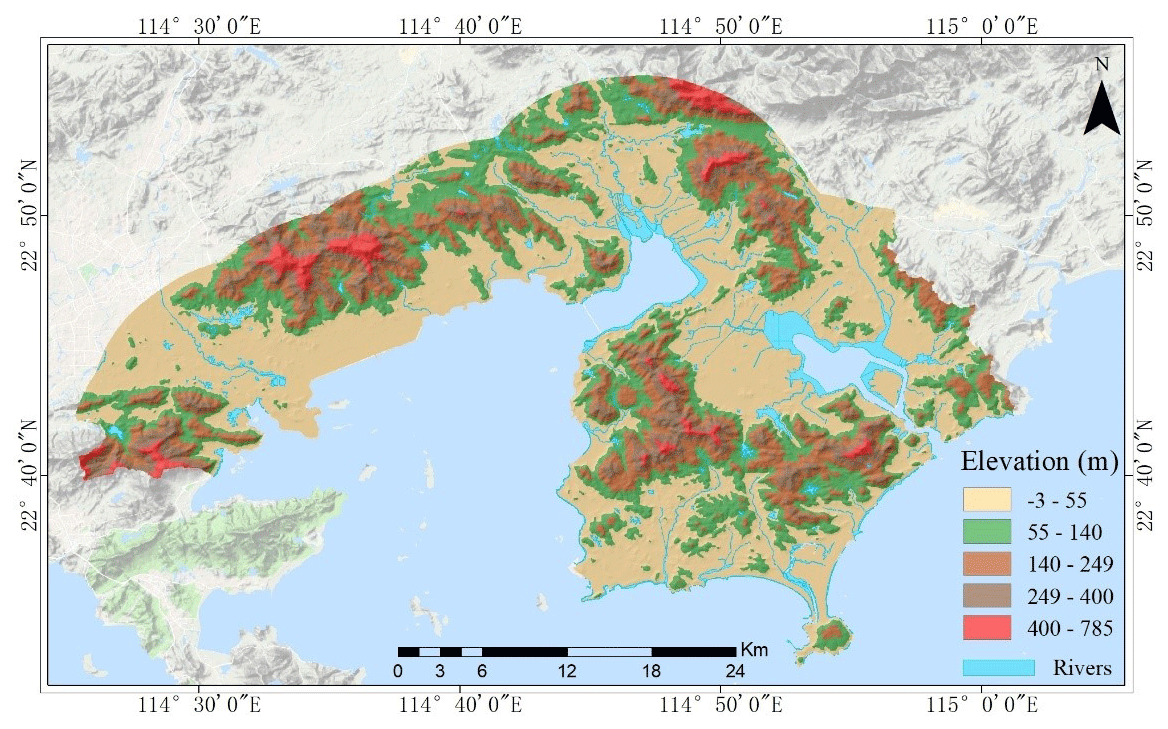
Figure 2The DEM map of the study area including rivers and the elevation value that point covers. The map was made using the ArcGIS 10.5 software based on the terrain base map layer, which was obtained from © Google Maps (map data © 2019 Google).
2.2 Dataset requirement
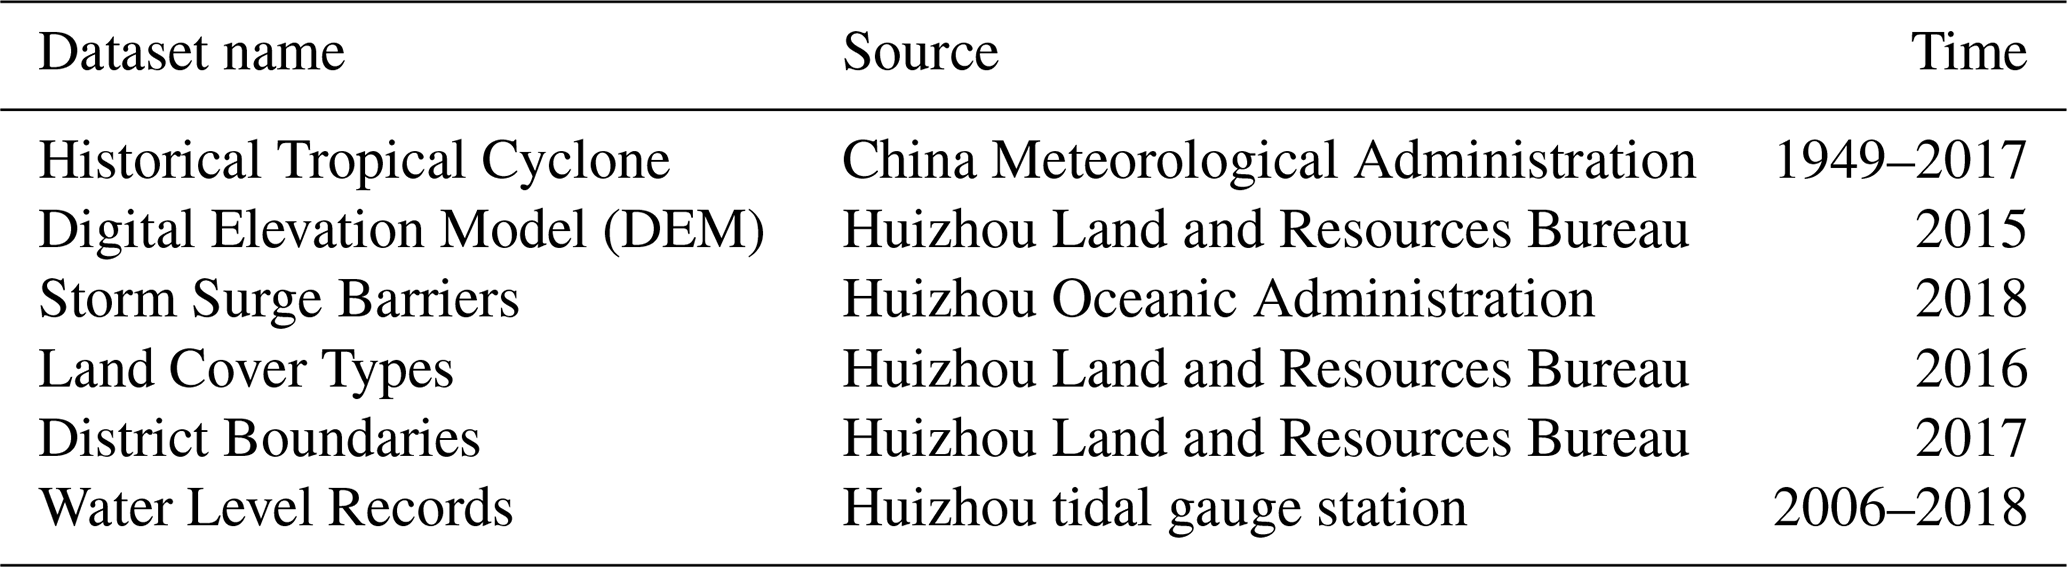
The datasets used in the study contain observed data and survey data obtained from various sources. The datasets can be employed to conduct the hazard assessment, vulnerability assessment, and risk assessment of storm surge in the study area for each of the different typhoon intensity scenarios. The datasets, which can be downloaded from the Figshare repository (Wang, 2020a), are listed in Table 1 and described below.
Table 1Summary of the datasets for conducting the risk assessment of storm surge.
-
The dataset of Historical Tropical Cyclone: it contains information on name, time, track, minimum central pressure, and maximum wind velocity of tropical cyclones that made landfall in the coastal area of Huizhou during the period from 1949 to 2017. It was obtained from the China Meteorological Administration. The historical data can be analyzed to construct representative typhoon scenarios over the study area. The input parameters of each of the typhoon scenarios are used to generate wind field with the Jelesnianski method, which is the requirement for modeling storm surge.
-
The dataset of Digital Elevation Model (DEM): the dataset of DEM with a scale of 1:2000 was constructed in 2015 and is available from Huizhou Land and Resources Bureau. It is a raster dataset that depicts land heights in Huizhou's solid surface. The point in the dataset contains the elevation value for the region that point covers. The DEM dataset is used for modeling storm surge. The DEM map of the study area is shown in Fig. 2.
-
The dataset of Storm Surge Barriers: the dataset includes information on storm surge barriers such as dikes and levees constructed in the study area, as shown in Fig. 3. The data related to name, height, slope, location, material, latitude, and longitude have been surveyed from the project named marine disaster prevention and reduction of Huizhou in 2018. The dataset is utilized to accurately simulate the inundation extent and depth of storm surge.
-
The dataset of Land Cover Types: the dataset contains current physical material including water, agriculture, trees, and wetlands over the study area. It was obtained from the Huizhou Land and Resources Bureau, which was created by analyzing remotely sensed imagery of Huizhou in 2016. Because each physical material has its bottom friction, the simulated inundated areas of storm surge cannot be the same on the different combinations of land covers. The dataset is applied to modeling storm surge and conducting the vulnerability assessment.
-
The dataset of Administrative Boundary: the dataset contains administrative boundaries at the township level of Huizhou in 2017, and there are 12 towns in the study area. It was obtained from Huizhou Land and Resources Bureau.
-
The dataset of Water Level Records: the Huizhou Oceanic Administration deployed the Huizhou water level gauging station that is located in the Quenwan port and Gangkou gauging station, as shown in Fig. 3. The coastal water level around the stations is automatically measured and recorded with a gauge at fixed intervals of time. The dataset contains the height of hourly water level records. The dataset can be used for validating the coupled model (ADCIRC–SWAN) over the study area by comparing simulated water levels and measured water levels.
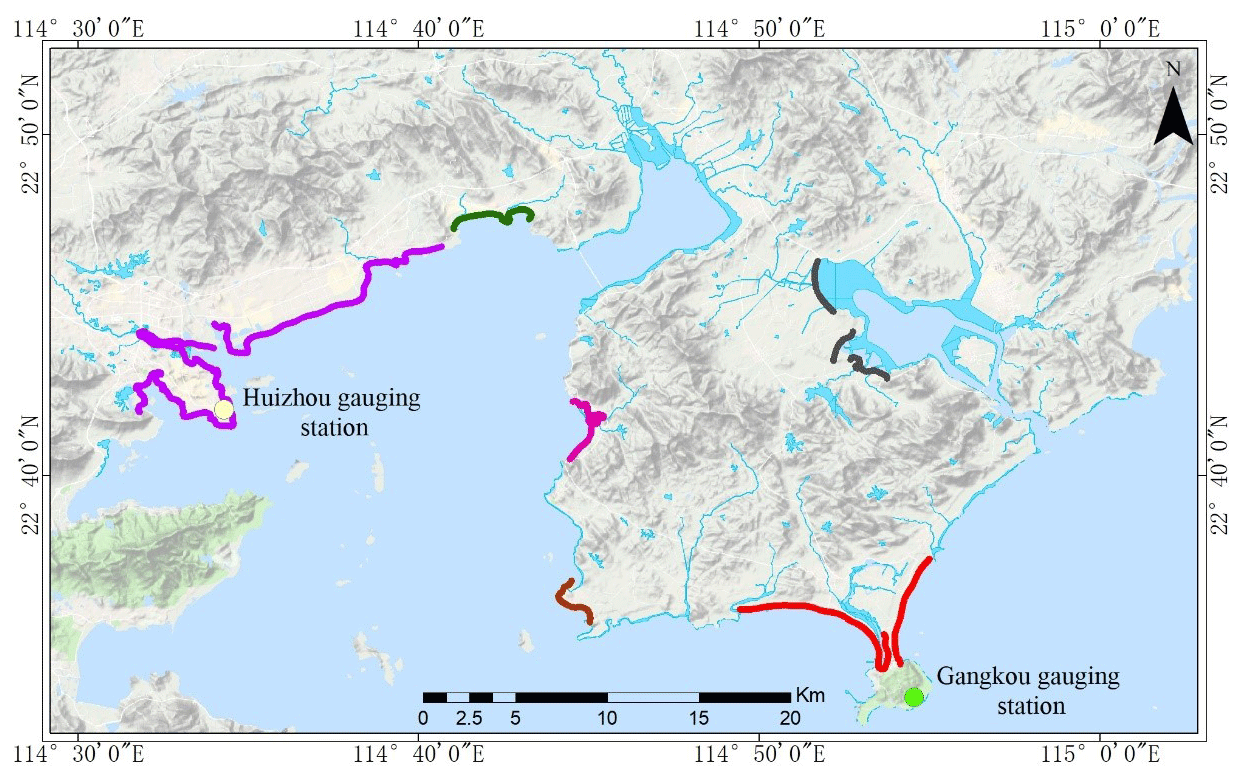
Figure 3The map of Storm Surge Barriers such as dikes and levees along the coastline of Huizhou over the study area, which are marked by the colored lines. The two stations including Huizhou gauging station and Gangkou gauging station measure the water levels in the study area, which are indicated by the lemon chiffon dot and the green dot, respectively. The map was made using the ArcGIS 10.5 software based on the terrain base map layer, which was obtained from © Google Maps (map data © 2019 Google).
3.1 Model description and validation
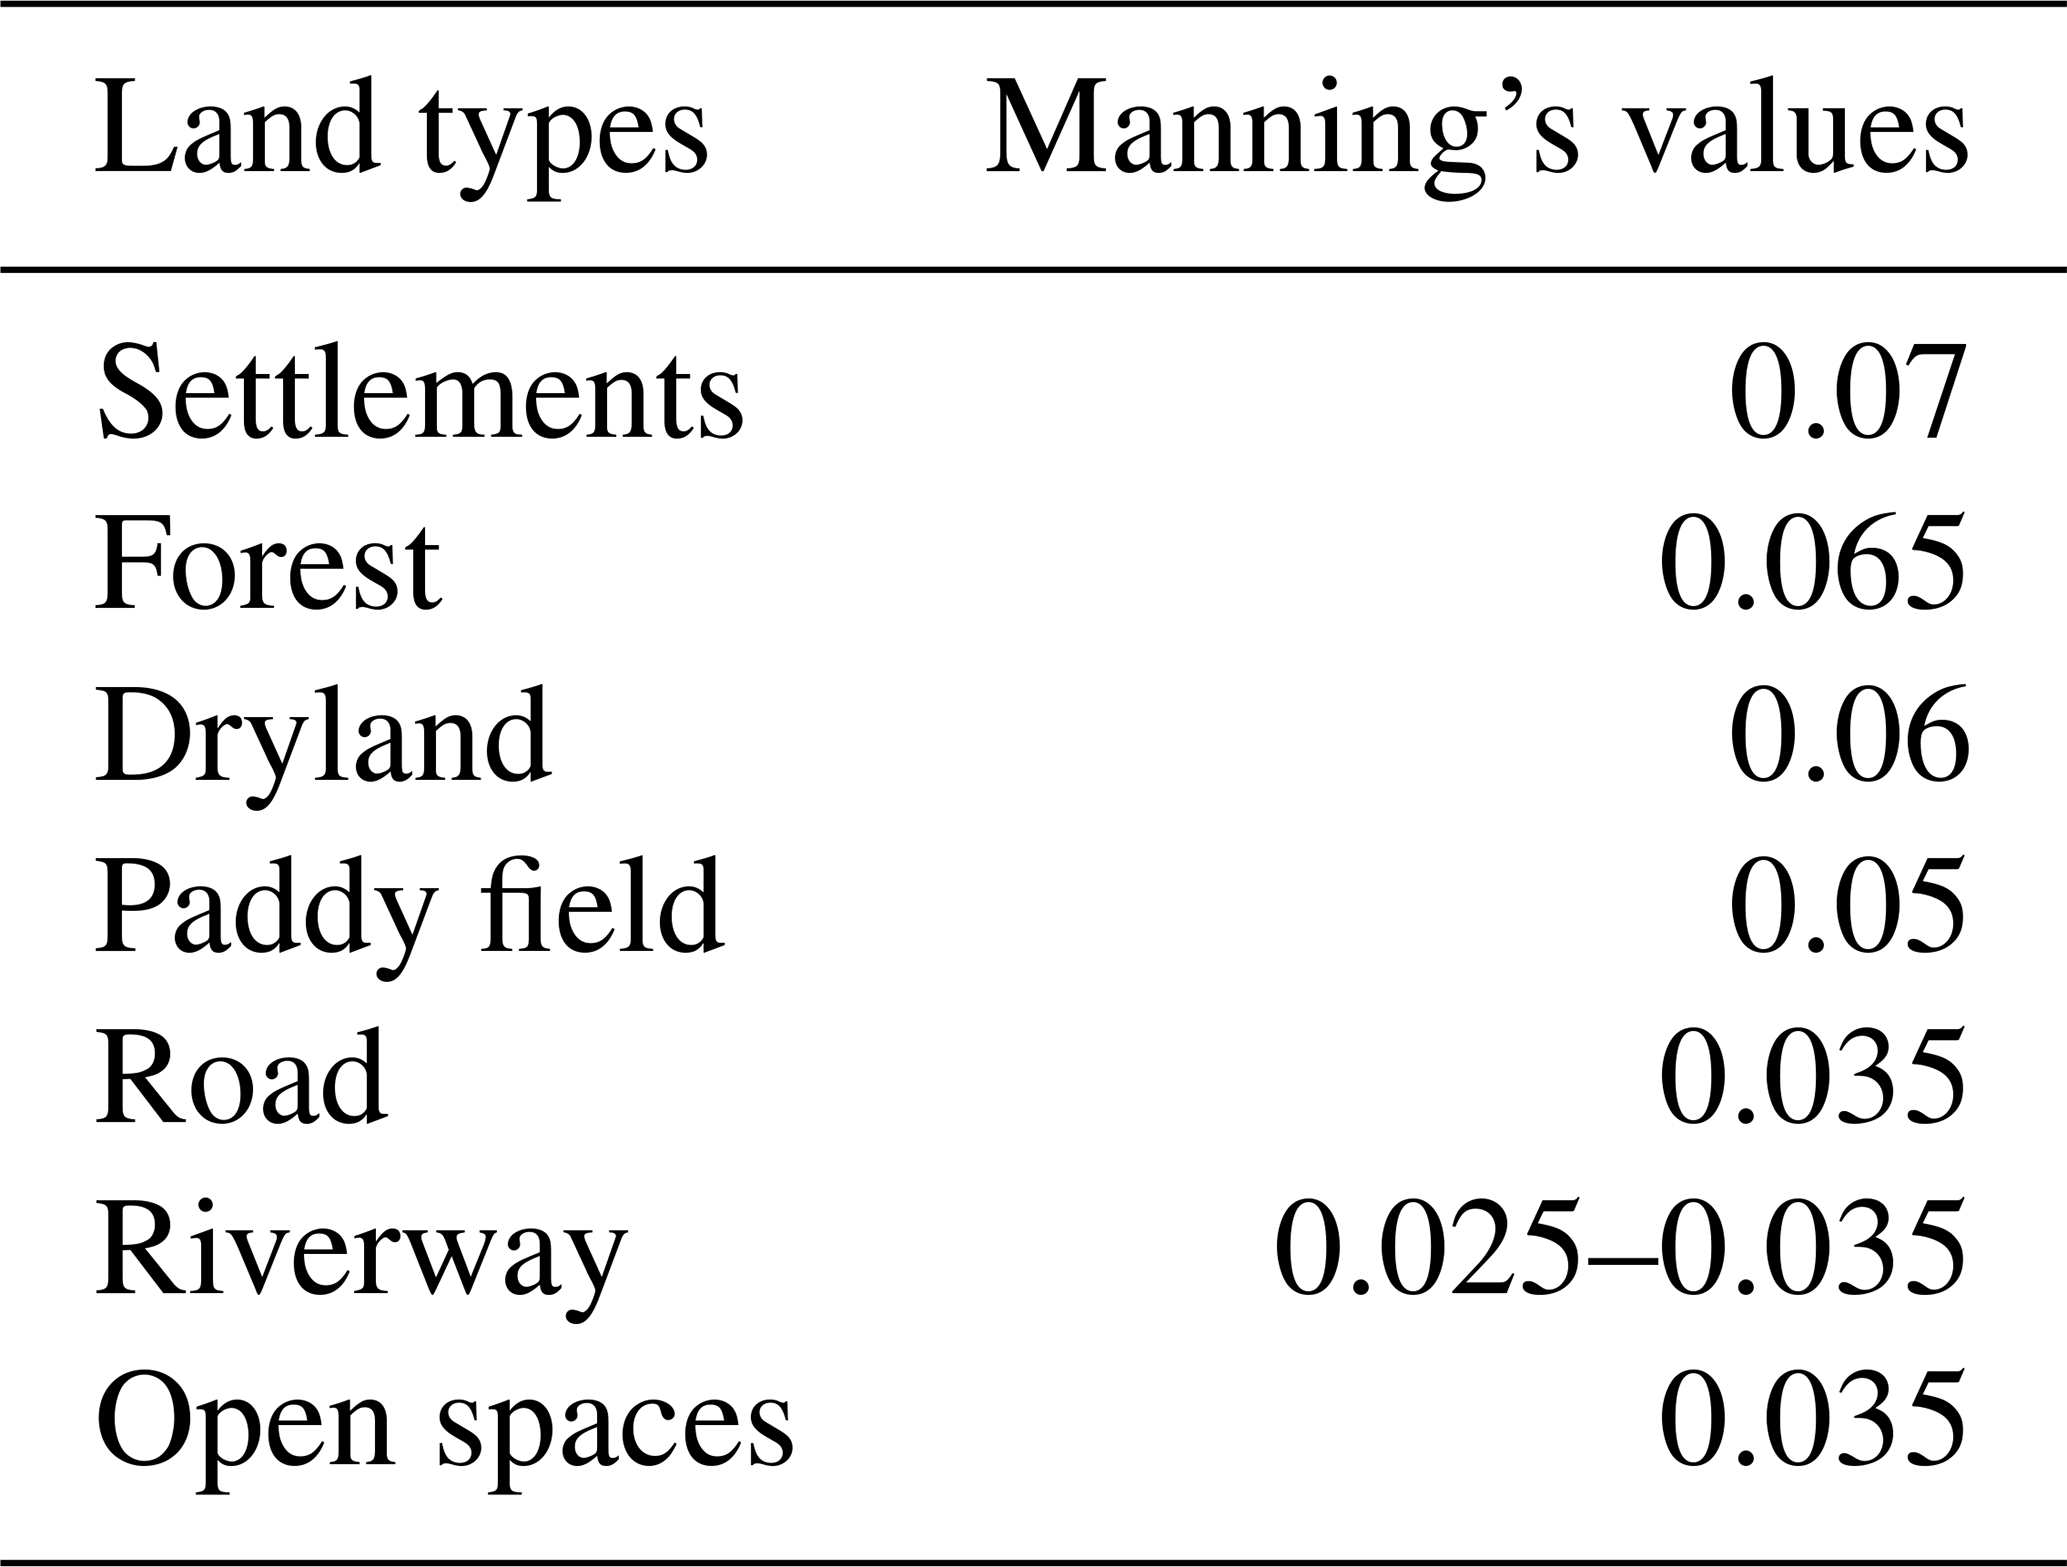
In this study, the Jelesnianski numerical method (Jelesnianski and Taylor, 1973), the well-established Advanced Circulation (ADCIRC) model (Luettich et al., 1992; Westerink et al., 1994), and Simulating Waves Nearshore (SWAN) model (Booij et al., 1999) are employed to simulate typhoon storm surge. The ADCIRC model is a two- and three-dimensional hydrodynamic circulation model, which can be utilized to model tides, wind-driven circulation, and storm surge. The ADCIRC model has been applied to simulate the hydrology in regions including the Gulf of Mexico, the Mediterranean Sea, and the South China Sea (Kerr et al., 2013; Orlić et al., 2010; Li et al., 2020). The ADCIRC-2D in the study was run using a spherical coordinate system. It can provide both water surface elevation and the depth-averaged velocity of the current in coastal seas by solving continuity equations and momentum equations. As for the friction coefficient, Manning's n values derived from the land cover types over the study area are utilized, which are listed in Table 2. These land types were first associated with Manning's values, and then the Manning's n values are averaged for the ADCIRC mesh.
Table 2The Manning's values related to the land cover types over the study area.
The SWAN model is a third-generation numerical wave model, which is used to simulate wind-generated wave propagation in coastal regions. The model computes the wave action density spectrum by solving the wave action balance equation. It can be coupled to the ADCIRC model to simulate the storm surge on the same unstructured grid (Dietrich et al., 2011, 2012).
The computational domain in this study covered the coastal region of Huizhou, as shown in Fig. 4, with progressively higher resolution approaching the coastal area of Huizhou. In the areas along the coastline of Huizhou, the high grid resolution of 100–200 m is provided to improve the simulation accuracy, and simultaneously unstructured grids contain a coarse resolution of 30 km along the open ocean boundary for decreasing computational cost. There are 38 407 nodes and 74 328 grids over the computational domain, as shown in Fig. 4a. The open boundary of the model water level is controlled by the total water level, which is obtained by the superposition of 11 astronomical tidal components. These 11 astronomical tidal components are M2, N2, S2, K2, K1, O1, P1, Q1, MS4, M4, and M6. The wave open boundary is controlled by a two-dimensional wave spectrum.
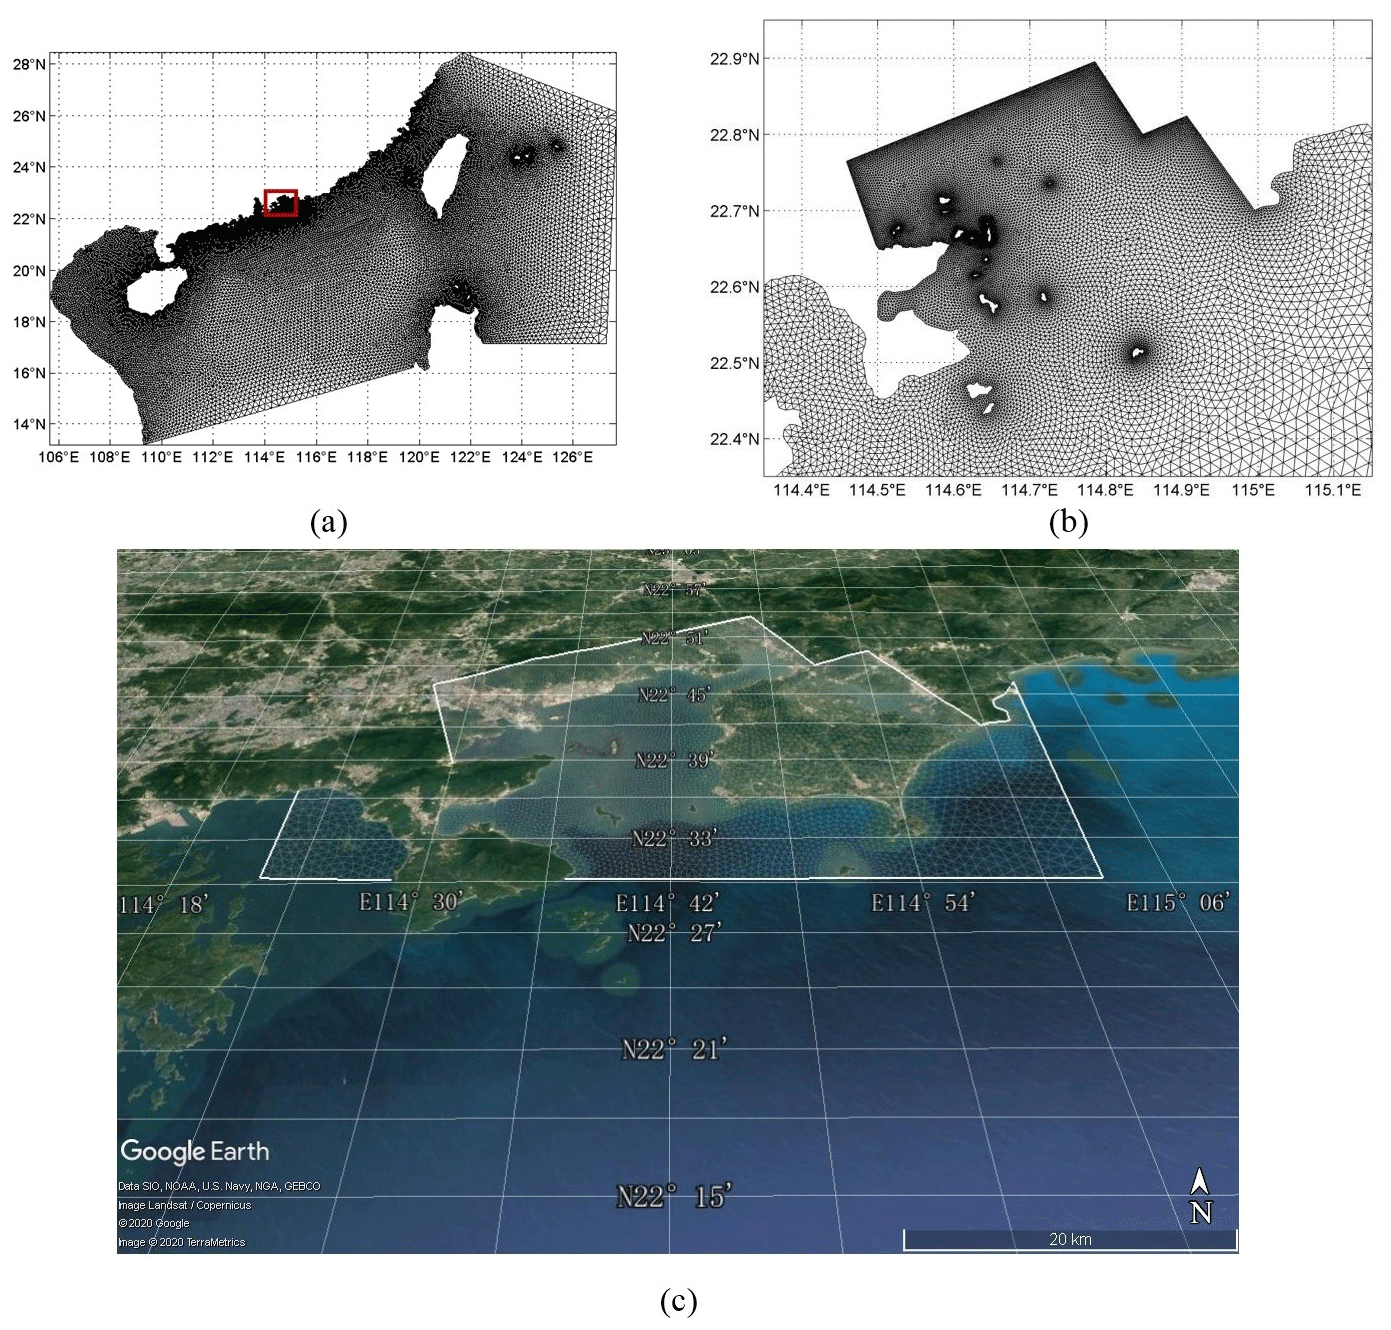
Figure 4A computational domain (a) and the domain over the study area (b). The satellite image (c) was obtained from © Google Earth (map data © 2020 Google, © 2020 ZENRIN).
The procedure of modeling storm surge is as follows: the wind filed, which is generated by the Jelesnianski method, is provided to the coupled model (ADCIRC–SWAN). Then, the ADCIRC model is operated to calculate the water level and current under the wind filed. Subsequently, based on the water level, the current, and the wind velocity, the SWAN model computes the wave spectrum, which is then passed back to the ADCIRC model to calculate the water levels in the next simulated round. Thus, the modeling typhoon event can be converted by the wave–current coupled model (ADCIRC–SWAN) into a storm surge event, outputting the data of water height corresponding to every grid node over the computational domain.
As the Jelesnianski method and the coupled model (ADCIRC–SWAN) have never been used in simulating typhoon storm surge over the coastal areas of Huizhou, the simulated performance of the coupled model is needed to be evaluated. The 10 representative typhoons (0812, 0814, 0906, 1208, 1319, 1604, 1622, 1713, 1720, 1822), which caused high water levels in Huizhou gauging station and Gangkou gauging station (Fig. 3), are selected to validate the coupled model (ADCIRC–SWAN) for the study area. Figure 5 shows all maximum simulated water levels, the highest observed water levels, and the timing of these peaks for these 10 representative typhoons.
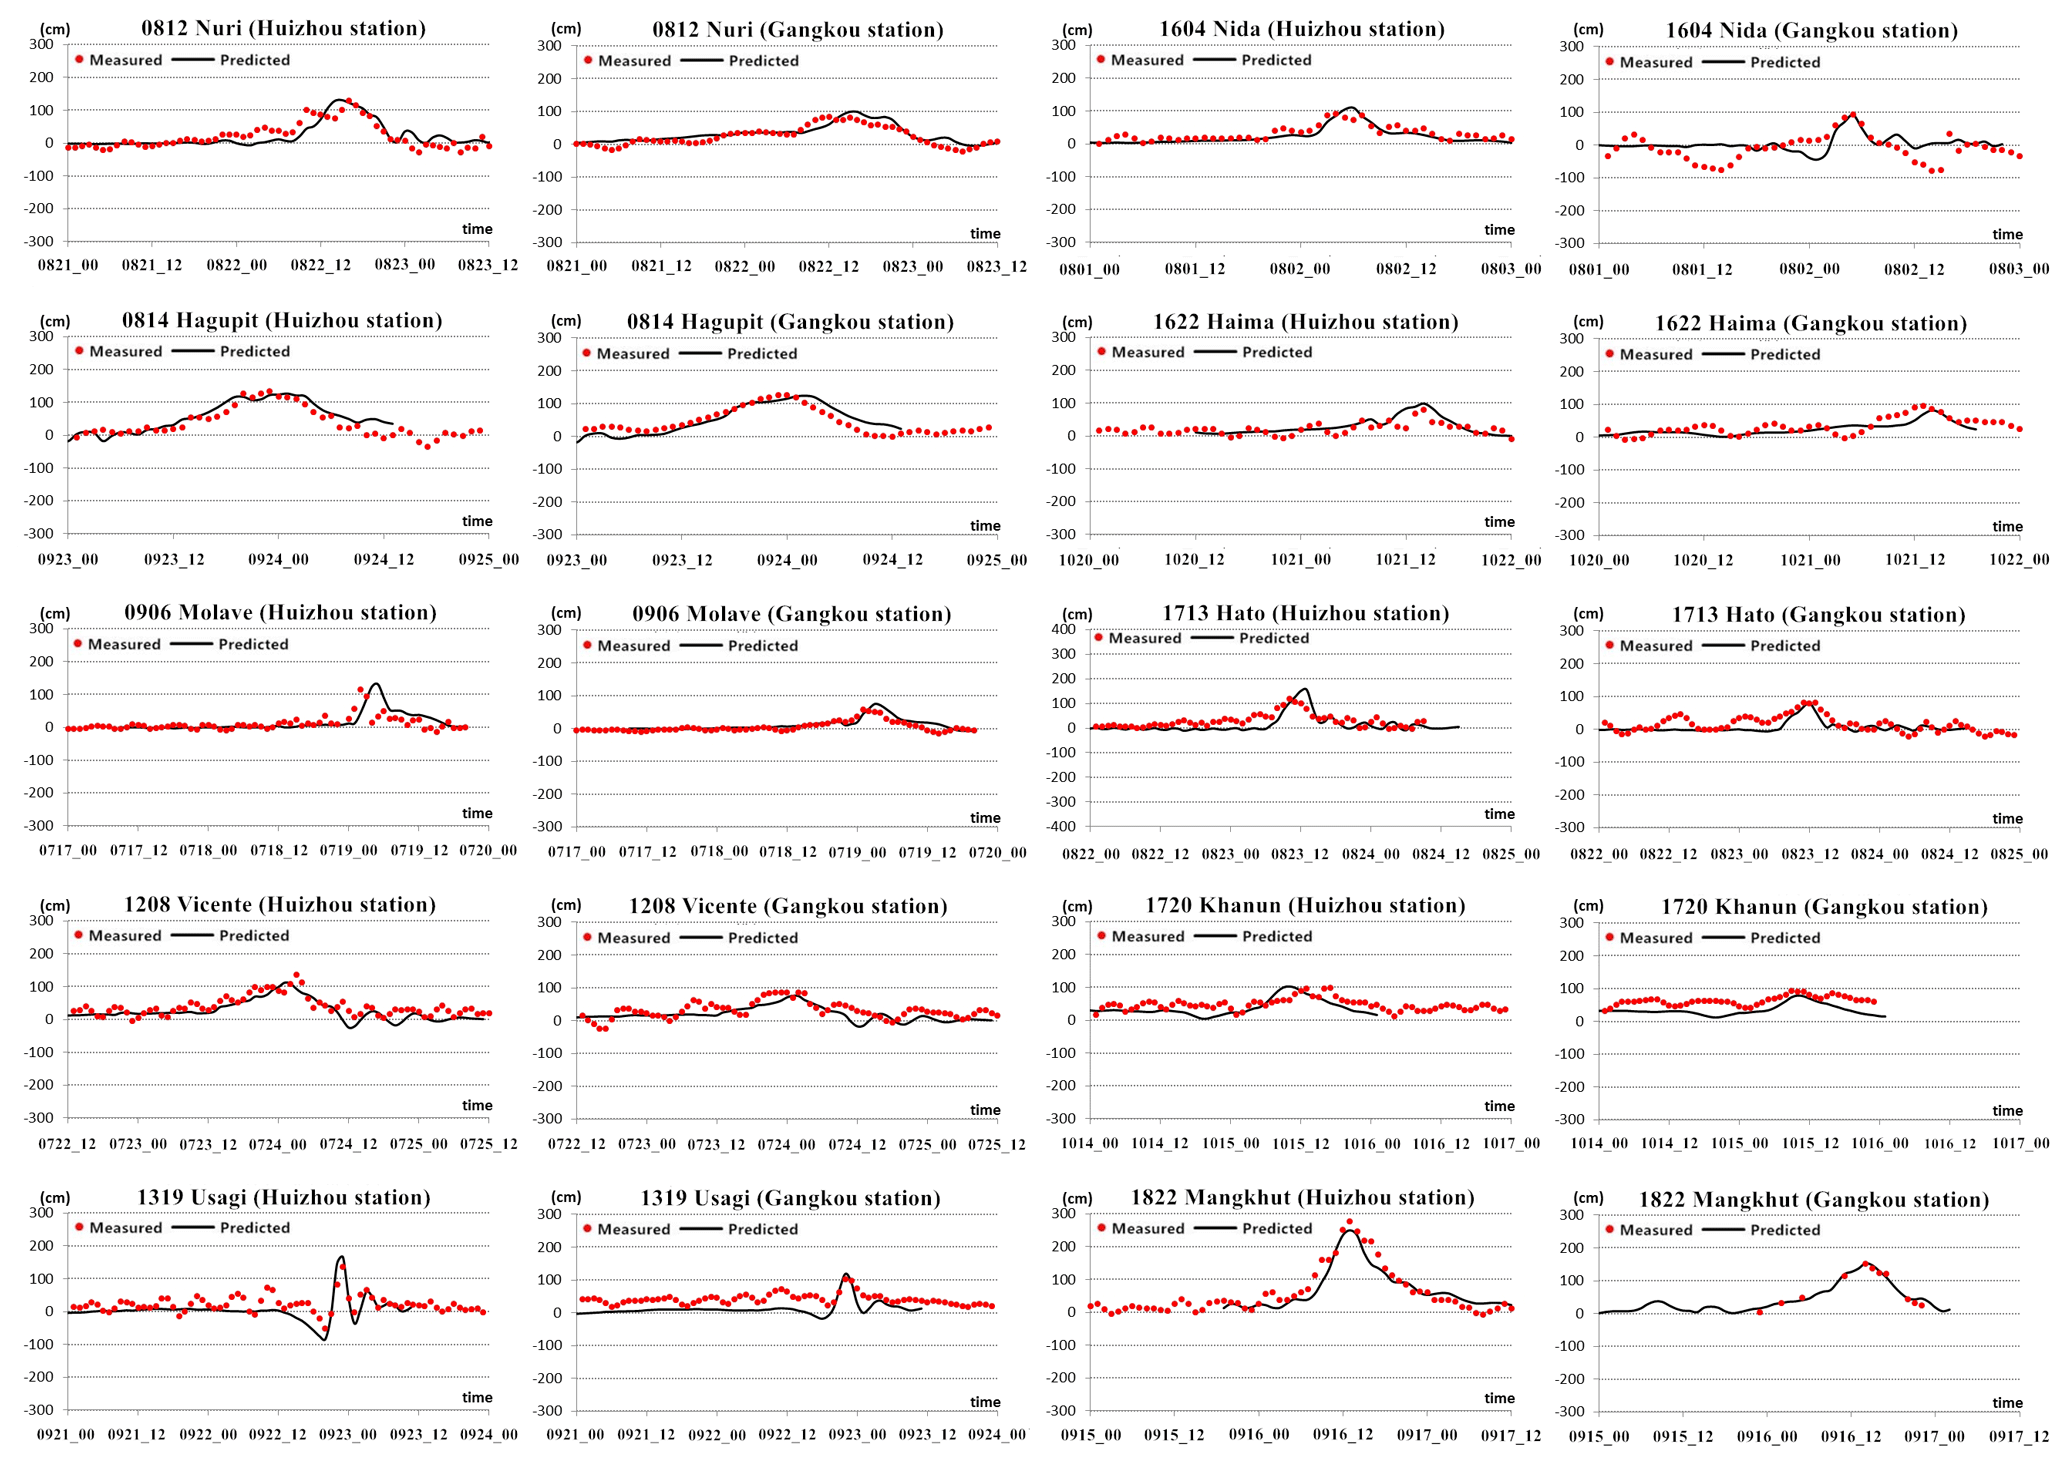
Figure 5The predicted water levels (black line) and highest measured water levels (red dots) recorded by the Huizhou station and Gangkou station during the typhoon events.
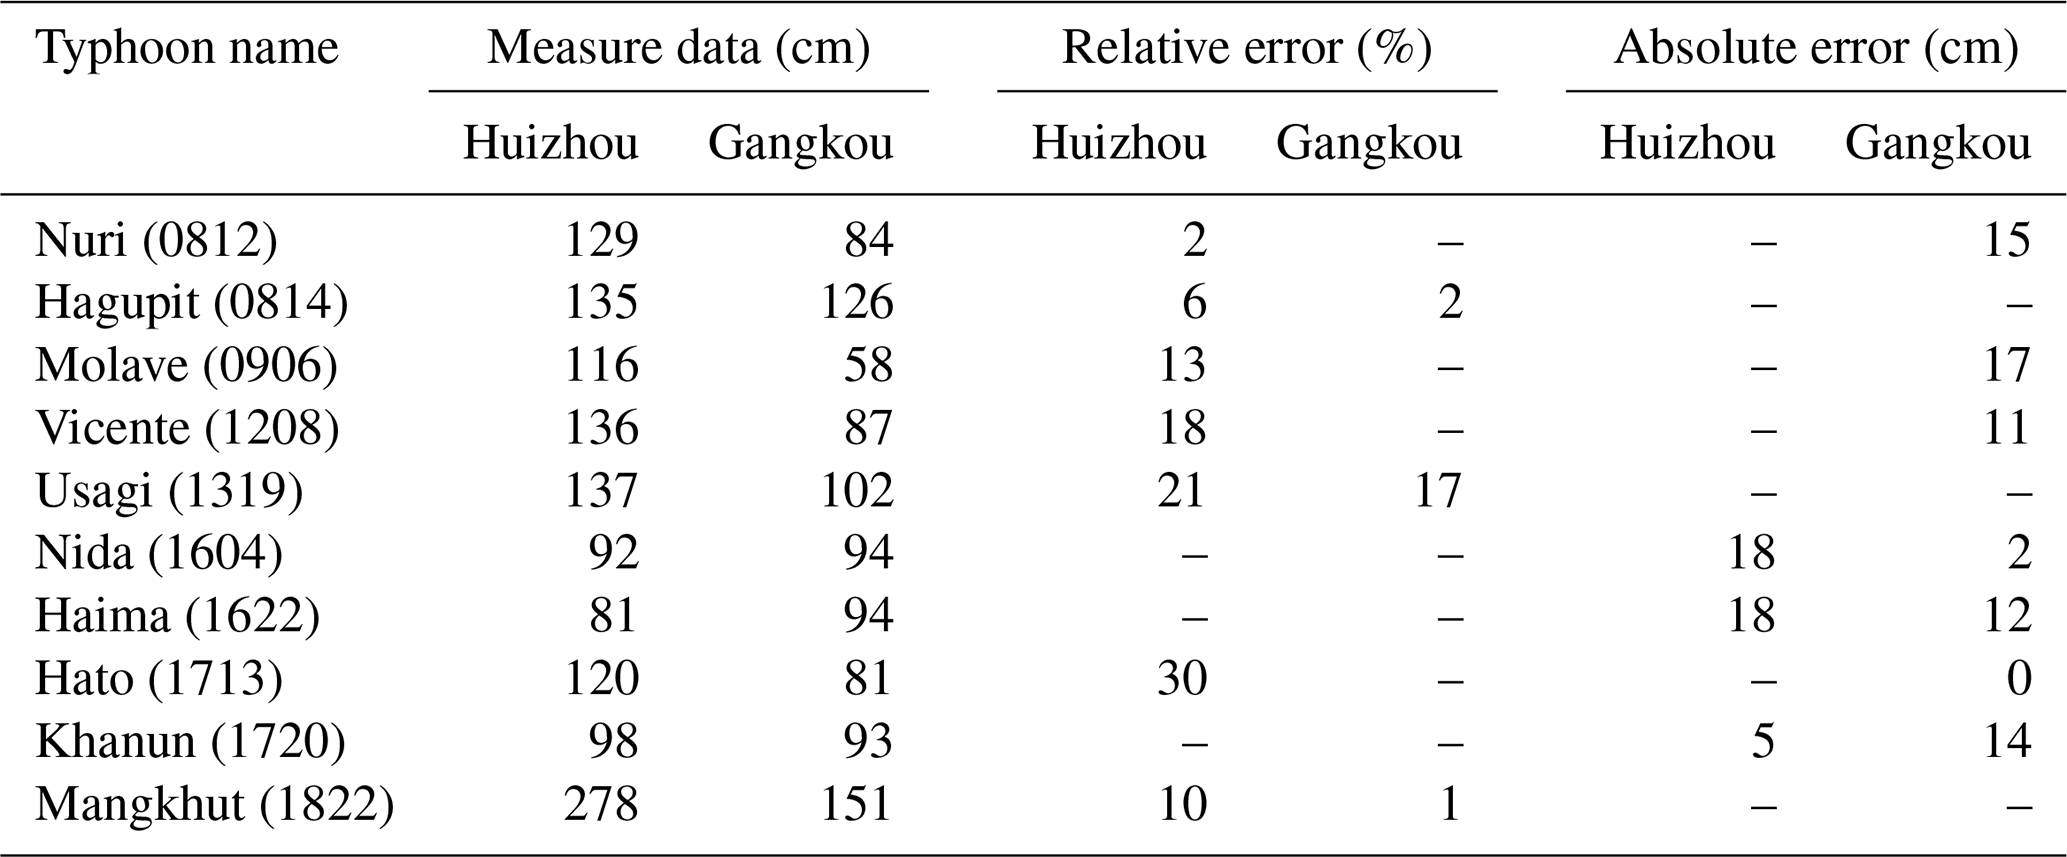
Two error statistic approaches are utilized to evaluate the performance of the coupled model with a comparison between maximum predicted water levels and the highest measured water levels. The relative error (RE) is calculated as the highest measured water level is above 100 cm. The absolute error (AE) is computed when the highest measured water level is below 100 cm. The statistical results from the two stations have been summarized in Table 3. It displays that the data with RE ≤ 20 % or AE ≤ 20 cm account for 90 % of all simulated data, which satisfies the criterion in the latest guideline. Therefore, the performance of the coupled model is considered to be reliable regarding its ability to simulate storm surges in the study area.
Table 3Summary of error statistics (AE and RE) between maximum predicted water levels and highest measured water levels from Huizhou station and Gangkou station during the typhoon events.
3.2 Storm parameters
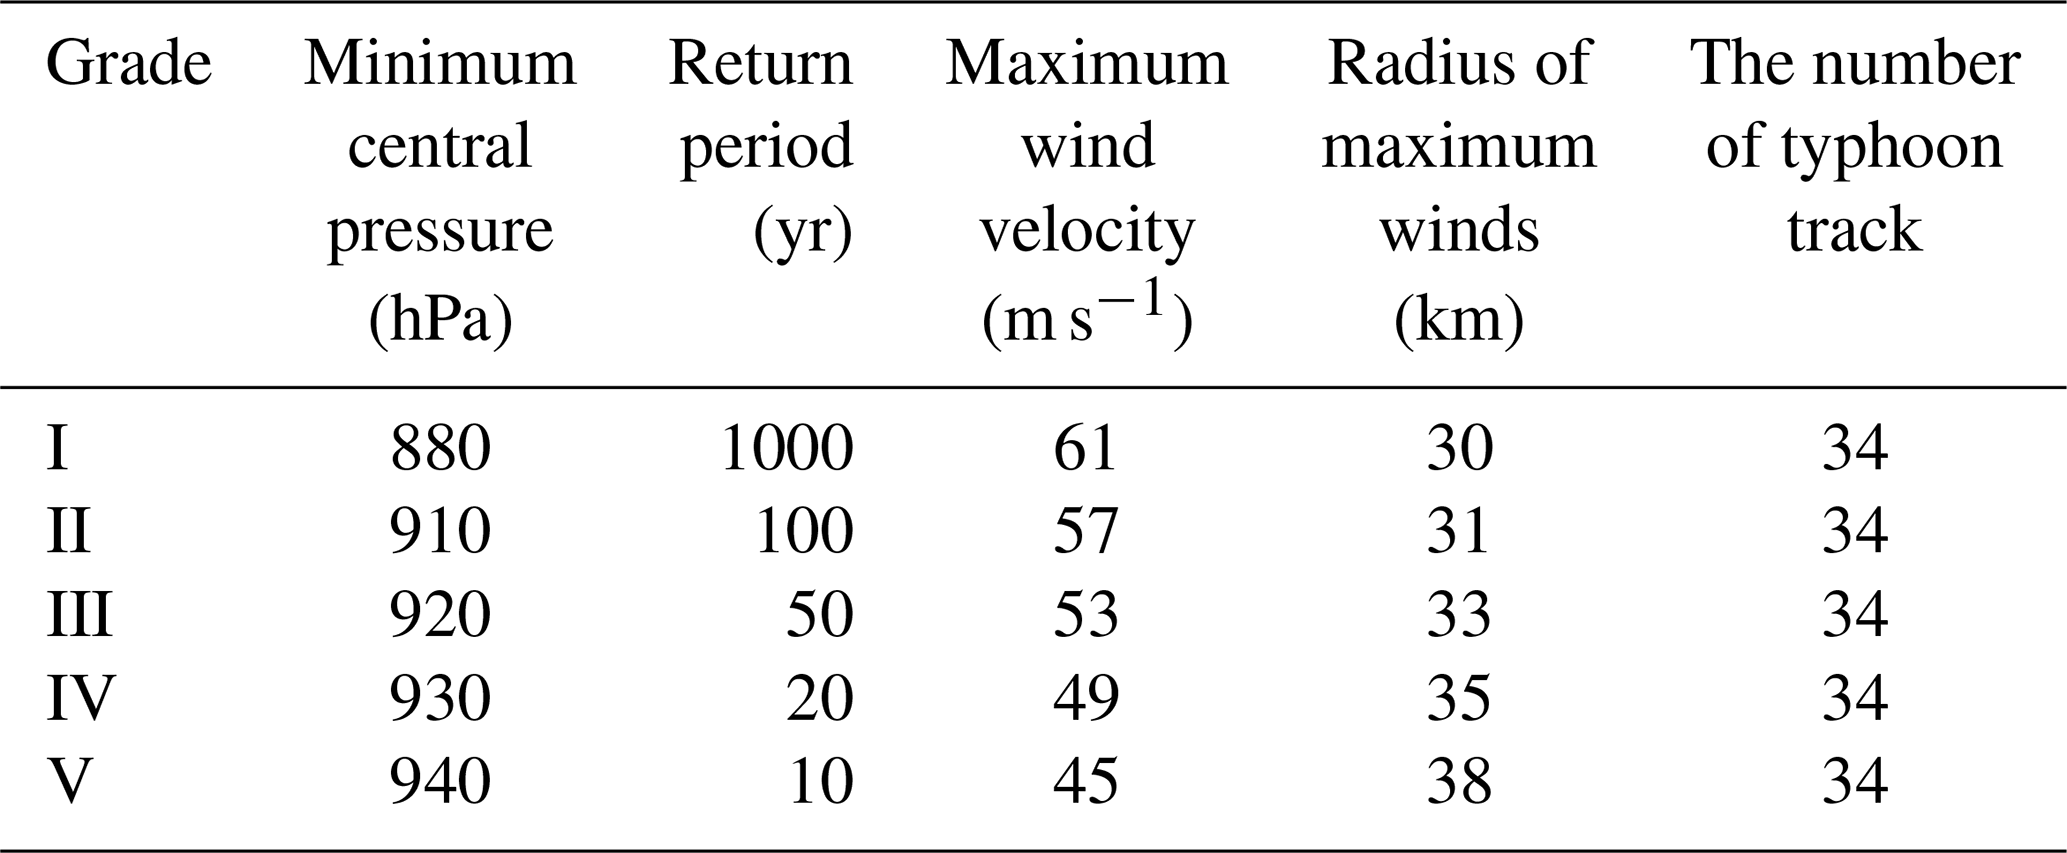
After validating the performance of the coupled ADCIRC–SWAN model, the input storm parameters must be set for designing the typhoon scenarios, which can be used to create the wind field with the Jelesnianski method to drive the storm surge in the coupled model. The storm parameters include the minimum central pressure, the radius of maximum winds, the maximum wind velocity, and the storm track.
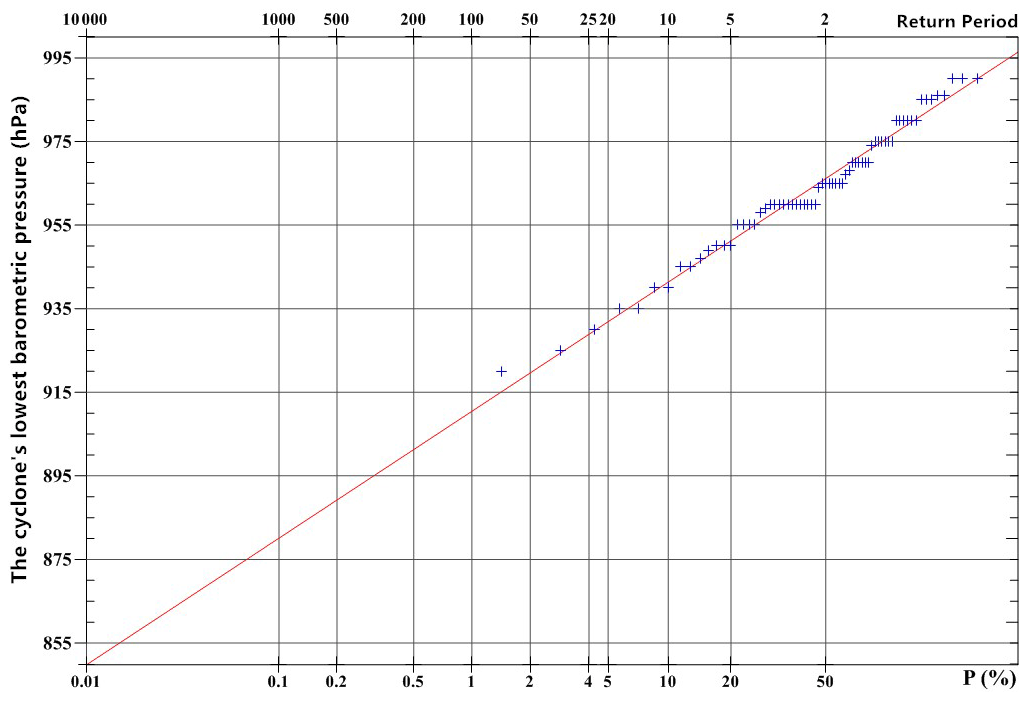
Figure 6The relation between the return period and the central pressure of typhoons on extreme value distribution Type I, which struck coastal areas of Huizhou city from 1949–2017.
3.2.1 Return period and minimum central pressure
The typhoon return period is the average time between typhoons with a certain intensity at a specific location. The typhoon return periods for Huizhou can be determined by making statistics of historical typhoon records in Huizhou. Based on the historical typhoon records, the minimum central pressure–return period relation for the study area was constructed with extreme value distribution Type I, as shown in Fig. 6. Thus, the minimum central pressure associated with a given return period can be calculated. For example, it can be observed from Fig. 6 that the minimum central pressure of typhoons corresponding to the return period of 1000 years was estimated at 880 hPa.
3.2.2 Radius of maximum wind
The radius of maximum wind (Rmax) has a strong connection to the maximum wind velocity and the minimum central pressure of the typhoon (P0). The researchers (Vickery et al., 2000; Cheung et al., 2007) developed empirical formulas to calculate the radius of maximum wind based on the Rmax–P0 relationship, as shown in Eq. (1) to (3), where θ represents the latitude of the typhoon's center, ΔP indicates the pressure difference between central pressure and ambient pressure, and Rk is an empirical constant with a value of 50.
Analyzing the historical radius of maximum wind data measured in the northwest Pacific hurricane records (2001–2016) from the Joint Typhoon Warning Center (JTWC), the empirical Eq. (4) of the Rmax–ΔP relation can be constructed based on Eq. (2) with regression statistics, as shown in Fig. 7.
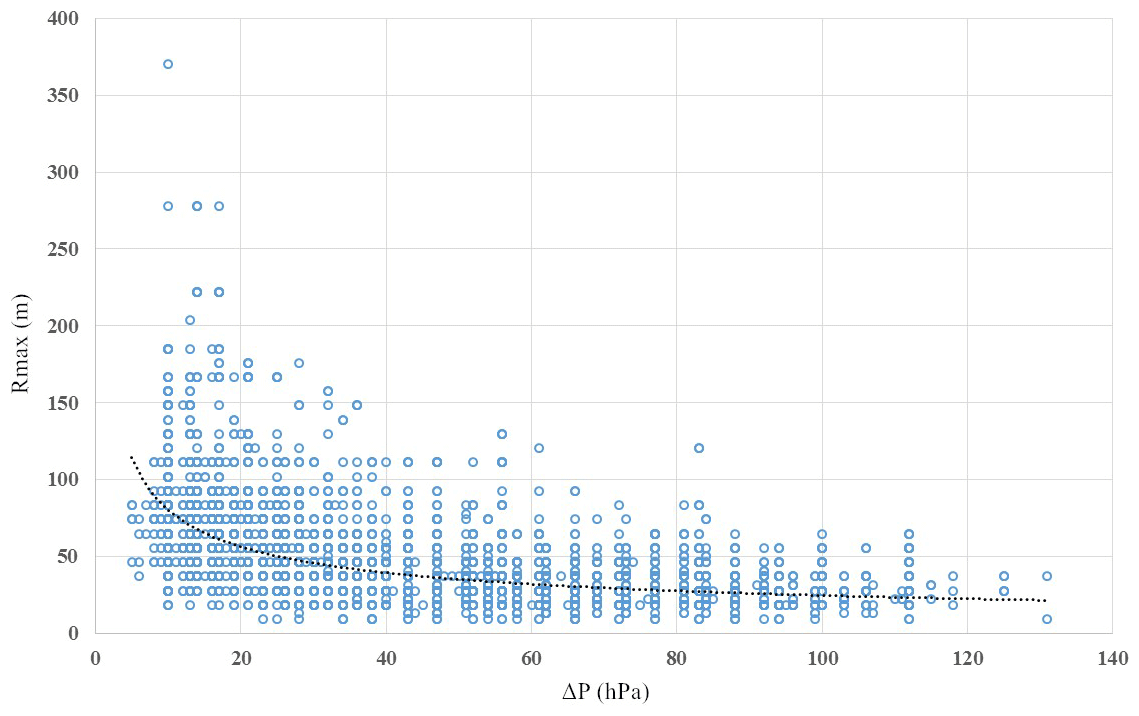
Figure 7The relation between the pressure difference (ΔP) and the radius of maximum wind (Rmax).
Therefore, according to the above empirical equations and historical observations, the radius of maximum wind corresponding to the minimum central pressure can be calculated. As shown in Table 4, averaging the empirical values from Eqs. (1) to (4) and observed values, the radius of maximum wind with respect to the minimum central pressure at 880 hPa was estimated at 30 km.
Table 4The estimated value of the radius of maximum wind when P0 is 880 hPa.

3.2.3 Maximum wind velocity
Based on the records from the dataset of Historical Tropical Cyclones, the regression statistic is made on the observed data containing maximum wind velocity (Vmax) and the minimum central pressure (P0) with the wind–pressure empirical equation (Atkinson and Holliday, 1977), as shown in Fig. 8.

Figure 8The relation between the pressure difference (ΔP) and the maximum wind velocity (Vmax).
Then, the empirical equation of the Vmax–P0 over the study area can be established, as shown in Eq. (5).
3.2.4 Tropical storm track
The tracks of tropical cyclones, which affected the coastal area of Huizhou during the period from 1949 to 2017, can be divided into four categories: moving northward (10.2 % of total), moving northwestward (47.5 % of total), moving west-southwestward (15.5 % of total), and moving northeastward (24.4 % of total), as shown in Fig. 9.
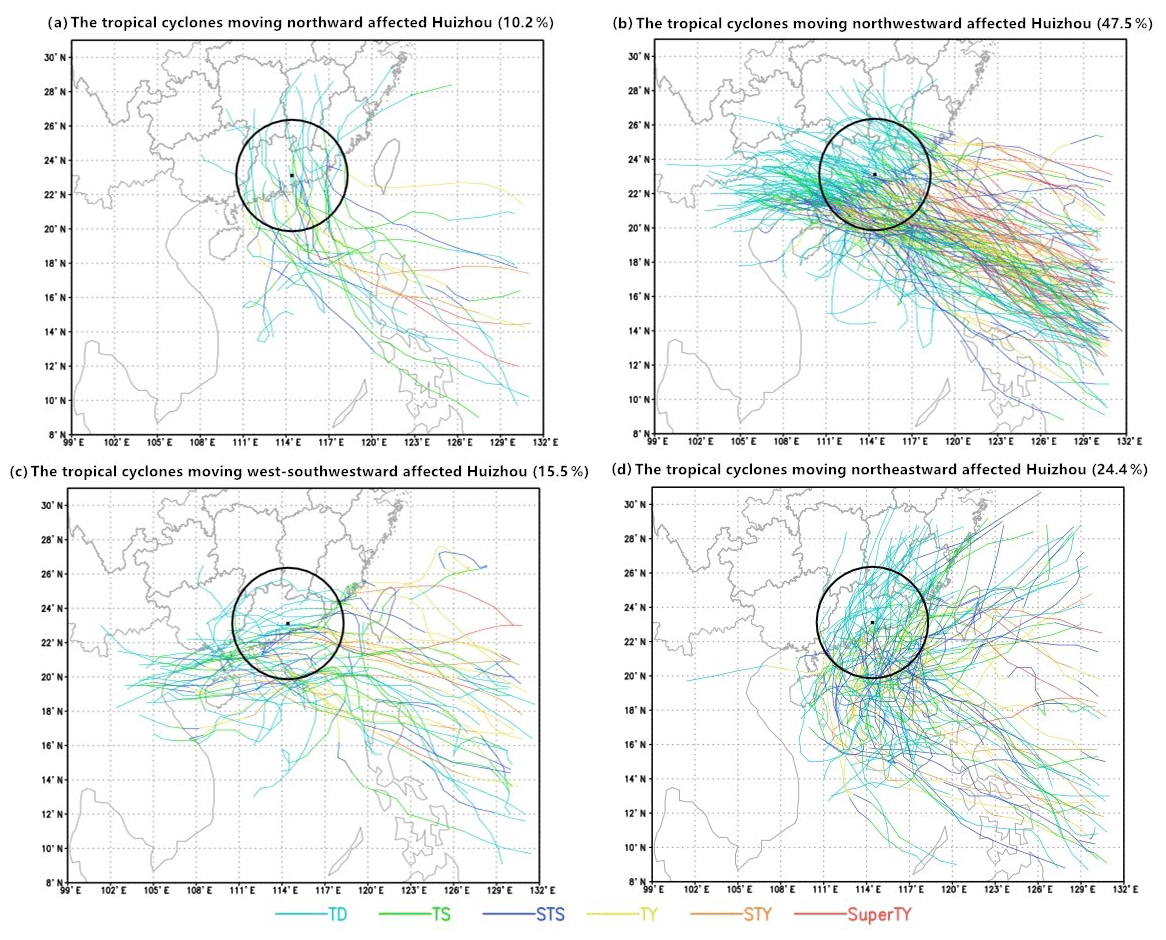
Figure 9The tracks of tropical cyclones affected Huizhou from 1949 to 2017. There are six categories of tropical cyclones: tropical depression (TD), tropical storm (TS), severe tropical storm (STS), typhoon (TY), severe typhoon super (STY), and super typhoon (Super TY).
Figure 9 indicates that tropical cyclones that approached the coast areas of Huizhou in the northwest (47.5 %) are the most common. The northwestward track is perpendicular to the coastline of Huizhou, which can increase the maximum storm surge for the study area. Analyzing the dataset of Historical Tropical Cyclones and dataset of Water Level Records, the five typhoons (7908, 0906, 1319, 1713, 1822) that caused the higher water level over the study area were moved on the northwestward track. In particular, the recent super typhoon Mangkhut (1822), which struck southern China in September 2018, led to the highest water level in Huizhou history. The track of super typhoon Mangkhut is shown in Fig. 10.
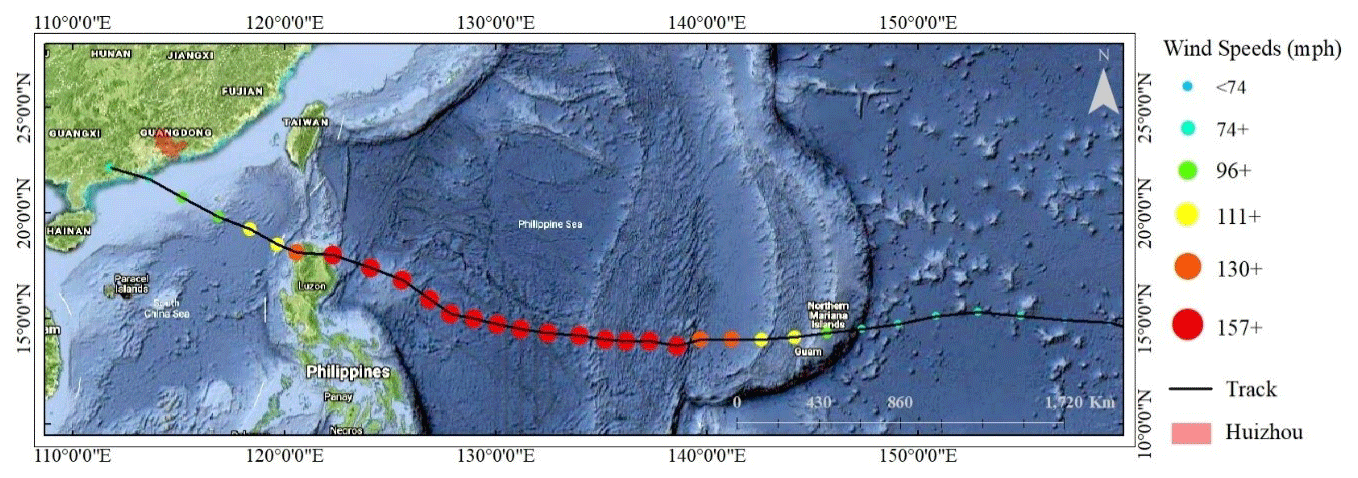
Figure 10The track of super typhoon Mangkhut over the western North Pacific and the South China Sea. The six categories of wind speeds are represented by the different colored dots. The track map was made using the ArcGIS 10.5 software based on the satellite base map layer, which was obtained from © Google Maps (map data © 2019 Google).

Figure 11The 34 typhoon tracks (16 shifting to the left and 17 shifting to the right and from the Mangkhut track) over the western North Pacific and the South China Sea. The track map was made using the ArcGIS 10.5 software based on the satellite base map layer, which was obtained from © Google Maps (map data © 2019 Google).
Figure 10 depicts the super typhoon Mangkhut moving northwestward into the South China Sea toward southern China. It was the costliest and most devastating marine disaster in the history of Huizhou. During the super typhoon Mangkhut period, the maximum water level at Huizhou gauging station reached up to 349 cm at 13:00 LT, 16 September 2018. The direct economic losses caused by super typhoon Mangkhut to Huizhou were estimated at RMB 577.39 million, and 0.236 million people were affected. Therefore, the Mangkhut track was chosen to model the worst-case scenario of storm surge under different representative typhoon intensities in this study.
In order to provide complete geographical coverage for the study area, a set of deviated typhoon tracks were produced. The 33 typhoon tracks deviating from the original Typhoon Mangkhut track were generated, as shown in Fig. 11. These 34 tracks are spaced 5 km apart and represent the typhoon activity near Huizhou. In this paper, the tracks were used to simulate the storm surge in the coastal area of Huizhou with the Jelesnianski method and the coupled model (ADCIRC–SWAN).
3.3 Procedure for assessing risk
The procedure for conducting the risk assessment of storm surge in China is derived from the latest guideline. The risk assessment is regarded as a combination of hazard assessment and vulnerability assessment. The procedure involves four steps: typhoon scenario design, hazard assessment, vulnerability assessment, and risk assessment as shown in Fig. 12.
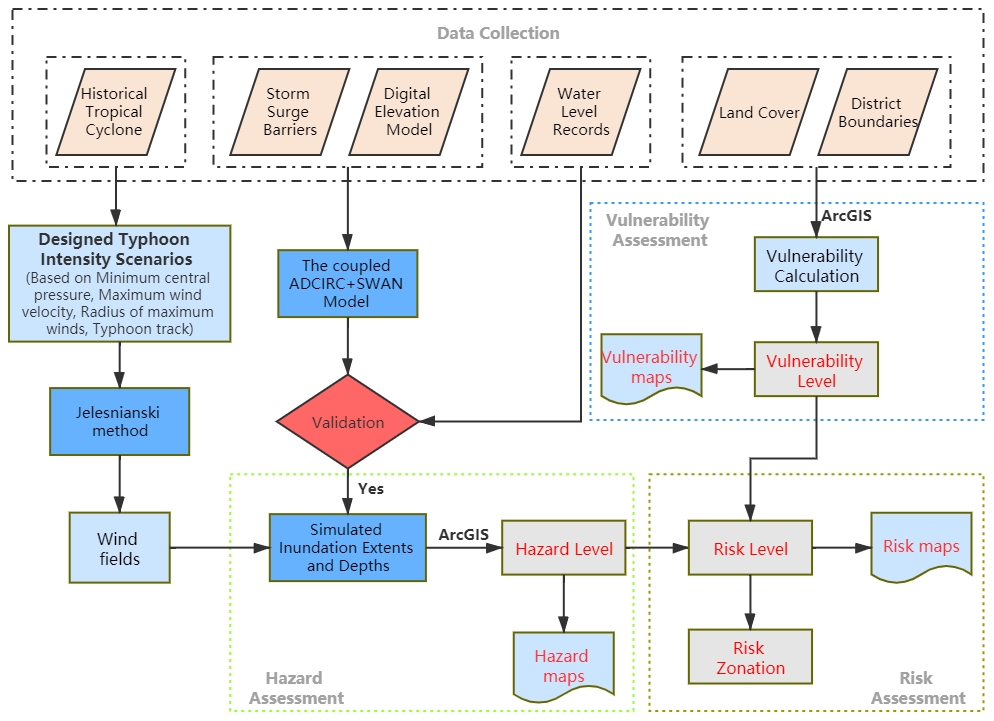
Figure 12The procedure for conducting the risk assessment of storm surge over the study area.
As seen in Fig. 12, the datasets used in the study are Land Cover, DEM, Historical Tropical Cyclones, Historical Sea Level, Storm Surge Barriers, and District Boundaries. The wind field created with the Jelesnianski method is provided to the coupled (SWAN–ADCIRC) model, which simulates the storm surge for each of the design typhoon intensity scenarios. Subsequently, the 12 h time series data of simulated surge documenting the temporal variation in inundation depth over the computational domain are generated. Then, these output data from the coupled (SWAN–ADCIRC) model for each scenario are converted to the ArcGIS 10.5 software. Eventually, the hazard maps, vulnerability maps, and risk maps for these representative scenarios are made using the ArcGIS 10.5 software.
3.3.1 Typhoon scenario design
The typhoon scenario is parametrized by intensity, maximum wind velocity, radius of maximum winds, and track. The lower the central pressure or the longer the year return period, the more intense the storm. Thus, the minimum central pressure or the year return period can be regarded as an indicator for the typhoon intensity. The comprehensive and representative typhoon intensity for the minimum central pressure of 880, 910, 920, 930, and 940 hPa (corresponding to 1000-, 100-, 50-, 20-, and 10-year return period) scenarios were designed. The corresponding maximum wind velocity and radius of maximum winds were calculated for each of the designed scenarios according to the analysis in Sect. 3.2.1–3.2.3, as shown in Table 5. The 34 constructed tracks discussed in Sect. 3.2.4 were used as input data to create the wind field.
Table 5Constructed storm scenarios with different intensities.
3.3.2 Hazard assessment
The hazard assessment is to identify the potential inundation extent and depth of storm surge caused by typhoons for the study area. The ADCIRC–SWAN model integrated with the Jelesnianski method was run on the datasets for scenarios with an increasing minimum central pressure from 880 hPa up to 940 hPa. Then, the outputs of the coupled model (ADCIRC–SWAN) were imported to the GIS software.
The spatial extents of surge area and heights of surge water in given scenarios were displayed in the ArcGIS 10.5 software. The inundation depth was calculated by subtracting DEM from the height of simulated surge water at each grid. The storm surge hazard for the study area was assessed based on the classifications of inundation depths as summarized in Table 6. Accordingly, the different hazard levels were assigned to the inundation zones.
Table 6Hazard zone classification according to the inundation depth.

3.3.3 Vulnerability assessment
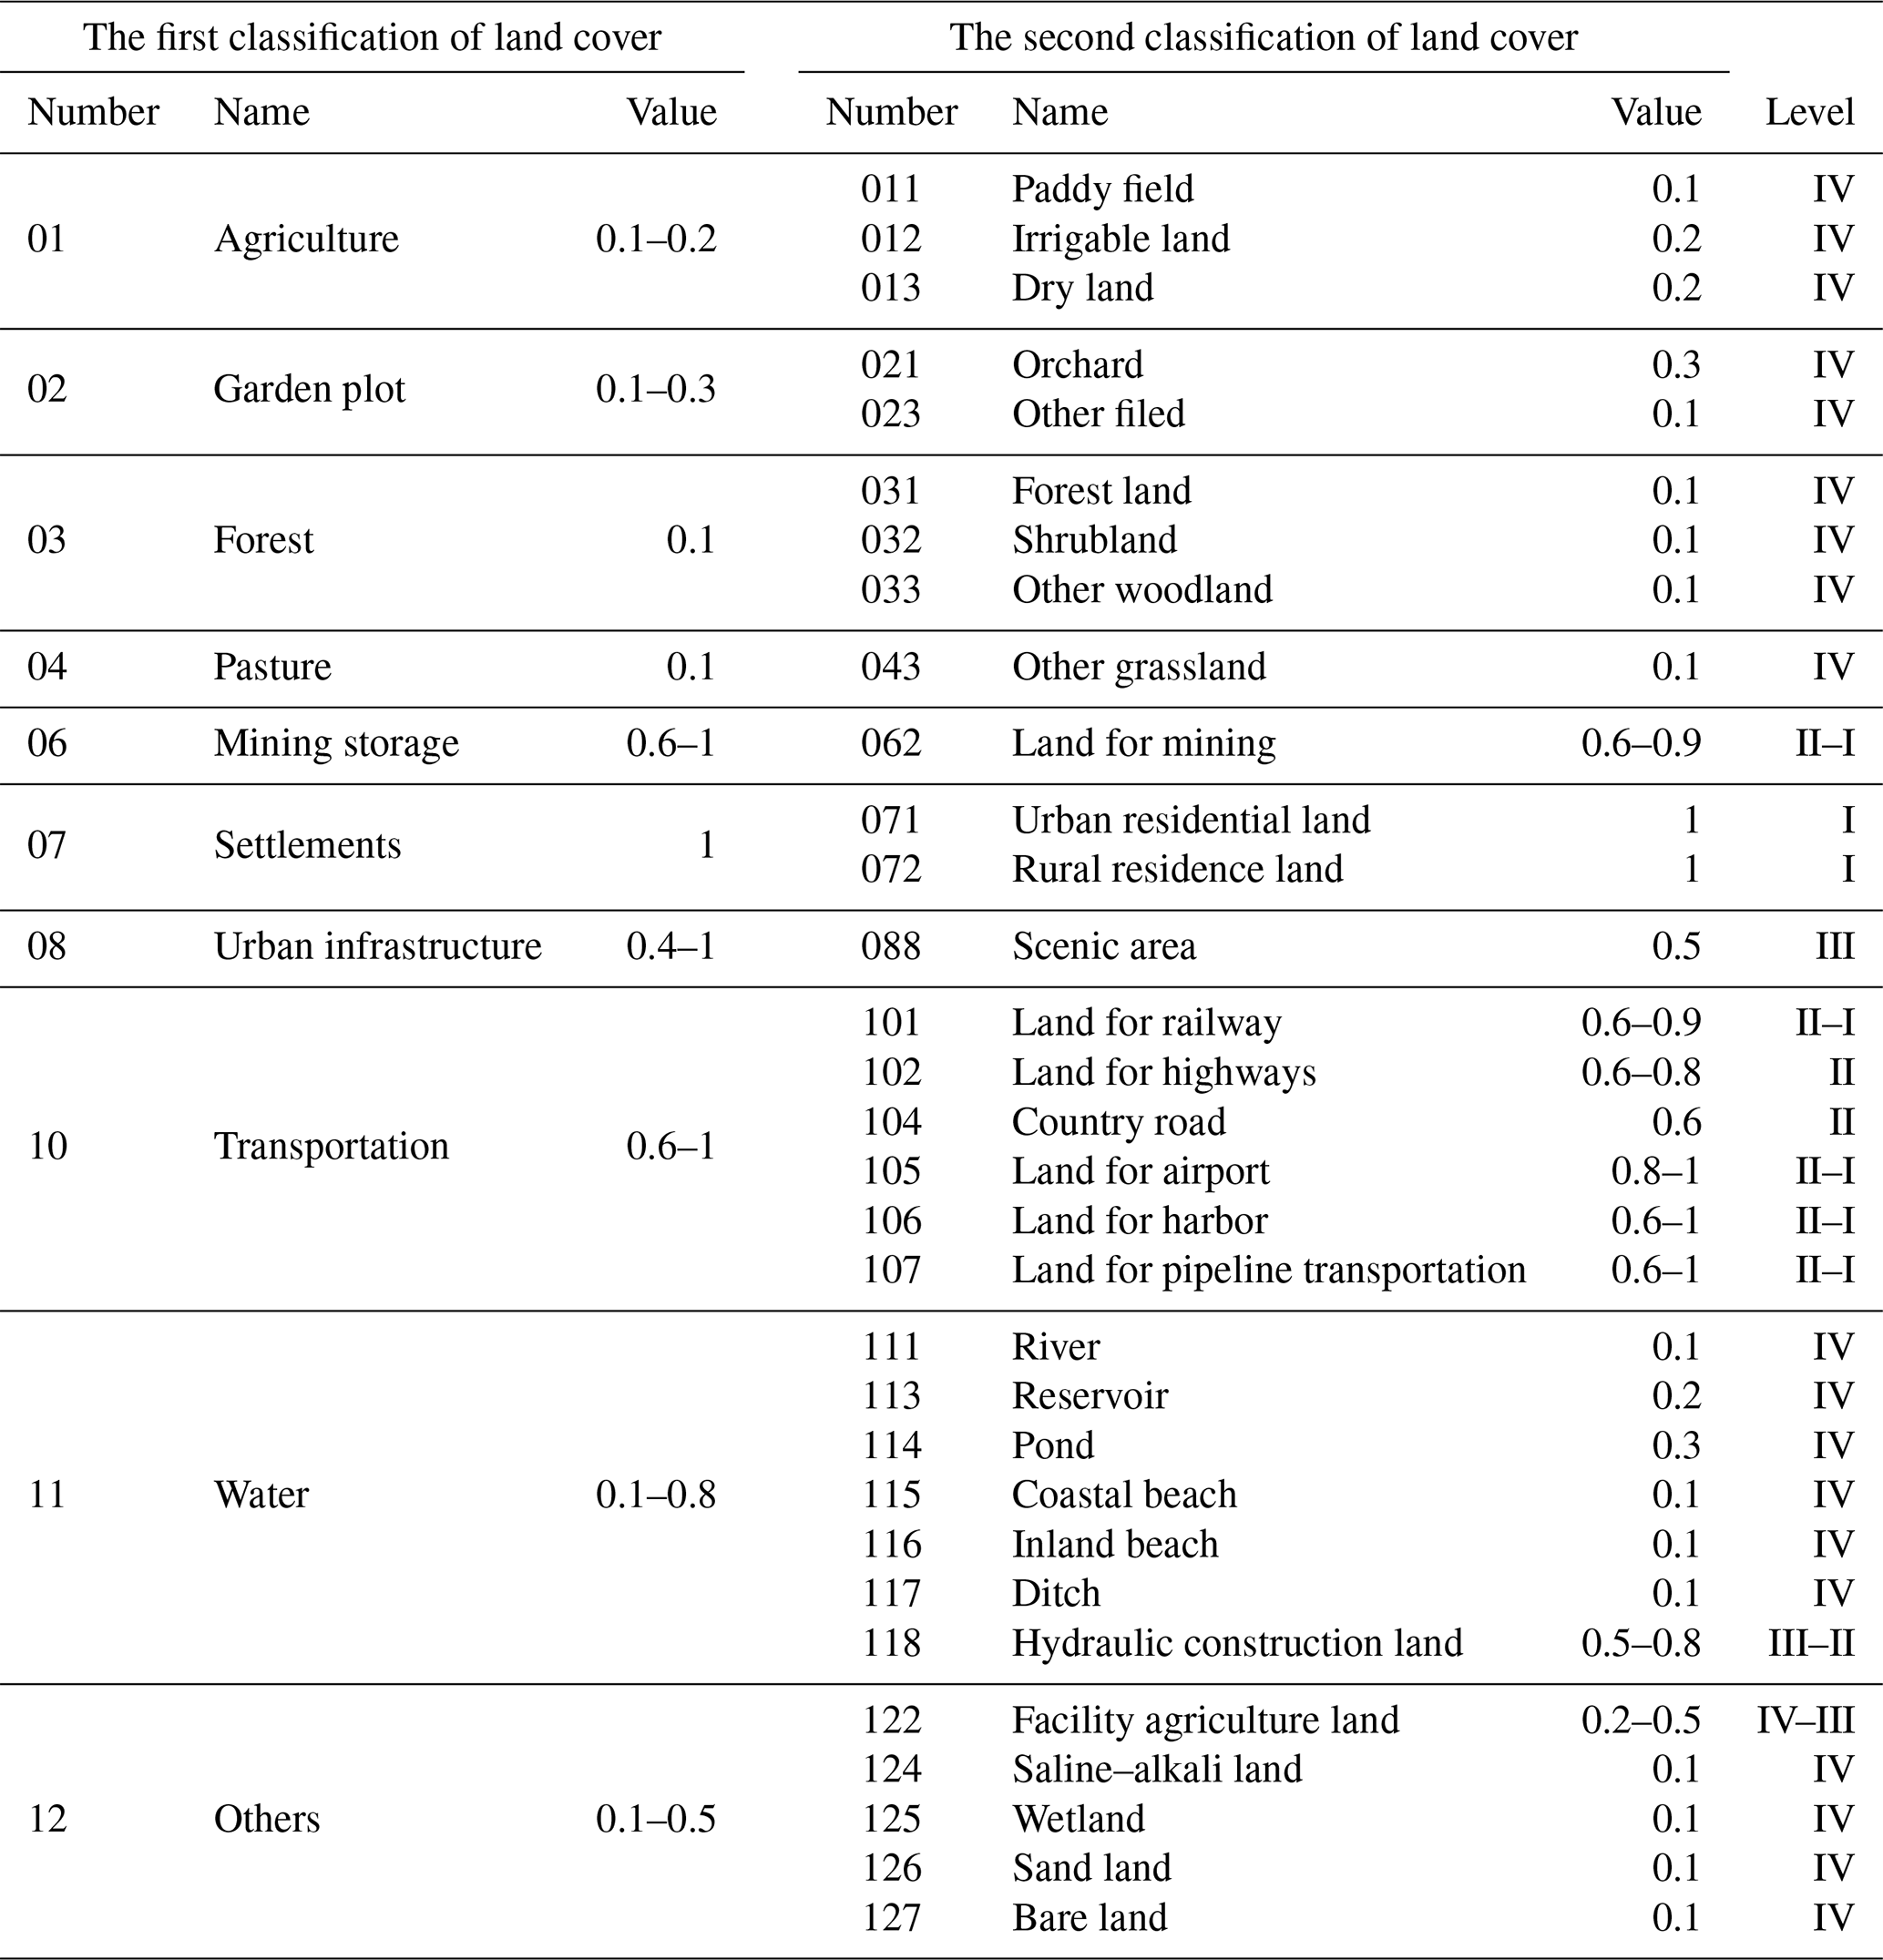
The exposure assessment aims to identify elements affected by storm surge. The land cover can be considered to be the representation of affected elements. The land cover type is regarded as an indicator to assess the vulnerability in the study area to storm surge. The vulnerability values ranging from 0 to 1 are assigned to different land cover types, which were defined in the latest guideline according to their properties of susceptibility and resilience to storm surge. The value of 0 indicates no vulnerability, and the value of 1 represents the highest vulnerability. The four levels of vulnerability were defined in the latest guideline (I–IV), from very high vulnerability (I) to low vulnerability (IV). The Land Cover dataset was categorized into 12 first classifications according to the latest guideline, as summarized in Table 7. Based on the vulnerability value corresponding to land cover type in Table 7, the vulnerability level over the study area was evaluated.
Table 7The vulnerability value and vulnerability level for different land cover types.
3.3.4 Risk assessment
As for the risk assessment, the inundated region is divided into several storm surge risk districts by integrating the inundation hazard assessment and vulnerability of affected elements over the study area. The quantitative risk assessment and the risk matrix are the primary methods for evaluating risk. However, the quantitative risk assessment method is data-demanding, and it is difficult to quantify all populations and properties at risk. The risk matrix, a typical semiquantitative approach, is utilized to solve these problems. The risk matrix is made of classes of hazard level on one axis and the vulnerability level on the other axis, as shown in two-dimensional Table 8.
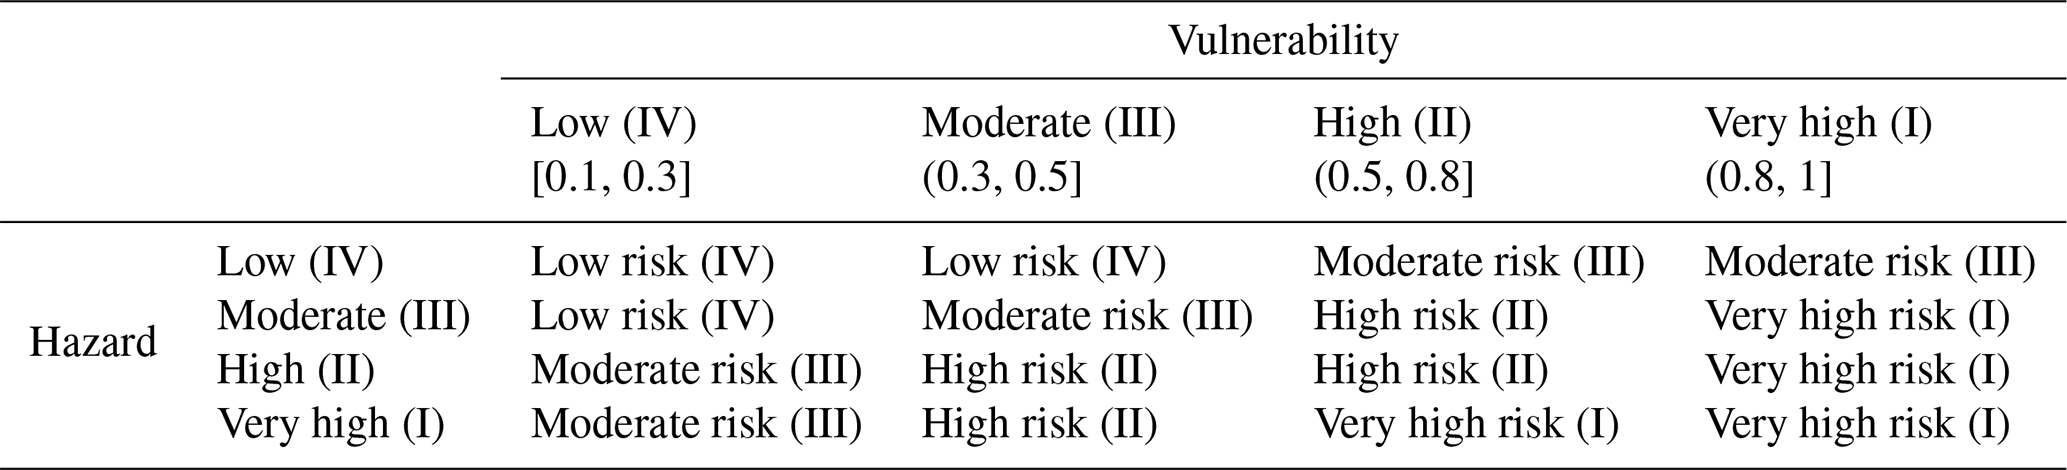
With the risk matrix approach, the degree of risk can be determined based on limited quantitative data. The degree of risk is evaluated by four levels (I–IV) from very high risk (I) to low risk (IV). For example, low vulnerability combined with low hazard can lead to a low risk, or the combination of very high vulnerability and low hazard can result in moderate risk in the area.
4.1 Hazard assessment
The coupled model (ADCIRC–SWAN) model and the Jelesnianski method were utilized to simulate the inundation extents and depths for each designed typhoon scenario (Table 5). The 12 h simulation of storm surge flooding over the study area for each typhoon scenario can be displayed in the ArcGIS 10.5 software. For example, for the typhoon intensity with 880 hPa (1000-year return period), the simulated inundation depths and extents of storm surge at time intervals of 2 h during the 12 h period are shown in Fig. 13. The inundation depth over the study area was divided into four categories according to the criterion in the latest guideline.
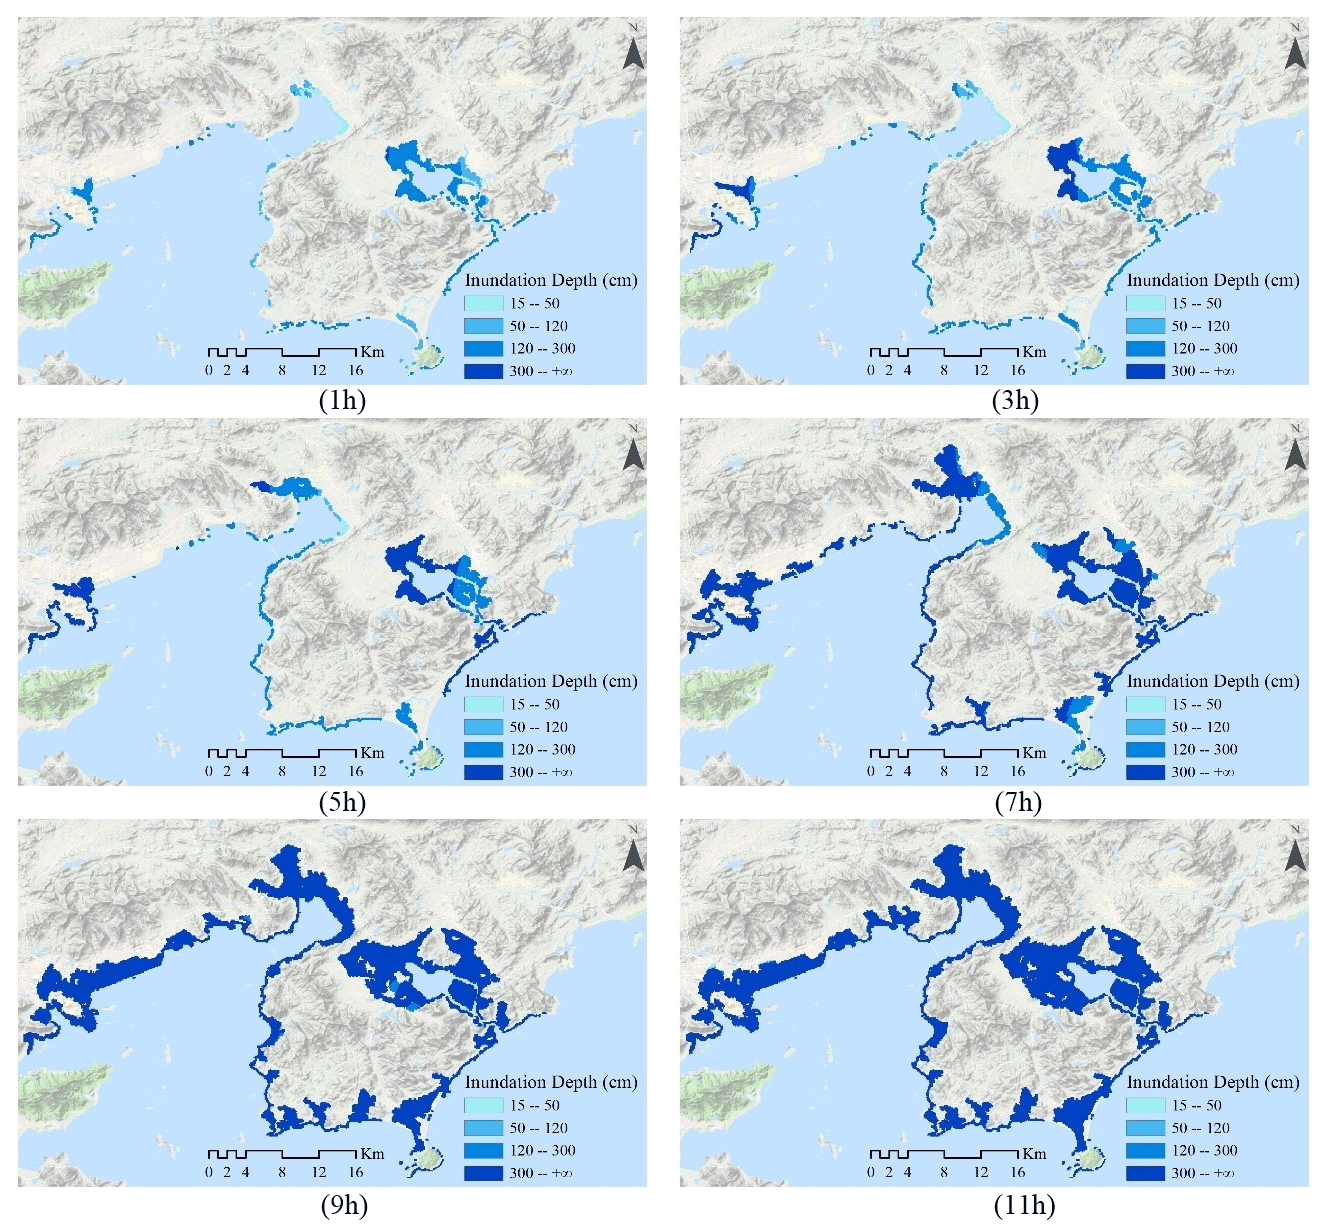
Figure 13The maps display the simulated inundation extents of storm surge over the study area during 12-hour simulation for the 880 hPa (1000-year return period) scenario. These maps were made using the ArcGIS 10.5 software based on the terrain base map layer, which was obtained from © Google Maps (map data © 2019 Google).
As shown in Fig. 13, the inundation area progressively expanded from the coastline to the mainland and reached a maximum at approximately the 11th hour. Moreover, the maximum distance that storm surge flooding penetrates inland from the coastline is approximately 6 km, and the inundation distances in other regions are less than 4 km. Furthermore, the simulated inundation depths over many coastal areas are more than 300 cm at the 11th hour.
With the output data of simulated storm surge elevations at the 12th hour, the hazard map, where regions are in different colors based on the inundation depths (Table 6), was made for each of the designed scenarios using the ArcGIS 10.5 software. The higher the inundation depth reach, the higher the risk is. These maps of hazard assessment over the study area for the representative scenarios are shown in Fig. 14, and the inundated areas for each scenario are shown in Fig. 15.
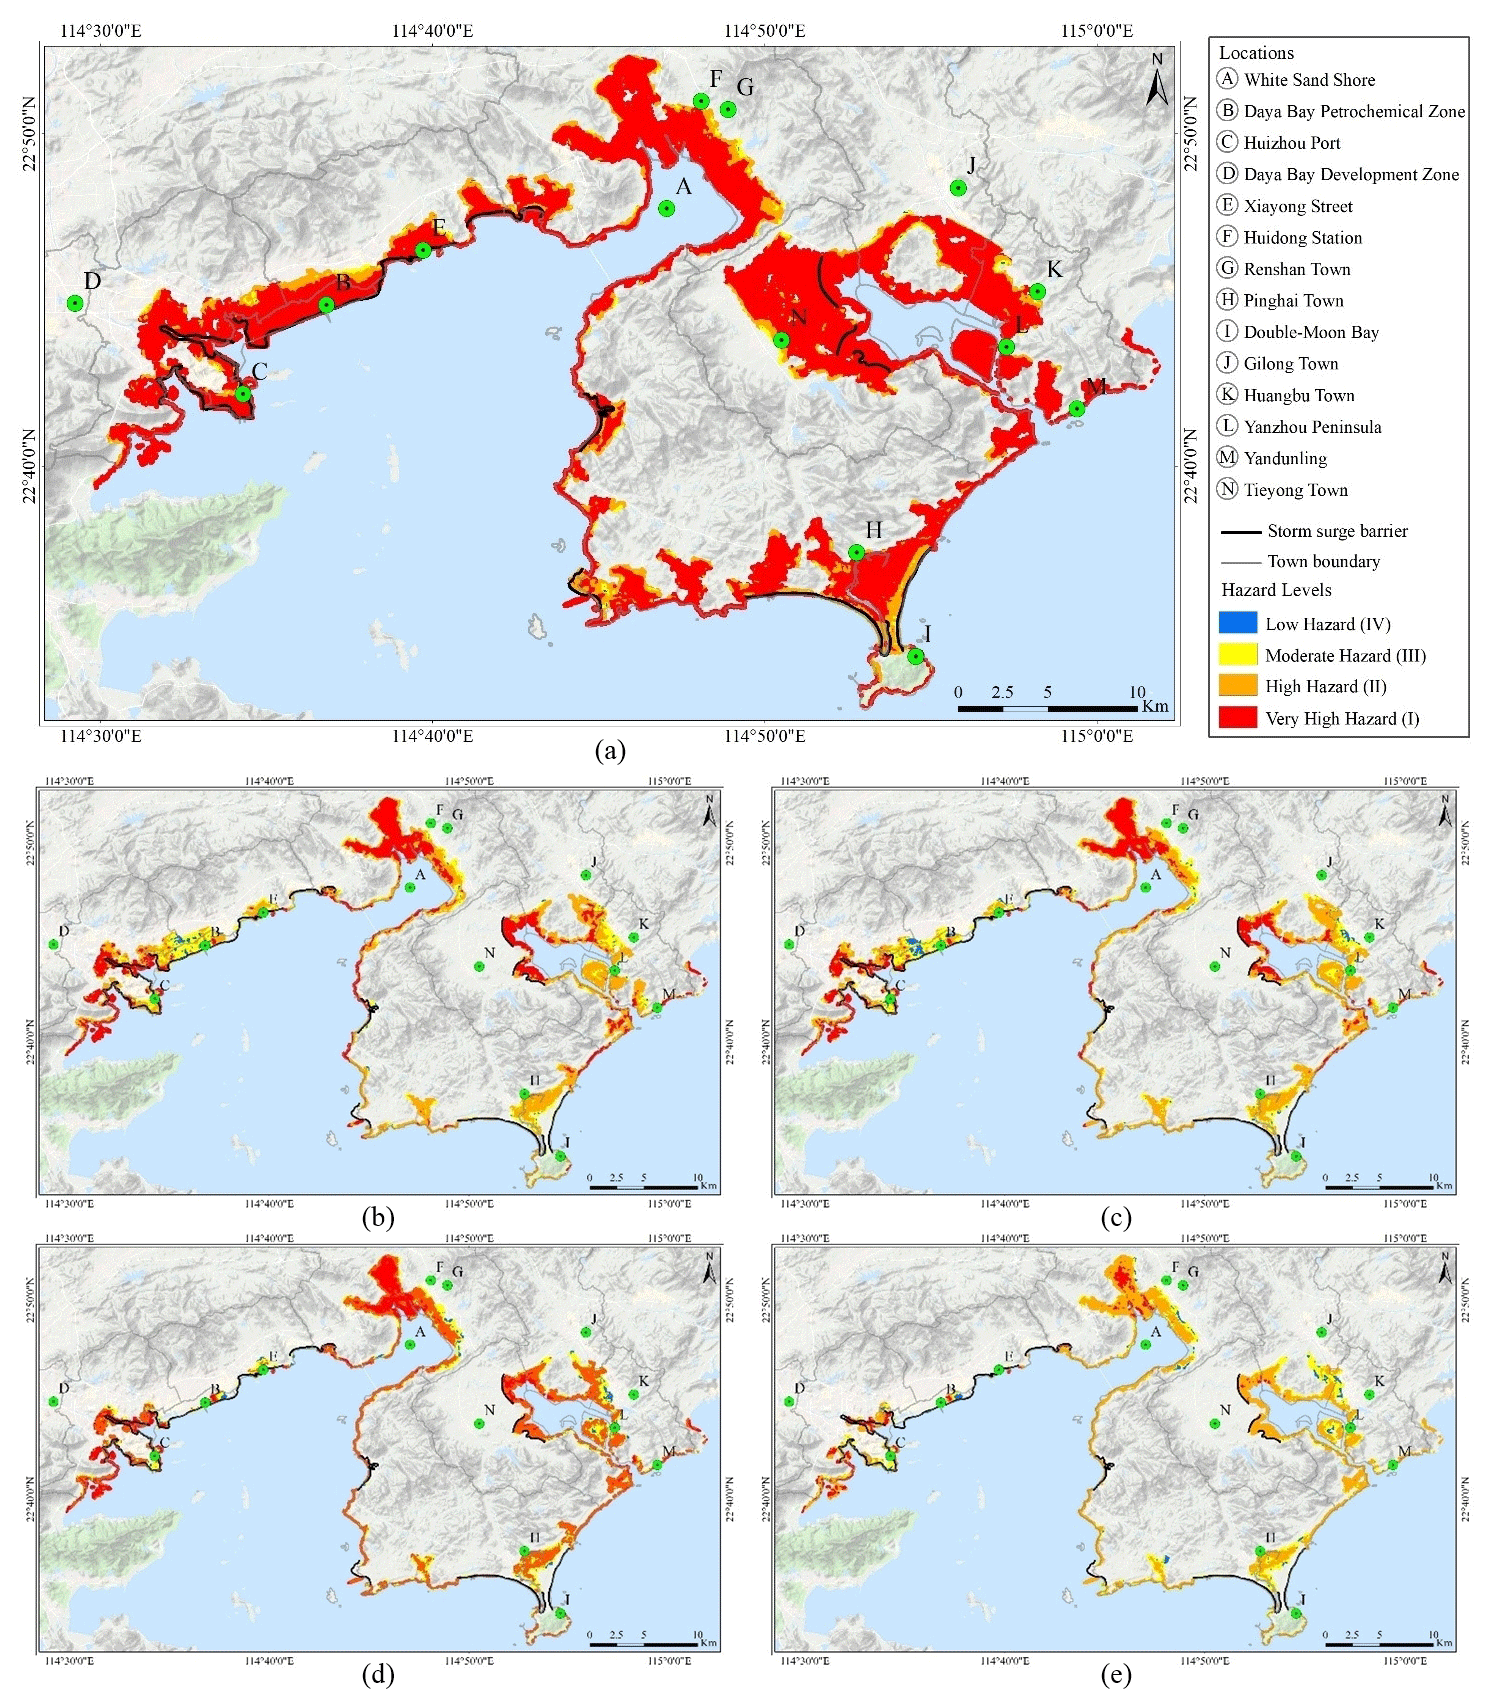
Figure 14The hazard assessment maps represent the inundation extents and depths for five storm scenarios: (a) 880 hPa, (b) 910 hPa, (c) 920 hPa, (d) 930 hPa, (e) 940 hPa. Different colors represent different hazard levels. The red means the highest water level and very high storm surge hazard, orange stands for high hazard, yellow represents moderate hazard, and blue indicates low hazard on the map. The important locations in the study area are labeled with letters, and the violet lines refer to the storm surge barriers along the coastline of Huizhou. These maps were made using the ArcGIS 10.5 software based on the terrain base map layer, which was obtained from © Google Maps (map data © 2019 Google).
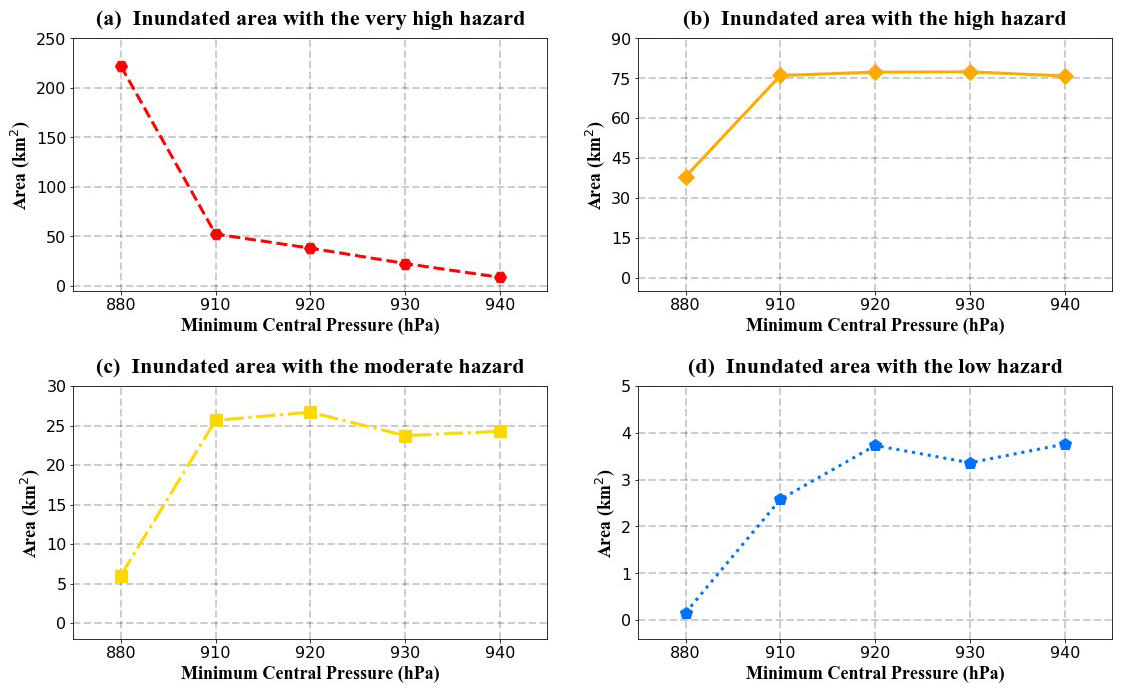
Figure 14 shows the ultimate simulated inundation extents and corresponding hazard assessment under each of the designed scenarios. First of all, the maximum inundation depths and extents decrease with increasing typhoon intensity. Second, in terms of the Daya Bay Petrochemical Zone (B), the hazard of storm surges is at a high or very high level when the minimum central pressure of the typhoon is 880 hPa. Moreover, the hazard of storm surge in the Daya Bay Petrochemical Zone (B) is at moderate and high levels as the minimum central pressure of typhoon is 910 or 920 hPa. Furthermore, the Daya Bay Petrochemical Zone (B) is hardly affected by the storm surge from the typhoon with a minimum central pressure at 930 or 940 hPa due to the protection given by storm surge barriers.
Moreover, it can be observed from Fig. 15 that the inundated area assigned to a very high hazard level decreases with increasing value of the minimum central pressure. The inundated land area belonged to the high level of hazard changes from 221.88 to 52.39 km2 when the minimum central pressure is 880 hPa. As the value of the minimum central pressure varied from 880 to 910 hPa, the inundated area classified as the high, moderate, or low hazard level increases rapidly, and these curves then remain nearly constant across other scenarios (910, 920, 930, and 940 hPa).
Figure 14a demonstrates that the very high-hazard zones are mainly located in the southeast of the Daya Bay Development Zone (D), the Huizhou Port (C), the region to the north of the White Sand Shore (A), the field close to the Huidong station (F) in Renshan town (G), the coastal place from the Double Moon Bay (I) to the Pinghai town (H), the Tieyong town (N), the land from the Huangbu town (K) to Yandunling (M), and Yanzhou Peninsula (L). The construction of storm surge barriers along the coastline of Huizhou cannot prevent storm surge caused by typhoons with a minimum central pressure at 880 hPa.
Figure 14b–e indicate that the typhoons with minimum central pressure are at 910, 920, 930, and 940 hPa; most areas of the inundated region are at a moderate level or high hazard level. The storm surge barriers can effectively protect coastal urban settlements and industrial facilities from storm surge generated by these designed typhoon scenarios. However, the Huizhou Port (C) and the southeast of the Daya Bay Development Zone (D) are at a very high hazard level caused by storm surge as they lie along the low-elevation coastal area. In addition, the hazard of storm surge in the region to the north of the White Sand Shore (A), the southwest of the Gilong town (J), and the Yanzhou Peninsula (L) is at a very high level because they are relatively flat without protection from barriers.
4.2 Vulnerability assessment
The vulnerability assessment can be used to identify different vulnerable regions in the study area. Making an exposure map is an important step before the vulnerability assessment. The Land Cover dataset obtained from the Huizhou Land and Resources Bureau in 2016 can be categorized into 10 different land cover types, and the exposure map over the study area is illustrated in Fig. 16. In addition, the land areas and percentages of different land cover types are presented in Fig. 17.

Figure 16The exposure map of different land cover types in the study area. The map was made using the ArcGIS 10.5 software based on the terrain base map layer, which was obtained from © Google Maps (map data © 2019 Google).

Figure 16 shows the distribution of different land cover types within the study area, which provides an overall view of the region where the forest is concentrated, the zone of settlements, or the location of urban infrastructure.
As seen in Fig. 17, the forest land occupies most of the land surface of the study area (55.9 %, approximately 633.17 km2). The second-largest land cover type is settlement land, which occupies approximately 10.51 % (119.1 km2) of the study area's surface. The agricultural land, the garden plot land, and the water land have a large surface area, while mining storage land, the urban infrastructure land, the pasture land, the transportation land, and other lands have a low surface area.
According to the relation between the exposure of land cover types and their corresponding vulnerability values described in Table 7, the four levels of vulnerability with each covered zone to storm surge in the study area can be determined, as displayed in Fig. 18. Moreover, the land area and percentage of each vulnerability zone in relation to the study area are summarized in Table 9.

Figure 18The map of vulnerability zones in the study area. The red means the highest vulnerability level (I), and the blue stands for the lowest vulnerability level (IV) on the map. The map was made using the ArcGIS 10.5 software based on the terrain base map layer, which was obtained from © Google Maps (map data © 2019 Google).
Table 9The vulnerability level, area, and proportion for each vulnerability zone.

Table 9 shows that the total area is 1132.8 km2. The zone marked by low vulnerability level (IV) covers an area of 978.21 km2. The zone is mainly present in the forest, agriculture, garden plot, and water and accounts for the greatest proportion of the study area. The zone assigned to the highest vulnerability level (I) is covered with settlements, and its geographical area is 119.1 km2. The vulnerability level in the land area, which is covered by mining storage and transportation, is at a high level (II), and it makes up 2.38 % of the study area. The moderate vulnerability (III) zone is mainly under the urban infrastructure class, with a total area of 8.42 km2.
Figure 18 shows that the zones marked by a very high vulnerability (level I) are mainly distributed in the center of the Daya Bay Petrochemical Zone (B) and the Daya Bay Development Zone (D) as well as the residential areas including the Renshan town (G), the Gilong town (J), and the Huangbu town (K):
-
The high-density human settlements and the highly concentrated petroleum and chemical industries make the Daya Bay Petrochemical Zone (B) highly susceptible to the effects of surge disaster, and thus the property and human loss caused by the storm surge is significant.
-
The center of the Daya Bay Development Zone (D) could suffer potential human casualties during storm surge events due to the higher density of the population.
-
The residential areas including the Renshan town (G), the Gilong town (J), Pinghai town (H), and the Huangbu town (K), which lie along the coastline, are more vulnerable to the storm surge without the protection from barriers. Therefore, these zones would most likely suffer significant losses from storm surge.
Furthermore, the Huizhou port (C) is located on the coast, playing a critical role in global trading, which could leave residents and assets with greater exposures to the storm surge than those located further inland. Accordingly, the vulnerability level in the Huizhou port (C) is high (level II).
Moreover, some urban infrastructure, transportation, and mining storage that are situated along the coastline of Huizhou are sensitive to the storm surge, and the vulnerability level for these coastal zones is moderate (III) or high (II).
In addition, the most common land cover types over the study area are forest land, agriculture land, the garden plot land, and the water land. These land cover types are hardly affected by natural disasters. Thus, most regions in the study area colored by blue are at a low vulnerability level (IV).
4.3 Risk assessment
With the risk matrix approach (Table 8), the risk map in the study area can be made by the combination of the hazard map and the vulnerability map. The risk region was categorized into four dangerous zones represented by different colors, as shown in Fig. 19. The statistics of the areas of different risk level zones for each of the design scenarios are summarized in Fig. 20.
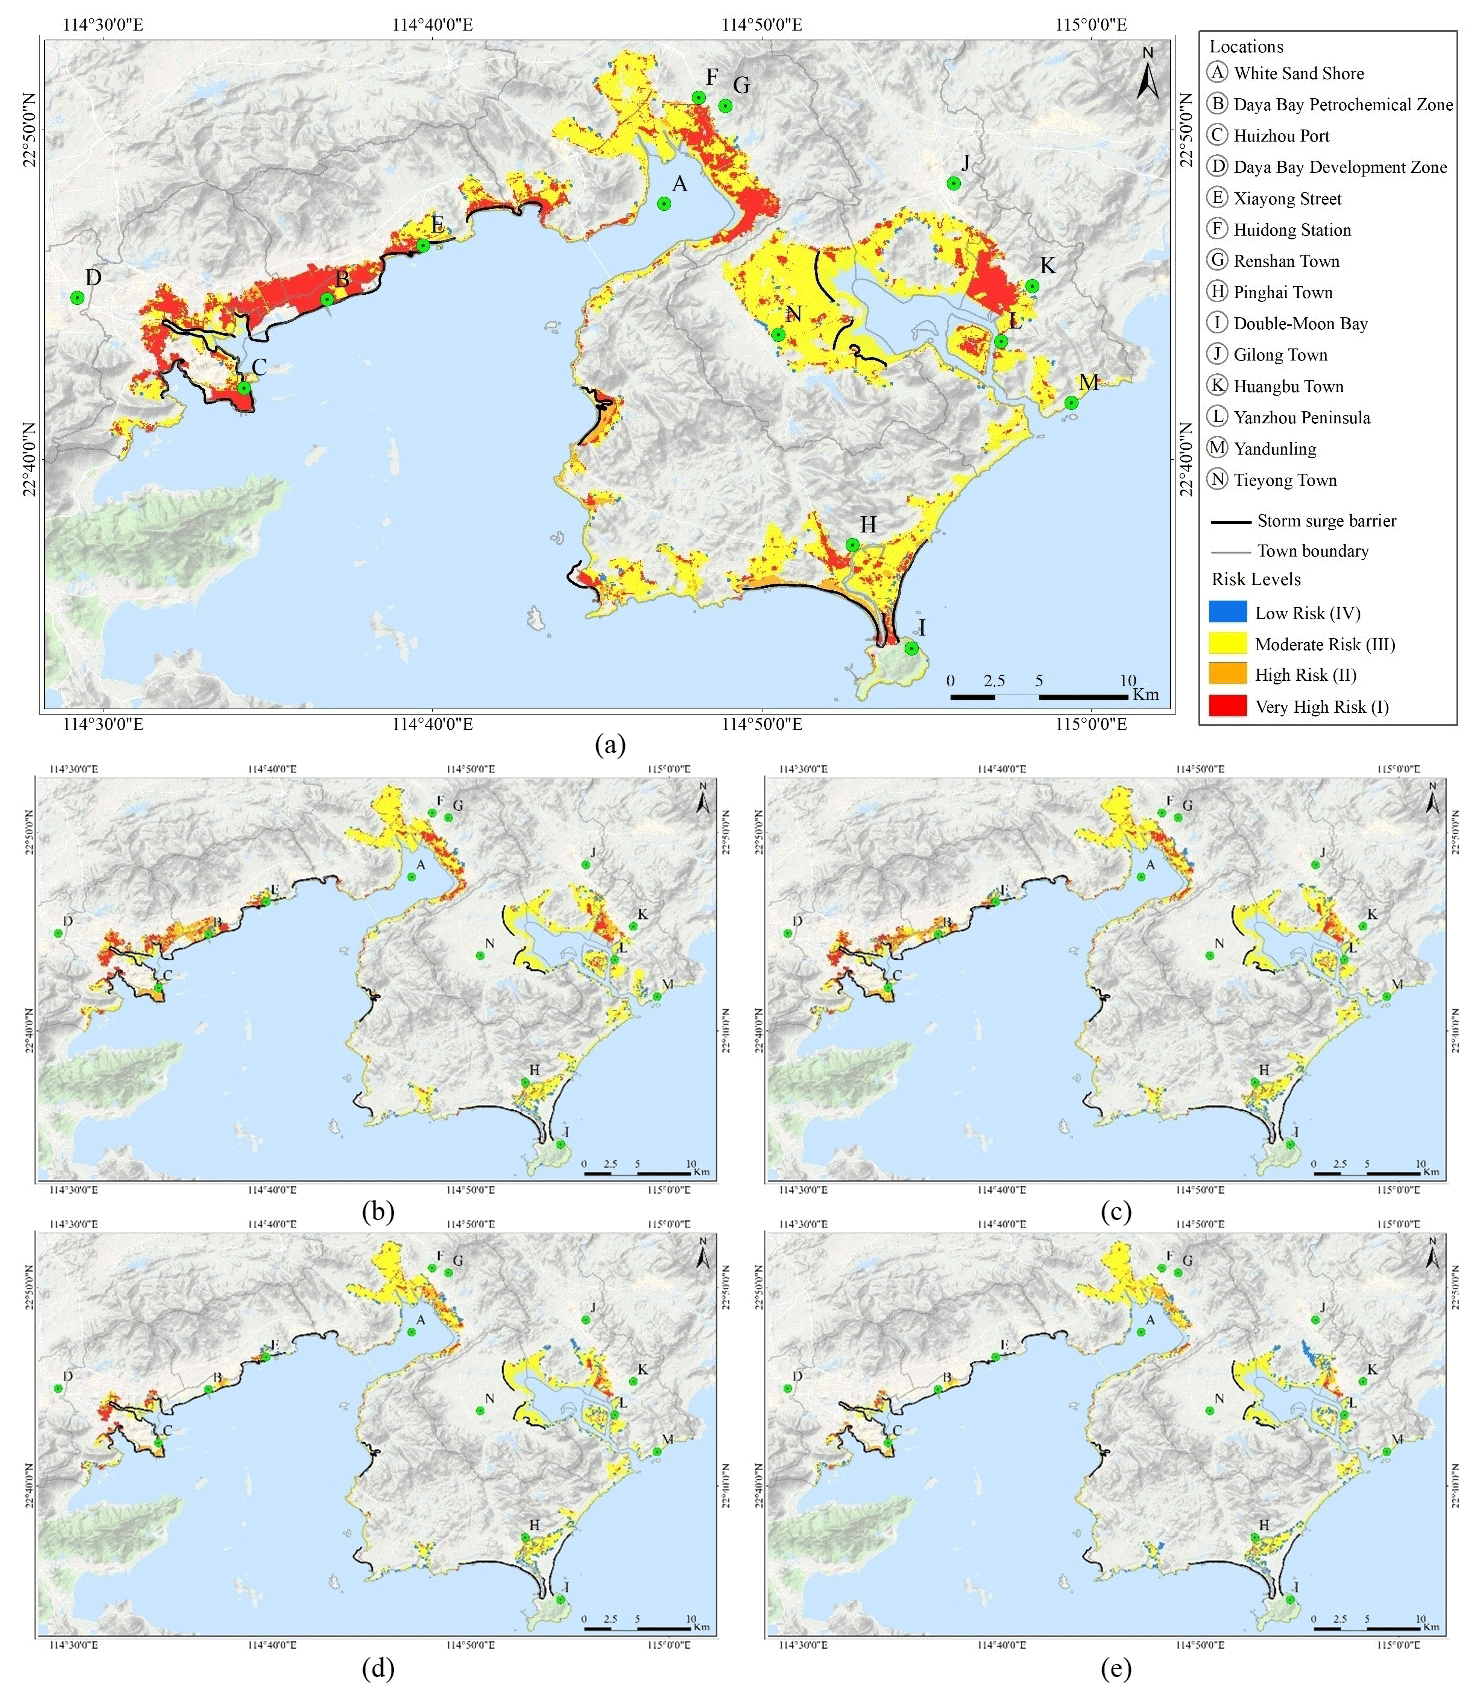
Figure 19The risk assessment maps represent the potential risk of storm surge for five designed storm scenarios: (a) 880 hPa, (b) 910 hPa, (c) 920 hPa, (d) 930 hPa, (e) 940 hPa. Different colors represent different risk levels. The red means the very high risk, orange stands for high risk, yellow represents moderate risk, and blue indicates low risk on the map. The important locations in the study area are labeled with letters, and the violet lines refer to the storm surge barriers along the coastline of Huizhou. These maps were made using the ArcGIS 10.5 software based on the terrain base map layer, which was obtained from © Google Maps (map data © 2019 Google).
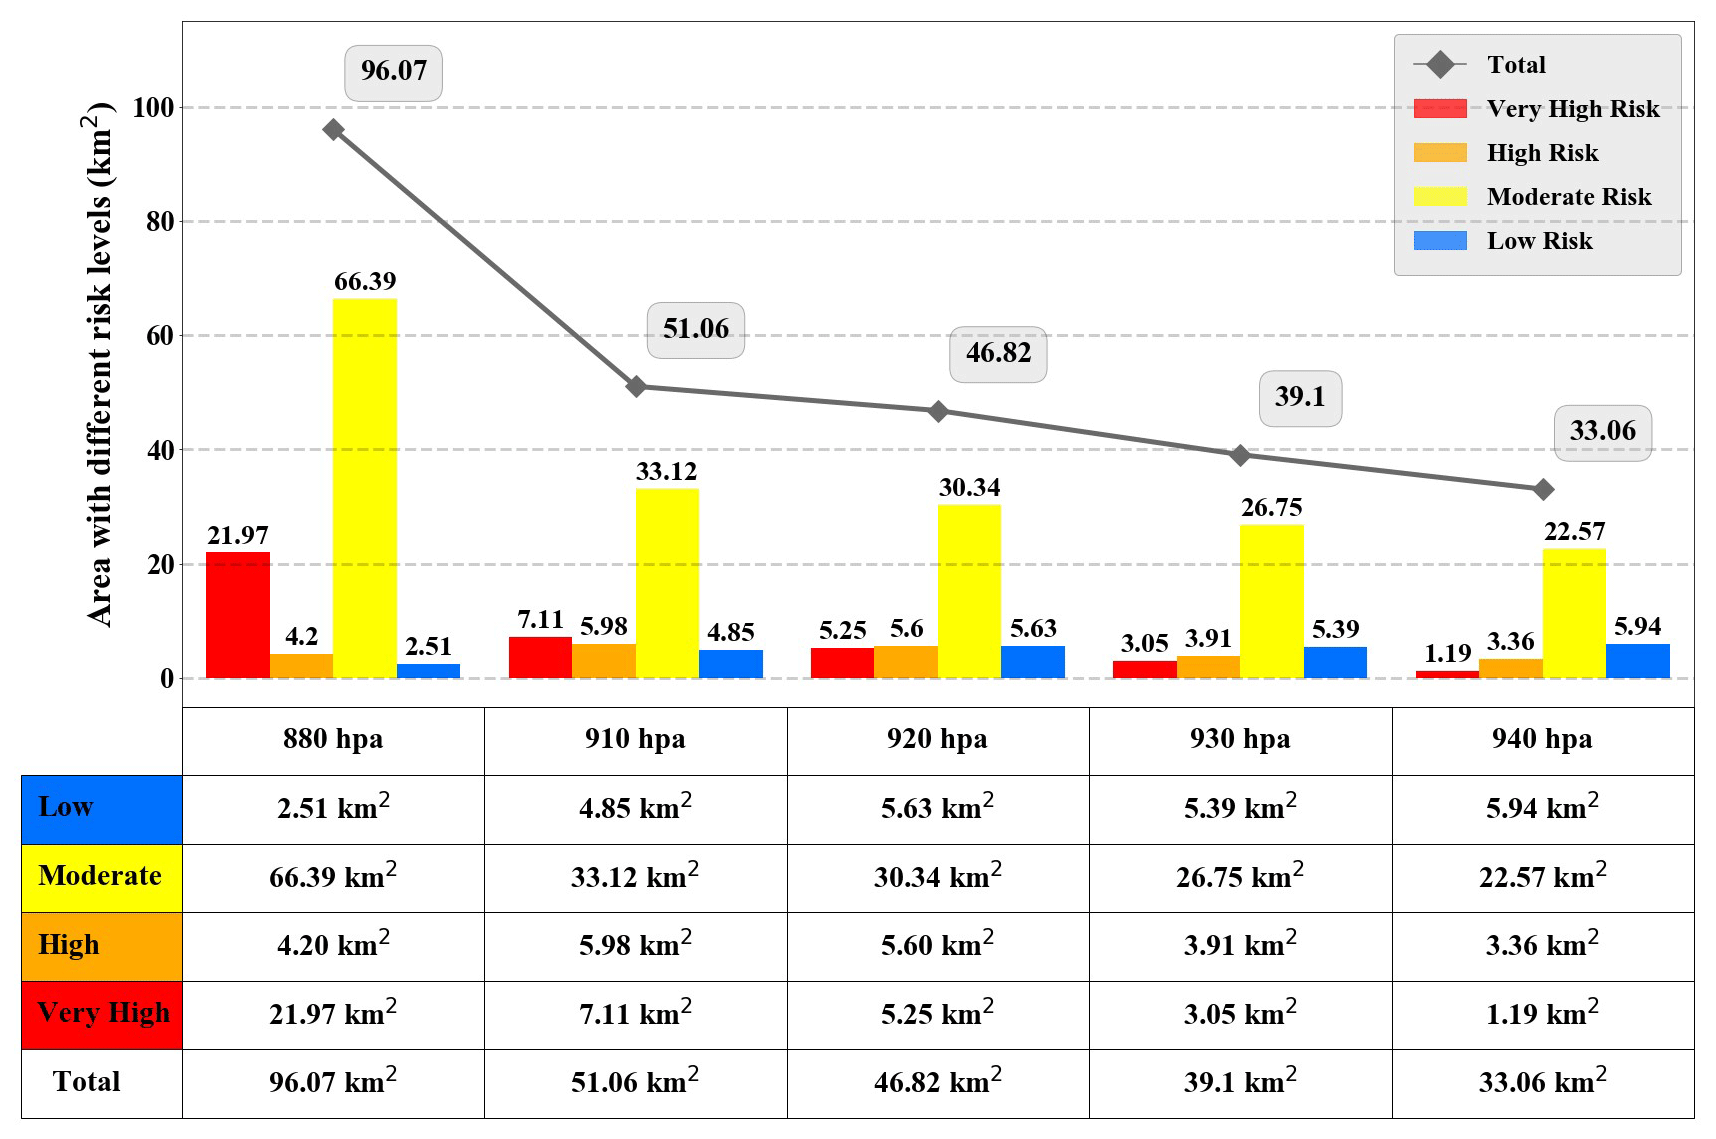
Figure 20The areas of different risk level zones for each of the designed typhoon scenarios (880, 910, 920, 930, 940 hPa).
The statistics data in Fig. 20 indicate the total area at a risk level and the land area labeled with a very high-level decrease with the increasing minimum central pressure of a typhoon. The regions at a moderate risk level take the largest portion of the total area at a risk level for each of the typhoon scenarios. For example, approximately 66.39 km2 area is exposed to the moderate risk as the minimum central pressure is 880 hPa, and an area of about 22.57 km2 would be at moderate risk when the minimum central pressure is 940 hPa.
Figure 19 shows that the high concentrations of petroleum industries and the high density of the population in the Daya Bay Petrochemical Zone (B) make its vulnerability very high. When the minimum central pressure is 880 hPa, the Daya Bay Petrochemical Zone (B) has a deep inundation status (level I). Thus, the risk level in this zone is very high (level I). As the minimum central pressure is 910 or 920 hPa, the risk levels over a wide area of the Daya Bay Petrochemical Zone (B) are high and moderate. However, the Daya Bay Petrochemical Zone (B) is largely free from risk due to the protection provided by the storm surge barriers along the coastline when the minimum central pressure is 930 or 940 hPa.
Moreover, the Huizhou Port (C) and the southeast of the Daya Bay Development Zone (D) are classified as very high-risk or high-risk regions because the regions occupied by transportation land or human settlements (Fig. 18) are combined with high or very high levels of hazard of storm surge (Fig. 14). In addition, the regions featuring very high or high risk levels are the area to the north of the White Sand Shore (A), the Renshan town (G), Pinghai town (H), and the Huangbu town (K). Without the protection from the barrier system, these regions mainly occupied by humans are at a moderate risk level even as the minimum central pressure is 940 hPa. Although the vulnerability level is high in the Gilong town (J) and the Tieyong town (N), there is no sign of the risk of storm surge due to their locations far from the coastline when the minimum central pressure is 910, 920, 930, or 940 hPa.
The total area of hazard and risk of storm surge under different typhoon intensities are shown in Fig. 21. It can be observed from Fig. 21 that although 83.4 % (227 km2) of the total inundated area is a very high-hazard zone with regards to storm surge as the minimum central pressure is the 880 hPa, only 8 % (21.97 km2) of the total inundated area belonged to the very high-risk zone with regards to storm surge, and 25 % (66.39 km2) of the entire inundated area falls into the moderate risk category due to its moderate or high vulnerability level. For other typhoon scenarios, many inundated areas are at a high hazard level for storm surge, but most of them change to moderate-risk zones, which indicates that the area at a high hazard level cannot represent that area at a high risk level.

Figure 21The total area of hazard and risk of storm surge for each of the designed typhoon scenarios (880, 910, 920, 930, and 940 hPa).
In this paper, the coupled model (ADCIRC–SWAN) and the Jelesnianski method were used for semiquantitative risk assessment of storm surge under different typhoon intensity. The typhoon intensity scenarios were designed to the minimum central pressure of 880, 910, 920, 930, and 940 hPa (corresponding to 1000-, 100-, 50-, 20-, and 10-year return period). The coastal dikes and levees, which are supposed to not be damaged during the modeling period, were included in the ADCIRC–SWAN model and Jelesnianski method to simulate the storm surge. The possible inundation extents and depths of storm surge under five different typhoon intensities were computed, and the risk assessments were performed based on coastal storm surge maps using the ArcGIS 10.5 software.
The results indicate that the whole Daya Bay Petrochemical Zone and most of the coastal area of Huizhou are not at risk to the storm surge generated by low-recurrence-interval typhoons (20-year and 10-year return period) due to the protection provided by coastal dikes and levees. The maximum inundation extents and depths increase with increasing return periods. Significant losses and damages might occur in some parts of the Daya Bay Petrochemical Zone and many coastal communities for the return periods of 50- and 100-year scenarios. Moreover, the regions extending from 4 to 6 km offshore, particularly in the Daya Bay Petrochemical Zone, are at a high or very high level of risk of a 1000-year-return-period typhoon-induced storm surge.
The study provides a comprehensive assessment and zonation of hazard, vulnerability, and risk of storm surge to reduce disaster losses, which are caused by designed typhoon scenarios (1000-, 100-, 50-, 20-, and 10-year return period) in the coastal area of Huizhou. The risk maps and escape route maps, which can be downloaded from the dataset (Wang, 2020b), have been used in practice in Huizhou city, China. These maps can help decision-makers in Huizhou recognize the densely populated communities at risk levels and allow them to develop evacuation strategies to minimize civilian casualties. Moreover, the study analyzes the storm surge risk especially for the Daya Bay Petrochemical Zone, which is occupied by the high concentrations of petroleum industries. This risk analysis provides a better understanding of the risk regions in the Daya Bay Petrochemical Zone, which can both reduce economic losses and prevent environmental damage caused by the massive chemical pollutants and oil spills from coastal petroleum industries that are affected by storm surge. Finally, the proposed methodology and procedure can be applied to any coastal city in China for conducting risk assessments of storm surge.
In further research, the risk assessment should be undertaken in the following aspects:
-
The evaluation method based on the different land cover classes is simple. The stage–damage function is regarded as one of the most effective solutions to storm surge damage assessment. Therefore, the vulnerability curve rather than the land cover types should be utilized to conduct quantitative vulnerability assessment in the study area.
-
Because of increasing typhoon intensity and rising sea levels caused by climate change in the future, the increased storm surge will be taken into consideration when assessing future risk and making hazard mitigation plans in the study area.
-
When the maximum inundated depths and extents are calculated under different-intensity typhoons, the levee breach along the coastline will be included in the modeling process to improve simulation precision.
The typhoon record was obtained from the China Meteorological Administration. The dataset of Storm Surge Barriers was acquired from the Huizhou Oceanic Administration. The dataset of Water Level Records was obtained from the Huizhou Oceanic Administration. Other datasets (DEM, Land Cover Types, District Boundaries) were available from the Huizhou Land and Resources Bureau. The datasets used in the study can be obtained from https://doi.org/10.6084/m9.figshare.12459794.v1 (Wang, 2020b).
The authors declare that they have no conflict of interest.
LM designed the concept. ZY and SW collected the data in this study. LW provided some detailed skills and approaches in the experiment. SW and JG completed the coding and carried out experiments. LM and SW analyzed experimental results. SW, LM, and EZ wrote the manuscript.
Thanks to the South China Sea Marine Prediction Center, whose researchers helped to evaluate the performance of the coupled model (ADCIRC–SWAN) by comparing the predicted water levels and the observed water levels in the study area and simulating the possible inundation depths and extents of typhoon surge with the coupled model for the designed typhoon scenarios.
This work was supported by the Key-Area Research and Development Program of Guangdong Province (grant no. 2020B1111020005), the National Natural Science Foundation of China (grant no. U2006210), and the Shenzhen Fundamental Research Program (grant nos. JCYJ20170810103011913 and JCYJ20200109110220482).
This paper was edited by Amy Donovan and reviewed by two anonymous referees.
Atkinson, G. D. and Holliday, C. R.: Tropical cyclone minimum sea level pressure/maximum sustained wind relationship for the western North Pacific, Mon. Weather Rev., 105, 421–427, https://doi.org/10.1175/1520-0493(1977)105<0421:TCMSLP>2.0.CO;2, 1977.
Booij, N. R. R. C., Ris, R. C., and Holthuijsen, L. H.: A third-generation wave model for coastal regions: 1. Model description and validation, J. Geophys. Res.-Oceans, 104, 7649–7666, https://doi.org/10.1029/98JC02622, 1999.
Cheung, K. F., Tang, L., Donnelly, J. P., Scileppi, E. M., Liu, K. B., Mao, X. Z., Houston, S. H., and Murnane, R. J.: Numerical modeling and field evidence of coastal overwash in southern New England from Hurricane Bob and implications for paleotempestology, J. Geophys. Res.-Earth, 112, F03024, https://doi.org/10.1029/2006JF000612, 2007.
China Marine disaster bulletin: Historical Marine disasters in China, available at: http://www.mnr.gov.cn/sj/sjfw/hy/gbgg/zghyzhgb/, last access: 12 December 2020.
Crichton, D.: The risk triangle, Nat. Disast. Manage., 102, 102–103, 1999.
de Moel, H., van Vliet, M., and Aerts, J. C.: Evaluating the effect of flood damage-reducing measures: a case study of the unembanked area of Rotterdam, the Netherlands, Reg. Environ. Change, 14, 895–908, https://doi.org/10.1007/s10113-013-0420-z, 2014.
Dietrich, J. C., Zijlema, M., Westerink, J. J., Holthuijsen, L. H., Dawson, C., Luettich Jr., R. A., Jensen, R. E., Smith, J. M., Stelling, G. S., and Stone, G. W.: Modeling hurricane waves and storm surge using integrally-coupled, scalable computations, Coast. Eng., 58, 45–65, https://doi.org/10.1016/j.coastaleng.2010.08.001, 2011.
Dietrich, J. C., Tanaka, S., Westerink, J. J., Dawson, C. N., Luettich, R. A., Zijlema, M., Holthuijsen, L. H., Smith, J. M., Westerink, L. G., and Westerink, H. J.: Performance of the unstructured-mesh, SWAN+ ADCIRC model in computing hurricane waves and surge, J. Scient. Comput., 52, 468–497, https://doi.org/10.1007/s10915-011-9555-6, 2012.
Fang, Y., Yin, J., and Wu, B.: Flooding risk assessment of coastal tourist attractions affected by sea level rise and storm surge: a case study in Zhejiang Province, China, Nat. Hazards, 84, 611–624, https://doi.org/10.1007/s11069-016-2444-4, 2016.
Huizhou: Major Social and Economic Indicators, available at: https://www.bayarea.gov.hk/en/about/huizhou.html (last access: 12 December 2020), 2020a.
Huizhou: Guangdong province, available at: http://govt.chinadaily.com.cn/s/201907/08/WS5d145d96498e5314096b63f5/huizhou-guangdong-province.html (last access: 12 December 2020), 2020b.
Hurricane Katrina: August 2005, available at: https://www.weather.gov/mob/katrina, last access: 12 December 2020.
Japan: Typhoon: 2019/10/12, available at: https://www.adrc.asia/view_disaster_en.php?NationCode=&Lang=en&Key=2357, last access: 12 December 2020.
Jelesnianski, C. P. and Taylor, A. D.: NOAA technical memorandum ERL WMPO-3, NOAA, Washington, D.C., 1973.
Kaźmierczak, A. and Cavan, G.: Surface water flooding risk to urban communities: Analysis of vulnerability, hazard and exposure, Landsc. Urban Plan., 103, 185–197, https://doi.org/10.1016/j.landurbplan.2011.07.008, 2011.
Kerr, P. C., Donahue, A. S., Westerink, J. J., Luettich Jr., R. A., Zheng, L. Y., Weisberg, R. H., Huang, Y., Wang, H. V., Teng, Y., Forrest, D. R., and Roland, A.: US IOOS coastal and ocean modeling testbed: Inter-model evaluation of tides, waves, and hurricane surge in the Gulf of Mexico, J. Geophys. Res.-Oceans, 118, 5129–5172, https://doi.org/10.1002/jgrc.20376, 2013.
Koks, E. E., Jongman, B., Husby, T. G., and Botzen, W. J.: Combining hazard, exposure and social vulnerability to provide lessons for flood management, Environ. Sci. Policy, 47, 42–52, https://doi.org/10.1016/j.envsci.2014.10.013, 2015.
Li, A., Guan, S., Mo, D., Hou, Y., Hong, X., and Liu, Z.: Modeling wave effects on storm surge from different typhoon intensities and sizes in the South China Sea, Estuar. Coast. Shelf Sci., 235, 106551, https://doi.org/10.1016/j.ecss.2019.106551, 2020.
Lichter, M., Vafeidis, A. T., Nicholls, R. J., and Kaiser, G.: Exploring data-related uncertainties in analyses of land area and population in the “Low-Elevation Coastal Zone” (LECZ), J. Coast. Res., 27, 757–768, https://doi.org/10.2112/JCOASTRES-D-10-00072.1, 2011.
Luettich, R. A., Westerink, J. J., and Scheffner, N. W.: ADCIRC: an advanced three-dimensional circulation model for shelves, coasts, and estuaries, Report 1, Theory and methodology of ADCIRC-2DD1 and ADCIRC-3DL, Report, Coastal Engineering Research Center, US Army Corps of Engineers Waterways Experiment Station, USA, 143 pp., 1992.
McGranahan, G., Balk, D., and Anderson, B.: The rising tide: assessing the risks of climate change and human settlements in low elevation coastal zones, Environ. Urbaniz., 19, 17–37, https://doi.org/10.1177/0956247807076960, 2007.
McGrath, H., Stefanakis, E., and Nastev, M.: Sensitivity analysis of flood damage estimates: A case study in Fredericton, New Brunswick, Int. J. Disast. Risk Reduct. 14, 379–387, https://doi.org/10.1016/j.ijdrr.2015.09.003, 2015.
Middelmann-Fernandes, M. H.: Flood damage estimation beyond stage–damage functions: an Australian example, J. Flood Risk Manage., 3, 88–96, https://doi.org/10.1111/j.1753-318X.2009.01058.x, 2010.
Orlić, M., Belušić, D., Janeković, I., and Pasarić, M.: Fresh evidence relating the great Adriatic surge of 21 June 1978 to mesoscale atmospheric forcing, J. Geophys. Res.-Oceans, 115, C06011, https://doi.org/10.1029/2009JC005777, 2010.
Seto, K. C., Fragkias, M., Güneralp, B., and Reilly, M. K.: A meta-analysis of global urban land expansion, PloS One, 6, e23777, https://doi.org/10.1371/journal.pone.0023777, 2011.
Technical directives for risk assessment and zoning of marine disaster: Part 1: Strom surge, available at: https://www.renrendoc.com/p-82139795.html, last access: 12 December 2020.
Vickery, P. J., Skerlj, P. F., and Twisdale, L. A.: Simulation of hurricane risk in the US using empirical track model, J. Struct. Eng., 126, 1222–1237, https://doi.org/10.1061/(ASCE)0733-9445(2000)126:10(1222), 2000.
Wang, S.: escape routine, figshare, https://doi.org/10.6084/m9.figshare.12647105.v1, 2020a.
Wang, S.: nhess-datasets-2020-130, figshare, https://doi.org/10.6084/m9.figshare.12459794.v1, 2020b.
Westerink, J. J., Luettich, R. A., and Blain, C. A.: ADCIRC: an advanced three-dimensional circulation model for shelves, coasts, and estuaries, Report 2, User's manual for ADCIRC-2DDI, Report, Coastal Engineering Research Center, US Army Corps of Engineers Waterways Experiment Station, USA, 133 pp., 1994.
Ying, M., Zhang, W., Yu, H., Lu, X., Feng, J., Fan, Y., Zhu, Y., and Chen, D.: An overview of the China Meteorological Administration tropical cyclone database, J. Atmos. Ocean. Tech., 31, 287–301, https://doi.org/10.1175/JTECH-D-12-00119.1, 2014.
Zhai, P., Pörtner, H. O., Roberts, D., Skea, J., Shukla, P. R., Pirani, A., Moufouma-Okia, W., Péan, C., Pidcock, R., and Connors, S.: Global Warming of 1.5 OC: An IPCC Special Report on the Impacts of Global Warming of 1.5 ∘C Above Pre-industrial Levels and Related Global Greenhouse Gas Emission Pathways, in the Context of Strengthening the Global Response to the Threat of Climate Change, Sustainable Development, and Efforts to Eradicate Poverty, Report, World Meteorological Organization, Geneva, 2018.
Zhang, Y., Li, T., Wang, H., and Guo, J.: Storm surge risk assessment for Yuhuan County in Taizhou City, Nat. Hazards, 84, 1–16, https://doi.org/10.1007/s11069-016-2328-7, 2016.