the Creative Commons Attribution 4.0 License.
the Creative Commons Attribution 4.0 License.
 | 08 Jan 2021
Drought propagation and its impact on groundwater hydrology of wetlands: a case study on the Doode Bemde nature reserve (Belgium)
Buruk Kitachew Wossenyeleh
Kaleb Asnake Worku
Boud Verbeiren
Marijke Huysmans
Drought can be described as a temporary decrease in water availability over a significant period that affects both surface and groundwater resources. Droughts propagate through the hydrological cycle and may impact vulnerable ecosystems. This paper investigates drought propagation in the hydrological cycle, focusing on assessing its impact on a groundwater-fed wetland ecosystem. Meteorological drought indices were used to analyze meteorological drought severity. Moreover, a method for assessing groundwater drought and its propagation in the aquifer was developed and applied. Groundwater drought was analyzed using the variable threshold method. Furthermore, meteorological drought and groundwater drought on recharge were compared to investigate drought propagation in the hydrological cycle. This research is carried out in the Doode Bemde wetland in central Belgium.
The results of this research show that droughts are attenuated in the groundwater system. The number and severity of drought events on groundwater discharge were smaller than for groundwater recharge. However, the onset of both drought events occurred at the same time, indicating a quick response of the groundwater system to hydrological stresses. In addition, drought propagation in the hydrological cycle indicated that not all meteorological droughts result in groundwater drought. Furthermore, this drought propagation effect was observed in the wetland.
- Article
(5043 KB) - Full-text XML
- BibTeX
- EndNote


Drought can be described as a temporary decrease in water availability over a significant period caused by deficient precipitation. Droughts propagate through the hydrological cycle and affect both surface and groundwater resources (Bloomfield and Marchant, 2013; Calow et al., 1997; Mishra and Singh, 2010; Wilhite, 2000).
If drought concerns groundwater, it is called groundwater drought. Groundwater drought can be defined as a temporary decrease in groundwater availability over a significant period of time (Peters and van Lanen, 2003). Groundwater drought results in decreased groundwater levels and discharges to surface water bodies (Peters, 2003). As groundwater systems are often slow to respond to drought, groundwater drought is often characterized by long recovery periods (Calow et al., 1997). Groundwater drought and its impacts have been less studied than other aspects of drought (Verbeiren et al., 2013; Wilhite and Glantz, 1985).
In the context of Belgium, Tricot et al. (2015) have shown that drought periods have not intensified during the last century. The meteorological drought periods were defined as the number of consecutive days without significant precipitation (less than 0.5 mm) for the 6 hottest months of the year. However, the authors suggest that their findings do not apply to all forms of drought. For instance, when investigating groundwater drought, precipitation deficits over longer periods (seasons to years) need to be investigated (Tricot et al., 2015). Furthermore, climate change projections for Belgium for the coming century predict drier summers causing drought conditions (Hoyaux et al., 2016; Tabari et al., 2015).
Groundwater droughts can have severe socioeconomic and environmental impacts (Verbeiren et al., 2013). Streams that are fed by groundwater may run dry if the groundwater system that is feeding them is affected by drought. These droughts may have significant implications on water supply, agriculture and ecology.
Ecosystems such as wetlands that are fed directly by groundwater discharge are also vulnerable to groundwater drought. Therefore, investigating groundwater drought is especially crucial in nature reserves such as groundwater-fed wetlands. Wetlands are primarily fed by groundwater and are an ecologically valuable part of the ecosystem. Droughts such as the one experienced in the summer of 2018 may have a significant impact on the groundwater discharge that is feeding such vulnerable systems (Ridder et al., 2020). A decrease in groundwater discharge to the wetland may result in a loss of biodiversity. Hence, a thorough investigation of how groundwater discharge is affected by drought is needed.
Groundwater drought can be assessed by investigating groundwater recharge, groundwater level and groundwater discharge with a high spatial and temporal resolution (Van Lanen and Peters, 2002). Although data on the groundwater levels (H) are typically available with a high temporal resolution, this is usually not the case for groundwater recharge (R) and groundwater discharge (Q) data. Therefore, numerical models are used to simulate these hydrological variables with high temporal and spatial resolution.
Numerical groundwater models are useful for simulating groundwater head and discharge if the necessary data are available and if proper boundary conditions are defined and implemented. Temporal and spatial variations of these variables can be obtained so that further analyses can be performed to identify drought periods. The effect of groundwater abstraction on the occurrence of groundwater drought can also be assessed by incorporating it into the models. Some previous studies (Peters, 2003; Peters et al., 2006) have used groundwater models to simulate groundwater level and discharge on a spatial and temporal scale and investigate groundwater drought using the constant threshold value method. In this study, variable threshold value methods and groundwater modeling were combined to investigate groundwater drought in the aquifer.
This paper aims to investigate drought propagation in the hydrological cycle by developing and applying a method for simulating meteorological drought, groundwater drought and drought propagation in the aquifer, particularly focusing on assessing its impact on a groundwater-fed wetland ecosystem. The method combines a water balance model and a groundwater flow model with a threshold method to determine groundwater drought and its effect on groundwater discharge.
The study area is located in Flanders in Belgium. It is found 8 km to the south of Leuven in the middle course of the Dijle River (Fig. 1). The area contains the nature reserve Doode Bemde. This nature reserve is an ecologically important wetland. The wetland is primarily fed by groundwater (Verbeiren et al., 2004).
In the study area, the Dijle River has cut through the surrounding hills to form a 1 km wide and 40 m deep valley (De Becker et al., 1999). The hills are situated in the western and eastern parts of the study area, while the valley extends from north to south occupying the middle part of the study area.
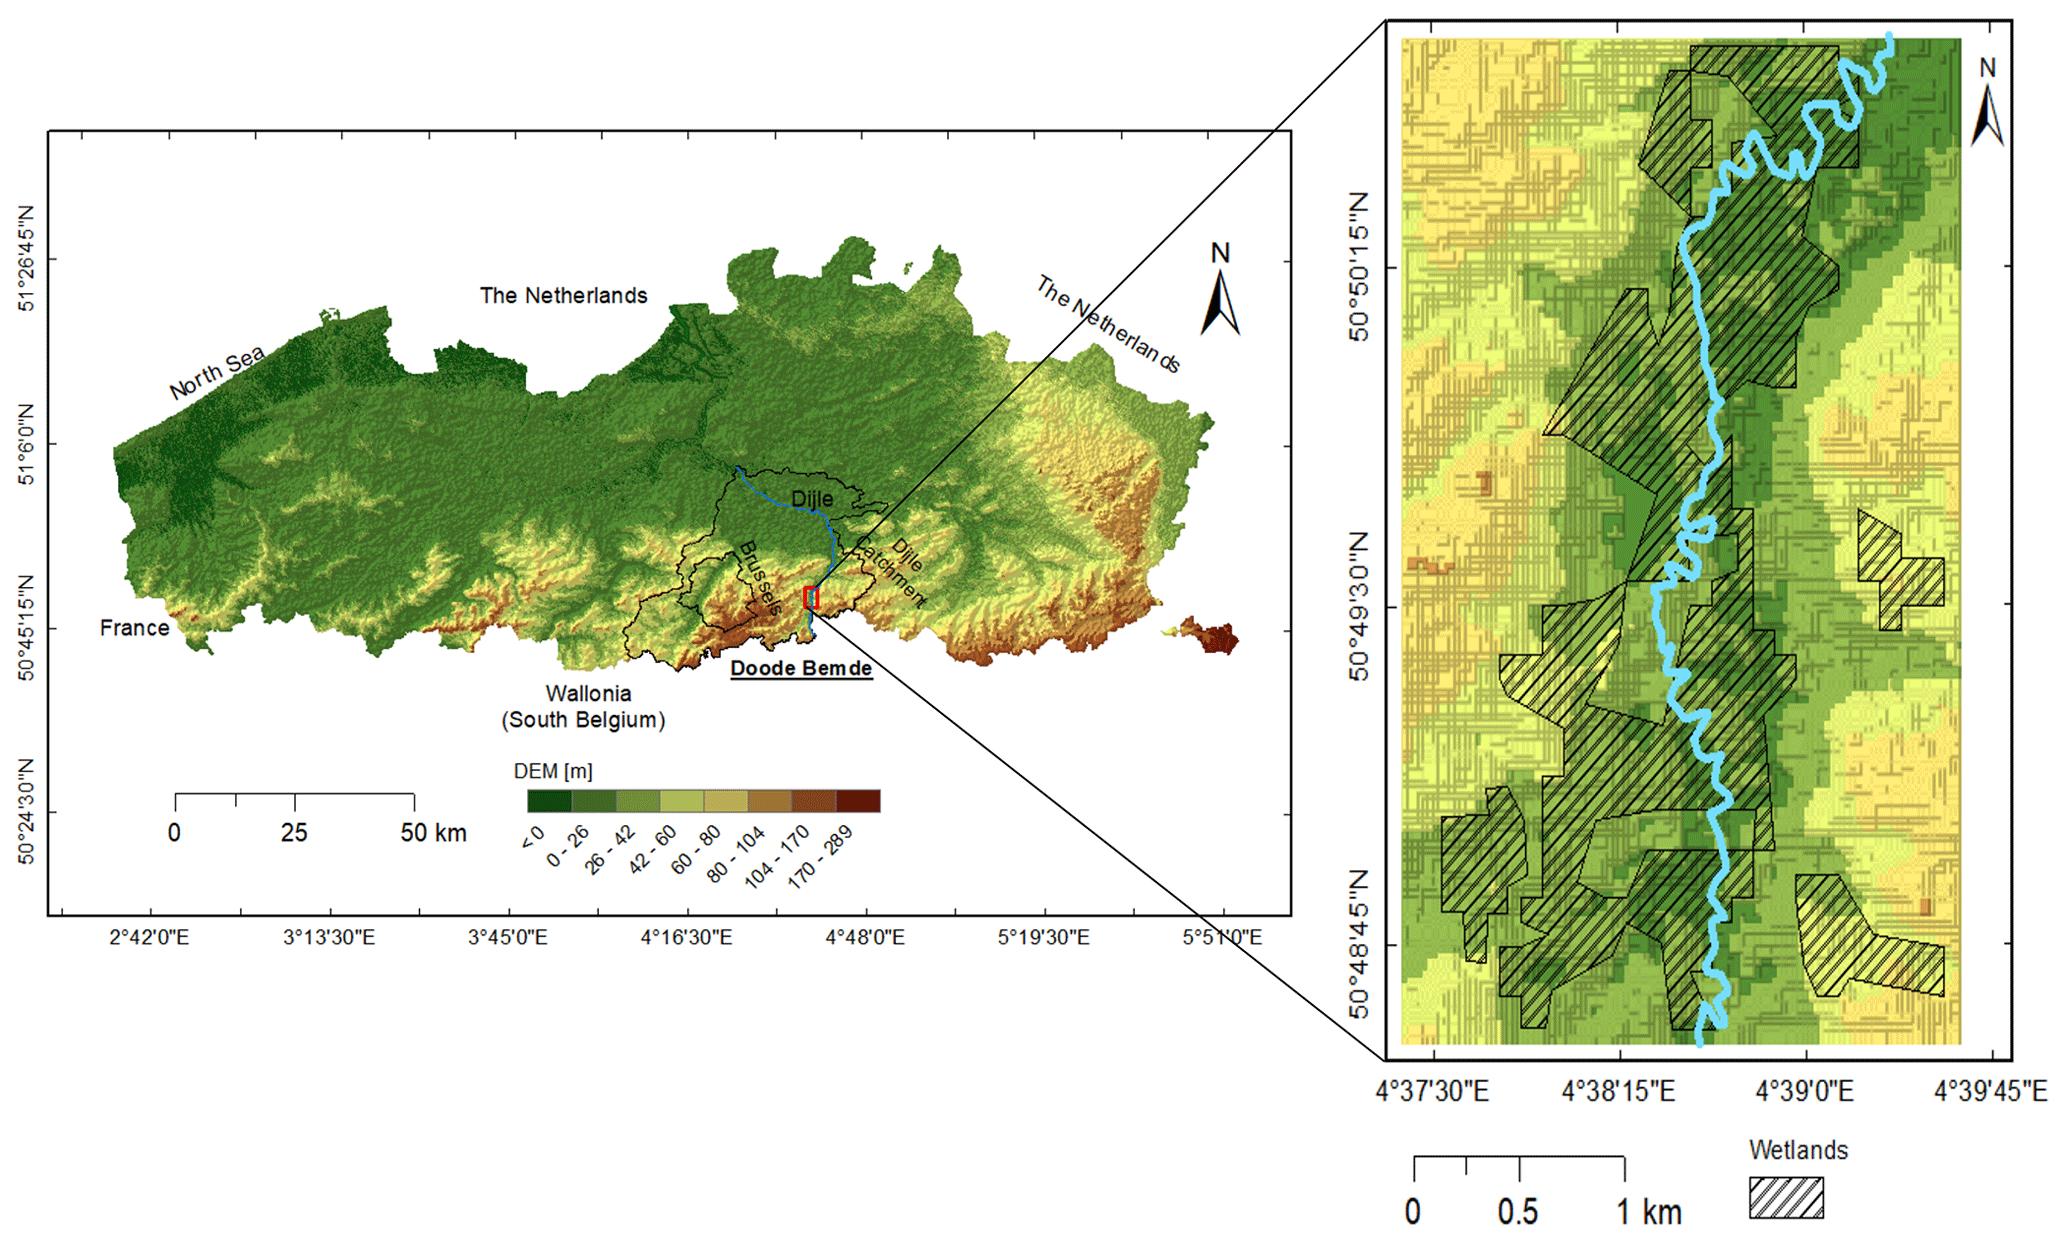
Figure 1Map of Flanders (Belgium) indicating the location of the Doode Bemde nature reserve (background: relief of Belgium – NGI).
The land cover in the area is predominantly grassland (showing a clear wet–dry gradient) with some reeds and forest, while a few ponds, houses and streets are also found in the western part of the study area (Verbeiren et al., 2004). Moreover, around 60 % of the soil in the study area is silty loam, and the area has a gentle slope vary between 0.02 to 11.50∘.
Hydrogeological studies on the Dijle catchment show that the top aquifers are unconfined with the thickness ranging from 0 to 50 m. The Dijle River has cut into the sandy tertiary formations of Lede (Ld), Brussel (Br) and the clayey formation of Kortrijk (Ko). During the Quaternary, a relatively thick layer of loam was deposited in the central valley. A successive deposition of Quaternary deposits near the river further shaped the valley as a result of repetitive inundations (Fig. 2).
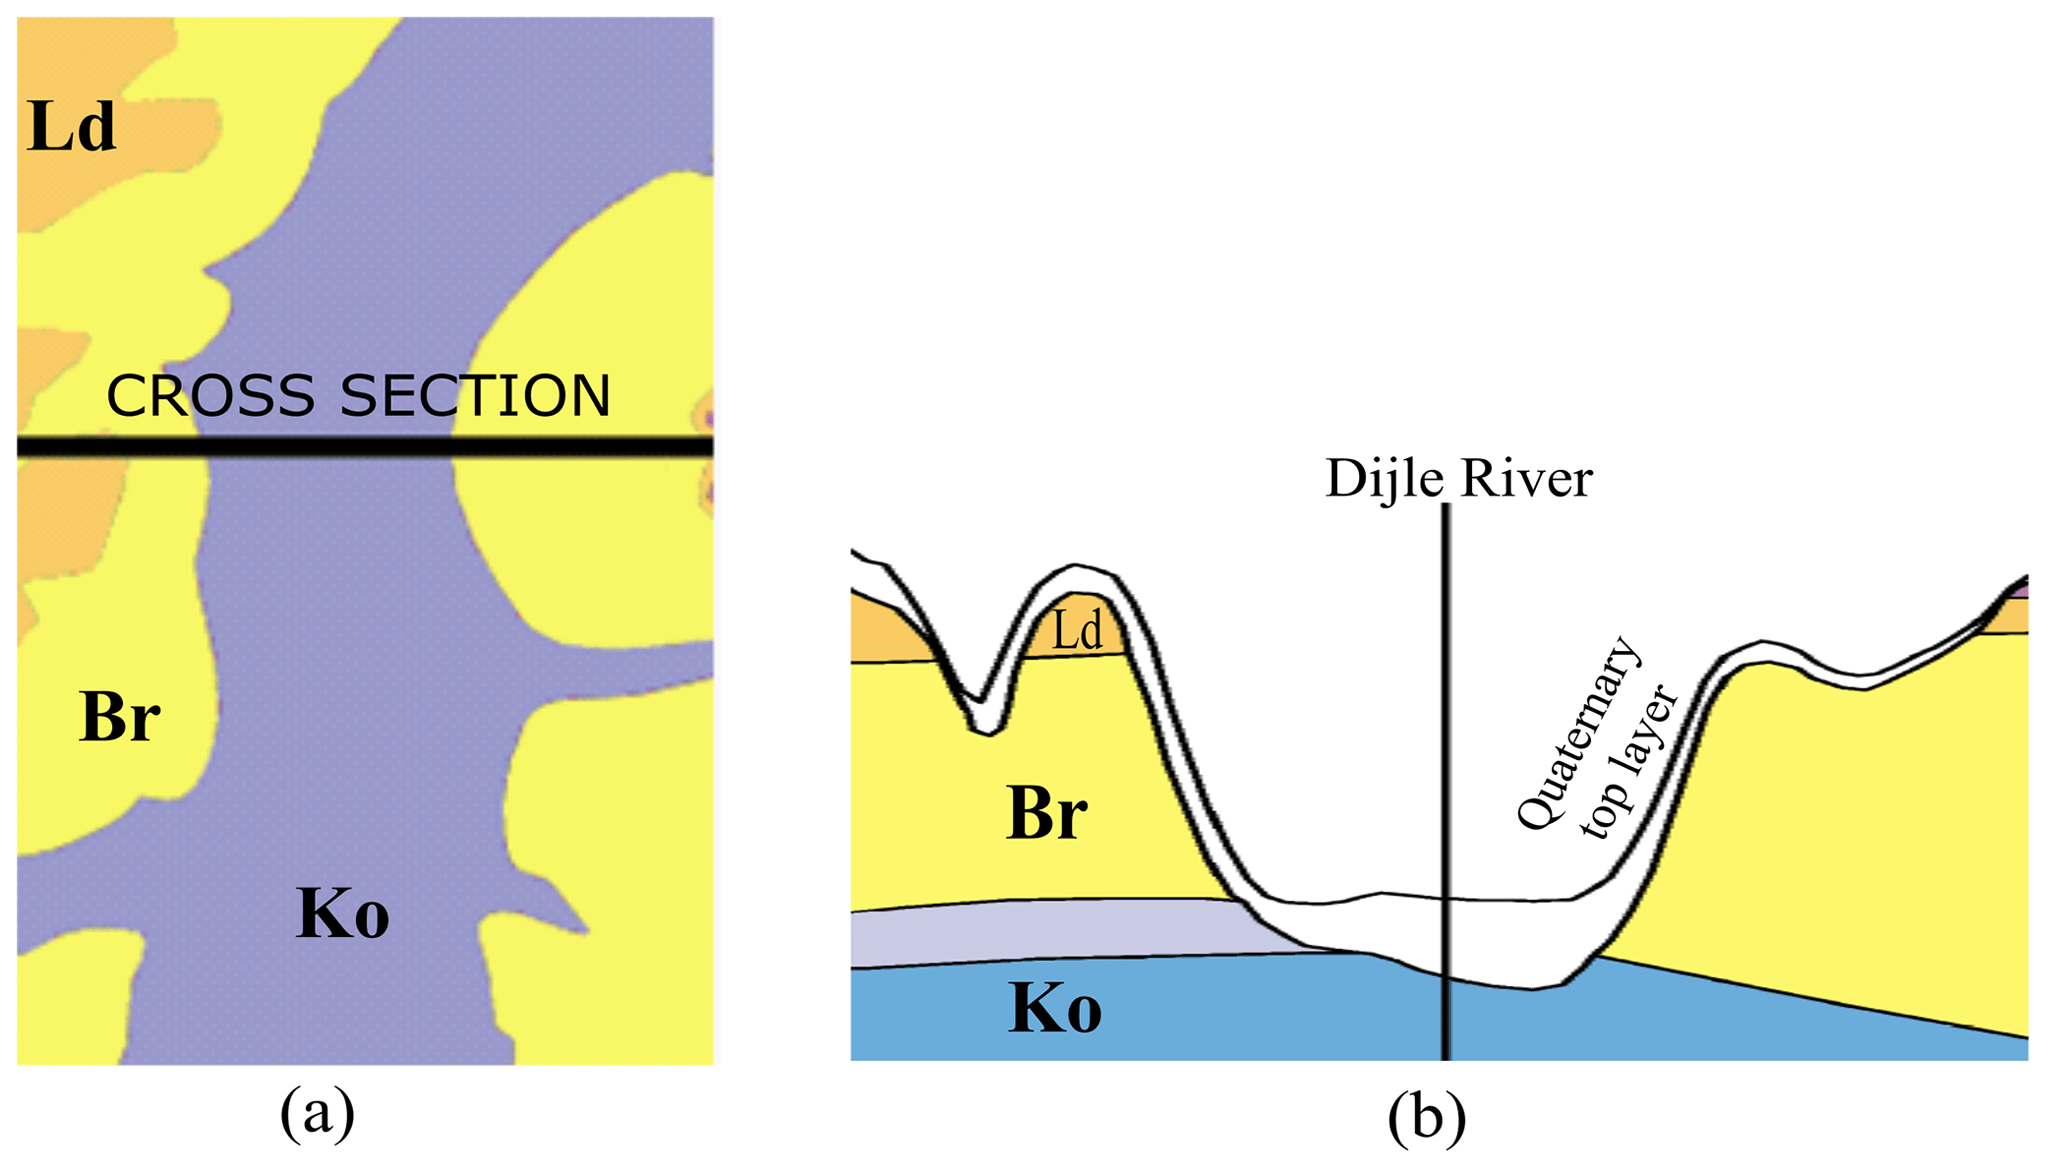
Figure 2(a) Hydrogeology of Dijle valley around Doode Bemde nature reserve showing the formations of Brussel (Ld & Br) and Kortrijk (Ko). (b) A cross section of the shallow hydrogeology (source: Databank Ondergrond Vlaanderen).
Spatially distributed groundwater recharge generated in the GroWaDRISK (drought-related vulnerability and risk assessment of groundwater resources in Belgium) project funded by Belgian Federal Science Policy Office (BELSPO) was used. This project was aiming for the development of a drought-related vulnerability and risk assessment strategy for sustainable management of groundwater resources under temperate conditions (Verbeiren et al., 2013). In this project, a monthly averaged spatially distributed groundwater recharge was estimated using the WetSpaSS model from 1980 to 2013. WetSpaSS is a physically based model for the estimation of spatially distributed surface runoff, actual evapotranspiration and groundwater recharge (Batelaan and De Smedt, 2001). This model accounts for spatially distributed land use, soil type, slope, elevation, monthly average groundwater depth and meteorological conditions as input (Abdollahi et al., 2017; Batelaan and De Smedt, 2007). However, the recharge obtained from WetSpaSS was the infiltration at the end of the root zone and did not take into account the delay of recharge in the unsaturated zone in between the root zone and the groundwater table. Therefore, a delay was implemented on the recharge extracted from the model to account for the time it takes for water to reach the groundwater table from the root zone (Wossenyeleh et al., 2020). The estimated groundwater recharge is larger than 10 mm/month in most of the study area and has a spatial average of 22 mm/month (Fig. 3). The zones indicated in red have very shallow groundwater levels (abundant water availability) and dense wetland vegetation, resulting in high evapotranspiration rates exceeding infiltration and leading to a “negative” net recharge.
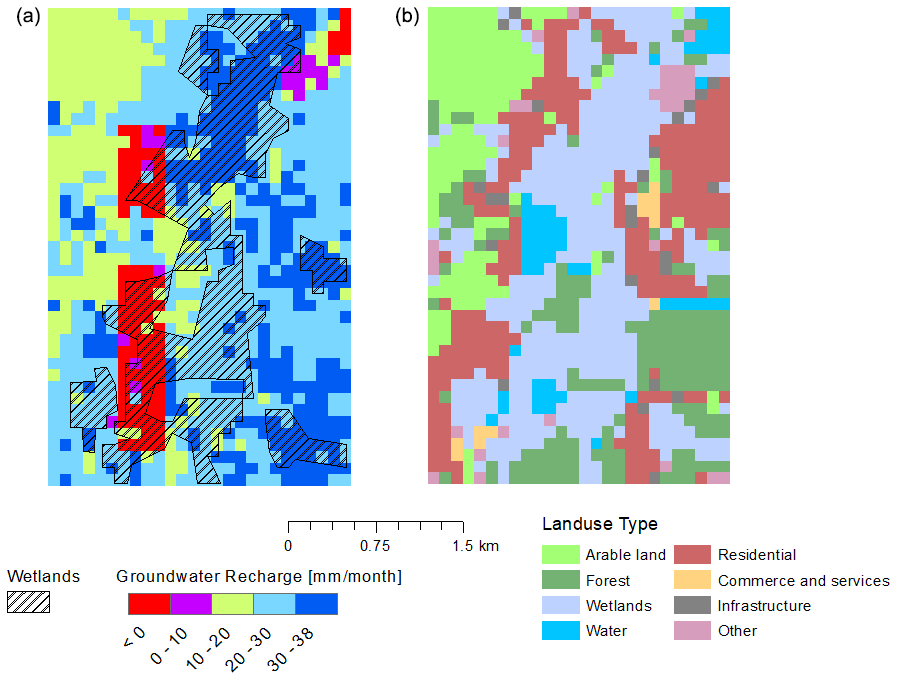
Figure 3Monthly averaged delayed groundwater recharge from 1980 to 2013 estimated using WetSpaSS (a) and land cover class (b).
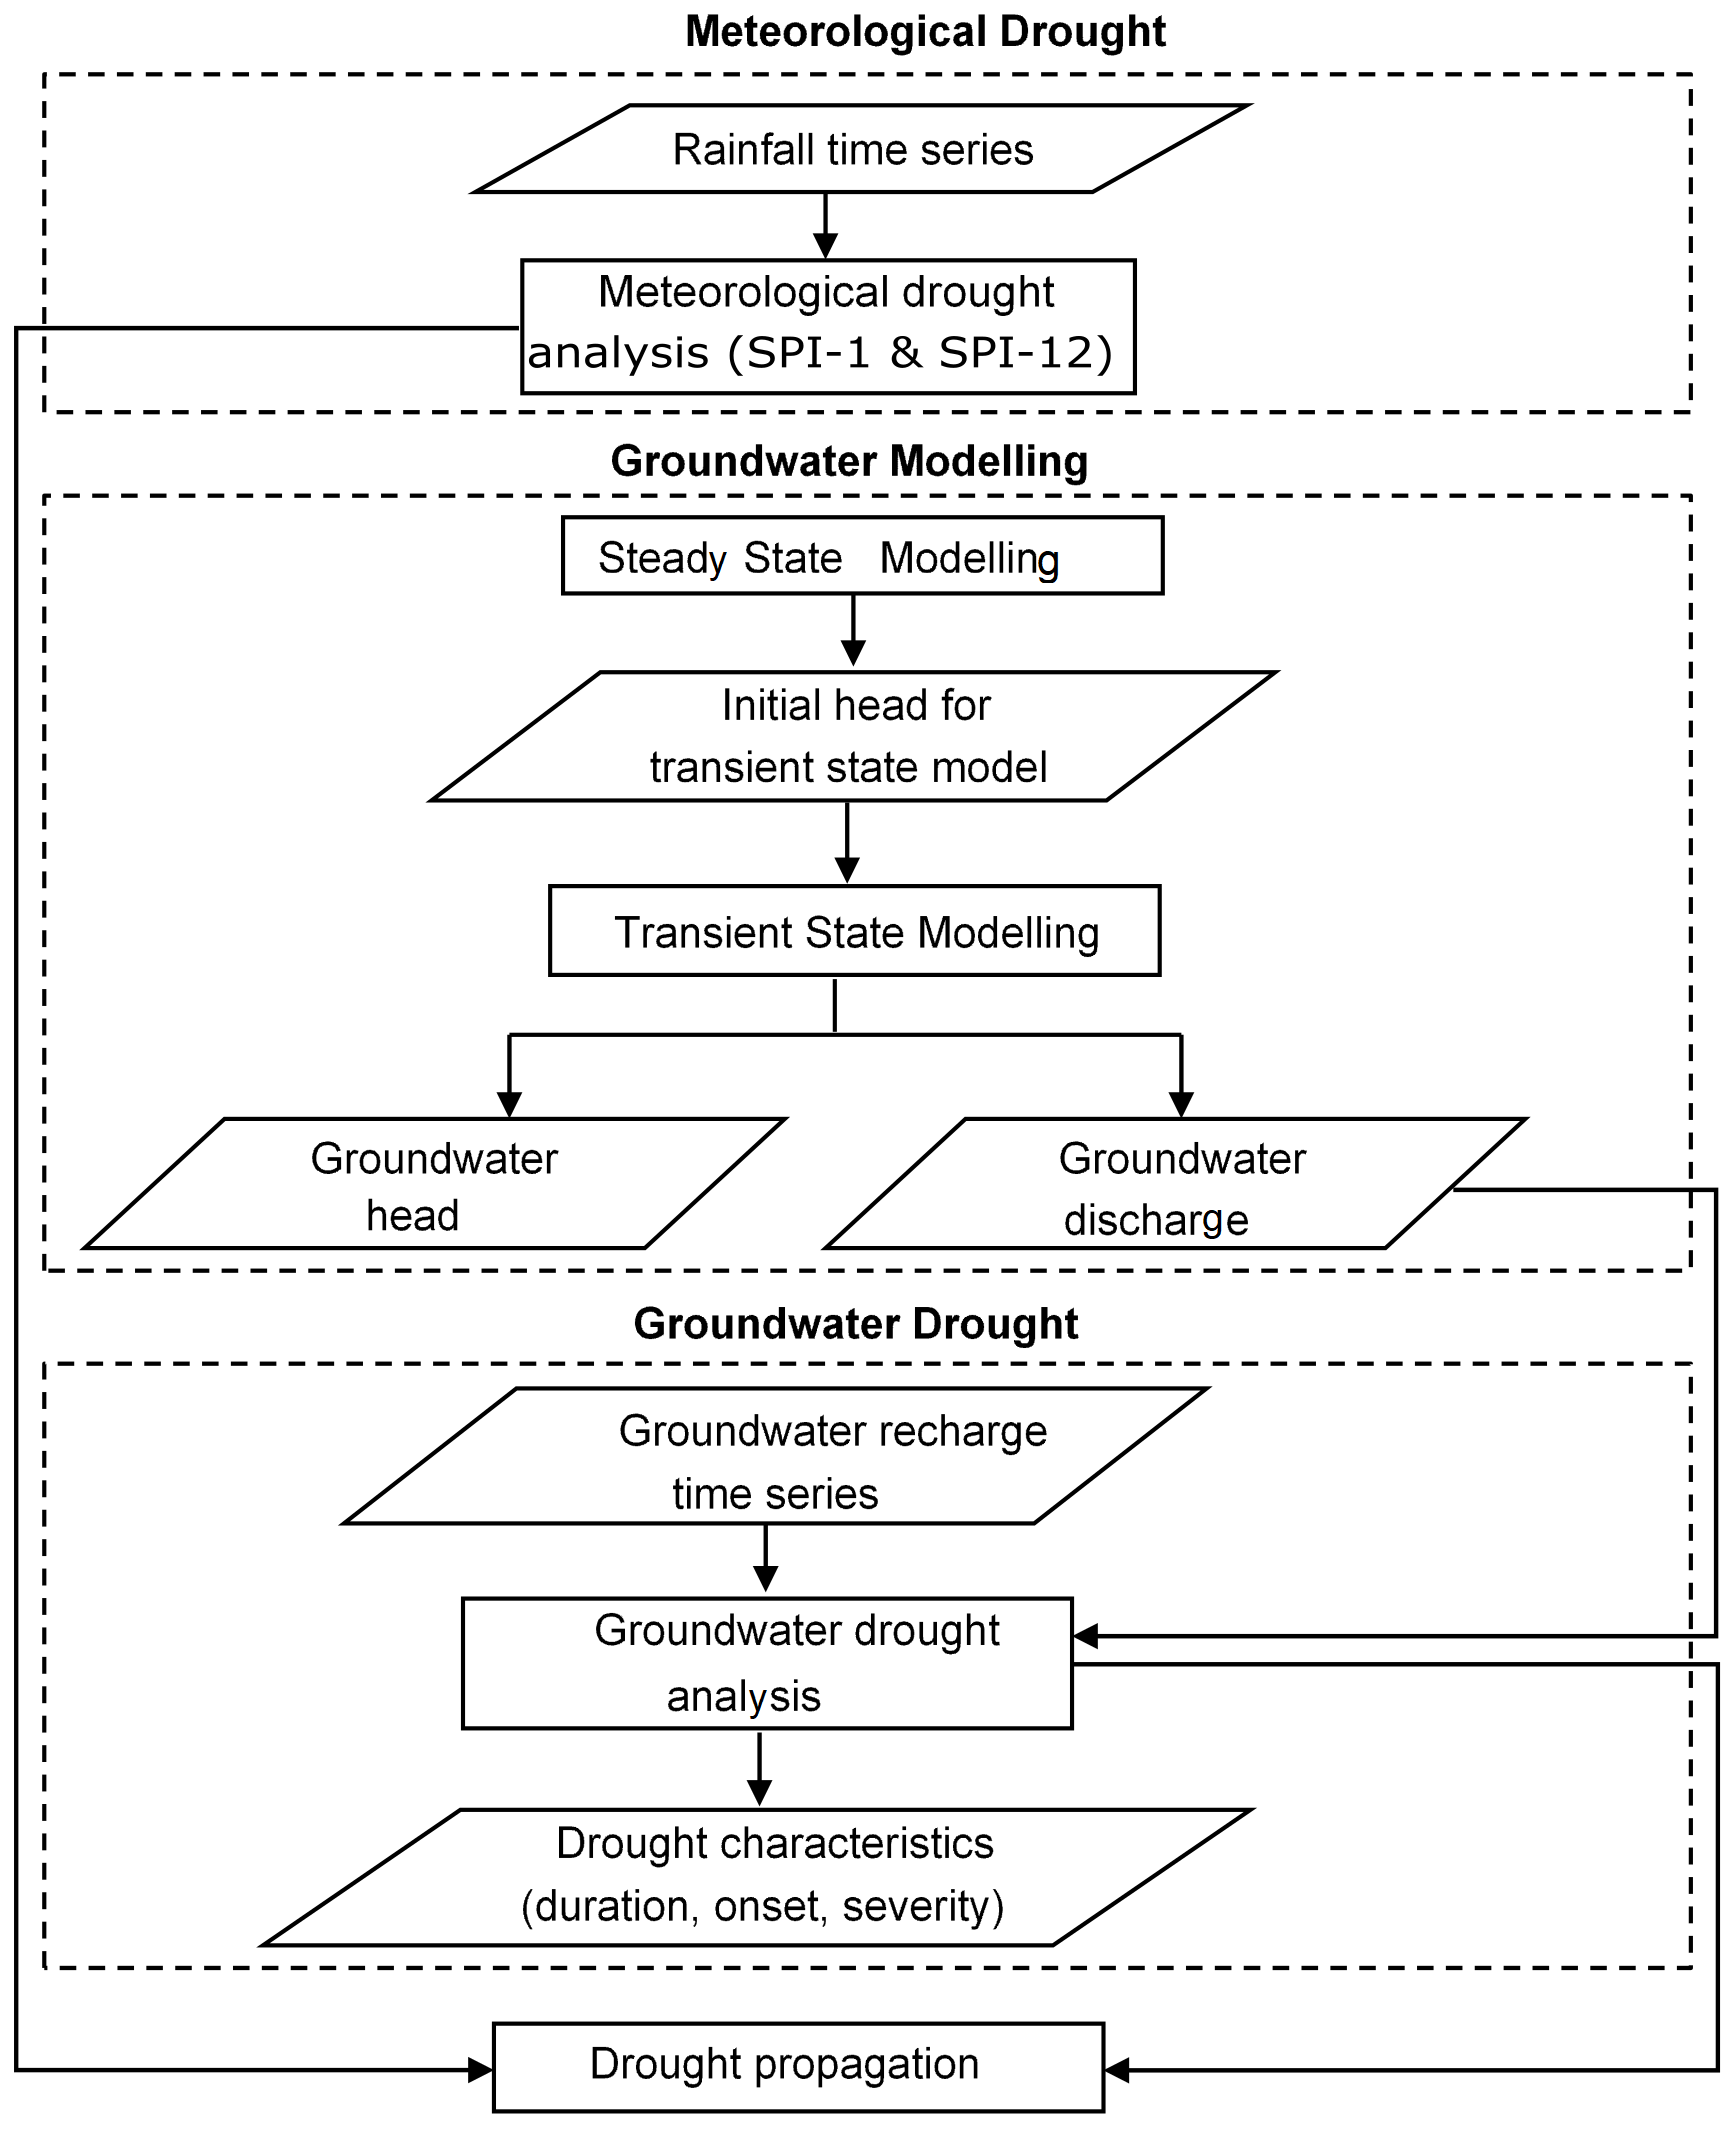
The study was divided into three parts: meteorological drought analysis, groundwater modeling and groundwater drought analysis (Fig. 4).
First, a meteorological drought analysis was conducted to investigate drought on the precipitation. Then, a transient state groundwater model was built to acquire a temporally and spatially distributed simulated groundwater head and discharge. Groundwater drought analysis was performed on simulated groundwater discharge and monthly groundwater recharge time series. Finally, a drought analysis was conducted to investigate drought propagation in the hydrological cycle. This was done by comparing groundwater drought to meteorological drought.
3.1 Meteorological drought analysis
The meteorological drought severity and spatial and temporal extent of the drought were determined using the standardized precipitation index (SPI; McKee et al., 1993). A total of 31 years of monthly averaged precipitation was obtained from the Royal Meteorological Institute (RMI) of Belgium at the Uccle station for the period 1981 to 2011 which was used to calculate SPI and identify meteorological drought events and severity.
As stated in McKee et al. (1993), SPI is based on the probability distribution of long-term rainfall on different timescales. In this study, the SPI values for 1 and 12 months were calculated to investigate the long-term meteorological drought severity. Moreover, this drought index was used to analyze the propagation of drought from meteorological to groundwater drought.
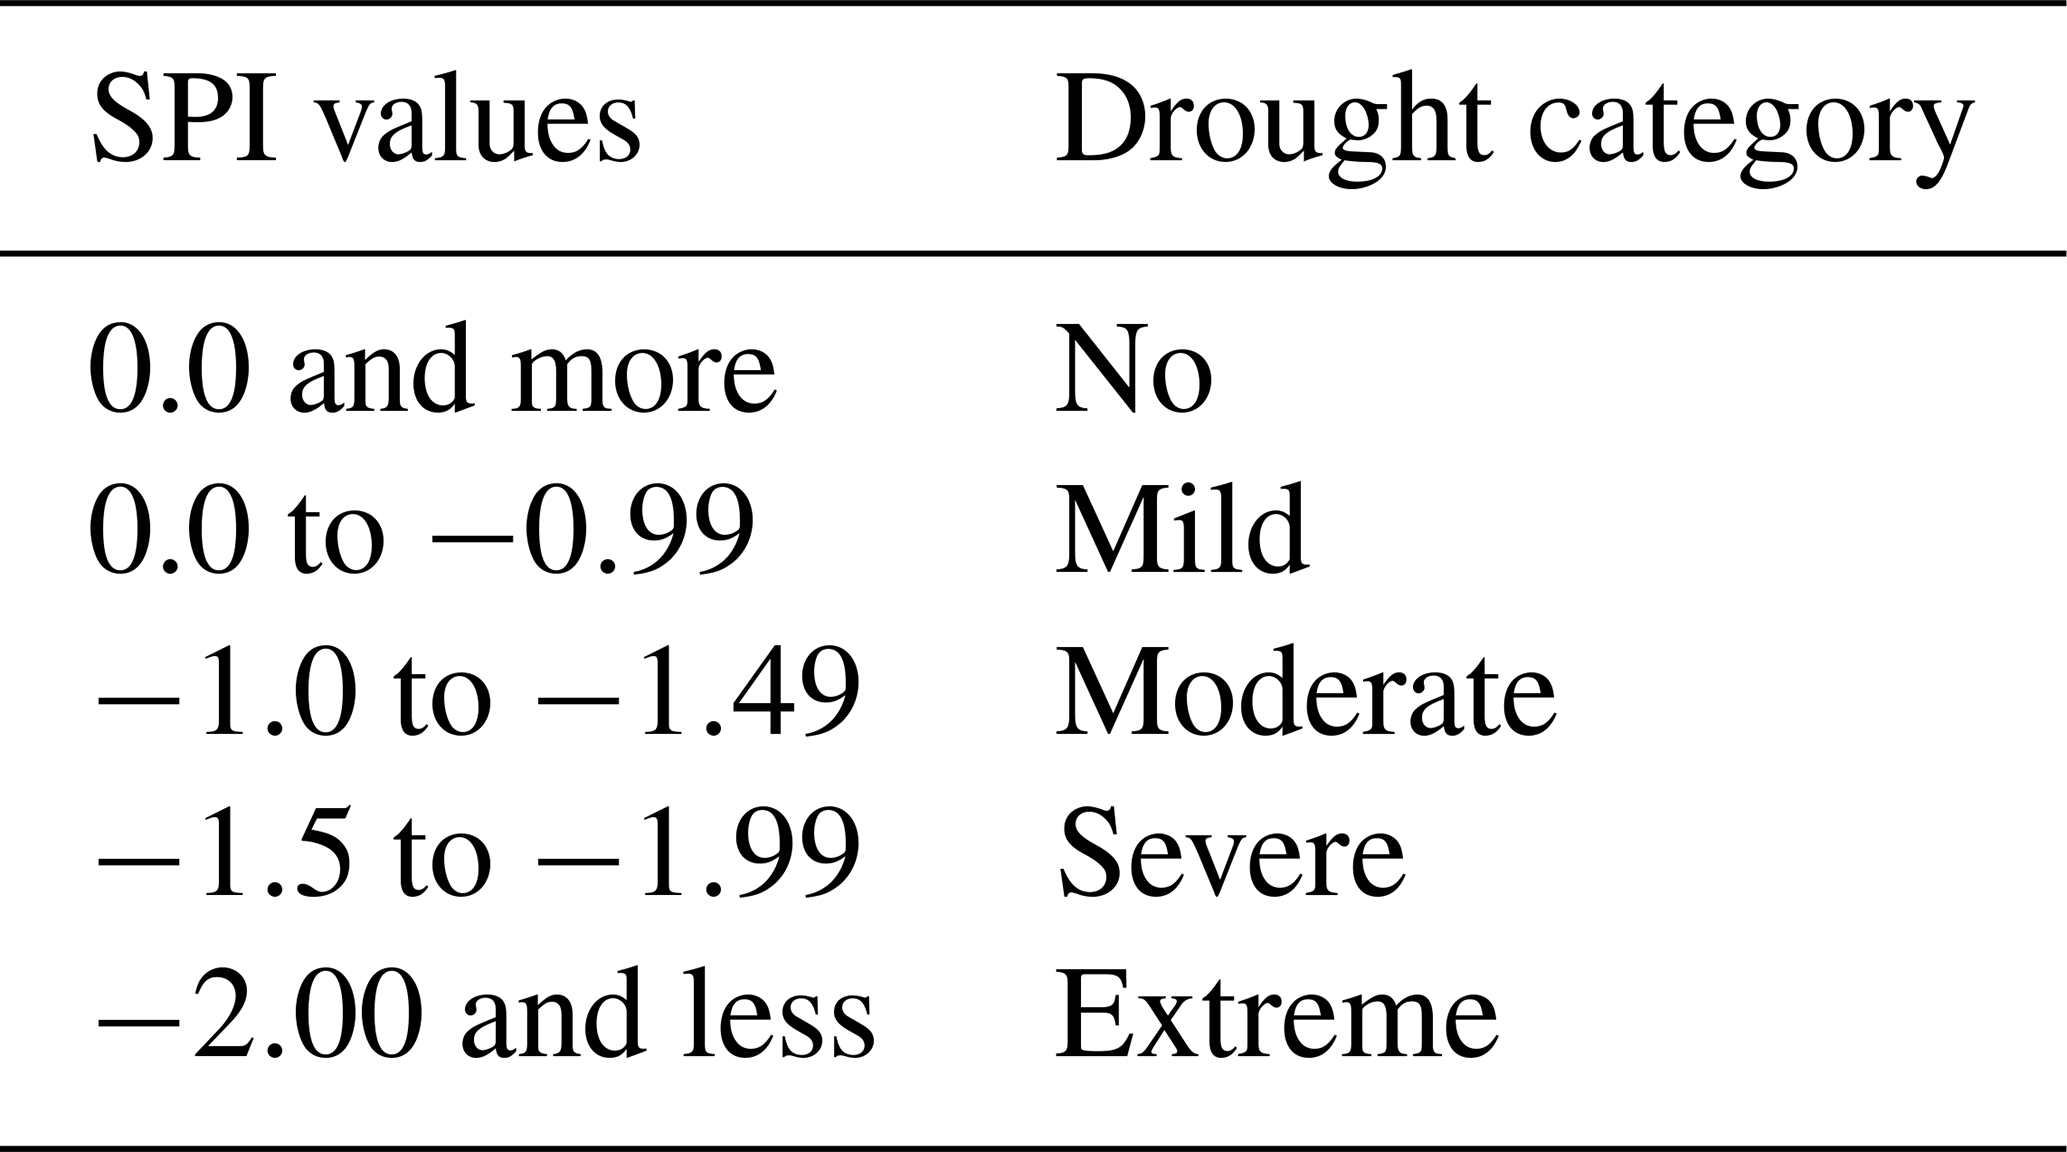
The long-term rainfall is fitted to a probability distribution, which is then transformed into a normal distribution so that the mean SPI for the location and desired period is zero (Edward and McKee, 1997). The gamma distribution is used to normalize the rainfall time series (Thom, 1958). Positive SPI values indicate greater than median precipitation, and negative values indicate less than median rainfall. Accordingly, a moderate drought event occurs when the index reaches an intensity of −1.0 or less (Table 1). The event ends when the SPI becomes positive.
Based on McKee et al. (1993), drought intensity categories based on the SPI value are defined as shown in Table 1.
Table 1Drought intensity categories based on SPI values (McKee et al., 1993).
3.2 Groundwater modeling
Groundwater modeling was performed using the groundwater modeling software MODFLOW-2000 (Harbaugh et al., 2000). A steady-state groundwater model for the study area was set up and run to obtain initial heads for the transient state model, which was built subsequently.
3.2.1 Conceptual model setup
The conceptual model shown in Fig. 5 was developed based on information about geology, hydrogeology and hydrology. The area of interest has an area of 10 km2 and includes most of the Doode Bemde nature reserve and the drinking extraction well operating in the study area.
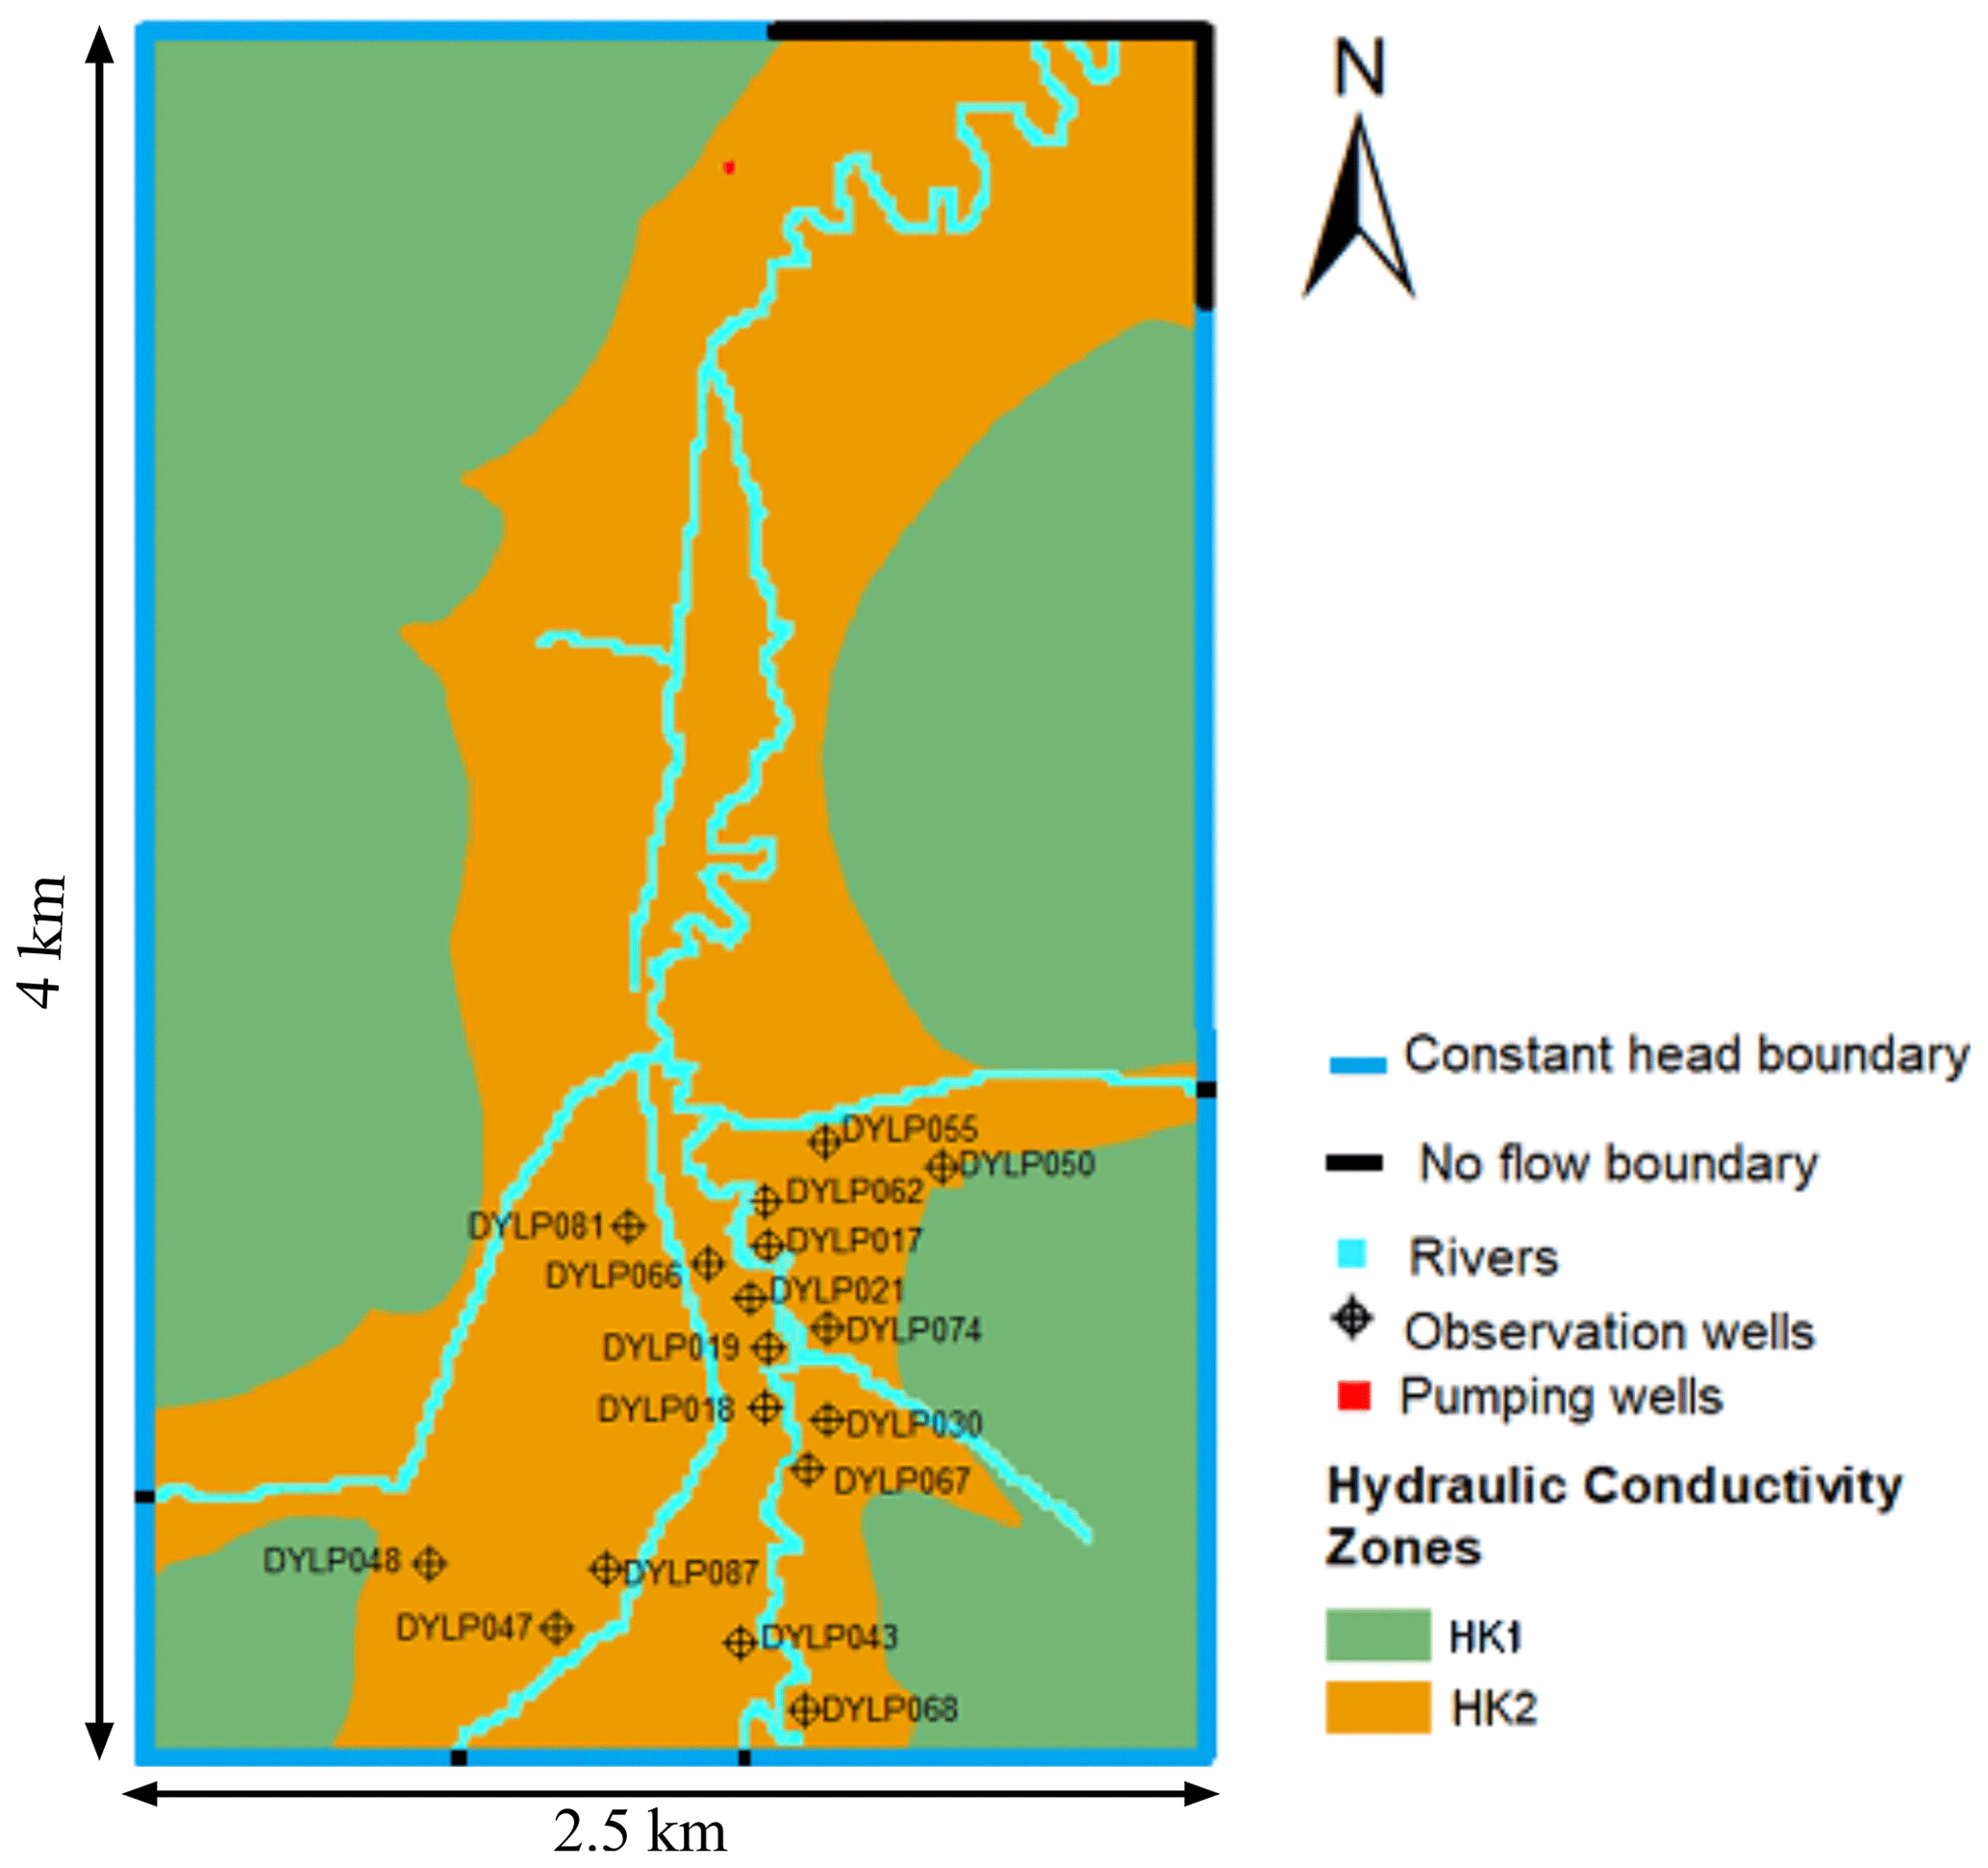
Figure 5Conceptual model setup showing the specified boundary conditions and hydraulic conductivity zones with two distinct hydraulic conductivities: HK1 (Brussels sand formation) and HK2 (Quaternary loam formation).
The clayey formation of Kortrijk shown in Fig. 2 was taken as the impervious model bottom due to its much lower hydraulic conductivity compared to the Brussels sand formation and Quaternary loam. Huysmans and Dassargues (2006) reported that the average vertical hydraulic conductivity of the Eocene Ypresian clays, which includes the Kortrijk formation, is m/d (with a standard deviation of m2/d2). The Brussels sand formation and Quaternary loam were represented as a one-layer phreatic aquifer system with two hydraulic conductivity zones representing the hilltops and the valley.
The Brussels sand formation's hydraulic conductivity ranges from 0.864 to 43.2 m/d based on the literature review conducted by Vandersteen et al. (2014). Possemiers et al. (2012) also found that the hydraulic conductivity of the Brussels sand is high and has a wide range of reported values between 2.16 and 63 m/d. Therefore, from these ranges, an initial value of hydraulic conductivity of 7 m/d for Brussels sand formation (HK1) was used in this study. Similarly, the hydraulic conductivity range for the Quaternary formation was found to be 1 to 10 m/d (Vandersteen et al., 2014). An initial hydraulic conductivity of 1 m/d was adopted. These initial values of hydraulic conductivities are optimized during the calibration of the model.
Due to scarcely observed groundwater levels in the vicinity of the study area and no clear natural boundaries (Batelaan et al., 2003), a constant head boundary condition in which the specified heads were extracted from a regional groundwater model for the Bruland-Krijt groundwater system (VMM, 2008) was implemented for most of the boundary. Moreover, from this regional groundwater model, the groundwater flow direction is perpendicular to the places where a river enters or exits the study area and where the valley exits the study area. Therefore, no flow boundaries were used for every cell in these places.
For this study, the average river stage and river bottom elevation were interpolated from measurement data obtained at a few locations within the study area (Flemish Water Authorities, 2019). According to Peeters (2010), most riverbed sediments in the study area consist of Pleistocene sands and gravels. Hence, a high riverbed conductance of 20 m2/d was assumed. Moreover, for every cell that was not modeled as a river within the boundary of the study area, a drain condition was specified. This was done to model the wetland in the study area, which is fed by groundwater adjacent to it, and to quantify this groundwater discharge to the wetland from the aquifer. From the study of groundwater flow modeling of three wetland ecosystems in the river valleys in Flanders by Batelaan et al. (2003), the average drain elevation 0.2 m below topography and a drain conductance of 20 m2/d was assumed in the present study. A groundwater extraction well with an average pumping rate of 900 m3/d is also present in the study area and the model.
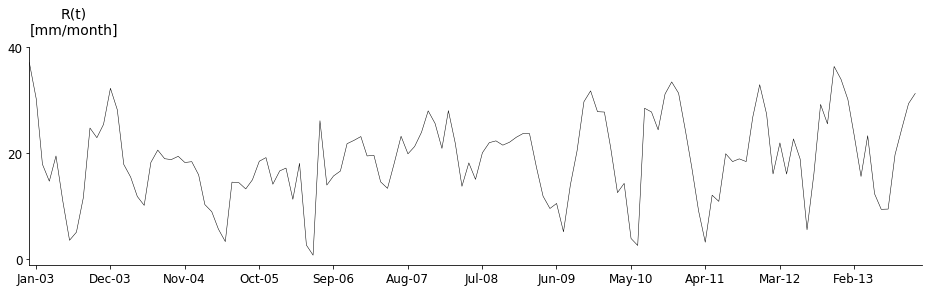
To set up and run the model in the transient state, 132 stress periods with monthly time steps from 2003 till 2013 were utilized. Calculated spatially distributed monthly recharge values were used as input for each stress period. Figure 6 shows the seasonal dynamics of groundwater recharge in the study area.
Relative sensitivities of the model parameters are as follows: hydraulic conductivity, drain conductance (Cdrn), specific yield (Sy) and river conductance (Criv) were executed for the Brussels sand formation and Quaternary loam formation to select parameters for calibration. Average observed hydraulic heads between 2003 and 2013 from 17 observation wells in the study area were used for calibration of the steady-state model. Twice weekly observed hydraulic heads from 14 observation wells between 2006 and 2008 were used to calibrate the transient state model. Afterward, the model was validated using observed hydraulic heads between 2011 and 2013. The variance in the differences between observed and simulated heads was used as a quantitative measure of the “success” of the calibration and validation.
3.3 Groundwater drought analysis
A groundwater drought analysis was performed on the groundwater recharge, R(t) and the groundwater discharge, Q(t), time series of 34 years (1980–2013) to investigate the propagation of groundwater drought in the aquifer and its effect on the wetland. The threshold level method introduced by Yevjevich (1967) with a variable threshold value (Beyene and Van Loon, 2014) was used for hydrological drought in different geoclimatic conditions. In this study, the variable threshold value was used to determine the occurrence of groundwater drought events for both variables.
To do so, first, a separate frequency analysis was conducted for each of the 12 months. The threshold level for each month was determined as the 80th percentile of the probability of exceedance of monthly recharge in that month in the 34-year series (1980–2013). This threshold level is within the 70th–95th percentile of the probability of exceedance range used for most drought studies (Van Loon, 2013). For each month of the year, the monthly recharge and discharge values in the time series were ranked from highest to lowest. For each month, the 80th percentile of recharge and discharge was calculated.
After the separate analysis of drought on groundwater recharge and discharge, the two analyses were combined to characterize groundwater drought events, gain insight into the propagation of drought in the aquifer and assess the response of the groundwater system to drought for the wetland. The groundwater drought events were investigated in terms of the number of droughts, duration of droughts and severity (cumulative volume deficit from the threshold level) (Peters, 2003).
4.1 Meteorological drought
The meteorological drought severity based on monthly SPI (SPI-1) and annual SPI (SPI-12) in the Doode Bemde nature reserve between 1980 and 2011 is shown in Fig. 7. As can be seen, there is a difference in severity and frequency between them. Based on the SPI-1 value (Fig. 7a), the drought categories vary from extreme to no drought, whereas the SPI-12 value (Fig. 7b) shows fewer drought severity categories, which vary from severe to no drought.
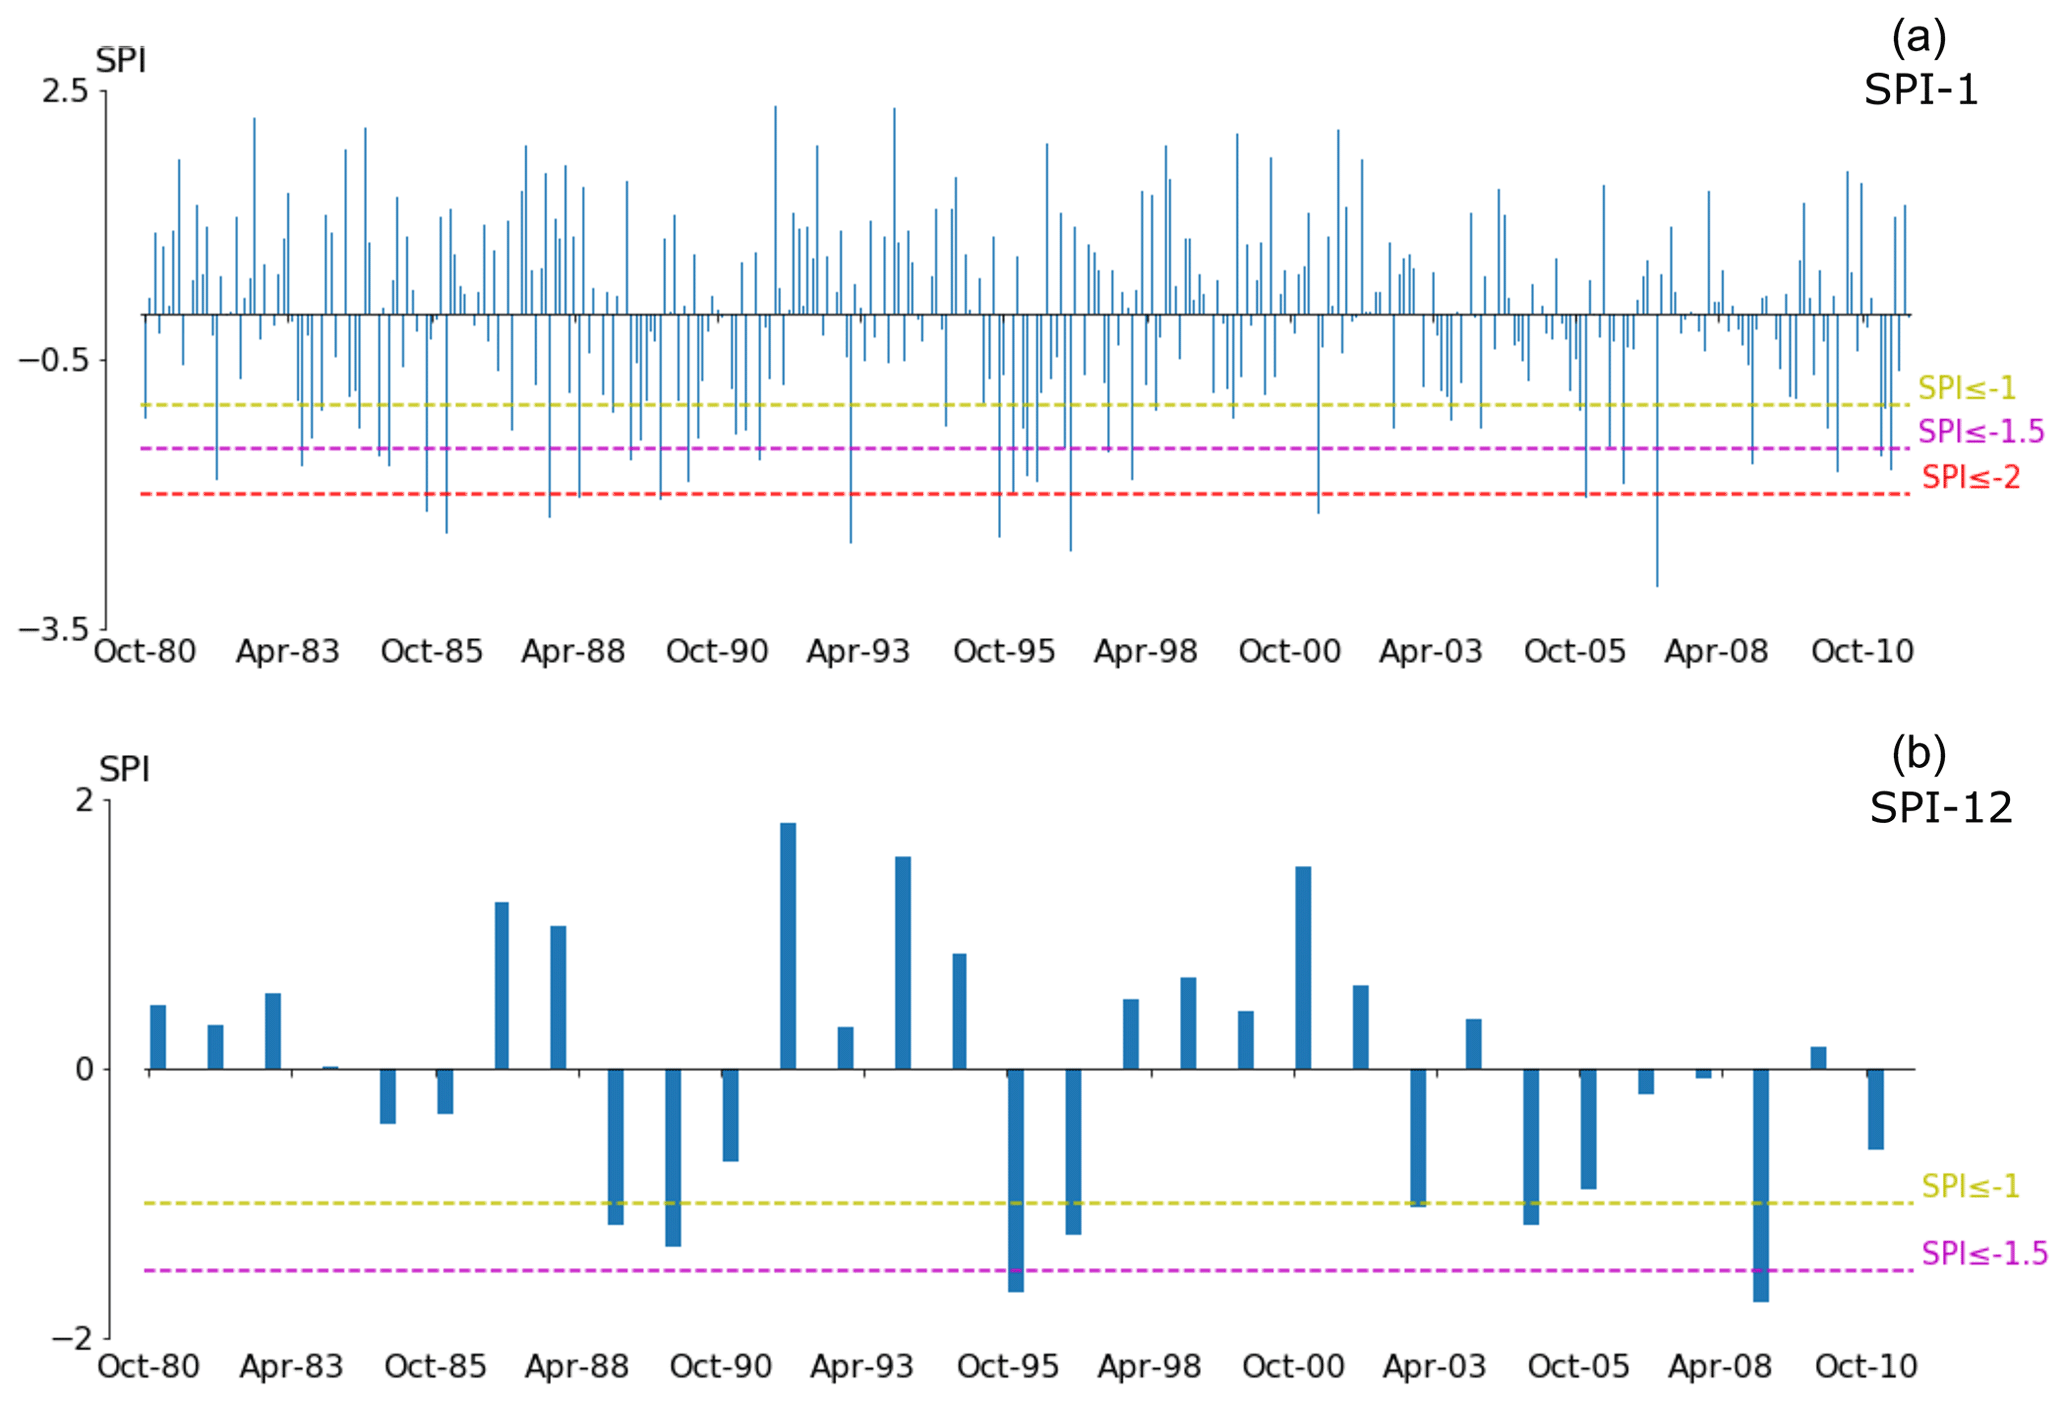
Figure 7Meteorological drought severity for Doode Bemde nature reserve based on (a) SPI-1 value and (b) SPI-12 value between the hydrological years of 1980 and 2011.
Within the analysis period, 11 extreme meteorological droughts at monthly scale are identified using SPI-1. However, two severe meteorological droughts are identified using SPI-12; these occur in 1995–1996 and 2008–2009. From this result, in a short-period SPI calculation, the meteorological drought is frequent but short, and as the period of SPI calculation increases, the duration of drought increases with less frequency. Therefore, SPI-1 is more convenient for the study of drought propagation in a quickly responding hydrological system like in the Doode Bemde nature reserve. Cammalleri and Barbosa (2019) also showed that a short-period SIP calculation is suitable for a quickly responding hydrological system.
4.2 Groundwater modeling
Relative sensitivities of model parameters for the sand formation show that the hydraulic conductivity of the Brussels sand formation (HK1) was the most sensitive parameter (relative sensitivity of 0.023) followed by drain conductance (Cdrn) (relative sensitivity of 0.009). Specific yield and river conductance had little effect on simulated heads. For the location within the Quaternary loam formation, the river conductance was the most sensitive parameter (0.013), followed by hydraulic conductivity HK2 (0.002) and drain conductance (0.001). Storage parameters had little effect on calculated heads.
Generally, the relative sensitivities of the model parameters were small, indicating that the uncertainties of the model parameters have limited influence on the simulated heads.
Hydraulic conductivities of the two geologic settings, HK1 for the Brussels sand formation in the hill tops and HK2 for the Quaternary loam in the valley, were optimized during calibration of the steady-state model. After calibration, the variance amounts to 0.11 m2. The mean absolute error of the simulated heads was 0.23 m.
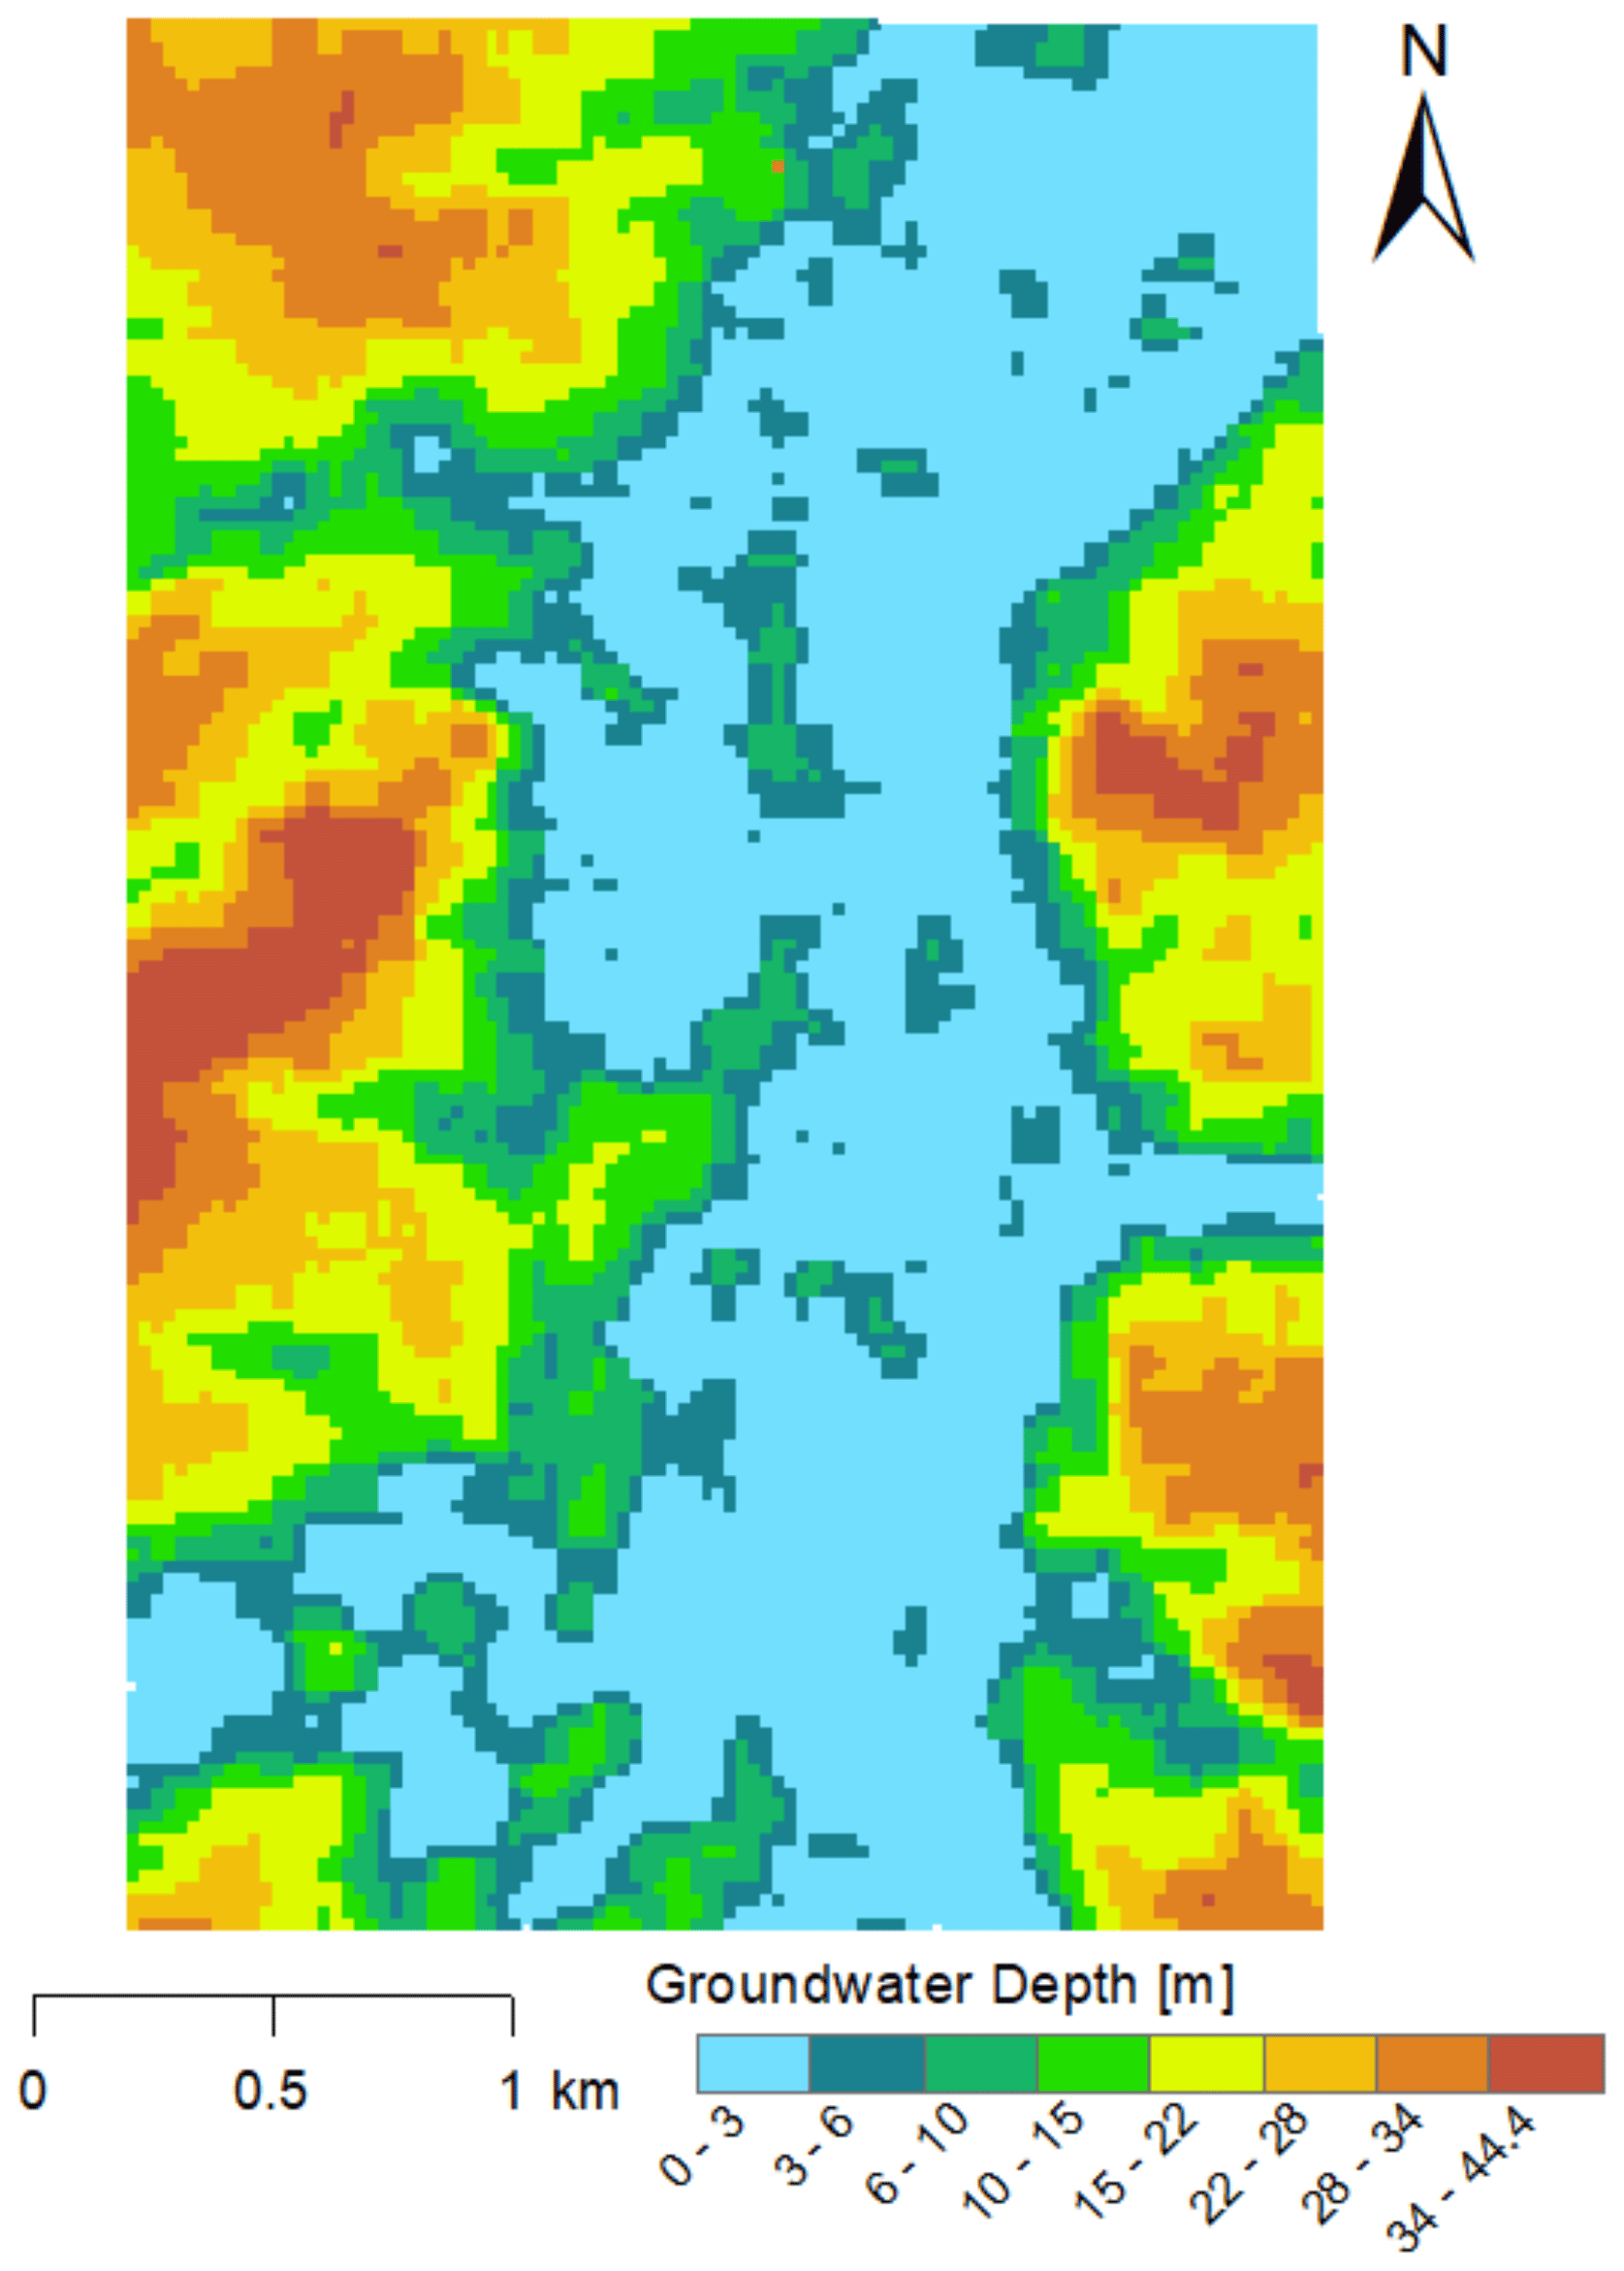
Figure 8Groundwater depth distribution after steady-state groundwater model calibration.
The resulting spatial groundwater depth distribution is shown in Fig. 8, which indicates that groundwater went as deep as 44 m in the hills. In the valley, groundwater depths are less than 1 m for the majority of the area but reach up to 6 m at the western and eastern edges of the valley. Generally, the area has deep groundwater depths around the hills and shallow groundwater depths around the valley.
The steady-state groundwater balance was calculated to obtain average fluxes in the study area. Flux across boundaries constituted around 59 % of the input into the groundwater system. The remaining input was from recharge. The largest outflow was groundwater discharge to the wetland, represented by drain outflow, which was around 58 % of the total output from the aquifer. The aquifer feeds the rivers, and this represents on average around 31 % of the total outflow out of the aquifer. The water balance error was 0.01 %.
During calibration of the transient model, specific yield was optimized for the two geological settings. The final stage calibration yielded a variance of 0.23 m2 and mean absolute error of 0.39 m between the simulated and observed head. Moreover, the model was validated with observed hydraulic head from a different time period, and this yielded a variance of 0.22 m2. The final calibrated values are summarized in Table 2.
Table 2Hydraulic conductivity and storage parameter value of the two geological settings after calibration.

Time series of observed and simulated head at the observation wells (twice weekly interval) showed that the model captures the dynamics of groundwater head in the study area reasonably well. For example, Fig. 9 shows the temporal variation of observed and simulated groundwater head at observation well DYLP081.

Figure 9Temporarily varying observed and simulated groundwater head at observation well DYLP081 between 2003 and 2013.
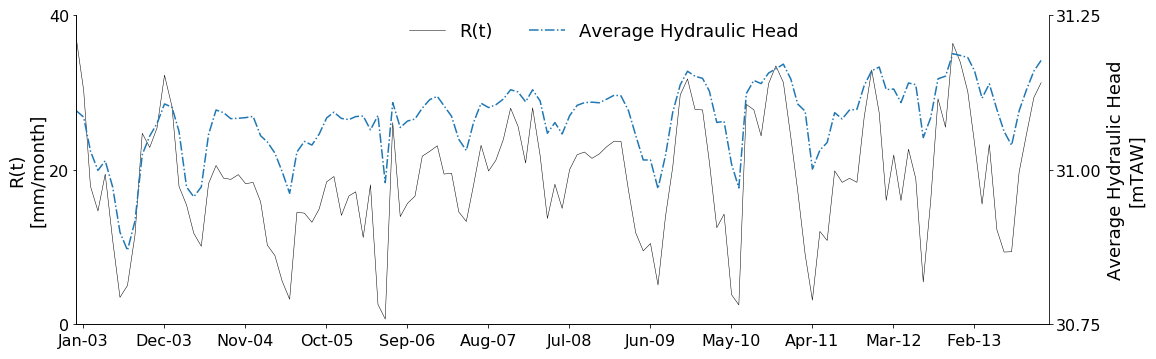
Figure 10Average simulated groundwater head time series and groundwater recharge time series.
The simulated hydraulic head dynamics between 2003 and 2013 in comparison to groundwater recharge is shown in Fig. 10. The model captured the seasonality of the recharge well. Groundwater head is high in winter (December–February) and low in summer (June–August). There is also no systematic delay in the timing of the peaks and lows of the hydraulic head and recharge. This could be attributed to shallow groundwater depths in the study area resulting in a fast response to changes in recharge.
Simulated total groundwater discharge to the wetland (Fig. 11) also shows clear seasonality: high groundwater discharge in winter (December–February) and low groundwater discharge in summer (June–August).
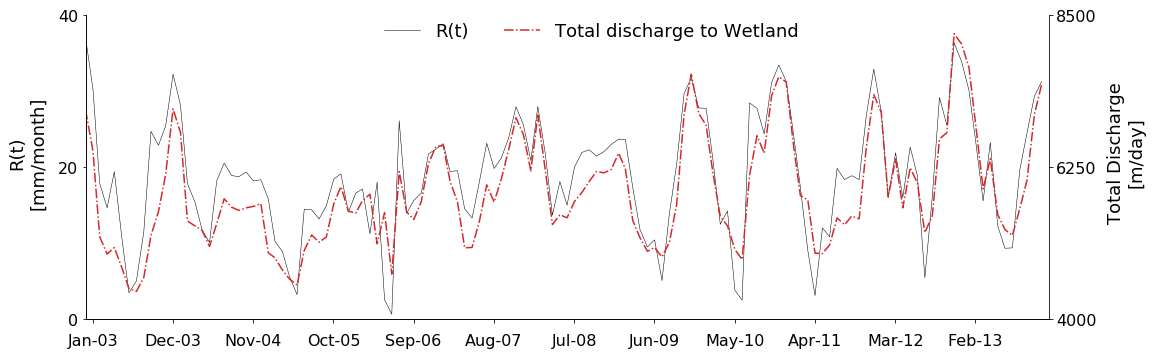
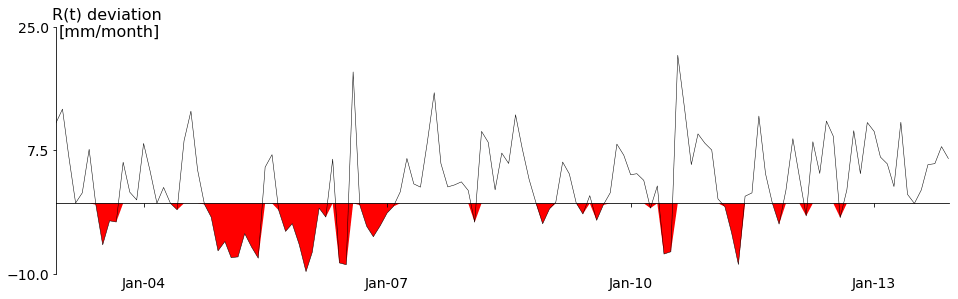
Figure 12Deviation from the threshold value of monthly groundwater recharge. The red color represents groundwater drought events on recharge.
4.3 Groundwater drought
4.3.1 Groundwater drought on recharge
Groundwater recharge deviation from the threshold and groundwater recharge drought events from 2003 to 2013 are shown in Fig. 12. Within this analysis period, seven drought events with a severity higher than 5 mm of cumulative deficit recharge were observed. In terms of duration, the drought events had a mean duration of 5 months. The drought with the longest duration was from October 2004 to June 2005, which lasted for 9 months, closely followed by a drought from September 2005 to April 2006, which lasted for 8 months. Droughts with shorter durations were observed between June 2006 and July 2006 (2 months), between June 2010 and July 2010 (2 months), and between March 2011 and March 2012 (3 months). The severity of the drought events was assessed based on cumulative deficit recharge from the threshold. The most severe drought was from October 2004 to June 2005 with a cumulative deficit recharge of 48 mm, followed by the drought from September 2005 till April 2006 with a cumulative deficit recharge of 33 mm. These severe droughts have drought volumes higher than the average estimated recharge, which is 22 mm/month.
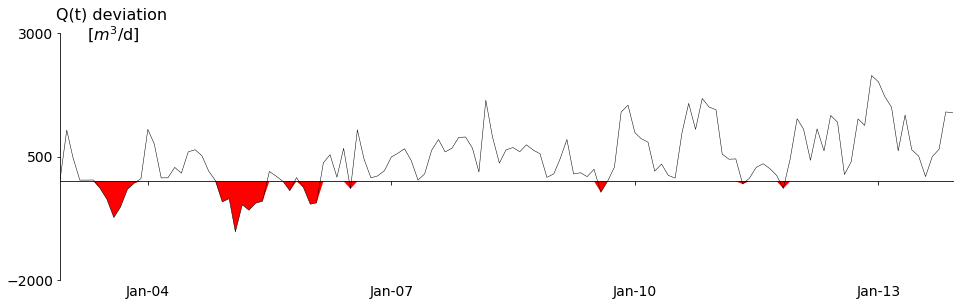
Figure 13Deviation from the threshold value of monthly groundwater discharge to wetland. The red color represents groundwater drought events on discharge.
4.3.2 Groundwater drought on discharge
Deviations of groundwater discharge from the threshold and discharge drought events are shown in Fig. 13.
Three groundwater discharge drought events occurred between 2003 and 2013. The first one was from June 2003 till November 2003. The second drought event occurred from December 2004 to June 2005. The last one was from 5 December till February 2006. Minor drought events with a cumulative deficit volume less than 300 m3 were excluded. The drought events lasted for 6 months, 7 months and 3 months, respectively, with a mean duration of 5.3 months. The second drought event from 4 December to 5 June was the most severe with a cumulative deficit volume of 3698 m3. The first drought had a cumulative volume deficit of 1969 m3 and the third 1025 m3.
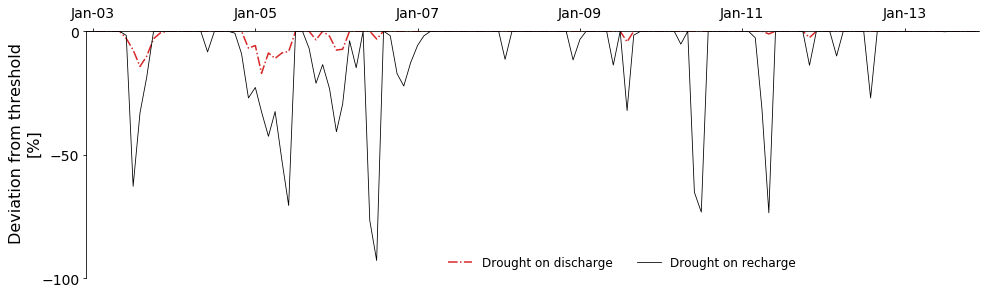
Figure 14Comparison of drought events on groundwater recharge and groundwater discharge using the percent deviation from the threshold.
The average duration of droughts on discharge (5.3 months) showed a slight increase compared to the mean duration of droughts on recharge (5 months). However, the number of droughts events on discharge (three) decrease compared to the number of droughts events on recharge (seven). This decrement was expected as the propagation of recharge drought through an aquifer usually results in a lower number of hydrological droughts (Van Lanen, 2006). Also, drought events on recharge were more severe than groundwater discharge (Fig. 14). This decrease in severity could be caused by the attenuation in discharge through the groundwater system (Peters, 2003). Another important observation was the absence of any significant shift in drought events. The drought events of recharge and discharge seem to occur at approximately the same time. This could be attributed to the limited thickness of the aquifer and shallow groundwater levels in most parts of the study area, which results in a quick response to hydrologic stresses.
Table 3Groundwater drought on recharge characteristics (onset, number events, duration and deficit volume) between 1981 and 2010 and number of meteorological droughts (SPI-1) ranging from moderate to extreme severity before the onset of groundwater drought on recharge with lag time.
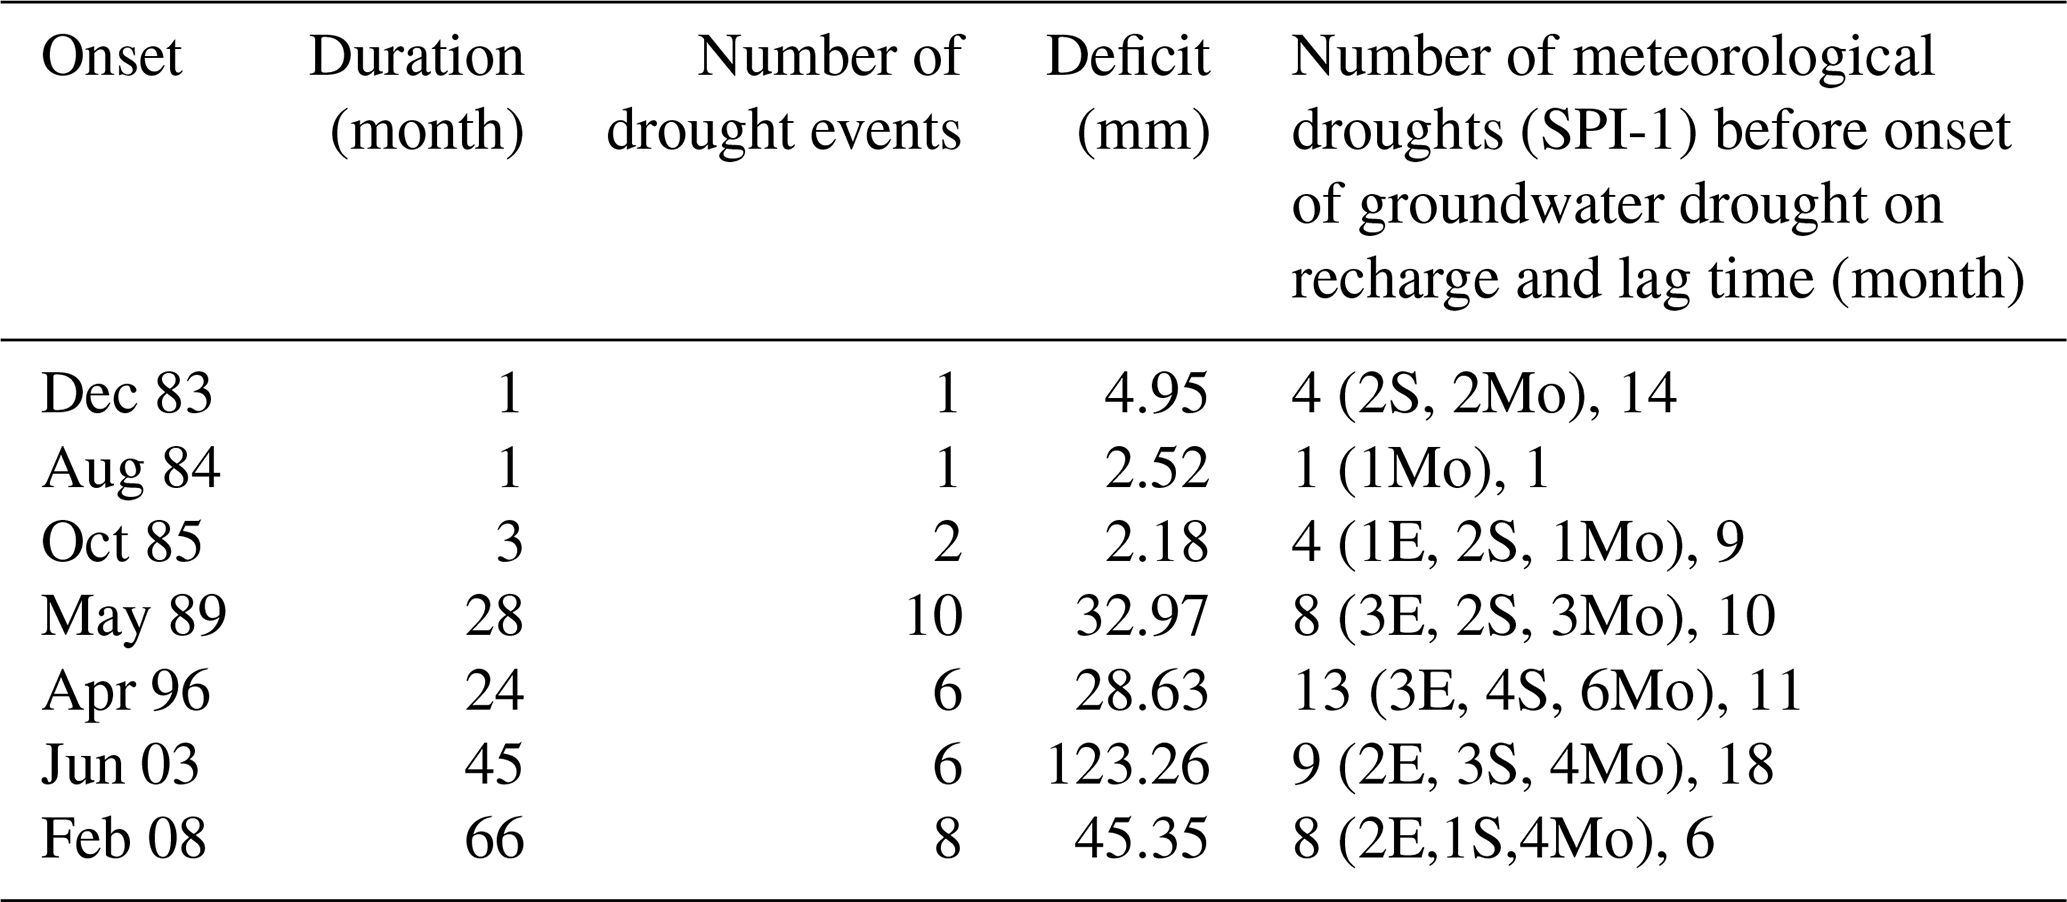
E: extreme; S: severe; Mo: moderate.
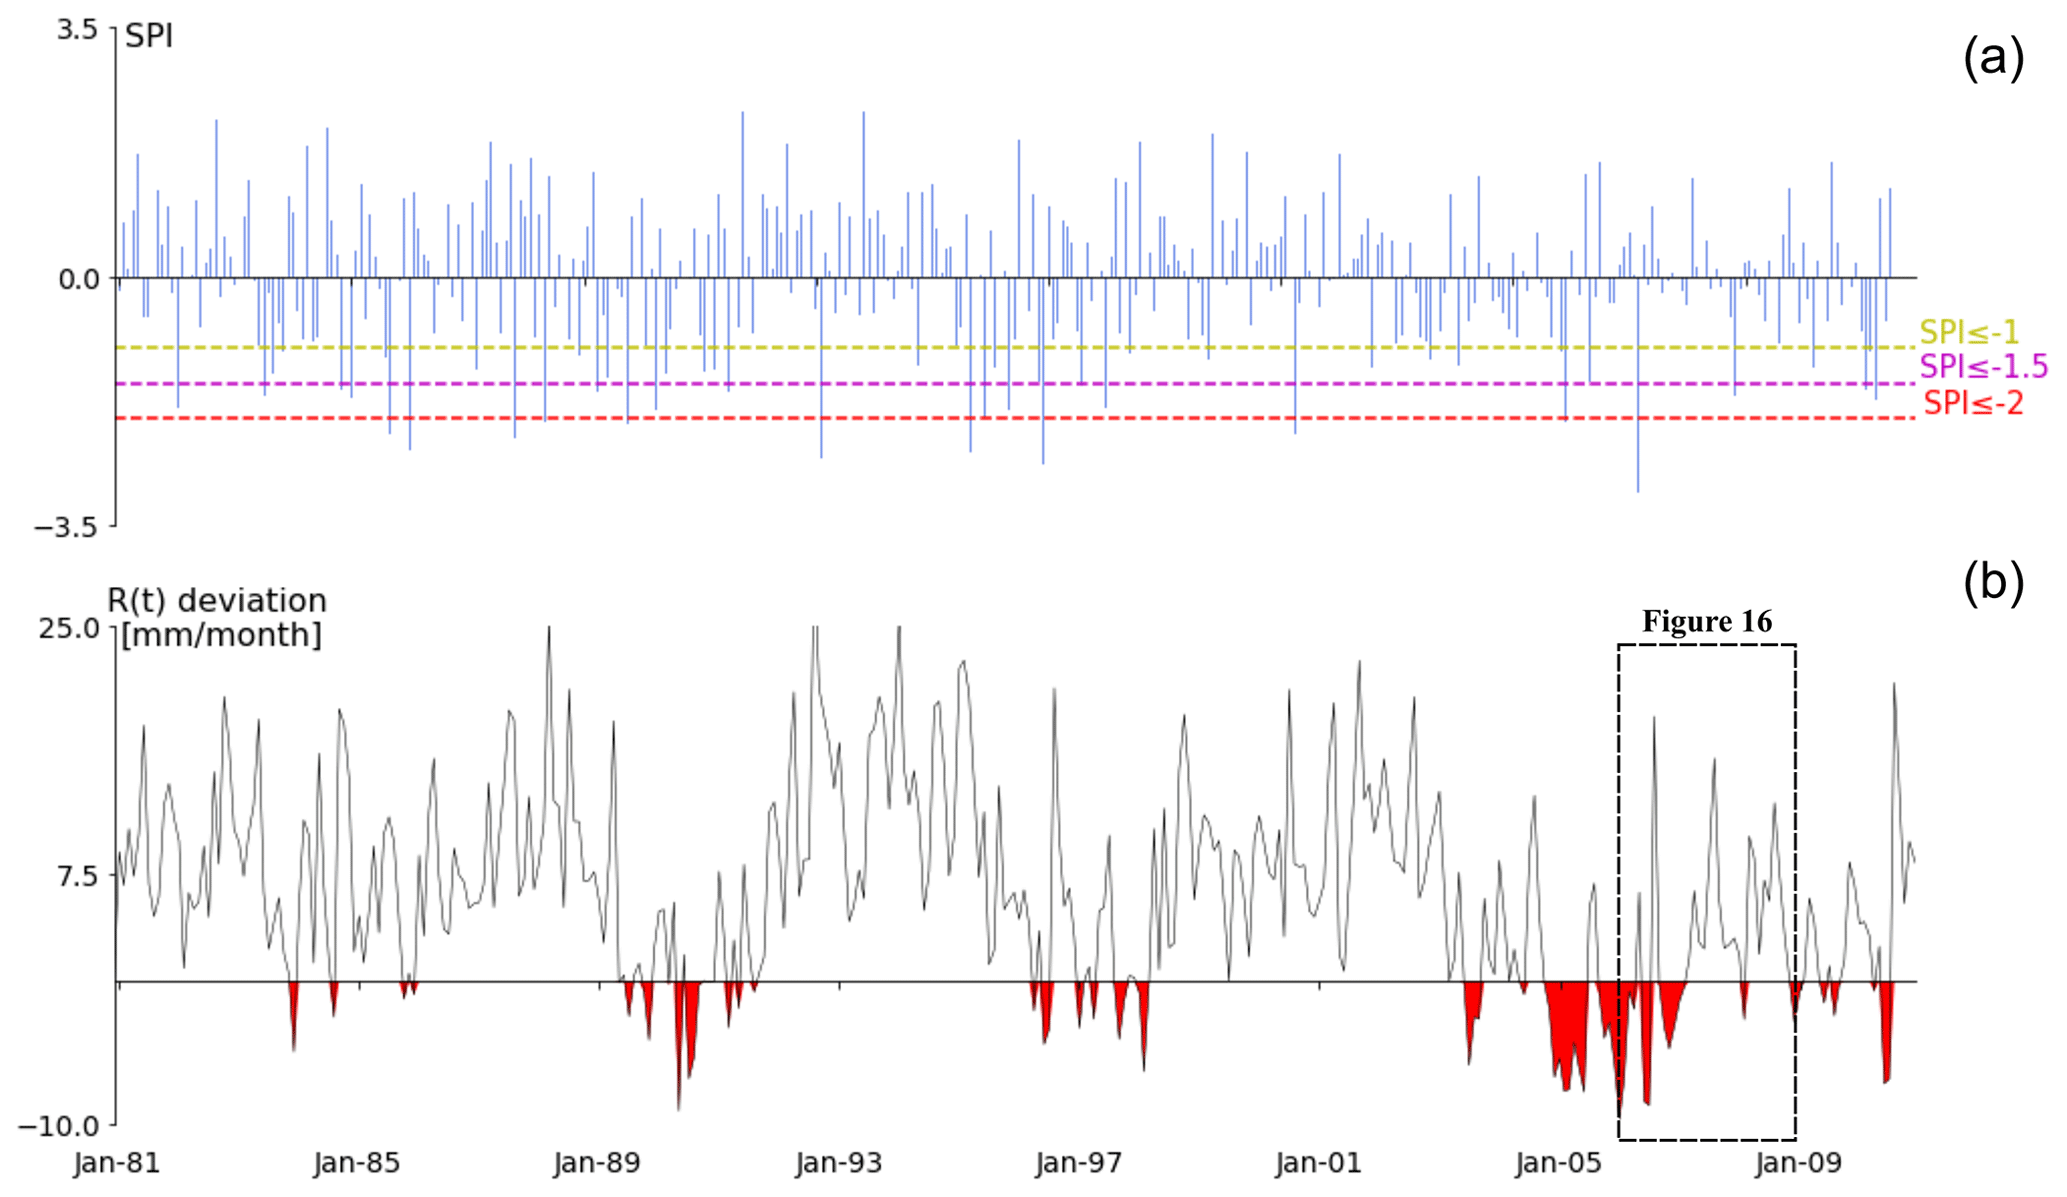
Figure 15Comparison of meteorological drought severity and groundwater recharge drought. (a) Monthly SPI values and (b) groundwater recharge deviation from the threshold. The red color represents recharge drought events.
4.4 Drought propagation from meteorological to groundwater recharge
The propagation of drought from meteorological to groundwater was analyzed by using SPI-1 and groundwater recharge. Table 3 indicates some of the groundwater drought characteristics between the hydrological years of 1981 and 2010. Before every groundwater drought, meteorological drought was observed in different severity ranges. Moreover, the severity of the meteorological drought had an impact on the deficit volume and duration of the groundwater drought; for example, the groundwater droughts occurred after May 1989. In this study area, moderate meteorological drought also propagates in the groundwater, i.e., a minor groundwater drought starts in August 1984. Moreover, the lag time between the start of the meteorological drought and the start of the groundwater drought events were calculated. The lag in Table 3 is the average of the lag of each ground drought event within the major groundwater drought.
Furthermore, by comparing Fig. 15a and b, the propagation of drought from meteorological to groundwater recharge can be evaluated. Within the analysis period, meteorological drought is observed first and is more frequent than groundwater drought on recharge. In addition, most of the meteorological droughts propagated in the groundwater recharge with an average lag of 9 months, which is attributed to the shallow groundwater depth in most parts of the study area.
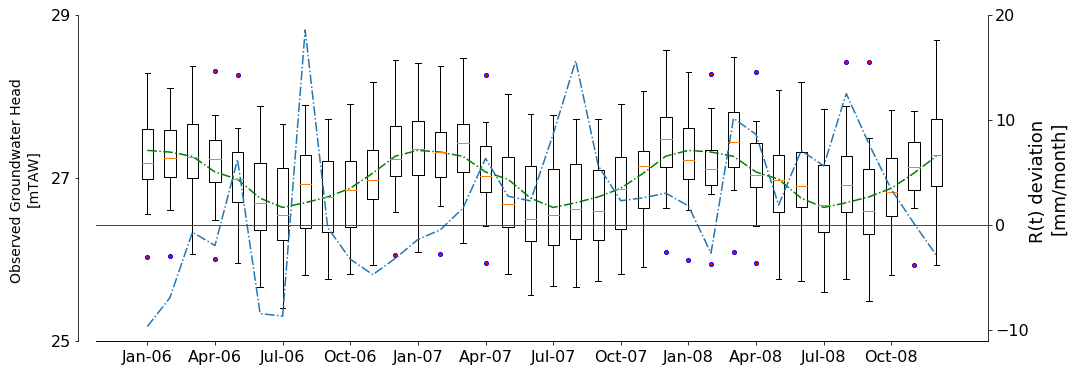
Figure 16Observed groundwater head distribution collected from 14 observation wells (boxplot with monthly time step), long-term (2003–2013) average monthly observed groundwater head (dotted green line) and groundwater recharge deviation from threshold value (dotted blue line) between 2006 and 2008. These observation wells are mainly found in the delineated wetland area (Fig. 5).
This propagation of drought had an impact on the hydrological functioning of the groundwater-fed wetland of Doode Bemde. The monthly box plots in Fig. 16 show observed groundwater head distribution measured using 14 observation wells mostly found on the delineated wetland. Long-term average groundwater heads (green) show clear seasonal dynamics: the highest level in January, the lowest in June. The mean observed groundwater heads (yellow) deviate from the long-term average. The identified groundwater recharge droughts (blue) seem to explain the majority of the observed deviations in the period between 2006 and 2008. The groundwater levels lower than the long-term average measured in the winter (January, February) and summer (June, July) of 2006 and winter (January, February) of 2008 could be the effect of the groundwater droughts that occurred in 2006 and 2008, respectively (Fig. 16). However, the impact of the groundwater drought between fall 2006 and winter 2007 was delayed, which is visible in the groundwater level measurement in the spring of 2007. This delay could be because of the upland recharge from the Dijle valley.
During drought propagation in the hydrological cycle, the multiyear meteorological droughts of 1981–2013 propagate in groundwater recharge drought. This propagation continues to the groundwater system. The groundwater drought propagation analysis showed that even though the number and severity of drought events observed in discharge to the wetland are lower than for recharge, the wetland is still vulnerable to groundwater drought. This is also reflected in the lower groundwater level measurements between 2006 and 2008. This vulnerability could be because of the shallow water table and limited thickness of the aquifer in the study area, resulting in a quick response to changes in hydrological stresses such as droughts. The drought propagation in a wetland studied by Fang and Pomeroy (2008) also showed a much lower discharge to the wetland from the basin groundwater and snowmelt runoff developed in drought years. Moreover, Drexler and Ewel (2001) performed a field experiment during the 1997–1998 ENSO-related (El Niño–Southern Oscillation) drought and found that the mean water table level in the wetlands lowered by 12 to 54 cm. This could also be explained by drought propagation from the meteorological to the groundwater system.
In this study, a method is proposed to investigate the propagation of meteorological drought in groundwater recharge, groundwater levels and groundwater discharge to a wetland. The method combines a water balance model, a transient groundwater flow model, threshold methods and drought indices. The method is applied to analyze drought propagation in the hydrological cycle, with a focus on groundwater recharge and discharge drought, in the Doode Bemde wetland nature reserve in central Belgium.
The combination of a water balance model (WetSpaSS) and groundwater model (MODFLOW) was used to simulate groundwater recharge and groundwater discharge with high temporal and spatial resolution. Moreover, a variable threshold value method was implemented for groundwater drought analysis.
Groundwater drought analysis on groundwater recharge and discharge to the wetland showed that the number of groundwater discharge drought events was smaller than the number of recharge drought events. As a result, not all recharge drought events resulted in discharge drought. This was expected as the number of hydrological droughts normally decreases as the groundwater recharge droughts propagate through the aquifer. When it comes to the onset of the drought events, not much difference was observed between droughts on recharge and discharge to the wetland. The drought events appeared to have occurred around the same time. In terms of severity, the drought events on recharge were more severe than the drought events on discharge to the wetland. Attenuation in discharge by the groundwater system could have played a role here.
From this study, it is concluded that not all meteorological droughts result in groundwater drought. However, a combination of different severity ranges of meteorological drought causes groundwater drought. Furthermore, the characteristics of drought, like duration, onset and deficit, changed during drought propagation in the aquifer, and the impact of drought was also detected on the Doode Bemde wetland water level.
The data that support the findings of this study are available from the corresponding author upon reasonable request.
BKW led the development of this work. All authors have contributed to the conceptualization of the study objective, data collection and methodology development. MH and BV were responsible for supervising the study. BKW and KAW prepared the original draft with contributions from all authors. BKW, BV and MH did the review and editing. All authors have read and agreed to the published version of the paper.
The authors declare that they have no conflict of interest.
This article is part of the special issue ”Drought vulnerability, risk, and impact assessments: bridging the science-policy gap”. It is not associated with a conference.
The research idea and spatially distributed groundwater recharge time series were obtained from the GRoWaDRISK project (SD/RI/05a, 2012–2016) funded by the Belgian Science Policy Office (BELSPO) within the framework of the Science for Sustainable Development research program.
This research has been supported by the IRO PhD scholarship KU Leuven (grant no. 000000078217).
This paper was edited by Ana Iglesias and reviewed by Ana Iglesias and one anonymous referee.
Abdollahi, K., Bashir, I., Verbeiren, B., Harouna, M., van Griensven, A., Huysmans, M., and Batelaan, O.: A distributed monthly water balance model: formulation and application on Black Volta Basin, Environ. Earth Sci., 76, 1–18, https://doi.org/10.1007/s12665-017-6512-1, 2017.
Batelaan, O. and De Smedt, F.: WetSpass: a flexible, GIS based, distributed recharge methodology for regional groundwater modelling, in: Proceedings of a symposium held during the Sixth IAHS Scientific Assembly, Maastricht, the Netherlands, 18 to 27 July 2001, 11–17, 2001.
Batelaan, O. and De Smedt, F.: GIS-based recharge estimation by coupling surface-subsurface water balances, J. Hydrol., 337, 337–355, https://doi.org/10.1016/j.jhydrol.2007.02.001, 2007.
Batelaan, O., Asefa, T., van Rossum, P., and De Smedt, F.: Groundwater flow modelling of three wetland ecosystems in river valleys in Flanders, Belgium, in: Proceedings of 8th Conference of the European Network of Experimental and Representative Basins (ERB), Ghent, Belgium, 27–29 September 2000, 1–7, 2003.
Beyene, B. S., Van Loon, A. F., Van Lanen, H. A. J., and Torfs, P. J. J. F.: Investigation of variable threshold level approaches for hydrological drought identification, Hydrol. Earth Syst. Sci. Discuss., 11, 12765–12797, https://doi.org/10.5194/hessd-11-12765-2014, 2014.
Bloomfield, J. P. and Marchant, B. P.: Analysis of groundwater drought building on the standardised precipitation index approach, Hydrol. Earth Syst. Sci., 17, 4769–4787, https://doi.org/10.5194/hess-17-4769-2013, 2013.
Calow, R. C., Robins, N. S., MacDonald, A. M., Macdonald, D. M. J., Gibbs, B. R., Orpen, W. R., Mtembezeka, P., Andrews, A. J., and Appiah, S. O.: Groundwater management in drought prone areas of Africa, Int. J. Water Resour. Dev., 13, 241–262, https://doi.org/10.1080/07900629749863, 1997.
De Becker, P., Hermy, M., and Butaye, J.: Ecohydrological characterization of a groundwater-fed alluvial floodplain mire, Appl. Veg. Sci., 2, 215–228, https://doi.org/10.2307/1478985, 1999.
Drexler, J. Z. and Ewel, K. C.: Effect of the 1997–1998 ENSO-related drought on hydrology and salinity in a Micronesian wetland complex, Estuaries, 24, 347–356, https://doi.org/10.2307/1353237, 2001.
Edward, D. C. and McKee, T. B.: Characteristics of 20th century drought in the United States at multiple time scales, Climatology Reports, Colorado State University, Fort Collins, CO, USA, 172 pp., 1997.
Fang, X. and Pomeroy, J. W.: Drought impacts on Canadian prairie wetland snowhydrology, Hydrol. Process., 22, 2858–2873, https://doi.org/10.1002/hyp.7074, 2008.
Flemish Water Authorities: Measurement of water level and discharge, availabe at: https://www.waterinfo.be/, last access: 20 April 2019.
Harbaugh, A. W., Banta, E. R., Hill, M. C., and McDonald, M. G.: MODFLOW-2000, The US Geological Survey Modular Ground-Water Model – User Guide to Modularization Concepts and the Ground-Water Flow Process, Open-File Report 2000-92, US Geological Survey, Reston, VA, USA, 130 pp., 2000.
Hoyaux, J., Verheyden, S., Bogaert, J., Ghelen, Y., Van Leest, M., Annemarie, V. A., and Squilbin, M.: Belgian National Adaptation Plan (2017–2020), B-1000, Brussels, Belgium, 40 pp., 2016.
Huysmans, M. and Dassargues, A.: Hydrogeological modeling of radionuclide transport in low permeability media: A comparison between Boom Clay and Ypresian Clay, Environ. Geol., 50, 122–131, https://doi.org/10.1007/s00254-006-0191-7, 2006.
McKee, T. B., Doesken, N. J., and Kleist, J.: A drought climatology for Europe, in: Proceedings of the 8th Conference on Applied Climatology, Anaheim, CA, USA, 17–22 January 1993, 179–183, 1993.
Mishra, A. K. and Singh, V. P.: A review of drought concepts, J. Hydrol., 391, 202–216, https://doi.org/10.1016/j.jhydrol.2010.07.012, 2010
Peeters, L.: Groundwater and geochemical modelling of the unconfined Brussels aquifer, PhD thesis, KU Leuven, Leuven, Belgium, 128 pp., 2010.
Peters, E.: Propagation of drought through groundwater systems, PhD thesis, Wageningen University, Wageningen, the Netherlands, 221 pp., 2003.
Peters, E. and Van Lanen, H. A. J.: Propagation of drought in groundwater in semi-arid and sub-humid climaticregimes, in: Proceedings of the International Symposium of Hydrology of the Mediterranean and Semi-AridRegions, Montpellier, France, 1–4 April 2003, 312–317, 2003.
Peters, E., Bier, G., van Lanen, H. A. J., and Torfs, P. J. J. F.: Propagation and spatial distribution of drought in a groundwater catchment, J. Hydrol., 321, 257–275, https://doi.org/10.1016/j.jhydrol.2005.08.004, 2006.
Possemiers, M., Huysmans, M., Peeters, L., Batelaan, O., and Dassargues, A.: Relationship between sedimentary features and permeability at different scales in the Brussels Sands, Geol. Belgica, 15, 156–164, 2012.
Ridder, K. D., Couderé, K., Depoorter, M., Liekens, I., Pourria, X., Steinmetz, D., Vanuytrecht, E., Verhaegen, K., and Wouters, H.: Evaluation of the Socio-Economic Impact of Climate Change in Belgium, vito, Report, 1–253, 2020.
Tabari, H., Taye, M. T., and Willems, P.: Water availability change in central Belgium for the late 21st century, Global Planet. Change, 131, 115–123, https://doi.org/10.1016/j.gloplacha.2015.05.012, 2015.
Thom, H. C. S.: A Note on the Gamma Distribution, Mon. Weather Rev., 86, 117–122, https://doi.org/10.1175/1520-0493(1958)086<0117:anotgd>2.0.co;2, 1958.
Tricot, C., Debontridder, L., Van de Vyver, H., Vandiepenbeek, M., Dewitte, S., De Backer, H., Malderen, R., Vannitsem, S., and Roulin, E.: Oog voor het Klimaatt/Vigilance climatique, KML, Bruxelles, Belgium, 87 pp., 2015.
Vandersteen, K., Gedeon, M., and Beerten, K.: A synthesis of hydraulic conductivity measurements of the subsurface in Northeastern Belgium, Geol. Belgica, 17, 196–210, 2014.
Van Lanen, H. A. J.: Drought propagation through the hydrological cycle, in: Proceedings of the Fifth FRIEND World Conference about Climate Variability and Change – Hydrological Impacts, Havana, Cuba, 27 November to 1 December 2006, 122–127, 2006.
Van Lanen, H. A. J. and Peters, E.: Temporal variability of recharge as an indicator for natural groundwater droughts in two climatically contrasting basins, in: Proceedings of Fourth International Conference on FRIEND 2002 – regional hydrology: bridging the gap between research and practice, Cape Town, South Africa, 18–22 March 2002, 101–106, 2002.
Van Loon, A. F.: On the propagation of drought How climate and catchment characteristics influence hydrological drought development and recovery, PhD thesis, Wageningen University, Wageningen, the Netherlands, 195 pp., 2013.
Verbeiren, B., Batelaan, O., Hung, L. Q., and De Smedt, F.: Doode Bemde CASI-SWIR 2002: Hyperspectral sensing of moisture gradients-set-up and first results of a combined field and airborne campaign, in: Proceedings of SPIE about Remote Sensing for Agriculture, Ecosystems, and Hydrology V, Bellingham, WA, USA, 8–12 September 2003, 399–407, https://doi.org/10.1117/12.511651, 2004.
Verbeiren, B., Huysmans, M., Tychon, B., Jacquemin, I., Canters, F., Vanderhaegen, S., Engelen, G., Poelmans, L., De Becker, P., Tsakiris, G., Vangelis, H., and Batelaan, O.: Drought-related vulnerability and risk assessment of groundwater resources under temperate conditions, in: 13th International Conference on Environmental Science and Technology, Athens, Greece, 5–7 September 2013, 10 pp., 2013.
VMM: Grondwater in Vlaanderen: Het Brulandkrijtsysteem, Aalst, Belgium, 127 pp., 2008.
Wilhite, D. A.: Drought as a Natural Hazard: Concepts and Definitions, Drought A Glob. Assess., Drought Mitigation Center Faculty, Routledge, London, 1, 3–18, 2000.
Wilhite, D. A. and Glantz, M. H.: Understanding the drought phenomenon: The role of definitions, Water Int., 10, 111–120, https://doi.org/10.4324/9780429301735-2, 1985.
Wossenyeleh, B. K., Verbeiren, B., Diels, J., and Huysmans, M.: Vadose zone lag time effect on groundwater drought in a temperate climate, Water, 12, 2123, https://doi.org/10.3390/w12082123, 2020.
Yevjevich, V.: An objective approach to definitions and investigations of continental hydrologic droughts, Hydrology Papers 23, Colorado State University, Fort Collins, CO, USA, 25 pp., 1967.