the Creative Commons Attribution 4.0 License.
the Creative Commons Attribution 4.0 License.
 | 10 Nov 2021
The mud volcanoes at Santa Barbara and Aragona (Sicily, Italy): a contribution to risk assessment
Alessandro Gattuso
Francesco Italiano
Giorgio Capasso
Antonino D'Alessandro
Fausto Grassa
Antonino Fabio Pisciotta
Davide Romano
The Santa Barbara and Aragona areas are affected by mud volcanism (MV) phenomena, consisting of continuous or intermittent emission of mud, water, and gases. This activity could be interrupted by paroxysmal events, with an eruptive column composed mainly of clay material, water, and gases. They are the most hazardous phenomena, and today it is impossible to define the potential parameters for modelling the phenomenon. In 2017, two digital surface models (DSMs) were performed by drone in both areas, thus allowing the mapping of the emission zones and the covered areas by the previous events.
Detailed information about past paroxysms was obtained from historical sources, and, with the analysis of the 2017 DSMs, a preliminary hazard assessment was carried out for the first time at two sites. Two potentially hazardous paroxysm surfaces of 0.12 and 0.20 km2 for Santa Barbara and Aragona respectively were defined. In May 2020, at Aragona, a new paroxysm covered a surface of 8721 m2. After this, a new detailed DSM was collected with the aim to make a comparison with the 2017 one. Since 2017, a seismic station was installed in Santa Barbara. From preliminary results, both seismic events and ambient noise showed a frequency of 5–10 Hz.
- Article
(22552 KB) - Full-text XML
- BibTeX
- EndNote


The mud volcano (MV) activity is a typical expression of the sedimentary volcanism mainly occurring in the compressive tectonic regimes, along discontinuities for the presence at depth, of under-pressure gases or by diapirism phenomena. It consists mainly of a slow and continuous or intermittent uprising of mud, composed of a mixture of saline water, clay, and gases (essentially methane and heavy hydrocarbons) from petroleum seepage (natural gas and oil) at depth to the Earth's surface (Mazzini and Etiope, 2017). In some cases, a violent and instantaneous explosion (“paroxysm”) of mud, water, and gases could interrupt this activity.
Thousands of mud volcanoes occur globally, and they develop in greater numbers in offshore regions than on land (Higgins and Saunders, 1974; Guliyiev and Feizullayev, 1998; Milkov, 2000; Dimitrov, 2002; Kopf, 2002; Deville, 2009).
In the world, within the 42 geographical areas, as well as Alpine–Himalayan, Pacific, and central Asian folding zones; in the deep-water zones of the Caspian, Black and Mediterranean seas; and on the passive margins of the continents, a total of 2508 mud volcanoes and mud volcanic manifestations are present (Aliyev et al., 2015).
The largest number of mud volcanoes, including the biggest, most frequently erupting ones, and in general all their known types are located in eastern Azerbaijan and the adjacent water area of the south Caspian Sea. It is in accordance with these factors that the Azerbaijan region is considered to be the “motherland of mud volcanoes”. In total, there are 353 mud volcanoes, 199 of which are terrestrial. A complete catalogue of the paroxysm events from 1810 to 2018, for this region, is reported in Baloglanov et al. (2018).
According to a detailed study performed by Mellors et al. (2007), for the mud volcanoes in Azerbaijan, the temporal correlation between earthquakes and eruptions is most pronounced for nearby earthquakes (within 100 km) and with intensities of Mercalli 6 or greater. According to Bonini (2009), mud volcanoes of the Pede–Apennine margin in Italy are intimately connected with rising fluids trapped in the core of anticlines associated with the seismogenic Pede–Apennine thrusts.
Monitoring the activity of the mud volcanoes, in terms of gas outflow, could be helpful to predict a future paroxysmal event. From the geochemical point of view, the monitoring is generally carried out by capturing gaseous emissions at the emitting conduits (Kopf et al., 2010). Sciarra et al. (2016), while monitoring the soil gas concentration (222Rn, CO2, CH4), carried out different geochemical surveys in 2006 in the Sidoarjo district (eastern Java Island, Indonesia). However, this approach is not always effective and applicable, due to logistic difficulties, which make this kind of measurement infeasible and expensive in many contexts. For this reason, several multidisciplinary monitoring approaches have been proposed in different MV in the world. More recently, Mazzini et al. (2021) have estimated the total CH4 emissions from Lusi using both ground-based and for, the first time, satellite (TROPOMI) measurements; CO2 emission is additionally measured by ground-based techniques. In May and October 2011, the activity was documented with high-resolution time-lapse photography, open-path Fourier transform infrared (FTIR) imagery, and thermal infrared imagery (Vanderkluysen et al., 2014).
In areas characterised by MV the gas “bubbling” phenomena can be effectively recorded by a geophysical monitoring system, such as a local seismic network. For low permeability of clays in mud volcano areas, Kopf (2002) suggests that, in the lack of large mud outflow (typical of quiescent phases), gas propagation from the reservoir mainly occurs by the uprising of gas bubbles (Etiope et al., 2002; Albarello, 2005). Recent research (Albarello et al., 2012) showed that seismic monitoring could provide useful signals to characterise the activity of mud volcanoes. The seismic signals recorded on the Dashgil mud volcano allowed the modelling of several transients as a surface effect of resonant gas bubbles in a shallow basin just below the volcano (Albarello et al., 2012). The interpretation of transient events in a seismic tremor in terms of bubble resonance suggests a new approach to stimulate gas emissions in the mud volcano.
In Italy, the mud volcanoes are clustered in three main geographical zones: in the northern Apennines (mainly in the Emilia Romagna region), in the central Apennines (Marche and Abruzzo regions), in the southern Apennines (in Basilicata, Calabria, and Campania regions), and in Sicily where 13 mud volcanoes areas are present in both the central and western sectors. The sizes and shapes of the Italian mud volcanoes vary considerably. According to Martinelli and Judd (2004), only a small proportion (20 %) can be described as “large” with a surface area > 500 m2, while only 5 % exceed 2 m in height.
In Sicily, mud volcanoes are mostly located within Caltanissetta and Agrigento provinces (S. Barbara and Aragona locations respectively). These phenomena are known as maccalube (or macalube), which derives from Arabic and means “overturning”. In some cases, a violent and instantaneous explosion called a paroxysm could occur, and the erupted material, consisting of mud breccias composed of a mud matrix with chaotically distributed angular to rounded rock clasts from a few millimetres to metres in diameter, could reach a large distance from the emission point. The volume of the erupted materials is generally on the order of tens of cubic metres and covers a big portion of the surface. On 27 September 2014 at maccalube of Aragona two kids died covered by thick erupted mud deposits during a violent paroxysm. At Santa Barbara village, the last paroxysmal episode occurred in August 2008, causing significant damages to houses, roads, electric pipelines, and water pipelines.
The majority of the mud eruptions occurred in the absence of any earthquake, suggesting that mud volcanoes may erupt in response to a seismic input only if the internal fluid pressure approaches the lithostatic one. A dormancy time is needed for triggering an eruption, related to the production rate of the driving gas to overcome the permeability of the system at depth (Bonini, 2009).
In this paper, we have gathered some historical information about the pre- and post-paroxysmal events that occurred in the past at both study areas as a starting point for a correct hazard assessment.
In October 2017, a seismic monitoring station was installed at Santa Barbara, in order to collect some seismic information of the site. Moreover, a number of drone surveys were performed at both Santa Barbara and Aragona. Finally, at Aragona a drone survey was carried out a few days after the last paroxysm event occurred on 19 May 2020, with the aim of mapping the surface of the erupted material and estimating volume and thickness.
Moreover, a digital surface model (DSM) has been elaborated, and the emission points at the Earth's surface were mapped. Based on the DSM analysis and our historical information, two main hazardous paroxysm areas at Santa Barbara and Aragona have been elaborated in this paper for the first time.
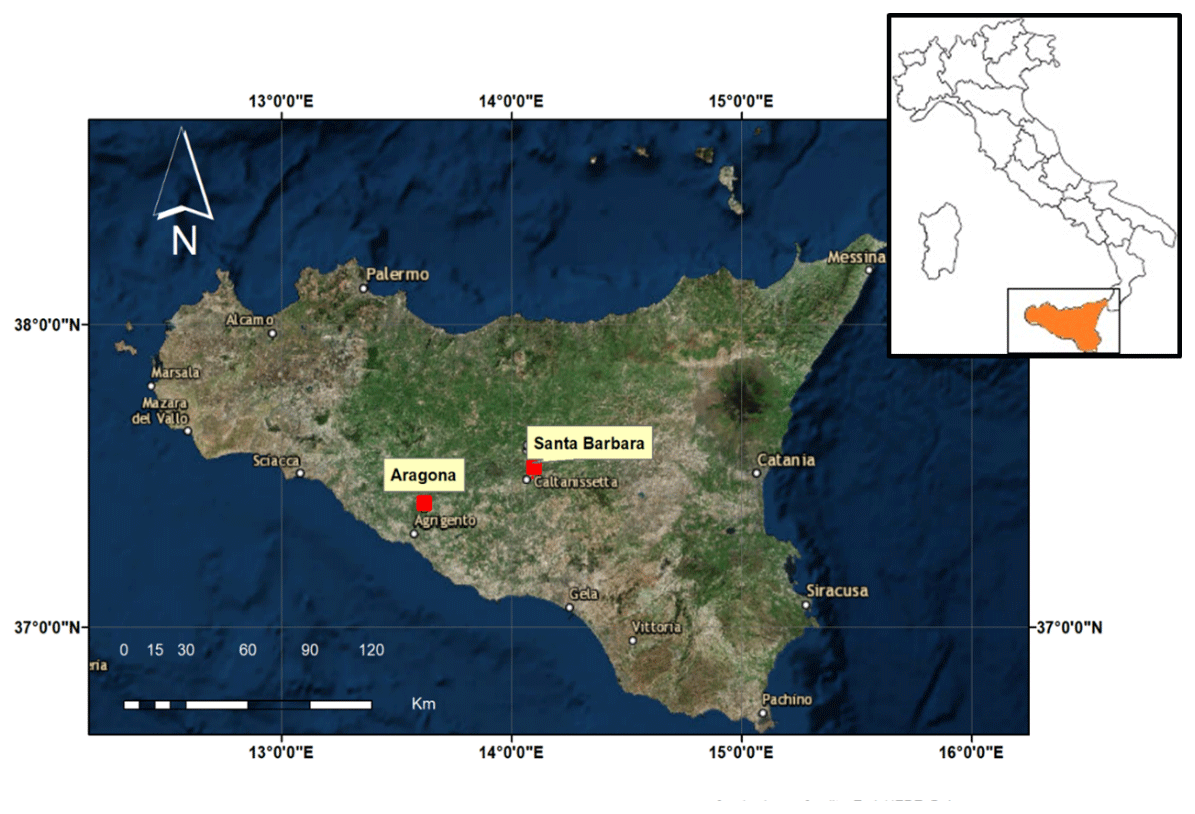
Figure 1Location of the two investigated mud volcano areas: Santa Barbara (Caltanissetta Province) and Aragona (Agrigento Province) (image from ESRI).
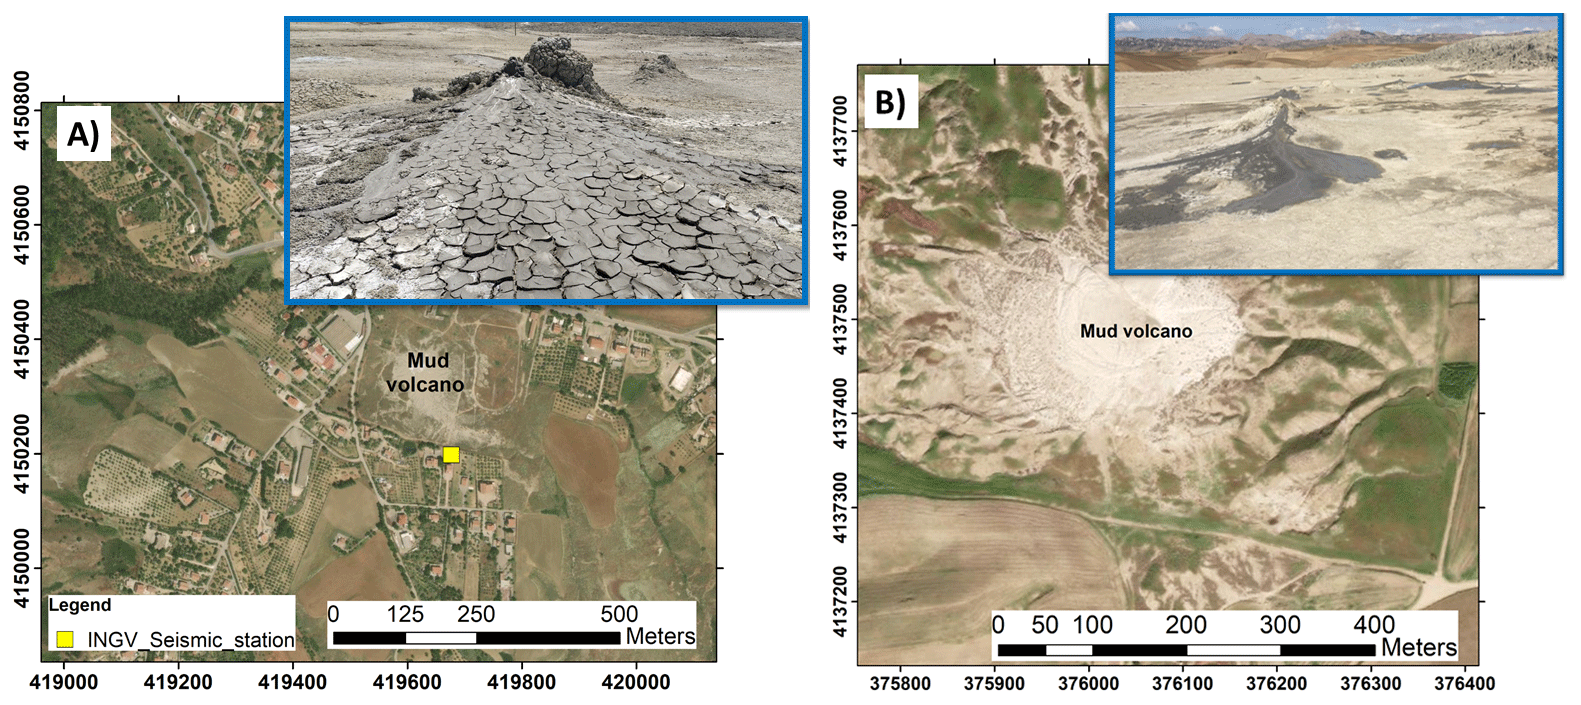
Figure 2Location of the two mud volcano areas: Santa Barbara (A) and Aragona (B). Image of ArcGis 10.5, ESRI.
Santa Barbara and Aragona MV areas are located in the central and southwest sectors of the Sicily region respectively inside the Caltanissetta Basin (locations in Fig. 1). These two areas, consisting of a Late Miocene to Pleistocene accretionary prism, were formed simultaneously with the Tyrrhenian Sea opening, during the convergence between the African and Eurasian plates in the Neogene–Quaternary (Catalano et al., 2000), reaching a deposit thickness of the order of some kilometres.
At Santa Barbara, the mud volcanism is located eastward of the Caltanissetta town, near the Santa Barbara village. The composition of its deposits consists essentially of clay, clayey marls, and sands. Around the main mud emission, in the northern sector, different residential buildings are present, which were built mainly in the 1960s. In the southern sector, 20 single-family houses are present (Fig. 2a). Several public facilities are present at the western side of the mud volcano, and electric pipelines, roads, and services for about 4000 resident people should be considered for a correct risk assessment of the entire area.
The Aragona MV area is located about 3.5 km from the town, in the SW direction. The maccalube of Aragona MV area is a beautiful natural touristic attraction over time and in 1995 was established as an integral natural reserve, today managed by Legambiente. The geology of the entire area is mainly characterised by clay deposits, clayey sands, and marls, alternating with sandstone that favours low-relief geomorphology (Fig. 2b). No residential buildings and public facilities are present around the main mud emission area, but the site represents a natural attraction for tourists. After the 2014 paroxysm, where two kids died, the entire area was closed.
Maccalube of Aragona and Santa Barbara have been affected in the past by different paroxysmal events, characterised by violent explosions of gas and mud, which periodically cause the interruption of the normal degassing activity, with a rapid emission of considerable quantities of clayey material and ballistics, accompanied by strong rambles. The paroxysmal activity, reaching a maximum column height of about 20–30 m, is generally determined by the accumulation and the sudden release of pressurised gases (mainly CH4 with 95 % vol–97 % vol) at depth. The volumes of the expelled mud during these events have reached tens of thousands of cubic metres, and consequently, after a paroxysmal event, a drastic variation in the morphology occurs. Sometimes, during historical paroxysmal manifestations, the emitted gas gives rise to suggestive manifestations like burning fountains (Grassa et al., 2012). However, MV does not only represent a relevant geological phenomenon as it also acts as an element of hazard. Therefore, the understanding of the occurrence of historic events, together with the intensities of the pre- and post-evidence associated with this phenomenon, could be a useful tool for the civil protection authorities in order to define the most probable hazard scenarios for a correct risk assessment in both study areas.
3.1 The Santa Barbara historical paroxysms
The old naturalists and geologists have described the activity of the mud volcano at Santa Barbara, since 1800, reporting some of their major paroxysmal events (Carnemolla, 2017). The first scientific document was produced in 1823, with a paper entitled “Descrizione geologico-mineralogica nei dintorni di Caltanissetta” by Gregorio Barnabà La Via, who documented one of the paroxysmal eruptions, reporting the following.
On March 5th, 1823 at 5:25 PM, the wind from the north with strong and broken turbines, the sky being clear, a few dense clouds with long stripes appeared. Five earthquakes occurred in 9 seconds without damages at factories. Going to mud volcano with the Villarosa duke, Luigi Barrile and Livolsi abbot, that observed since 1818 the phenomenon, increasing up to 50 cm the width of the cracks at the maccalube (that were 27 cm) and observing an increasing of the height of the mud volcano with a continuous emission of mud, water and hydrogen sulfide at 2.30 m height.
The Li Volsi (1826) abbot, in his study entitled “Sul vulcano aereo di Terrapilata in Caltanissetta” reported the description of the entire area of the mud volcano: “its surface is conical in shape, and at first glance offers the appearance of an extinct volcano”. According to this paper, different paroxysms occurred in 1783, 1817, 1819, and 1823 (Madonia et al., 2011).
The intense phenomena have occurred continuously over time, and there is evidence of a significant event that occurred between the years 1930–1940.
On 11 August 2008, near the village of Santa Barbara, a sudden emission of natural gas occurred, accompanied by the expulsion of large quantities of clayey material, gas, and water, reaching a maximum height of about 30 m. From the morning, the village was affected by intense phenomena of soil cracking, causing diffuse damage to civil and industrial buildings. A general uplift of the area around the mud volcano, together with the presence of variable fractures with horizontal and vertical rejections, was observed (DRPC, 2008). During the period just before the paroxysmal event, from December 2007 to August 2008, Cigna et al. (2012) recorded up to 3–5 cm of progressive movements accumulating in the direction towards the satellite with the satellite-based synthetic aperture radar interferometry method.
As a consequence of these phenomena, heavy damage to factories, roads, residential buildings, and public facilities (water, gas, electricity pipelines) occurred. The regional department of civil protection forced the evacuation of several buildings both in the southern sector of the mud volcano area at a short distance (hundreds of metres) from the MV area and at a distance 2.5 km away from the main area, where a large amount of soil deformations and fracturing occurred (DRPC, 2008).
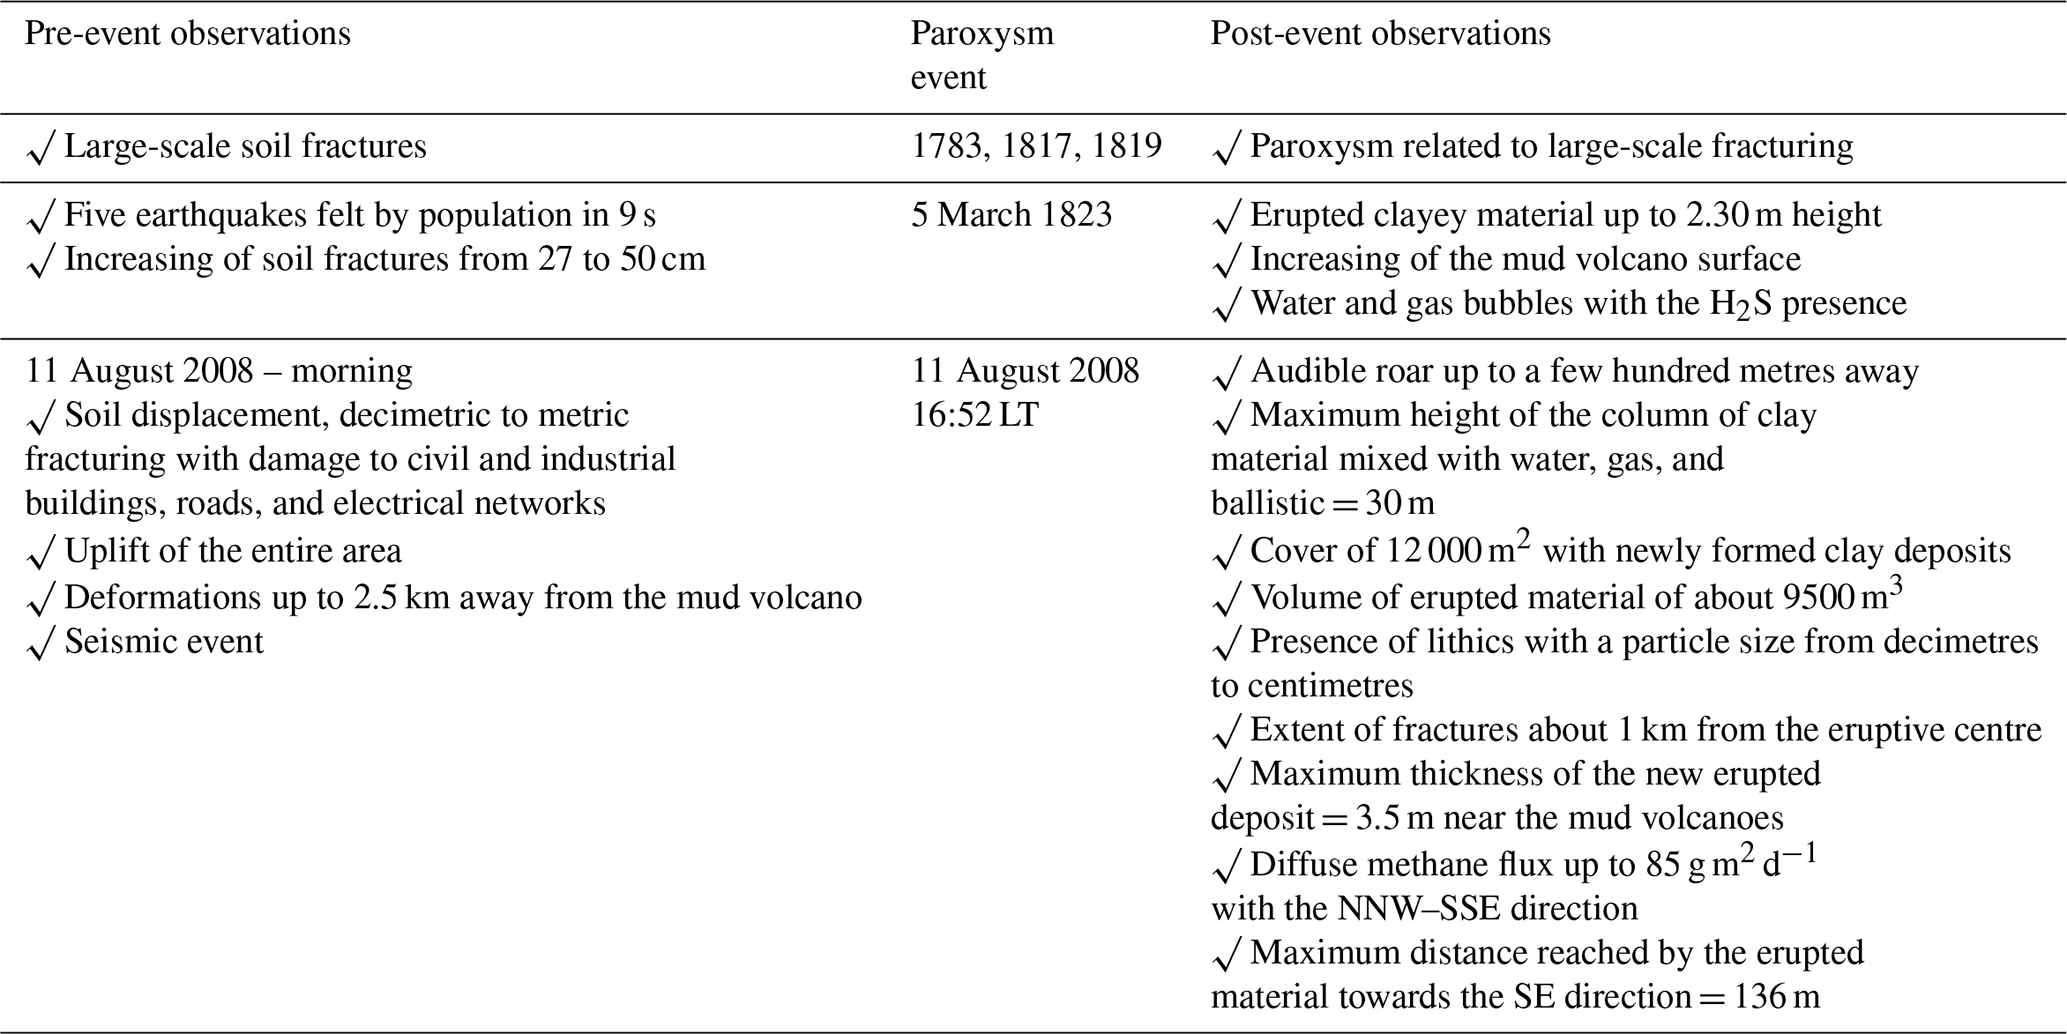
At 16.52 LT (local time) on the same day (11 August) a paroxysm occurred next to the Santa Barbara village, accompanied by strong rumble and by an about 30 m column height composed mainly by clayey material, gas, and water that covered about 12 000 m2 of the area with an estimated volume of about 9550 m3 in 7 min. The maximum width of the deposit was 3.5 m next to the emission points up to 30 cm in the SE direction, reaching a total distance of about 136 m from the main vents. The paroxysmal event lasted several minutes and was anticipated by a telluric event (Madonia et al., 2011) that occurred a few hours before in the whole Terrapelata area and, contemporaneously, in the neighbouring area of St. Anna. According to Madonia et al. (2011) in August 2008, five earthquakes occurred with magnitudes ranging from 1.7 to 2.4 in the radius of 10–55 km from the sites. After the end of the paroxysm, an increase in the length of the pre-existing fractures occurred. The main pre- and post-historical observations of these events are shown in Table 1.
Table 1Pre-historical and post-historical observations of the historical paroxysm events at Santa Barbara.
3.2 The Aragona historical paroxysms
The activity of the maccalube of Aragona, according to Greek, Roman, and Arab historical evidence, has occurred at least for 2500 years. The cosmetic and therapeutic use of the mud, emitted from these geological manifestations, has been reported by Plato, Aristotle, Diodoro Siculo, and Pliny. In 1777, the first big mud eruption (today called paroxysm) was documented by Abruzzese (1952), reporting “In the early hours of September 29th, the inhabitants of the neighbouring felt a strong shaking of the ground and observed a copious mud flow from the craters up to different heights.”
Furthermore, the Ferrara abbot described the same paroxysm as one of the most violent eruptions known.
On the September 29th they heard before a roaring noise in all the surroundings. The ground shaking around a great chasm formed up a few miles […] an enormous column of mud rose up to almost a hundred feet high, having been abandoned by the force that pushed it upward […] the terrible explosion lasted half an hour, then calmed down, but recovered after a few minutes and intermittently continued all day but the smoke lasted all night. In all the time of the phenomenon the very strong smell of hydrogen sulfide gas was felt at a great distance in all the surroundings.
An unknown author reports the same eruption on 30 September describing the following.
[…] On September 30th 1777, after half an hour when the sun had risen, a murmur was heard in the above mentioned place, which, momentarily advancing, surpassed the roar of the strongest thunders. The earth begins to tremble, and shows the deep cracks, which widened more than usual to ten palms, the main crater, from where the clay and the murky water emerged perpetually, like a cloud of smoke, although somewhere it was flame-colored […] this eruption lasted for half an hour, and, with a quarter-hour interval, replied three more times. The next day, the clay material emitted, however, appeared at the natural consistency, in such a way that it allowed the curious to approach the mud volcano. The clay material erupted still retained the smell of sulfur, which more penetrating was felt during the eruption.
On October 19th, 1936, at 5, some of Aragona and Giancaxio neighbor villages heard two rumbles, like thunders, which had followed one another in a short period of time. A violent explosion destroyed the central part of the maccalube from where an imposing fountain of mud raised, which in its ascent dragged blocks of marl mixed with sandstones and gypsum. This fountain reached ten to fifteen meters in height.
Only at the sunrise the people noticed that a large black mass had covered the place where the mud volcanoes are located for about 2 ha. From the surveys data detected by Prof. Ponte and Prof. Abruzzese, […] since February 1935 there were the presence of a soil fracture extending for about 400 m to E direction, then distancing 600 m towards the W. In March 1935, at the proximity of the fracture, several mud volcanoes arose, some of which reached a height of one meter.
The main pre- and post-historical observations of these historical paroxysms at Aragona are showed in Table 2.
Table 2Pre-event and post-event observation of the historical paroxysm events at Aragona.

Since 1995, the year of establishment of the natural reserve, eight paroxysmal events have taken place in 1998, 2002, 2005, 2008, 2010, 2012 (Fig. 3), and 2014 and the last one on 19 May 2020. Grassa et al. (2012) reported the volumes and the covered areas for each of the first six events. The largest event was in 2005, with an estimated volume of about 19 600 m3 (Fig. 3b) covering an area of about 16 350 m2 (Fig. 3a). It is interesting to note that a strong correlation exists between the erupted material and the covered surface areas for the paroxysms that occurred from 1998 to 2012 (no volume data are available for the 2014 paroxysm) as is demonstrated by the high correlation coefficient (R2=1) and shown in Fig. 3c. From the same plot, the 2020 paroxysm event falls far from the general trend previously highlighted covering a smaller surface (approximately a half) rather than the expected one. In our opinion, this could be linked to a different location of the main emissive vent, 2020 being the only eccentric event, and/or to the different nature of the emitted material.

Figure 3(a) Estimated volume and (b) interesting surfaces at Aragona mud volcanoes during paroxysmal events. (c) Correlation coefficient for erupted volume and interesting surface for the 1998–2012 events (Grassa et al., 2012, modified). Blue is the linear correlation with R2=1. The red square represents the 2020 paroxysm.
From the historical information obtained by the past documentary sources, it is clear and evident that the most hazardous phenomena existing in both areas are the paroxysms.
They are quite common, especially at Aragona, and therefore, it is likely to hypothesise that other hazardous events, with the same magnitude or higher, could repeat in the future.
In all of the paroxysmal events that occurred in the past, at both Santa Barbara and Aragona (Tables 1 and 2), diffuse soil fractures and deformations, even at considerable distances from the mud volcanism area, occurred during a pre-paroxysm period. In particular, at Santa Barbara the population felt several seismic events before the 2008 paroxysm.
Another important element that emerges from historical descriptions is that, following the paroxysms, people approaching the mud volcano areas usually detected a strong acrid smell of gas, reasonably being H2S. It could be lethal to human life if breathed in high concentrations; it is a toxic, corrosive, irritant, and colourless gas with the characteristic unpleasant smell of rotten eggs. It can cause chronic diseases of the respiratory organs through prolonged exposure even at very low concentrations; at concentrations of 200–250 ppm it can cause pulmonary edema and risk of death, while at 1000 ppm it is immediately lethal (NIOSH, 1981).
5.1 Digital surface model (DSM)
High-resolution DSM maps of both study areas were performed in 2017, while in 2020 they were only performed at Aragona MV, with a range of 0.1–0.15 m. For these surveys, we used a DJI Phantom III Professional drone (quadcopter) with a mounted 12 MP digital camera (Lens FOV 94∘ – 20 mm, Sony Sensor EXMOR , effective pixel resolution of 12.4 M). Before conducting drone mapping, we planned the flight paths and areas for each flight mission. The drone was set to take aerial photographs using “autopilot mode” with a camera facing directly downwards for hilly terrain. The surveys were conducted with the camera mounted 90∘ sideways. We selected 75 % forward and sideways overlap of images.
The acquisition of field data requires the determination of several control points on the ground, known as GCPs (ground control points). Therefore, 11 points distributed within the defined area were recorded using a GPS NAVCOM SF-3040 with angular accuracy of 1 cm.
The images were processed with a structure-from-motion (SfM) and multi-view stereo approach, in order to produce a high-resolution DSM (digital surface model) and to identify the morphological structures linked to the sedimentary volcanic activity. These approaches allow the geometric constraints of camera position, orientation, and GCPs from many overlapping images to be solved simultaneously through an automatic workflow. The image datasets were processed with the software Agisoft Photoscan (Agisoft, 2016). The post-processing of the acquired data merged in GIS software (ArcGIS 10.5) allowed the extrapolation of the thickness and the volume of the erupted material, with its reached distance.
5.2 Hazard assessment
In order to define the potential paroxysm hazardous scenarios for both areas, in this paper, we consider the maximum real distances reached by the erupted material over time through the analysis of the high-resolution (12×12 cm) DSM acquired by the drone during the 2017 surveys in the Aragona and Santa Barbara areas.
At the Santa Barbara mud volcano, the erupted material reached a total distance along its major axis in the main event of 2008 of about 136 m, while at Aragona, it reached a total distance of 150 m. In the 2014 paroxysm event at Aragona, the distance reached by the erupted material was 111 m (Fig. 4).
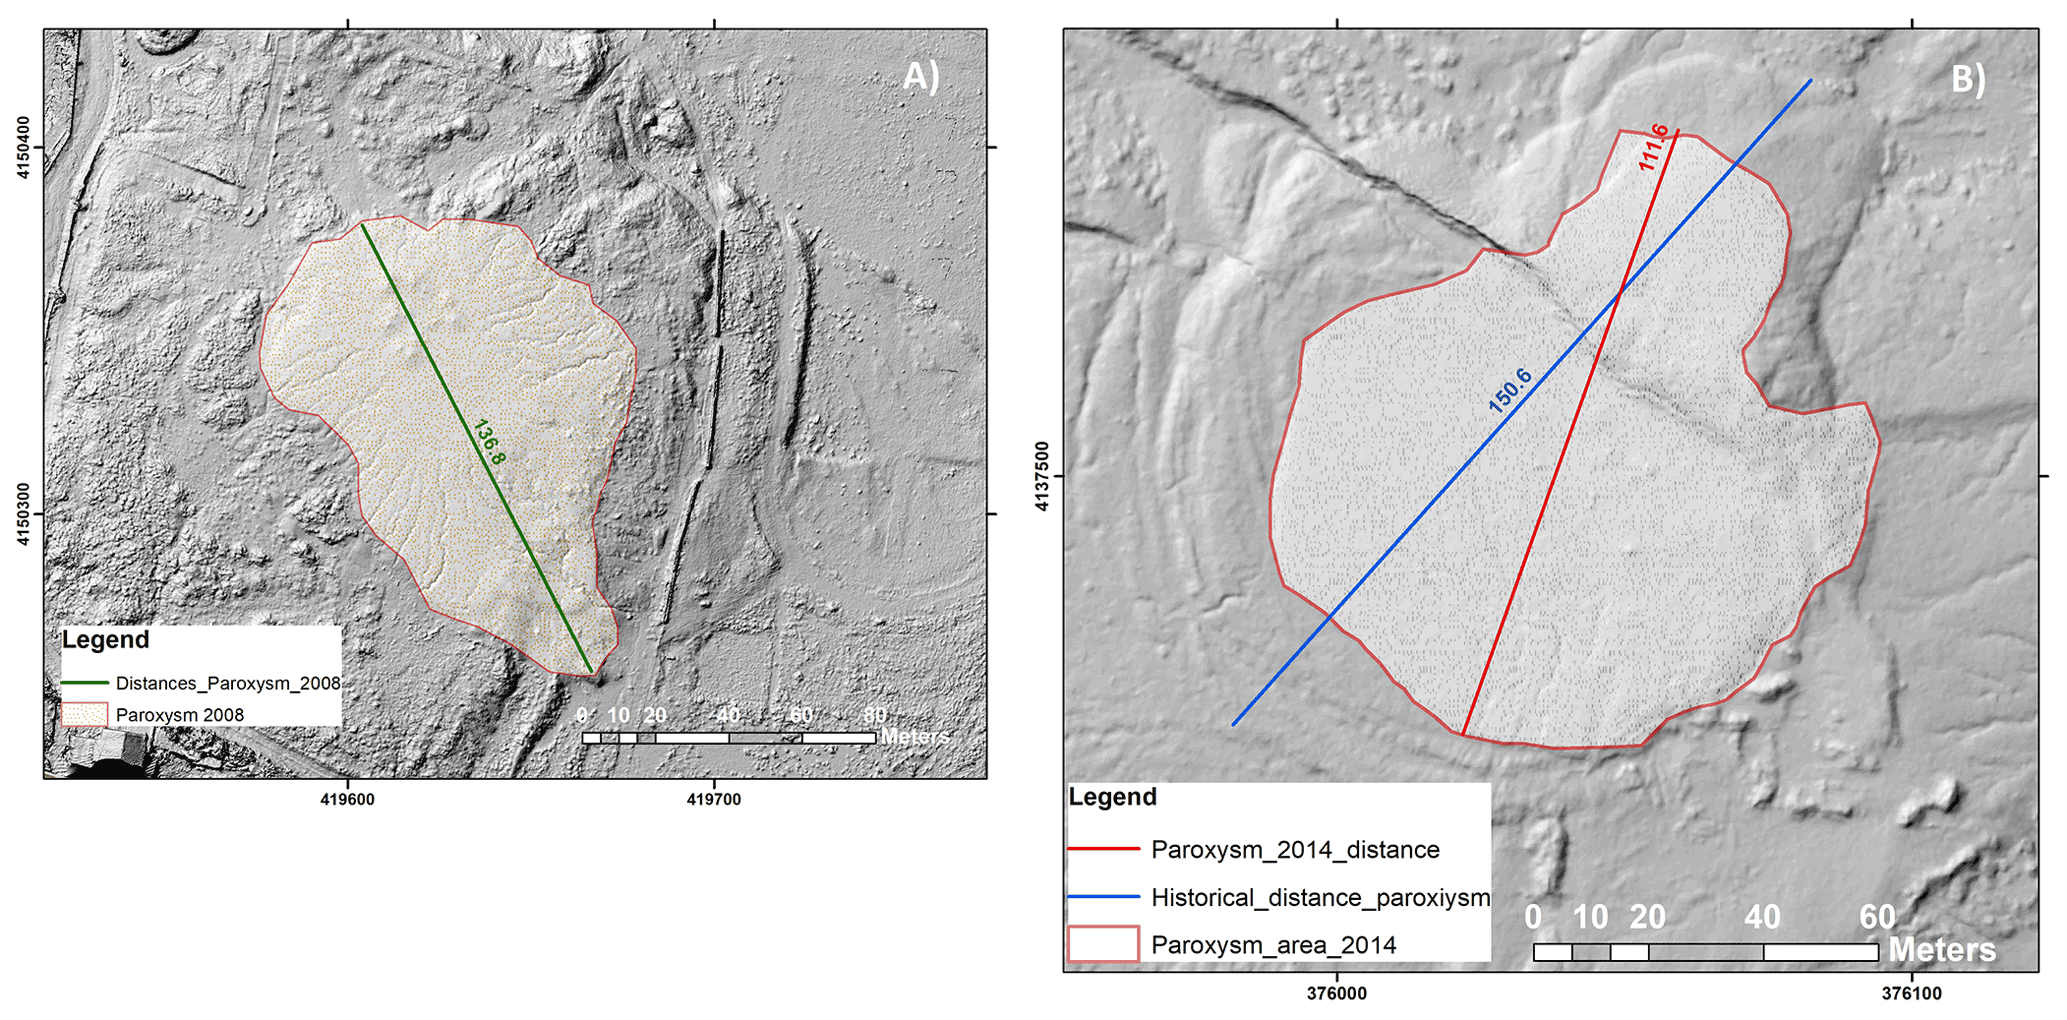
Figure 4Historical distances reached by the erupted paroxysm material: (A) Santa Barbara and (B) Aragona (source: 2017 DSMs in ArcGIS 10.5).
In both areas, according to the historical sources, the maximum estimated erupted column height is in the range of about 20–30 m. During the 2008 paroxysm, the erupted clay material fallout at Santa Barbara covered an area of about 9000 m2 with a maximum thickness of about 3.5 m next to the emission points, while at Aragona, during the 2014 ones, the affected surface was 7525 m2.
In this preliminary phase, in order to model the potential hazard scenarios, we assumed that both areas, in the future, will be affected by similar erupted fallout deposits that reach maximum distances of 136 and 150 m for the Santa Barbara and Aragona areas respectively.
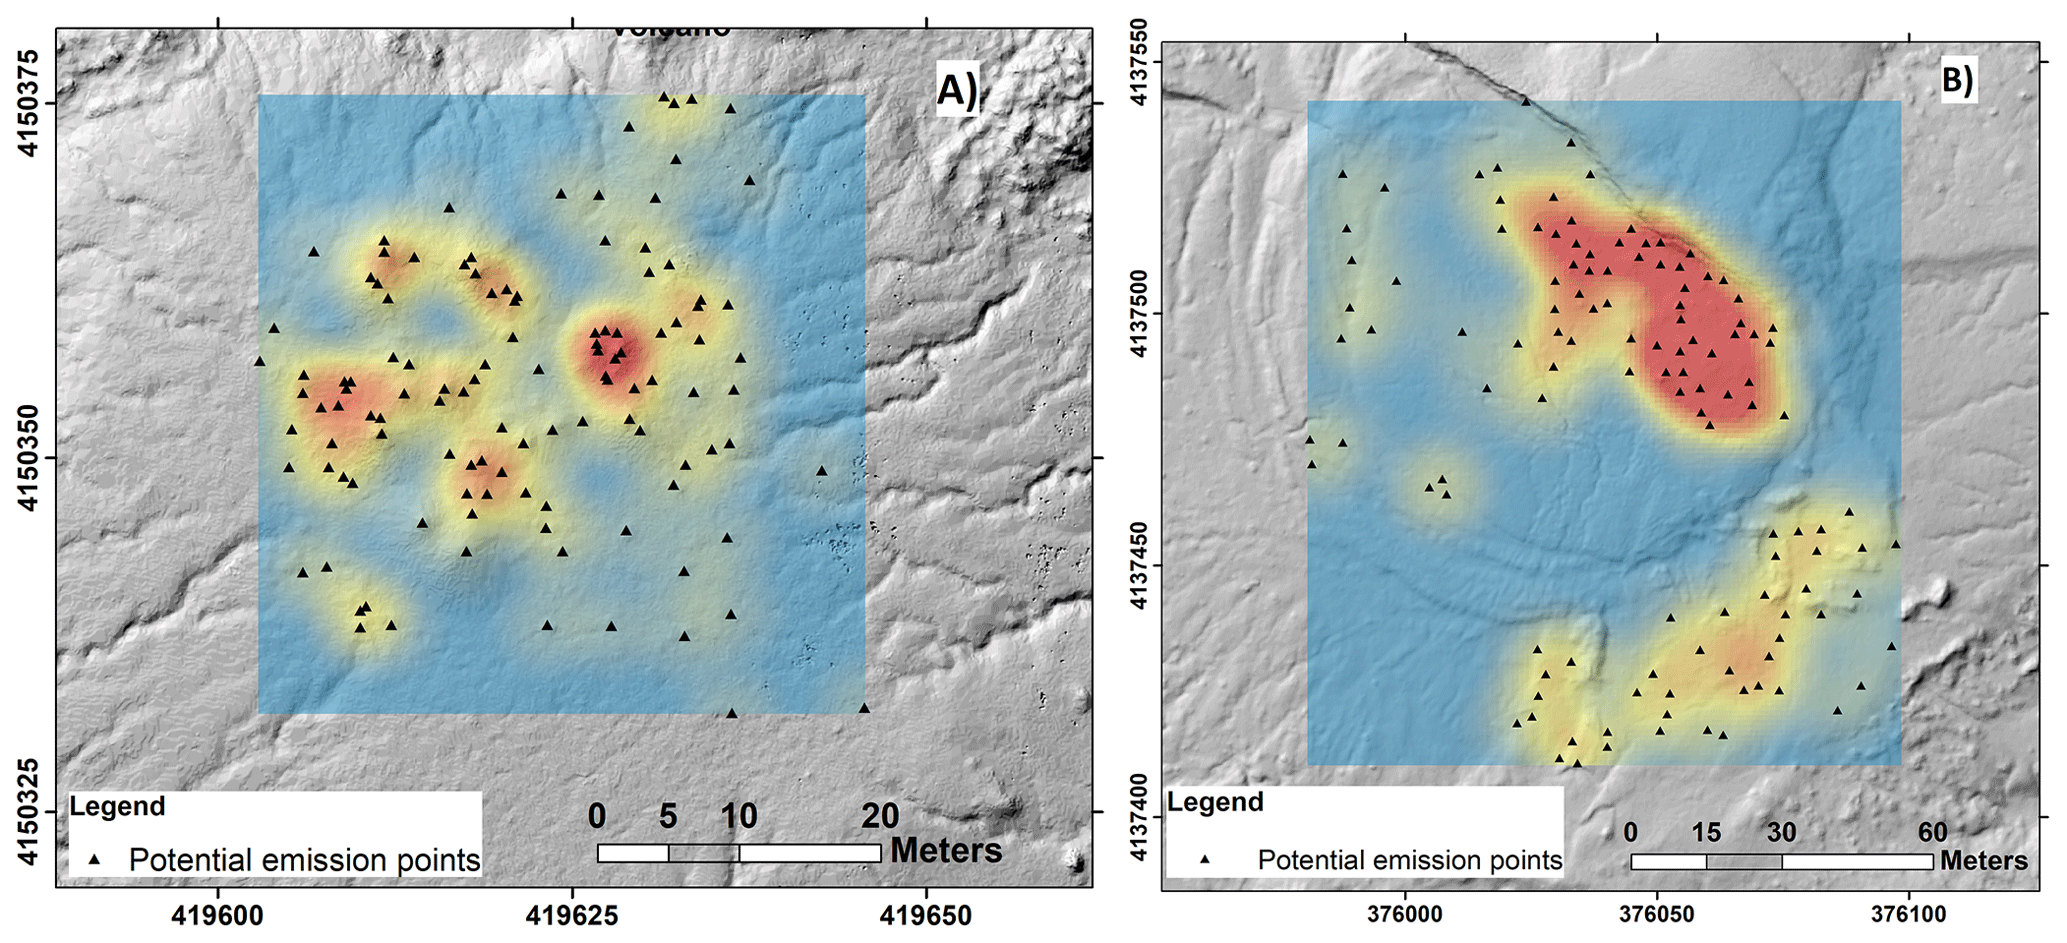
Figure 5Density maps of the potential emission points investigated. Red: high-density values; yellow: low-density values. (A) Santa Barbara MV area and at (B) maccalube of Aragona (source: 2017 DSMs in ArcGIS 10.5).
For these reasons, starting from our 2017 DSM, we identified the mud volcanoes and bubbling pools in both areas (Fig. 5) as the potential emission points for generating a future paroxysmal event. By using the kernel density tool in ArcGIS 10.5, we defined different cluster maps (Fig. 4), with two main directions, mostly highlighting the NW–SE and NE–SW directions at Aragona (Fig. 5b), while, at Santa Barbara, the distribution at the surface seems to be inhomogeneous (Fig. 5a).
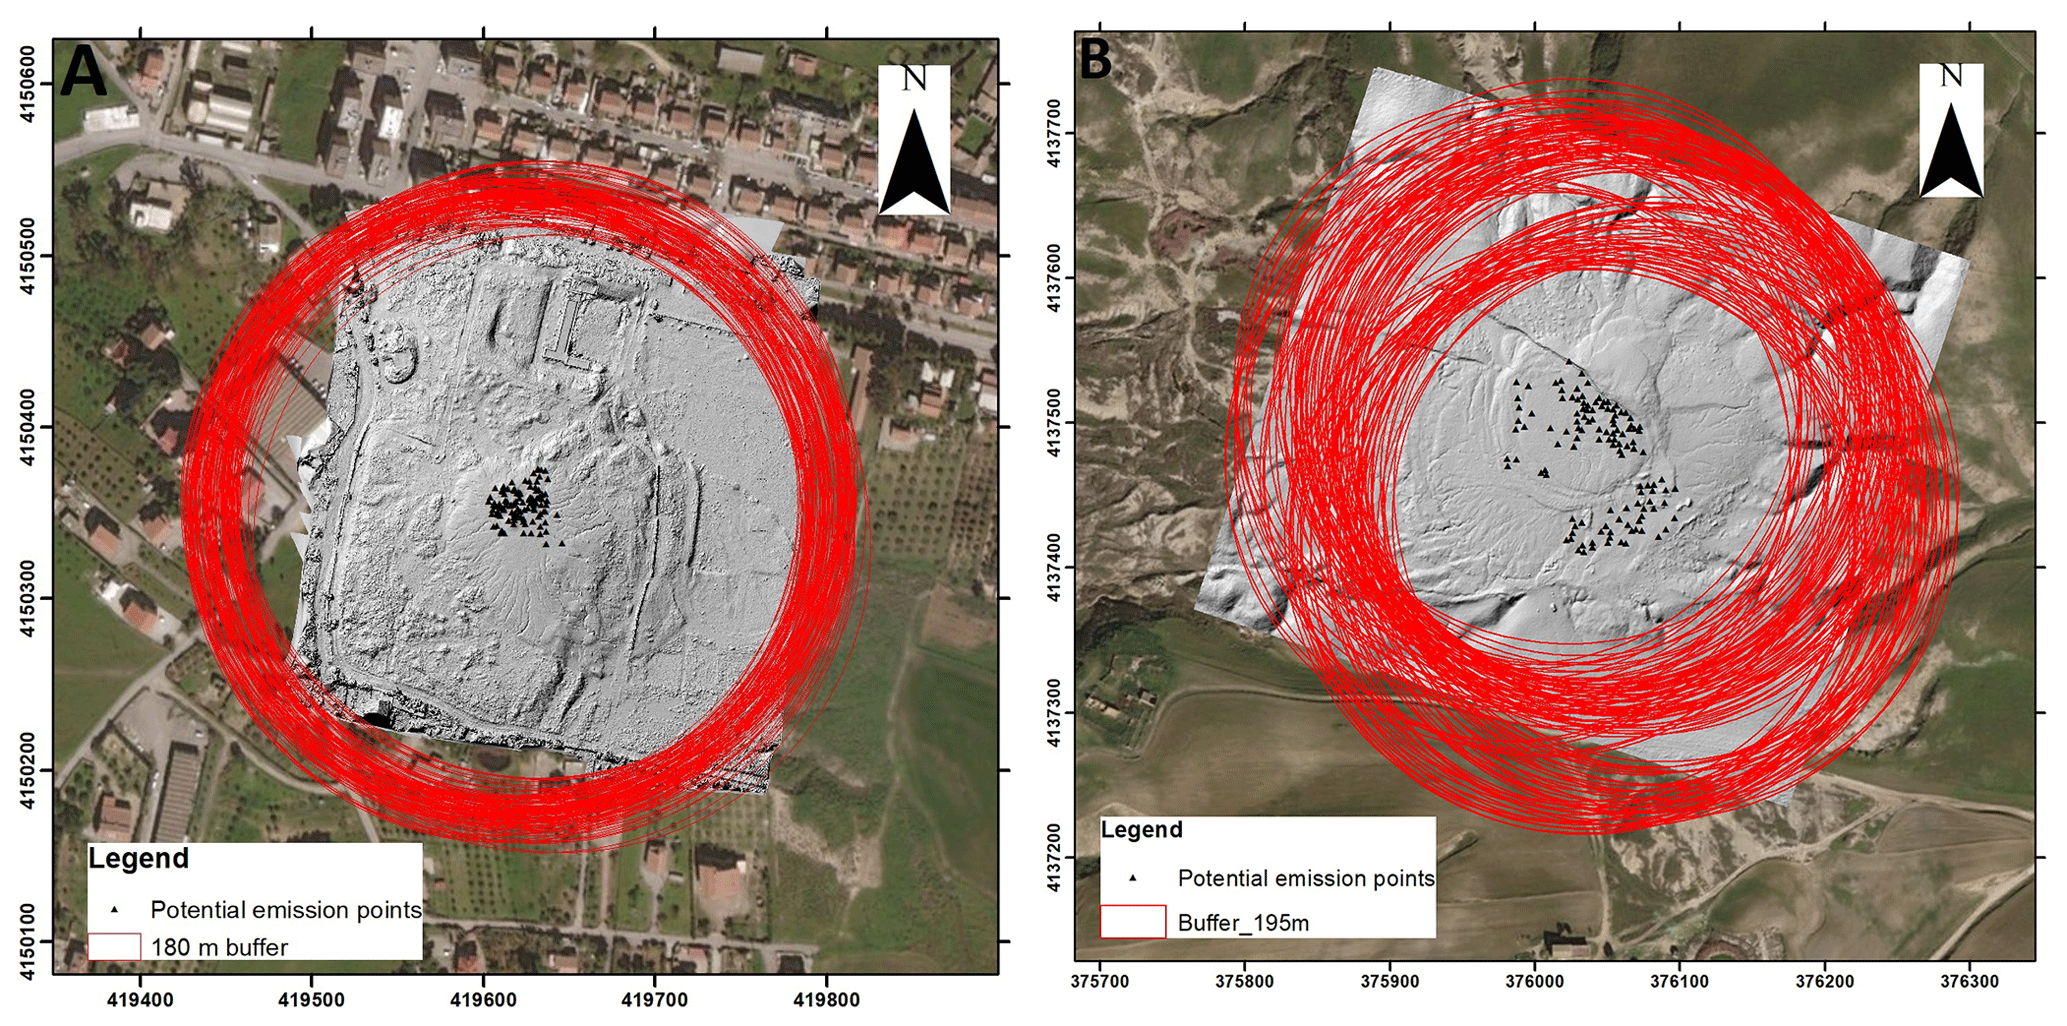
Figure 6Buffer circumferences in ArcGIS 10.5 in the Santa Barbara (A) and Aragona (B) mud volcano areas (source: 2017 DSMs in ArcGIS 10.5).
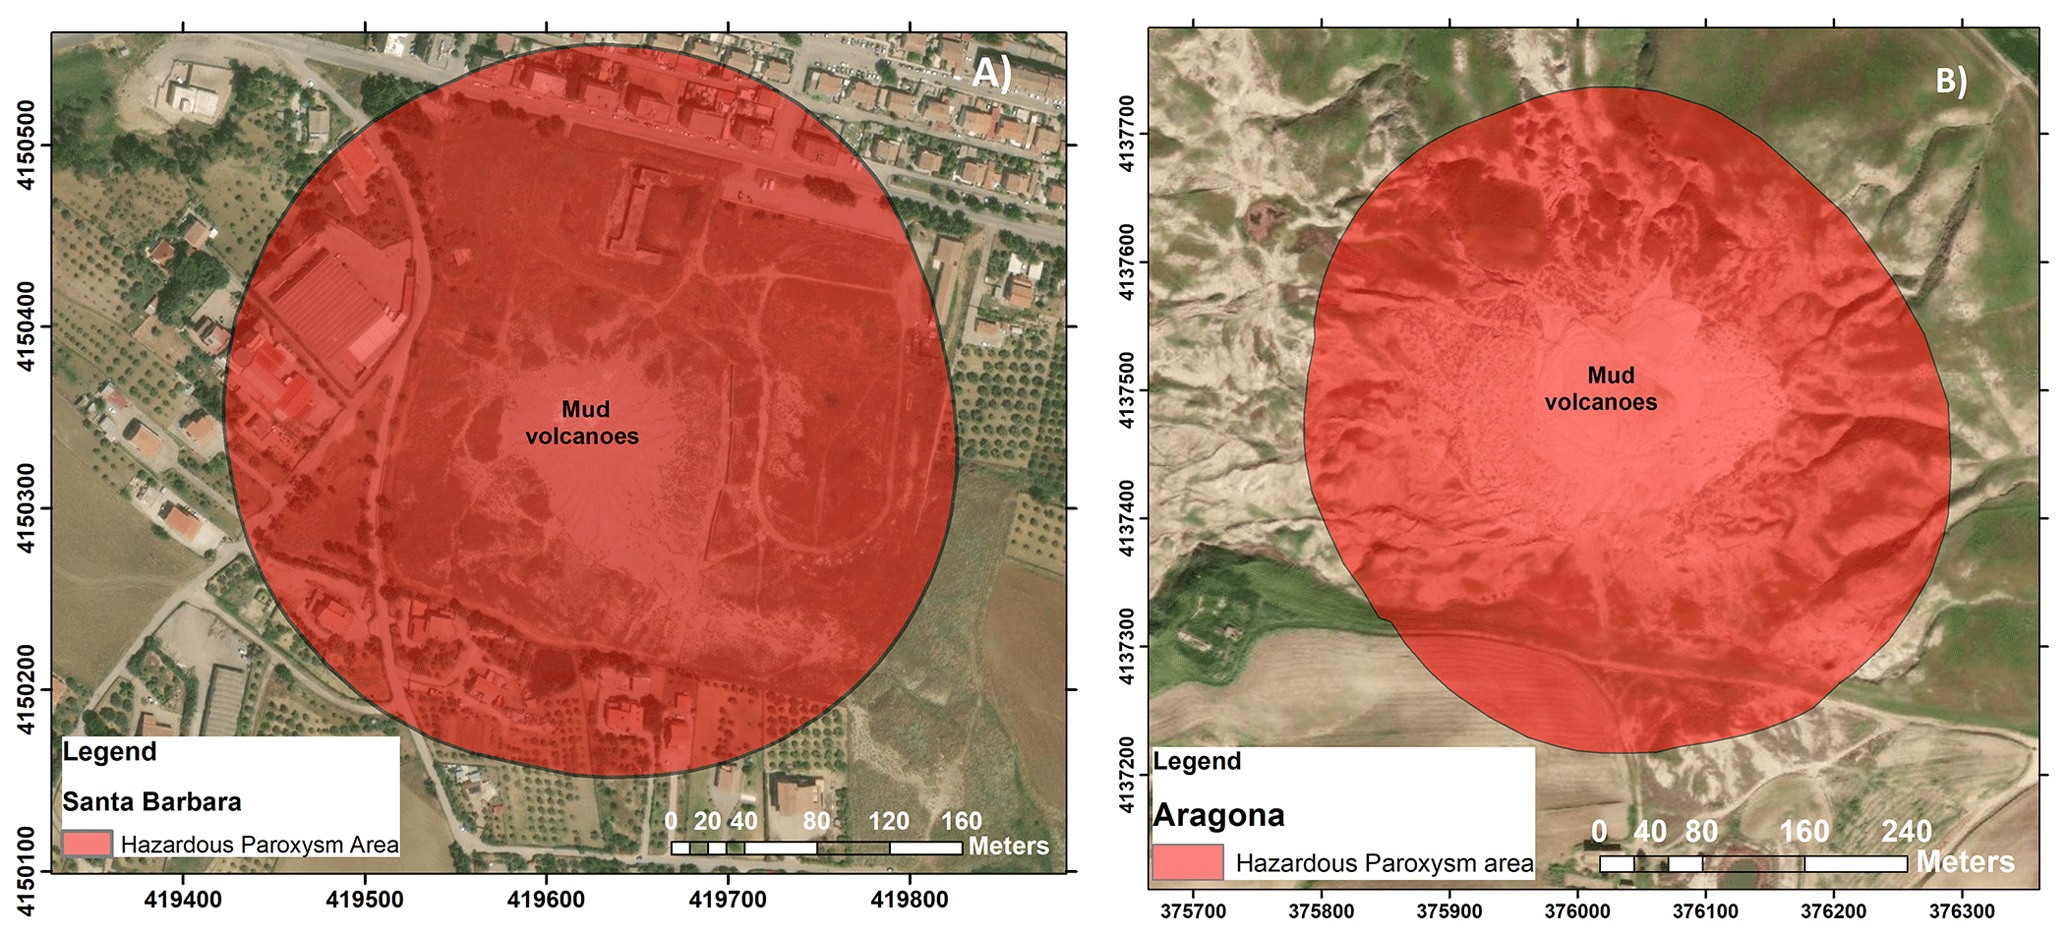
Figure 7Hazardous paroxysm areas in ArcGis 10.5 for the Santa Barbara (A) and Aragona (B) mud volcano areas (source image from ArcGIS 10.5, ESRI).
Secondly, through the elaboration in ArcGis 10.5, we created different omnidirectional buffer circumferences from each emission point checked in 2017, considering an increase in distance of +30 % with respect to the greatest historical distance reached, due to the creation of the safety limits in both areas. For the hazard assessment, we elaborated 117 and 165 buffer circumferences with a radius of 180 and 195 m at Santa Barbara and at Aragona respectively (Fig. 6a and b).
The final potential paroxysmal hazardous areas, in both areas, are considered to envelope the entire buffer circumferences elaborated (Fig. 7).
5.3 Uncertainties
The application of the methodology for the hazard assessment in both study areas, inevitably, is based on assumptions which could give us some uncertainties. At the same time, the absence of a modelling approach for the paroxysm events at both study areas and the poor availability of data from all the past events follow a semi-quantitative approach for the hazard definition. The digital surface model elaborated on 2017 was used in ArcGis 10.5 to calculate, with some uncertainties, the maximum distance reached by the erupted fallout materials. The emission points checked in 2017 at Santa Barbara and Aragona may change the location over time due to their constant evolution, also depending on the seasonality, on the weather conditions, or on new deposition of the erupted clay materials.
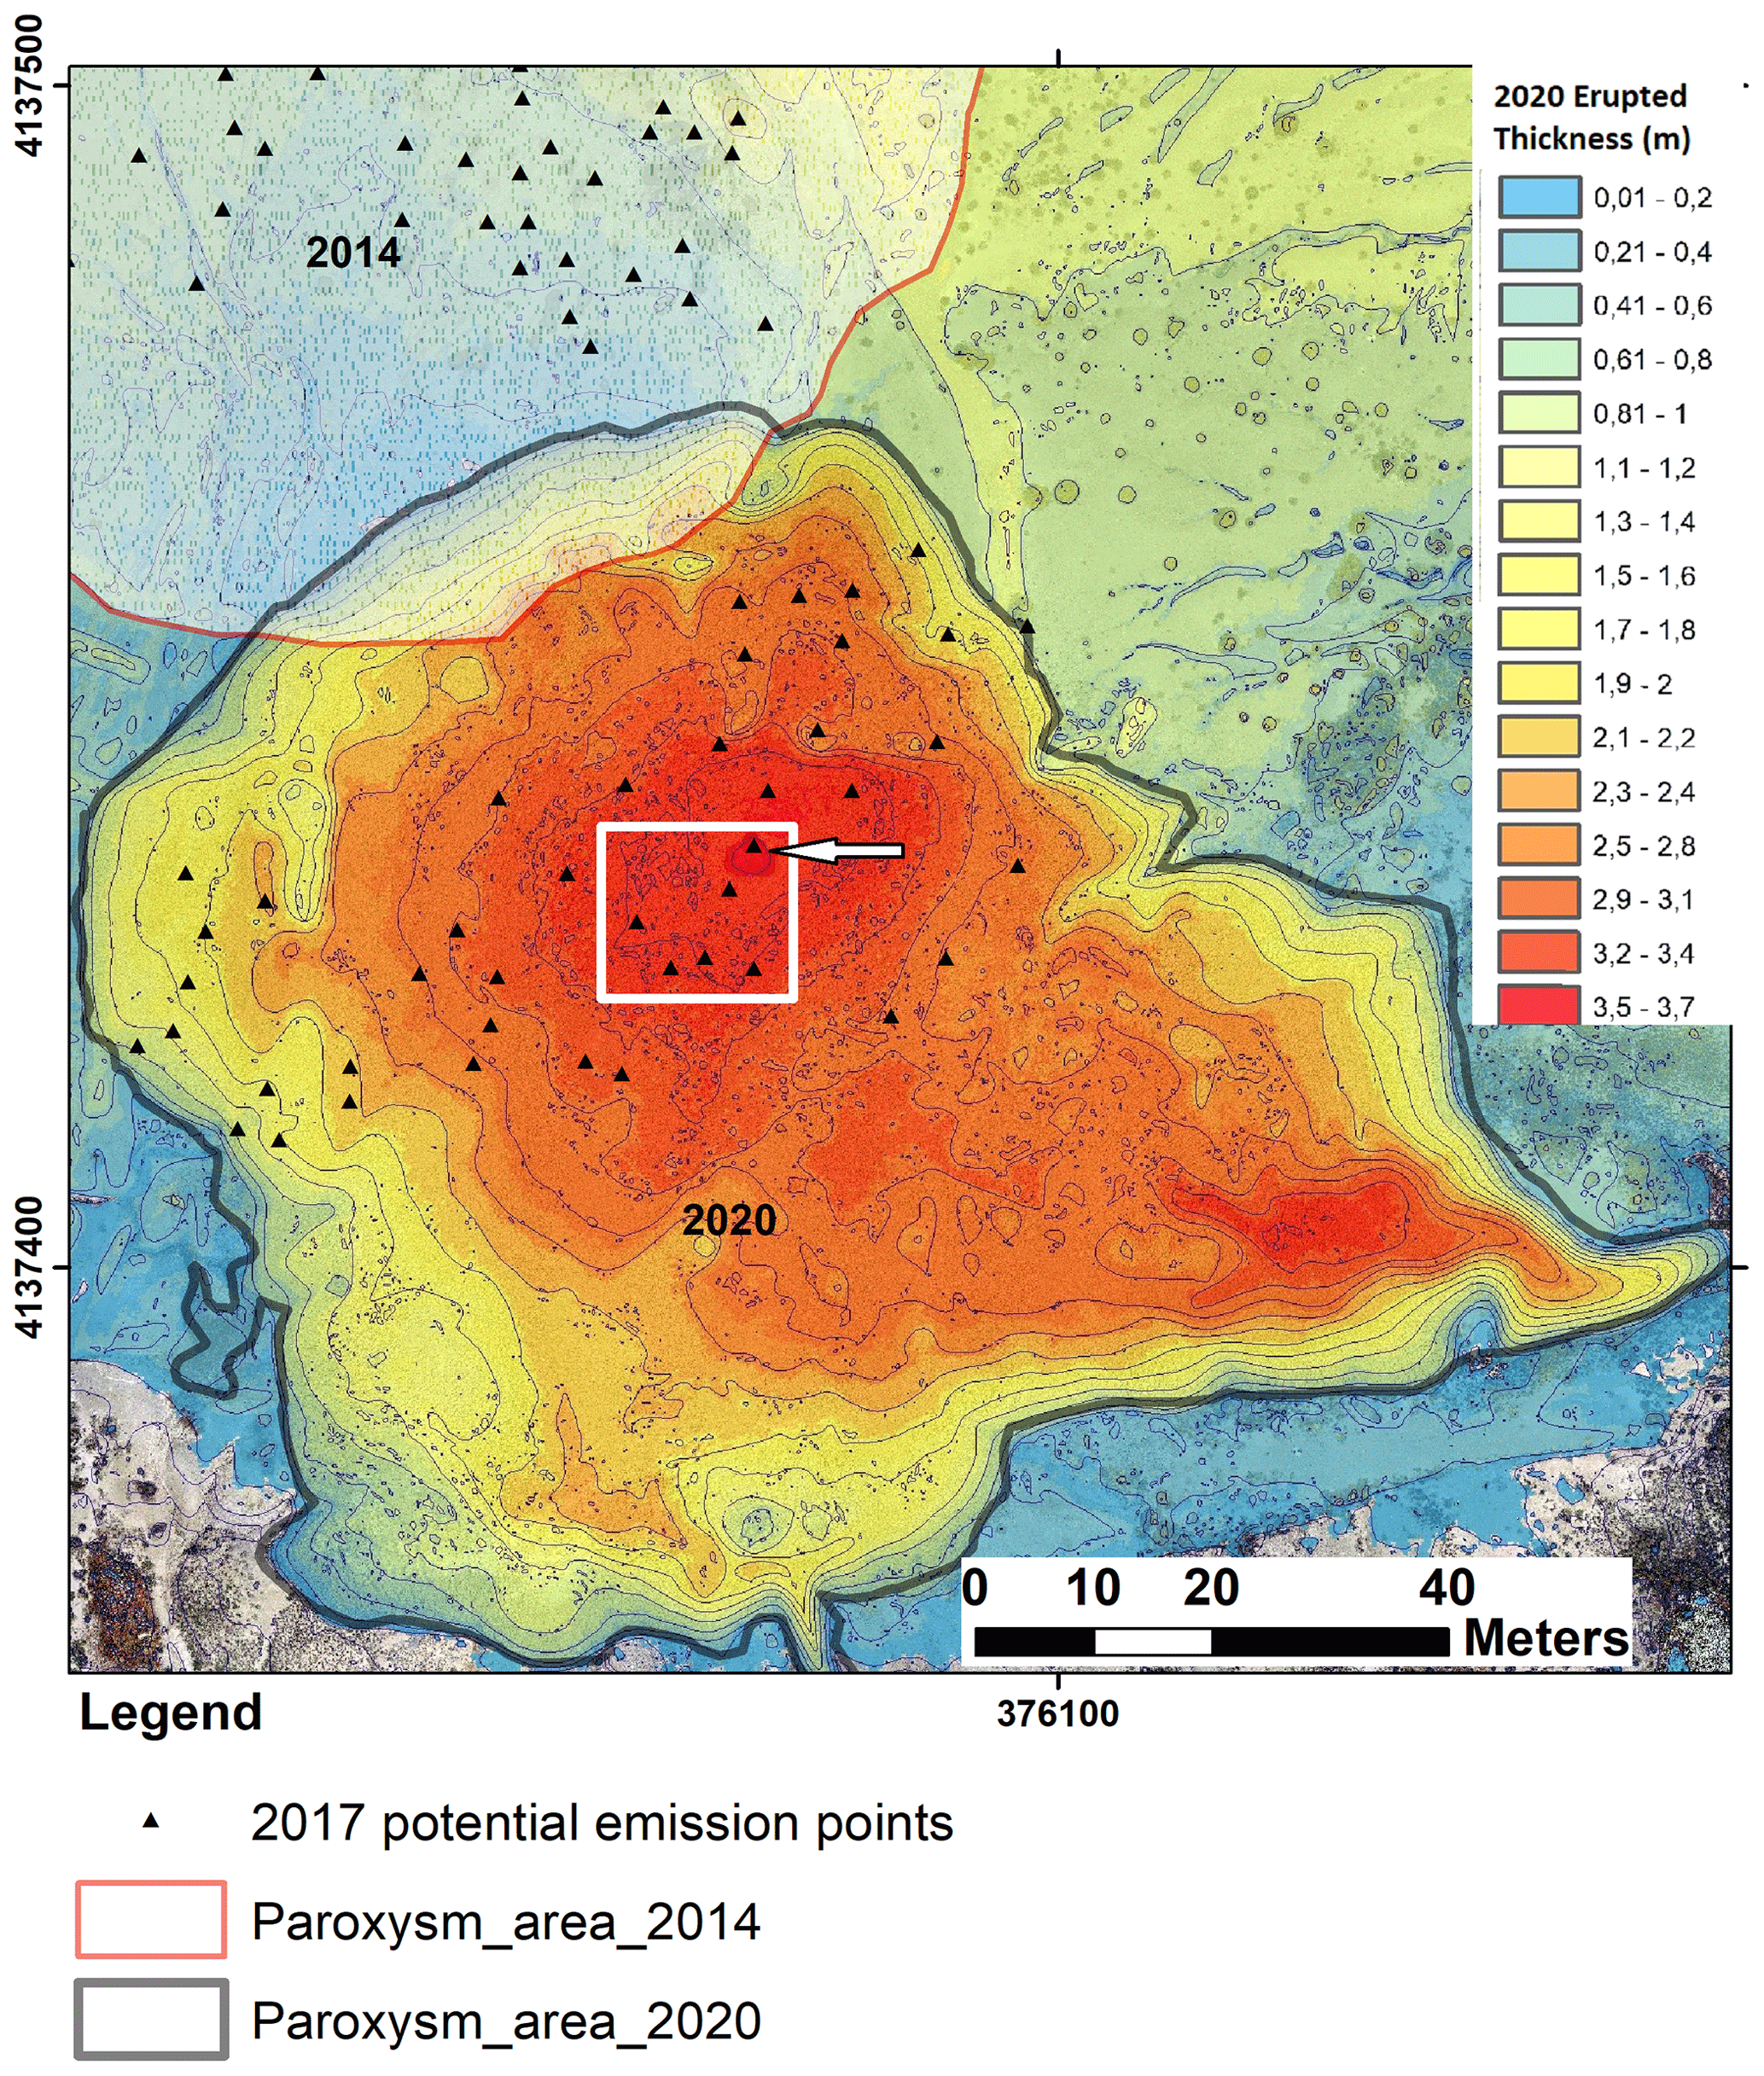
Figure 8The 2020 thickness map for the erupted materials, due to the paroxysm event of 19 May. Inside the white square is the emission point detected in 2017, corresponding to the main centre for the 2020 paroxysm (source: 2020 contour map in ArcGIS 10.5).
5.4 Seismic monitoring activity at Santa Barbara
Since October 2017, a seismic INGV station has been installed at Santa Barbara (see Fig. 2 for location). It was equipped with a Lennartz 3D-LITE/1s short period velocimeter, with flat response in the bandwidth 1–80 Hz, and a 24-bit seismic data logger RefTek 130 model. To take full advantage of the sensor frequency band, the sampling frequency was set at 200 Hz, while the signals were synchronised via GPS.
6.1 Paroxysm hazard assessment
The hazardous paroxysm areas for both areas were created through the envelope of all buffer circumferences of Fig. 6. An area of 0.12 nd 0.20 km2 potentially exposed to possible paroxysmal events was calculated for the Santa Barbara and Aragona sites respectively (Fig. 7). In these two hazardous paroxysm areas, different geophysical phenomena as well as deformation, fracturing, and seismic events together with geochemical ones could occur. For that reason, these two exposed areas should be closed to visitors and residential and public activities, due to the correlated hazardous phenomena that could occur before, during, and after a paroxysm event. In both areas, a dedicated safe path, outside the hazardous paroxysm areas of Fig. 7, should be created in order to permit the safety observations of these geological phenomena to visitors.
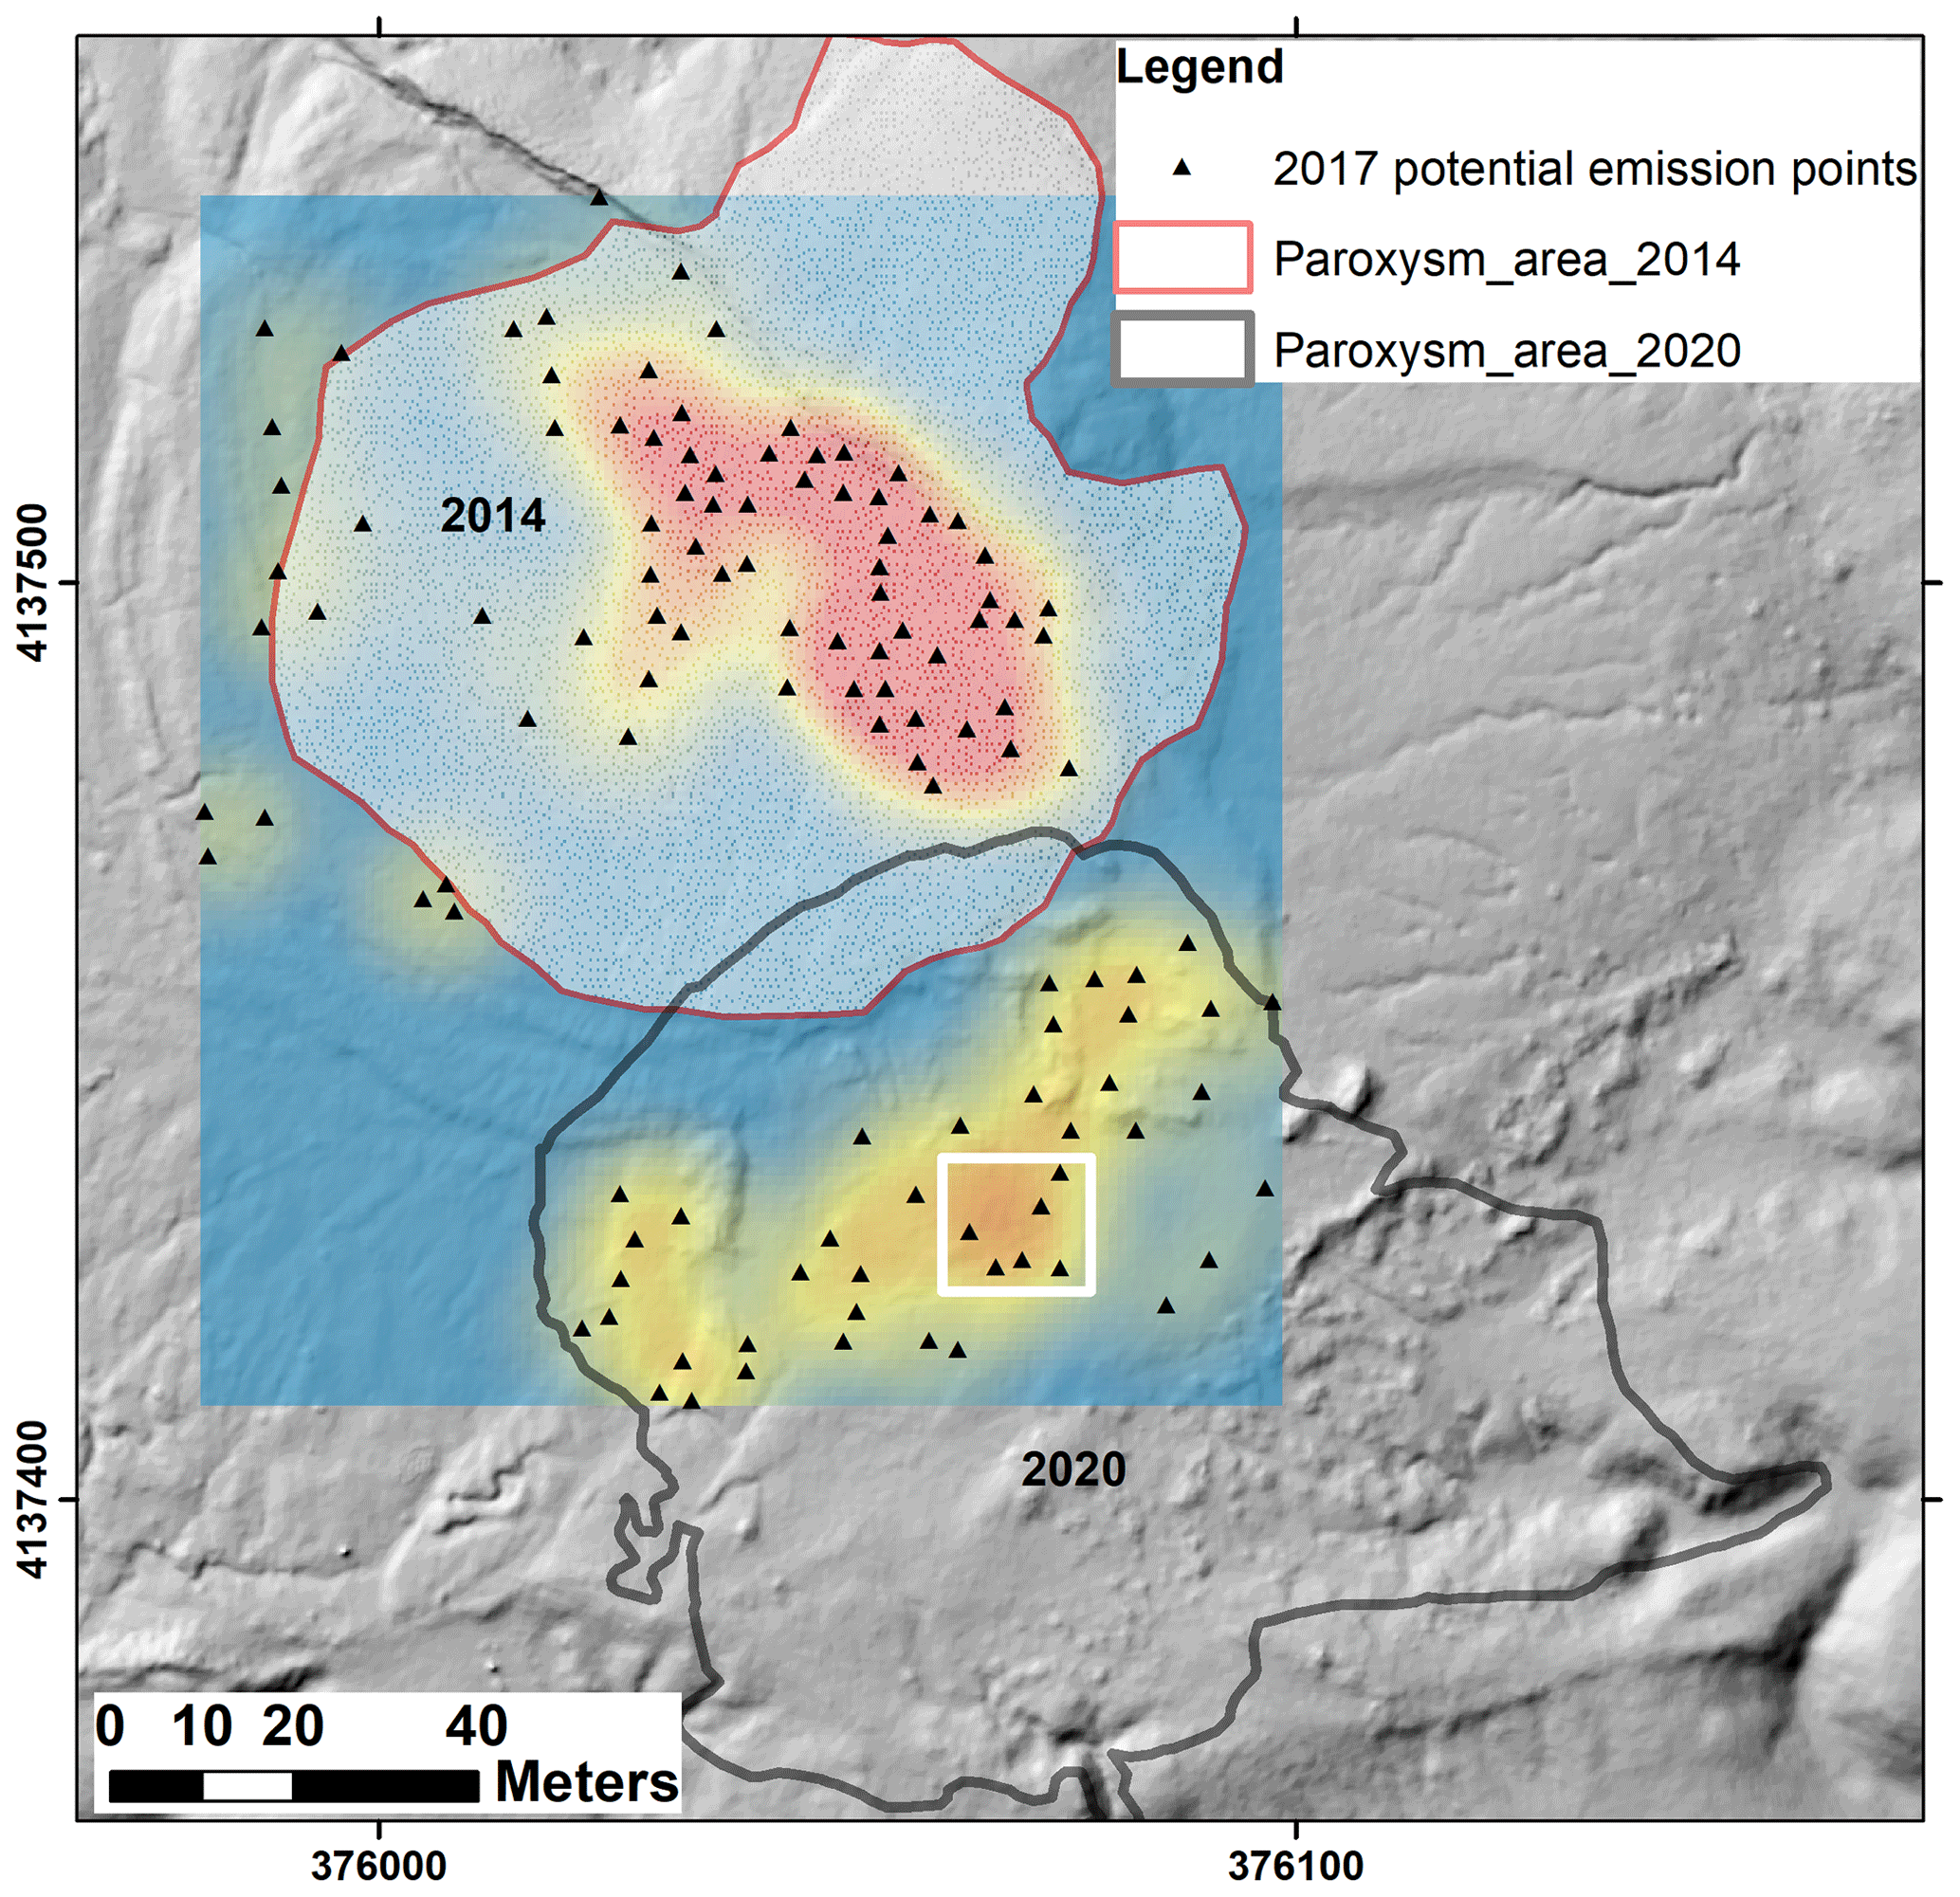
Figure 9Density maps for the 2017 emission points (red: high density; yellow: low density). The covered surface area for the 2014 and 2020 paroxysms is shown with red and grey lines respectively. In the white square are the 2017 emission points, likely responsible for the new 2020 paroxysm event (source: 2017 DTMs in ArcGIS 10.5).
The decrease in the gas output in the central area of the maccalube of Aragona before the paroxysmal events could be an important parameter. It may occur, according to Grassa et al. (2012), due to the increase in the tectonic stress field in the compression regime, generating an overpressure of the interstitial pore fluids at depth while, on the surface, it reduces the permeability of the structural discontinuities along which the gases migrate, thus reducing the outgassing at the surface. The paroxysmal event would occur, according to these deductions, when the gas pressure at depth exceeds the lithostatic pressure resistance opposed by the overlying rocks.
6.2 The 2020 paroxysm at Aragona
On 19 May 2020 at around 14:00 LT a new paroxysmal event occurred at the Aragona MV area. This violent paroxysm occurred in the southeastern part of the main emission area, emitting a mud volume of 18 196 m3 and covering a surface of 8721 m2 with a maximum thickness of 3.7 m (Fig. 8).
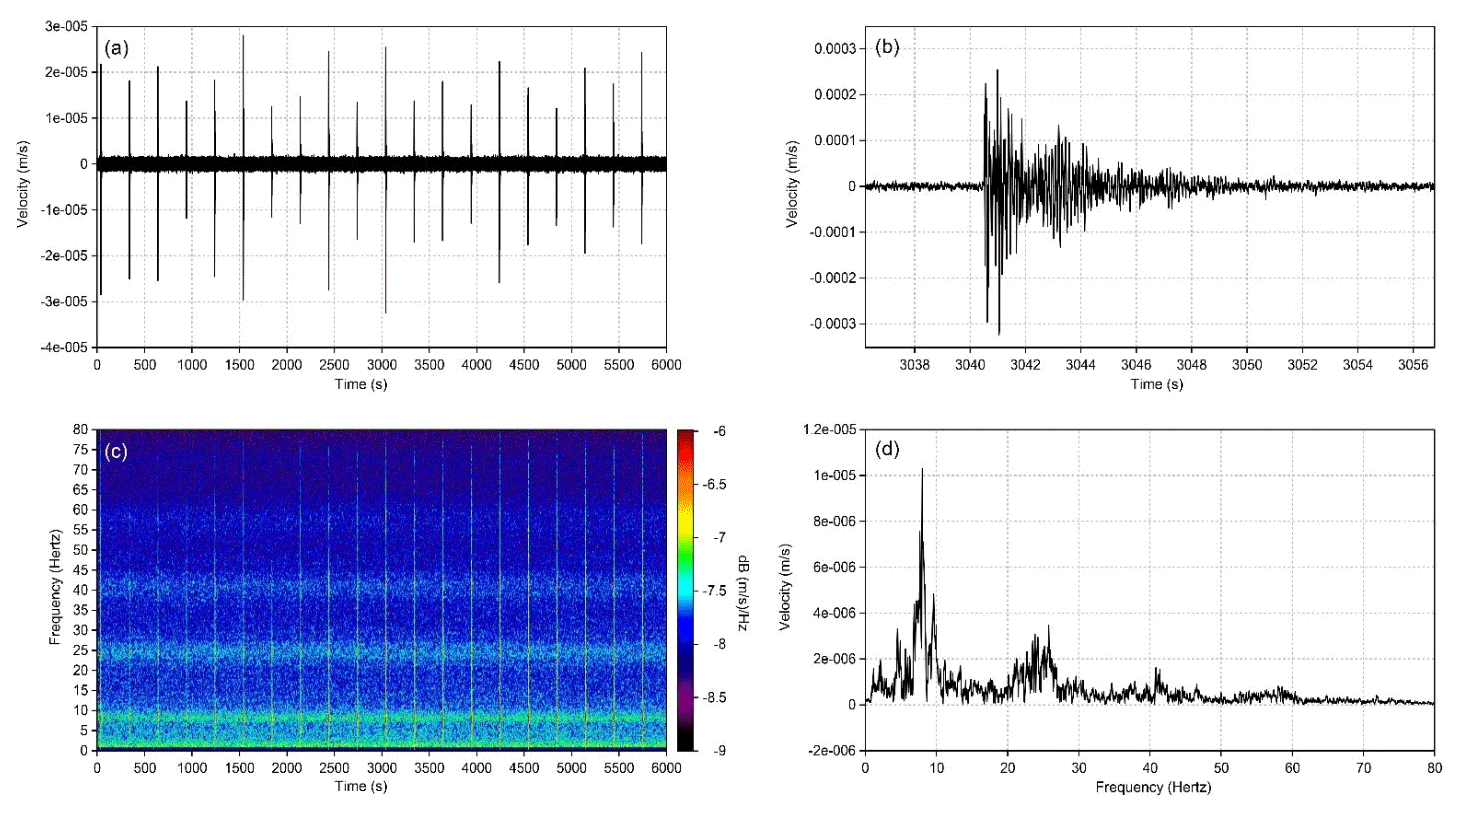
Figure 10Example of micro-seismicity record by the seismic station installed at Santa Barbara: (a) time signal relative to some minutes of the vertical component (velocity) record and (b) zoom on a single waveform with relative spectrogram (c) and amplitude spectrum (d). The spectrogram allows us to highlight the presence in the ambient noise of a continuous energy band in the frequency range 5–10 Hz and some possible overtones. The same frequencies can be identified in the amplitude spectra of the micro-events, suggesting a possible link to local resonance phenomena.
The maximum distance reached by the erupted materials, according to our analysis, is around 130 m. The 2020 paroxysm occurred in a medium–high-density area of emission points detected from our 2017 survey, where a NE–SW structural lineament has been highlighted (Figs. 5 and 9). In particular, the eruptive centre for the 2020 event is located, according to our thickness map of Fig. 8, where the maximum is recorded (arrow in Fig. 8) and where, in 2017, the emission points were mapped. Today, the 2017 emission points have been buried by the 2020 new erupted material.
6.3 The seismic monitoring at Santa Barbara
Preliminary analysis of the continuous recordings allowed the identification of variations in the power of the ambient vibrations, mainly in the frequency range 5–10 Hz, which could be due to changes in the emissions activity. Periods of intense activity have also been observed as shown in Fig. 10. These periods are characterised by numerous micro-events with high-frequency content (several tens of hertz). This micro-seismicity, of clear local origin, appears to have energy/temporal characteristics similar to a swarm, that is comparable energy of events and stable temporal interdistance from seconds to several minutes. Both ambient noise and seismic events show energy in the frequency range 5–10 Hz, with some possible overtones that could be generated from local resonance phenomena. This activity could be related to the surface effect of resonant gas bubbles, but we cannot rule out the possibility of a deep origin connected to gas flows at the root of the “volcanic” system.
In this paper, for the first time, a preliminary hazard assessment of two main mud volcanoes area of Sicily was evaluated. We calculated the hazard scenarios based on the most recent paroxysm events at Santa Barbara and Aragona, in order to define a realistic dimension for a correct risk assessment. It is evident that the hazardous paroxysm areas that we have computed should be implemented with a probabilistic modelling approach, deriving from the real measured parameters on both areas. For these reasons, it should be important to implement in terms of acquisition frequency as well as the number of parameters, the actual discrete multidisciplinary surveys, with a new technological geochemical and geophysical observatory, in order to minimise the knowledge gaps in these two areas. In light of this, therefore, it is appropriate to realise and maintain a high-frequency multidisciplinary data acquisition system to allow the construction of a forecast model able to best represent the real conditions and, on the basis of which, a monitoring system should be implemented.
Today, it is impossible to define “when” the next paroxysm will occur and how intense it will be. This is because currently there is not enough information to recognise the parameters that could potentially change before a paroxysm, and a modelling approach of the phenomenon does not exist.
In this work, our hazard assessment for the Santa Barbara and Aragona areas represents a picture of the 2017 survey. The emission points, checked in 2017, could change their location over time. It is therefore appropriate, in light of this, to monitor the new emission points and fractures at both sites, as potential sources of future paroxysmal events, as demonstrated in 2020 at Aragona where the paroxysm occurred in an emissive point, mapped in our 2017 survey.
It is important to underline that we cannot exclude that these paroxysmal events could occur outside of the restricted area in which most of the emission points are located at the surface. At the same time, an update of the actual hazard maps for the two areas must be implemented. However, a better comprehension of the sedimentary volcanism paroxysmal processes is needed, with particular reference to their hazard assessment; it is certainly important in a next future to build a paroxysmal event catalogue in order to be able to apply advanced assessment approaches such as the one proposed by Mellors et al. (2007).
From historical information, we know that different phenomena could occur before a paroxysm in the mud volcano areas, in particular deformations, soil fractures, and increase in seismicity.
After the paroxysmal event, according to the historical descriptions, a strong smell of acrid gas, reasonably H2S, is recorded. H2S, if breathed in high concentrations, could be lethal to human life. It is a toxic, corrosive, irritant, and colourless gas with the characteristic unpleasant smell of rotten eggs. It can cause chronic diseases of the respiratory organs through prolonged exposure even at very low concentrations; at concentrations of 200–250 ppm it can cause pulmonary edema and risk of death, while at 1000 ppm it is immediately lethal (NIOSH, 1981).
In October 2017, a short period seismic station was installed at the Santa Barbara site. The continuous monitoring and the preliminary analysis of the acquired signals allowed us to highlight variations in the power of environmental vibrations. Moreover, the presence of periodic micro-seismicity, likely due to linked variation in emissions and bubbling activity, was detected. However, the use of a single station does not allow a complete characterisation of the seismic activity, for which the creation of a micro-network would be desirable. Continuous monitoring of local microtremor and micro-seismicity, in particular before and during a paroxysmal event, could allow us to understand the source mechanisms of these events and propose useful predictive models for risk reduction.
Only with the installation of a multidisciplinary geochemical and geophysical observatory at the two study areas could we speculate to discriminate the “potential” phenomena that could occur before, during, and after a paroxysm event. For these reasons, different geochemical and geophysical parameters will have to be analysed, verified, and validated in the future.
This could be a useful tool for civil protection authorities in order to take the appropriate risk mitigation measurements for the exposed people. A safety path outside our hazardous detected areas should be considered by the local administrations, in order to reduce the risk. Finally our hazardous paroxysm areas, at both sites, should be forbidden to visitors, especially during the period where high deformation, fractures, and seismicity occur.
Requests for the collected data in this paper can be sent to alessandro.gattuso@ingv.it for metadata GIS, to fabio.pisciotta@ingv for the DSM images, and to antonino.dalessandro@ingv.it for the seismic signals of the Santa Barbara MV.
AG coordinated the paper and was author for Sects. 1 to 4, 5.2, 6.1, and 6.2. AFP and GC coordinated the 2017 and 2020 drone surveys and their post-processing image, in Sect. 5.1. AD coordinated the installation of the seismic station and the signal analysis in Sects. 5.4 and 6.3. FG contributed mainly to the Sect. 3.2 for updating Fig. 3a–c. FI and DR collaborated with AG to write the paper.
The authors declare that they have no conflict of interest.
Publisher's note: Copernicus Publications remains neutral with regard to jurisdictional claims in published maps and institutional affiliations.
We would like to thank Giuseppe Passafiume for the installation support of the seismic station in the field and Salvatore Scudero for continuous checking and downloading of the seismic data.
We would also like to thank the editor Oded Katz for the constructive comments and integrations to the paper, Giovanni Martinelli for his prestigious contributions to the work, and the anonymous reviewer for the correct and constructive analysis.
This research has been supported by the Dipartimento Regionale Protezione Civile – Regione Sicilia (grant no. 840/December 2016).
This paper was edited by Oded Katz and reviewed by Giovanni Martinelli and one anonymous referee.
Abruzzese, D.: Le Maccalube di Aragona e le eruzioni di fango del 1936 e 1940, Relazione della commissione di revisione composta dai soci effettivi prof B. Foresti e G. Cumin, available at: http://opac.apat.it/sebina/repository/catalogazione/immagini/pdf/Abbruzzese 1952.pdf (last access: 3 November 2021), 1954.
Agisoft: LLC: Agisoft PhotoScan User Manual – 1.2, Tech. rep., available at: https://www.agisoft.com/pdf/photoscan-pro_1_4_en.pdf (last access: 3 November 2021), 2016.
Albarello, D.: Mud volcanoes as natural strainmeters: a working hypothesis, Mud Volcanoes, geodynamics and seismicity, in: NATO Science Series IV, v51, edited by: Martinelli, G. and Panahi, B., Springer, the Netherlands, 239–249, 2005.
Albarello, D., Palo, M., and Martinelli, G.: Monitoring methane emission of mud volcanoes by seismic tremor measurements: a pilot study, Nat. Hazards Earth Syst. Sci., 12, 3617–3629, https://doi.org/10.5194/nhess-12-3617-2012, 2012.
Aliyev, A. A., Guliyev, I. S., Dadashov, F. H., and Rahmanov, R. R.: Atlas of world mud volcanoes, Publishing house “Nafta-Press”, Sandro Teti Editore, Baku, 321 pp., 2015.
Baloglanov, E. E., Abbasov, O. R., and Akhundov, R. V.: Mud Volcanoes Of The World: Classifications,Activities and Environmental Hazard (Informational-Analytical Review), Eur. J. Nat. Hist., 5, 12–26, 2018.
Bonini, M.: Mud volcano eruptions and earthquakes in the Northern Apennines and Sicily, Italy, Tectonophysics, 474, 723–735, 2009.
Carnemolla, F.: Evidenze geologiche, sismologiche e geodetiche di deformazioni attive a thrust e pieghe nell'area di Caltanissetta, Attività tettonica e manifestazioni del vulcanismo sedimentario delle maccalube di Santa Barbara, Tesi di Laurea Magistrale in Scienze Geofisiche, Università degli studi di Catania, Catania, 2017.
Catalano, R., Franchino, A., Merlini, S., and Sulli, A.: Central western Sicily structural setting interpreted from seismic reflectio profiles, Mem. Soc. Geol. Ital., 55, 5–16, 2000.
Cigna, F., Tapete, D., and Casagli, N.: Semi-automated extraction of Deviation Indexes (DI) from satellite Persistent Scatterers time series: tests on sedimentary volcanism and tectonically-induced motions, Nonlin. Processes Geophys., 19, 643–655, https://doi.org/10.5194/npg-19-643-2012, 2012.
Deville, E.: Mud Volcano Systems, in: Volcanoes: Formation, Eruptions and Modelling, edited by: Lewi, N. and Moretti, A., Nova Science Publishers, Inc., 95–126, ISBN 978-1-60692-916-2, 2009.
Dimitrov, L. I.: Mud volcanoes – the most important pathway for degassing deeply buried sediments, Earth-Sci. Rev., 59, 49–76, 2002.
DRPC – Dipartimento Regionale della Protezione Civile: Emergenza “Maccalube” dell' 11 Agosto 2008 nel Comune di Caltanissetta, Descrizione dell'evento e dei danni Caltanissetta, available at; https://www.docsity.com/it/maccalube-vulcani-di-fango/5325310/ (last access: 3 November 2021), 2008.
Etiope, G., Caracausi, A., Favara, R., Italiano, F., and Baciu, C.: Methane emission from the mud volcanoes of Sicily (Italy), Geophys. Res. Lett., 29, 561–564, https://doi.org/10.1007/1-4020-3204-8_12, 2002.
Grassa, F., Gucciardo, D., Interlandi, M., and Noto, G.: Aspetti geologici e caratterizzazione geochimica delle Maccalube di Aragona, Provincia di Agrigento, Bollettino dell'Ordine dei Geologi Siciliani, 2, 14–23, 2012.
Guliyiev, I. S. and Feizullayev, A. A.: All about mud volcanoes, Nafta Press, Azerbaidjan Publishing House, Baku, Azerbaidjan, 1998.
Higgins, G. E. and Saunders, J. B.: Mud volcanoes, their nature and origin, Verhandlungen Naturforschenden gesseltschaft in Basel, 84, 101–152, 1974.
Kopf, A.: Significance of mud volcanism, Rev. Geophys., 40, 1–52, 2002.
Kopf, A., Delisle, G., Faber, E., Panahi, B., Aliyev, C. S., and Guliyev, I.: Long term in situ monitoring at Dashgil mud volcano, Azerbaijan: a link between seismicity, pore-pressure transients and methane emission, Int. J. Earth. Sci. (Geol. Rundsch.), 99, 227–240, https://doi.org/10.1007/s00531-009-0487-4, 2010
Li Volsi, S.: Memoria sul vulcano aereo (ossia gasoso) (I) di Terrapilata in Caltanissetta dell'abate Salvatore Li Volsi, dedicata a S. E. sig. March. Delle Favare Ministro Segretario di Stato, Luogotenente Generale in Sicilia, Giornale di Scienze, Lettere ed Arti per la Sicilia, Tomo XIII, Anno IV, Gennajo, Febbrajo e Marzo, Palermo Presso Lorenzo Dato, 1826.
Madonia, P., Grassa, F., Cangemi, M., and Musumeci, C.: Geomorphological and geochemical characterization of the 11 August 2008 mud volcano eruption at S. Barbara village (Sicily, Italy) and its possible relationship with seismic activity, Nat. Hazards Earth Syst. Sci., 11, 1545–1557, https://doi.org/10.5194/nhess-11-1545-2011, 2011.
Martinelli, G. and Judd, A.: Mud volcanoes of Italy, Geol. J., 39, 49–61, 2004.
Mazzini, A. and Etiope, G.: Mud volcanism: an updated review, Earth-Sci. Rev., 168, 81–112, 2017.
Mazzini, A., Sciarra, A., Etiope, G., Sadavarte, P., Houweling, S., Pandey, S., and Husein, A.: Relevant methane emission to the atmosphere from a geological gas manifestation, Scient. Rep., 11, 4138, https://doi.org/10.1038/s41598-021-83369-9, 2021.
Mellors, R., Kilb, D., Aliyev, A., Gasanov, A., and Yetirmishli, G.: Correlations between earthquakes and large mud volcano eruptions, J. Geophys. Res., 112, B04304, https://doi.org/10.1029/2006jb004489, 2007.
Milkov, A. V.: Worldwide distribution of submarine mud volcanoes and associated gas hydrates, Mar. Geol., 167, 29–42, 2000.
NIOSH – National Institute for Occupational Safety and Health: Occupational Health Guidelines for Chemical Hazards, DHHS (NIOSH) Publication No. 81-123. available at: https://www.cdc.gov/niosh/docs/81-123/default.html (last access: 27 October 2021), 1981.
Sciarra, A., Mazzini, A., Etiope, G., Inguaggiato, S., Hussein, A., and Hadi, J. S: Geochemical surveys in the Lusi mud eruption, Geophys. Res. Abstr., 18, EGU2016-9270-1, https://doi.org/10.13140/RG.2.1.3567.9601, 2016.
Vanderkluysen, L., Burton, M. R., Clarke, A. B., Hartnett, H. E., and Smekens, J.-F.: Composition and flux of explosive gas release at LUSI mud volcano (East Java, Indonesia), Geochem. Geophy. Geosy., 15, 2932–2946, https://doi.org/10.1002/2014GC005275, 2014.
- Abstract
- Introduction
- The study areas
- The historical background: a tool for the hazard assessment
- Associated hazards at Santa Barbara and Aragona mud volcanoes
- Methods
- Results
- Discussion and conclusions
- Data availability
- Author contributions
- Competing interests
- Disclaimer
- Acknowledgements
- Financial support
- Review statement
- References