the Creative Commons Attribution 4.0 License.
the Creative Commons Attribution 4.0 License.
 | 21 Jul 2021
A harmonised instrumental earthquake catalogue for Iceland and the northern Mid-Atlantic Ridge
Bjarni Bessason
Ásdís Helgadóttir
Páll Einarsson
Gunnar B. Guðmundsson
Bryndís Brandsdóttir
Kristín S. Vogfjörd
Kristín Jónsdóttir
A comprehensive catalogue of historical earthquakes, with accurate epicentres and harmonised magnitudes is a crucial resource for seismic hazard mapping. Here we update and combine catalogues from several sources to compile a catalogue of earthquakes in and near Iceland, in the years 1900–2019. In particular the epicentres are based on local information, whereas the magnitudes are based on teleseismic observations, primarily from international online catalogues. The most reliable epicentre information comes from the catalogue of the Icelandic Meteorological Office, but this is complemented with information from several technical reports, scientific publications, and newspaper articles. The catalogue contains 1281 moment magnitude (Mw) ≥4 events, and the estimated completeness magnitude is Mw 5.5 in the first years, going down to Mw 4.5 for recent years. The largest magnitude is Mw 7.0. Such merging of local data and teleseismic catalogues has not been done before for Icelandic earthquakes, and the result is an earthquake map with much more accurate locations than earlier maps. The catalogue also lists 5640 additional earthquakes on the Mid-Atlantic Ridge, north of 43∘, with both epicentres and magnitudes determined teleseismically. When moment magnitudes are not available, proxy Mw values are computed using χ2 regression, normally on the surface-wave magnitude but exceptionally on the body-wave magnitude. Magnitudes of Mw≥4.5 have associated uncertainty estimates. The actual combined seismic moment released in the Icelandic earthquakes is found to be consistent with the moment estimated using a simple plate motion model, indicating that the seismic activity of the catalogue period might be typical of any 120-year time span. The catalogue is named ICEL-NMAR, and it is available online at http://data.mendeley.com (last access: 19 July 2021).
- Article
(3286 KB) - Full-text XML
- BibTeX
- EndNote


Seismic hazard in Iceland is the highest in northern Europe and is comparable to that in southern Europe. The seismicity is caused by tectonic movements of the plate boundary of the North American plate and the Eurasian plate crossing the island, as well as by volcanic activity (Einarsson, 1991, 2008). Based on historical records, faulting mechanisms, and tectonic context, it can be argued that earthquakes larger than about Mw 7.2 are not to be expected (Halldórsson, 1992a). This is further supported by the limited thickness of the seismogenic part of the Icelandic crust, about 8–12 km (e.g. Stefánsson et al., 1993). Since the settlement of Iceland in the eighth or ninth century CE, destructive earthquakes have repeatedly been reported in local chronicles with descriptions of structural damage and fatalities (Sólnes et al., 2013). However, because of low population density, the losses and number of deaths and injuries have been low and have gained little global attention. The main characteristic of the seismicity is shallow (<10 km) strike-slip earthquakes as well as earthquakes related to volcanic activity. The first instrumentally recorded earthquakes in Iceland occurred in 1896 when six destructive earthquakes struck in South Iceland in a 2-week period (Ambraseys and Sigbjörnsson, 2000; Sigbjörnsson and Rupakhety, 2014). These events were recorded at several stations in Europe: England, France, Poland, and Italy, equipped with rather primitive seismographs (Sólnes et al., 2013, pp. 579–583). Damped seismographs, which could measure absolute ground motion, were introduced around the year 1900, allowing (later) magnitude computation. In 1909 a Mainka seismograph was installed in Reykjavík. It was operated until 1914 and again from 1925 when continuous operation was secured (IMO, 1924–2006).
The main motivation behind this study is to construct a catalogue with harmonised magnitudes (which are comparable in both time and space) and reassessed locations for Iceland to use in seismic hazard analysis. Selection criteria for inclusion are that the earthquake was instrumentally recorded by seismic centres outside Iceland and assigned a surface-wave, body-wave, or moment magnitude (Ms, mb, or Mw) and that it is listed either in the International Seismological Centre (ISC) Bulletin event catalogue (ISC, 2020) or in the catalogue of Ambraseys and Sigbjörnsson (2000), which lists and reappraises internationally recorded earthquakes in the region 62–68∘ N, 12–26∘ W (Fig. 1), in the period 1896–1995. This catalogue will be referred to as the AMB-SIG catalogue. The new catalogue contains reappraised magnitudes and locations for earthquakes in the AMB-SIG region (referred to as ICEL) and the period 1900–2019, a total of 1281 earthquakes. Icelandic earthquakes are almost always less than 12 km deep, but the exact depth information is often not resolvable, and therefore the catalogue does not include hypocentral depth.
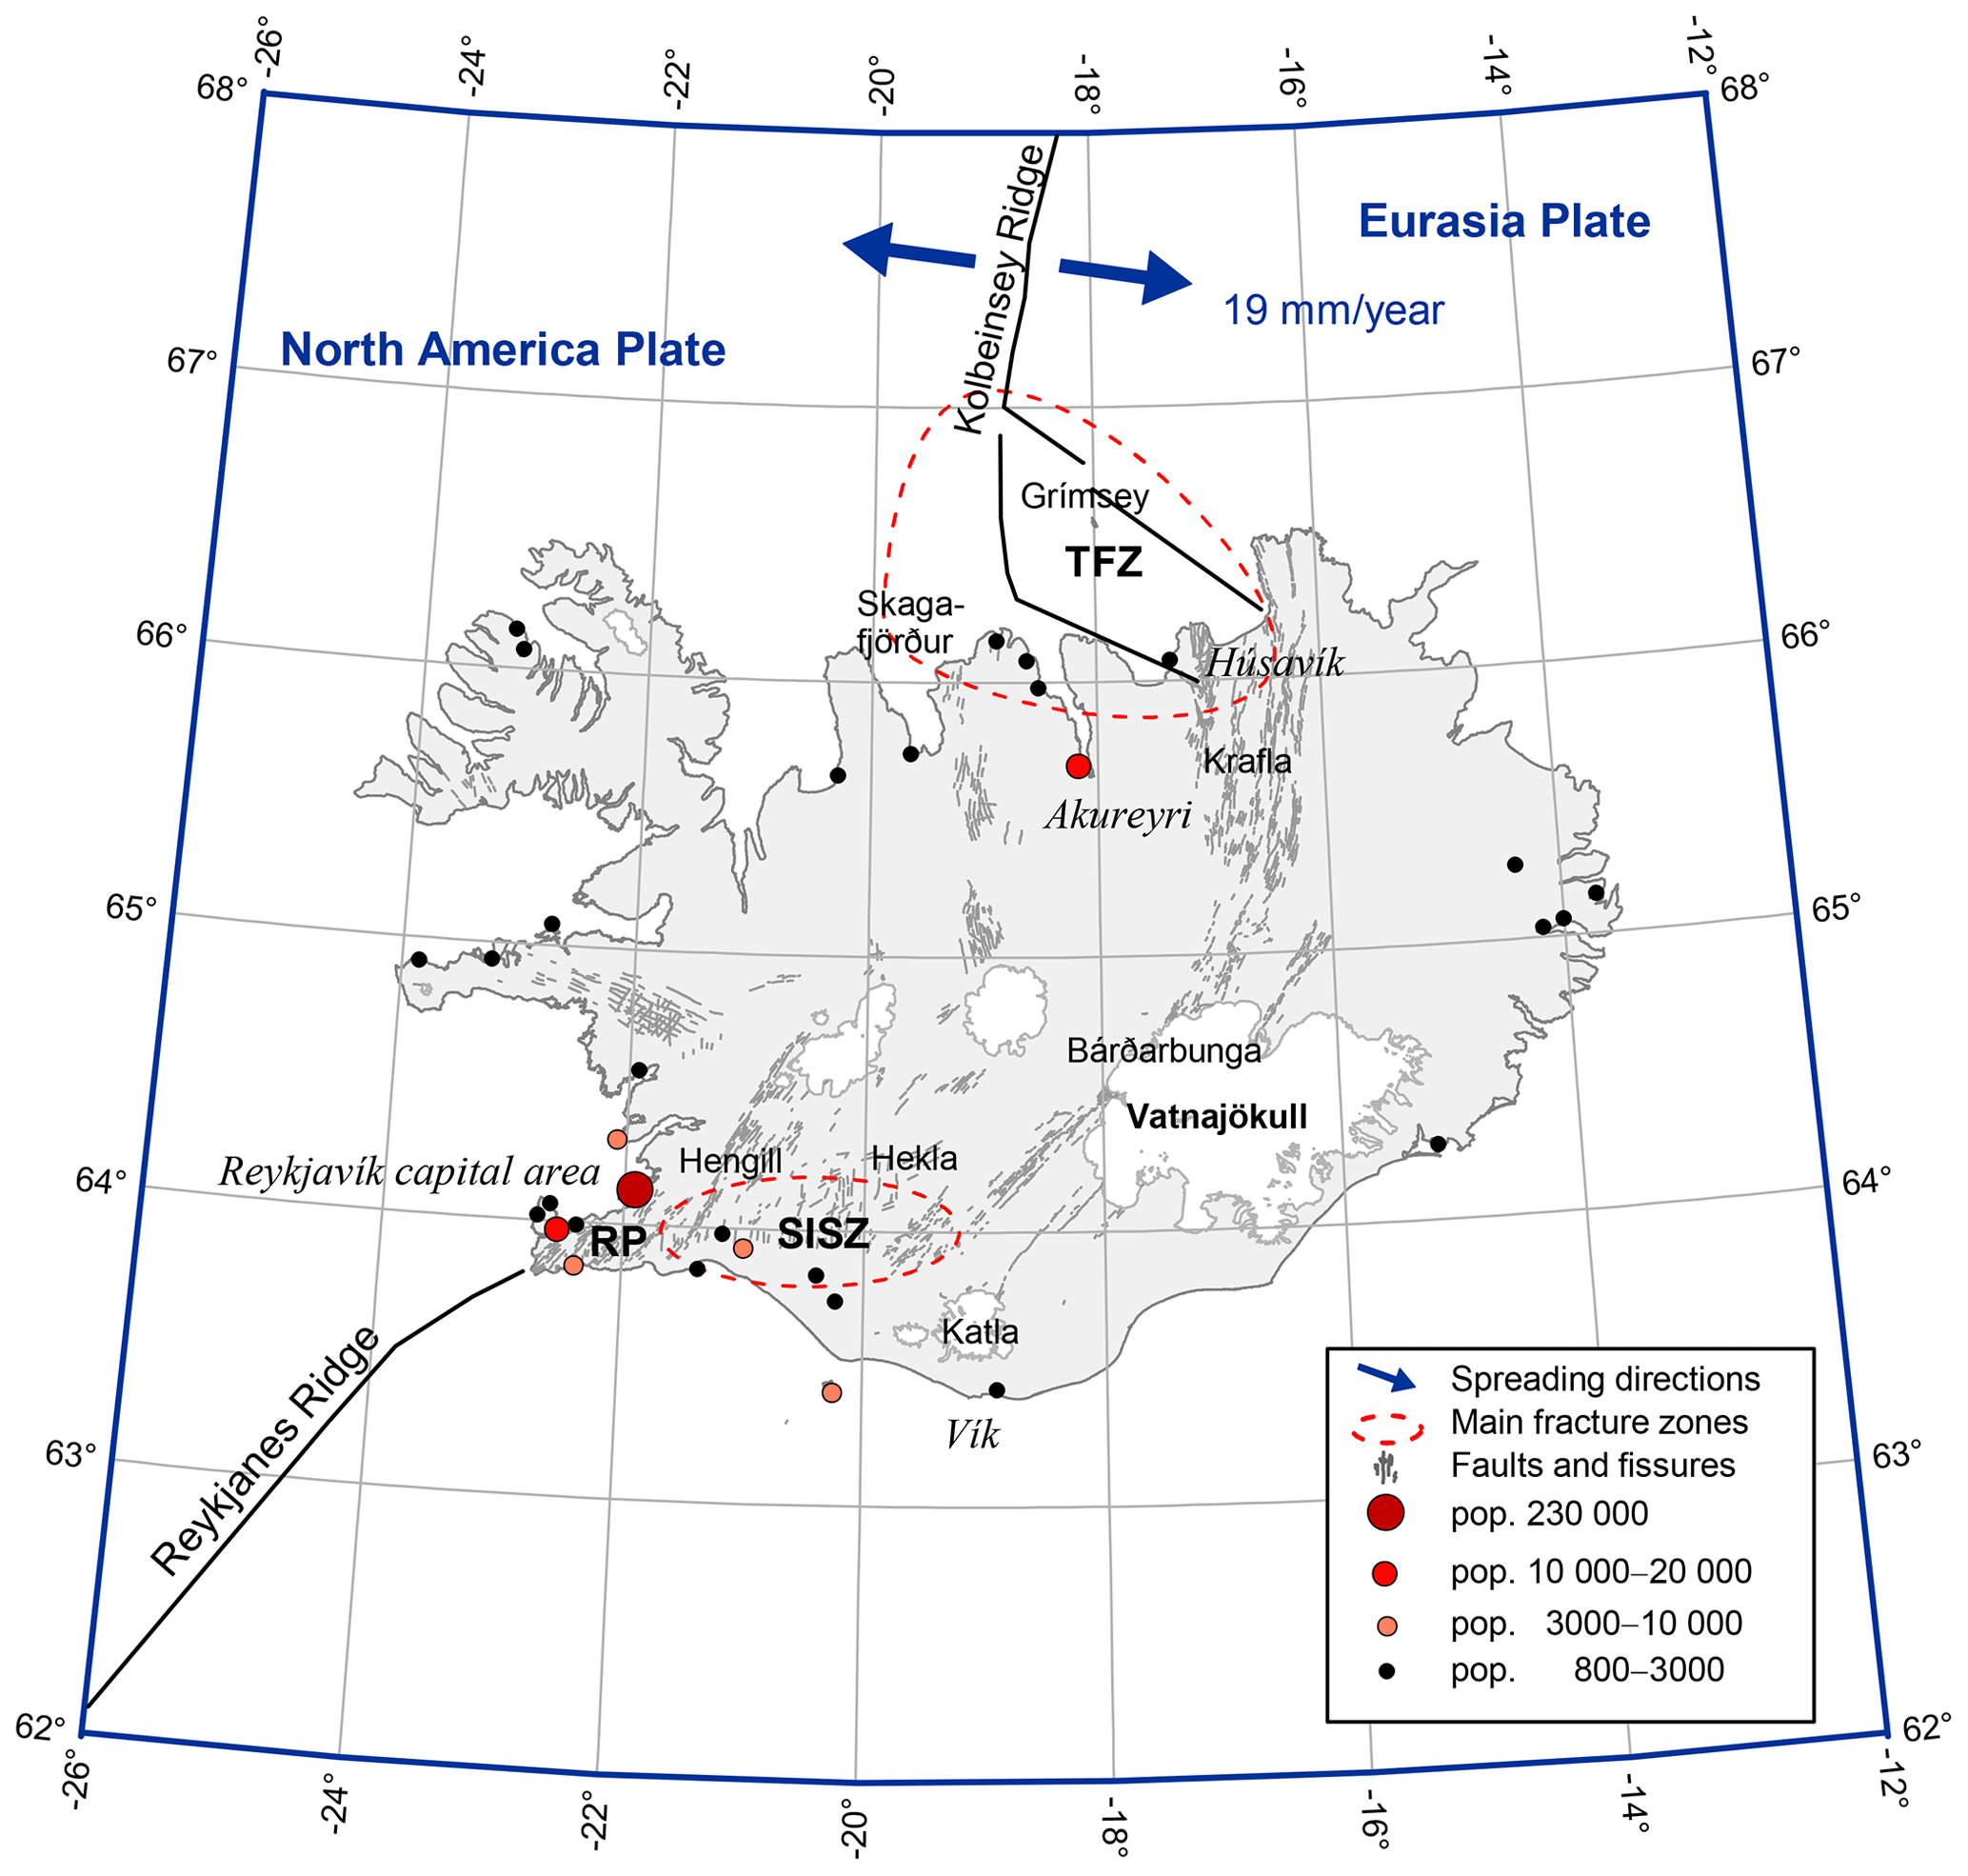
Figure 1The ICEL region, 62–68∘ N, 12–26∘ W. The figure shows place names in Iceland mentioned in the article. Towns and villages with a 2020 population of at least 800 are also indicated as well as the Tjörnes Fracture Zone (TFZ), the South Iceland Seismic Zone (SISZ), and the Reykjanes Peninsula (RP).
The magnitudes are all copied or computed from the ISC, AMB-SIG, or the Global Centroid Moment Tensor (GCMT) Catalog (GCMT, 2020). Mw values are provided for all earthquakes. They are of three types: (a) taken directly from the GCMT Catalog if available there (the golden standard), (b) averaged or copied from values in the ISC catalogue, or (c) proxy values computed with regression using Ms or mb. For the regression, region-specific magnitude relationships were developed using data from a larger region, referred to as NMAR. This region follows the northern Mid-Atlantic Ridge (Fig. 2) and includes all of the region AOI (Atlantic Ocean and Iceland) of Grünthal and Wahlström (2012). A byproduct of our study is therefore a catalogue of 6921 events in the whole NMAR region (including the 1281 ICEL events). Locations of events outside ICEL are copied directly from the ISC catalogue, and magnitudes are obtained in the same way as inside it. The magnitude range of the new catalogue is Mw 4–7.08, as events of Mw<4 were omitted.
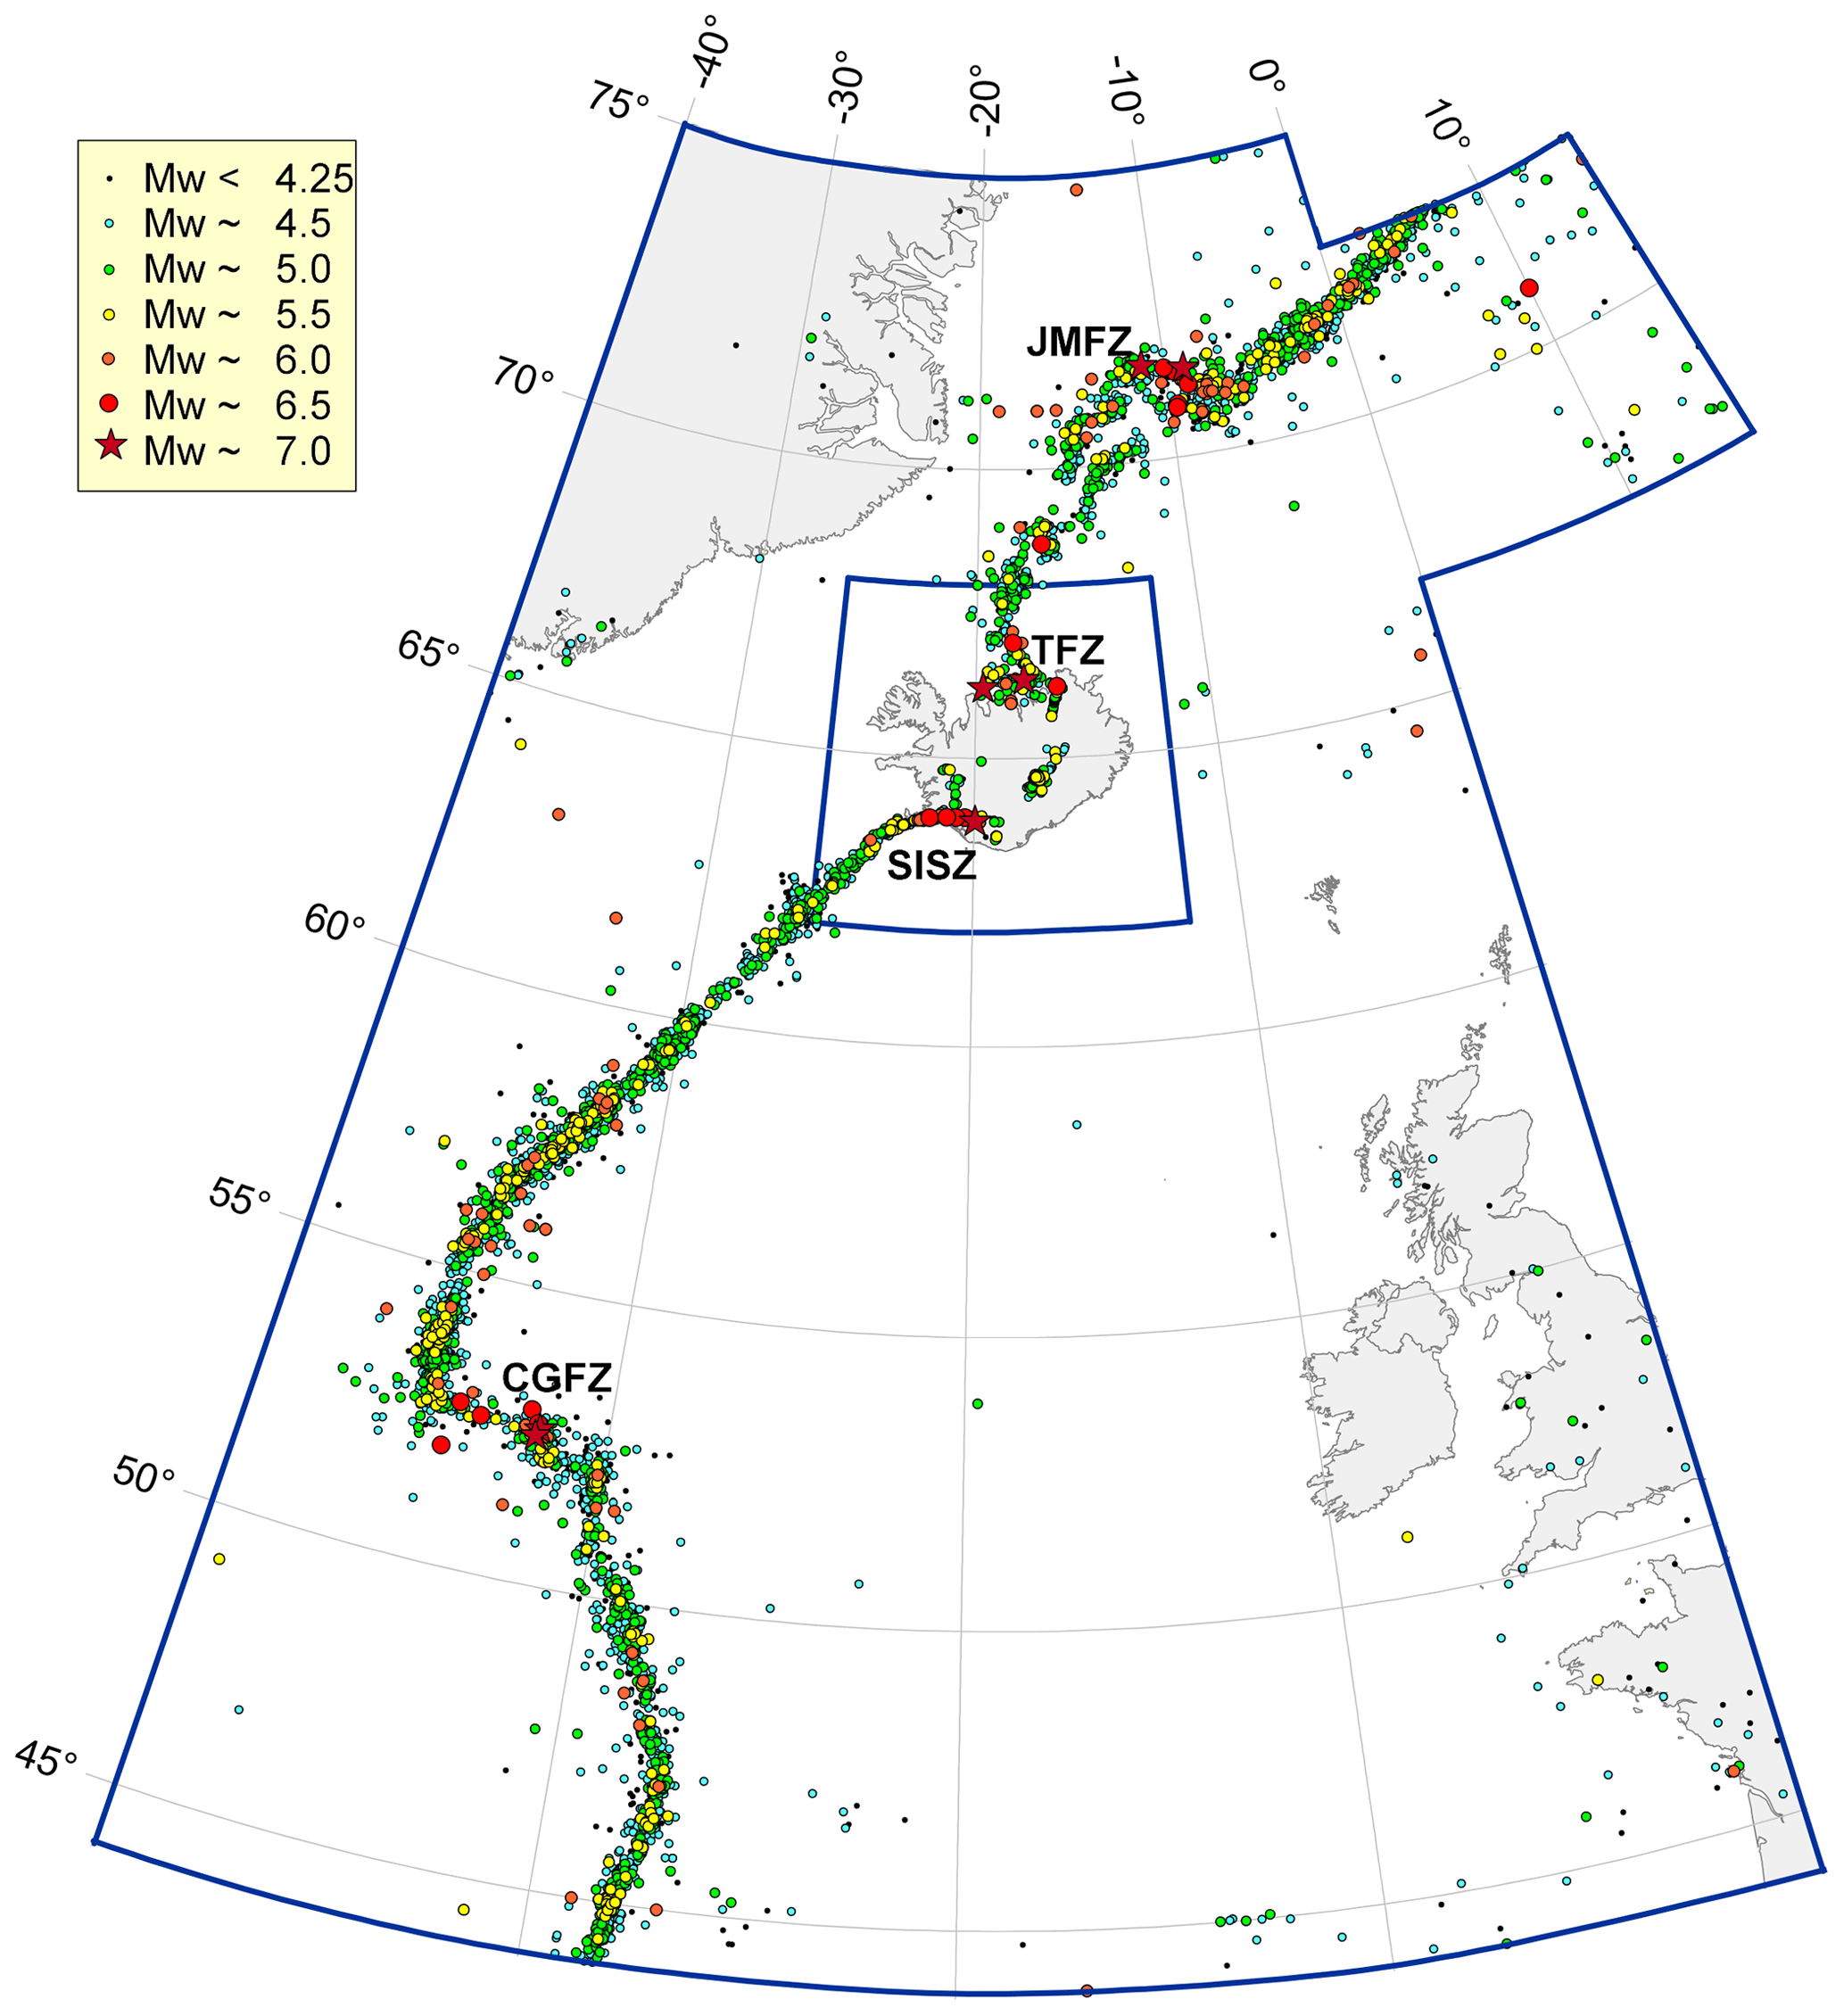
Figure 2The NMAR region, 44–75∘ N, 0–40∘ W, and 67–73∘ N, 0–17∘ E. The small part in the Eastern Hemisphere is added to make the region include all of the AOI region of Grünthal and Wahlström (2012). The ICEL region is also marked. Four main seismic zones are marked on the map, i.e. the Charlie-Gibbs Seismic Zone (CGSZ), South Iceland Seismic Zone (SISZ), Tjörnes Fracture Zone (TFZ), and Jan Mayen Fracture Zone (JMFZ). The displayed locations and magnitudes are those of the new catalogue.
For the whole catalogue period local information is crucial for improving earthquake locations. Before 1955 and also for several subsequent events, written sources often provide valuable location information. Since 1955, when three seismometers were installed in Iceland covering the primary seismic zones, locally computed epicentres may be assumed to be more accurate than teleseismic epicentres in international catalogues, which are off by tens of kilometres. One of the innovations in the new catalogue is therefore to use such local data. The primary local sources on epicentres are a catalogue compiled at the Icelandic Meteorological Office (IMO), seismological bulletins, newsletters and reports published by the IMO and the University of Iceland Science Institute (UISI), journal articles with results of studies on Icelandic earthquakes, and contemporary accounts of earthquakes from newspapers. The origin times are generally taken from the IMO catalogue when available and otherwise taken from the international catalogues.
An early published list of instrumentally recorded earthquakes in Iceland and the surrounding oceans appeared in Gutenberg and Richter's book (Gutenberg and Richter, 1949, pp. 196, 207), which lists 60 large earthquakes in the period 1910–1945 in the NMAR region; of these 8 are in the ICEL region. Six years later Tryggvason (1955) compiled a list of earthquakes of M≥5.25 in 1927–1945, with 121 in NMAR; of these 22 are in ICEL. Another global source for earthquakes in the first part of the 20th century is the International Seismological Summary (ISS), the predecessor of the ISC.
Since shortly after the IMO was established, it has been responsible for monitoring earthquakes in Iceland. From the beginning, accounts of earthquakes have been published in the IMO monthly newsletter Veðráttan (The Weather) (IMO, 1924–2006); in addition the Seismological Bulletin (IMO, 1926–1973) was compiled and distributed to seismological centres abroad, and since 1975 computerised earthquake catalogues have been kept and made available to scientists working elsewhere. After 1965 earthquake research took off at the University of Iceland and has flourished ever since with a number of case studies, as well as historical summaries.
The new century has seen a surge in the publication of local and global earthquake catalogues, and Iceland is not an exception. The aforementioned catalogue of Ambraseys and Sigbjörnsson (2000) covers the same ICEL region as the current study and lists 415 earthquakes with Ms and/or mb magnitudes. The epicentres for a portion of these were reassessed, but for the remaining ones, inaccurate teleseismically determined locations were given. Unfortunately this catalogue was only published with a very limited distribution, and it is not available online.
Grünthal and Wahlström (2003) compiled a historical catalogue of earthquakes in central and northern Europe up to 1993, with magnitudes and locations in Iceland taken from a data file obtained from the IMO. These data were compiled at the IMO independently of the IMO catalogue discussed in Sect. 2.2.1 and are still available on the IMO website (http://hraun.vedur.is/ja/ymislegt/storskjalf.html, last access: 13 January 2021). The locations are reasonably accurate, but the resulting Mw magnitudes are exaggerated compared to our results, by up to a whole magnitude unit for some of the early events (the average difference is 0.41 before 1970, 0.37 between 1970 and 1980, and 0.27 after 1980; third quartiles are 0.59, 0.47, and 0.36, respectively). The work on this catalogue continued with a number of subsequent projects (Grünthal et al., 2009; Grünthal and Wahlström, 2012; Grünthal et al., 2013), under several abbreviations, CENEC (the unified catalogue of earthquakes in central, northern, and northwestern Europe), EMEC (European-Mediterranean earthquake catalogue), SHARE (Seismic Hazard Harmonization in Europe), and SHEEC (SHARE European Earthquake catalogue).
For the Iceland region, all these projects adopted the original 2003 catalogue, adding data (locations and local magnitudes) after 1990 from IMO's catalogue. Among the products of these studies was the SHARE hazard map for Europe, where the hazard was greatly overestimated in some places in Iceland, among them in the Reykjavík capital area, where the estimated peak ground acceleration (PGA) for a 10 % exceedance probability in 50 years is given as 0.4–0.5 g (Woessner et al., 2015). Several recent local studies estimate 10 % 50-year PGA as 0.1–0.2 g in the Reykjavík area (Sólnes et al., 2004; SCI, 2010; Sólnes et al., 2013; D’Amico et al., 2016). The reason for the presumed overestimation is likely a combination of errors in the underlying catalogues and differences in modelling.
In 2010 the ISC initiated work on a global catalogue of large earthquakes since 1904, the ISC-GEM (Global Earthquake Model) Global Instrumental Earthquake Catalogue. The first version was released in 2013, and the work is ongoing, with version 7 being released in 2020 (Storchak et al., 2013; Di Giacomo et al., 2015). The catalogue contains 40 earthquakes in the ICEL region. It is not used as a source for the new catalogue but instead for quality checking and comparison.
Panzera et al. (2016) compiled a catalogue of earthquakes in South Iceland 1991–2013. It reports locations and magnitudes from IMO's database, cleaned and corrected, as well as proxy Mw values based on regression of GCMT magnitudes on the IMO data, like the CENEC and EMEC catalogues. It has more than 150 000 events with magnitudes down to M=0. Unfortunately the IMO magnitudes are very inaccurate, at least when Mw≥4 (Fig. 4), and thus this catalogue has not been used directly in the current work.
The next section discusses the primary sources used to compile the new catalogue. This is followed by two sections describing how epicentres and magnitudes in the catalogue are determined. The final section contains details of the catalogue, including how to retrieve it, as well as a discussion of completeness magnitude, comparison with ISC-GEM, and comparison with the total moment of a simple plate motion model.
This section discusses the primary sources used to compile the new ICEL-NMAR catalogue. These sources consist of four teleseismic international catalogues, used primarily to obtain and/or compute magnitudes, and several types of local Icelandic sources used as a basis for event locations. The local sources include the catalogue of the IMO, scientific publications, seismological bulletins, newsletters, and technical reports, as well as newspaper articles. The section concludes with a few remarks on how individual events in different sources have been matched up.
2.1 Teleseismic catalogues
2.1.1 The ISC Bulletin event catalogue
The ISC database (ISC, 2020) contains data on earthquake location and magnitude contributed by several seismological agencies from around the world. For each earthquake a single origin time (UTC) and location but multiple magnitude values are provided. The magnitudes are of several different types, but in the present work only Ms, mb, and Mw are considered. Magnitudes coded as mS and Ms are treated as Ms and similarly for varying capitalisation of mb. In addition in the period 1955–1970, there are a few magnitude values marked as M and these are also treated as Ms; see Sykes (1965). When both M and Ms values are available for an earthquake, the difference is small. Each magnitude is either marked ISC, to signify that the value is computed by the ISC themselves, or marked with the abbreviation of a submitting agency. The ISC-marked values are referred to as reviewed, and according to Storchak et al. (2017), “seismic events are reprocessed resulting in more robust and reliable mb and MS magnitudes”. Di Giacomo and Storchak (2016) say that the ISC puts considerable effort into relocating earthquakes and recomputing their magnitudes. They also recommend that preference be given to three agencies, CTBTO (Comprehensive Nuclear-Test-Ban Treaty Organization, also known as International Data Center, IDC, Vienna), MOS (Geophysical Survey of the Russian Academy of Sciences, Moscow), and USGS (United States Geological Survey). Among other important agencies is the Swiss Seismological Service, providing the ZUR-RMT (Zurich moment tensors; Braunmiller et al., 2002).
2.1.2 The GCMT Catalog
The GCMT Catalog (GCMT, 2020) contains data on seismic moment tensors with associated Mw magnitudes of large earthquakes (Mw≥5) around the world, starting in 1976 (Dziewonski et al., 1981; Ekström et al., 2012). This is considered the most authoritative catalogue in providing Mw (Di Giacomo and Storchak, 2016). There are 663 events in the NMAR region in this catalogue, and all but 7 of them are also in the ISC catalogue. The GCMT Catalog gives Mw with two decimal places, while the ISC gives only one, but apart from that most of the values match between the catalogues.
2.1.3 The catalogue of Ambraseys and Sigbjörnsson
Ambraseys and Sigbjörnsson (2000) published an earthquake catalogue for Iceland or more specifically for the region shown in Fig. 1. The catalogue covers exactly 1 century, i.e. from 1896 to 1995, and lists 422 earthquakes. The catalogue is based on teleseismic data from seismological bulletins and information from books, journals, newspapers, and reports. The authors recalculated surface-wave magnitudes (Ms) and locations when possible. Ambraseys and Sigbjörnsson (2000) mention that the greatest outstanding problem was the epicentral accuracy, particularity for pre-1960 macroseismic and instrumental events. They specially remark that epicentres before 1918 reported by the British Association for the Advancement of Science (BAAS, 1913–1917) are crude, as well as epicentres of events before 1950 reported by the ISC, although to a lesser degree (Ambraseys and Sigbjörnsson, 2000). This catalogue contains valuable information for the time period from 1900 to 1960 when fewer records are available from other catalogues.
2.1.4 The USGS Earthquake Catalog
A simple online search in the USGS catalogue (USGS, 2020) provides one magnitude value per earthquake (Mw, Ms, or mb), although several magnitude types are often computed. The remaining values are in the ISC database, labelled USGS. Corresponding magnitudes from the two sources are in almost all cases identical. However the locations in the USGS catalogue are different from those in the ISC catalogue, with the difference frequently amounting to a few tens of kilometres.
2.2 Local sources and catalogues
2.2.1 The catalogue of the Icelandic Meteorological Office
The Icelandic Meteorological Office (IMO) in Reykjavík has been responsible for monitoring earthquakes in Iceland since shortly after its foundation in 1920 when the Mainka seismograph mentioned in the introduction was reinstalled there in 1925. A second Mainka instrument was installed in 1927, also in Reykjavík. Data processing was conducted at the IMO, and the results were published in seismological bulletins (IMO, 1926–1973) which were sent to several seismological agencies around the world. These results were mainly phase readings and reports of felt earthquakes along with a few locations.
After 1980 the IMO reanalysed these data and combined them with other local and global sources, e.g. the University of Iceland (UI) reports discussed in the next subsection and Kárník (1968). The resulting event locations and magnitudes form the basis of IMO's catalogue for the period 1926–1952.
In 1951–1952, three Sprengnether short-period seismographs, measuring all three components of motion, were installed in Reykjavík and the old seismographs were moved to Akureyri in North Iceland and to Vík in South Iceland (Fig. 1), and in the following 2 decades several more instruments were installed.
As detailed in the next subsection, the University of Iceland Science Institute (UISI) initiated several research projects after 1970 involving seismic measurements. Many of these were in cooperation with the IMO, and at the same time IMO's network continued to expand. As before the resulting data were published in the seismological bulletins. The IMO catalogue of 1952–1974 is based on these and a digital-only bulletin for 1974.
From 1975 to 1986 no bulletins were published, and to fill this gap, phase readings from the UISI and the IMO stations were merged and reanalysed to compute locations and magnitudes. This work was carried out at the IMO after 1990, and earthquakes of magnitude Ml>3 were entered into the IMO database. The database for this period is somewhat preliminary and incomplete, as manual review is lacking. The period 1987–1990 is also in the IMO database, with results based on Mánaðaryfirlit jarðskjálfta (Monthly reports of earthquakes) (IMO, 1987–1990), published by the IMO in cooperation with the UISI.
In 1991 a digital seismic system, the South Iceland Lowland (SIL) system was implemented by the IMO (Stefánsson et al., 1993; Bödvarsson et al., 1996). As the name implies, it began in South Iceland but was gradually expanded to cover all geologically active areas in the country. In 2020 around 80 stations are in operation in the SIL network. Even if the system did not cover the whole island to begin with, all events of magnitude Ml>4 occurring within a few tens of kilometres offshore should be present for the whole period. Locations and local magnitudes are automatically computed by the system; all automatically located events are manually reviewed, and the locations are recomputed. The IMO catalogue from 1991 is based on the SIL system analysis.
2.2.2 Data from the University of Iceland Science Institute
Research on historical seismicity at the University of Iceland relies heavily on reports by Tryggvason (1978a, b, 1979) and Ottósson (1980). Tryggvason's reports are based on the early seismographic observations at the IMO and overseas for the years 1930–1960, augmented by felt reports and newspaper reports. Ottósson's report on earthquakes during 1900–1930 is based on felt reports and newspapers, supported by rare teleseismic observations.
Technical advances and increasing interest in crustal activity following the Surtsey eruptions in 1963–1967 led to a proliferation of seismic observations in Iceland in the late 1960s (Einarsson, 2018). Cooperation started between the UISI and the Lamont-Doherty Earth Observatory (LDEO) at Columbia University in New York. A team from LDEO came to Iceland with several portable seismographs to study the background seismicity of the mid-Atlantic plate boundary (Ward, 1971). A network of six stations was operated on the Reykjanes Peninsula segment of the boundary during 1971–1976 (Björnsson et al., 2020), augmented by a dense network in the summers of 1971 and 1972 (Klein et al., 1973, 1977). The work continued by building an island-wide network of short-period, vertical-component seismographs, designed and built at the UISI. The installation began in South Iceland in 1973, and the network was gradually expanded in the following years, to the Tjörnes Fracture Zone (TFZ) in North Iceland in 1974, and to other parts in 1975–1979. A telemetered network was installed in Central Iceland in 1985. These networks provided valuable data on major events such as the Krafla volcano-tectonic episode of 1975–1984 (Einarsson and Brandsdóttir, 1980; Brandsdóttir and Einarsson, 1979; Buck et al., 2006; Wright et al., 2012), the Hekla eruptions of 1980 and 1991 (Grönvold et al., 1983; Soosalu and Einarsson, 2002), and the Gjálp eruption in Central Iceland in 1996 (Einarsson et al., 1997), as well as the location of the major seismically active structures of Iceland (Einarsson, 1991). After 1991, the analogue seismic stations were gradually replaced by the SIL system discussed in the previous subsection. The last analogue stations were dismantled in Central Iceland in 2010. Some of the data gathered by the seismic network discussed above, including epicentres, are documented in the Skjálftabréf (Earthquake letter) (UISI, 1975–1988).
2.2.3 Newspapers
Newspapers are an important source on earthquakes in Iceland during the first part of the 20th century. The web page http://timarit.is (last access: 19 July 2021) provides search access to all newspapers published in Iceland during 1830–2016. News about earthquakes often provides direct or indirect information on their epicentres. In the current work we have used this data source extensively to check the correctness of the sources listed in the previous sections and, when deemed appropriate, to correct earthquake locations for the new catalogue.
2.3 Combining catalogues
All the catalogues that need to be combined for the current study have their own version of both origin time and location of each earthquake. Jones et al. (2000) and several later publications propose that two records that differ by less than 16 s and 100 km refer to the same earthquake. We have discovered that this is too strict and use windows of 16 s and 320 km. Increasing the window to 25 s and 1000 km gave identical event pairings. Furthermore, the AMB-SIG catalogue only provides times to the nearest whole minute, so for that a 90 s time window is used. For each earthquake, the ISC time, all available locations (ISC, AMB-SIG, IMO, other local sources), and all available magnitude values of different types (Mw, Ms, mb) and from different catalogues/contributors are entered into a data file. This file is then used for further processing as described below. It contains some smaller earthquakes that are absent from the final catalogue, as explained at the beginning of Sect. 4 below. The counts of events according to period, region, location source, and magnitude source, in Sects. 3.1, 3.2, and 4.1, are however all made using the catalogue, instead of this data file, as we deem that information to be more relevant for the reader.
When an accurate instrumentally determined location of an earthquake is missing, which applies to a large part of the study period, several methods may be used to determine the epicentre. Sometimes the historical accounts, discussed in Sect. 2.2, provide quite accurate locations, especially in inhabited areas. For the past decades a major effort has been devoted to the mapping of surface expressions of earthquake faults in Iceland, and these often indicate the location of historical earthquakes (Einarsson, 2015). Furthermore, the main faults tend to produce microearthquakes detected with the SIL network. By relative locations, detailed maps of the subsurface faults can be produced (Slunga et al., 1995). Combining all these methods and adding expert judgement will normally give much more accurate locations than those provided by the international catalogues, and the same holds for many of the locations in the IMO catalogues, even before 1990. One could say that we have reinterpreted the data with seismological and tectonic understanding that has been accumulating in recent years and decades.
The remainder of this section describes details of how this methodology has been applied for several subperiods of the study period.
3.1 The period until 1990
In the period 1900–1925 there are 22 earthquakes in the ICEL region listed in our final catalogue. All of these are in the AMB-SIG catalogue, and 4 are also in the ISC catalogue, originally coming from Gutenberg and Richter (1949). The authors have viewed all these earthquakes on a map and checked newspapers articles for contemporary accounts of them (using the web service timarit.is mentioned in Sect. 2.2.3), as well as scientific publications, in particular the report of Ottósson (1980). The result of this scrutiny is to use the AMB-SIG location for 14 earthquakes and the aforementioned report for 1 event and to adjust the location of 6 events using the methodology described at the beginning of this section. In the new catalogue these location sources have been specified as Amb-Sig, Report, and New, respectively. Finally, for the 22 January 1910 earthquake, we use the location provided by Stefánsson et al. (2008), 20 km offshore North Iceland. This source is marked as [1] in the catalogue, with details in an accompanying reference list.
In the period 1926–1954 there are 87 earthquakes in the catalogue, and their locations have been scrutinised in the same way. Sometimes we can take into account that an origin time is within a known earthquake series. For this period additional data sources are the IMO catalogue (Sect. 2.2.1), as well as the reports of Tryggvason (1978a, b, 1979) which often provide direct epicentres. This results in using 37 AMB-SIG locations, 9 IMO locations (marked IMetO in the new catalogue), 33 locations from the reports, 4 computed as averages of the most believable reported locations (marked Average), and 4 relocations (marked New).
In the period 1955–1990 there are 346 earthquakes in the catalogue. Having multiple local seismometers offers the possibility of computing locations from local measurements. Such locations have found their way into several of our sources, but the quality is variable. There are several journal articles stemming from this period providing locations for 39 earthquakes, and our choice is to trust these. The relevant articles are listed in the reference list in the readme file accompanying the catalogue and are specified as [2], [3], etc., in the catalogue itself. Some of the articles are also cited in Sect. 2.2.2 above. Available locations for the remaining 307 earthquakes were viewed on a map, with up to four locations per earthquake: from AMB-SIG; the IMO; the ISC; and one of the earthquake reports, newsletters, or bulletins. It transpired that none of these sources could be used as an overall first choice, but instead we had to select the most believable one in each case or sometimes take an average or relocate. The result was to use AMB-SIG for 64 cases, the IMO catalogue for 94, the ISC for 17, reports for 3, locations from the Skjálftabréf (Earthquake letter) (UISI, 1975–1988) (marked Letter) for 73, averages for 15, and relocations for 40.
3.2 Earthquakes after 1990
For the period 1991–2019 the catalogue contains 826 earthquakes in the ICEL region. With the introduction of the SIL system described in Sect. 2.2.1, the quality of the local epicentre information vastly improved after 1990. We have viewed maps of these locations together with ISC and USGS locations, along with a background layer showing microearthquake activity. From this comparison it was evident that the errors in the teleseismic locations are in many cases of tens of kilometres (see Sect. 3.3). The SIL locations are however accurate to a few kilometres inside the station network, and they are judged to be more accurate than the teleseismic locations in the region 63–67∘ N, 13–25∘ W. Outside this region ISC, AMB-SIG, and USGS locations are used for 118 events, 2 events, and 1 event, respectively. Inside the region SIL locations are used for 703 events and ISC locations are used for 17 (these events are missing in the SIL-catalogue), and finally there are 2 events located using published results as detailed in Sect. 5.2.
3.3 Uncertainty in earthquake locations
To obtain some indication of the uncertainty in event locations in the international catalogues we have looked at the variability between different catalogues, which can be considered a proxy for the precision of the locations. For 293 events in both the AMB-SIG and the ISC catalogues (period 1910–1996), the median location difference is 10 km, the 90th percentile is 31 km, and the maximum is 311 km. The difference does not seem to decrease markedly with time or with earthquake magnitude. A similar comparison between the ISC and the USGS catalogues in the whole NMAR region (4186 events, 1973–2019) gave a median of 9 km, 90th percentile of 25 km, and maximum of 284. Comparison of the ISC and SIL in the region defined in Sect. 3.2 (860 events, 1991–2019) gave a median of 4.4 km, 90th percentile of 23 km, and maximum of 150 km.
Contrary to earthquake locations, where local information is crucial, estimating the size of larger earthquakes with teleseismic data is often easier and more reliable than using regional and local data. The dominant periods at teleseismic distances are longer and the structure is smoother due to attenuation of the higher frequencies (Wang et al., 2009; Karimiparidari et al., 2013; Yadav et al., 2009).
Modern earthquake catalogues generally provide moment magnitudes for all earthquakes larger than about Mw 4. For earthquakes whose source mechanism and magnitude have not been modelled by moment tensor inversion of seismic data, regression on surface- or body-wave magnitudes is customarily used to obtain proxy Mw values, and this procedure is followed here. As mentioned in the Introduction, earthquakes from the whole NMAR region are used to construct the Ms–Mw and mb–Mw regression relationships, thus improving the accuracy of these relationships and at the same time obtaining a larger catalogue of 6921 earthquakes. The data file discussed in Sect. 2.3 above contains some earthquakes that are too small to be included in the catalogue but are used in the regression in order to improve the relationship for small magnitudes.
For each earthquake there are usually several mb values, contributed by different agencies, and the same applies to Ms and sometimes also Mw. These values must be appropriately averaged or selected before they can be used in the regression. This subtask is dealt with in the next subsection, followed by a subsection on uncertainty in the magnitude estimates in the context of previous studies. Section 4.3 discusses the proxy regression, and finally there are two short subsections on the uncertainty in the proxy and local magnitudes.
4.1 Best estimates of Mw, Ms, and mb
4.1.1 Estimates of Mw
In the NMAR region 868 earthquakes in our final catalogue have modelled moment magnitudes; of these 148 are in the ICEL region. The GCMT Catalog is the golden standard for moment magnitudes, and available GCMT Mw values are used verbatim, 665 in total in the larger NMAR region. The magnitudes range from Mw 4.51 to 7.08, stemming from the period 1976–2019. An additional 204 earthquakes have modelled Mw values from other sources, all downloaded via the ISC; 201 are from the ZUR-RMT from the Swiss Seismological Service, all stemming from the period 2000–2005, and 2 are from the USGS catalogue. In addition 61 earthquakes have both a GCMT value and a ZUR-RMT value, with the ZUR-RMT values on average 0.08 magnitudes higher (standard deviation 0.09). The common values are in the range 4.8–6.6, and a graph of MGCMT against MZUR-RMT shows that the relationship is approximately linear with a slope of 1, which justifies using −0.08 as an agency correction for ZUR-RMT. More precisely, we set Mest as equal to MZUR-RMT−0.08, and the estimated values are in the range 3.62–5.22. Gasperini et al. (2012) found a very similar result.
Similarly the GCMT and USGS catalogues have 109 common events, with a correction of 0.00 and standard deviation of 0.08, and we set Mest to MUSGS for the three events. Other agencies which provide 35 additional Mw values in the ISC catalogue have been compared with the GCMT Catalog in the same way, but in all cases the standard deviation is too high to include them.
4.1.2 Estimates of Ms
The final catalogue contains 5050 Ms values for earthquakes in the NMAR region; of these 1080 are in the ICEL region. This time the golden standard consists of reviewed values in the ISC catalogue. The situation is somewhat complicated by the fact that three important sources for magnitudes in the first half of the catalogue period have very little overlap with these reviewed values, so corresponding agency corrections cannot be determined. In fact all sources have small overlap with the ISC before 1965. The period has therefore been divided into two: 1900–1964 and 1965–2019.
Of the 317 Ms values before 1965, 43 are ISC-reviewed. The remaining 274 Ms values come from a total of 24 other sources, the most important being Ambraseys and Sigbjörnsson (2000), Sykes (1965) (PAL in the ISC catalogue), and the California Institute of Technology in Pasadena (PAS). For each of these earthquakes a direct average of available magnitudes is used.
Of the 4733 Ms values since 1965, 2828 are ISC-reviewed and are again used unchanged. The remaining 1905 events have Ms values from a total of 33 sources. After pooling agencies with fewer than 20 events, all sources have sufficient overlap with the ISC to estimate an agency correction, Δi, computed as the average of all available differences, , where Mi is the magnitude estimated by agency i. When only one source is available, Mest is set to Mi+Δi, but otherwise a weighted average is computed using
where the wi values are normalised weights (summing to 1) and the sum is taken over all available Mi values. If the Δi values are independent, it is optimal to weigh with their inverse variance, and, even if not optimal, it is more robust to use the same weights when the Δi values are correlated (Schmelling, 1995). To be precise, , where σi is the standard deviation of the available δi. The lowest corrections (0.02–0.04) and the lowest standard deviations (0.10–0.16) are those for AMB-SIG, CTBTO, MOS, and USGS. Of the 1905 events without reviewed ISC magnitudes, 93 % are contributed by a single agency (the majority from CTBTO), and for (only) 7 % of them Eq. (1) is used.
4.1.3 Estimates of mb
The catalogue contains 6581 NMAR events with an mb value; of these 1128 are ICEL events. Again it is beneficial to split the period at year 1965. ISC-reviewed values are once more used when available, for 38 earthquakes out of 63 before 1965 and for 5262 out of 6545 since 1965. Of the 25 remaining earthquakes in the first period, Ambraseys and Sigbjörnsson (2000) provide mb for 17 events and USGS provide it for 4 events, and for 4 events an average is taken. Of the 1283 remaining earthquakes in the second period, there are 44 contributors of mb values, the largest being CTBTO and USGS. Final mb values are computed as for Ms: 82 % have a single contributor and 18 % use Eq. (1). Agency corrections and standard deviations are somewhat higher than for Ms, typically 0.1–0.2 and 0.15–0.25, respectively.
4.2 Uncertainty in magnitude estimates
4.2.1 A short survey of uncertainty estimates
Helffrich (1997) discusses the uncertainty in moment magnitudes in the GCMT and USGS catalogues, and his conclusion corresponds to a standard deviation in Mw of 0.05, 0.04, and 0.10, for deep, intermediate, and shallow events, respectively. Kagan (2003) studies the accuracy of earthquake catalogues extensively. Among his conclusions are the standard deviation of Mw for both the GCMT and the USGS catalogues on the order of 0.05–0.09 for deep to shallow earthquakes, 0.07–0.11 for Mw 6 to 8, and decreasing from 0.11 to 0.06 in the period 1980–2002. Werner (2008) models the magnitude accuracy of 25 000 events during 1980–2006 with a Laplace distribution. The confidence interval presented in the article corresponds to the confidence interval of a normal distribution with σ=0.08. Finally, Gasperini et al. (2012) conclude with an even lower value: σ(Mw)=0.07. Many of the estimates cited above are obtained by dividing the standard deviation of magnitude difference between the USGS and the GCMT catalogues by , on the assumption that the errors in them are independent and have the same variance. In reality the errors are probably correlated, so the cited values may be underestimates of the actual uncertainties.
With a little handwaving, Kagan (2003) estimates the uncertainty in Ms in the ISC catalogue to be about 0.2 and that of mb to be about 0.25. In line with these numbers, Kagan also concludes that when Ms and/or mb is turned into proxy Mw, the uncertainty is about 3–4 times higher than when Mw is found with moment tensor modelling. This reckoning is supported by both Werner (2008) and Gasperini et al. (2013).
4.2.2 Uncertainty in the best estimates
For earthquakes occurring before 1965, there are not enough data to compute the uncertainty objectively, so a subjective estimate must be used: for this period the uncertainty in Ms has been set to 0.25 and that in mb to 0.35.
After 1964, Eq. (1) is used. Let M denote the actual magnitude of an earthquake and Mg its “golden standard” estimated magnitude (which may be unavailable), MGCMT for moment magnitude and MISC for the other two magnitudes. Also, let d equal Mg−M. The uncertainty in Mg, or standard deviation of d, is set to
and these numbers are used directly when Mg is available and Mest is equal to Mg. Keeping in mind that almost all the earthquakes in the NMAR region are shallow, these uncertainties are perhaps somewhat lower than those quoted in Sect. 4.2.1. However, the accuracy of the global catalogues has probably improved since the quoted studies were carried out, and, furthermore, these studies do not explicitly specify GCMT or reviewed ISC magnitudes.
When Mg is not available and Mest is computed via Eq. (1), the error in the magnitude estimate may be partitioned into several terms:
using the knowledge that the wi values sum to 1. Treating d and δi as random variables and Δi as constants, this gives
The first term is given by Eq. (2), and Varδi and Cov(δi,δj) can be approximated by and σij, the data covariance of the available pairs (δi, δj). Finally, for the last term, we have
where ri is the correlation between d and δi. A reasonable constraint is that this correlation is positive: if Mg overestimates M, why should Mi overestimate M even more? Another constraint is that the estimated variance in Mest is not smaller than when the golden standard Mg can be used. The second constraint corresponds to . Selecting the middle road with seems reasonable: it gives ri in the range of 0.11–0.64 and on average 0.28. This choice corresponds to approximating the last term with and the uncertainty estimate:
The root-mean-square (rms) average uncertainty for all cases where Eq. (1) is used to estimate Mw is 0.113; for Ms it is 0.205, and for mb it is 0.302.
4.3 Proxy values for Mw
In the New Manual of Seismological Observatory Practice, Bormann et al. (2013) recommend the use of general orthogonal regression to convert between magnitude types when uncertainties in the types differ significantly, as when estimating Mw from Ms or mb. They also recommend using a nonlinear relationship. An implementation of such a procedure is given by Gasperini et al. (2013), which is based on Stromeyer et al. (2004), and also by Di Giacomo et al. (2015), and we have chosen to follow this procedure. A proxy Mw value is computed from Ms using
where Ms is the best estimate of Sect. 4.1 and a, b, and c are parameters determined by χ2 regression using MATLAB's optimisation toolbox and the formulae in Appendix B of Gasperini et al. (2013) (note that the two terms in curly braces in Eq. (B2) in the Appendix should be squared).
Bormann et al. (2013) and Di Giacomo et al. (2015) also recommend weighing data points in magnitude ranges with low data frequency higher (histogram equalisation). We use a moderately weighted regression of this type: an earthquake with moment and surface-wave magnitudes Mw and Ms receives a weight of . The effect is that the largest earthquakes weigh about twice as much as the smallest ones.
There is freedom in the regression to fix one of the uncertainties, σ(Ms) or σ(Mw), and it is also possible to fix their ratio. If the ratio is taken as 2.0, as in Gasperini et al. (2013), the NMAR data give σ(Ms)=0.176 and σ(Mw)=0.0881.
Exactly the same method could be used to compute Mw from best estimates of mb. However the NMAR dataset contains far fewer large earthquakes than the one used by Gasperini et al. (2013), so when this is attempted, the relationship turns out to be very slightly concave rather than convex (logarithmic rather than exponential). The nonlinearity is so slight that it can be ignored with a linear model. For earthquakes larger than about mb=5.75, an Ms value is almost always available and, as explained below, preferred. Thus a model valid for mb<5.75 is constructed and used:
Earthquakes in the Bárðarbunga caldera (Fig. 1) exhibit a different relationship between Mw and mb than the rest of the dataset: for the same Mw, their mb is ∼ 0.15 higher. Therefore a separate model is used for these earthquakes. The relationship between Mw and Ms is also slightly different in the caldera than elsewhere, and for consistency separate models are also used in this case. The ratio used by Gasperini et al. (2013), , gives σ(mb)=0.225 and σ(Mw)=0.0900.
As one might expect, the deviation in the Ms model is considerably lower than in the mb model (Fig. 3). Thus Ms is used to compute a proxy Mw when it is available, for 4217 events in the NMAR region, of which 933 are in the ICEL region. In the absence of an Ms value, the mb relation must be used, for 2954 events in NMAR, of which 379 are in ICEL. Ms is available for almost all large earthquakes, the ones that are important for hazard assessment. Only three mb>5 values are used to compute proxy Mw in the ICEL region, and therefore the regression only uses data with mb<5.5 (Fig. 3).
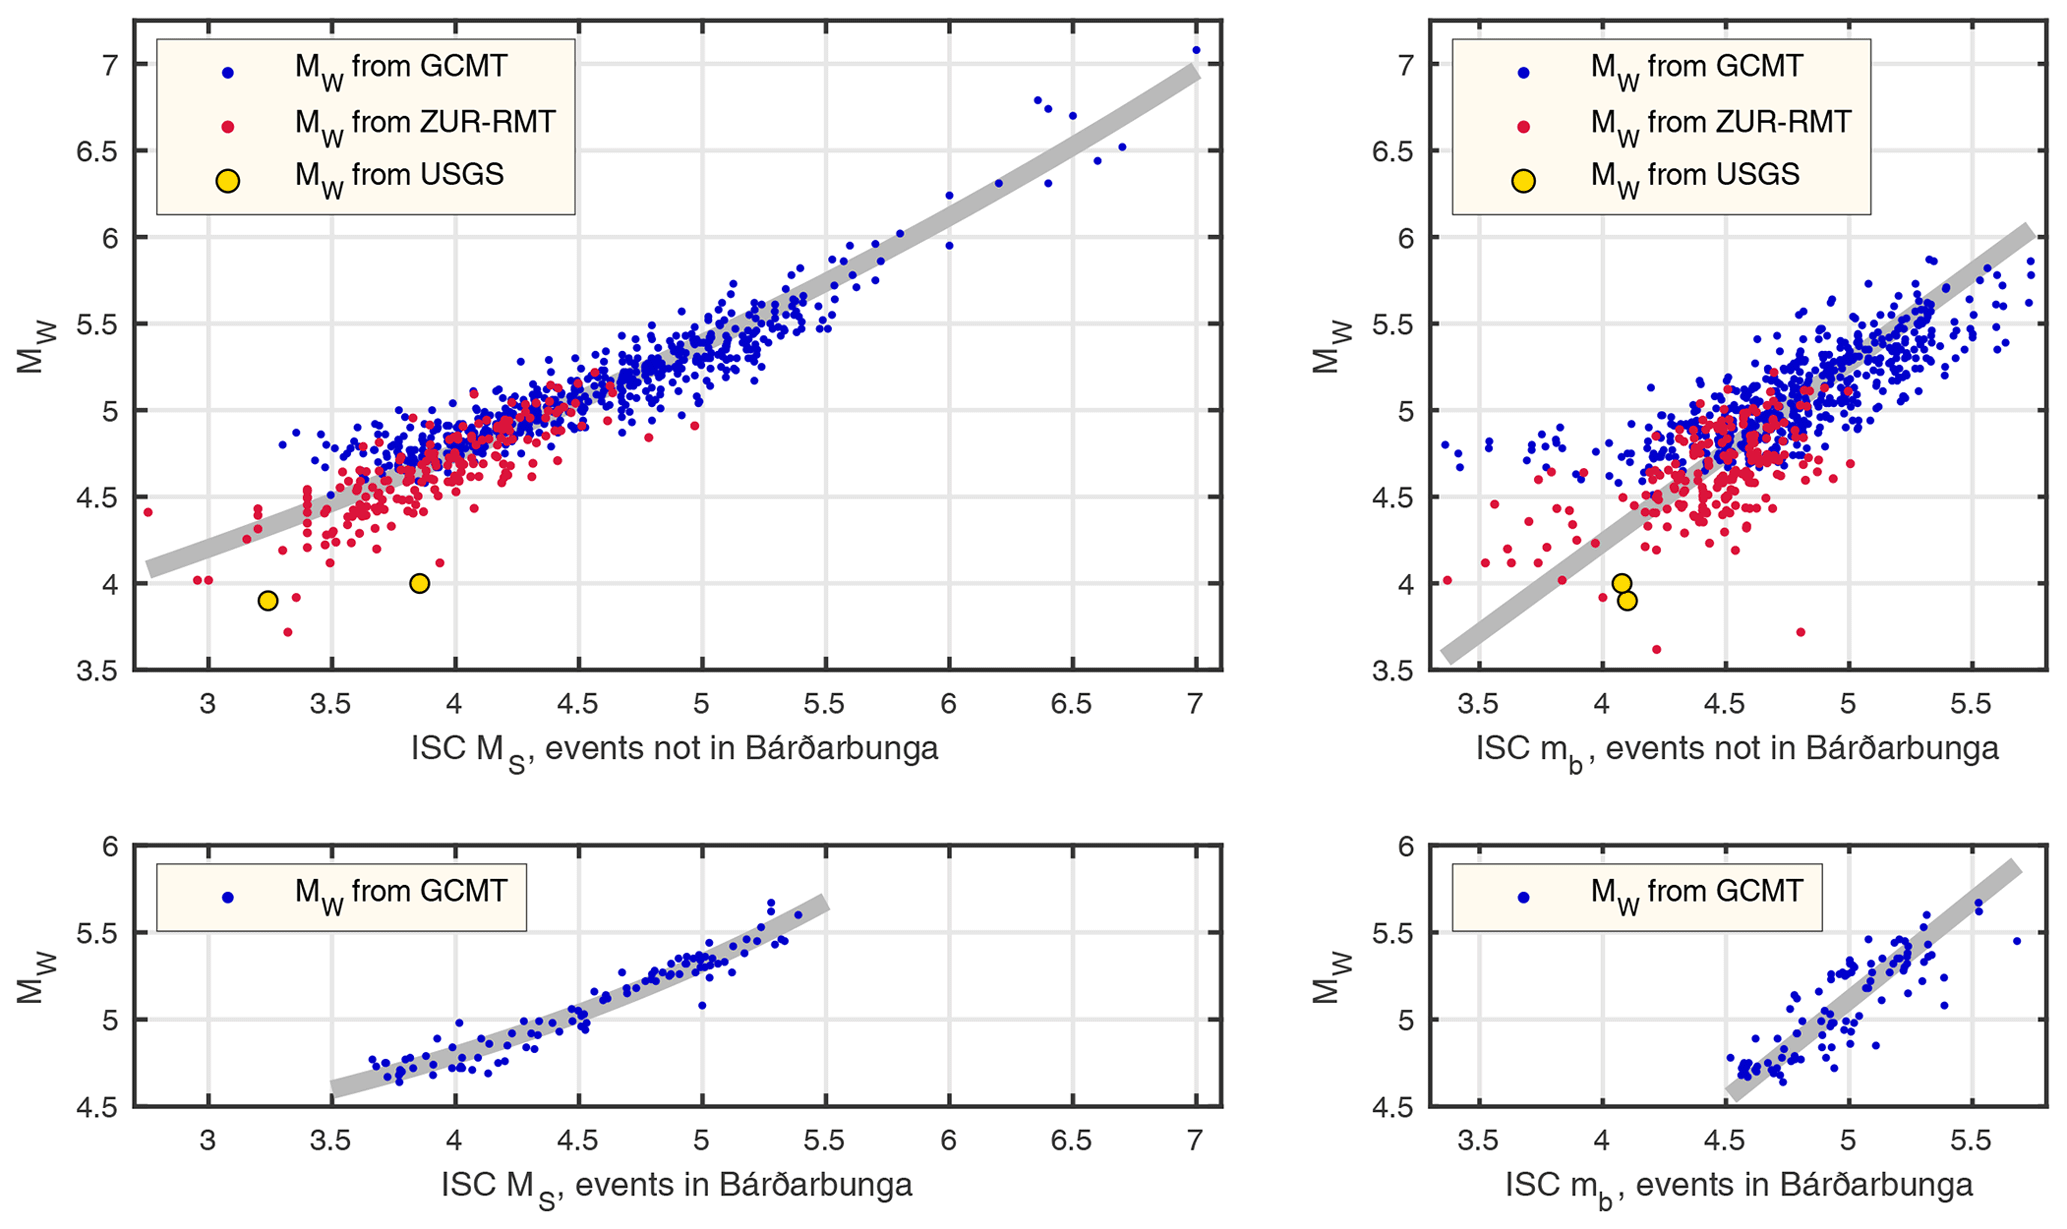
Figure 3Magnitude pairs for earthquakes in the northern Mid-Atlantic Ridge (NMAR) region 1976–2019, exponential relations for Ms and linear relations for mb, all fitted with χ2 regression. There are 733 Mw–Ms pairs outside Bárðarbunga and 95 in it and 744 Mw–mb pairs outside and 97 in Bárðarbunga. Note that a few earthquakes with mb<3.5, thus not included in the final catalogue, are used for the regression. A slight random jitter has been applied to the pairs to avoid superimposing different data points.
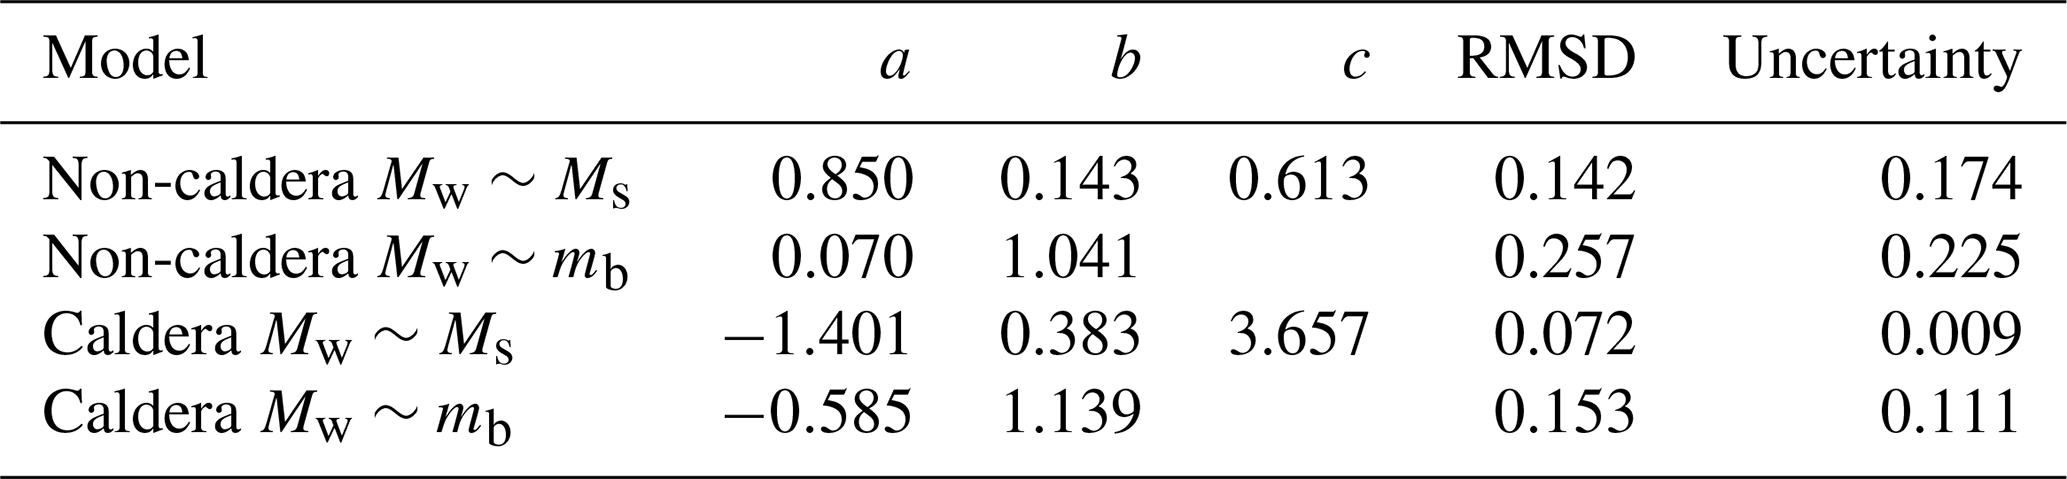
To use a somewhat round number and to have a single Mw uncertainty, the current work uses σ(Mw)=0.09 for all the models, mb and Ms, in and outside Bárðarbunga (Fig. 3, Table 1). These uncertainty values are in good agreement with the results quoted in Sect. 4.2.1, although perhaps somewhat lower, which might reflect that our data are more recent and that there is continuous improvement in the quality of the global catalogues.
Table 1Parameters of exponential and linear models for Mw, obtained with σ(Mw)=0.09; see Eqs. (5) and (6), RMSD is the root-mean-square deviation between the model and the y coordinates of the data, and the last column gives the estimated σ(mb) and σ(Ms).
To study possible change in the Ms–Mw relationship or in the accuracy of the moment tensor Mw values, separate modelling was tested for a few subperiods. A slight, somewhat erratic, improvement in the accuracy was observed, but there was no significant change in the relationship. Thus it was decided to use a single model for the whole period.
4.4 Uncertainty in the proxy magnitudes
Following Gasperini et al. (2013), the variance of for an earthquake obtained with Ms regression may be estimated with
where is the variance estimate for the earthquake, obtained as described in Sect. 4.2.2, σ(Mw) is 0.09 as in Sect. 4.3, f is the model function given in Eq. (5), and a and b are the regression parameters (Table 1). The values of σproxy computed with Eq. (7) are in the range 0.11–0.24, and their rms average is 0.15, indicating that only a few earthquakes have uncertainty at the high end of the range. A similar procedure is used in the mb regression case, and the uncertainties given by the analogue of Eq. (7) are in the range 0.26–0.53 (rms avg 0.27). For the caldera models, the uncertainty ranges are 0.10–0.18 (rms avg 0.11) for Ms and 0.28–0.39 (rms avg 0.28) for mb. Note that because , σproxy will be smaller than σMS.
4.5 Uncertainty in recent local magnitudes
The SIL system described in Sect. 2.2.1 provides two types of local magnitudes, denoted Ml and Mlw (Rögnvaldsson and Slunga, 1993). To assess the uncertainty in these values, χ2 regression has been applied, with modelled (non-proxy) Mw magnitudes on the y axis and Ml and Mlw on the x axis with σ(Mw)=0.09, as in Sect. 4.3 (with caldera earthquakes excluded). The resulting estimates are σ(Ml)=0.47 and σ(Mlw)=0.57, far higher than the corresponding values 0.18 for Ms and 0.23 for mb. Restricting the comparison to earthquakes onshore (24 events) gave an improved σ(Ml) of 0.22 but a worse σ(Mlw) of 0.75. In all cases there is a considerable negative bias of 0.6–1.4 magnitudes, more offshore (outside the SIL network) than onshore. One explanation for the large spread and bias of the local magnitudes is that the SIL system's analysis is optimised towards robust magnitude estimation of earthquakes smaller than those of this comparison. Figure 4 shows the spread of the data, evidently in line with these estimates. There would be no meaning in showing the regression curves because of the high uncertainties.
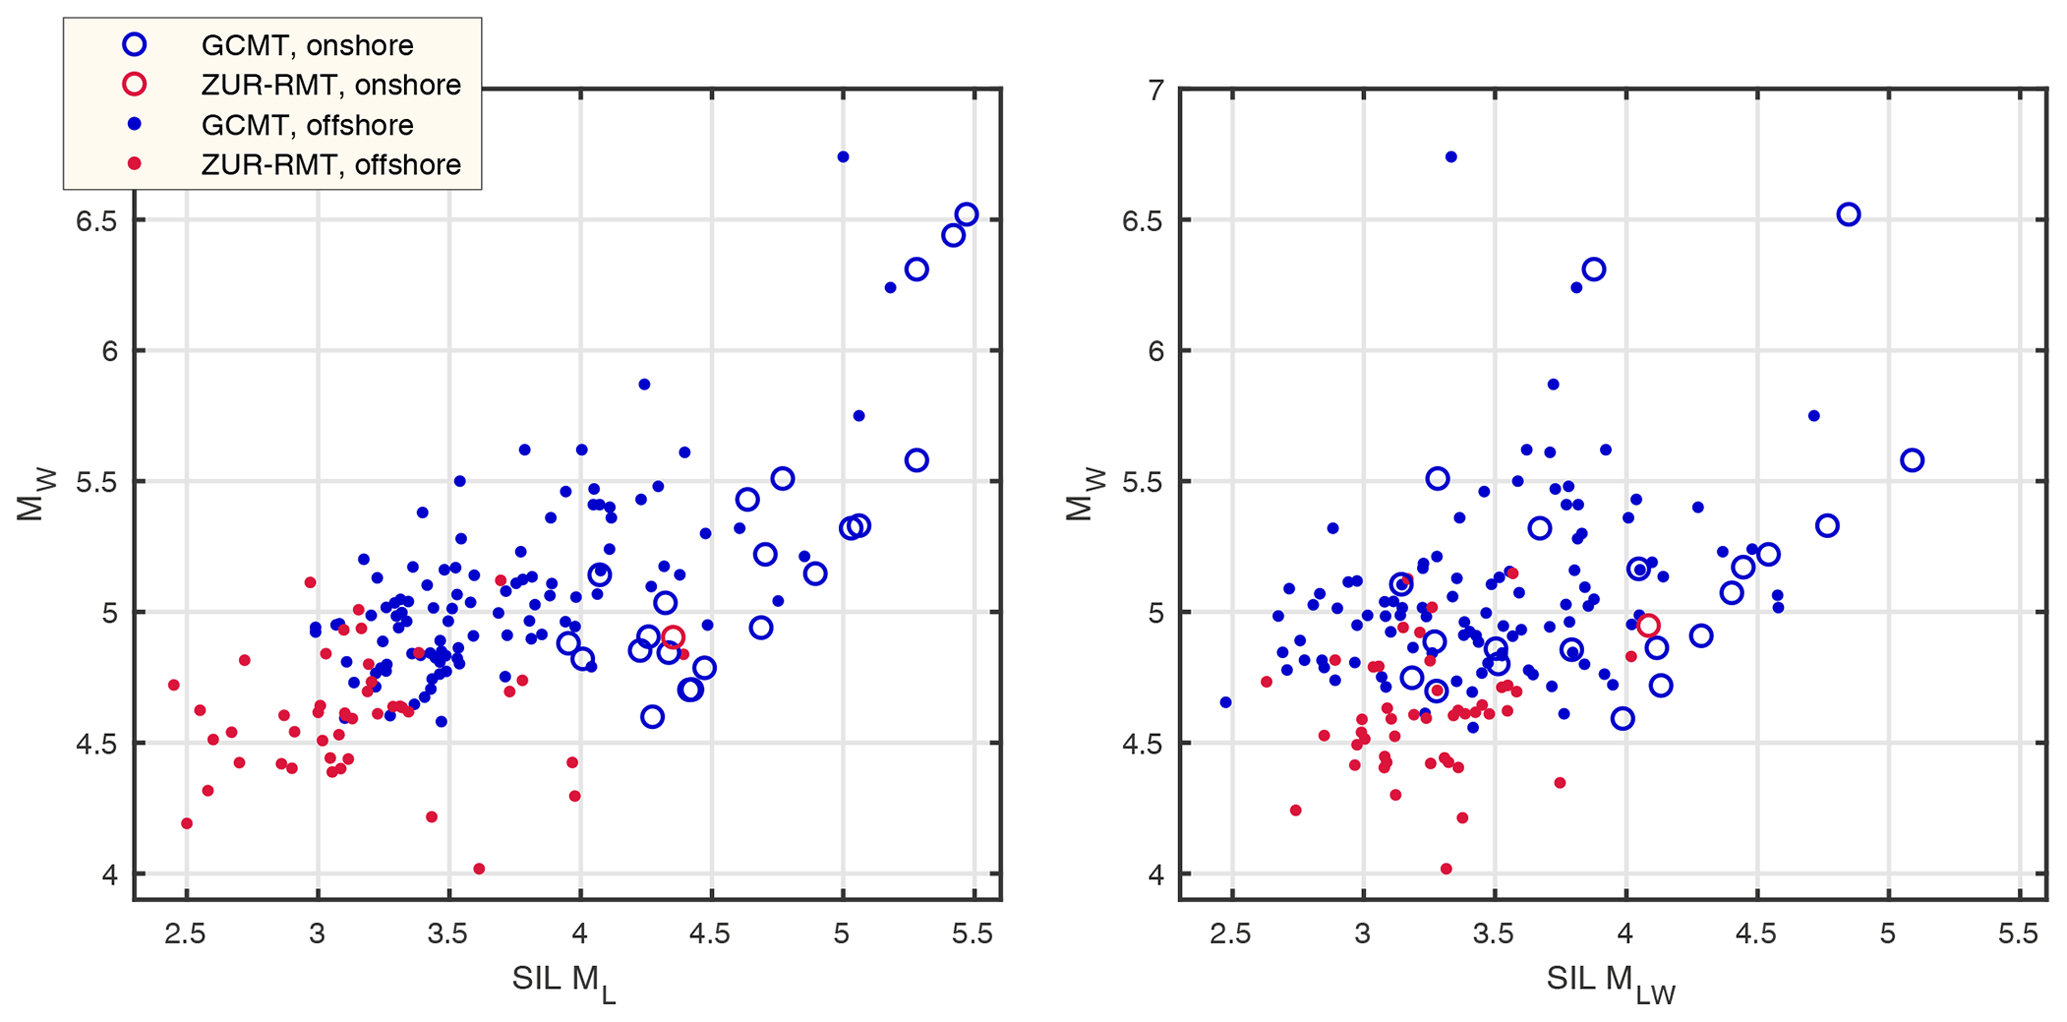
Figure 4Moment tensor modelled magnitudes (Mw) and two types of local magnitudes computed by the SIL system (see Sect. 2.2.1). Earthquakes in the calderas Bárðarbunga and Katla have been excluded, but apart from that all events with both SIL and Mw magnitudes are included, 24 onshore and 146 offshore. The ZUR-RMT Mw values were computed by the Swiss Seismological Service 2000–2005.
The primary results of this study is the ICEL-NMAR catalogue, described briefly in the next subsection. Section 5.2 discusses the completeness of the catalogue as a function of magnitude and time. Next is a section which compares the new catalogue with the ISC-GEM catalogue discussed in the introduction, and finally there is a section with a general discussion. The catalogue earthquakes within the region 63–67∘ N, 13–25∘ W, are plotted in Fig. 5.
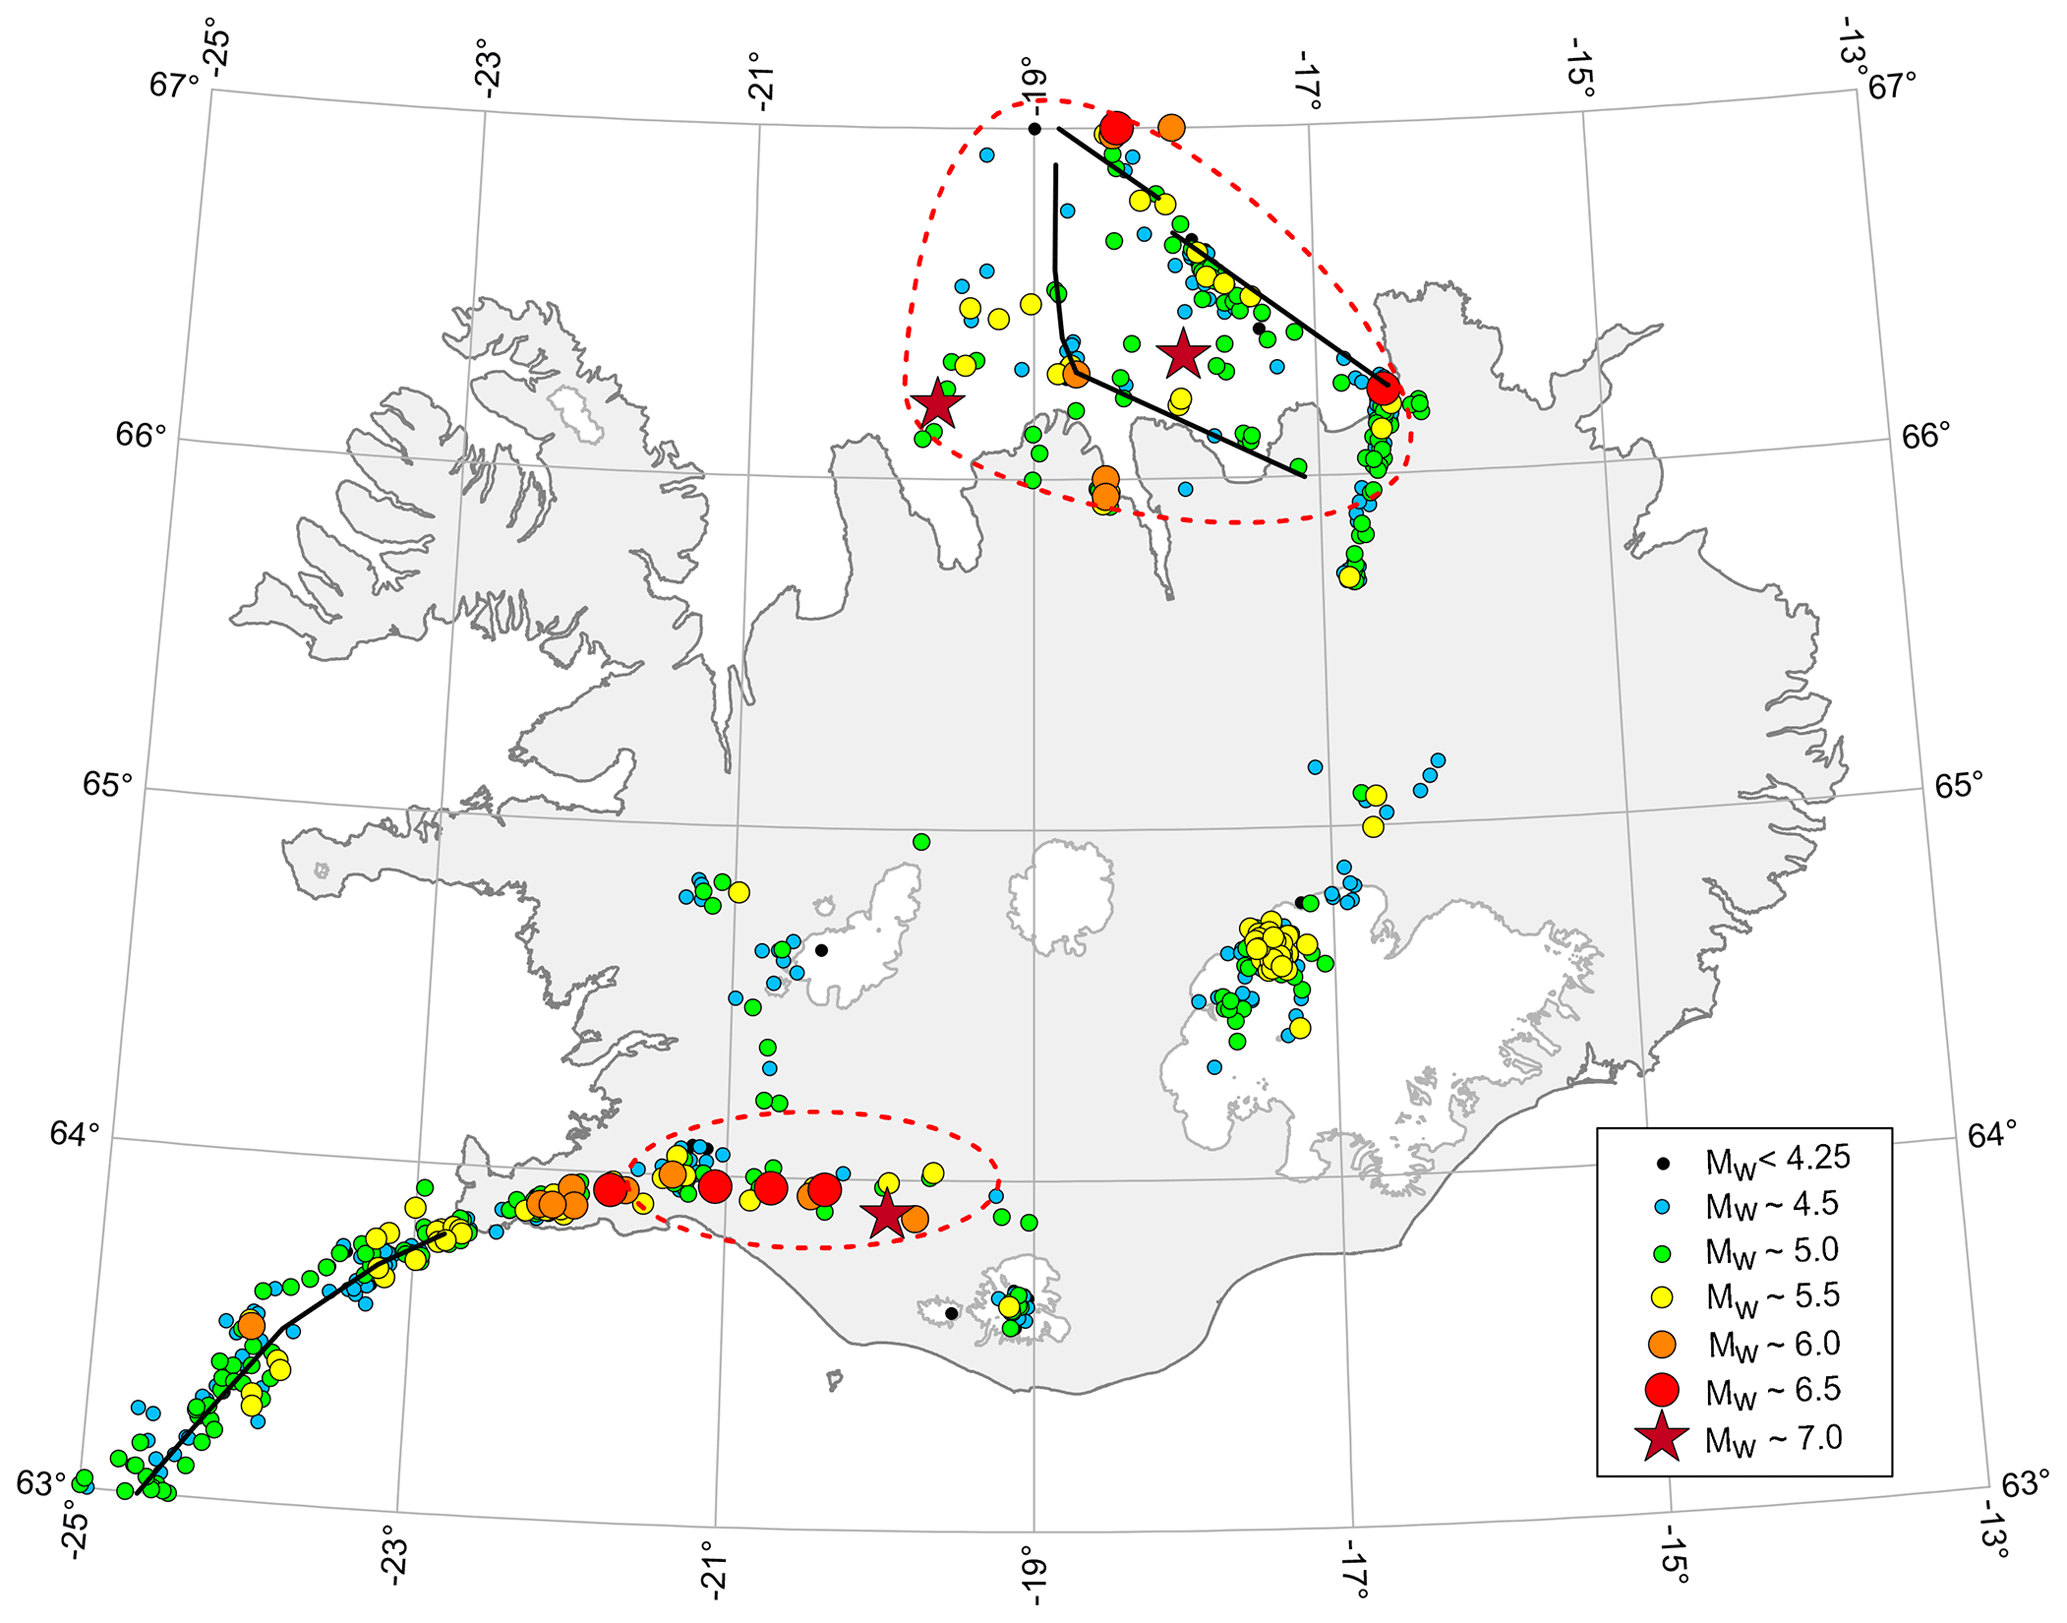
Figure 5Earthquakes in or near Iceland during 1900–2019 listed in the new catalogue. For the first part of the period, location coordinates are often given in round numbers (tenths of degrees or even half or whole degrees). The map shows slightly jittered locations (≤ 3 km, except when Mw>5.75) to avoid superimposing different events. The magnitude range for the smallest earthquakes is Mw 4–4.25. For the other ranges the central value is specified so that, for example, Mw ∼ 4.5 implies the range 4.25–4.75. The largest event is Mw 7.00 in the TFZ at 18∘ W. The indicated tectonic features are explained in Fig. 2.
5.1 The ICEL-NMAR Earthquake Catalogue
The new catalogue is available in the repository Mendeley Data, as the ICEL-NMAR Earthquake Catalogue (Jónasson et al., 2021). There are three files, icel-nmar-v3.txt with the actual earthquake data, supporting-info-v3.txt with meta information, and origin-time-v3.txt. For each earthquake icel-nmar-v3.txt provides the region (ICEL or NMAR), origin time, location, Mw, Mw uncertainty estimated with Eqs. (4) or (7) as appropriate, and information on how the Mw value is computed or what its source is. When available, similar information for Ms and mb are given, and finally information on the origin time and location sources is given. For completeness, all available origin times are provided in origin-time-v3.txt. All events smaller than Mw 4 were excluded and the uncertainty was not computed for Mw<4.5 because the regression accuracy is reduced at the lower magnitudes. Hypocentral depth is not provided in the catalogue. The brittle part of the Icelandic crust in most areas is less than 12 km thick, and earthquakes of any significance will rupture the whole thickness (Hjaltadóttir, 2010; Pedersen et al., 2003; Stefánsson et al., 1993).
5.2 Magnitude of completeness
To investigate the magnitude of completeness of the new harmonised catalogue for the whole NMAR region, two methods were used. Firstly, histograms with 10- to 30-year bins of the earthquake count with magnitudes exceeding different thresholds were created (Fig. 6), and secondly Gutenberg–Richter models were constructed for a few selected periods and minimum magnitudes. The histograms show that the catalogue appears to be complete for Mw≥6 for the whole period, for Mw≥5.5 since 1915, for Mw≥5 since 1970, and for Mw≥4.5 since 2000. Gutenberg–Richter modelling with simple declustering (Gardner and Knopoff, 1974) indicates a magnitude of completeness of 5.5 for the whole period and 4.5 for the period after 1970 (data not shown). For the ICEL region similar histograms indicated a completeness magnitude of 5.5 for the whole period, 5 from 1915, and 4.5 from 1965.
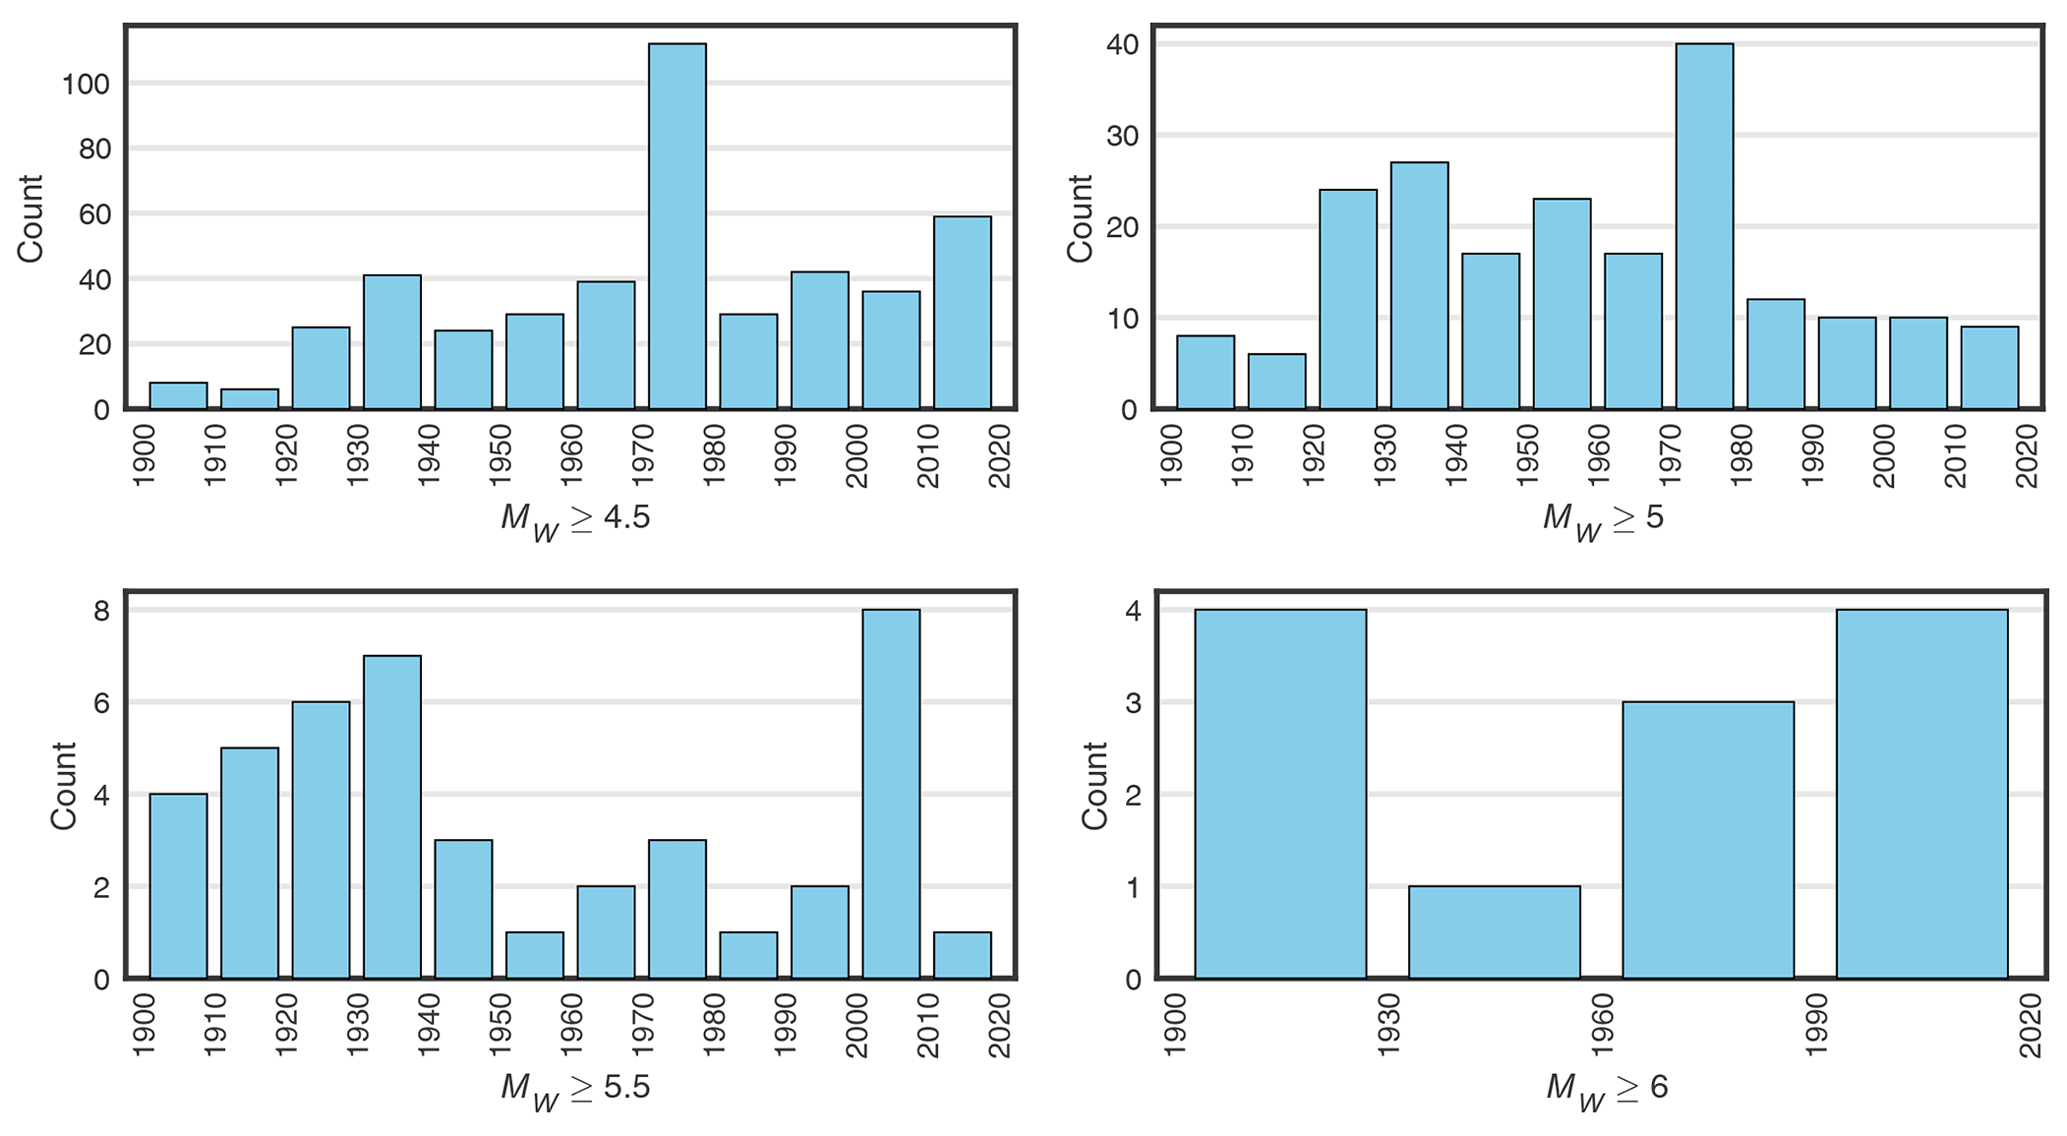
Figure 6Count of earthquakes in the NMAR region exceeding different Mw thresholds according to period.
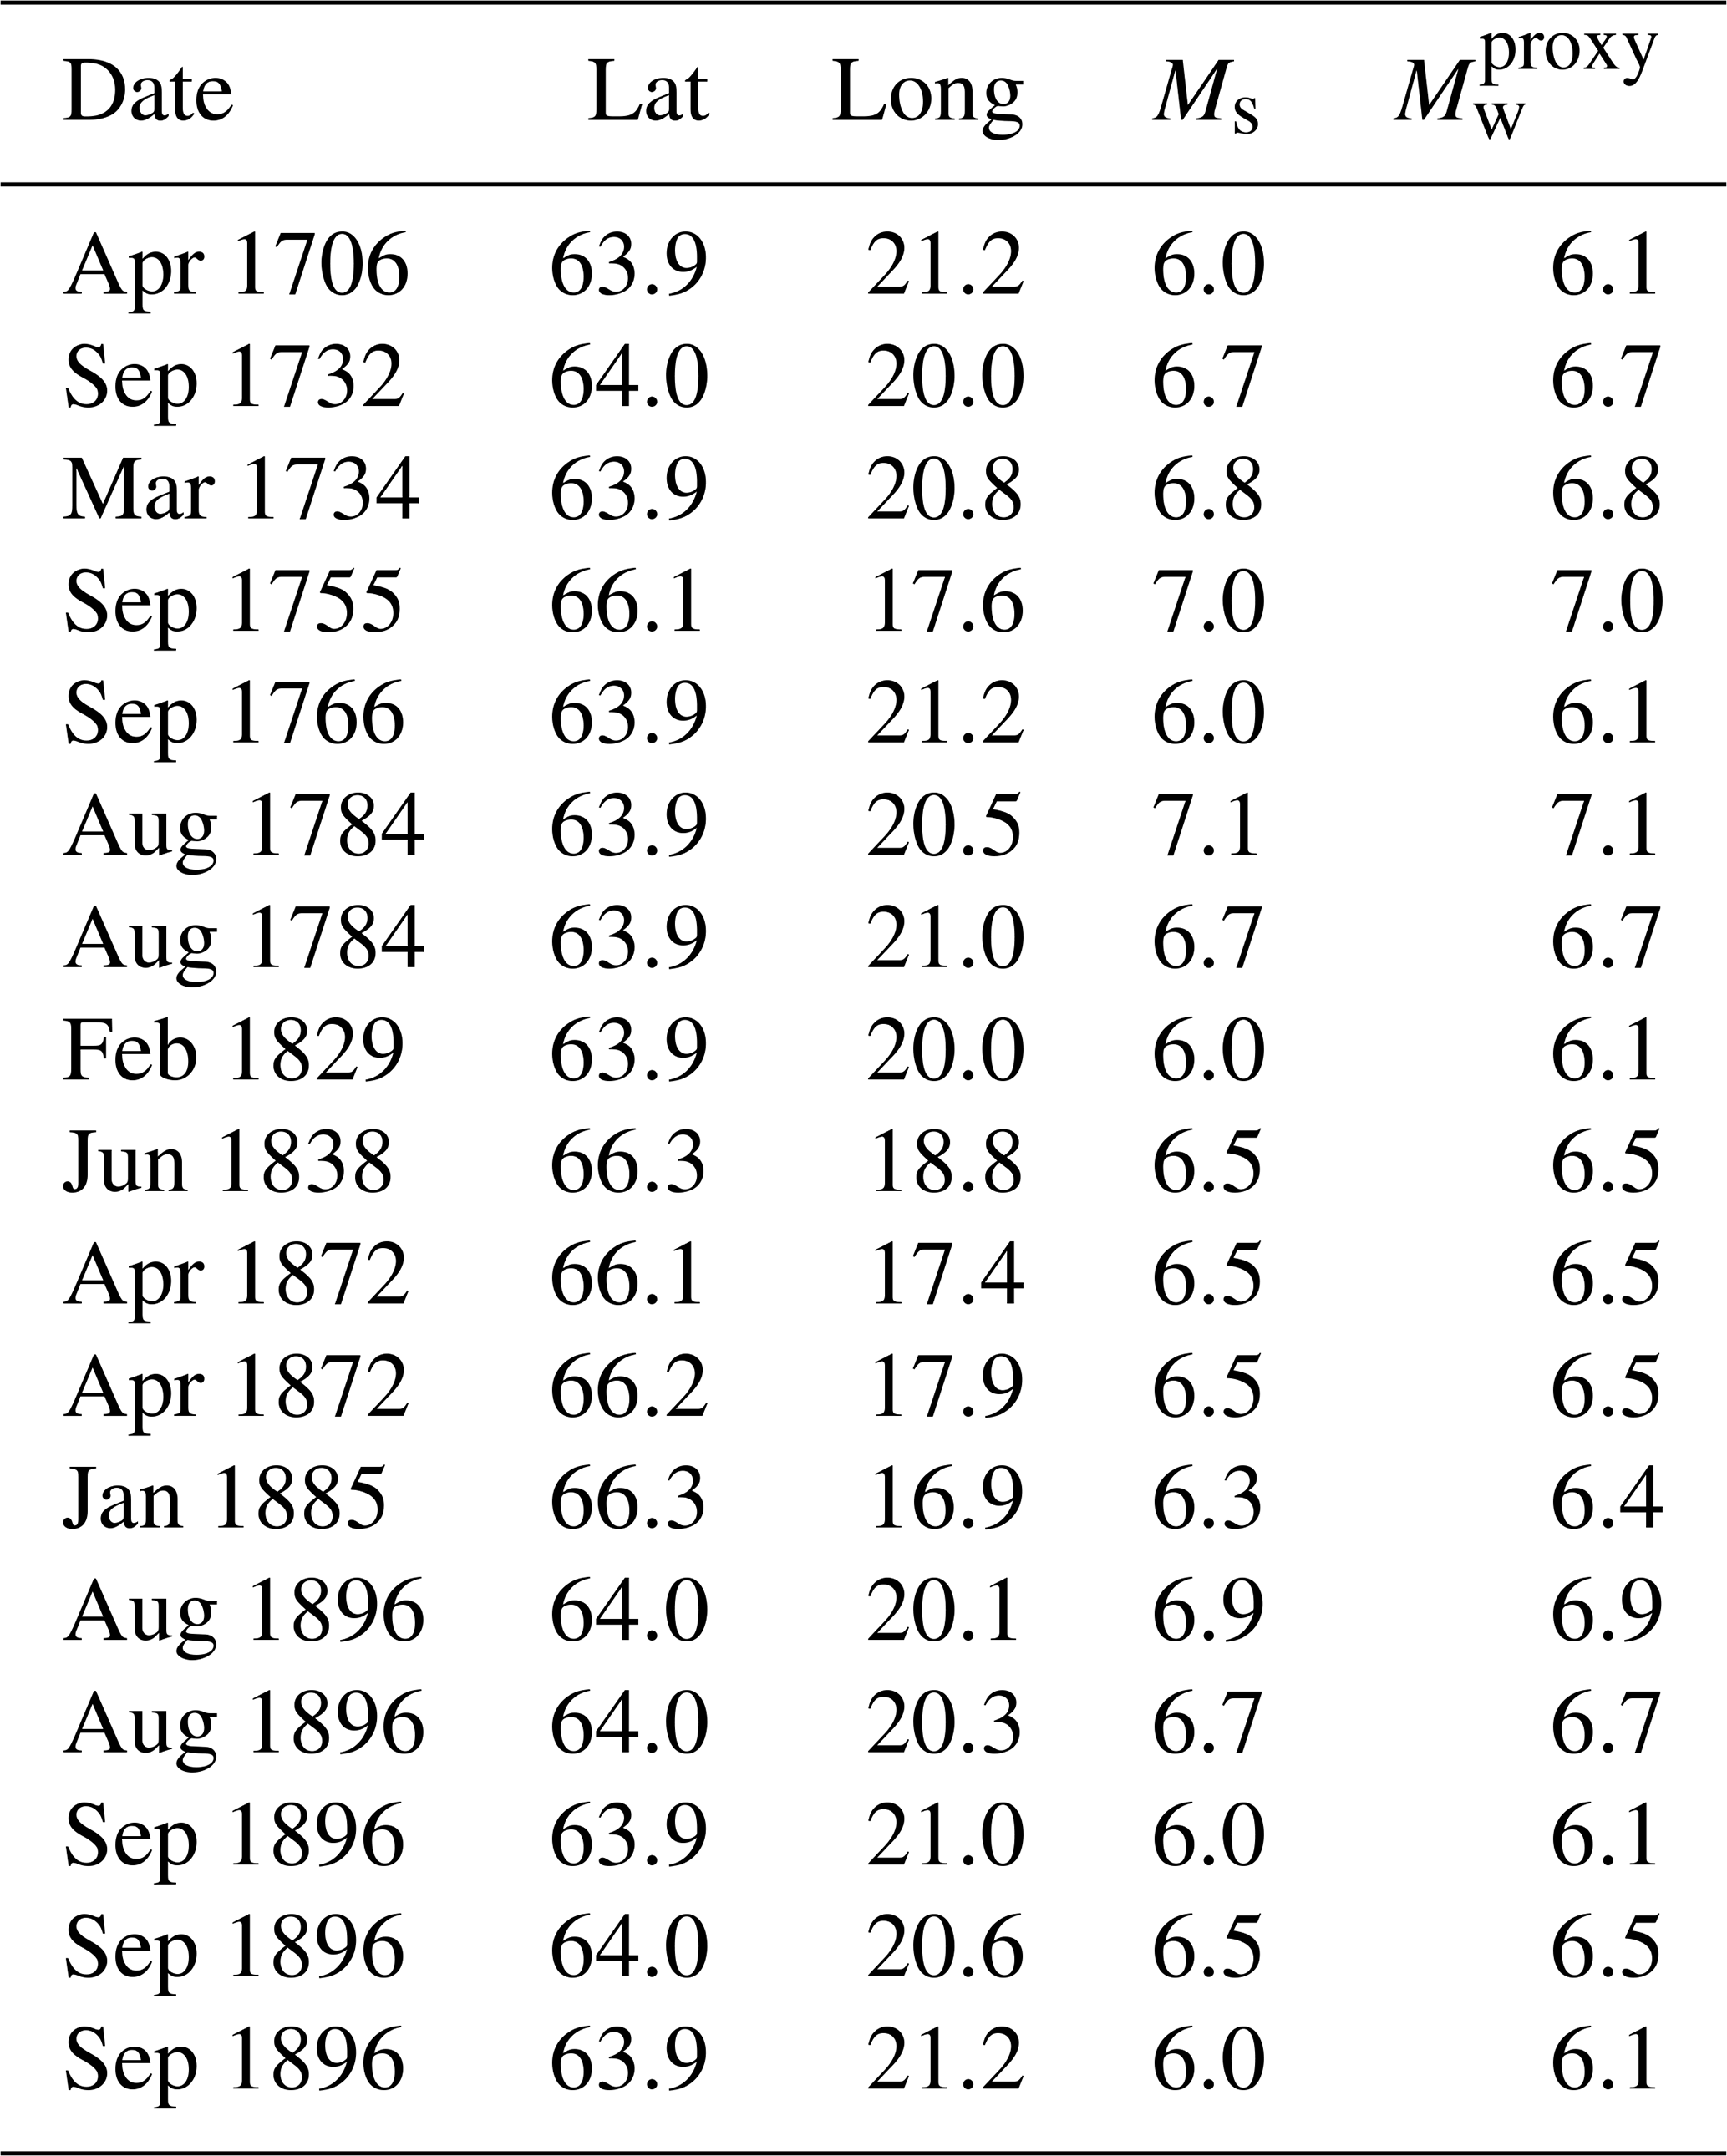
It is interesting to compare the number of large events during the 20th century with lists of historical earthquakes in earlier centuries. Table 2 shows earthquakes with estimated magnitude ≥6 in Iceland or within 20 km offshore during 1700–1899, in total 17 events. In the new catalogue there are 8 earthquakes with Mw≥6 in the 20th century in the same region and 4 more in the first 2 decades of the 21st century.
Table 2Historical large earthquakes in Iceland in the 18th and 19th centuries. The magnitude estimates are based on the resulting damage (Halldórsson, 1992b; Stefánsson et al., 2008; Sólnes et al., 2013). The epicentral locations are approximate, but overall the longitude is more accurate than the latitude since in most cases N–S surface faults have been mapped and linked to the largest events. Note that these earthquakes are not included in the new catalogue.
In the final catalogue there are a few periods with disproportionately many earthquakes connected to tectonic activity (SISZ 2000 and 2008) and volcanic activity (Krafla region 1975–1976, Hengill 1994–1999, Bárðarbunga 2014–2015).
In the wake of large earthquakes it is possible that other events are triggered by their propagating waves. These secondary events can be missing from the international catalogues because their signal is lost in the coda of the primary event at teleseismic distances. Examples of this are two events on the Reykjanes Peninsula triggered by the Mw 6.52 South Iceland event on 17 June 2000 15:40:41 UTC, occurring 26 and 30 s later and 65 and 80 km farther west, respectively. The size of the first one was estimated to be Ml 5.5 (Antonioli et al., 2006), and that of the second one was estimated to be Mw 5.79 (Pagli et al., 2003). Our estimated Mw for the first event is 5.5, and both Mw values have been added to the new catalogue with uncertainties of 0.4 and 0.2, respectively. These are the only events that do not come from one of the four teleseismic catalogues of Sect. 2.1.
5.3 Comparison with the ISC-GEM catalogue
Version 7.0 of the ISC-GEM catalogue was released in 2020. In the NMAR region it contains far fewer events than our new catalogue (168, with Mw in the range of 5.42–7.00), and no local information is used to relocate them. Non-proxy Mw magnitudes in ISC-GEM and the current catalogue are identical, but in general the proxy values differ, both because ISC-GEM uses a different regression model and because the underlying Ms and mb data may differ. The difference in the more important Ms regression curves is slight. Comparing Fig. 3 and the corresponding figure in Di Giacomo et al. (2015), for Ms=5 the ISC-GEM curve is 0.06 higher, for Ms=6 it is 0.02 lower, and for Ms=7 it is 0.05 lower.
There are 119 earthquakes with proxy Mw common to the catalogues; of these 30 are in the ICEL region. Their ISC-GEM magnitudes are on average 0.06 lower than the ones presented here. The largest absolute difference is 0.47, and for 85 events the difference is less than 0.2. For the ICEL region, the mean difference is 0.02 and the largest absolute one is 0.26, and there are 24 events which differ by less than 0.2 magnitudes.
A few events which differ the most were investigated, and it transpired that the explanation was usually a combined effect of the regression curve difference and the underlying data difference.
5.4 Cumulative seismic moment and the earthquake cycle
The question arises of how representative the seismic activity of the catalogue period is for any period of 120 years. The answer depends on the length of the typical earthquake cycle. If the cycle is significantly longer than 120 years, our sample may underestimate the seismicity greatly, e.g. if the period does not contain a characteristic maximum magnitude earthquake. Studies of South Iceland earthquakes indicate that we may be near this critical duration of the cycle. The study of Einarsson et al. (1981) gave an average time between major earthquake sequences of about 80 years, ranging between 45 and 112 years. Stefánsson and Halldórsson (1988) concluded that the South Iceland Seismic Zone (SISZ) had a total release of accumulated strain in about 140 years. Decriem et al. (2010) estimated the accumulated strain by plate movements since the 1896–1912 earthquakes and compared this to the released seismic moment during the earthquakes of 2000 and 2008. They found that only about half of the strain had been released by these events.
For comparison with our catalogue, we estimate the potential seismic moment release in the two fracture zones, the SISZ and the TFZ, by a simplified geometric model of two transform faults parallel to the relative plate motion. The simplification is justified by the arguments of Sigmundsson et al. (1995), who showed that the seismic moment of many closely spaced, short transverse faults (bookshelf faults) is equivalent to that released by a single transform fault. We also assume that almost all the seismic moment is released by the transform zones and not by the divergent segments of the plate boundary or the magmatically induced seismicity. The length of the transform zones is taken as 180 and 150 km for the South Iceland and North Iceland zones, respectively, i.e. the offset of the ridge axes. The width of the fault is taken to be the thickness of the seismogenic part of the crust, about 10 km, below which the slip is assumed to be aseismic. The spreading rate is 19 mm/yr, and the shear modulus is 20×109 Pa (McGarr and Barbour, 2018). The moment rate will then be
This result can be compared with the total seismic moment released in Iceland during the catalogue period, which may be estimated using the catalogue data and the completeness information of Sect. 5.2. Such computation for all earthquakes ≥Mw 4 in the area shown in Fig. 6, excluding the Reykjanes Ridge and Bárðarbunga, gives a total of 1.61×10²⁰ Nm. Adding a simple correction for smaller events assuming the Gutenberg–Richter law with b=1 raises the estimate to 1.64⋅1020 Nm, corresponding to an annual rate of 1.37×10¹⁸ Nm/yr. This agrees quite (even surprisingly) well with the result of Eq. (8).
5.5 General discussion
We have constructed a new catalogue of earthquakes in Iceland and, as a byproduct, for the northern Mid-Atlantic Ridge. A general criterion for entry into the catalogue is that an earthquake has been instrumentally recorded by agencies outside Iceland. Locations of events in the ICEL region (Fig. 1) have been reassessed, and proxy Mw values for earthquakes without modelled moment magnitudes have been computed. The resulting moment magnitudes range from 4 to 7.08. For the ICEL region the catalogue is reasonably complete for Mw≥5.5 for the whole period. There are 36 earthquakes of this size onshore or less than 20 km offshore, i.e. 2.8 per decade, and of these 10 have Mw≥6, i.e. 0.8 per decade.
To our knowledge, the map in Fig. 5 is the first earthquake map of Iceland which is not substantially confounded by misplaced events. The locations of the two large TFZ events marked with a star in Fig. 5 (the easternmost 1910 and the westernmost 1963) are still uncertain and controversial. Neither of them appears to have occurred on the best known structures, the Húsavík-Flatey Fault or the Grímsey Oblique Rift. Stefánsson et al. (2008) suggest that the 1963 event originated on a NNE-striking fault offshore Skagafjörður, based on the distribution of recent earthquakes and the focal mechanism solutions of Stefánsson (1966) and Sykes (1967). They furthermore suggest that the 1910 event originated on the eastern margin of the Grímsey Shoal. We adopt these locations in our catalogue. Distribution of epicentres and recent bathymetric data support these suggestions (Einarsson et al., 2019).
The largest events occur in the two seismic zones, where the plate boundaries are parallel to the plate movements (Figs. 1 and 5). The distance from these events to the Reykjavík capital area, where 63 % of the population live, is some tens of kilometres, and the same holds for Akureyri in North Iceland, with 5 % of the population. However there are several towns and villages within the zones. An important future task is to carry out a detailed analysis of the seismic hazard both in these urban areas and elsewhere in Iceland. The new catalogue should prove to be an essential resource for such seismic hazard mapping.
The international earthquake catalogues from USGS, GCMT, and the ISC are freely available online. In addition we used the catalogue of Ambraseys and Sigbjörnsson (2000), as well as scattered data on individual earthquakes from various printed sources, as detailed in Sect. 2. We also used the Icelandic Meteorological Office catalogue for the period 1926–2019. Work is currently underway to put at least part of this catalogue online. The new catalogue is available in the repository Mendeley Data (https://data.mendeley.com/datasets/7zh6xg22cv/3; Jónasson et al., 2021).
KJ and BB prepared the manuscript with contributions from all authors. KJ and ÁH wrote software for data processing. PE, GBG, KJ, BB, BB, and KV reappraised event locations.
The authors declare that they have no conflict of interest.
Publisher's note: Copernicus Publications remains neutral with regard to jurisdictional claims in published maps and institutional affiliations.
We thank all the people and institutions who have set up seismometers, gathered data from these, and used them to compute earthquake locations and magnitudes. Without their contribution this work would not have been possible. The public datasets that we have used are available from three open web sources: the ISC Bulletin event catalogue (2020), the GCMT Catalog (2020), and the USGS Earthquake Catalog (2020). Finally, we use the earthquake catalogue of the Icelandic Meteorological Office for the period 1926–2019.
Contributions of Kristín Vogfjörd were supported by the RISE project (grant no. 821115) under the EC Horizon 2020 programme.
This paper was edited by Filippos Vallianatos and reviewed by Jim Dewey and one anonymous referee.
Ambraseys, N. N. and Sigbjörnsson, S.: Re-appraisal of the seismicity in Iceland, Earthquake Engineering Research Centre, University of Iceland, Selfoss, Iceland, ISBN 9797989914X, 2000. a, b, c, d, e, f, g, h, i
Antonioli, A., Belardinelli, M., Bizzarri, A., and Vogfjord, K.: Evidence of instantaneous dynamic triggering during the seismic sequence of year 2000 in south Iceland, J. Geophys. Res.-Sol. Ea., 111, B03302, https://doi.org/10.1029/2005JB003935, 2006. a
BAAS: Seismological Committee, quarterly issues, BAAS F. Econ., 1913–1917. a
Björnsson, S., Einarsson, P., Tulinius, H., and Hjartardóttir, A. R.: Seismicity of the Reykjanes Peninsula 1971–1976, J. Volcanol. Geoth. Res., 391, 106369, https://doi.org/10.1016/j.jvolgeores.2018.04.026, 2020. a
Bormann, P., Wendt, S., and DiGiacomo, D.: Seismic Sources and Source Parameters, chap. 3, in: New Manual of Seismological Observatory Practice 2 (NMSOP-2), edited by: Bormann, P., Deutsches GeoForschungszentrum GFZ, Potsdam, 1–259, https://doi.org/10.2312/GFZ.NMSOP-2, 2013. a, b
Brandsdóttir, B. and Einarsson, P.: Seismic activity associated with the September 1977 deflation of the Krafla central volcano in northeastern Iceland, J. Volcanol. Geoth. Res., 6, 197–212, 1979. a
Braunmiller, J., Kradolfer, U., Baer, M., and Giardini, D.: Regional moment tensor determination in the European–Mediterranean area–initial results, Tectonophysics, 356, 5–22, 2002. a
Buck, W. R., Einarsson, P., and Brandsdóttir, B.: Tectonic stress and magma chamber size as controls on dike propagation: Constraints from the 1975–1984 Krafla rifting episode, J. Geophys. Res.-Sol. Ea., 111, B12404, https://doi.org/10.1029/2005JB003879, 2006. a
Bödvarsson, R., Rögnvaldsson, S. T., Jakobsdóttir, S., Slunga, R., and Stefánsson, R.: The SIL data acquisitional and monitoring system, Seismol. Res. Lett., 67, 35–47, 1996. a
D'Amico, V., Albarello, D., Sigbjörnsson, R., and Rupakhety, R.: Seismic hazard assessment for Iceland in terms of macroseismic intensity using a site approach, B. Earthq. Eng., 14, 1797–1811, 2016. a
Decriem, J., Árnadóttir, T., Hooper, A., Geirsson, H., Sigmundsson, F., Keiding, M., Ófeigsson, B. G., Hreinsdóttir, S., Einarsson, P., LaFemina, P., and Bennett, R. A.: The 2008 May 29 earthquake doublet in SW Iceland, Geophys. J. Int., 181, 1128–1146, https://doi.org/10.1111/j.1365-246X.2010.04565.x, 2010. a
Di Giacomo, D. and Storchak, D. A.: A scheme to set preferred magnitudes in the ISC Bulletin, J. Seismol., 20, 555–567, 2016. a, b
Di Giacomo, D., Bondár, I., Storchak, D. A., Engdahl, E. R., Bormann, P., and Harris, J.: ISC-GEM: Global instrumental earthquake catalogue (1900–2009), III. Re-computed MS and mb, proxy M W, final magnitude composition and completeness assessment, Phys. Earth Planet. In., 239, 33–47, 2015. a, b, c, d
Dziewonski, A. M., Chou, T.-A., and Woodhouse, J. H.: Determination of earthquake source parameters from waveform data for studies of global and regional seismicity, J. Geophys. Res.-Sol. Ea., 86, 2825–2852, 1981. a
Einarsson, P.: Earthquakes and present-day tectonism in Iceland, Tectonophysics, 189, 261–79, 1991. a, b
Einarsson, P.: Plate boundaries, rifts and transforms in Iceland, Jökull, 58, 35–58, 2008. a
Einarsson, P.: Mechanisms of earthquakes in Iceland, in: Encyclopedia of Earthquake Engineering, edited by: Beer, M., Patelli, E., Kougioumtzoglou, I. A., and Au, S. K., Springer, Berlin, Heidelberg, 2015. a
Einarsson, P.: Short-term seismic precursors to Icelandic eruptions 1973–2014, Front. Earth Sci., 6, 45, https://doi.org/10.3389/feart.2018.00045, 2018. a
Einarsson, P. and Brandsdóttir, B.: Seismological evidence for lateral magma intrusion during the July 1978 deflation of the Krafla volcano in NE-Iceland, J. Geophys., 47, 160–165, 1980. a
Einarsson, P., Björnsson, S., Foulger, G., Stefánsson, R., and Skaftadóttir, T.: Seismicity pattern in the South Iceland seismic zone, in: Earthquake Prediction: An International Review, edited by: Simpson, D. and Richards, P., Wiley Online Library, 4, 141–151, 1981. a
Einarsson, P., Brandsdóttir, B., Gudmundsson, M. T., Björnsson, H., Grönvold, K., and Sigmundsson, F.: Center of the Iceland hotspot experiences volcanic unrest, EOS T. Am. Geophys. Un., 78, 369–375, 1997. a
Einarsson, P., Brandsdóttir, B., and Ásta Rut Hjartardóttir: Seismicity, faults, and bathymetry of the Tjörnes Fracture Zone, in: Proceeding of the Northquake 2019 Workshop, Husavik Academic Centre, Húsavík, Iceland, 2019. a
Ekström, G., Nettles, M., and Dziewoński, A. M.: The global CMT project 2004–2010: Centroid-moment tensors for 13,017 earthquakes, Phys. Earth Planet. Int., 200, 1–9, 2012. a
Gardner, J. K. and Knopoff, L.: Is the sequence of earthquakes in Southern California, with aftershocks removed, Poissonian?, B. Seismol. Soc. Am., 64, 1363–1367, 1974. a
Gasperini, P., Lolli, B., Vannucci, G., and Boschi, E.: A comparison of moment magnitude estimates for the European-Mediterranean and Italian regions, Geophys. J. Int., 190, 1733–1745, 2012. a, b
Gasperini, P., Lolli, B., and Vannucci, G.: Body-Wave Magnitude mb is a Good Proxy of Moment Magnitude MW for Small Earthquakes (mb<4.5–5.0), Seismol. Res. Lett., 84, 932–937, 2013. a, b, c, d, e, f, g
GCMT: Global Centroid Moment Tensor Earthquake Catalog, avalable at: https://www.globalcmt.org, last access: 25 November 2020. a, b
Grönvold, K., Larsen, G., Einarsson, P., Thorarinsson, S., and Sæmundsson, K.: The Hekla eruption 1980–1981, Bulletin Volcanologique, 46, 349–363, 1983. a
Grünthal, G. and Wahlström, R.: An Mw based earthquake catalogue for central, northern and northwestern Europe using a hierarchy of magnitude conversions, J. Seismol., 7, 507–531, 2003. a
Grünthal, G. and Wahlström, R.: The European-Mediterranean earthquake catalogue (EMEC) for the last millennium, J. Seismol., 16, 535–570, 2012. a, b, c
Grünthal, G., Wahlström, R., and Stromeyer, D.: The unified catalogue of earthquakes in central, northern, and northwestern Europe (CENEC)—updated and expanded to the last millennium, J. Seismol., 13, 517–541, 2009. a
Grünthal, G., Wahlström, R., and Stromeyer, D.: The SHARE European earthquake catalogue (SHEEC) for the time period 1900–2006 and its comparison to the European-Mediterranean earthquake catalogue (EMEC), J. Seismol., 17, 1339–1344, 2013. a
Gutenberg, B. and Richter, C. F.: Seismicity of the Earth, Princeton University Press, Princeton, New Jersey, 1949. a, b
Halldórsson, P.: Seismic hazard assessment based on historical data and seismic measurements, in: Proceedings of the International Conference on Preparedness and Mitigation for Natural Disasters '92, Association of Chartered Engineers in Iceland, Reykjavík, 53–63, 1992a. a
Halldórsson, P.: Um jarðskjálftasvæði Suðurlands (About the South Iceland seismic zone), Árbók VFÍ (Icelandic Journal of Engineering), 4, 226–239, 1992b. a
Helffrich, G. R.: How good are routinely determined focal mechanisms? Empirical statistics based on a comparison of Harvard, USGS and ERI moment tensors, Geophys. J. Int., 131, 741–750, 1997. a
Hjaltadóttir, S.: Use of relatively located microearthquakes to map fault patterns and estimate the thickness of the brittle crust in Southwest Iceland, Tech. Rep. VI-2010-003, Icelandic Meteorological Office, Reykjavík, 2010. a
IMO: Veðráttan (the Weather), Icelandic Meteorological Office, Reykjavík, available at: https://timarit.is (last access: 13 January 2021), 1924–2006. a, b
IMO: Seismological Bulletin, Icelandic Meteorological Office, Reykjavík, 1926–1973. a, b
IMO: Mánaðaryfirlit jarðskjálfta (Monthly reports of earthquakes), Icelandic Meteorological Office, Reykjavík, 1987–1990. a
ISC: International Seismological Centre Bulletin Event Catalog, available at: http://www.isc.ac.uk/iscbulletin/search/, last access: 25 November 2020. a, b
Jones, A., Michæl, A., Simpson, B., Jacob, S., and Oppenheimer, D.: Rapid distribution of earthquake information for everybody, Seismol. Res. Lett., 71, 355–358, 2000. a
Jónasson, K., Bessason, B., Helgadóttir, Á., Einarsson, P., Gudmundsson, G. B., Brandsdóttir, B., Vogfjörd, K. S., and Jónsdóttir, K.: ICEL-NMAR Earthquake Catalogue, version 3, available at: https://data.mendeley.com/datasets/7zh6xg22cv/3, last access: 2 July 2021. a, b
Kagan, Y. Y.: Accuracy of modern global earthquake catalogs, Phys. Earth Planet. Int., 135, 173–209, 2003. a, b
Karimiparidari, S., Zare, M., Memarian, H., and Kijko, A.: Iranian earthquake, a uniform catalog with moment magnitudes, J. Seismol., 17, 897–911, 2013. a
Klein, F. W., Einarsson, P., and Wyss, M.: Microearthquakes on the mid-Atlantic plate boundary on the Reykjanes Peninsula in Iceland, J. Geophys. Res., 78, 5084–5099, 1973. a
Klein, F. W., Einarsson, P., and Wyss, M.: The Reykjanes Peninsula, Iceland, earthquake swarm of September 1972 and its tectonic significance, J. Geophys. Res., 82, 865–888, 1977. a
Kárník, V.: Seismicity of the European area, Part 1, Academia, Praha, 1968. a
McGarr, A. and Barbour, A. J.: Injection-induced moment release can also be aseismic, Geophys. Res. Lett., 45, 5344–5351, 2018. a
Ottósson, K. G.: Jarðskjálftar á Íslandi 1900–1929 (Earthquakes in Iceland 1900–1929), Tech. Rep. RH-80-05, University of Iceland Science Institute, Reykjavík, 1980. a, b
Pagli, C., Pedersen, R., Sigmundsson, F., and Feigl, K. L.: Triggered fault slip on June 17, 2000 on the Reykjanes Peninsula, SW-Iceland captured by radar interferometry, Geophys. Res. Lett., 30, 1273, https://doi.org/10.1029/2002GL015310, 2003. a
Panzera, F., Zechar, J. D., Vogfjörd, K. S., and Eberhard, D.: A Revised earthquake catalogue for South Iceland, Pure Appl. Geophys., 173, 97–116, 2016. a
Pedersen, R., Jónsson, S., Árnadóttir, T., Sigmundsson, F., and Feigl, K. L.: Fault slip distribution of two June 2000 Mw 6.5 earthquakes in South Iceland estimated from joint inversion of InSAR and GPS measurements, Earth Planet. Sc. Lett., 213, 487–502, 2003. a
Rögnvaldsson, S. T. and Slunga, R.: Routine fault plane solutions for local networks: a test with synthetic data, B. Seismol. Soc. Am., 83, 1232–1247, 1993. a
Schmelling, M.: Averaging correlated data, Phys.Scripta, 51, 676–679, 1995. a
SCI: Icelandic National Annexes to Eurocodes, Standards Council of Iceland, Reykjavík, technical report, 2010. a
Sigbjörnsson, R. and Rupakhety, R.: A saga of the 1896 South Iceland earthquake sequence: magnitudes, macroseismic effects and damage, B. Earthq. Eng., 12, 171–184, 2014. a
Sigmundsson, F., Einarsson, P., Bilham, R., and Sturkell, E.: Rift-transform kinematics in south Iceland: Deformation from Global Positioning System measurements, 1986 to 1992, J. Geophys. Res.-Sol. Ea., 100, 6235–6248, 1995. a
Slunga, R., Rögnvaldsson, S. T., and Bödvarsson, R.: Absolute and relative locations of similar events with application to microearthquakes in southern Iceland, Geophy. J. Int., 123, 409–419, 1995. a
Soosalu, H. and Einarsson, P.: Earthquake activity related to the 1991 eruption of the Hekla volcano, Iceland, B. Volcanol., 63, 536–544, 2002. a
Stefánsson, R.: Methods of focal mechanism studies with application to two Atlantic earthquakes, Tectonophysics, 3, 209–243, 1966. a
Stefánsson, R. and Halldórsson, P.: Strain release and strain build-up in the South Iceland seismic zone, Tectonophysics, 152, 267–276, 1988. a
Stefánsson, R., Bödvarsson, R., Slunga, R., Einarsson, P., Jakobsdóttir, S., Bungum, H., Gregersen, S., Havskov, J., Hjelme, J., and Korhonen, H.: Earthquake prediction research in the South Iceland Seismic Zone and the SIL project, B. Seismol. Soc. Am., 83, 696–716, 1993. a, b, c
Stefánsson, R., Gudmundsson, G. B., and Halldórsson, P.: Tjörnes fracture zone. New and old seismic evidences for the link between the North Iceland rift zone and the Mid-Atlantic ridge, Tectonophysics, 447, 117–126, 2008. a, b, c
Storchak, D. A., Di Giacomo, D., Bondár, I., Engdahl, E. R., Harris, J., Lee, W. H. K., Villaseñor, A., and Bormann, P.: Public release of the ISC-GEM global instrumental earthquake catalogue (1900–2009), Seismol. Res. Lett., 84, 810–815, 2013. a
Storchak, D. A., Harris, J., Brown, L., Lieser, K., Shumba, B., Verney, R., Di Giacomo, D., and Korger, E. I. M.: Rebuild of the Bulletin of the International Seismological Centre (ISC), part 1: 1964–1979, Geosci. Lett., 4, 32, https://doi.org/10.1186/s40562-017-0098-z, 2017. a
Stromeyer, D., Grünthal, G., and Wahlström, R.: Chi-square regression for seismic strength parameter relations, and their uncertainties, with applications to an Mw based earthquake catalogue for central, northern and northwestern Europe, J. Seismol., 8, 143–153, 2004. a
Sykes, L. R.: The seismicity of the Arctic, B. Seismol. Soc. Am., 55, 501–518, 1965. a, b
Sykes, L. R.: Mechanism of earthquakes and nature of faulting on the mid-oceanic ridges, J. Geophys. Res., 72, 2131–2153, 1967. a
Sólnes, J., Sigbjörnsson, R., and Elíasson, J.: Probabilistic seismic hazard mapping of Iceland, 2337, in: Proceedings of the 13th World conference on earthquake engineering, Vancouver, BC, Canada, 1–6 August 2004, Canadian Association for Earthquake Engineering, Vancouver, 2004. a
Sólnes, J., Sigmundsson, F., and Bessason, B., eds.: Náttúruvá á Íslandi, eldgos og jarðskjálftar (Natural Hazard in Iceland, Volcanic Eruptions and Earthquakes), University of Iceland Press and Natural Catastrophe Insurance of Iceland, Reykjavík, ISBN 978-9979-54-943-7, 2013. a, b, c, d
Tryggvason, E.: Jarðskjálftar á Íslandi og nyrzta hluta Atlantshafsins (Seismicity of Iceland and the surrounding oceans), Náttúrufræðingurinn, 25, 194–197, 1955. a
Tryggvason, E.: Jarðskjálftar a Íslandi 1930–1939 (Earthquakes in Iceland 1930–1939), Tech. Rep. RH-78-21, University of Iceland Science Institute, Reykjavík, 1978a. a, b
Tryggvason, E.: Jarðskjálftar á Íslandi 1940–1949 (Earthquakes in Iceland 1940–1949), Tech. Rep. RH-78-22, University of Iceland Science Institute, Reykjavík, 1978b. a, b
Tryggvason, E.: Jarðskjálftar a Íslandi 1950–1959 (Earthquakes in Iceland 1950–1959), Tech. Rep. RH-79-06, University of Iceland Science Institute, Reykjavík, 1979. a, b
UISI: Skjálftabréf (Earthquake Letter), University of Iceland Science Institute, Reykjavík, available at: https://jardvis.hi.is/skjalftabref (last access: 13 January 2021), 1975–1988. a, b
USGS: United States Geographical Survey Earthquake Catalog, available at: https://earthquake.usgs.gov/earthquakes/search/, last access: 25 November 2020. a
Wang, Q., Jackson, D. D., and Kagan, Y. Y.: California earthquakes, 1800–2007: A unified catalog with moment magnitudes, uncertainties, and focal mechanisms, Seismol. Res. Lett., 80, 446–457, 2009. a
Ward, P. L.: New interpretation of the geology of Iceland, Geol. Soc. Am. Bull., 82, 2991–3012, 1971. a
Werner, M. J.: Magnitude uncertainties impact seismic rate estimates, forecasts, and predictability experiments, J. Geophys. Res.-Sol. Ea., 113, 1–20, 2008. a, b
Woessner, J., Laurentiu, D., Giardini, D., Crowley, H., Cotton, F., Grünthal, G., Valensise, G., Arvidsson, R., Basili, R., Demircioglu, M. B., Hiemer, S., Meletti, C., Musson, R. W., Rovida, A. N., Sesetyan, K., and Stucchi, M.: The 2013 European seismic hazard model: key components and results, B. Earthq. Eng., 13, 3553–3596, 2015. a
Wright, T. J., Sigmundsson, F., Pagli, C., Belachew, M., Hamling, I. J., Brandsdóttir, B., Keir, D., Pedersen, R., Ayele, A., Ebinger, C., Einarsson, P., Lewi, E., and Calais, E.: Geophysical constraints on the dynamics of spreading centres from rifting episodes on land, Nat. Geosci., 5, 242–250, 2012. a
Yadav, R., Bormann, P., Rastogi, B. K., Das, M. C., and Chopra, S.: A homogeneous and complete earthquake catalog for northeast India and the adjoining region, Seismol. Res. Lett., 80, 609–627, 2009. a