the Creative Commons Attribution 4.0 License.
the Creative Commons Attribution 4.0 License.
 | 13 Jul 2021
Spatiotemporal clustering of flash floods in a changing climate (China, 1950–2015)
Nan Wang
Luigi Lombardo
Marj Tonini
Liang Guo
Junnan Xiong
The persistence over space and time of flash flood disasters – flash floods that have caused either economical losses or loss of life or both – is a diagnostic measure of areas subjected to hydrological risk. The concept of persistence can be assessed via clustering analyses, performed here to analyze the national inventory of flash flood disasters in China that occurred in the period 1950–2015. Specifically, we investigated the spatiotemporal pattern distribution of the flash flood disasters and their clustering behavior by using both global and local methods: the first based on Ripley's K function, and the second on scan statistics. As a result, we could visualize patterns of aggregated events, estimate the cluster duration and make assumptions about their evolution over time, also with respect to the precipitation trend. Due to the large spatial (the whole Chinese territory) and temporal (66 years) scale of the dataset, we were able to capture whether certain clusters gather in specific locations and times but also whether their magnitude tends to increase or decrease. Overall, the eastern regions in China are much more subjected to flash flood disasters compared to the rest of the country. Detected clusters revealed that these phenomena predominantly occur between July and October, a period coinciding with the wet season in China. The number of detected clusters increases with time, but the associated duration drastically decreases in the recent period. This may indicate a change towards triggering mechanisms which are typical of short-duration extreme rainfall events. Finally, being flash flood disasters directly linked to precipitation and their extreme realization, we indirectly assessed whether the magnitude of the trigger itself has also varied through space and time, enabling considerations in the context of climatic change.
- Article
(10366 KB) - Full-text XML
- BibTeX
- EndNote


Flash floods are among the most destructive surface processes around the world, especially in mountainous areas (Au, 1998; Borga et al., 2011; Gomez and Kavzoglu, 2005; Jonkman, 2005). They are mainly initiated by rapid and intense rainfall, often discharged in few hours (e.g., Borga et al., 2007; Bout et al., 2018; He et al., 2018; Lóczy et al., 2012), and by complex interactions of the climatic conditions with topography and hydrology (e.g., Hatheway et al., 2005). Because of the very rapid rise in water levels caused by flash floods, it is challenging to take timely and effective actions to contain the associated damage. Flash flood disasters are essentially flash floods that have caused losses either in terms of human lives or economy or both (Gaume et al., 2009; Jonkman and Kelman, 2005; Kelman and Spence, 2004). In China, approximately 70 % of the total area is covered by mountains and hills, which exposes a substantial surface of the national territory to flash flood disasters' risk (Liu et al., 2018). Additionally, the more frequent extreme precipitation associated with climate change has increased the number of flash flood disasters in recent decades (Sampson et al., 2015).
The susceptibility to hydro-geomorphological processes is commonly assessed by considering only the spatial distribution of observed events (Cama et al., 2015, 2017; Santangelo et al., 2012; Zaharia et al., 2017). However, this is purely a convenient assumption from the modeling perspective. Recently, a growing amount of evidence indicates that these events tend to aggregate in space conditioned by the temporal variability, attesting to an interaction between space and time on event frequency and distribution (Gariano and Guzzetti, 2016; Kouli et al., 2010; Zhang and Cong, 2014; Fuchs et al., 2015; Merz et al., 2016; Tonini and Cama, 2019). In other words, when an event occurs at a specific location, a temporary increase in the probability that other events will cluster at nearby locations should be accounted for. This increase in probability can be captured through clustering analyses, and various examples already exist in the literature where this has been done at different spatial and temporal scales and via different analytical approaches. Notably, this type of application spans many areas of natural hazards and has become mainstream in the case of seismicity (e.g., Fischer and Horálek, 2003; Georgoulas et al., 2013; Varga et al., 2012; Woodward et al., 2018; Yang et al., 2019), joint sets, and their orientation in rock outcrops (e.g., Tokhmechi et al., 2011; Zhan et al., 2017), groundwater monitoring (Chambers et al., 2015), wildfires (e.g., Orozco et al., 2012; Costafreda-Aumedes et al., 2016; Fuentes-Santos et al., 2013; Tonini et al., 2017) and landslides (e.g., Lombardo et al., 2018, 2019; Tonini and Cama, 2019). In the specific case of flooding, Zhao et al. (2014) used the projection pursuit theory to cluster spatial data and to build a dynamic risk assessment model for flood disasters. Moreover, Renard (2017) detected flood vulnerability accounting for clustering effects in key areas with high flood risk. Pappadà et al. (2018) also investigated the flood risks in a given region and identified clusters where the floods show a similar behavior with respect to multivariate criteria. Gu et al. (2016a, b) indicated that the floods in Tarim River basin showed evident interannual clustering pattern. Another example can be found in Merz et al. (2016) in which the authors analyzed the interannual and intra-annual flood clustering in Germany. All these examples confirm a substantial scientific interest in recent years dedicated to investigate the clustering behaviors of flash floods and the associated risk and, more generally, to concurrently analyze their spatial and temporal persistence. However, despite the scientific efforts, detecting flash flood patterns at long temporal scale is still scarce in the literature mainly because of technical limitations. In fact, limited information and records are available in digital form reporting locations and dates of flash floods (and flash flood disasters), especially over long periods. Nevertheless, very recent advances in data collection and sharing techniques are gradually filling this gap, and an increasing number of databases are being published and made available to the scientific community with the records of historical and hydro-geomorphological disasters at the global, continental or regional scale over long periods (Gourley et al., 2013; Haigh et al., 2017; Vennari et al., 2016; Liu et al., 2018; Archer et al., 2019; de Bruijn et al., 2019; Jessee et al., 2020; Wood et al., 2020). Among these, Chinese historical inventories of flash flood disasters are a precious source of information allowing us to investigate their spatiotemporal pattern distribution and evolution. Furthermore, this information can be related to the geomorphological settings of the area and the meteorological conditions to detect triggering factors, highlight the more vulnerable areas, and prevent and forecast their effects in the future.
Typically, flash flood disasters (as with many other hydro-geomorphological disasters) can be considered as a stochastic point process (Stoyan, 2006) acting in both spatial and temporal dimensions (e.g., Lombardo et al., 2020). Point patterns can be analyzed in terms of their random distribution, dispersion and clustering behavior (Merz et al., 2016; Tonini and Cama, 2019). Several methods can be implemented to deal with stochastic properties. Some classic models, such as Moran’s I (Moran, 1950), Ripley’s K function (Ripley, 1977), fractal dimension (Lovejoy et al., 1986) and Allan factor (Allan, 1966), have been used to detect clustering behavior in space and in time. Representative models for local clustering analysis (i.e., allowing us to detect clusters and their specific location) include geographical analysis machine (GAM; Openshaw et al., 1987), Turnbull’s cluster evaluation permutation procedure (CEPP; Turnbull et al., 1990), scan statistics (Kulldorff, 1997), and DBSCAN (Ester et al., 1996). For flash floods, which are triggered by storms, the temporal dependency among persistent events is mainly driven by climatic and meteorological conditions. However, global cluster indicators only take into consideration one dimension, disregarding the interaction between space and time. In this sense, spatiotemporal scan statistics is a good tool to detect clusters since it allows us to identify statistically significant excess of observations thanks to a moving cylindrical window that scans all locations both in space and time (Kulldorff et al., 1998).
Therefore, it is especially useful to investigate large spatiotemporal inventories of hydro- and geomorphological processes, such as flash floods. Indeed, the detection of clusters originated by events closer both in space and in time can be more informative that the simple investigation of their purely temporal and purely spatial pattern distribution. For example, understanding the duration of the spatiotemporal clusters of flash floods is a key tool to investigate their dynamics and to highlight more vulnerable areas and frame periods.
In light of this, the main objective of the present research is to explore the pattern distribution of flash flood disasters which have caused life or economic losses in China over a 66-year period (daily data from 1950 to 2015). Firstly, Ripley’s K function was applied to explore the deviation of flash flood disasters from a random process. Results allow to assess at which spatial and temporal scale events are clustered. Then, a local cluster indicator, namely scan statistics, was implemented to map statistically significant spatiotemporal clusters. To the best of our knowledge, this study represents the first attempt of investigating the spatiotemporal cluster behavior of flash flood disasters affecting a huge area, such as the entire Chinese territory. Moreover, the volume of the data that we analyzed represents an additional challenge, allowing us to provide useful insights on flood dynamics over a large spatiotemporal domain and enabling considerations in the context of climatic change. To this end, we finally compared the dynamic of the clusters, detected from the early to the recent period, with the extreme rainfall evolution, computed each 10 years, which is assumed to be local climatic proxy factors.
2.1 Data description
2.1.1 Study area
China lies between latitudes 18 and 54∘ N and longitudes 73 and 135∘ E. With an area of about 9.6 million square kilometers, it is the world's third-largest country. The landscape varies significantly across this vast area, ranging from the Gobi and Taklamakan deserts in the north to the subtropical forests in the wetter south. The eastern plains and southern coasts are the location of most of China's agricultural land and settlements. The southern areas consist of hilly and mountainous terrain. The west and north of the country are dominated by sunken basins (such as the Gobi and the Taklamakan deserts), towering massifs and rolling plateaus, including part of the highest tableland on earth, the Tibetan Plateau. Based on its topography, China can be divided into six homogeneous geomorphological macro-regions (Wang et al., 2020): eastern plain, southeastern hills, southwestern mountains, north-central plateaus, northwestern basins and Tibetan Plateau. Mountains (33 % of the territory), plateaus (26 %) and hills (10 %) together account for nearly 70 % of the entire surface.
In recent years, the precipitation intensity has shown an increasing trend over China (Zhang and Cong, 2014). Influenced by the East Asian summer monsoon and the geomorphologic settings, the climatic condition across the whole country varies considerably (Wu et al., 2019). In general, the wet season in China lasts from May to September (Song et al., 2011b). In the eastern area, the annual rainfall decreases from south to north with an average annual precipitation that ranges from 250 to 750 mm (Zhang et al., 2007). In the west and central part of North China, due to its far distance away from an ocean, the climate tends to be more arid, and the landscape transitions to large deserts. The Tibetan Plateau is characterized by wet and humid summers with cool and dry winters. More than 60 %–90 % of the annual total precipitation falls between June and September (Xu et al., 2008).
2.1.2 Flash flood disaster inventory
The dataset used in this study has been collated and made accessible for the present research as part of a national effort carried out by the Chinese Institute of Water Resources and Hydropower Research (Liu et al., 2018). It reports flash flood occurrences in China from 1950 until 2015, together with available information, namely longitude and latitude, date, fatalities, and economic losses. Due to the lack of specific terminology or detailed descriptions of the disaster process in the database, the data do not differentiate the initial mechanism, be it water floods or debris floods/flows (e.g., Fernández and Lutz, 2010; Gartner et al., 2014). The only common information is that for each specific case, a large amount of overland flows, mixed with an unspecified solid fraction, rapidly flooded a given area with disastrous effects (e.g., Pierson et al., 1987; Chang et al., 2011).
To better understand the spatiotemporal dynamics of flash floods and associated disasters, as well as the relationship with the triggering factors, the date of occurrence is of vital importance. Therefore, for consistency reasons, we considered only the records whose metadata contained a full temporal description (year–month–day) resulting in a subset of 32 473 flash flood disasters (accounting for 68 % of the entire dataset) precisely located in space and time (Fig. 1).
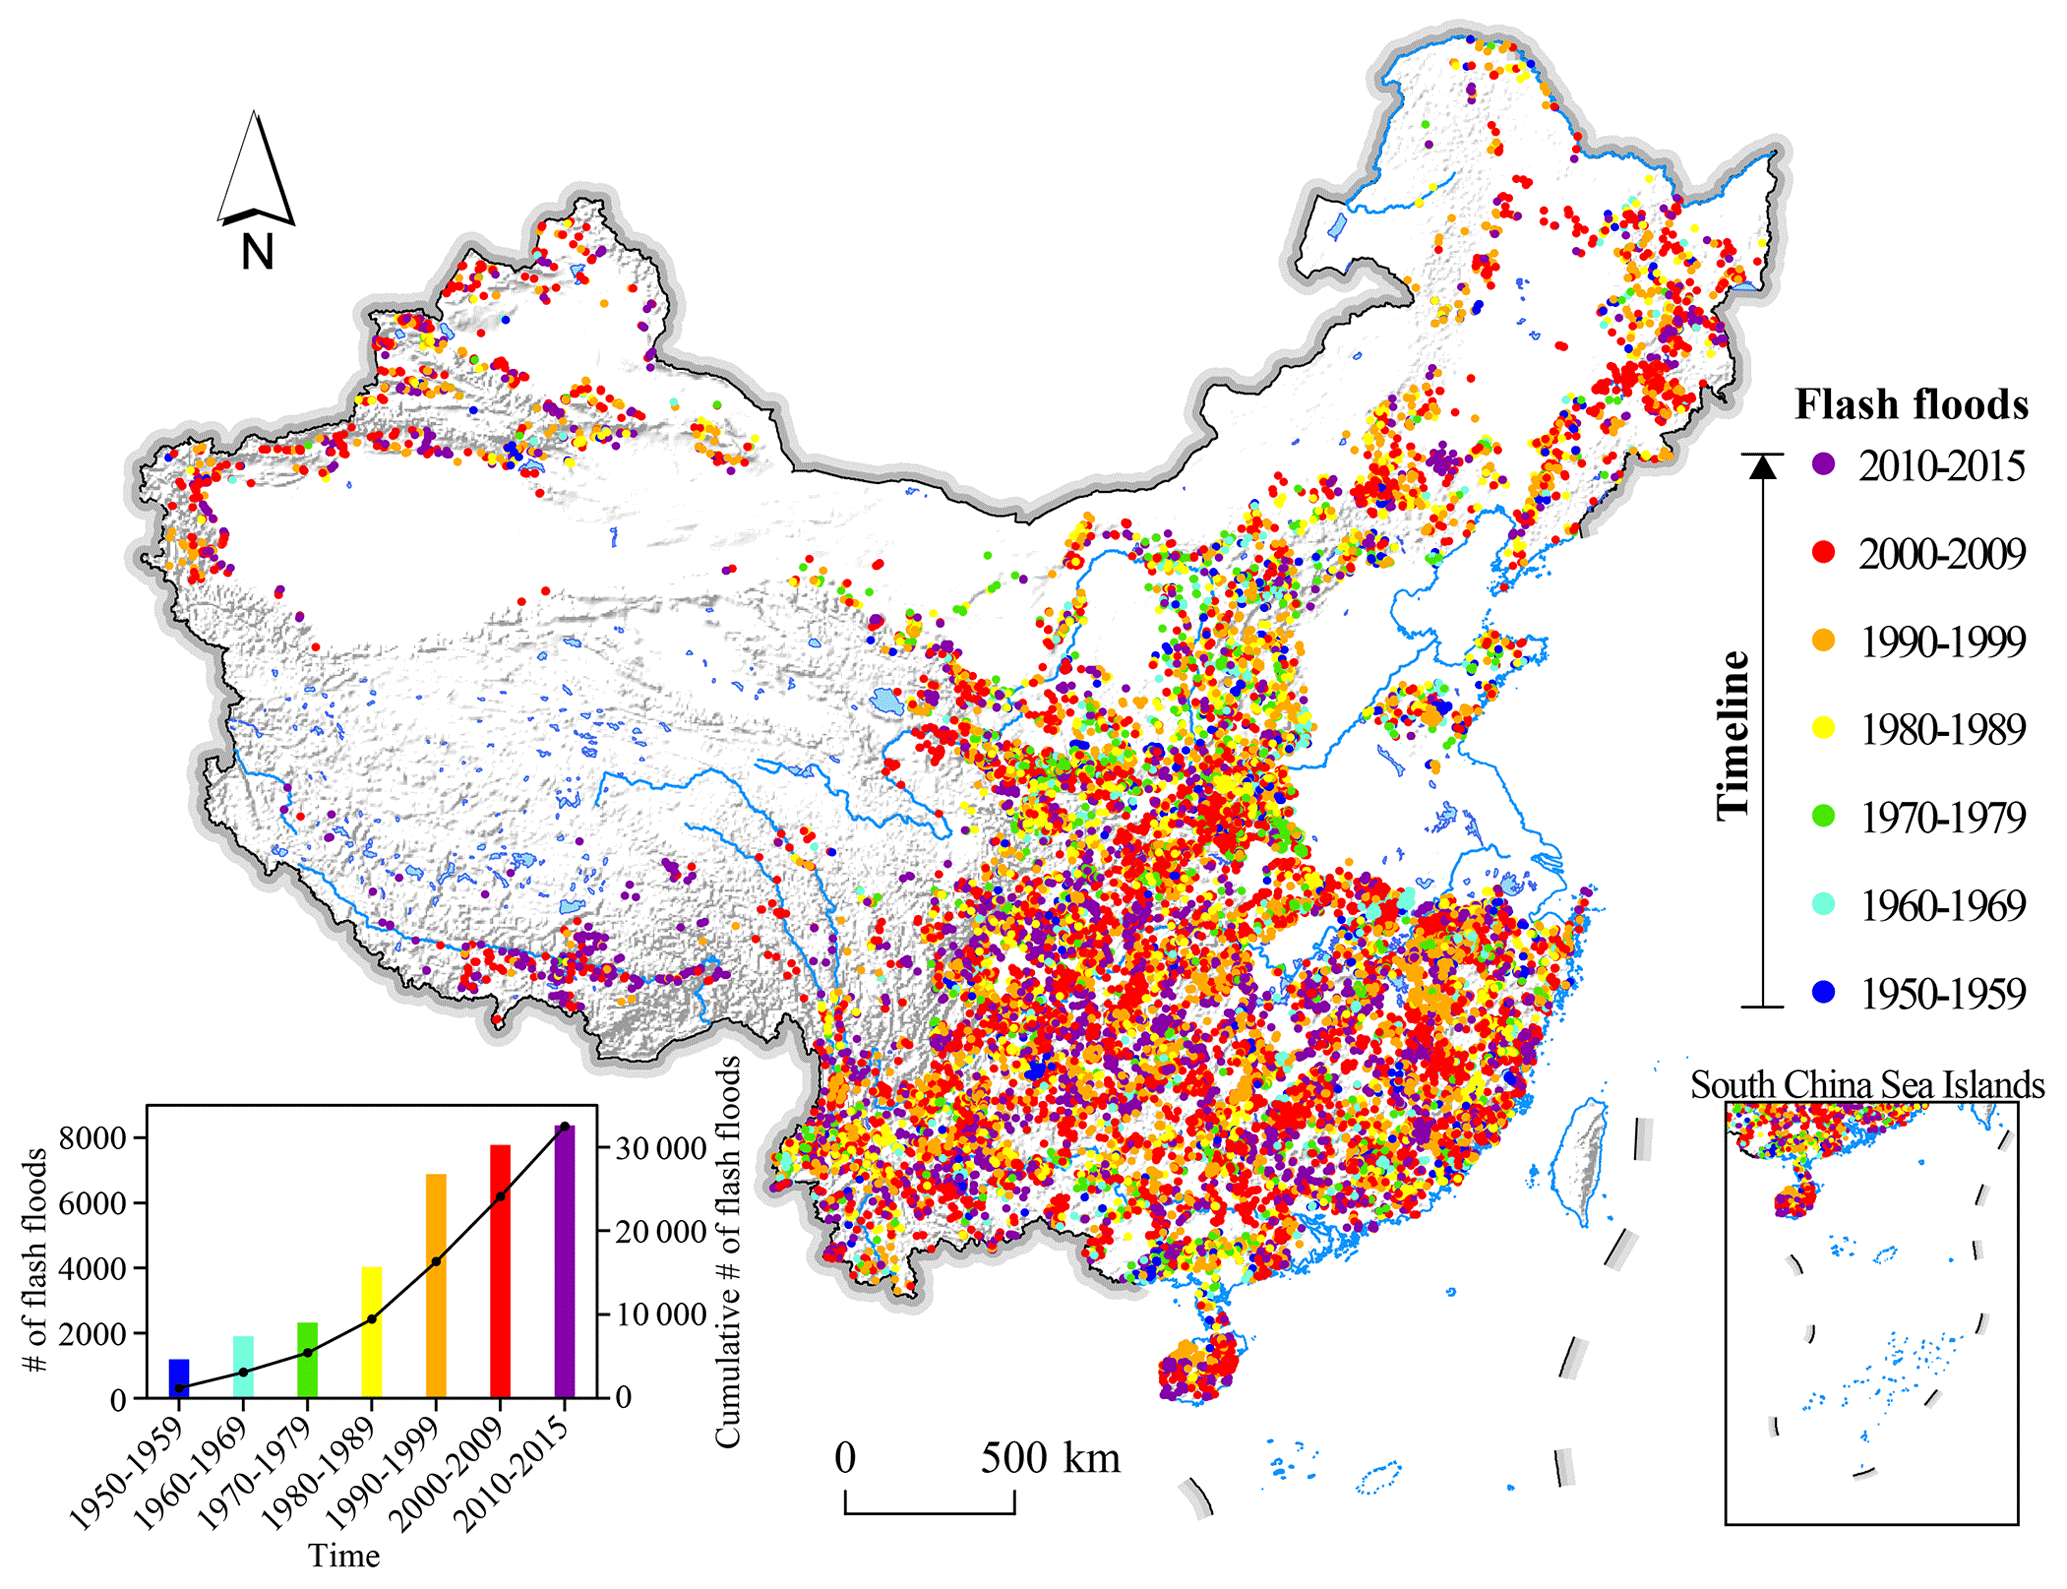
Figure 1Spatiotemporal distribution of flash flood disasters in China.
2.2 Methodological overview
2.2.1 Spatiotemporal K function
Ripley’s K function (K(s)) is largely applied in environmental studies to analyze the pattern distribution of spatial point processes and to detect deviation from spatial randomness. K(s) allows us to determine if a set of mapped punctual events show a random, dispersed or cluster distribution pattern over increasing distance values (Ripley, 1977). It is computed as the ratio between the expected number of events falling at a distance r from an arbitrary event and the average number of points per unit area, corresponding to the intensity of the spatial point process (λ). In the same way, it is possible to define the temporal K function (K(t)) allowing us to assess the randomness of events in time. The spatiotemporal K function (K(s, t)) is a generalization of the univariate Ripley’s K function which allows us to test for the independence between two variables, space (s) and time (t). Therefore, the K(s, t) is a suitable tool to investigate the clustering behavior of a set of events occurring in a given area at a given time. For a point process X with intensity λ, according to Eq. (1), it is defined as the number of expected further events (E) occurring within a distance r and time t from an arbitrary event u, where a defines the contouring circle.
To illustrate the interaction between space and time, it can be useful to evaluate the value D(s, t) defining the difference between the spatiotemporal K function and the product of the purely spatial and the purely temporal K function (see Eq. 2).
If space and time are independent variables, this value equals zero. Otherwise, positive values of D(s, t) indicate the interaction among events in space and in time. In other words, events closer in space are more likely to occur in a closer time. In contrast, the negative values mean a dispersed pattern.
In this study, spatiotemporal K function analyses were performed with the package “Spatial and Space-Time Point Pattern Analysis” (splancs; Rowlingson and Diggle, 2017) in R (R Core Team, 2019).
2.2.2 Spatiotemporal scan statistics
Scan statistics was originally developed by Naus (1965a, b) to detect clusters in a 1D point process. Subsequently Kulldorff (1997) extended this approach to multi-dimensional point processes, introducing the use of scanning windows. The procedure was implemented with free software, SaTScan™ (https://www.satscan.org/, last access: 25 April 2020), which can handle a purely spatial, purely temporal or spatiotemporal dataset and includes different probability models depending on the nature of the data and the scope of the research (e.g., for prospective or retrospective cluster detection). In the purely spatial case, the aim of scan statistics is the early detection of clusters, allowing us to map them and to assess their statistical significance. Moving windows scan the region, increasing their radius up to a fixed limit (Rmax), and count the number of events falling inside and outside the area. The probability that a window contains more observations than expected is assessed via the likelihood ratio through a comparison with the background population. Then, the null hypothesis of randomness is tested via Monte Carlo simulations, based on repeated random sampling. The spatiotemporal scan statistics use cylinders instead of circular windows, in which the height of the cylinder accounts for the temporal dimension.
In order to deal with flash floods, the retrospective spatiotemporal permutation scan statistics (STPSS; Kulldorff et al., 2005) seems to be the most adequate model. Indeed, for environmental processes, the definition of the background population at risk needed for the statistical significance assessment of the detected clusters is quite problematic. STPSS assesses the expected number of cases using only the observed cases by permutation, supposing that each event has the same probability for all the times. Computationally, if C is the total number of observed cases and czd the number of cases observed in a specific zone z and on a day d, the expected number of cases per zone and day (μzd) is equal to the following:
It follows that, for a spatiotemporal cylinder A, the expected number of cases μA can be estimated as the sum of each μzd inside the cylinder A:
If CA is the number of observed cases in A, considered as Poisson-distributed with mean μA, the Poisson generalized likelihood ratio (GLR) can be computed as follows:
This ratio is calculated and maximized for every possible scanning cylinder. The cylinder with the highest GLR value is the most likely cluster, that is, the cluster least likely to be due to chance, while the following are secondary clusters. Then, Monte Carlo simulations are performed, and the statistical significance (p value) of the detected clusters can be assigned by comparing the rank (R) of GLR from the real dataset with the GLR from the simulated one. Thus, the p value can be estimated by dividing R by the number, plus 1, of performed simulations.
3.1 Deviation from a random process
In the present study, the spatiotemporal K function was used to assess the global cluster behavior of flash flood disasters generated by the interaction between these two variables. To this end, the perspective 3D plot of D(s, t) represents a useful visual tool allowing us to estimate the distribution pattern of events along the spatial and the temporal dimensions. In more details, positive values attest to a cluster distribution, while values close to zero indicate a random pattern with no interaction between space and time. In our case, the 3D plot (Fig. 2) shows that at any distance, from hundreds to thousands of meters and from a few years to decades, flash flood disasters display a cluster behavior, which is more pronounced at increasing distance values. In addition, the spatiotemporal K function was computed considering individually the southeastern and the northwestern areas in China, given that the first corresponds to the rainiest zone, highly affected by flash floods, while the second is predominantly desert. The result is that (Fig. 3) in southeastern China (panel a) clusters arise at a shorter spatial distance and closer in time than in northwestern China (panel b). As regards the temporal dimension, the two areas show a similar cluster behavior, with a strong attraction among events up to 10 years and then lasting in time with a more relaxed clustering behavior.
To summarize, the spatiotemporal K function reveals a deviation of flash flood disasters and associated spatiotemporal pattern distribution from a random process at specific scales, measured and quantified both in space, as distance values, and in time, as yearly periods. These values can provide a useful indication to set up the parameters for further clustering algorithms, acting at local scale such as, for example, the spatiotemporal scan statistics.

Figure 2Perspective 3D plot of flash flood disasters in China during 1950–2015 (a) with a zoom up to 2000 km (b).
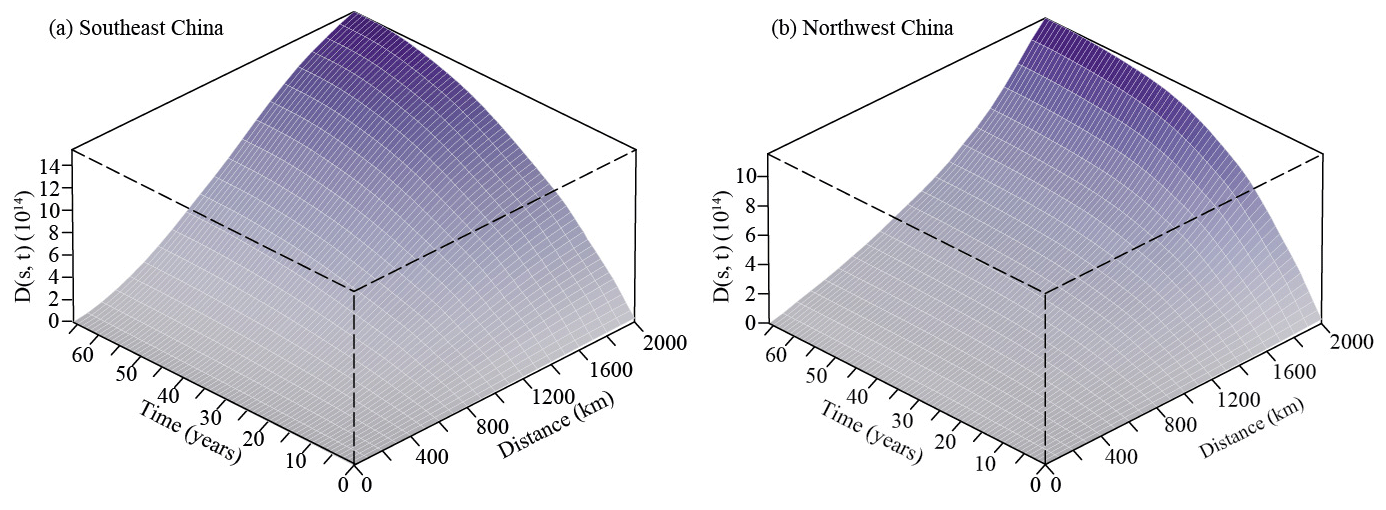
Figure 3Perspective 3D plot of flash flood disasters in southeast (a) and northwest China (b).
3.2 Spatiotemporal cluster detection
3.2.1 Cluster parametrization and their spatial distribution
Scan statistics were performed to detect spatiotemporal clusters of flash flood disasters. The size and the duration of the detected clusters are influenced by the input parameters of the scanning windows, namely the maximum radius (Rmax), the maximum temporal duration (Tmax) and the time aggregation (Tagg). Indeed, values of Rmax exceeding the 50 % of the total area or, for Tmax, the 50 % of the entire study period can result in an exceptionally low rate outside the scanning window rather than detecting an exceptionally high rate inside. Tagg is used to adjust the aggregation of the data over time and allows us to adjust for cyclic temporal trends: for example, a time aggregation of 1 year automatically adjusts for the seasonal variability, while the contrary happens with monthly aggregations. Moreover, both spatial and temporal aggregations can highly reduce the computer processing time. Different values for Rmax were tested for the southeast and northwest areas in China, as suggested by looking at the respective perspective 3D plot. Nevertheless, the performed analyses indicated that the effect on the detected clusters were negligible and that finally the distribution of spatiotemporal clusters of flash flood disasters in the country can be analyzed as a whole. A set of possible combinations of Rmax and Tmax was tested, while Tagg was initially fixed to 1 year.
More specifically, since results of the K function revealed that flash flood disasters in the study area and investigated period are globally clustered even at short distances, we chose Rmax of 100, 200 and 300 km and Tmax equal to 1, 3 and 5 years. The choice for Rmax is corroborated by Zhang et al. (2010) who report measurements constantly less than 500 km for the radius of typical convective storms in the Chinese mainland which can trigger flash floods. Results of STPSS for each of the nine combinations of these parameters are shown in Fig. 4.
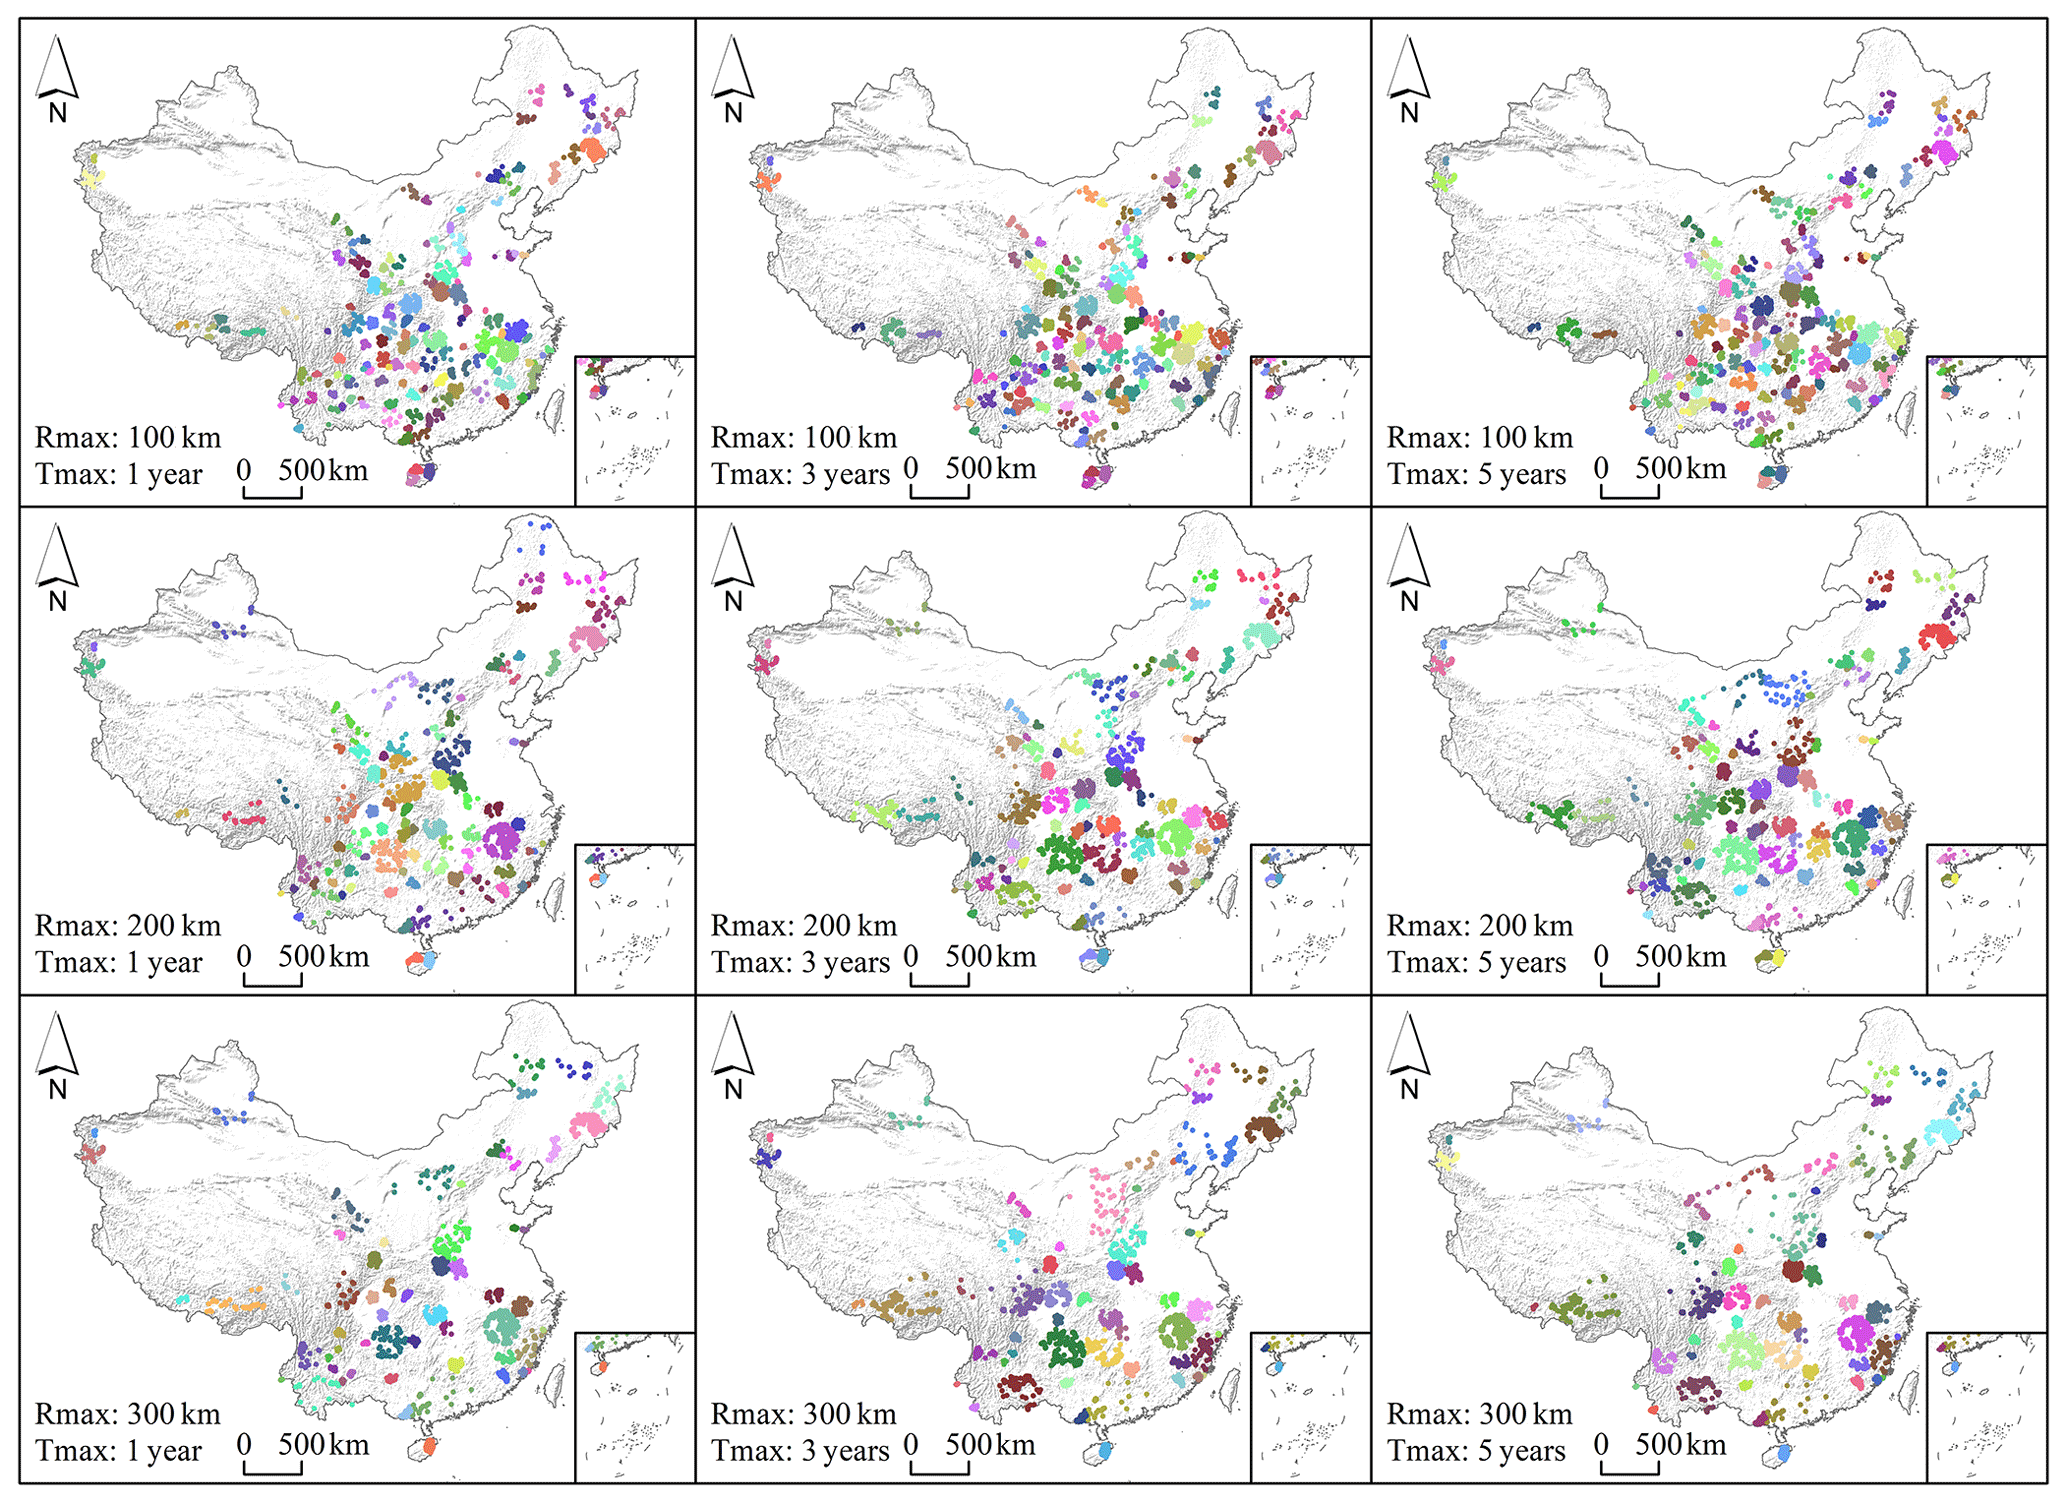
Figure 4Significant (p<0.005) spatiotemporal clusters of flash flood disasters in China during 1950–2015.
Table 1Number of detected spatiotemporal clusters of flash flood disasters in China during 1950–2015 using different parameters, as indicated.
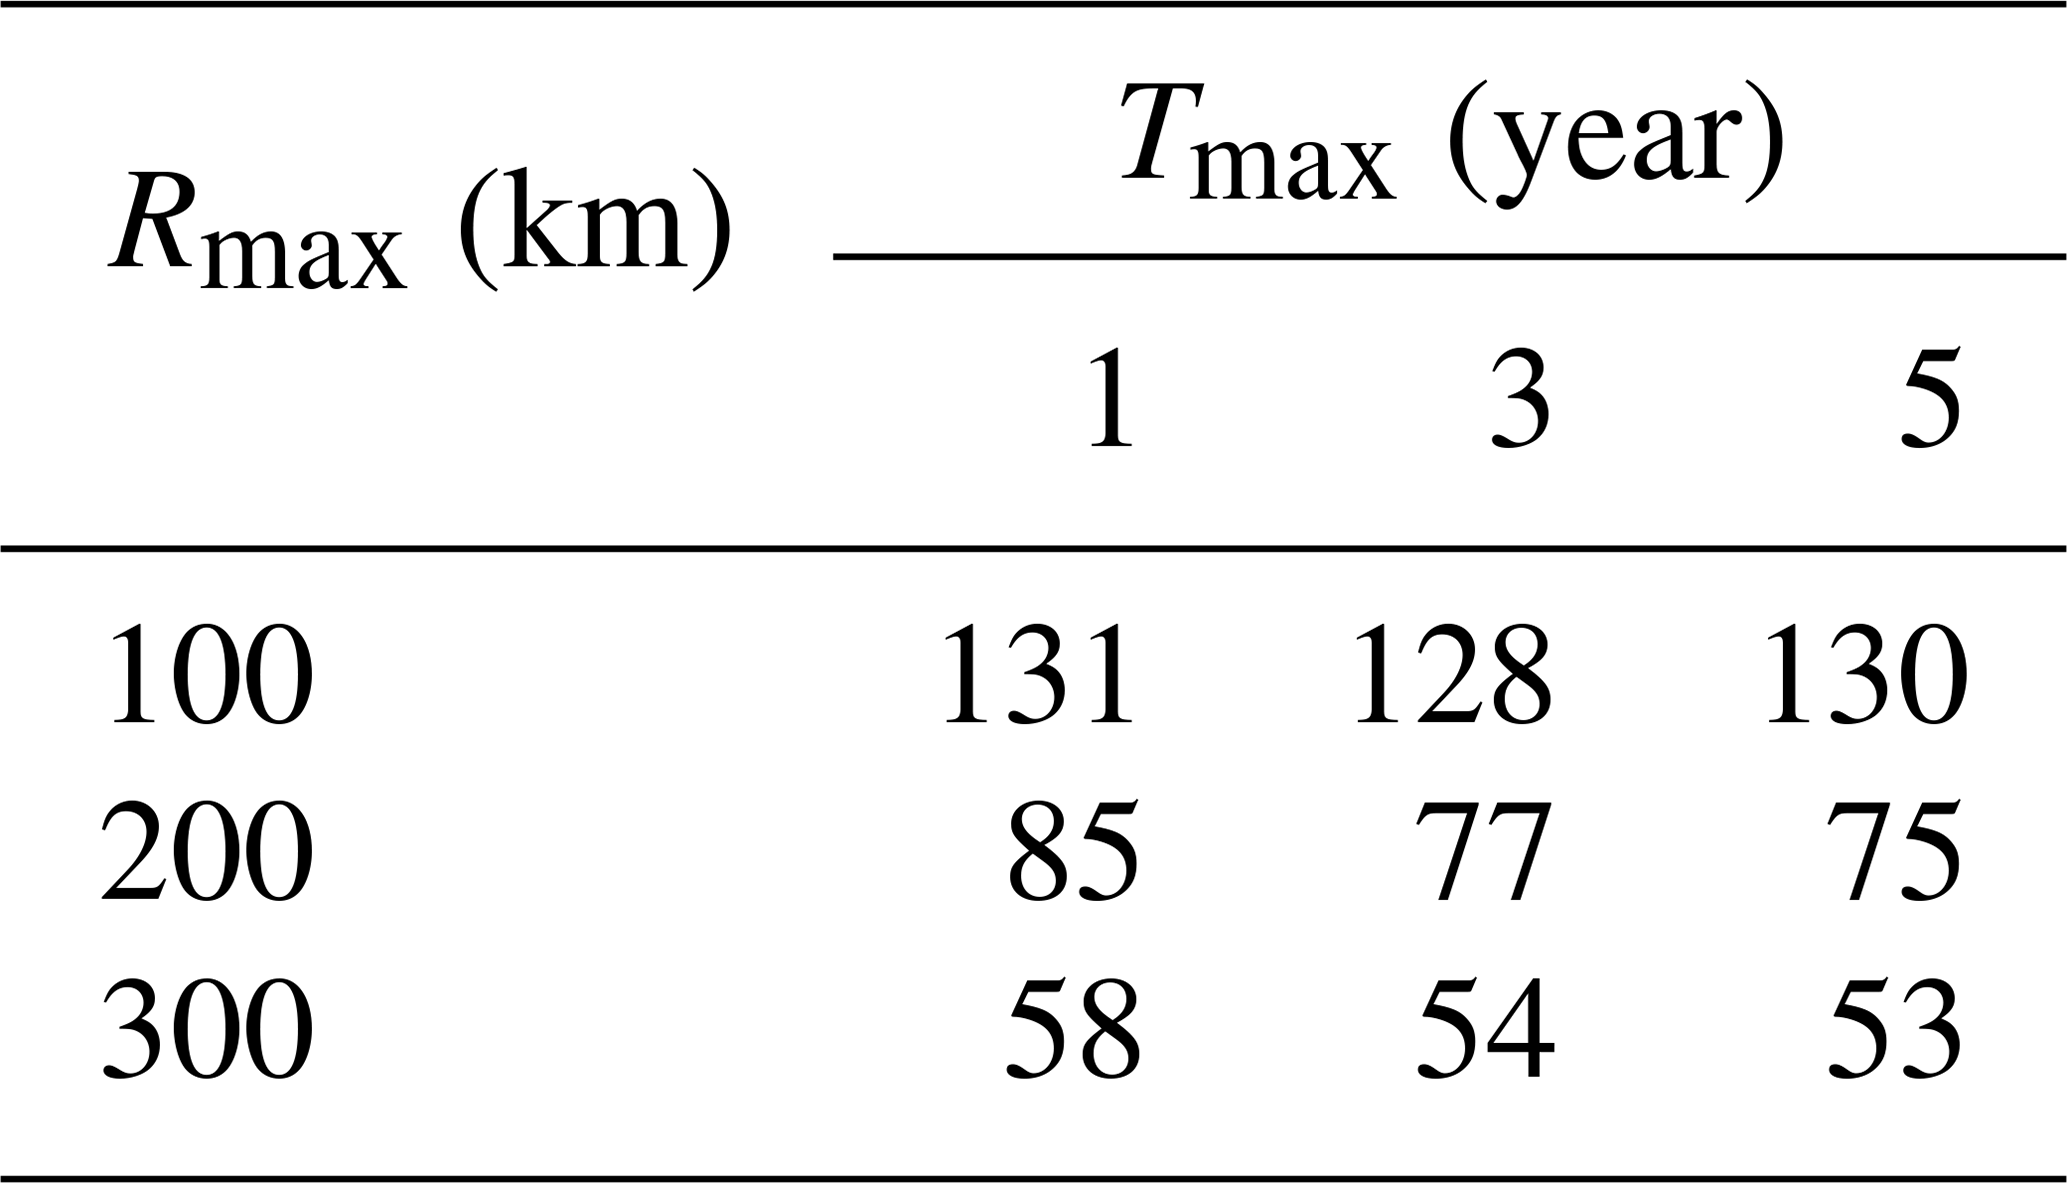
As shown in Table 1, the largest variation in the number of detected clusters is mainly associated with Rmax rather than with Tmax; as Rmax increases, the number of detected clusters decreases. Indeed, large Rmax values affect the detection of clusters acting at a fine scale by merging small cluster close each others into big ones or eventually by neglecting very small flash flood aggregations. Conversely, very large clusters, acting at a coarse spatial scale, are detected for any value of Rmax, as can be geographically visualized in the southeasternmost sector of China (Fig. 4). Changes in Tmax have almost no effect on the number of detected clusters since, even allowing for a maximum duration of 5 years, almost all the clusters do not exceed the duration of 1 year.
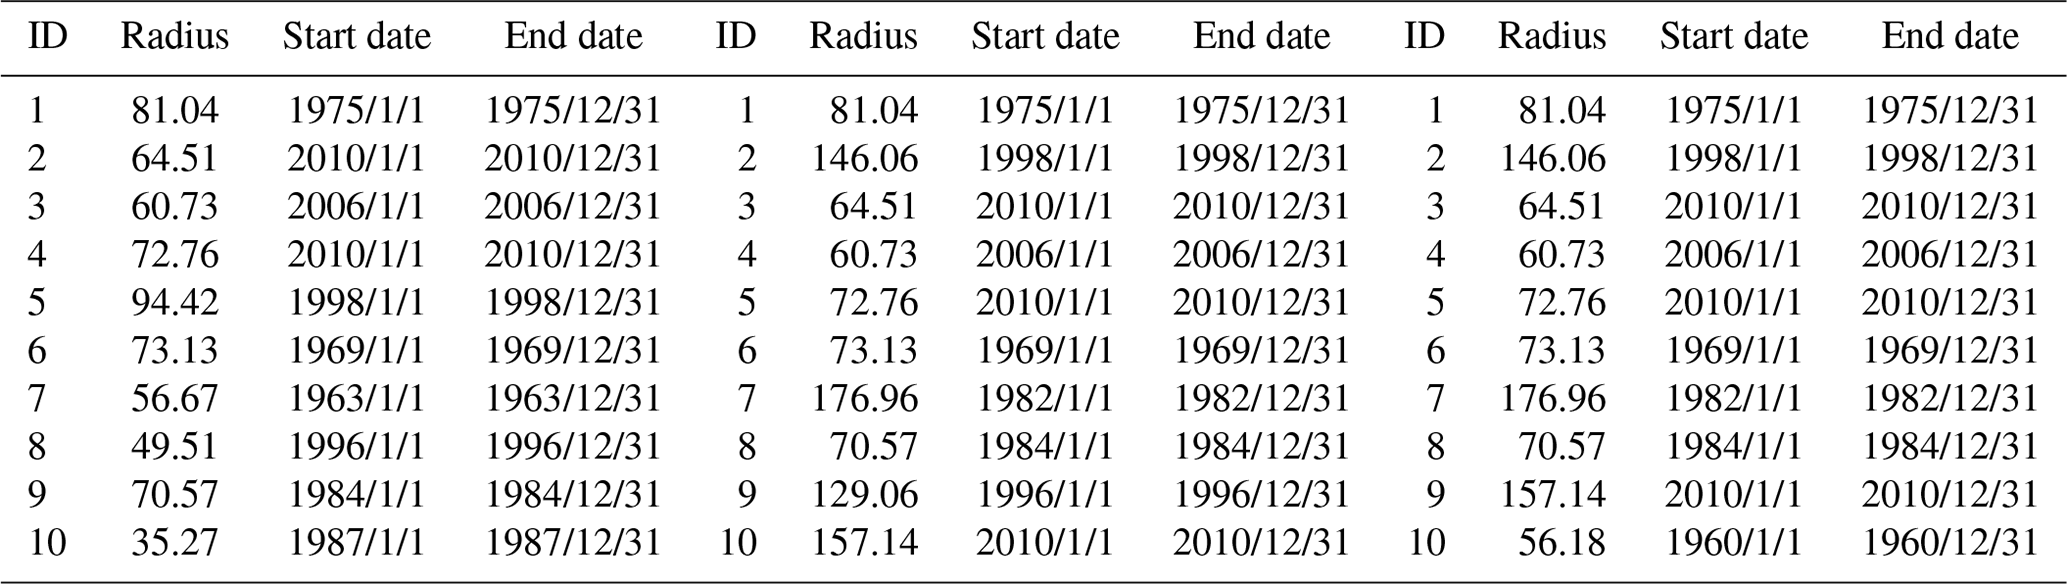
To confirm this finding, we computed the temporal duration of the first 10 clusters of flash flood disasters detected by applying a Tmax equal to 3 years and for the three models, defined by using values of Rmax equal to 100, 200 and 300 km (Table 2). Results confirm that cluster duration, expressed as start and end dates, never exceeds 1 year. The most significant cluster (ranked as ID =1) is the same for any model and is dated to 1975. Secondary clusters (just from the second to the tenth) are almost the same using Rmax of 200 or 300 km, while, reducing the radius to 100 km, their size and ranking can change due to the merging of small clusters into bigger ones. Finally, it is worth noting that the top 10 clusters are well distributed over the entire study period, with the oldest one detected between 1963 and 1969 and the latest in 2010.
Table 2Temporal duration of the first 10 clusters of flash flood disasters detected via three different models (left: Rmax=100 km; center: Rmax=200 km; right: Rmax=300 km).
We opted to carry out additional analyses using a Tagg of 3 months (hereafter referred as “monthly model”). Results are shown in Fig. 5 where information on the spatial distribution of the detected clusters is shown. Overall, the clusters chiefly appear along the main river systems in China, namely the Yangtze, the Yellow, the Pearl and the Yarlung Zangbo rivers. In addition, some clusters stand out on high mountains, such as the Qinling-Daba and the Changbai mountains.
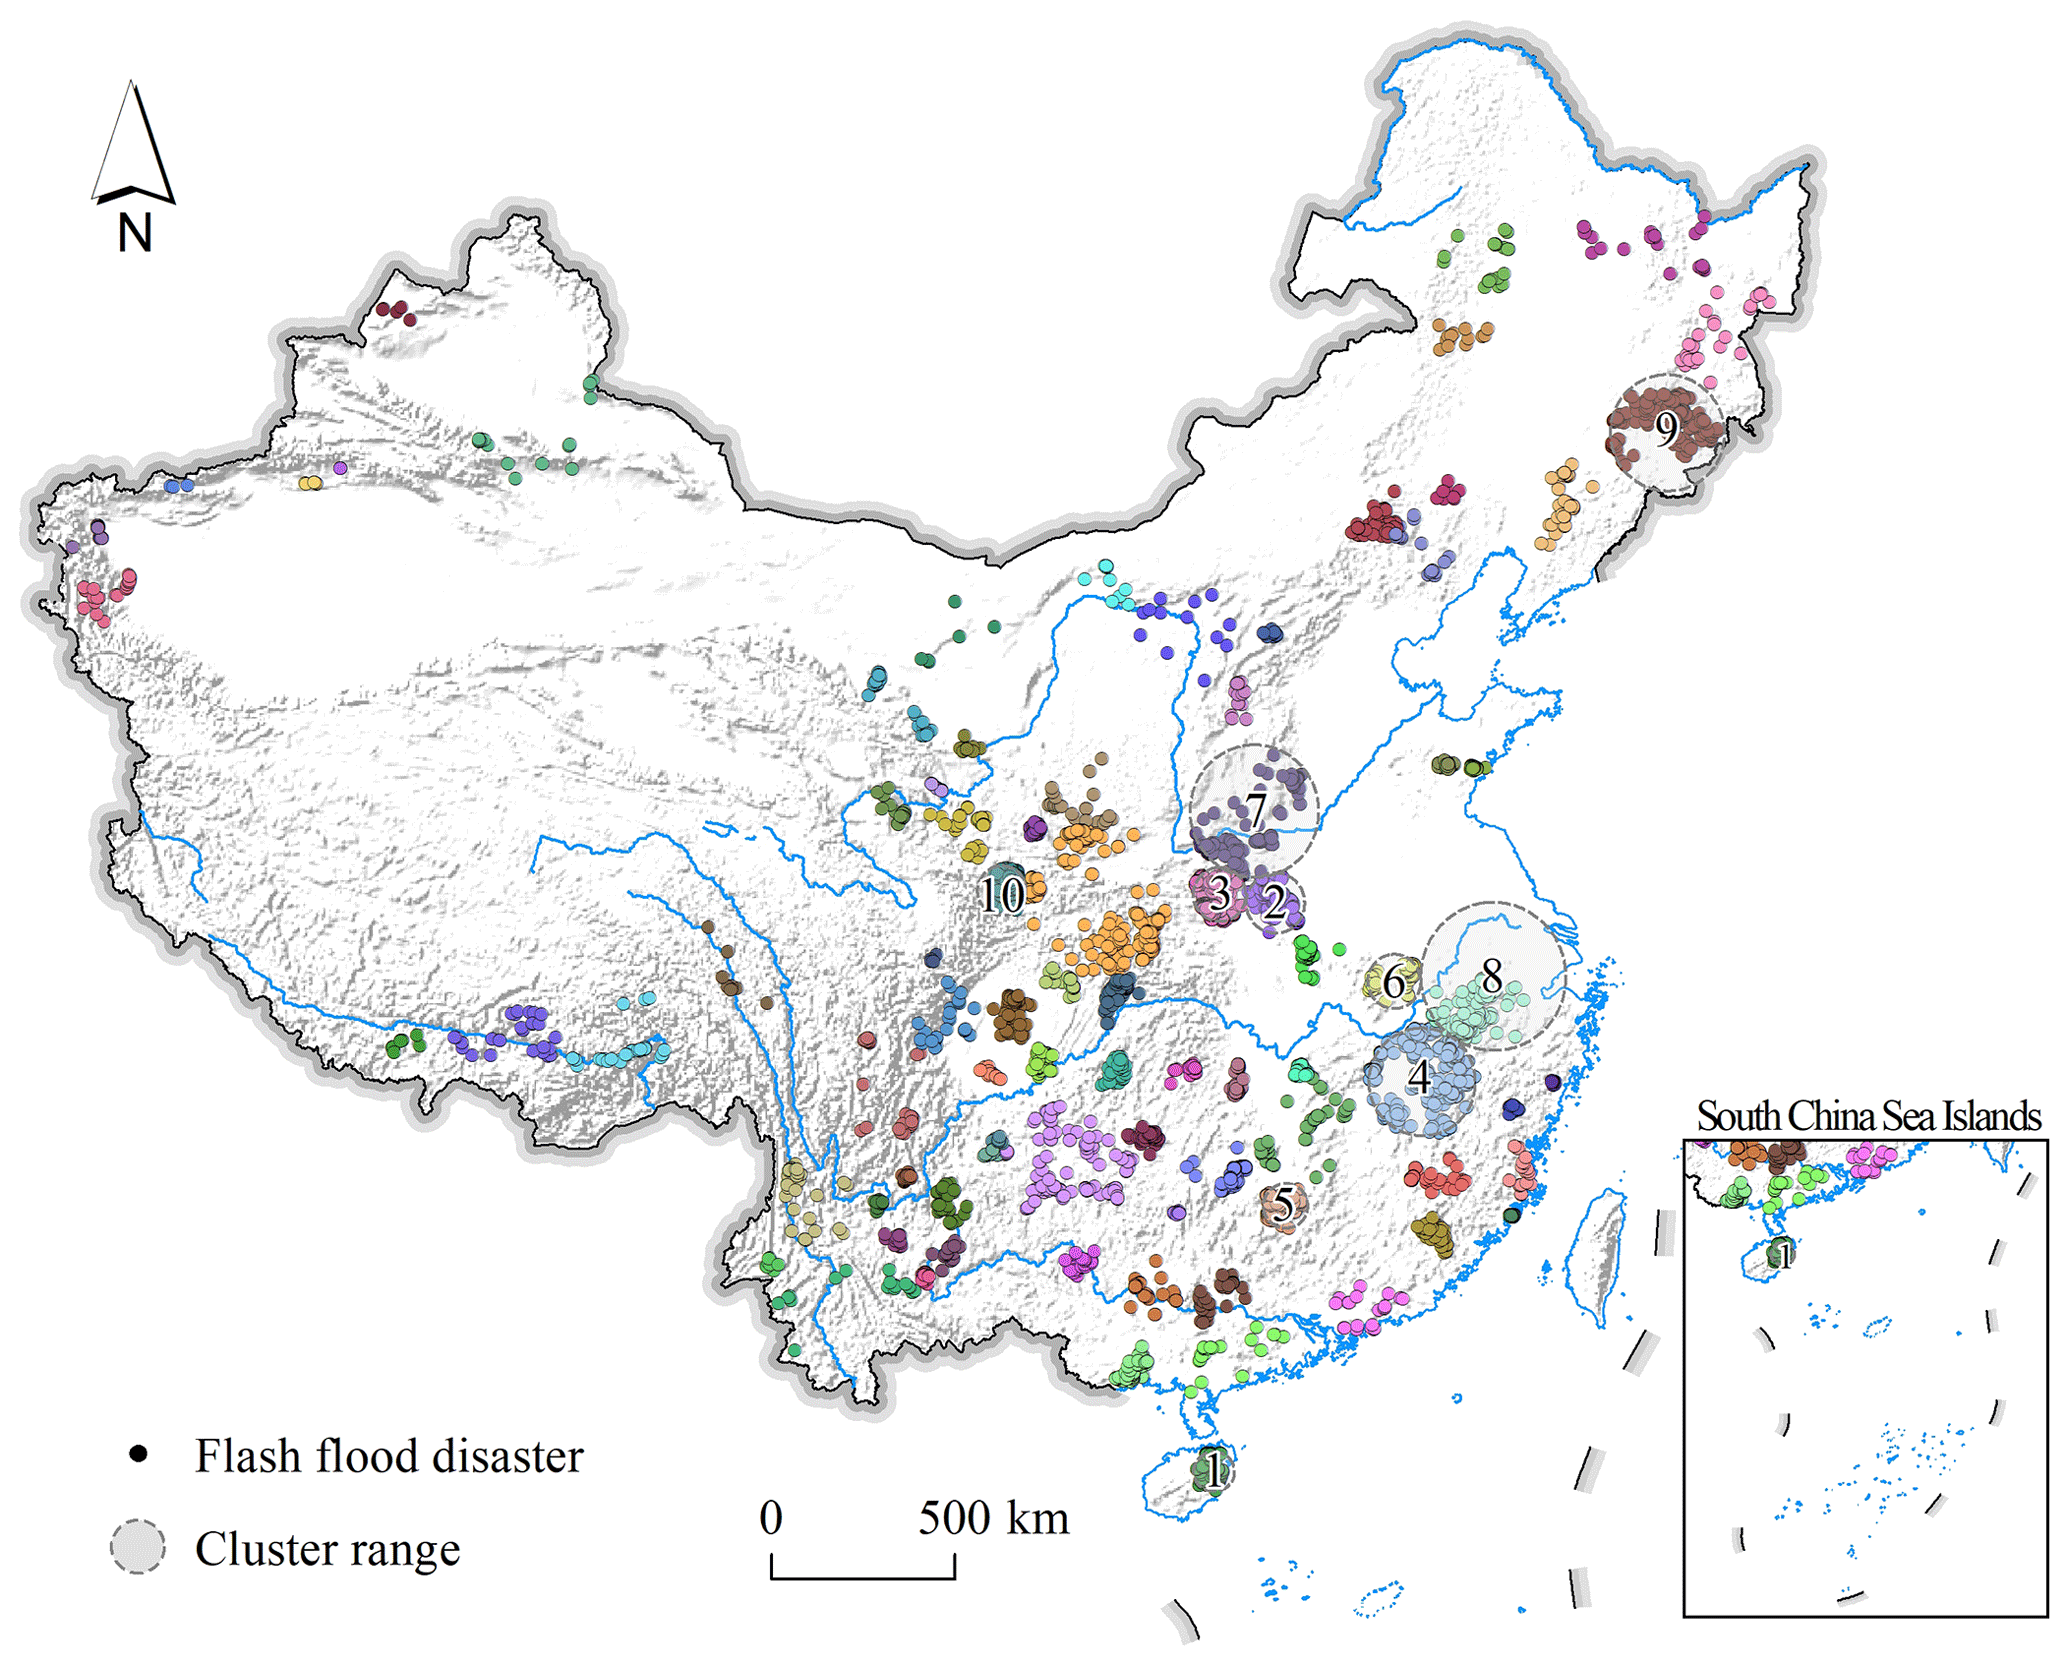
Figure 5Significant (p<0.005) spatiotemporal clusters of flash flood disasters occurring in China during 1950–2015 (Rmax=200 km, Tmax=3 years, Tagg=3 months).
3.2.2 Temporal characterization of detected clusters
It emerges that clusters detected by using the different parameters for the scanning cylinders overlap both in space and in time. Therefore, in the present analysis, seeking to investigate in more details the years of occurrence and the temporal duration of detected clusters of flash floods, only results from the model with Rmax=200 km, Tagg=1 year and Tmax=3 years are presented. Considering all the statistically significant clusters, they emerged during almost each year of the investigated period but are more frequently starting from 1980. The relative small number of clusters detected between 1950 and 1980 may imply that the data acquisition and reporting in the Chinese database of hydro-morphological disasters were not fully operational at the time. Conversely, from 1980 to the present day the Chinese database has evolved into a mature and detailed geographic information system. Another factor explaining this distribution can be the more frequent extreme precipitation observed in recent decades, which could have increased the frequency of flash flood disasters in this last period. The precipitation regime can also explain the variation in the duration of the detected clusters. Indeed some clusters have a temporal extent up to 3 years, which could result from a persistent precipitation pattern over a delimited prone area.
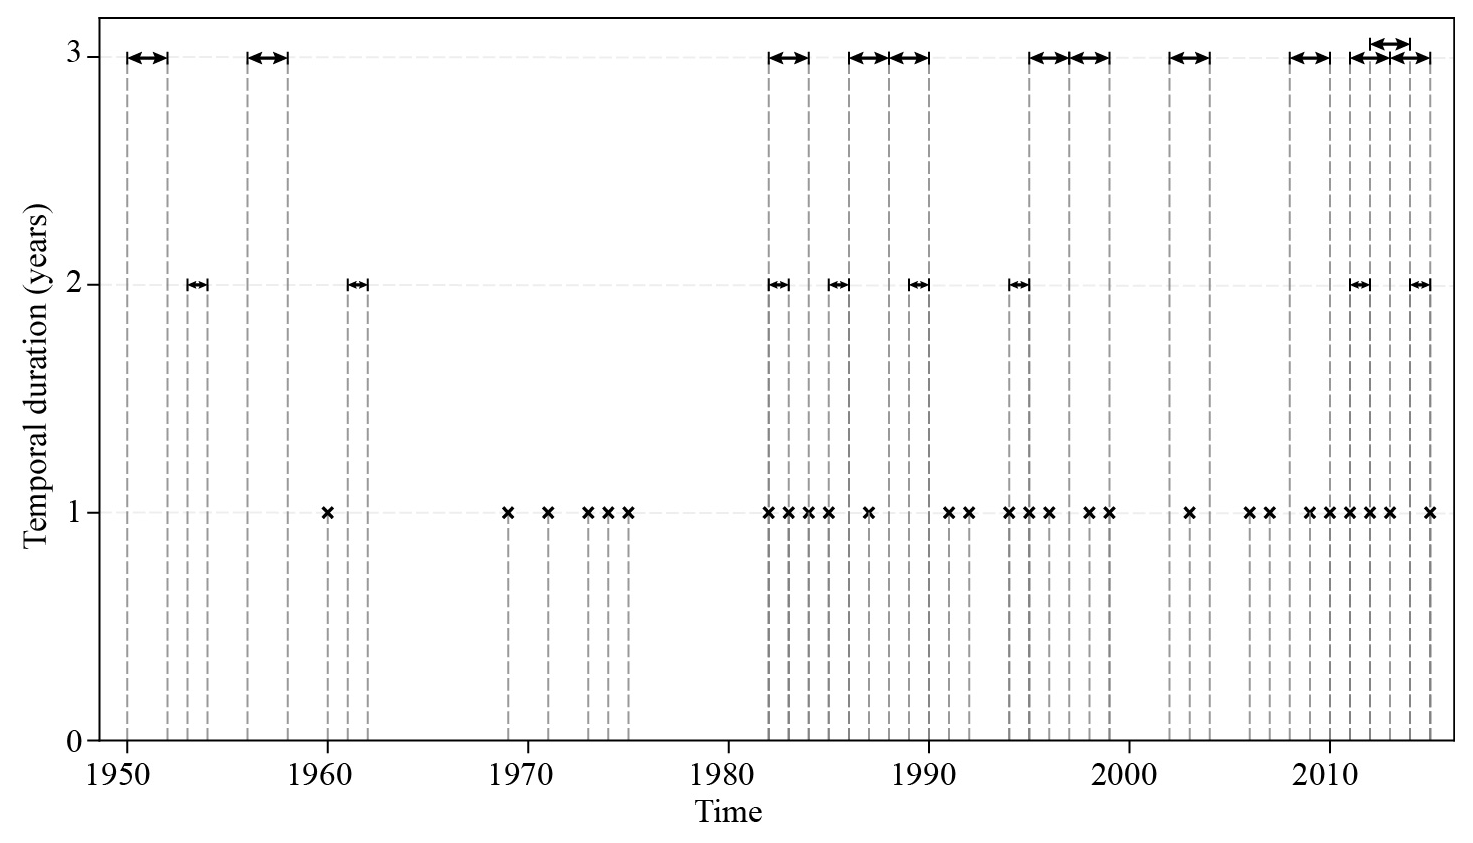
Figure 6Temporal duration of flash flood disaster clusters detected via the “yearly model” (Rmax=200 km, Tagg=1 year, Tmax=3 years).
To highlight the influence of the seasonal variability in cluster detection, we carried out additional analyses using a Tagg of 3 months (hereafter referred as monthly model). As shown in Fig. 5, the detected clusters are spread along the main river systems in China, namely the Yangtze, the Yellow, the Pearl and the Yarlung Zangbo rivers. In addition, some clusters stand out on high mountains such as the Qinling-Daba and the Changbai mountains.
Table 3Temporal duration of the first 10 clusters of flash flood disasters detected via the monthly model (Rmax=200 km, Tmax=1 year, Tagg=3 months).
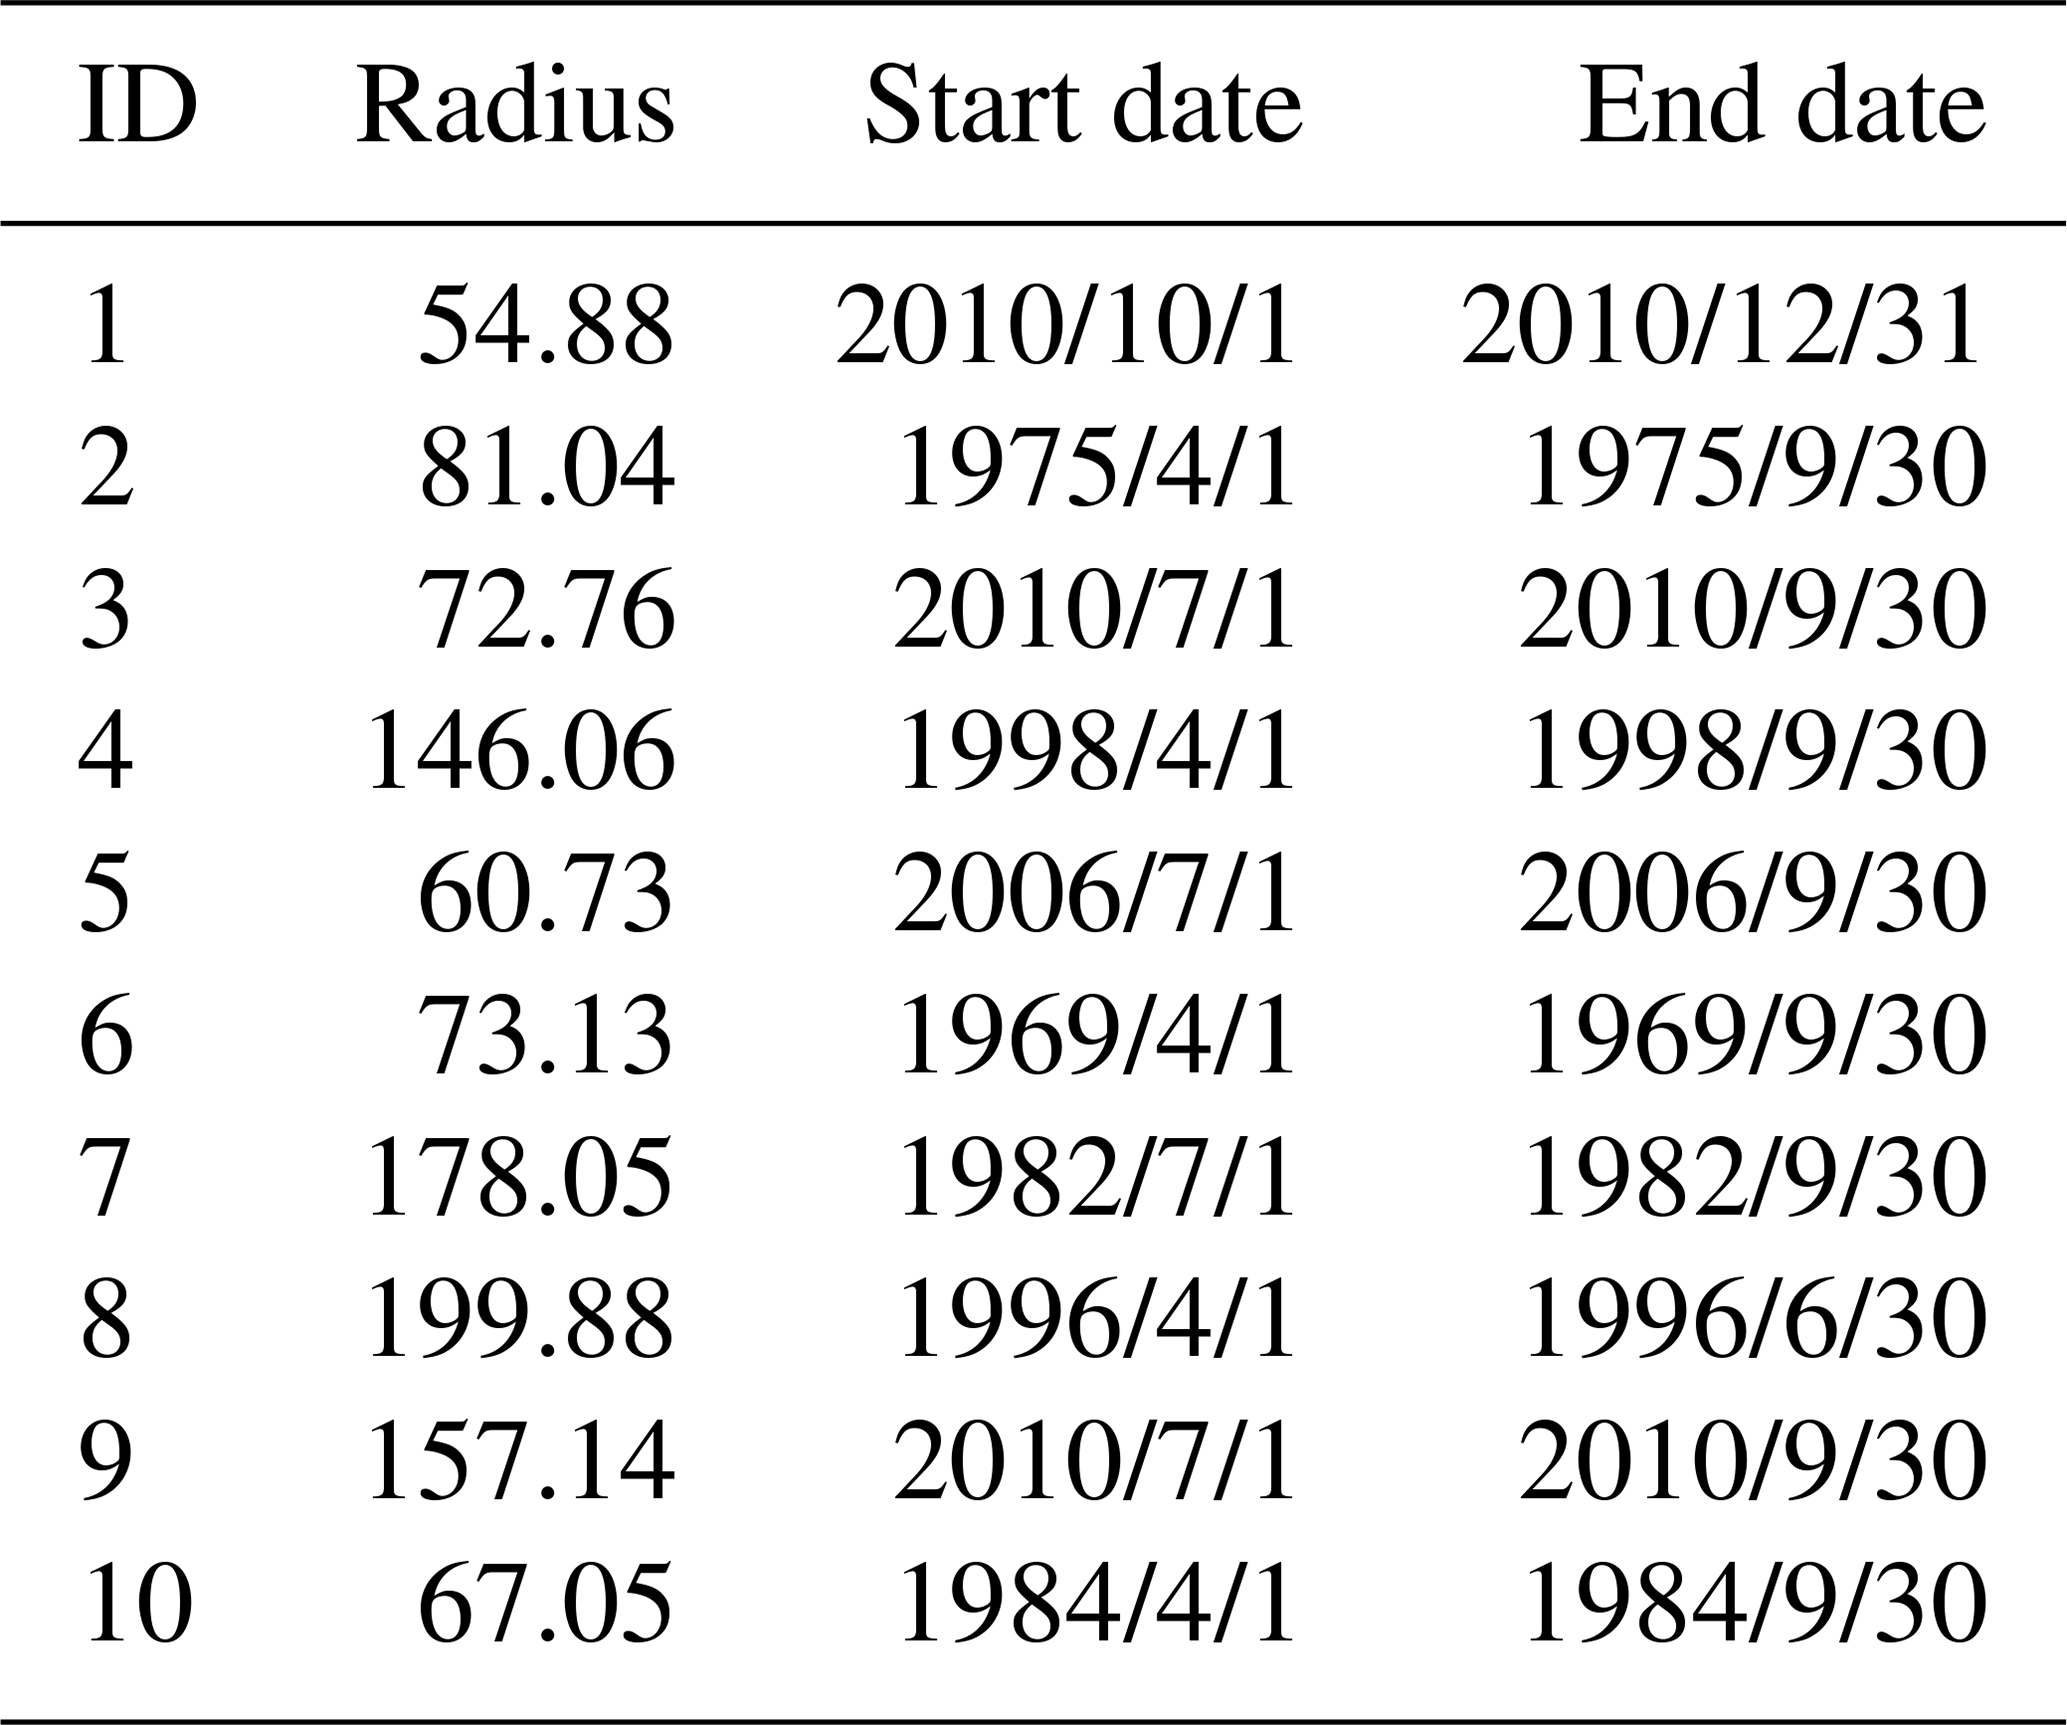
Forcing the model parameterization to aggregate over 3 months allows us to investigate potential seasonal effects. Indeed, even if the maximum temporal duration is still 1 year, looking at the 10 most significant clusters detected under the monthly model (Table 3), the result is that all of them have a duration of 3 (six clusters) or 6 (four clusters) months. Notably, almost every cluster (nine clusters) encompasses the period from July to September, with an earlier start date (in April) for the ones which have a longer duration.
To visualize the seasonality trend, we summarized these results using a cyclic representation (Fig. 7). The majority of the cluster have a 3-month duration, concentrated in the period between July and October. Furthermore, clusters of 6-month temporal duration are most likely to occur from January to July or from April to October. As for clusters with 9-month temporal duration, these mostly cover the period of July–August–September, irrespective of the starting month. Ultimately, as noticed for the yearly model, many more clusters were also detected in the monthly model in the recent period. Overall, the vast majority of flash flood disaster clusters happened between July and October, a period coinciding with the wet season in China.
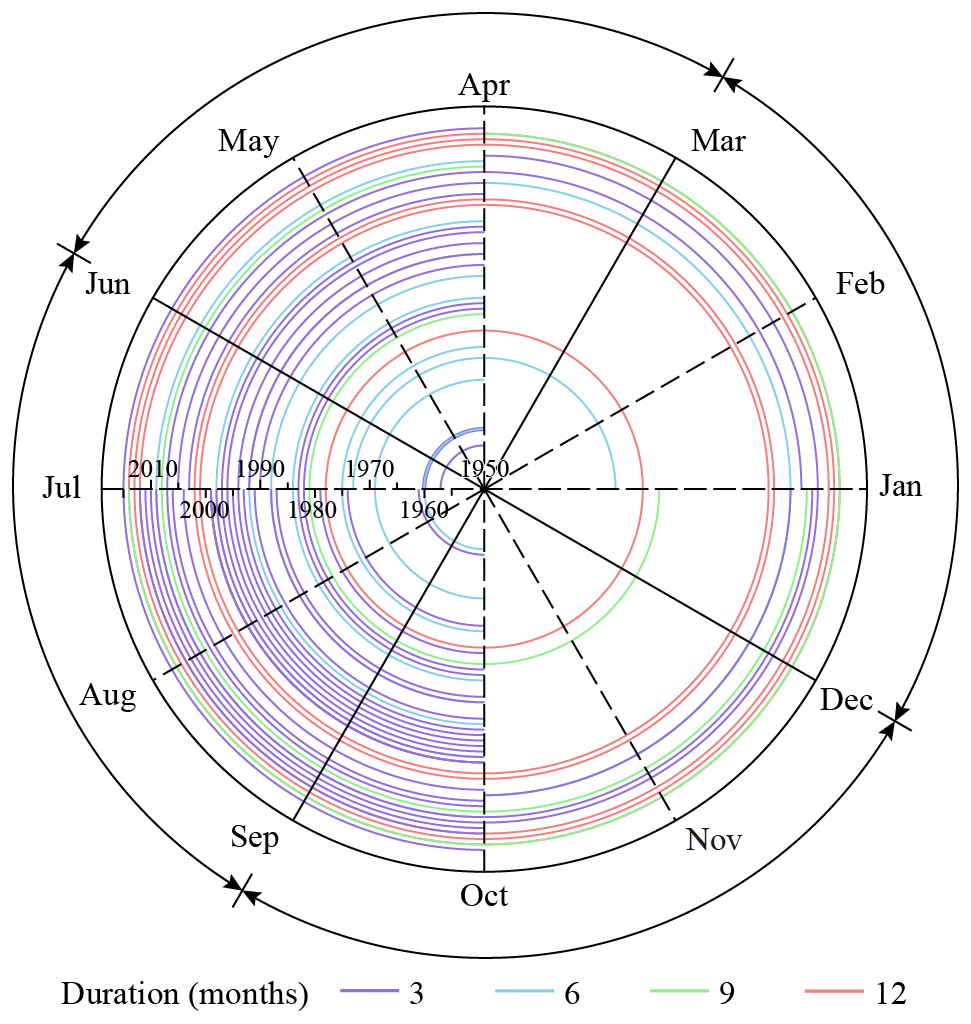
Figure 7Seasonal effect of flash flood disaster clusters detected via the monthly model (Rmax=200 km, Tmax=1 year, Tagg=3 months).
3.2.3 Clusters pattern evolution at decadal scale
The previous analyses allowed us to detect yearly and seasonal clusters. However, environmental changes usually act on a longer time span. To better investigate this factor, we considered a temporal subdivision of the dataset into six subsets, each one lasting 10 years (starting from 1956). Each subset was analyzed separately using the following parameter for the scanning widows: Rmax=200 km and Tmax=1 year, while no temporal aggregation was applied. This allowed us to precisely evaluate the temporal duration of each cluster, given as number of days between the earliest and the latest flash flood single event within a cluster. As shown in Fig. 8, the number of detected clusters increases from the early to recent periods. These are compared with the rainfall distribution derived from the daily rainfall data provided by the China Meteorological Administration (http://data.cma.cn/, last access: 30 November 2020). In the present study, only the weather stations (a total of 699 rain gauges) with complete data for the period 1955–2015 were considered. From these, we computed the extreme precipitation as follows. Out of the rainfall records available per weather station, we initially extracted 5 % of the time series corresponding to the rainfall values greater than the 95th percentile (Karl and Easterling, 1999; Klein Tank and Können, 2003). Then we cumulated these values per station over decadal time periods corresponding to 1956–1965, 1966–1975, 1976–1985, 1986–1995, 1996–2005 and 2006–2015. From these cumulated extreme rainfall values per station and per decade, we computed the mean over the 10-year time span and then interpolated over the whole spatial domain under consideration via a ordinary kriging. The data were regionalized on a 2 km × 2 km lattice. The procedure returned six maps of the mean extreme events per decade over the Chinese territory. The result is that flash-flood-detected clusters are mainly located in the southeasternmost humid regions in every period. However, in the last 2 decades, clusters appear also in the northwestern arid regions. Even if the rainfall distribution, averaged over each decade, does not allow to discover clear changes along the subsequent periods, these newly detected clusters can be due to the intensification of the extreme rainfall events occurring in the area in recent periods. This assumption is confirmed by the statistics on cluster duration (Fig. 9). From the boxplot summarizing the descriptive statistics it is evident that the median values of cluster durations tend to slightly decrease from 46 d (1956–1965) to 17 d (1986–1995) and stabilize at a value around 20 d in the last 2 decades. At the same time, the overall duration, measured as the difference between the maximum and the minimum value, is higher in the late periods (140 d in 1956–1965 and 93 and 74 d respectively in the 2 following decades) than in the early periods (about 65 d for the last 2 decades). This is even more evident looking at the inter-quantile ranges, which decrease with time. To resume, from these analyses, the result is that the number of detected clusters globally increases in time, but their duration drastically decreases in the recent period.
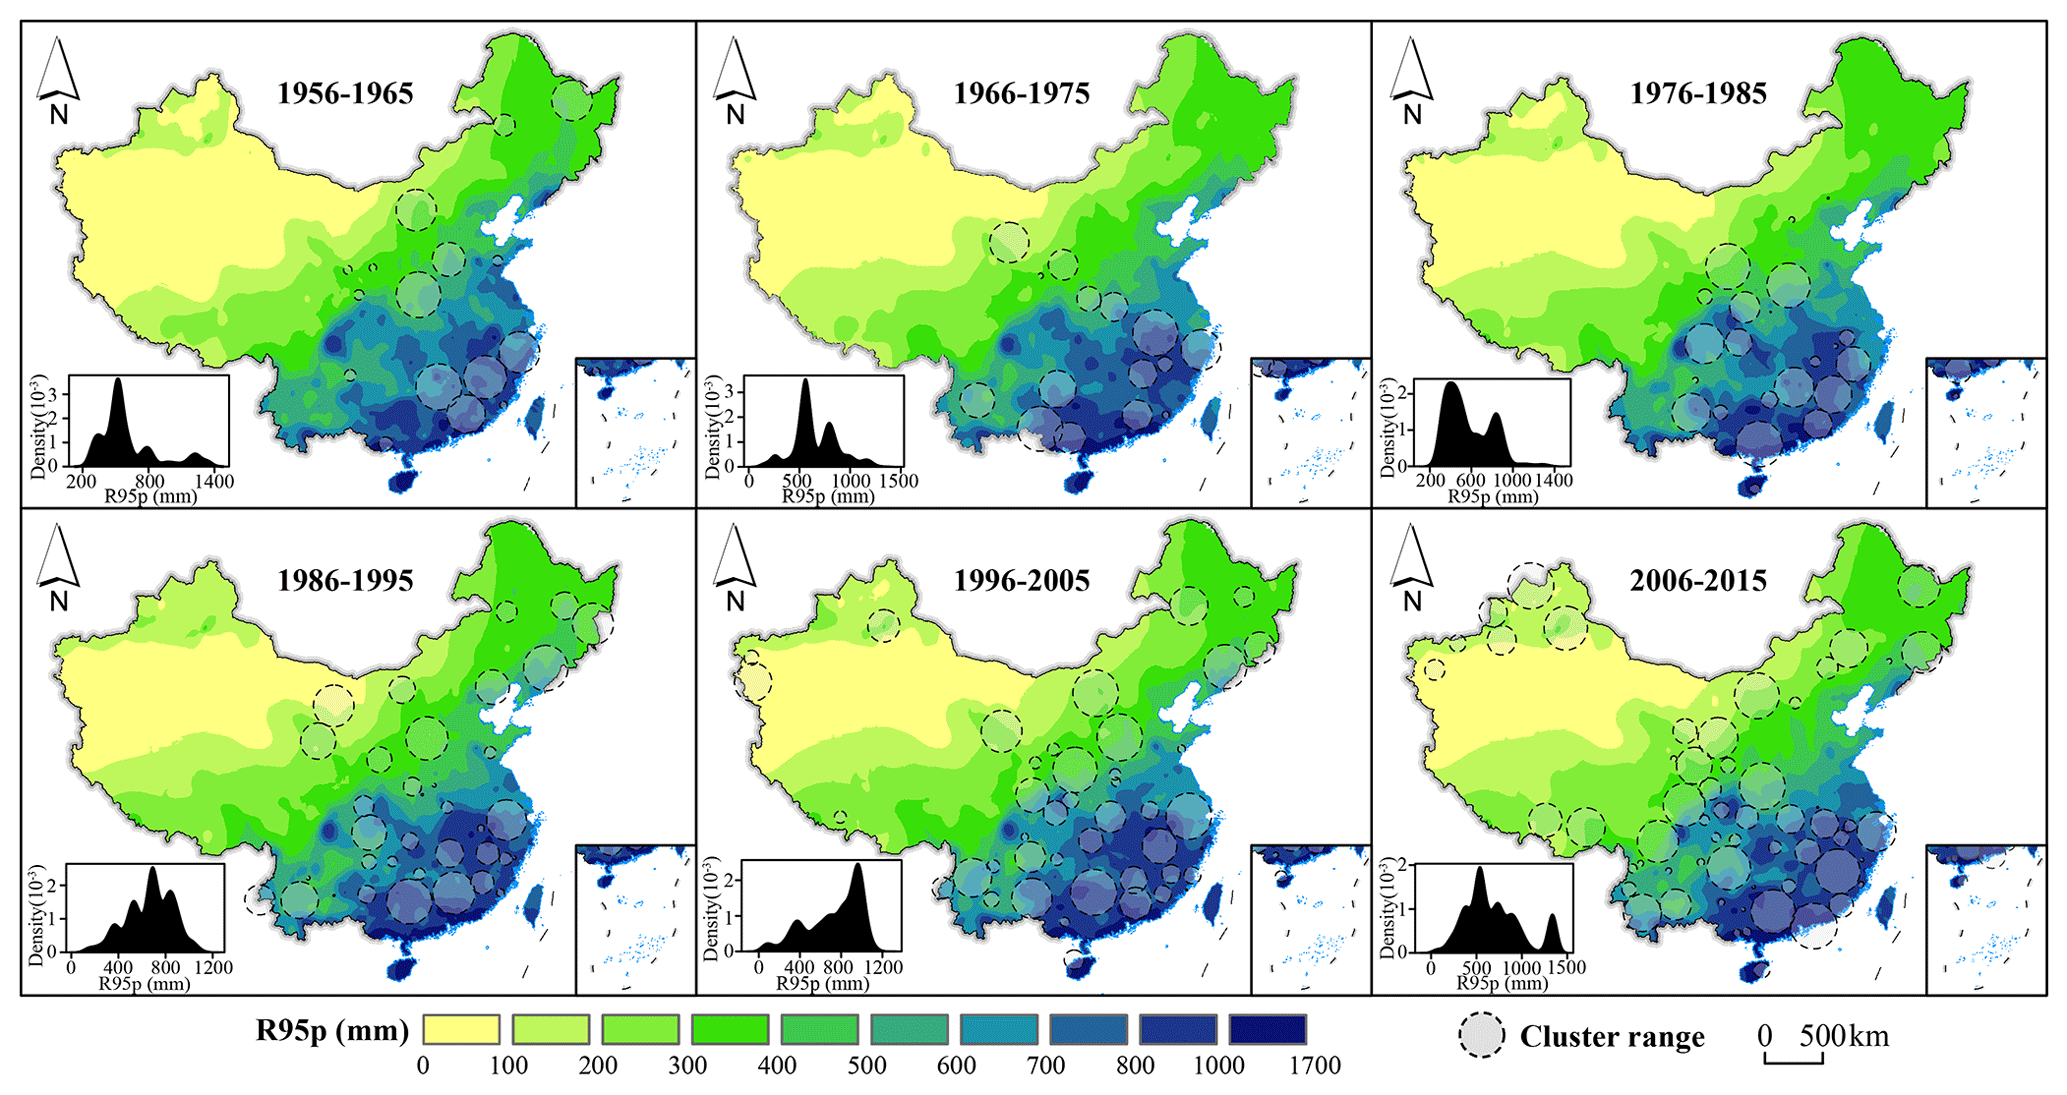
Figure 8Significant (p<0.005) spatiotemporal clusters of flash flood disasters in China every 10 years. The size of the circles indicates the spatial coverage of the flash flood clusters we detected.
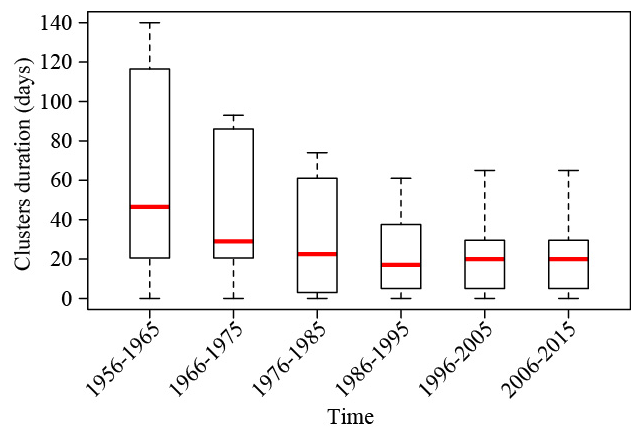
Figure 9Boxplots summarizing the descriptive statistics of the duration of clusters reported in Fig. 8.
Spatiotemporal clusters of flash flood disasters detected in China by decade were further assembled in a unique image. To this end, the centroid of each cluster (with reference to Fig. 8) was extracted and intersected with the catchment boundaries. Then, we computed the total number of clusters per catchment (Fig. 10a), as well as the average interval of time at which two consecutive clusters were detected in the same catchment (Fig. 10b). The result is that the catchments mainly affected by clusters of flash floods throughout several decades are mainly located in the southeast sector and essentially in the coastal mountains and that, on average, most of the clusters occur within an interval of 10–20 years.
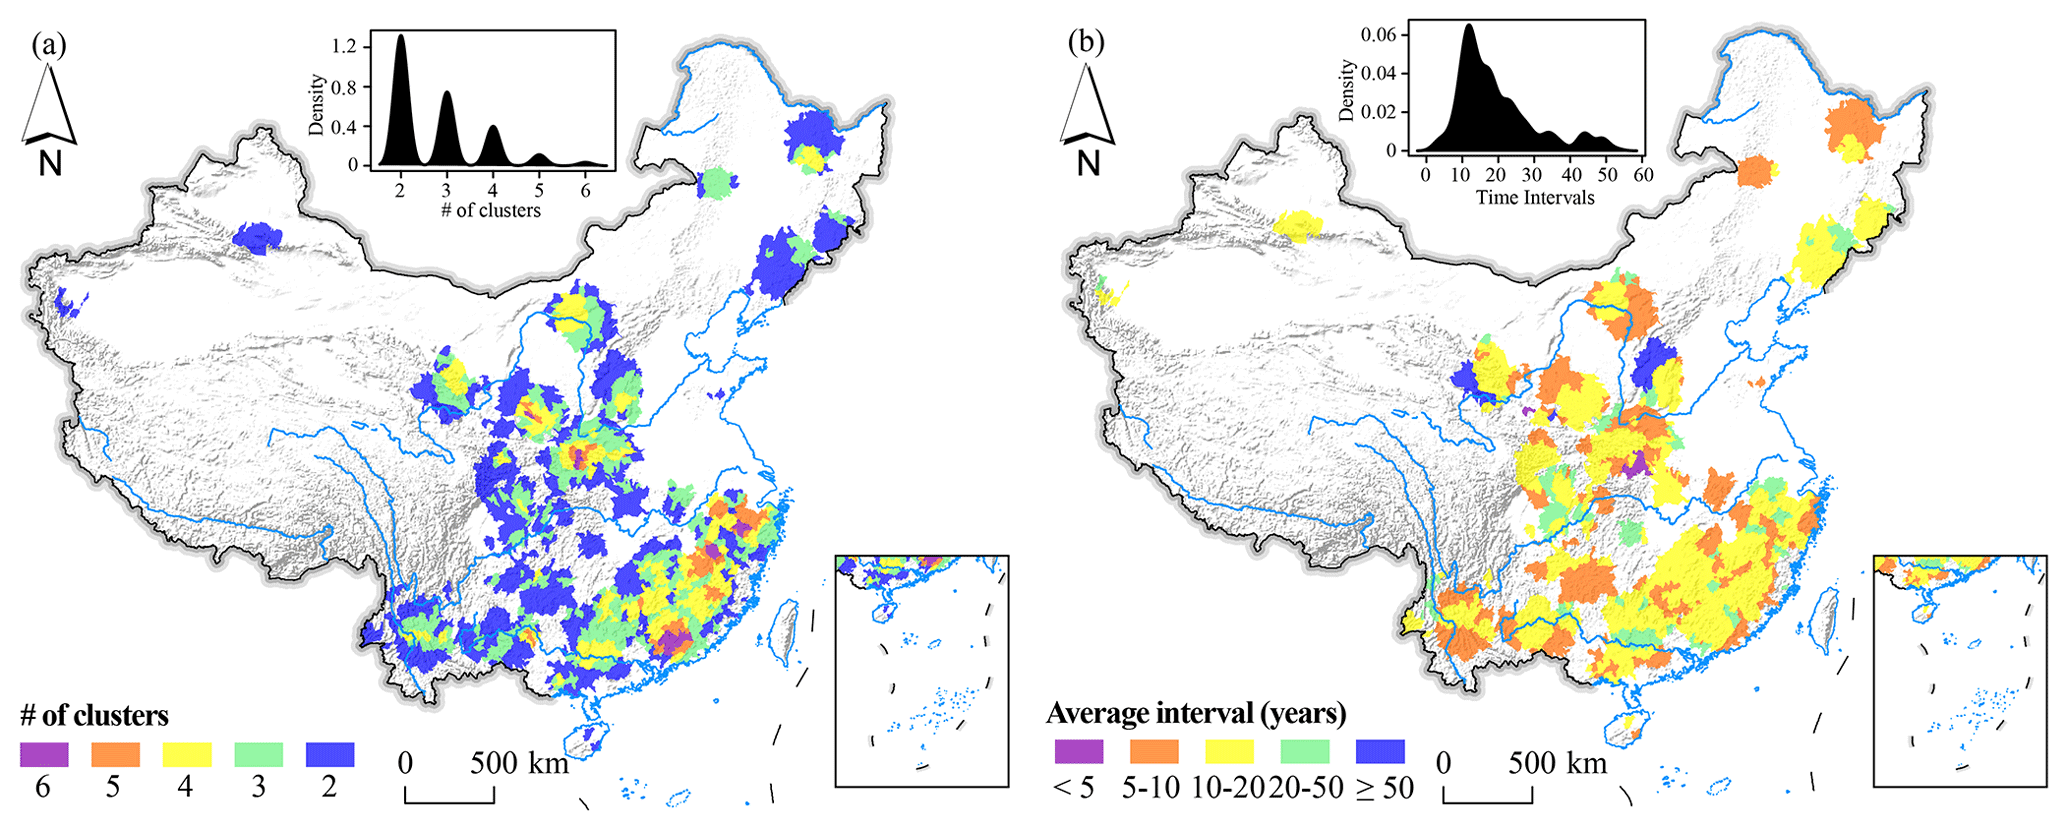
Figure 10Number of times a cluster has been detected per catchment and by decade (a). Average time interval between two clusters detected over the same catchment by decade (b).
The present study aims at exploring the spatiotemporal clustering characteristics, in terms of spatial location and temporal duration, of flash flood disasters in China. For this purpose, we analyzed the official historical inventory, which covers several decades from 1950 to 2015. Results are interpreted with a particular regard to the extreme rainfall distribution, these two processes being highly related (Wei et al., 2018). Actually the spatiotemporal pattern distribution of flash floods can also be induced by the geomorphological setting of the area and by anthropogenic pressures, such as land use and land cover changes (Yang and Tian, 2009). However, in the present study we are considering both the spatial and the temporal dimensions with the aim of detecting clusters occurring as a consequence of the interaction between these two variables. Therefore, these clusters are likely related to dynamic factors such as rainfall, which is the only triggering factor that covers and varies across the same spatiotemporal domain as the clusters themselves. Thus, our results are interpreted and discussed on the basis of this hypothesis.
The spatiotemporal K function computed first reveals a deviation of flash flood disasters from a random process at specific scales, measured and quantified both in space, as distance values, and in time, as yearly periods. Nevertheless this indicator can not provide the location at which clusters appear or their duration. To this end, the spatiotemporal permutation scan statistics was then performed. Results allowed us to identify statistically significant clusters, together with the start and end date of their occurrence, and to detect areas and periods more susceptible to flash flood disasters. We opted for a set of possible combinations for the maximum spatial and temporal extension of the scanning windows, while dates were aggregated both at yearly and at seasonal scales (i.e., over 3 months). Among the dozens or even hundreds of clusters detected by the different models, the top 10 most significant clusters resulting from the yearly model were analyzed in detail. These appears to be almost the same for any increasing value of Rmax even if their size and ranking can change. This is a consequence of the fact that small clusters detected when using an Rmax of 100 km can merge into bigger clusters when Rmax increases at 200 and 300 km. As for the occurrence time, these top 10 clusters are well distributed over the entire study period, with the earliest one dated to 1963 and the latest to 2010. Results of the monthly model show that the top 10 most significant clusters have a duration of 3 (six clusters) or 6 (four clusters) months. Notably, almost every cluster encompasses the period from July to September, coinciding with the wet season in China, with an earlier start date (in April) for the clusters that have a longer duration. The same behavior can be observed for the subsequent secondary clusters detected under the monthly model which, in addition, reveals an increasing number of clusters detected in the recent period.
Overall, clusters are chiefly located along the main river systems in China (the Yangtze, the Yellow, the Pearl and the Yarlung Zangbo rivers). In addition, some clusters stand out on high mountains such as the Qinling-Daba and the Changbai mountains.
Finally, to monitor the cluster pattern evolution, data were grouped and analyzed by decade. As for the previous analyses, detected clusters are mainly located in the southeasternmost humid regions in every period. However, in the last 2 decades, clusters appear also in the northwestern arid regions. These newly detected clusters can be due to the intensification of the extreme rainfall events occurring in the area in recent periods as a consequence of climate change (Song et al., 2011a). This important fact is confirmed by checking the descriptive statistics of the duration of clusters: globally, the number of detected clusters increases in time, but the duration drastically decreases in recent periods, indicating a possible activation induced by short-duration extreme rainfall events. Another factor that can induce flash floods in China is the tropical cyclones (Hu et al., 2018). Indeed, it is well known that tropical cyclones induce torrential rain which is a major trigger of catastrophic flood hazards in many coastal regions around the world (Rappaport, 2000; Dare et al., 2012; Zhang et al., 2019). A recent study by Lai et al. (2020) shows that slow-moving tropical cyclones, characterized by lower translation speed, occurred more frequently after 1990 in the Pearl River Delta in southern China. In addition, their findings suggest that these cyclones tend to elevate local rainfall totals and thus impose greater flood risks at the regional scale. Essentially cluster results have increased in number in the last 3 decades, but their duration drastically decreases in the recent period, indicating a possible activation induced by short-duration extreme rainfall events.
As the spatial distribution of detected clusters is concerned, our analyses revealed that the more affected catchments with frequent clusters are mainly located in the southeast sector and essentially in the coastal mountains. China is indicated as one of the hotspots with a global flood-exposed coastal population (Van Coppenolle and Temmerman, 2020). Therefore, we can assume that these catchments are exposed at the highest potential risk across the whole Chinese territory also in the short- to long-term future. In addition, catchments with clusters occurring within a short interval (5 to 10 years) may also pose a relevant threat, especially in the near future.
In the present study spatiotemporal clusters of flash floods were detected chiefly on the basis of two parameters (Rmax and Tmax) without featuring terrain attributes, precipitation regimes and anthropogenic pressure. However, these factors may have played and may still play a significant role in explaining the distribution of flash flood disasters. For instance, the approach we adopted may over rely on spatial distances to detect clusters. In fact, the natural landscape has mountain belts that can act as orographic barriers to the incoming cloudbursts, effectively limiting the rainfall distribution – hence flash flood occurrences – on one or the other side of a catchment divide (at various scales). As for the temporal scale, due to the large time span, the detected temporal patterns may reflect more information due to long-term climatic variations rather than specific conditions. For this reason, we are planning to extend our spatiotemporal cluster analyses to more complex models which can concurrently capture multivariate contributions featuring environmental effects even at the latent level (Lombardo et al., 2018, 2019).
In this work, we explore the national archive of flash flood disasters in China from 1950 to 2015. The term “disaster” is meant to describe the destructiveness of the flash floods, since each record in this archive has produced economic losses, loss of life or both.
The clustering procedure highlighted distinct spatial and temporal patterns at different scales. For instance, the statistically significant clusters of flash flood disasters detected in the present study occur in specific areas and have a characteristic duration which closely follow the extreme rainfall patterns. The performed analyses allowed us to distinguish between seasonal, yearly and even long-term persistent flash flood behaviors. The persistence of disasters is crucial information because it indicates the risk that a community may undergo in response to a flash flood. Moreover, we studied the cycle of such disasters with particular emphasis on their repeated occurrence per catchment and by decade. As a result, we highlighted that the southeasternmost sector of China is subjected to a much larger number of flash flood clusters compared to the rest of the country. However, in terms of how these clusters are manifested through time with regards to their average re-occurrence time, the catchments in the southeastern sector suffer from flash floods as frequently as the rest of the central and eastern sectors of the country. This complementary information can be further used in relation to engineering and structural design. In fact, infrastructure is usually built to sustain the damage of an event of a certain return time. In our analyses we show that at catchment level, the very same area can be affected by clusters at least two up to six times in the last 60 years, considering a time unit of 10 years. This may suggest locally tailored structural improvements which may lengthen the life expectancy of specific infrastructure, as well as reduce the number of victims.
We would like to stress that, as advanced as it may be, our clustering framework is essentially a descriptive tool, and yet, the amount of information one can draw from a descriptive tool can be extremely valuable. Nowadays, the hazard community's effort is mainly dedicated to predictive modeling of various natures and purposes, thus leaving under-explored or even unexplored some basic concepts and interpretative conclusions that data description and visualization can provide. Long time series of national hazard phenomena are one of these examples in which studying variations over space and time can highlight very important environmental dynamics even in the direction of climate change and its implications.
For the first exploratory analysis we used the R package CRAN (https://www.maths.lancs.ac.uk/~rowlings/Splancs/, Rowlingson and Diggle, 2017), and for the remaining analysis we used a proprietary software with a graphical interface.
The data are related to a confidential national project and are therefore not publicly available.
NW, LL and MT conceived and designed the experiments, NW performed the experiments, LL and MT analyzed the results, NW, LL and MT wrote the paper, and WC, LG and JX revised the paper.
The authors declare that they have no conflict of interest.
Publisher’s note: Copernicus Publications remains neutral with regard to jurisdictional claims in published maps and institutional affiliations.
The authors acknowledge the support by the China Institute of Water Resources and Hydropower Research (IWHR).
This research has been supported by the Science and Technology Project of Xizang Autonomous Region (grant no. XZ201901-GA-07), the China National Flash Flood Disasters Prevention and Control project (grant no. SHZH-IWHR-57), and the Science and Technology Development Plan of Jilin Province (grant no. 20190103151JH).
This paper was edited by Mario Parise and reviewed by three anonymous referees.
Allan, D. W.: Statistics of atomic frequency standards, P. IEEE, 54, 221–230, 1966. a
Archer, D., O'donnell, G., Lamb, R., Warren, S., and Fowler, H. J.: Historical flash floods in England: New regional chronologies and database, J. Flood Risk Manag., 12, e12526, https://doi.org/10.1111/jfr3.12526, 2019. a
Au, S.: Rain-induced slope instability in Hong Kong, Eng. Geol., 51, 1–36, 1998. a
Borga, M., Boscolo, P., Zanon, F., and Sangati, M.: Hydrometeorological analysis of the 29 August 2003 flash flood in the Eastern Italian Alps, J. Hydrometeorol., 8, 1049–1067, 2007. a
Borga, M., Anagnostou, E., Blöschl, G., and Creutin, J.-D.: Flash flood forecasting, warning and risk management: the HYDRATE project, Environ. Sci. Policy, 14, 834–844, 2011. a
Bout, B., Lombardo, L., van Westen, C., and Jetten, V.: Integration of two-phase solid fluid equations in a catchment model for flashfloods, debris flows and shallow slope failures, Environ. Modell. Softw., 105, 1–16, https://doi.org/10.1016/j.envsoft.2018.03.017, 2018. a
Cama, M., Lombardo, L., Conoscenti, C., Agnesi, V., and Rotigliano, E.: Predicting storm-triggered debris flow events: application to the 2009 Ionian Peloritan disaster (Sicily, Italy), Nat. Hazards Earth Syst. Sci., 15, 1785–1806, https://doi.org/10.5194/nhess-15-1785-2015, 2015. a
Cama, M., Lombardo, L., Conoscenti, C., and Rotigliano, E.: Improving transferability strategies for debris flow susceptibility assessment: Application to the Saponara and Itala catchments (Messina, Italy), Geomorphology, 288, 52–65, 2017. a
Chambers, J. E., Meldrum, P. I., Wilkinson, P. B., Ward, W., Jackson, C., Matthews, B., Joel, P., Kuras, O., Bai, L., Uhlemann, S., and Gunn, D.: Spatial monitoring of groundwater drawdown and rebound associated with quarry dewatering using automated time-lapse electrical resistivity tomography and distribution guided clustering, Eng. Geol., 193, 412–420, 2015. a
Chang, C.-W., Lin, P.-S., and Tsai, C.-L.: Estimation of sediment volume of debris flow caused by extreme rainfall in Taiwan, Eng. Geol., 123, 83–90, 2011. a
Costafreda-Aumedes, S., Comas, C., and Vega-Garcia, C.: Spatio-temporal configurations of human-caused fires in Spain through point patterns, Forests, 7, 185, https://doi.org/10.3390/f7090185, 2016. a
Dare, R. A., Davidson, N. E., and McBride, J. L.: Tropical cyclone contribution to rainfall over Australia, Mon. Weather Rev., 140, 3606–3619, 2012. a
de Bruijn, J. A., de Moel, H., Jongman, B., de Ruiter, M. C., Wagemaker, J., and Aerts, J. C.: A global database of historic and real-time flood events based on social media, Scientific Data, 6, 1–12, 2019. a
Ester, M., Kriegel, H. P., Sander, J., and Xu, X.: A density-based algorithm for discovering clusters in large spatial databases with noise, in: ACM SIGKDD Conference on Knowledge Discovery and Data Mining, 2–4 August 1996, Portland, USA, 96, 226–231, 1996. a
Fernández, D. and Lutz, M.: Urban flood hazard zoning in Tucumán Province, Argentina, using GIS and multicriteria decision analysis, Eng. Geol., 111, 90–98, 2010. a
Fischer, T. and Horálek, J.: Space-time distribution of earthquake swarms in the principal focal zone of the NW Bohemia/Vogtland seismoactive region: period 1985–2001, J. Geodyn., 35, 125–144, 2003. a
Fuchs, S., Keiler, M., and Zischg, A.: A spatiotemporal multi-hazard exposure assessment based on property data, Nat. Hazards Earth Syst. Sci., 15, 2127–2142, https://doi.org/10.5194/nhess-15-2127-2015, 2015. a
Fuentes-Santos, I., Marey-Pérez, M., and González-Manteiga, W.: Forest fire spatial pattern analysis in Galicia (NW Spain), J. Environ. Manage., 128, 30–42, 2013. a
Gariano, S. L. and Guzzetti, F.: Landslides in a changing climate, Earth-Sci. Rev., 162, 227–252, https://doi.org/10.1016/j.earscirev.2016.08.011, 2016. a
Gartner, J. E., Cannon, S. H., and Santi, P. M.: Empirical models for predicting volumes of sediment deposited by debris flows and sediment-laden floods in the transverse ranges of southern California, Eng. Geol., 176, 45–56, 2014. a
Gaume, E., Bain, V., Bernardara, P., Newinger, O., Barbuc, M., Bateman, A., Blaškovičová, L., Blöschl, G., Borga, M., Dumitrescu, A., Daliakopoulos, I., Garcia, J., Irimescu, A., Kohnova, S., Koutroulis, A., Marchi, L., Matreata, S., Medina, V., Preciso, E., Sempere-Torres, E., Stancalie, G., Szolgay, J., Tsanis, I., Velasco, D., and Viglione, A.: A compilation of data on European flash floods, J. Hydrol., 367, 70–78, 2009. a
Georgoulas, G., Konstantaras, A., Katsifarakis, E., Stylios, C. D., Maravelakis, E., and Vachtsevanos, G. J.: “Seismic-mass” density-based algorithm for spatio-temporal clustering, Expert Syst. Appl., 40, 4183–4189, 2013. a
Gomez, H. and Kavzoglu, T.: Assessment of shallow landslide susceptibility using artificial neural networks in Jabonosa River Basin, Venezuela, Eng. Geol., 78, 11–27, 2005. a
Gourley, J. J., Hong, Y., Flamig, Z. L., Arthur, A., Clark, R., Calianno, M., Ruin, I., Ortel, T., Wieczorek, M. E., Kirstetter, P.-E., Clark, E., and Krajewski, W. F.: A unified flash flood database across the United States, B. Am. Meteorol. Soc., 94, 799–805, 2013. a
Gu, X., Zhang, Q., Singh, V. P., Chen, X., and Liu, L.: Nonstationarity in the occurrence rate of floods in the Tarim River basin, China, and related impacts of climate indices, Global Planet. Change, 142, 1–13, 2016a. a
Gu, X., Zhang, Q., Singh, V. P., Chen, Y. D., and Shi, P.: Temporal clustering of floods and impacts of climate indices in the Tarim River basin, China, Global Planet. Change, 147, 12–24, 2016b. a
Haigh, I. D., Ozsoy, O., Wadey, M. P., Nicholls, R. J., Gallop, S. L., Wahl, T., and Brown, J. M.: An improved database of coastal flooding in the United Kingdom from 1915 to 2016, Scientific Data, 4, 170100, https://doi.org/10.1038/sdata.2017.100, 2017. a
Hatheway, A. W., Kanaori, Y., Cheema, T., Griffiths, J., and Promma, K.: 10th annual report on the international status of engineering geology–year 2004–2005; encompassing hydrogeology, environmental geology and the applied geosciences, Eng. Geol., 81, 99–130, 2005. a
He, B., Huang, X., Ma, M., Chang, Q., Tu, Y., Li, Q., Zhang, K., and Hong, Y.: Analysis of flash flood disaster characteristics in China from 2011 to 2015, Nat. Hazards, 90, 407–420, 2018. a
Hu, P., Zhang, Q., Shi, P., Chen, B., and Fang, J.: Flood-induced mortality across the globe: Spatiotemporal pattern and influencing factors, Sci. Total Environ., 643, 171–182, 2018. a
Jessee, M., Hamburger, M. W., Ferrara, M. R., Mclean, A., and Fitzgerald, C.: A global dataset and model of earthquake-induced landslide fatalities, Landslides, 17, 1363–1376, https://doi.org/10.1007/s10346-020-01356-z, 2020. a
Jonkman, S. N.: Global perspectives on loss of human life caused by floods, Nat. Hazards, 34, 151–175, 2005. a
Jonkman, S. N. and Kelman, I.: An analysis of the causes and circumstances of flood disaster deaths, Disasters, 29, 75–97, 2005. a
Karl, T. R. and Easterling, D. R.: Climate extremes: selected review and future research directions, Climatic Change, 42, 309–325, 1999. a
Kelman, I. and Spence, R.: An overview of flood actions on buildings, Eng. Geol., 73, 297–309, 2004. a
Klein Tank, A. and Können, G.: Trends in indices of daily temperature and precipitation extremes in Europe, 1946–99, J. Climate, 16, 3665–3680, 2003. a
Kouli, M., Loupasakis, C., Soupios, P., and Vallianatos, F.: Landslide hazard zonation in high risk areas of Rethymno Prefecture, Crete Island, Greece, Nat. Hazards, 52, 599–621, https://doi.org/10.1007/s11069-009-9403-2, 2010. a
Kulldorff, M.: A spatial scan statistic, Communications in Statistics-Theory and methods, 26, 1481–1496, 1997. a, b
Kulldorff, M., Athas, W. F., Feurer, E. J., Miller, B. A., and Key, C. R.: Evaluating cluster alarms: a space-time scan statistic and brain cancer in Los Alamos, New Mexico, Am. J. Public Health, 88, 1377–1380, https://doi.org/10.2105/AJPH.88.9.1377, 1998. a
Kulldorff, M., Heffernan, R., Hartman, J., Assunção, R., and Mostashari, F.: A Space–Time Permutation Scan Statistic for Disease Outbreak Detection, PLoS Med, 2, e59, https://doi.org/10.1371/journal.pmed.0020059, 2005. a
Lai, Y., Li, J., Gu, X., Chen, Y. D., Kong, D., Gan, T. Y., Liu, M., Li, Q., and Wu, G.: Greater flood risks in response to slowdown of tropical cyclones over the coast of China, P. Natl. Acad. Sci. USA, 117, 14751–14755, 2020. a
Liu, Y., Yang, Z., Huang, Y., and Liu, C.: Spatiotemporal evolution and driving factors of China’s flash flood disasters since 1949, Science China Earth Sciences, 61, 1804–1817, 2018. a, b, c
Lóczy, D., Czigány, S., and Pirkhoffer, E.: Flash flood hazards, in: Studies on water management issues, IntechOpen, London, United Kingdom, 2012. a
Lombardo, L., Opitz, T., and Huser, R.: Point process-based modeling of multiple debris flow landslides using INLA: an application to the 2009 Messina disaster, Stoch. Env. Res. Risk A., 32, 2179–2198, https://doi.org/10.1007/s00477-018-1518-0, 2018. a, b
Lombardo, L., Bakka, H., Tanyas, H., van Westen, C., Mai, P. M., and Huser, R.: Geostatistical modeling to capture seismic-shaking patterns from earthquake-induced landslides, J. Geophys. Res.-Earth, 124, 1958–1980, https://doi.org/10.1029/2019JF005056, 2019. a, b
Lombardo, L., Opitz, T., Ardizzone, F., Guzzetti, F., and Huser, R.: Space-time landslide predictive modelling, Earth-Sci. Rev., 209, 103318, https://doi.org/10.1016/j.earscirev.2020.103318, 2020. a
Lovejoy, S., Schertzer, D., and Ladoy, P.: Fractal characterization of inhomogeneous geophysical measuring networks, Nature, 319, 43–44, 1986. a
Merz, B., Nguyen, V. D., and Vorogushyn, S.: Temporal clustering of floods in Germany: Do flood-rich and flood-poor periods exist?, J. Hydrol., 541, 824–838, 2016. a, b, c
Moran, P. A.: Notes on continuous stochastic phenomena, Biometrika, 37, 17–23, 1950. a
Naus, J. L.: Clustering of random points in two dimensions, Biometrika, 52, 263–266, https://doi.org/10.1093/biomet/52.1-2.263, 1965a. a
Naus, J. L.: The distribution of the size of the maximum cluster of points on a line, J. Am. Stat. Assoc., 60, 532–538, https://doi.org/10.1080/01621459.1965.10480810, 1965b. a
Openshaw, S., Charlton, M., Wymer, C., and Craft, A.: A mark 1 geographical analysis machine for the automated analysis of point data sets, Int. J. Geogr. Inf. Syst., 1, 335–358, 1987. a
Orozco, C. V., Tonini, M., Conedera, M., and Kanveski, M.: Cluster recognition in spatial-temporal sequences: the case of forest fires, Geoinformatica, 16, 653–673, 2012. a
Pappadà, R., Durante, F., Salvadori, G., and De Michele, C.: Clustering of concurrent flood risks via Hazard Scenarios, Spat. Stat., 23, 124–142, 2018. a
Pierson, T. C., Costa, J. E., and Vancouver, W.: A rheologic classification of subaerial sediment-water flows, Debris flows/avalanches: process, recognition, and mitigation, Rev. Eng. Geol., 7, 1–12, 1987. a
R Core Team: R: A Language and Environment for Statistical Computing, R Foundation for Statistical Computing, Vienna, Austria, available at: https://www.R-project.org/ (last access: 4 June 2020), 2019. a
Rappaport, E. N.: Loss of life in the United States associated with recent Atlantic tropical cyclones, B. Am. Meteorol. Soc., 81, 2065–2074, 2000. a
Renard, F.: Flood risk management centred on clusters of territorial vulnerability, Geomat. Nat. Haz. Risk, 8, 525–543, 2017. a
Ripley, B. D.: Modelling Spatial Patterns, J. Roy. Stat. Soc. B Met., 39, 172–192, https://doi.org/10.1111/j.2517-6161.1977.tb01615.x, 1977. a, b
Rowlingson, B. and Diggle, P.: Splancs: spatial and space-time point pattern analysis, R package version 2.01-40, available at: https://www.maths.lancs.ac.uk/~rowlings/Splancs/ (last access: 25 April 2020), 2017. a, b
Sampson, C. C., Smith, A. M., Bates, P. D., Neal, J. C., Alfieri, L., and Freer, J. E.: A high-resolution global flood hazard model, Water Resour. Res., 51, 7358–7381, 2015. a
Santangelo, N., Daunis-i Estadella, J., Di Crescenzo, G., Di Donato, V., Faillace, P., Martín-Fernández, J., Romano, P., Santo, A., and Scorpio, V.: Topographic predictors of susceptibility to alluvial fan flooding, Southern Apennines, Earth Surf. Proc. Land., 37, 803–817, 2012. a
Song, Y., Achberger, C., and Linderholm, H. W.: Rain-season trends in precipitation and their effect in different climate regions of China during 1961–2008, Environ. Res. Lett., 6, 034025, https://doi.org/10.1088/1748-9326/6/3/034025, 2011a. a
Song, Y., Achberger, C., and Linderholm, H. W.: Rain-season trends in precipitation and their effect in different climate regions of China during 1961–2008, Environ. Res. Lett., 6, 034025, https://doi.org/10.1088/1748-9326/6/3/034025, 2011b. a
Stoyan, D.: Fundamentals of point process statistics, in: Case studies in spatial point process modeling, 3–22, Springer, New York, USA, 2006. a
Tokhmechi, B., Memarian, H., Moshiri, B., Rasouli, V., and Noubari, H. A.: Investigating the validity of conventional joint set clustering methods, Eng. Geol., 118, 75–81, 2011. a
Tonini, M. and Cama, M.: Spatio-temporal pattern distribution of landslides causing damage in Switzerland, Landslides, 16, 2103–2113, 2019. a, b, c
Tonini, M., Pereira, M. G., Parente, J., and Orozco, C. V.: Evolution of forest fires in Portugal: from spatio-temporal point events to smoothed density maps, Nat. Hazards, 85, 1489–1510, 2017. a
Turnbull, B. W., Iwano, E. J., Burnett, W. S., Howe, H. L., and Clark, L. C.: Monitoring for clusters of disease: application to leukemia incidence in upstate New York, Am. J. Epidemiol., 132, 136–143, 1990. a
Van Coppenolle, R. and Temmerman, S.: Identifying global hotspots where coastal wetland conservation can contribute to nature-based mitigation of coastal flood risks, Global Planet. Change, 187, 103125, https://doi.org/10.1016/j.gloplacha.2020.103125, 2020. a
Varga, P., Krumm, F., Riguzzi, F., Doglioni, C., Süle, B., Wang, K., and Panza, G.: Global pattern of earthquakes and seismic energy distributions: Insights for the mechanisms of plate tectonics, Tectonophysics, 530, 80–86, 2012. a
Vennari, C., Parise, M., Santangelo, N., and Santo, A.: A database on flash flood events in Campania, southern Italy, with an evaluation of their spatial and temporal distribution, Nat. Hazards Earth Syst. Sci., 16, 2485–2500, https://doi.org/10.5194/nhess-16-2485-2016, 2016. a
Wang, N., Cheng, W., Wang, B., Liu, Q., and Zhou, C.: Geomorphological regionalization theory system and division methodology of China, J. Geogr. Sci., 30, 212–232, 2020. a
Wei, L., Hu, K.-h., and Hu, X.-d.: Rainfall occurrence and its relation to flood damage in China from 2000 to 2015, J. Mt. Sci., 15, 2492–2504, https://doi.org/10.1007/s11629-018-4931-4, 2018. a
Wood, J., Harrison, S., Reinhardt, L., and Taylor, F.: Landslide databases for climate change detection and attribution, Geomorphology, 355, 107061, https://doi.org/10.1016/j.geomorph.2020.107061, 2020. a
Woodward, K., Wesseloo, J., and Potvin, Y.: A spatially focused clustering methodology for mining seismicity, Eng. Geol., 232, 104–113, 2018. a
Wu, Y., Ji, H., Wen, J., Wu, S.-Y., Xu, M., Tagle, F., He, B., Duan, W., and Li, J.: The characteristics of regional heavy precipitation events over eastern monsoon China during 1960–2013, Global Planet. Change, 172, 414–427, 2019. a
Xu, Z., Gong, T., and Li, J.: Decadal trend of climate in the Tibetan Plateau – regional temperature and precipitation, Hydrol. Process., 22, 3056–3065, 2008. a
Yang, J., Cheng, C., Song, C., Shen, S., Zhang, T., and Ning, L.: Spatial-temporal distribution characteristics of global seismic clusters and associated spatial factors, Chinese Geogr. Sci., 29, 614–625, https://doi.org/10.1007/s11769-019-1059-6, 2019. a
Yang, Y. and Tian, F.: Abrupt change of runoff and its major driving factors in Haihe River Catchment, China, J. Hydrol., 374, 373–383, 2009. a
Zaharia, L., Costache, R., Prăvălie, R., and Ioana-Toroimac, G.: Mapping flood and flooding potential indices: a methodological approach to identifying areas susceptible to flood and flooding risk. Case study: the Prahova catchment (Romania), Front. Earth Sci., 11, 229–247, 2017. a
Zhan, J., Xu, P., Chen, J., Wang, Q., Zhang, W., and Han, X.: Comprehensive characterization and clustering of orientation data: A case study from the Songta dam site, China, Eng. Geol., 225, 3–18, 2017. a
Zhang, D. D., Zhang, J., Lee, H. F., and He, Y.-q.: Climate change and war frequency in Eastern China over the last millennium, Hum. Ecol., 35, 403–414, 2007. a
Zhang, Q., Wei, Q., and Chen, L.: Impact of landfalling tropical cyclones in mainland China, Science China Earth Sciences, 53, 1559–1564, 2010. a
Zhang, X. and Cong, Z.: Trends of precipitation intensity and frequency in hydrological regions of China from 1956 to 2005, Global Planet. Change, 117, 40–51, 2014. a, b
Zhang, Y., Wang, Y., Chen, Y., Liang, F., and Liu, H.: Assessment of future flash flood inundations in coastal regions under climate change scenarios – A case study of Hadahe River basin in northeastern China, Sci. Total Environ., 693, 133550, https://doi.org/10.1016/j.scitotenv.2019.07.356, 2019. a
Zhao, J., Jin, J., Guo, Q., Liu, L., Chen, Y., and Pan, M.: Dynamic risk assessment model for flood disaster on a projection pursuit cluster and its application, Stoch. Env. Res. Risk A., 28, 2175–2183, 2014. a