the Creative Commons Attribution 4.0 License.
the Creative Commons Attribution 4.0 License.
 | 08 Jul 2021
A homogeneous earthquake catalogue for Turkey
Onur Tan
A new homogenized earthquake catalogue for Turkey is compiled for the period 1900–2018. The earthquake parameters are obtained from the Bulletin of International Seismological Centre that was fully updated in 2020. New conversion equations between moment magnitude and the other scales (md, ML, mb, Ms, and M) are determined using the general orthogonal regression method to build up a homogeneous catalogue, which is the essential database for seismic hazard studies. The 95 % confidence intervals are estimated using the bootstrap method with 1000 samples. The equivalent moment magnitudes () for the entire catalogue are calculated using the magnitude relations to homogenize the catalogue. The magnitude of completeness is 2.7 . The final catalogue is not declustered or truncated using a threshold magnitude in order to be a widely usable catalogue. It contains not only but also the average and median of the observed magnitudes for each event. Contrary to the limited earthquake parameters in the previous catalogues for Turkey, the 45 parameters of ∼378 000 events are presented in this study.
- Article
(11277 KB) - Full-text XML
-
Supplement
(13029 KB) - BibTeX
- EndNote


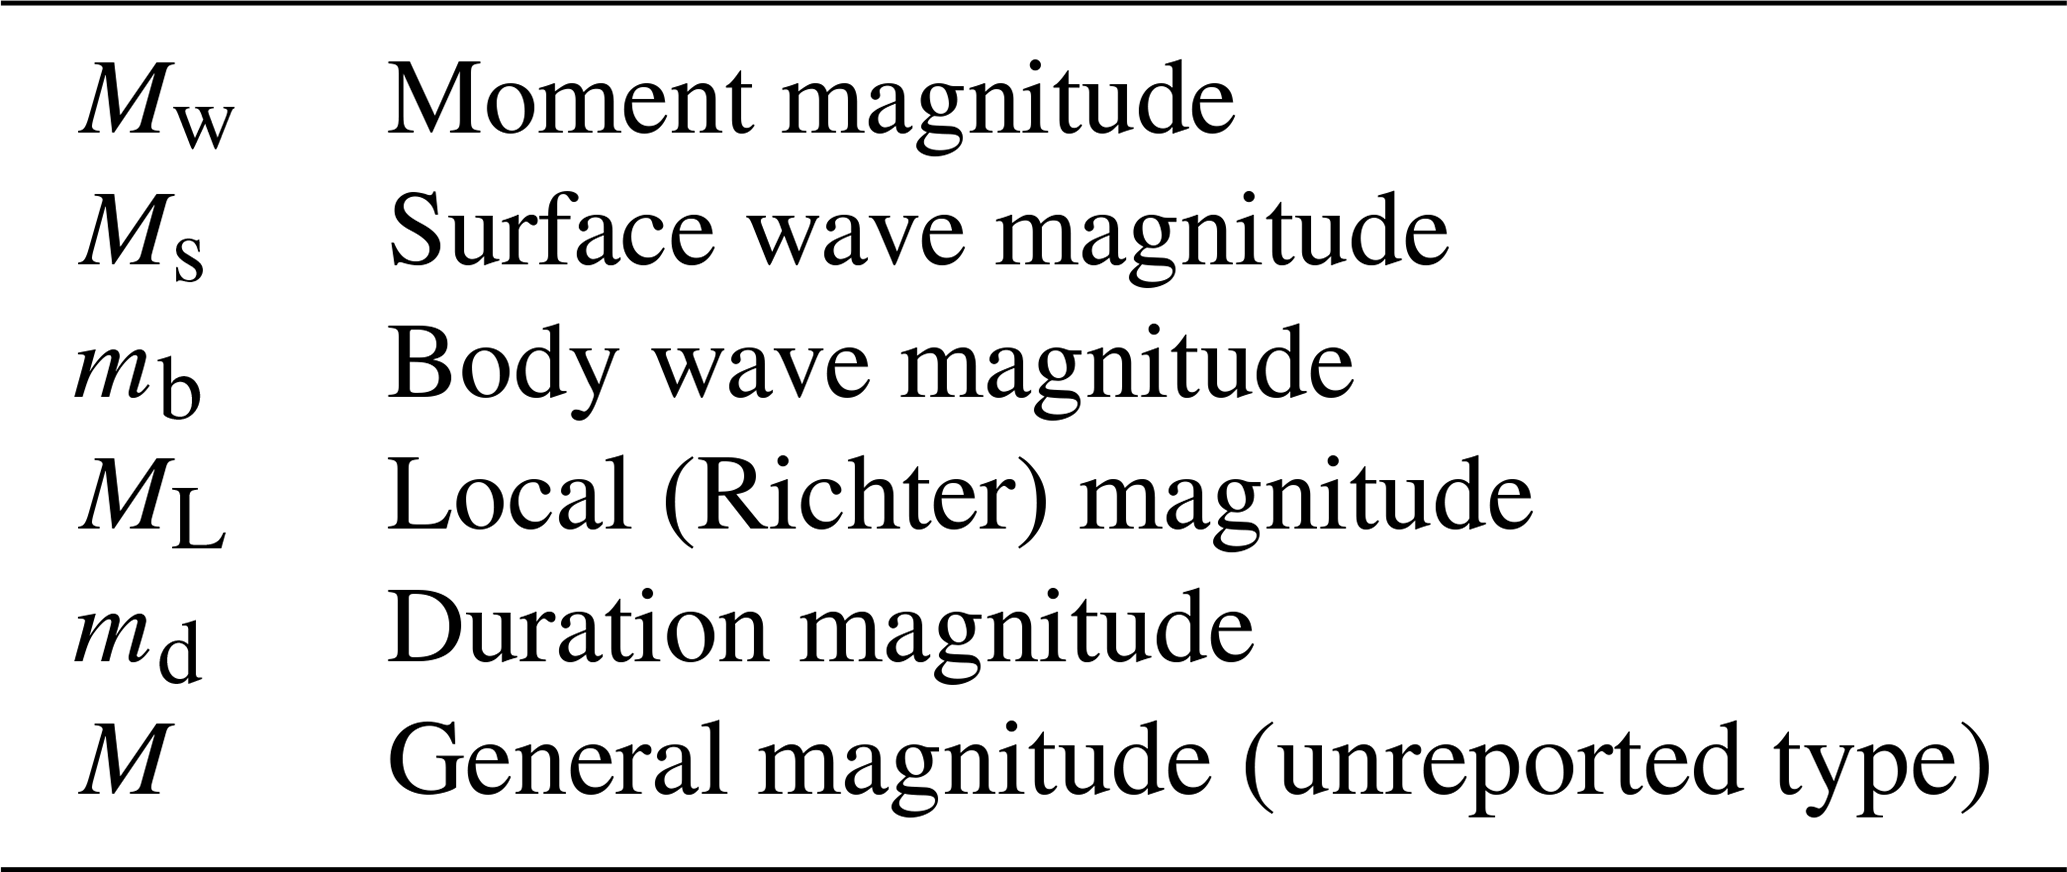
The earthquake catalogues are the first output of seismological observations. Several institutions around the world generate national and international catalogues for understanding the seismic activity of a region. Principally, a catalogue contains the parameters such as origin time, coordinates, and focal depth. Earthquake magnitude is another vital parameter which is a dimensionless scale of energy being released. Magnitude is defined with different scales (types) based on different seismic wave phases and calculation approximations (Table 1). A catalogue may not contain all magnitude scales for an event. If an earthquake catalogue is used to show seismicity on a map, the magnitude type may not be important because the differences among the values of scales are not too large for visualization. However, magnitude scale information used in energy calculation is crucial for seismic hazard studies.
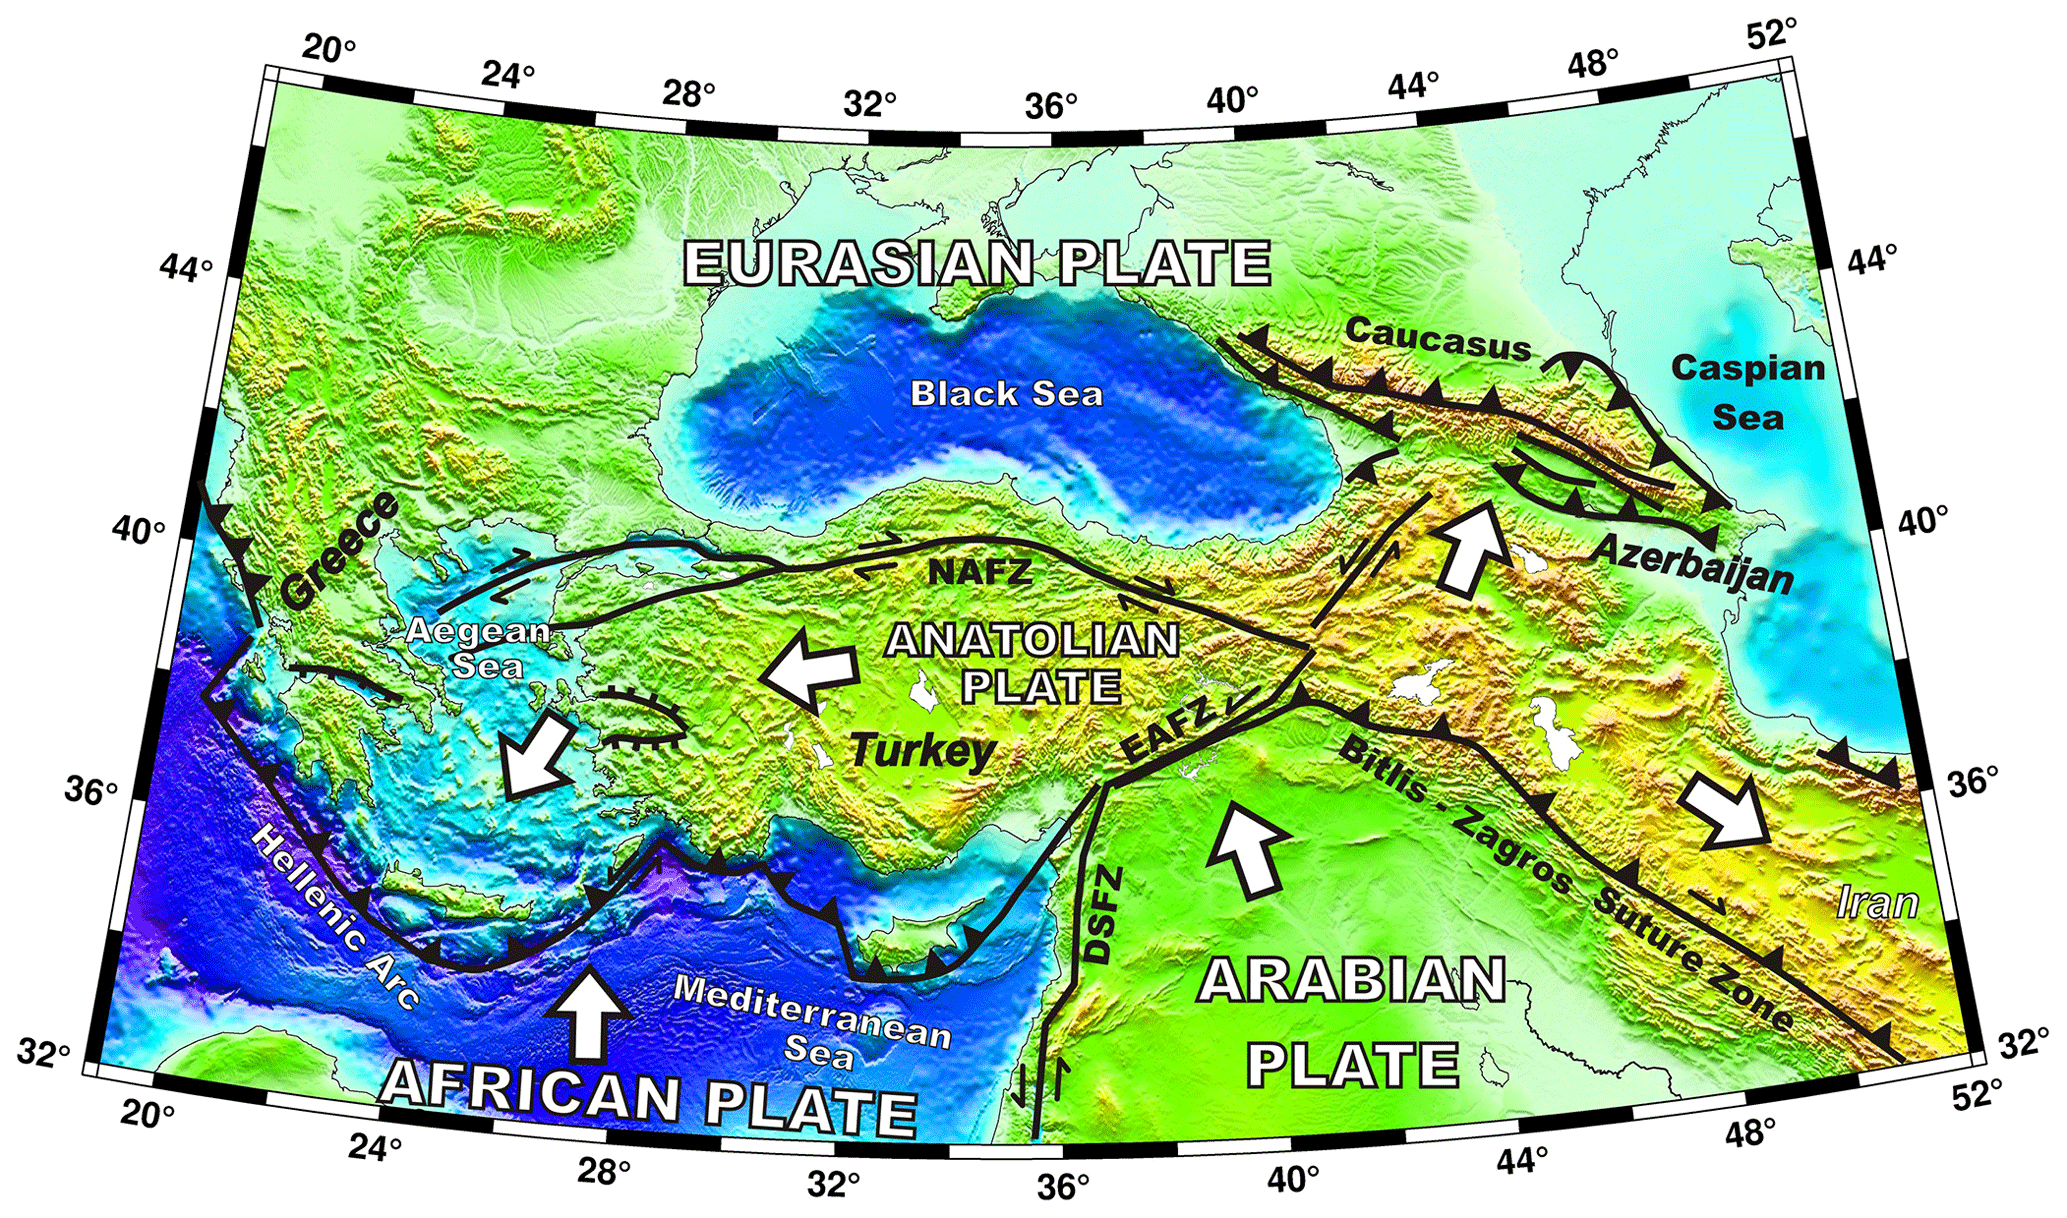
Figure 1Simplified tectonic map of the eastern Mediterranean. DSFZ: Dead Sea Fault Zone; EAFZ: East Anatolian Fault Zone; and NAFZ: North Anatolian Fault Zone. Triangles indicate the direction of vergence or subduction. Bars are the down-thrown side of normal faults. White arrows are relative plate motions. The relief model is generated with the ETOPO1 model (Amante and Eakins, 2009).
There are several unknowns in magnitude calculations by institutions due to the equations coefficients, seismic network structures, human-made mistakes, etc. Both amplitude and distance coefficients in the magnitude equations are the major items. Although the coefficients must be specific for a region because of seismic wave attenuation in the crust and mantle, the calculated values for the Californian earthquakes (i.e. for local magnitude by Richter, 1935; Hutton and Boore, 1987) are widely used. On the other hand, magnitudes, except md, are calculated using the waveform amplitudes at each station for an event. Different amplitudes are observed for an event because of the source radiation pattern. Generally, the average magnitude for all stations is calculated to minimize the effect of the radiation pattern. The median is also preferred to exclude the magnitude outliers (Havskov and Ottemöller, 2010). Consequently, the average magnitude is closely related to several factors such as the number of stations, the standard deviation of the average, amplification or attenuation due to the geological structure beneath the station, and the radiation pattern that depends on the azimuthal distribution of stations. Therefore, institutions may report different magnitudes for an event.
Table 1Symbols for different magnitude scales in the priority order of magnitude saturation.
Another issue picked out in this study is the reported moment magnitudes (Mw) in the catalogues. Mw is determined using waveform modelling for events (Mw≥3.5–4.0) with a high signal-to-noise ratio. However, a few institutes report Mw for small events to the international catalogues (Mw<3.0, i.e. 25 January 1999 at 13:06 UTC Mw=1.8 by Cyprus Geological Survey Department; 29 May 2014 at 01:14 UTC Mw=1.8 by the Earthquake Research Center, Ataturk University, Turkey). These small moment magnitudes are obviously determined by using an empirical relationship without using waveform data. As a result, there is more than one reported magnitude value for an event with known and unknown calculation errors. One common magnitude scale should be used to standardize analyses in the studies based on the parametric data such as hazard mitigation. Therefore, a homogenized catalogue with a unified magnitude scale becomes essential. In the last two decades, the studies on unifying earthquake magnitudes and generating improved catalogues have been carried out for different regions on the Earth (i.e. Grünthal et al., 2009; Chang et al., 2016; Manchuel et al., 2018; Rovida et al., 2020).
This study focuses on earthquakes in Turkey. The region is one of the most geodynamically active areas because of the deformation among the Eurasian, African, and Arabian plates (Fig. 1). Both the Arabia–Eurasia continental collision and the subduction of the African Plate beneath Eurasia started in the early and middle Miocene (11–23 Ma). The interactions of the three plates are the major driving forces for the tectonics of the region. The plate motions result in thrust faulting in eastern Anatolia, Caucasus, and Iran, normal faulting in western Turkey and Greece, and transform faults due to escaping to the west and east (see Bozkurt, 2001, for a brief synthesis). The complexity of the eastern Mediterranean tectonics causes high earthquake activity with different faulting mechanism and a wide range of focal depths. Western Anatolia is the most seismically active part of Turkey. Both the north–south extension in the Aegean and the westward motion of the Anatolian Plate along the North Anatolian Fault Zone (NAFZ) cause a dense deformation with small to moderate earthquakes in western Turkey. The NAFZ and East Anatolian Fault Zone (EAFZ) are also the primary seismic sources that generate destructive earthquakes (Mw≥6).
The destructive earthquakes in Turkey and the surrounding countries through the centuries are found in the historical records. Pınar and Lahn (1952), Ergin et al. (1967, 1971), Soysal et al. (1981), Güçlü et al. (1986), Ambraseys and Finkel (1995), and Ambraseys and Jackson (1998) compile the historical earthquakes in the region. Tan et al. (2008) present the historical events in a digital database and the first focal mechanism catalogue of Turkish earthquakes. On the other hand, Leptokaropoulos et al. (2013) and Kadirlioğlu et al. (2018) introduce homogenized catalogues. The main component of homogenization is to obtain reliable magnitude conversion from one scale to moment magnitude. Several empirical relations are also proposed for the region (Papazachos et al., 1997; Ambraseys, 2000; Baba et al., 2000; Papazachos and Papazachou, 2003; Burton et al., 2004; Ulusay et al., 2004; Scordilis, 2006; Akkar et al., 2010; Deniz and Yücemen, 2010; Makropoulos et al., 2012).
The motivation of this study is to build a widely usable earthquake catalogue (i.e. for geophysicists, geologists, earthquake engineers) that contains homogenized moment magnitudes and the other seismological parameters. During the international seismic hazard studies of the Sinop Nuclear Power Plant planned in northernmost Turkey, it is clearly understood that a comprehensive homogenized earthquake catalogue for Turkey is needed for future studies. For this aim, the earthquakes in Turkey are statistically analysed, and the empirical magnitude relation equations are obtained using a refined dataset. Then, an extensive homogenized earthquake catalogue is constructed. The distinguishing feature of the new homogenized catalogue is that it contains all earthquakes in a manageable format without removing aftershocks and truncating small events.
The Bulletin of the International Seismological Centre (ISC, 2020) is used as the main database to generate a new and comprehensive homogeneous earthquake catalogue for Turkey. The ISC Bulletin contains a large amount of parametric data for any event that occurred anywhere on the Earth. Because national and international seismological centres contribute to the bulletin, it contains not only moderate-to-large events (M≥4) but also local earthquakes with small magnitudes (M<4). The most important feature of the bulletin is that an event with sufficient data is manually checked and relocated by a seismologist. Therefore, the latest earthquake information in the database is 2 years behind real time (ISC, 2020). The bulletin also presents the event parameters reported by the contributing centres. The ISC finished rebuilding the entire database in 2020 by utilizing a new location algorithm (Bondár and Storchak, 2011) with the ak135 seismic velocity model (Kennett et al., 1995). Furthermore, previously unavailable hypocentre and station phase readings from the permanent and temporary networks are added to the rebuilt bulletin (ISC, 2020; Storchak et al., 2017). Therefore, the latest and revised international dataset is used in this study.
The earthquake parameters in the bulletin are in the IASPEI Seismic Format (ISF, 2020). Each event has its own data block that contains several data types and comments such as origin and magnitude. Data and comment lines have no specific flag to identify their types, and it is not possible to read the database using a simple computer programme or shell scripts. A Fortran code is written to analyse the ISF lines using the parsing subroutines provided by the ISC. The different parsers check each line in the database to identify the data type. After determining the origin and magnitude sub-blocks of an event properly, the parameters are analysed. The overall data processing is given in the flowchart in Fig. 2. Because the bulletin may contain multiple hypocentres from multiple agencies for an event, the ISC considers that one of them is primary and assigns the PRIME flag to it. A hypocentre determined by the ISC always has the PRIME flag. In this study, the event origin parameters such as time, location, and focal depth with the PRIME flag are searched in the first step. If there is no PRIME flag, the origin data are searched in the secondary hypocentres using the institute priority order given in the flowchart. The parameters reported by the ISC are preferred first. If there is no information from the ISC, the availability of the hypocentre parameters from the European-Mediterranean Seismological Centre (CSEM or EMSC) is searched (see Appendix A for the institute abbreviations). The priority of both institutes is high because they use all available data in the study area. In turn, the hypocentre parameters of the two Turkish seismological networks are searched (ISK: Kandilli Observatory and Earthquake Research Institute, KOERI; DDA: General Directorate of Disaster Affairs until September 2017 and Disaster and Emergency Management Presidency, AFAD, after October 2017). The local institutes are preferred for the events that occurred in the neighbouring countries. Moreover, the earthquake information reported by the International Seismological Summary (ISS) and Gutenberg and Richter (GUTE) is used for the period of 1900–1964. If the event origin parameters are found in any step of the query order, this event is added to the homogenized catalogue with these parameters.
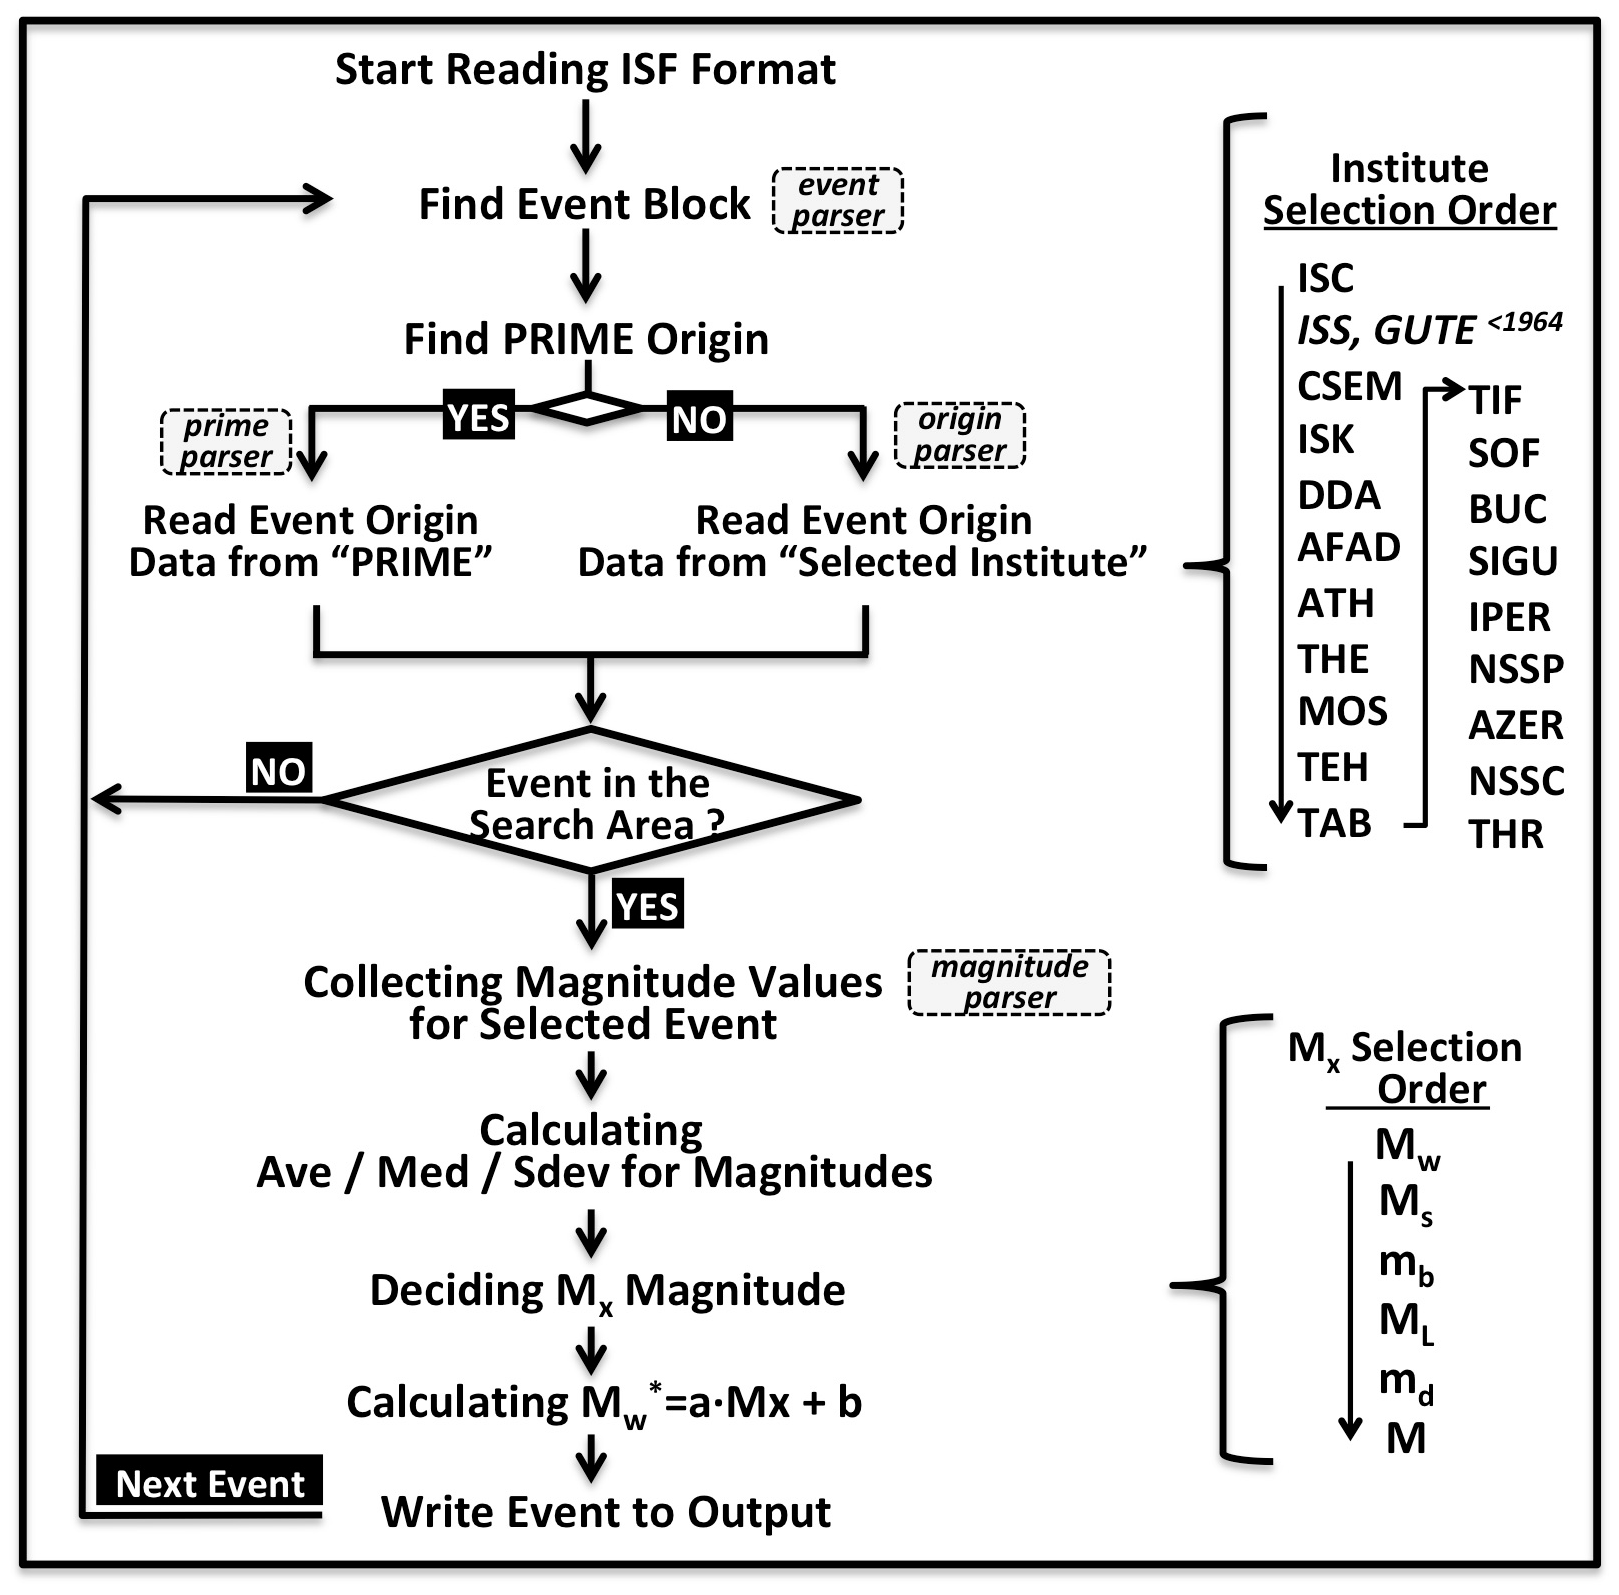
Figure 2Flowchart of the ISC database processing. Ave: average (mean); med: median; and Sdev: standard deviation. is equivalent moment magnitude. See Appendix A for the institute codes.

Figure 3The earthquakes in the homogenized catalogue (dots). Yellow circles are the events with an equivalent moment magnitude () greater than 6.0 (total 145 events).
After determining the event origin parameters in the selected area, the magnitude data sub-block is analysed by the magnitude parser. The reported values of different magnitude scales given in Table 1 are collected. If there are two or more values for a magnitude scale, the arithmetic mean and median of all reported values are calculated. Selecting a magnitude value from a particular institute such as KOERI, Harvard, and EMSC is not preferred to overcome the problems such as unreported magnitude, the effect of network distribution, and calculation errors.
More than 8.3 million events in the ISC monthly datasets are analysed for the final catalogue. The study area is bounded by 35–44∘ N and 25–46∘ E (Fig. 3). The final catalogue contains 377 429 events that occurred in the period from 1900 to October 2018. The modern instrumental period (1964–present) data are used for all statistical analyses. The number of events (1964–2018) reported with local magnitude (ML) is 227 726 (60 % of the total), and it is the highest rate concerning the other magnitudes types (Fig. 4, Table 2). About 39 % of the events have duration magnitudes (md). Because both magnitude types are widely determined by the national institutions, especially for the local events, they are dominant in the catalogue. The body (mb) and surface wave (Ms) magnitudes are reported for only 3.0 % and 1.4 % of the total events in the region, respectively. Though moment magnitude (Mw) is the most preferred magnitude scale for seismic hazard studies, only 0.9 % of all events have Mw because waveform analyses are not an easy and routine process. On the other hand, the final catalogue contains 18 859 (5 %) events with no specified magnitude types (M). The magnitude M is mostly reported until 1990, and the number of events with M dramatically decreases after this year. Approximately 2 % of the annual activity is reported without a magnitude value in the study area. These events are excluded from the final homogenized catalogue.
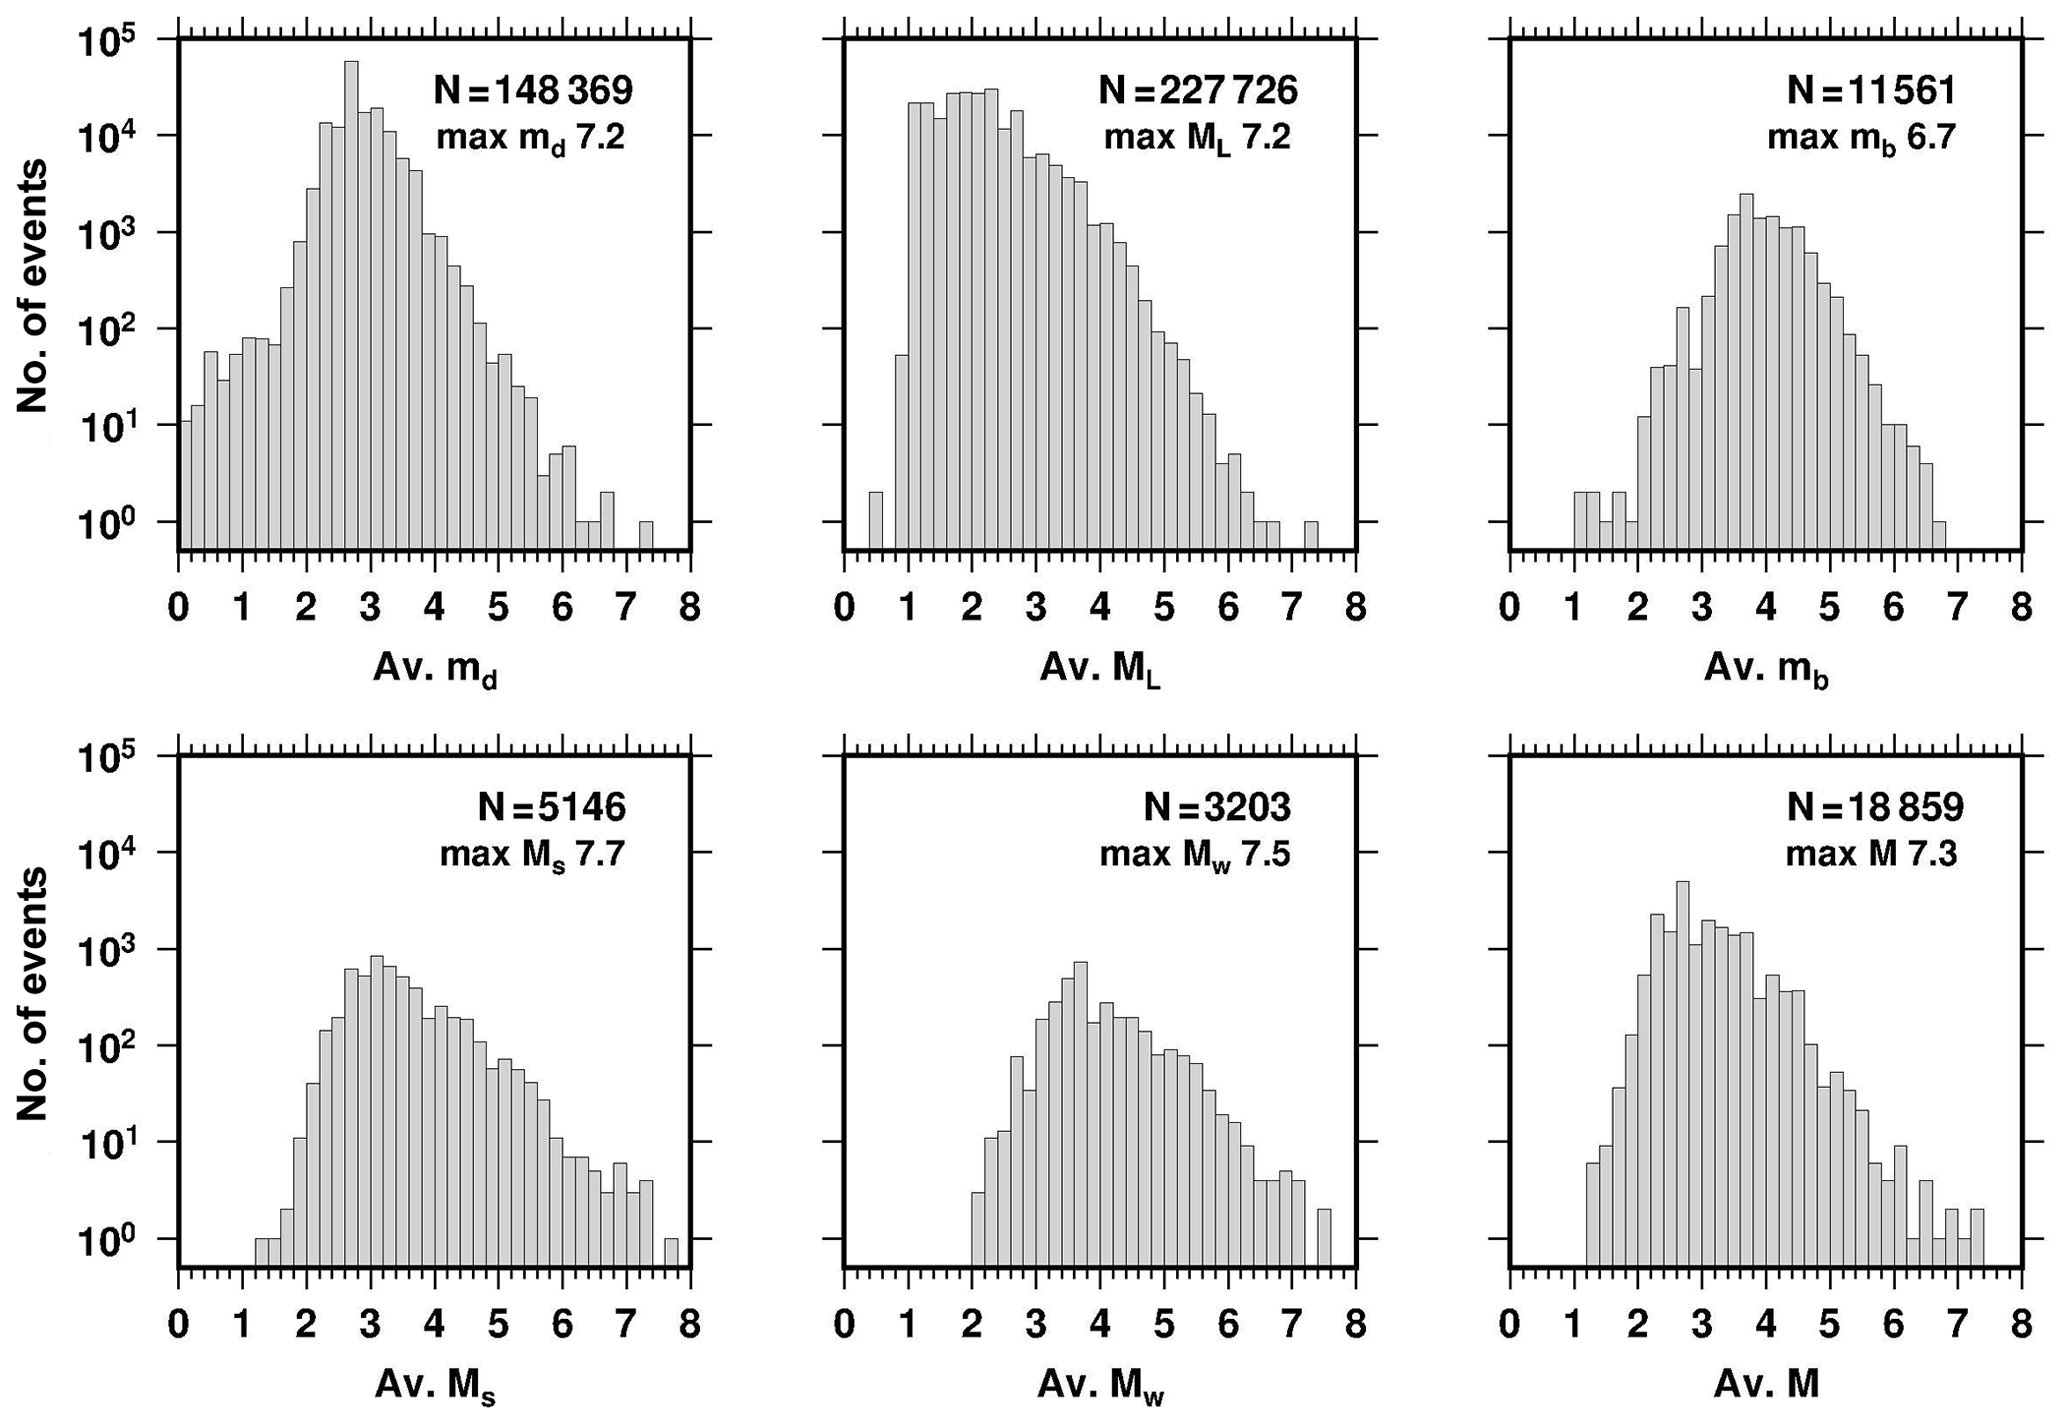
Figure 4The number of events in the final catalogue for each average magnitude (1964–2018). N is the total number of events for each magnitude.
Table 2(a) Number of magnitudes with zero and non-zero values between 1964 and 2018 in the catalogue. (b) The number of magnitude pairs with non-zero values.

3.1 Refining the dataset
The dataset is refined in detail for regression analyses to obtain the empirical relations between the magnitude scales. In the first step, the catalogue is declustered using the second-order moment approximation of Reasenberg (1985) because removing aftershocks is necessary to determine reliable magnitude completeness. For aftershock analysis in space, a subsequent event is searched for in an area with a radius 20 times that of the circular source dimension of the preceding event considering ±4 km hypocentre uncertainties (Kanamori and Anderson, 1975; Reasenberg, 1985). The maximum interaction period for the next event in a sequence is 10 d to build a temporal cluster extension. After declustering, the earthquakes that occurred after 1980 are selected for the subsequent analyses because the Turkish national station networks and data processing become much more reliable (i.e. Mignan and Chouliaras, 2014; Canbaz et al., 2019). In the third step, completeness (Mc) for each magnitude is determined. It is found that Mc is ∼2.8 for md and ML, whereas it is ∼4.0 for mb and Ms. The events with an average magnitude smaller than the Mc thresholds of each magnitude scale are excluded from the regression. Using a threshold also helps eliminate possible blasts (M<2.0–2.5) before the regression. In the last step, a cut-off value is applied for large differences between magnitude pairs. There are, naturally, differences among the reported magnitudes for an earthquake. Occasionally, the difference between the magnitude pairs may be as large as 2 or more magnitude units. After obtaining the difference scattering for each pair, the data points that are out of the 95 % confidence interval (±2σ) are removed by using the interquartile range (IQR) method (Galton, 1869; MacAlister, 1879). The IQR is one of the robust methods for outliers and can be successfully applied to seismological data (i.e. Tan et al., 2010, 2014; Tan, 2013). The cut-off values are determined as 0.85 (md−Mw), 0.67 (ML−Mw), 0.57 (mb−Mw), 1.1 (Ms−Mw), and 0.9 (M−Mw). These cut-offs overcome the scattering of the pairs. After refining the magnitude pairs in the four steps, the number of data points used in regression is 978, 1664, 685, 351, and 38 for md−Mw, ML−Mw, mb−Mw, Ms−Mw and M−Mw, respectively (Fig. 5).
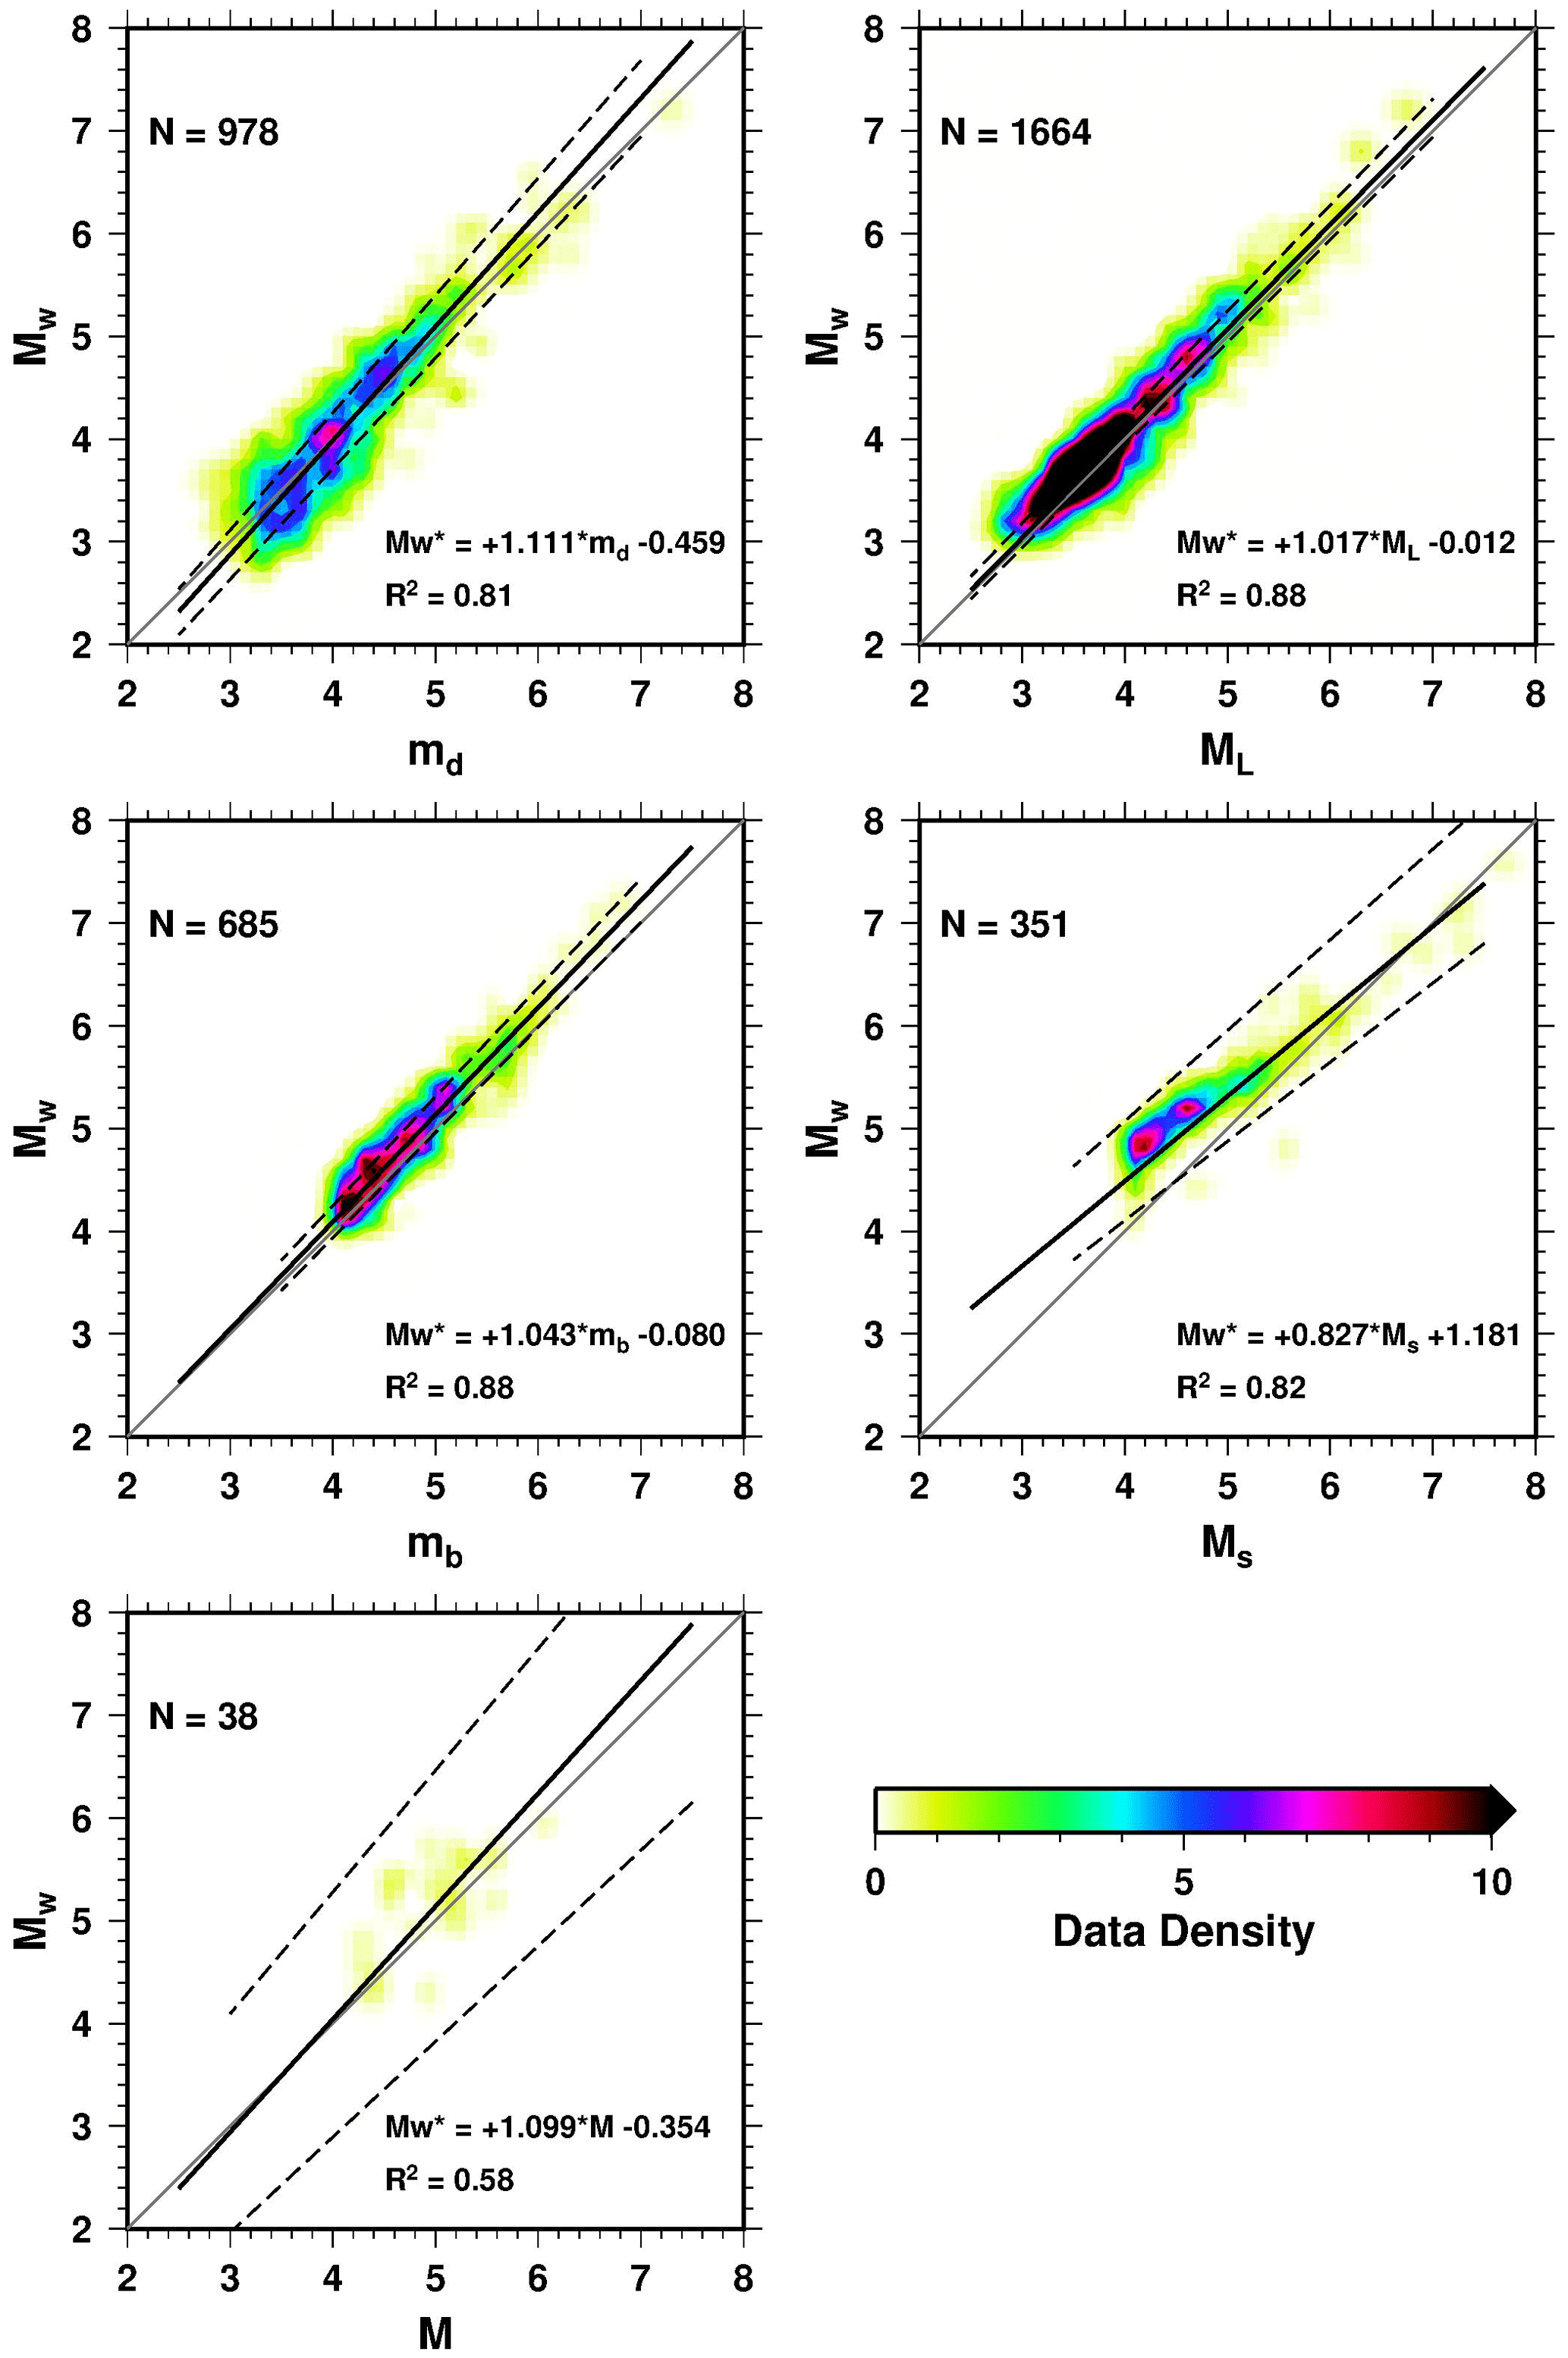
Figure 5Magnitude relations between Mw and the other scales. The data density in 0.1 magnitude intervals is shown with coloured counters. N is the total number of magnitude pairs. The solid line is the best linear fit of the orthogonal regression, whereas the dashed lines show the 95 % confidence interval after bootstrapping. Grey line indicates the y=x relation.
Table 3Equivalent moment magnitude () relations for different magnitude scales.

3.2 Regression analyses
The relationships of the refined magnitude pairs are estimated using the general orthogonal regression (GOR). The method is a better estimator than the least-square (LS) approximation when both x and y variables have non-negligible size errors (Castellaro et al., 2006). The slope (a) and intercept (b) values of the GOR line in the form of are given by
where , , and are the covariance of X (independent variable), Y (dependent variable), and between X and Y, respectively (i.e. Castellaro et al., 2006; Das et al., 2014). and are the average values of the variables, and η is the error variance ratio of the variables (σεX, σεY) and is defined as . When the standard errors of the variables are not known, η is arbitrarily set to a value. In practice, η=1 (squared Euclidean distance) gives good results (Castellaro et al., 2006; Das et al., 2014). In this study, η is tested for the values from 0.5 to 2.0 to seek a better fit. The R2 values do not increase when η is assigned a different value than 1.0, and a significant improvement is not observed in the regressions. Moreover, the real errors of the magnitudes are not known; η=1 is used. The squared Euclidean distance gives better results for all magnitude scales. The 95 % confidence intervals of the best-fit regression are determined with the bootstrap method (Efron, 1979). A total of 1000 new regressions are calculated using 50 % of the total amount of data of each relation. The bootstrap samples are randomly selected using the Mersenne Twister random number generator (Matsumoto and Nishimura, 1998). The random numbers are unique in each test to prevent multiple selections of any datum. After obtaining a large set for the constants a and b of the linear fits, the outliers are removed utilizing the IQR method. Then, the standard deviation (σ) of the normally distributed dataset is calculated.
The GOR results are given in Table 3 and Fig. 5. Because the number of magnitude pairs is high for each relation, the data are shown with coloured density contours in 0.1 magnitude-unit grids. It is clear that all relations are linear and that the minimum misfit regression lines are in good agreement with the data distribution. The number of pairs is generally dense between magnitude values of 3.0 and 5.0 and decrease for larger magnitudes. In general, the slopes of the regression lines are close to 1, and the intercept values are negative except for Ms magnitude. The relation between md and Mw indicates that both magnitude scales are equal at md=4, and the difference increases up to 0.4 magnitude units at larger values. ML values are dense between 3 and 5, and the linear fitting line extends close to the y=x line. The difference between local and moment magnitudes is about 0.25 at ML=7.0. The conversion equation of md−Mw is similar to that of ML−Mw. The most considerable difference between the two different magnitude scales is observed for surface and moment magnitudes. Ms is always smaller than Mw, and the difference is about 0.6 at Ms=4.0. Both scales are equal at Ms=7.5. The magnitude M (the real type is not known) is mostly reported in the past. There are 27 events with M≥5.0 before 1964 in the study area. Therefore, an M−Mw conversion is necessary for seismic hazard analyses using long-term seismicity data. There are few magnitude pairs (N=38), and they are distributed sparsely between 4.0 and 6.5 with a high standard deviation (Fig. 5).
3.3 Homogenization
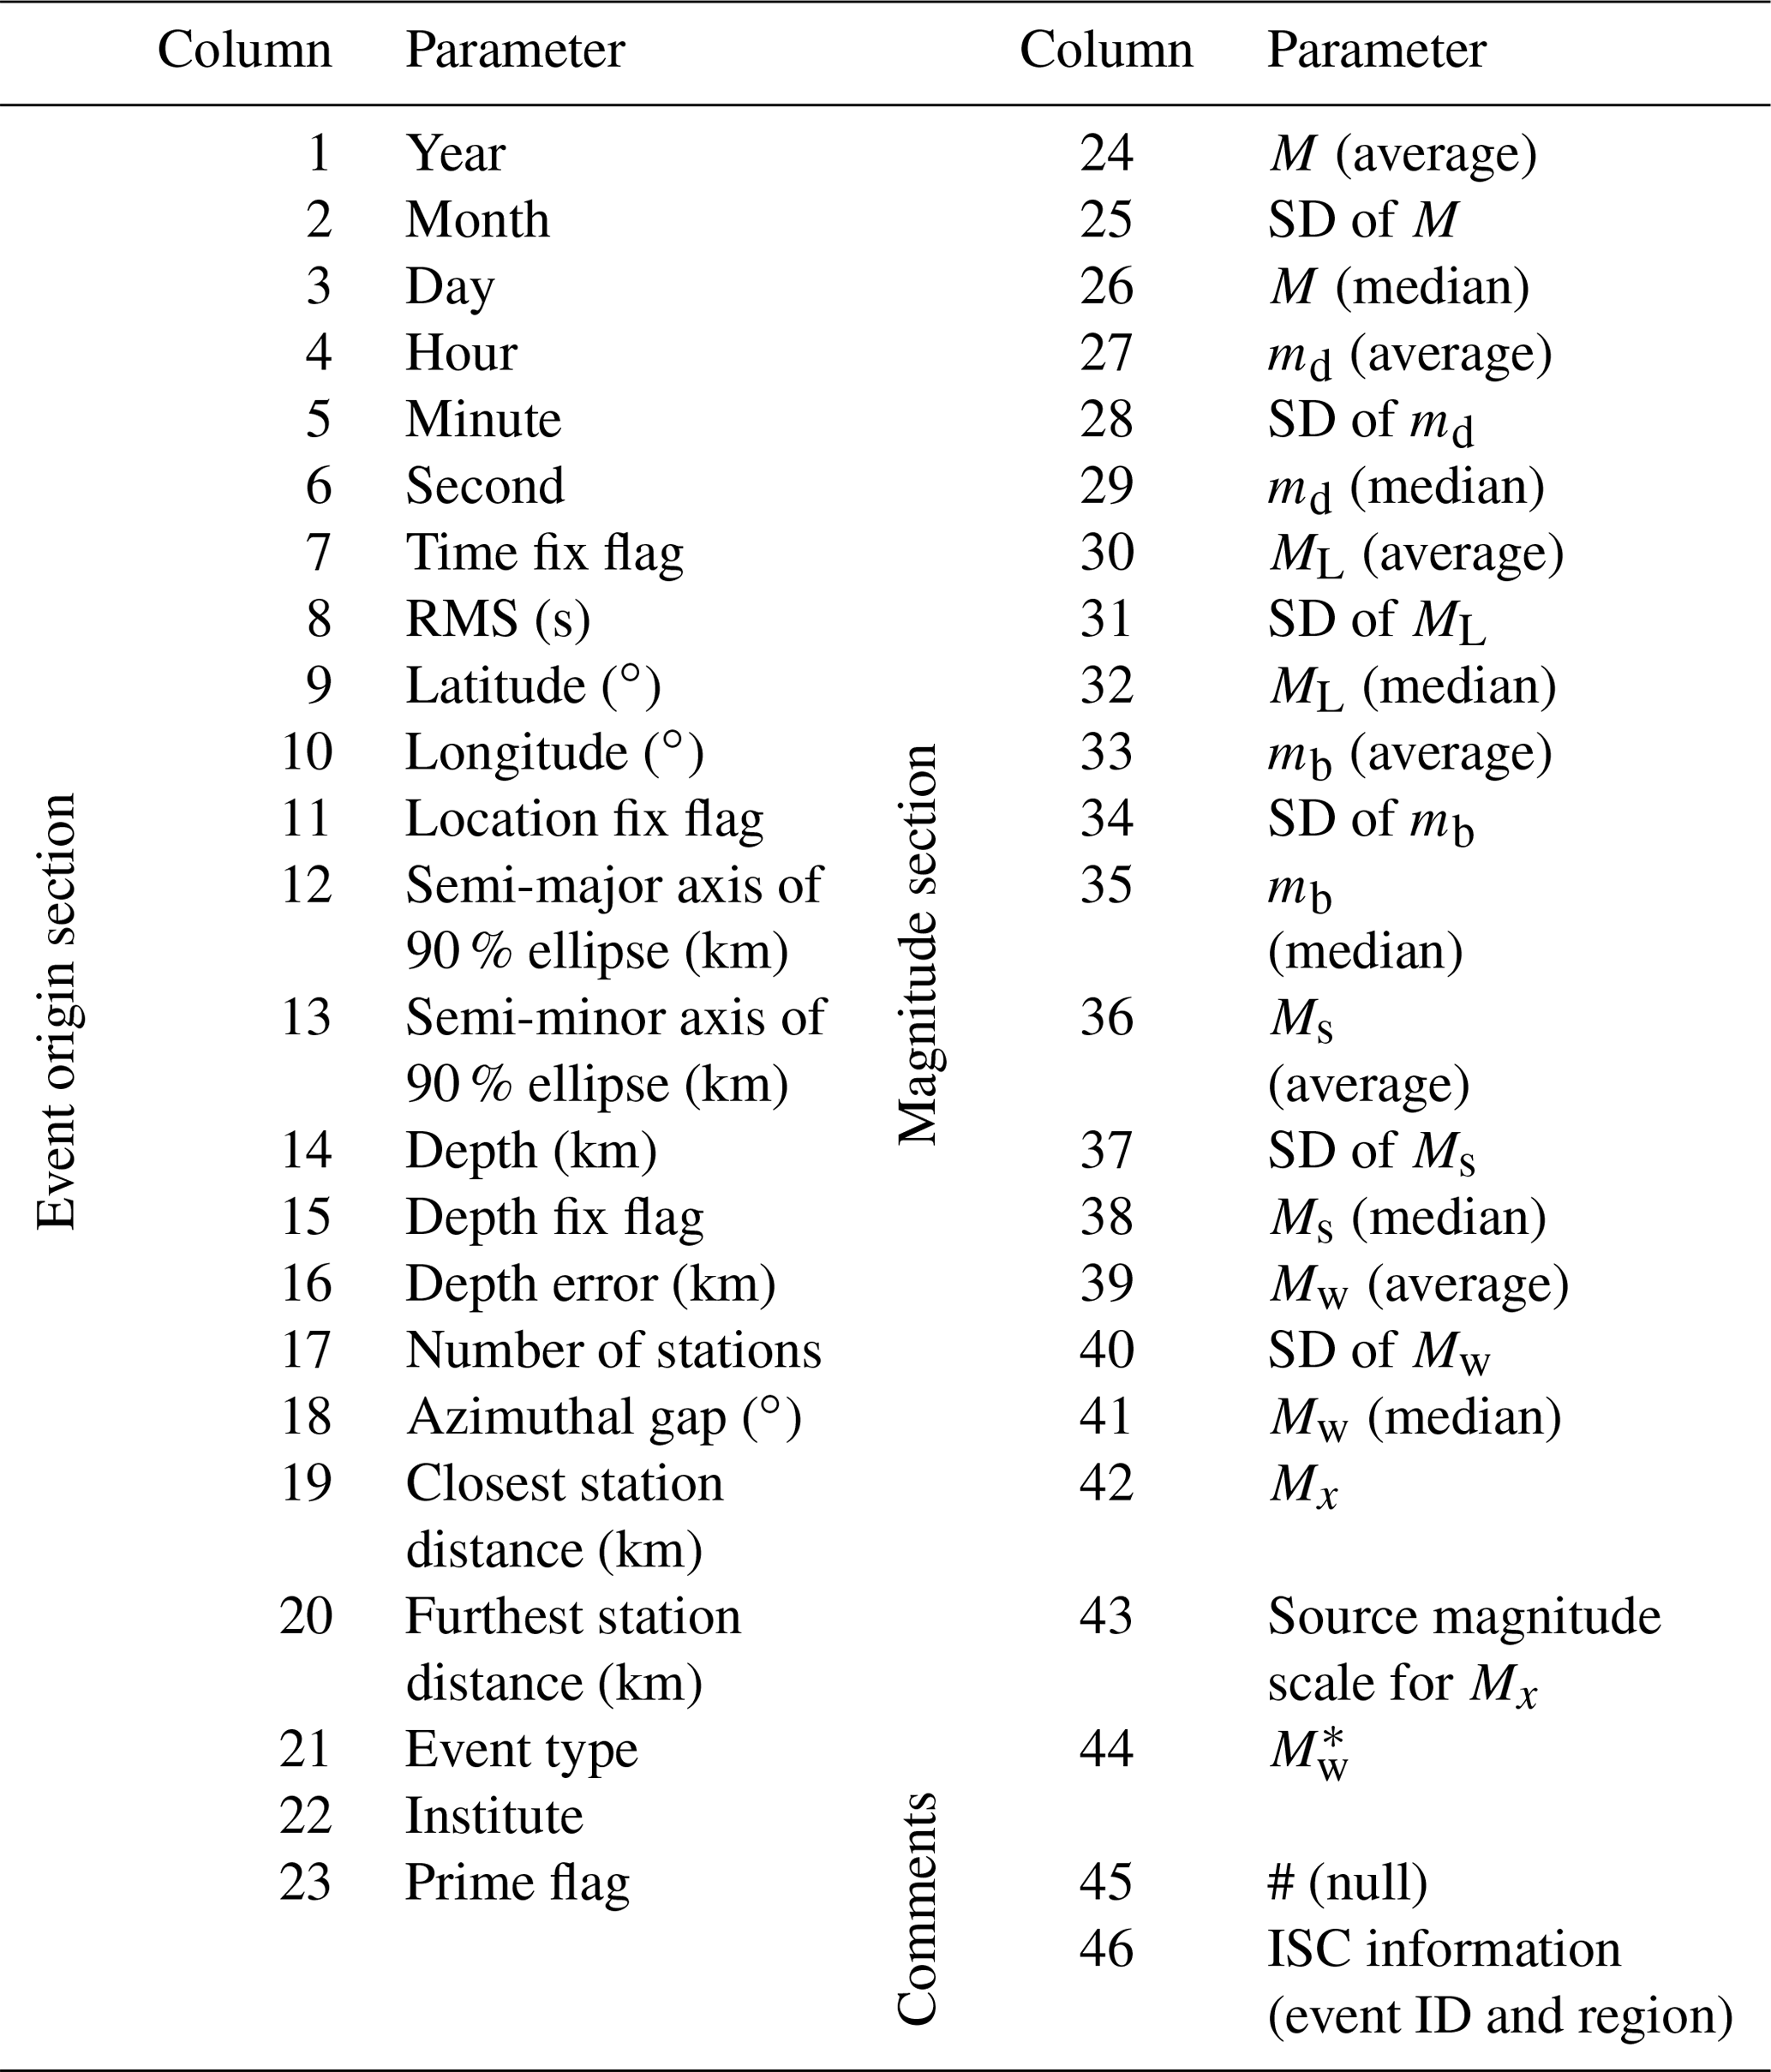
The GOR results are implemented in all events in the study area. First, Mw is searched and assigned as if found. For the events without an observed Mw, the first average magnitude with a non-zero value is chosen according to the priority of saturation order in Table 1. For example, if an event has only average Ms and ML values, Ms is selected for calculation. The chosen magnitude is also named Mx and is used to calculate the equivalent moment magnitude () with the relevant equation. After applying homogenization equations to all earthquakes, the catalogue is presented with a total of 45 parameters described in Appendix B. The catalogue has three sections: “Event Origin Section”, “Magnitude Section”, and “Comments”. There are 23 parameters in the origin section. The origin time, coordinates, and depths with their uncertainties are given. If one of these parameters is fixed, it is marked with the “f” flag. The magnitude section contains the average with standard deviation and median for the six magnitude scales. The selected Mx value, its source magnitude scale, and the calculated equivalent moment magnitude () are presented. The ISC event ID number and the epicentre region are given in the comment section as a reference.
In the homogenized catalogue, 57 % of the event origin parameters are flagged as PRIME by the ISC. The ISC and EMSC (CSEM) origin parameters are generally reported with the prime flag (∼90 %–98 %). On the other hand, approximately half of the reported parameters (∼60 %–65 %) by the national institutes in Turkey (KOERI, AFAD/DAD) and Greece (ATH) have the flag. The catalogue contains the event origin information from the national sources (Fig. 6a) in a high percentage. The distribution of the magnitude scales for the equivalent magnitude calculation is given in Fig. 6b. The vast majority of are obtained from ML and md; the contribution of the other magnitude scales is small.
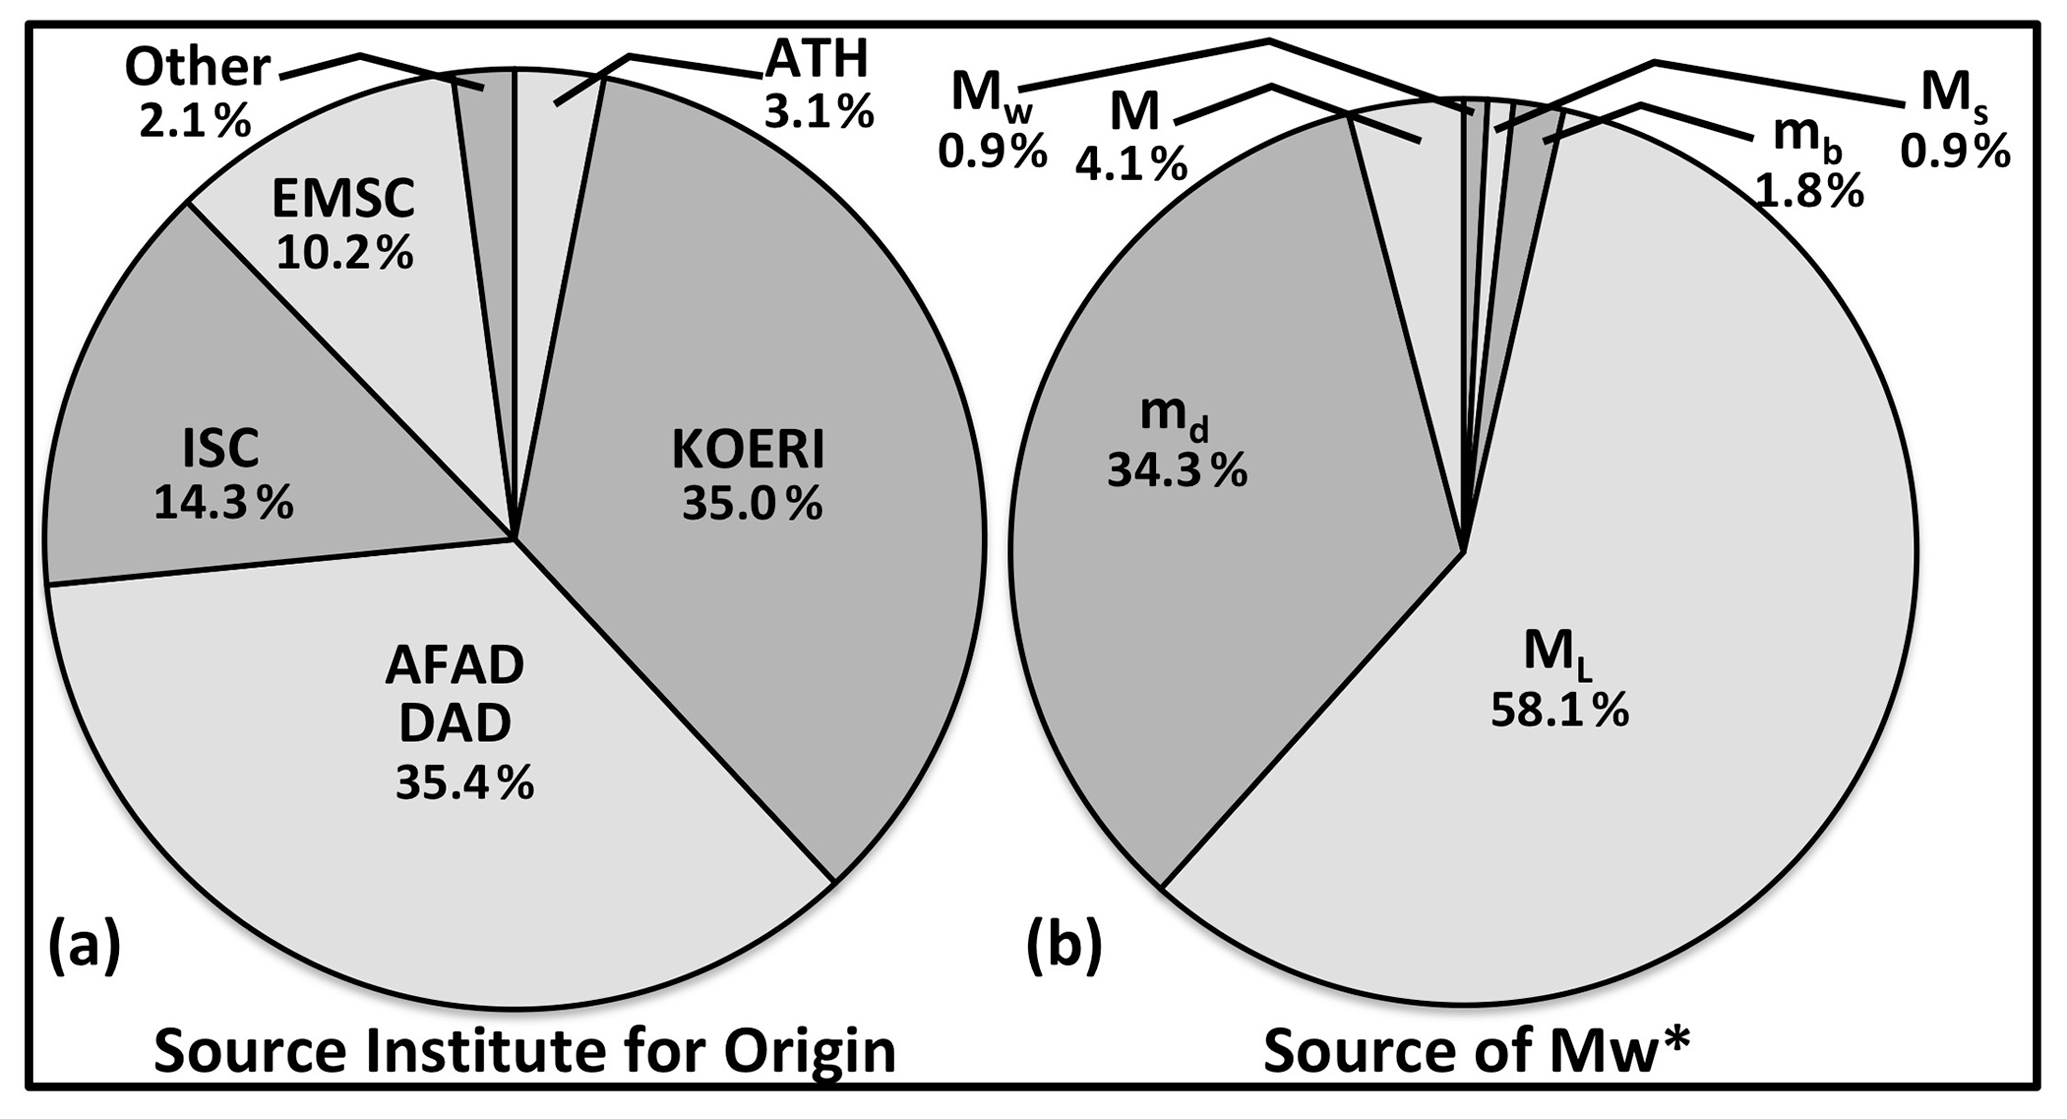
Figure 6Distribution of the parameters in the homogenized catalogue. (a) Source institutes for the origin parameters. (b) Percentage of the magnitude scales used for calculation.
3.4 Completeness of the catalogue
One of the important parameters of an earthquake catalogue is the magnitude of completeness (Mc). Mc is a threshold magnitude and indicates that all earthquakes with magnitudes greater than Mc are recorded in a study area. It is determined using cumulative frequency–magnitude law (GR) of Gutenberg and Richter (1954). The GR relation is simple but powerful and formulated as , where N is the cumulative number of events with magnitudes equal to or greater than m. The other useful parameter derived from this equation is the b value (slope). The b value is around 1 for the tectonically active areas.
The modern instrumental period (1964–present) observations for the region show a linear relation with b=0.96 between the cumulative number of earthquakes and equivalent moment magnitude, (Fig. 7). If the dataset is extended to cover the period from 1900 to 1964, the linearity of the GR relation for the magnitudes between 5 and 7 disappears due to the magnitude calculation uncertainties and lack of small events in the catalogues for that time span. The Mc, the lowest intercept point of the linear fit with the slope b, is 2.7 for all earthquakes between 1964 and 2018.

Figure 7The Gutenberg–Righter frequency–magnitude distribution for the homogenized catalogue. Light and dark grey circles represent the cumulative number of earthquakes in the periods 1900–2018 and 1964–2018, respectively. The b value and magnitude completeness (Mc) for the period of 1964–2018 are 0.96 and 2.7, respectively.
The maximum curvature method (Wyss et al., 1999; Wiemer, 2001) is applied to investigate the spatial and temporal change in Mc for the modern instrumental period. Equal horizontal sampling in latitude and longitude degrees is not used to prevent artificial elongation because the length of 1∘ of longitude is ∼94 and ∼76 km in the south and north of the study area, respectively. I use 20 km grid spacing and at least 100 events in a 100 km radius for the spatial distribution of Mc. On the other hand, the temporal variation is estimated using a window with 200 events and a moving step of 40 events. These sampling parameters are sufficient to avoid erroneous statistical results for the b value and Mc due to under-sampling and non-homogenous subsets (Amorese et al., 2010; Kagan, 1999, 2002, 2010; Kamer and Hiemer, 2013; Shi and Bolt, 1982). The contour map in Fig. 8 shows that the homogenized catalogue is complete down to –2.7 in Turkey. The white areas have deficient seismic activity (see Fig. 2), and there are not sufficient data to ensure the criteria. The variation of Mc throughout the years indicates that the standard deviation band is narrow after the 1990s. The Mc has been stable at about 2.6 since 2007 because the number of seismological stations increases after the devastating earthquakes (Mw>7) in 1999.
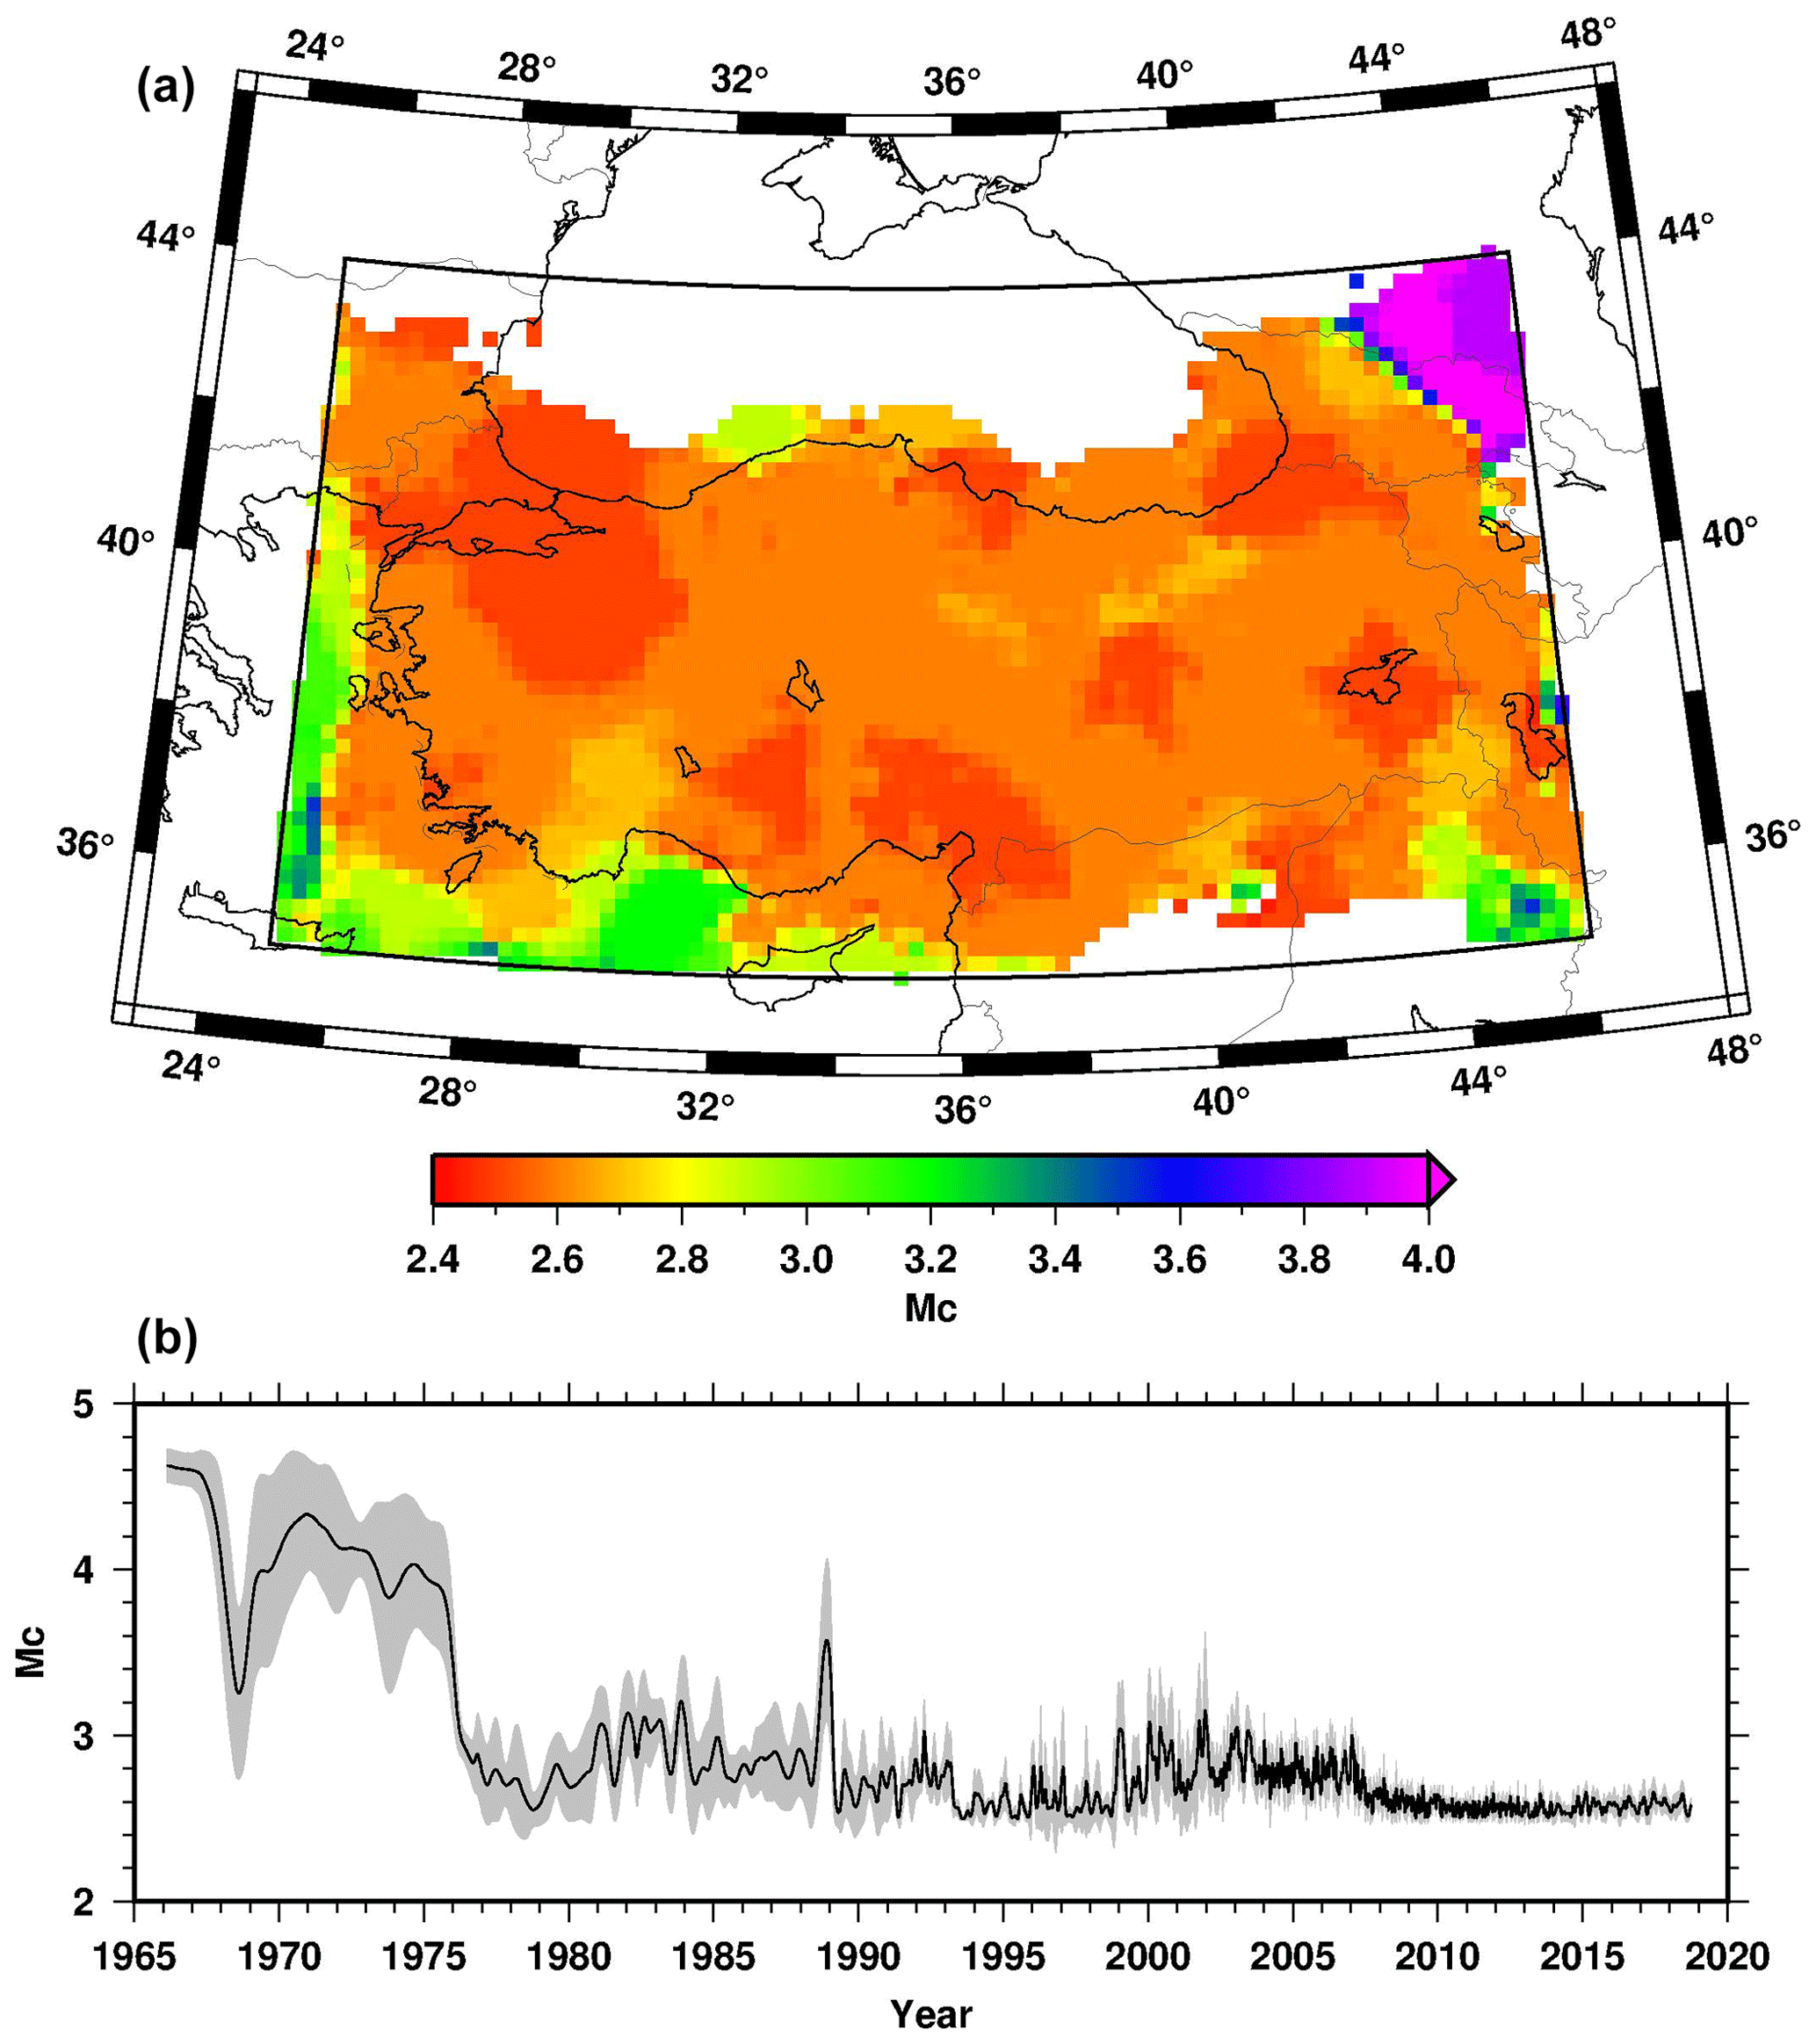
Figure 8(a) Mc spatial distribution map for the events since 1964. There are no data in white areas. (b) Temporal Mc variation as a function of year. Grey area is the ±σ interval estimated by bootstrapping.
Generating an earthquake catalogue is one of the main study areas for seismologists. An institution that operates a costly seismological network provides the primary parametric information of an event from raw waveform observations. Although accessing catalogues is very easy via the internet in recent decades, it is difficult to obtain all available data due to some limitations of the data providers' web pages. The problems of online datasets, such as absent or limited observations for the past years, a limited number of parameters, lack of parameter uncertainties, listing limitations, and useless formats in web pages, make it difficult to handle the earthquake data for an extensive range of users. However, most of the researchers only pay attention to the homogenized magnitudes and the number of events. Unfortunately, the importance of providing more parameters and their uncertainties in the previous catalogues are missed. For example, the SSG-9 (item #3.27i) safety document of the International Atomic Energy Agency for nuclear power plants requires the uncertainties of all earthquake parameters. Therefore, the previously given datasets are less useful, especially for seismic hazard analyses.
The earthquake information for Turkey comes from two national networks operated by the KOERI and AFAD. Both institutes have a large number of stations around Turkey (∼1240) and report recent events online. The date, time, depth, and magnitudes without uncertainties can be obtained by using web search engines. While the KOERI lists only 50 000 events in a single search with a downloadable text file, the AFAD's search result is given with a maximum of 100 events at each window, and it can be downloaded in the comma-separated CSV file format. The other online catalogue with the same parameters is provided by the EMSC. The searched events can be downloaded in CSV format with the limitations of 5000 lines. Among the three institutions, only the KOERI provides all available magnitude scales for an event. Additionally, the EMSC does not provide the type of magnitude scale for an event. In contrast, the ISC provides all available parameters for an event determined not only by itself but also by the other institutions, as mentioned in the previous chapter. The magnitudes in the ISC event list are given in separate lines, so it is not easy to use without knowledge of the comprehensive bulletin format and programming. The online bulletin search of the ISC also has an output limitation of 60 000 events.
Besides the online catalogues, some catalogue compilations based on magnitude homogenization for Turkey and its vicinity are published. Leptokaropoulos et al. (2013) statistically analyse the earthquakes in western Turkey (1964–2010) and construct a catalogue with an equivalent moment magnitude. They obtain conversion equations for different magnitude scales reported by different institutions. The catalogue contains 9875 events with only the parameters of date, time, coordinates, and focal depth. Kadirioğlu et al. (2018) present another homogenized catalogue for Turkey containing ∼6573 events between 1900 and 2012 by utilizing the same dataset and conversion equations presented in the previous studies (Kadirioğlu et al., 2014; Kadirioğlu and Kartal, 2016). Their final catalogue is declustered and contains events only with . On the other hand, Kadirioğlu et al. (2014, 2018) mention that a focal depth of 10 km is assigned to the events without a reported depth or that are shallower than 1 km in the final catalogue. This assignment is arbitrary and unrecoverable. It may generate artificial errors in future studies using this catalogue, especially in seismic hazard analyses.
Burton et al. (2004) generate a homogenized catalogue that contains both reported and equivalent magnitudes for earthquakes in Greece and western Turkey using the previous conversion equations. There are ∼5200 events without Mc analysis. The catalogue by Bayliss and Burton (2007) contains ∼3680 homogenized events in Bulgaria and the surrounding Balkan region with Mc∼4.0. More recently, Makropoulos et al. (2012) have presented ∼7350 homogenized events for calculated and in the excel format for Greece and western Turkey.
The common structure of the previous catalogues mentioned above and others has limited earthquake parameters, such as date, location, depth, and . Especially, the observed magnitudes and error/uncertainty values are not included. The source institute of the parameters is also missing. Therefore, it is impossible to trace back to the origin of the parameters, and the equivalent moment magnitude () cannot be recalculated using newly determined conversion equations. On the other hand, a truncated final earthquake list using a magnitude threshold is not useful for the researchers who want to analyse or plot all seismic activity in a region. The new homogenized catalogue in this study overcomes the common deficiency of the previous earthquake catalogues for Turkey.
Turkey and the surrounding area is one of the most seismically active regions on the Earth. Therefore, improved earthquake catalogue studies are necessary. A new, comprehensive, and homogenized earthquake catalogue is compiled in this study. The main aim is to present an earthquake database in an easily manageable ASCII format for a wide range of researchers in earth sciences. This study is based on the latest ISC Bulletin rebuilt in 2020. All earthquakes during the period from 1900 to October 2018 in Turkey and its near vicinity are analysed. The origin parameters and magnitude data in the IASPEI Seismic Format are systematically parsed with a Fortran algorithm.
Approximately 378 000 events in the study area bounded by 35–44∘ N and 25–46∘ E are compiled (Fig. 3). The equivalent moment magnitude (), which is the mandatory parameter for the seismic hazard studies, is calculated for all events. For this purposes, new conversion equations for md, ML, mb, Ms, and M are determined using the well-refined magnitude pairs and the general orthogonal regression method that is useful when the two variables have different uncertainties. According to the values of , the overall catalogue is complete down to Mc=2.7. The spatial completeness variation indicates –2.7 in Turkey. One of the advantages of the catalogue is that it is not declustered or truncated using a threshold magnitude so that it is useful for geophysicists, geologists, and geodesists. The values can be easily recalculated, and the catalogue can be declustered by seismologists and earthquake engineers using different parameters. The final dataset contains not only as in the previous studies but also the average with standard deviation and median of the observed magnitudes. The ISC event ID number and geographic region of each event are also given to trace an event in the bulletin. Presenting 45 parameters for all events is the most valuable part of the new homogenized catalogue.
The ISC contributor institutes mentioned in this study are given below. The ISS and GUTE catalogues are used for the events in the period of 1900–1964.
The first and second lines of the homogenized catalogue are the parameter names and column numbers, respectively. The earthquake parameters are given below.
Table B1Parameters in the homogenized catalogue.
Fixing flags: n – not fixed (free), f – fixed. Prime flags: n – not prime location, p – prime location. Event types: de – damaging earthquake, fe – felt earthquake, ke – known earthquake, se – suspected earthquake, uk – unknown. Unreported numerical parameters in the ISC Bulletin are given as “0.00”. Uncalculated standard deviations are given as “−1.00”. Unknown or blank character fields are filled with “–”.
The catalogue can be downloaded from https://doi.org/10.5281/zenodo.5056801 (Tan, 2021).
The supplement related to this article is available online at: https://doi.org/10.5194/nhess-21-2059-2021-supplement.
The author declares that there is no conflict of interest.
Publisher's note: Copernicus Publications remains neutral with regard to jurisdictional claims in published maps and institutional affiliations.
I would like to thank Özlem Karagöz Tan for her support and encouragement for this study. All maps and graphs are plotted using the Generic Mapping Tools (GMT) by Wessel and Smith (1998). I also thank three anonymous referees for careful reviews and constructive comments on the manuscript and the handling editor, Filippos Vallianatos.
This paper was edited by Filippos Vallianatos and reviewed by three anonymous referees.
Akkar, S., Çagnan, Z., Yenier, E., Erdogan, Ö., Sandikkaya, M. A., and Gülkan, P.: The recently compiled Turkish strong motion database: Preliminary investigation for seismological parameters, J. Seismol., 14, 457–479, 2010.
Amante, C. and Eakins, B. W.: ETOPO1 1 Arc-Minute Global Relief Model: Procedures, Data Sources and Analysis, NOAA Technical Memorandum NESDIS NGDC-24, National Geophysical Data Center, NOAA, https://doi.org/10.7289/V5C8276M, 2009.
Ambraseys, N. N. and Finkel, C. F.: The Seismicity of Turkey and Adjacent Areas: A Historical Review, 1500–1800, Muhittin Salih Eren, İstanbul, Turkey, 1995.
Ambraseys, N. N.: Reappraisal of north-Indian earthquakes at the turn of the 20th century, Curr. Sci., 79, 1237–1250, 2000.
Ambraseys, N. N. and Jackson, J. A.: Faulting associated with historical and recent earthquakes in the Eastern Mediterranean region, Geophys. J. Int., 205, 390–406, 1998.
Amorese, D., Grasso, J. R., and Rydelek, P. A.: On varying b-values with depth: results from computer-intensive tests for Southern California, Geophys. J. Int., 180, 347–360, 2010.
Baba, A. B., Papadimitiou, E. E., Papazachos, B. C., Papaioannou, C. A., and Karakostas, B. G.: Unified local magnitude scale for earthquakes of south Balkan area, Pure Appl. Geophys., 157, 765–783, 2000.
Bayliss, T. J. and Burton, P. W.: A new earthquake catalogue for Bulgaria and the conterminous Balkan high hazard region, Nat. Hazards Earth Syst. Sci., 7, 345–359, https://doi.org/10.5194/nhess-7-345-2007, 2007.
Bondár, I. and Storchak, D. A.: Improved location procedures at the International Seismological Centre, Geophys. J. Int., 186, 1220–1244, https://doi.org/10.1111/j.1365-246X.2011.05107.x, 2011.
Bozkurt, E.: Neotectonics of Turkey: A synthesis, Geodinamica Acta, 14, 3–30, https://doi.org/10.1016/S0985-3111(01)01066-X, 2001.
Burton, P. W., Xu, Y., Qin, C., Tselentis, G., and Sokos, E.: A catalogue of seismicity in Greece and the adjacent areas for the twentieth century, Tectonophysics, 390, 117–127, 2004.
Canbaz, M.D., Turhan, F., Yılmazer, M., Kekovalı, K., Necmioğlu, Ö., and Kalafat, D.: An Investigation on the Evaluation of Seismic Network and Catalogue of Regional Earthquake-Tsunami Monitoring Center (RETMC-KOERI), Bull. Earth Sci. Appl. Res. Centre Hacettepe Univers., 40, 110–135, https://doi.org/10.17824/yerbilimleri.500472, 2019.
Castellaro, S., Mulargia, F., and Kagan, Y. Y.: Regression problems for magnitudes, Geophys. J. Int., 165, 913–930, https://doi.org/10.1111/j.1365-246X.2006.02955.x, 2006.
Chang, W., Chen, K., and Tsai, Y.B.: An updated and refined catalog of earthquakes in Taiwan (1900–2014) with homogenized Mw magnitudes, Earth Planet Space, 68, 45, https://doi.org/10.1186/s40623-016-0414-4, 2016.
Das, R., Wason, H. R., and Sharma, M. L.: Unbiased Estimation of Moment Magnitude from Body- and Surface-Wave Magnitudes, Bull. Seismol. Soc. Am., 104, 1802–1811, https://doi.org/10.1785/0120130324, 2014.
Deniz, A. and Yücemen, M. S.: Magnitude conversion problem for the Turkish earthquake data, Nat. Hazards, 55, 333–352, 2010.
Efron, B.: Bootstrap methods: Another look at the jackknife, Ann. Stat., 7, 1–26, https://doi.org/10.1214/aos/1176344552, 1979.
Ergin, K., Güçlü, U., and Uz, Z.: A Catalog of Earthquakes for Turkey and Surrounding Area (11 A.D. to 1964 A.D.), Technical Report no. 24, Istanbul Technical University, Faculty of Mines, Institute of Physics of the Earth, Istanbul, 1967.
Ergin, K., Güçlü, U., and Aksay, G.: A Catalog of Earthquakes of Turkey and Surrounding Area (1965–1970), Technical Report no. 28, Istanbul Technical University, Faculty of Mines, Institute of Physics of the Earth, Istanbul, 1971.
Galton, F.: Hereditary Genius, Macmillan Publishers, London, 1869.
Grünthal, G., Wahlström, R., and Stromeyer, D.: The unified catalogue of earthquakes in central, northern, and northwestern Europe (CENEC) updated and expanded to the last millennium, J. Seismol., 13, 517–541, https://doi.org/10.1007/s10950-008-9144-9, 2009.
Güçlü, U., Altınbaş, G., and Eyidoğan, H.: A Catalog of Earthquakes of Turkey and Surrounding Area (1971–1975), Technical Report no. 30, İstanbul Technical University, Faculty of Mines, Istanbul, 1986.
Gutenberg, B. and Richter, C.: Seismicity of the Earth and Associated Phenomena, Princeton Univ. Press, Princeton, NJ, 310,pp., 1954.
Havskov, J. and Ottemöller, L.: Routine Data Processing in Earthquake Seismology, Springer, Dordrecht, Heidelberg, 347 pp., 2010.
Hutton, L. K. and Boore, D. M.: The ML scale in Southern California, Bull. Seismol. Soc. Am., 77, 2074–2094, 1987.
ISC – International Seismological Centre: On-line Bulletin, https://doi.org/10.31905/D808B830, 2020.
ISF – IASPEI Seismic Format: http://www.isc.ac.uk/standards/isf/, last access September 2020.
Kadirioğlu, F. T. and Kartal, R. F.: The new empirical magnitude conversion relations using an improved earthquake catalogue for Turkey and its near vicinity (1900–2012), Turkish J Earth Sci 25(4), 300–310, 2016.
Kadirioğlu, F. T., Kartal, R. F., Kılıç, T., Kalafat, D., Duman, T. Y., Özalp, S., and Emre, Ö.: An improved earthquake catalogue (M≥4.0) for Turkey and near surrounding (1900–2012), in: 2nd European Conference on Earthquake Engineering and Seismology Proceedings, 25–29 August 2014, Istanbul, Turkey, 411–422, 2014.
Kadirioğlu, F. T., Kartal, R. F., Kılıç, T., Kalafat, D., Duman, T., Azak, T. E., Özalp, S., and Emre, Ö.: An improved earthquake catalogue (M≥4.0) for Turkey and its near vicinity (1900–2012), Bull. Earthq. Eng., 16, 3317–3338, https://doi.org/10.1007/s10518-016-0064-8, 2018.
Kagan, Y. Y.: Universality of the seismic moment-frequency relation, Pure Appl. Geophys., 155, 537–573, 1999.
Kagan, Y. Y.: Seismic moment distribution revisited: I. Statistical results, Geophys. J. Int., 148, 520–541, 2002.
Kagan, Y. Y.: Earthquake size distribution: power-law with exponent?, Tectonophysics, 490, 103–114, 2010.
Kamer, Y. and Hiemer, S.: Comment on “Analysis of the b-values before and after the 23 October 2011 Mw 7.2 Van–Erciş, Turkey, earthquake”, Tectonophysics, 608, 1448–1451, https://doi.org/10.1016/j.tecto.2013.07.040, 2013.
Kanamori, H. and Anderson D. L.: Theoretical basis of some empirical relations in seismology, Bull. Seismol. Soc. Am., 65, 1073–1095, 1975.
Kennett, B. L. N., Engdahl, E. R., and Buland, R.: Constraints on seismic velocities in the Earth from travel times, Geophys. J. Int., 122, 108–124, 1995.
Leptokaropoulos, K. M., Karakostas, V. G., Papadimitriou, E. E., Adamaki, A. K., Tan, O., and Inan, S.: A Homogeneous Earthquake Catalog for Western Turkey and Magnitude of Completeness Determination, Bull. Seism.ol Soc. Am., 103, 2739–2751, 2013.
MacAlister, D.: The Law of the Geometric Mean, in: Proc. R. Soc., XXIX, Harrison and Sons, London, 1879.
Makropoulos, K., Kaviris, G., and Kouskouna, V.: An updated and extended earthquake catalogue for Greece and adjacent areas since 1900, Nat. Hazards Earth Syst. Sci., 12, 1425–1430, https://doi.org/10.5194/nhess-12-1425-2012, 2012.
Manchuel, K., Traversa, P., Baumont, D., Cara, M., Nayman, E., and Durouchoux, C.: The French seismic CATalogue (FCAT-17), Bull. Earthq. Eng., 16, 2227–2251, https://doi.org/10.1007/s10518-017-0236-1, 2018.
Matsumoto, M. and Nishimura, T.: Mersenne twister: a 623-dimensionally equidistributed uniform pseudo-random number generator, ACM Trans. Model. Comput. Simul., 8, 3–30, https://doi.org/10.1145/272991.272995, 1998.
Mignan A. and Chouliaras, G.: Fifty Years of Seismic Network Performance in Greece (1964–2013): Spatiotemporal Evolution of the Completeness Magnitude, Seismol. Res. Lett., 85, 657–667, https://doi.org/10.1785/0220130209, 2014.
Papazachos, B. C. and Papazachou, C.: The Earthquakes of Greece, Ziti publications, Thessaloniki, 2003.
Papazachos, B.C., Kiratzi, A. A., and Karakostas, B. G.: Toward a homogeneous moment-magnitude determination for earthquakes in Greece and surrounding area, Bull. Seismol. Soc. Am., 87, 474–483, 1997.
Pınar, N. and Lahn, E.: Turkish Earthquake Catalog with Descriptions, Technical Report no. 36, in: Serial 6, Turkey The Ministry of Public Works and Settlement, The General Directorate of Construction Affairs, Ankara, Turkey, 1952.
Reasenberg, P.: Second order moment of central California seismicity, 1969–1982, J. Geophys. Res.-Solid, 90, 5479–5495, 1985.
Richter, C. F.: An instrumental earthquake magnitude scale, Bull. Seismol. Soc. Am., 25, 1–31, 1935.
Rovida, A., Locati, M., Camassi, R., Lolli, B., and Gasperini, P.: The Italian earthquake catalogue CPTI1.5, Bull. Earthq. Eng., 18, 2953–2984, https://doi.org/10.1007/s10518-020-00818-y, 2020.
Scordilis, E. M.: Empirical Global Relations Converting MS and mb to Moment Magnitude, J. Seismol., 10, 225–236, https://doi.org/10.1007/s10950-006-9012-4, 2006.
Shi, Y. and Bolt, B.: The standard error of the magnitude–frequency b value, Bull. Seismol. Soc. Am., 72, 1677–1687, 1982.
Soysal, H., Siphioğlu, S., Kolçak, D., and Altınok, Y.: Historical Earthquake Catalogue of Turkey and Surrounding Area (2100 B.C.–1900 A.D.), Technical Report No. TBAG-341, TÜBİTAK, Istanbul, Turkey, 1981.
Storchak, D. A., Harris, J., Brown, L., Lieser, K., Shumba, B., Verney, R., Di Giacomo, D., and Korger, E. I. M.: Rebuild of the Bulletin of the International Seismological Centre (ISC), part 1: 1964–1979, Geosci. Lett., 4, 32, https://doi.org/10.1186/s40562-017-0098-z, 2017.
Tan, O.: The Dense Micro-Earthquake Activity at the Boundary Between the Anatolian and South Aegean Microplates, J Geodyn., 65, 199–217, https://doi.org/10.1016/j.jog.2012.05.005, 2013.
Tan, O.: Turkish Homogenized Earthquake Catalogue (TURHEC) [Data set], Natural Hazards and Earth System Sciences (NHESS), Zenodo, https://doi.org/10.5281/zenodo.5056801, 2021.
Tan, O., Tapirdamaz, M. C., and Yörük, A.: The earthquake catalogues for Turkey, Turkish, J. Earth Sci., 17, 405–418, 2008.
Tan, O., Tapırdamaz, M. C., Ergintav, S., İnan, S., İravul, Y., Saatçılar, R., Tüzel, B., Tarancıoğlu, A., Karakısa, S., Kartal, R. F., Zünbül, S., Yanık, K., Kaplan, M., Şaroğlu, F:, Koçyiğit., A., Altunel, E., and Özel, N. M.: Bala (Ankara) Earthquakes: Implications for Shallow Crustal Deformation in Central Anatolian Section of the Anatolian Platelet (Turkey), Turk. J. Earth Sci., 19, 449–471, https://doi.org/10.3906/yer-0907-1, 2010.
Tan, O., Papadimitriou, E. E., Pabuçcu, Z., Karakostas, V. G., Yörük, A., and Leptokaropoulos, K. M.: A detailed analysis of microseismicity in Samos and Kusadasi (eastern Aegean Sea) areas, Acta Geophys., 62, 1283–1309, https://doi.org/10.2478/s11600-013-0194-1, 2014.
Ulusay, R., Tuncay, E., Sonmez, H., and Cokceoglu, C.: An attenuation relationship based on Turkish strong motion data and iso-accelaration map of Turkey, Eng. Geol., 74, 265–291, 2004.
Wessel, P. and Smith, W. H. F.: New, improved version of the Generic Mapping Tools released, EOS Trans. Am. Geophys. Union, 79, 579, https://doi.org/10.1029/98EO00426, 1998.
Wiemer, S.: A software package to analyze seismicity: ZMAP, Seismol. Res. Lett., 72, 373–382, https://doi.org/10.1785/gssrl.72.3.373, 2001.
Wyss, M., Hasegawa, A., Wiemer, S., and Umino, N.: Quantitative mapping of precursory seismic quiescence before the 1989, M 7.1 off-Sanriku earthquake, Japan, Annal. Geofis., 42, 851–869, 1999.