the Creative Commons Attribution 4.0 License.
the Creative Commons Attribution 4.0 License.
 | 14 Jun 2021
Predicting social and health vulnerability to floods in Bangladesh
Hassan Ahmadul
Jonathan Patz
Paul Block
Floods are the most common and damaging natural disaster in Bangladesh, and the effects of floods on public health have increased significantly in recent decades, particularly among lower socioeconomic populations. Assessments of social vulnerability on flood-induced health outcomes typically focus on local to regional scales; a notable gap remains in comprehensive, large-scale assessments that may foster disaster management practices. In this study, socioeconomic, health, and coping capacity vulnerability and composite social-health vulnerability are assessed using both equal-weight and principal-component approaches using 26 indicators across Bangladesh. Results indicate that vulnerable zones exist in the northwest riverine areas, northeast floodplains, and southwest region, potentially affecting 42 million people (26 % of the total population). Subsequently, the vulnerability measures are linked to flood forecast and satellite inundation information to evaluate their potential for predicting actual flood impact indices (distress, damage, disruption, and health) based on the immense August 2017 flood event. Overall, the forecast-based equally weighted vulnerability measures perform best. Specifically, socioeconomic and coping capacity vulnerability measures strongly align with the distress, disruption, and health impact records observed. Additionally, the forecast-based composite social-health vulnerability index also correlates well with the impact indices, illustrating its utility in identifying predominantly vulnerable regions. These findings suggest the benefits and practicality of this approach to assess both thematic and comprehensive spatial vulnerabilities, with the potential to support targeted and coordinated public disaster management and health practices.
- Article
(4166 KB) - Full-text XML
-
Supplement
(2647 KB) - BibTeX
- EndNote


Flood-induced mortality, one of the most telling statistics of flood impacts, has been studied extensively in conjunction with environmental and socioeconomic factors. For example, Kundzewicz and Takeuchi (1999) demonstrate the relationship between economic losses per death and overall national wealth for the most severe flood events of the 1990s. Based on information from flood victims in Poland in 1997, Kundzewicz and Kundzewicz (2005) also emphasize that flood-related mortality is indirectly related to wealth level and instead is more directly related to social and health factors and perceptions of flood risk. According to Jonkman and Vrijling (2008), the primary causes of flood-related mortality are a lack of warning, inability to reach shelter, building collapse, flood level and velocity, and impacts on children and the elderly. Doocy et al. (2013) review global flood fatality data during 1980–2009 and related articles, concluding that sociodemographic factors such as population growth, urbanization, land use change, disaster warning systems, and response capacity all contribute to flood mortality.
Public health outcomes stemming from flood events are typically acute and severe, particularly in developing or tropical regions, potentially including death and injury, contaminated drinking water, endemic and infectious diseases, and community disruption and displacement. Although the impacts of floods on public health have been investigated (Ahern et al., 2005; Alderman et al., 2012; Batterman et al., 2009; Du et al., 2010; Tapsell et al., 2002), integrated management of flood and health risks is technically and institutionally limited.
Unsurprisingly, public health research on the impacts of natural disasters predominantly focuses on clinical, microbiological, and ecological aspects, including vaccines, therapy, and improved treatment (Colston et al., 2020; Schwartz et al., 2006). Development of flood prediction and disaster management has principally targeted advancing climate and hydrologic aspects, with much less focus on the considerations of health vulnerability, community risk, and early warning systems, particularly in developing countries (Kovats et al., 2003). This often results in underprediction of event outcomes on marginalized and susceptible communities (WHO, 2013). Only recently has the global community started calling for multi-sectoral disaster forecast and warning systems to support integrated disaster management (UNISDR, 2015), including novel indicators of public health risk and vulnerability. In addition to prioritizing forecast-informed health risks, identifying vulnerable regions and populations to establish targeted and coordinated public health practices is critical (Akanda et al., 2011).
In Bangladesh, floods are the most significant and damaging natural disaster. A vast majority (75 %) of the country is within 10 m a.m.s.l. (above mean sea level), and an even higher fraction of landmass (80 %) is classified as a floodplain (BBS, 2018). Approximately 78 % of Bangladesh’s total population, mostly rural and poor, live in floodplain regions (BBS, 2016). On average, 18 % of the country is inundated in any given year. Catastrophic events have occurred most recently in 1988, 1998, 2007, and 2017, affecting 60 % of the nation for nearly 3 months and causing erosion, landlessness, mortality, environmental refugees, destruction of property and crop lands, and disruption of communication and health systems (BBS, 2018; CEGIS, 2003). In addition, these floods have led to outbreaks of waterborne disease and epidemics as a result of contaminated drinking water. The effects of floods on diarrheal diseases have been a major public health concern, as diarrheal disease is one of the leading causes of morbidity and mortality, particularly among people with low socioeconomic status and poor sanitation (Alderman et al., 2012; Kosek et al., 2003); risks have significantly increased in recent decades (Hashizume et al., 2008). These conditions, when combined with social inequity, low literacy rates, deprivation, and insufficient institutional capacity, can lead to precarious situations (Mazumder et al., 2015; Shahid, 2010; Mani and Wang, 2014).
In this regard, a number of studies investigate health vulnerability to floods based on demographic and socioeconomic factors in Bangladesh. Kunii et al. (2002), for example, associate the impacts of the 1998 Bangladesh flood on community health, such as fever, diarrhea, and respiratory problems, with socioeconomic status, water handling, and household sanitation. Hashizume et al. (2008) examine flood-related diarrheal incidents during the 1998 flood in Dhaka and discover substantially higher flood-related cases in the post-flood period for populations with low socioeconomic status and weak sanitation and hygiene facilities. Schwartz et al. (2006) analyze demographic and clinical data of patients with flood-related diarrhea in Dhaka and find an increase in flood-related epidemics in populations with low socioeconomic status, inferior sanitation, dwellings in flood-prone areas, and minimal access to care. Shahid (2010) discusses direct and indirect impacts of climate change on public health and highlights high poverty rates and limited access to sanitation facilities in Bangladesh as significantly impacting diarrheal-related health problems. Nahar et al. (2014) note that women and poor populations in Bangladesh are especially vulnerable to poor mental health status in the post-flood period.
While these studies illustrate the underlying relationships between demographic and socioeconomic vulnerability factors and flood-induced health risks at specific locations (e.g., Dhaka), there is no explicit link to disaster management practices for more rural and poor regions. Presumably, if such vulnerability factors are aggregated and concurrently evaluated with physical flood information to estimate at-risk populations, this collective information may be strategic for informing pre- and post-flood disaster management plans. This motivates evaluation of combined socioeconomic and health factors to develop comprehensive and practical vulnerability metrics.
Thus, we develop a social-health vulnerability (SHV) index based on a variety of demographic, socioeconomic, health, and infrastructural indicators for all of Bangladesh to identify the most vulnerable regions, means for vulnerability and risk reduction, and to enhance response capacity and efficiency for international and local disaster management agencies. We also examine the predictability of flood impacts on livelihood, community, and health sectors by linking vulnerabilities to flood forecasts and satellite inundation for the catastrophic 2017 Bangladesh flood event. While the emphasis here is on the impacts of flood on social and health, multi-sectoral risk warning systems, coupled with vulnerability and risk characteristics, can be envisioned.
In this study, as is generally adopted in the literature, an indicator represents an individual variable, an index represents a composite vulnerability, and a score indicates the value of an indicator or index (Birkmann, 2006; Fekete, 2009). Here we describe the data necessary to establish vulnerability indicators, including survey and census data, spatially explicit flood forecasts, satellite inundation, and population data. Flood impact records for the August 2017 event from post-disaster reports are also presented.
2.1 Survey, census, and population data
A large number of relevant data, resources, and documents are available across various governmental agencies, including the Bangladesh Bureau of Statistics (BBS), Department of Disaster Management (DDM), and Directorate General of Health Services (DGHS). These agencies typically report outcomes for administrative units defined as (large to small): division, district, Upazila, and union.
A census is conducted in Bangladesh approximately every 10 years, with 2011 being the most recent. Upazila-scale population, household census data, and various demographic and socioeconomic records are available via the BBS (BBS, 2015). These census data provide a significant proportion of the indicators of socioeconomic vulnerability used in this study. Poverty estimates (population below the upper poverty line) in 2010 measured by the World Bank and BBS in conjunction with World Food Programme (WFP) are also obtained from the BBS.
Information outlining comprehensive measures of coping capacity at local scales is often incomplete or not available. In Bangladesh, the BBS conducts household surveys and quantifies disaster-related statistics for 12 main natural disasters (BBS, 2016). From this report, we adopted district-level statistics to represent coping capacity and public health vulnerability indicators for flood disasters. Examples include knowledge and perceptions of disasters (the population assumes that natural processes causes critical disasters), damages and losses, households receiving financial support, and the population lacking safe drinking water, etc.
Additionally, health facility (e.g., location and capacity) and physician data are obtained from the Facility Registry (http://facilityregistry.dghs.gov.bd, last access: 30 April 2021) and the Health Dashboard (https://dghs.gov.bd/index.php/en/home, last access: 30 April 2021), respectively. From these data, the number of hospital beds and physicians are estimated to reflect the capacity of the health system and health workforce of each Upazila. The national average of hospital beds per 1000 people and physicians per 10 000 people in 2019 are measured as 0.6 (0.8 in 2015 by World Bank) and 0.58 (0.53 in 2017 by World Bank), respectively.
For spatial population data, the WorldPop population per pixel data in 100 m resolution is obtained and rescaled linearly with a World Bank population record of 2017 (World Bank, 2018; Worldpop et al., 2018) (Fig. S1 in the Supplement).
2.2 Flood forecast, satellite inundation, and population data
In Bangladesh, the Flood Forecasting and Warning Centre (FFWC) provides flood forecasts and warning services countrywide. The FFWC's flood forecasting system is based on the MIKE 11 model, a one-dimensional water modeling software for the simulation of water levels and discharges in river networks and floodplains. Two-dimensional flood inundation (flood depth) forecasts are created using digital elevation models (DEMs) at 300 m spatial resolution. The current early flood warning system offers a 120 h lead time (FFWC, 2018). The FFWC acknowledges that flood forecasts may underestimate or overestimate inundation depths and extent given the lack of model updates and coarse spatial resolution. These FFWC-issued flood forecasts are utilized for the August 2017 event (issued 16 August) evaluated here. These forecasts were verified by the FFWC with observed inundation maps from Sentinel-1 satellite images, illustrating good agreement in the northwestern and northeastern regions (FFWC, 2018). We obtained the satellite inundation data for the August 2017 flood event generated using Sentinel-1 synthetic aperture radar images (22, 24, 27, and 29 August) from the International Centre for Integrated Mountain Development (Uddin et al., 2019) (Fig. 1).

Figure 1FFWC's flood forecast issued on 16 August 2017 (left panel) and Sentinel-1-based satellite flood inundation for the August 2017 (right panel) flood event. The borderline represents the boundary of divisions.
2.3 Flood impact records
The Global Shelter Cluster has aggregated relevant post-disaster reports and data for the August 2017 flood event in Bangladesh through government agencies and international relief organizations (https://www.sheltercluster.org/response/bangladesh-monsoon-floods-2017, last access: 30 April 2021). Specifically, we leverage the 72 h rapid assessment report published 21 August, the flood damage data reported on 3 September by the DDM and Natural Disaster Response Coordination Group, and monthly hazard incident reports from the Network for Information, Response and Preparedness Activities on Disaster (NIRAPAD) (NIRAPAD, 2017b). The DGHS reported health outcomes from the August 2017 flood collected between July to September. From this, we extract the number of diarrheal incidents and other adverse health outcomes, including incidents of respiratory tract infections (RTIs), eye and skin diseases, snake bites, drowning, and other injuries.
Spatially explicit vulnerability and risk maps can support decision-makers by enhancing their ability to take appropriate actions. However, vulnerability assessment is complicated by environmental, social, economic, and political patterns of societies. To date, no standard model or methodology exists to guide spatial vulnerability assessments for natural disasters, although the number of related studies is rapidly increasing (Villagrán de Léon, 2008; Ward et al., 2020). In this study, we select socioeconomic, health, and coping capacity vulnerability domains consisting of 26 indicators based on the literature, availability of data, and their vulnerability influences. The domain-level vulnerability (DV) index is estimated using two approaches of vulnerability calculation, namely equal-weight and principal-component analysis (PCA); the social-health vulnerability (SHV) index is measured using equal weights. The flood forecast and satellite inundation information are applied to estimate affected population during the August 2017 flood event. Finally, the vulnerability of the affected population is assessed and validated against records of post-disaster flood impacts. The overall framework of this study is illustrated in Fig. 2.
3.1 Social-health vulnerability assessment
3.1.1 Domain and indicators selection
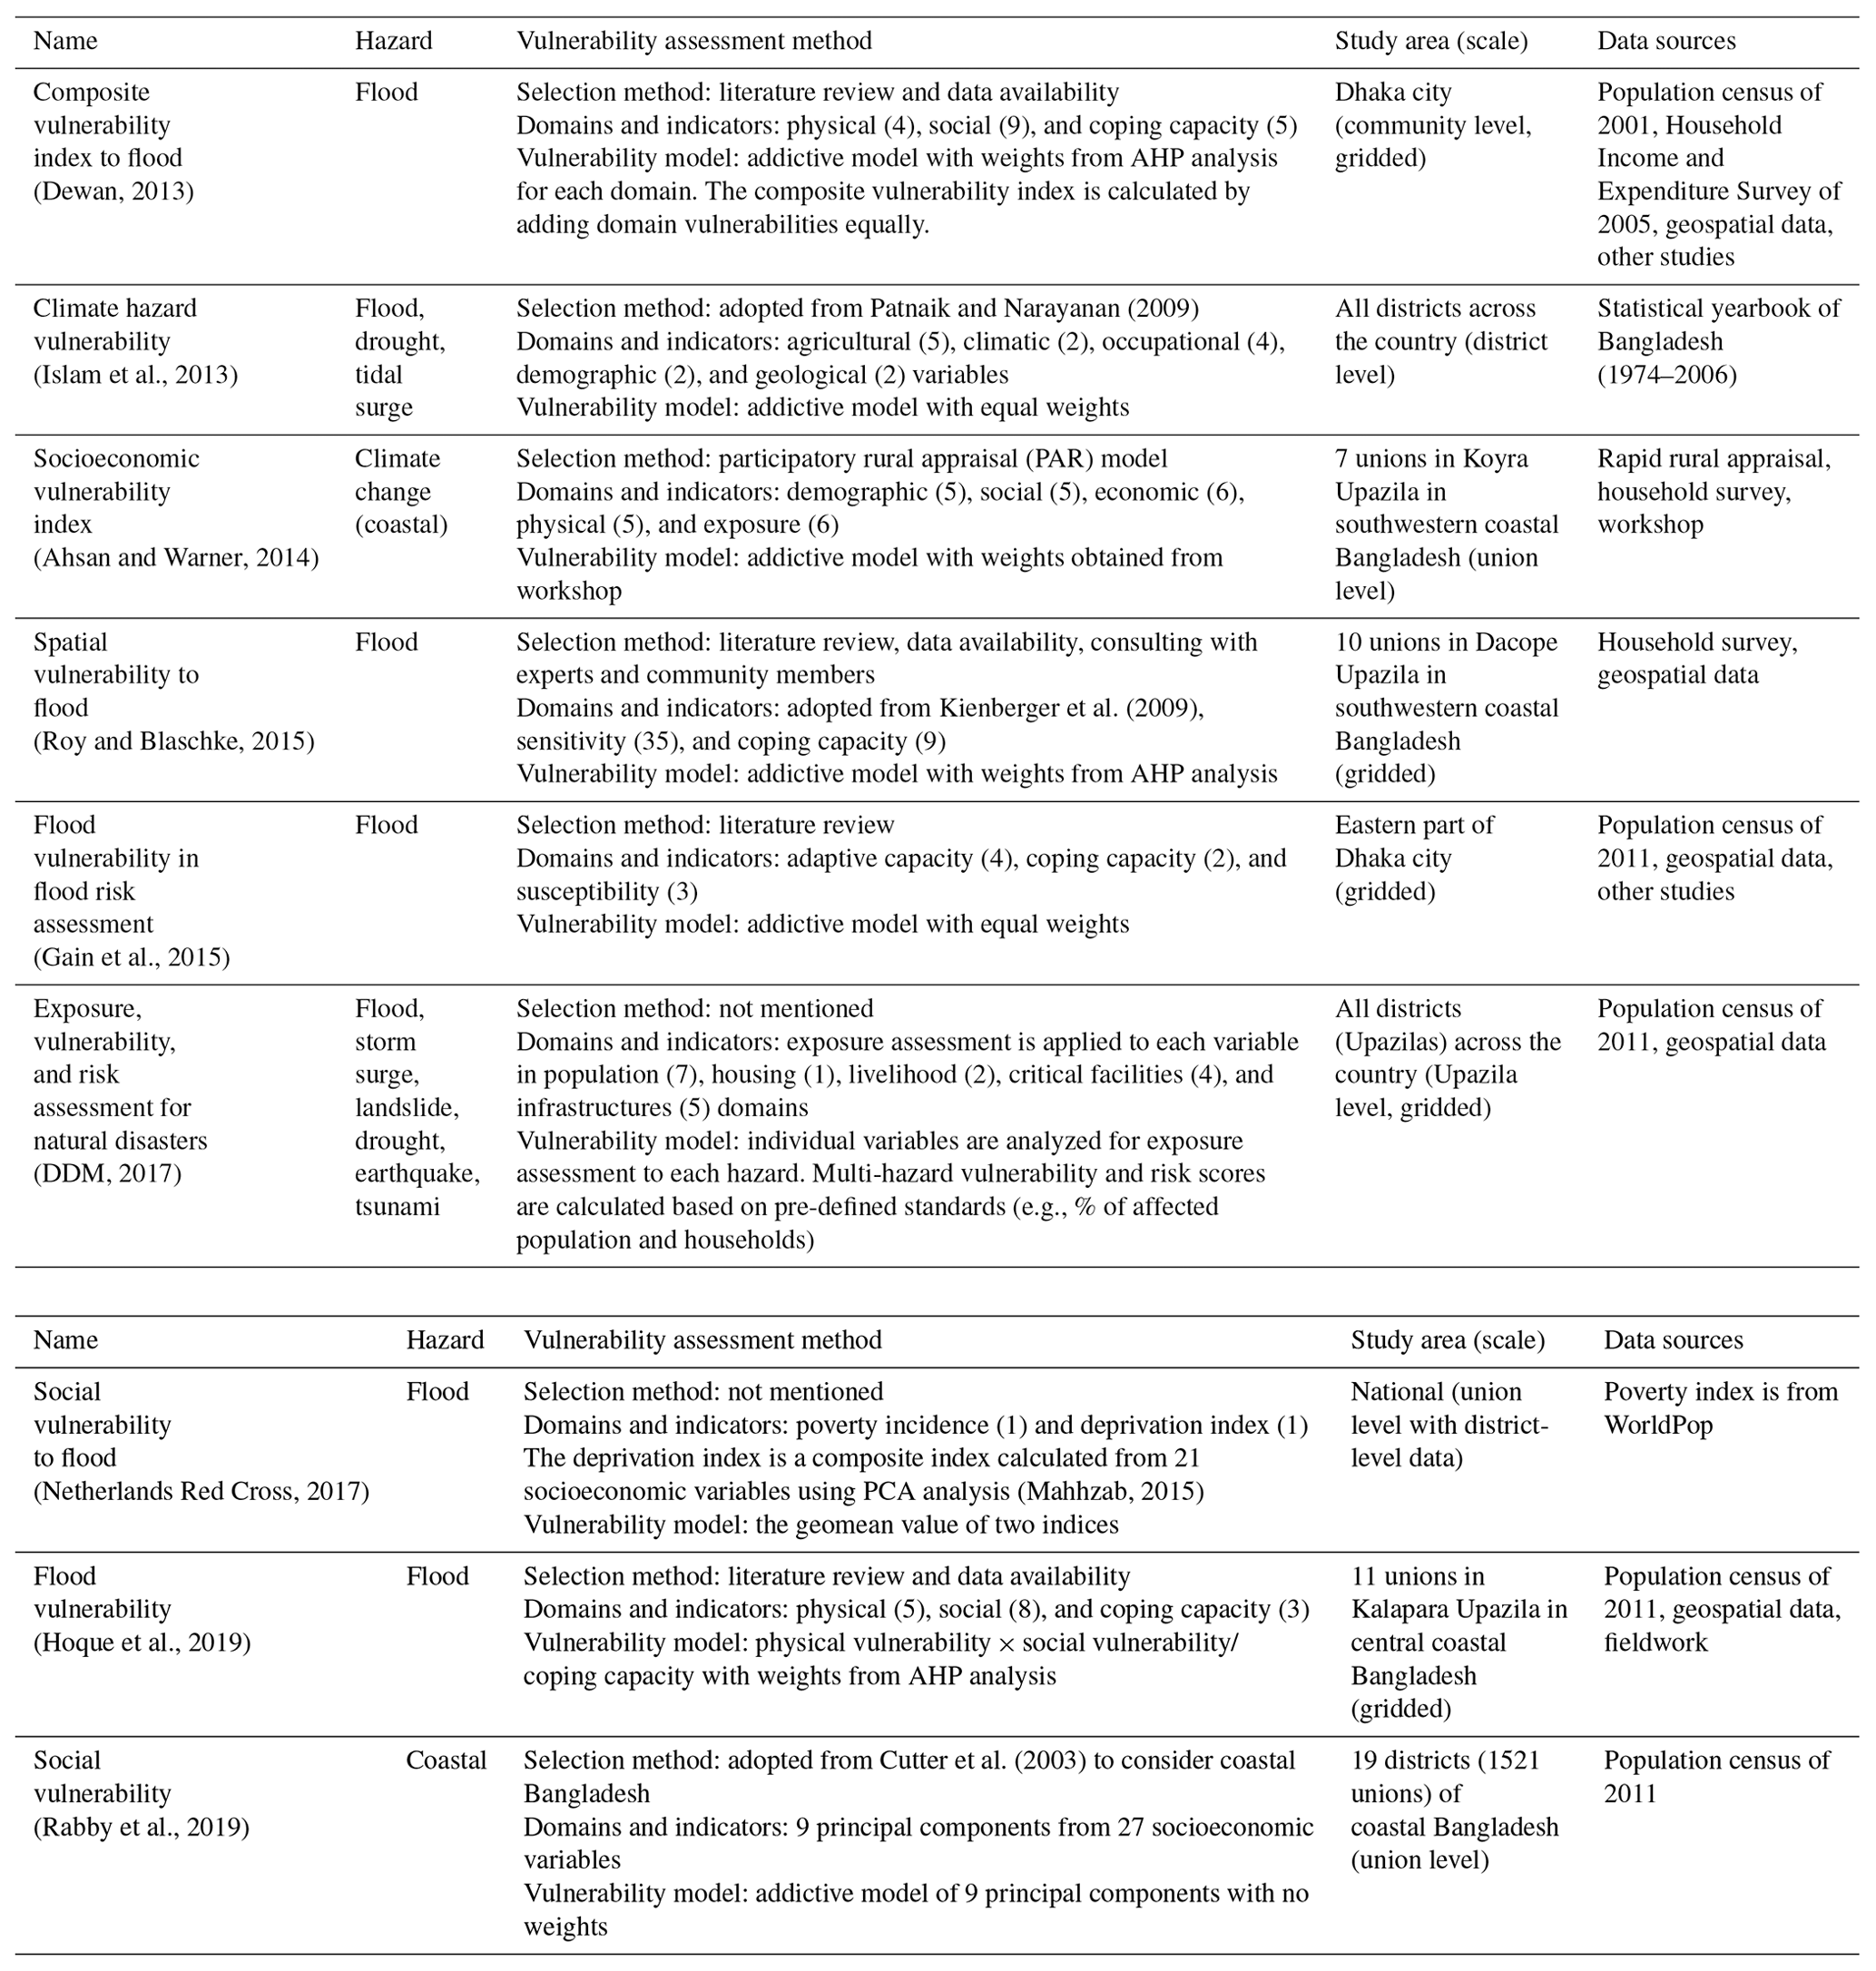
Previously, assessments of spatial vulnerability conditioned on socioeconomic factors have been conducted for a number of regions of Bangladesh (Ahsan and Warner, 2014; Dewan, 2013; Gain et al., 2015; Hoque et al., 2019; Rabby et al., 2019; Roy and Blaschke, 2015) and more broadly for the entire country (DDM, 2017; Islam et al., 2013). The method of assessment, indicators, study area, scale, and data are summarized in Table 1. These studies typically select vulnerability domains and indicators based on the context of the target disaster and study area or from a pre-defined approach in the literature. In previous studies, the domains include socioeconomic, adaptive or coping capacity, and unique exposure or hazard domains, such as agricultural, physical (climate, flood, or coastal hazard), and infrastructure. For vulnerability models, an addictive model (equal weights) or analytic hierarchy process (AHP) analysis (custom weights from stakeholder engagement or expert opinion; Saaty and Vargas, 2012) are most common. A PCA analysis (e.g., Cutter et al., 2003) is also frequently employed to identify dominant spatial patterns and to generate a composite vulnerability. The majority of studies adopt the equal-weight approach such that each domain contributes equally to the composite vulnerability index.
(Dewan, 2013)Patnaik and Narayanan (2009)(Islam et al., 2013)(Ahsan and Warner, 2014)Kienberger et al. (2009)(Roy and Blaschke, 2015)(Gain et al., 2015)(DDM, 2017)(Netherlands Red Cross, 2017)(Mahhzab, 2015)(Hoque et al., 2019)Cutter et al. (2003)(Rabby et al., 2019)
Table 1Report and studies of spatial social vulnerability to flood disasters in Bangladesh.
In this study, the SHV index includes 26 indicators along with three indicator domains: socioeconomic (15 indicators), health (5 indicators), and coping capacity (6 indicators) domains. Some studies of vulnerability assessments to flood include physical indicators (e.g., floodplain area, low elevation, proximity to river, etc.) in their composite vulnerability index to reflect flood susceptibility or risk (Dewan, 2013; Islam et al., 2013; Roy and Blaschke, 2015; Hoque et al., 2019). In this study, however, the SHV index precludes those physical indicators, as flood hazard information (i.e., flood inundation) will be linked later through the impact assessment. Instead, we include a health domain uniquely reflecting flood-induced health risk that has rarely been considered in previous studies (Ahsan and Warner, 2014; Gain et al., 2015; Rabby et al., 2019) (Table 1). Indicators are selected on the basis of their relevance to each domain vulnerability and availability of data for the country at Upazila or district level (Table 2).
BBS (2015)BBS (2015)BBS (2015)BBS (2015)BBS (2015)BBS (2015)BBS (2015)BBS (2015)BBS (2015)BBS (2015)BBS (2015)BBS (2015)BBS (2010)BBS (2015)BBS (2015)BBS (2016)BBS (2016)BBS (2016)MHFW (2020)DGHS (2020)BBS (2016)BBS (2016)BBS (2016)BBS (2016)BBS (2016)BBS (2016)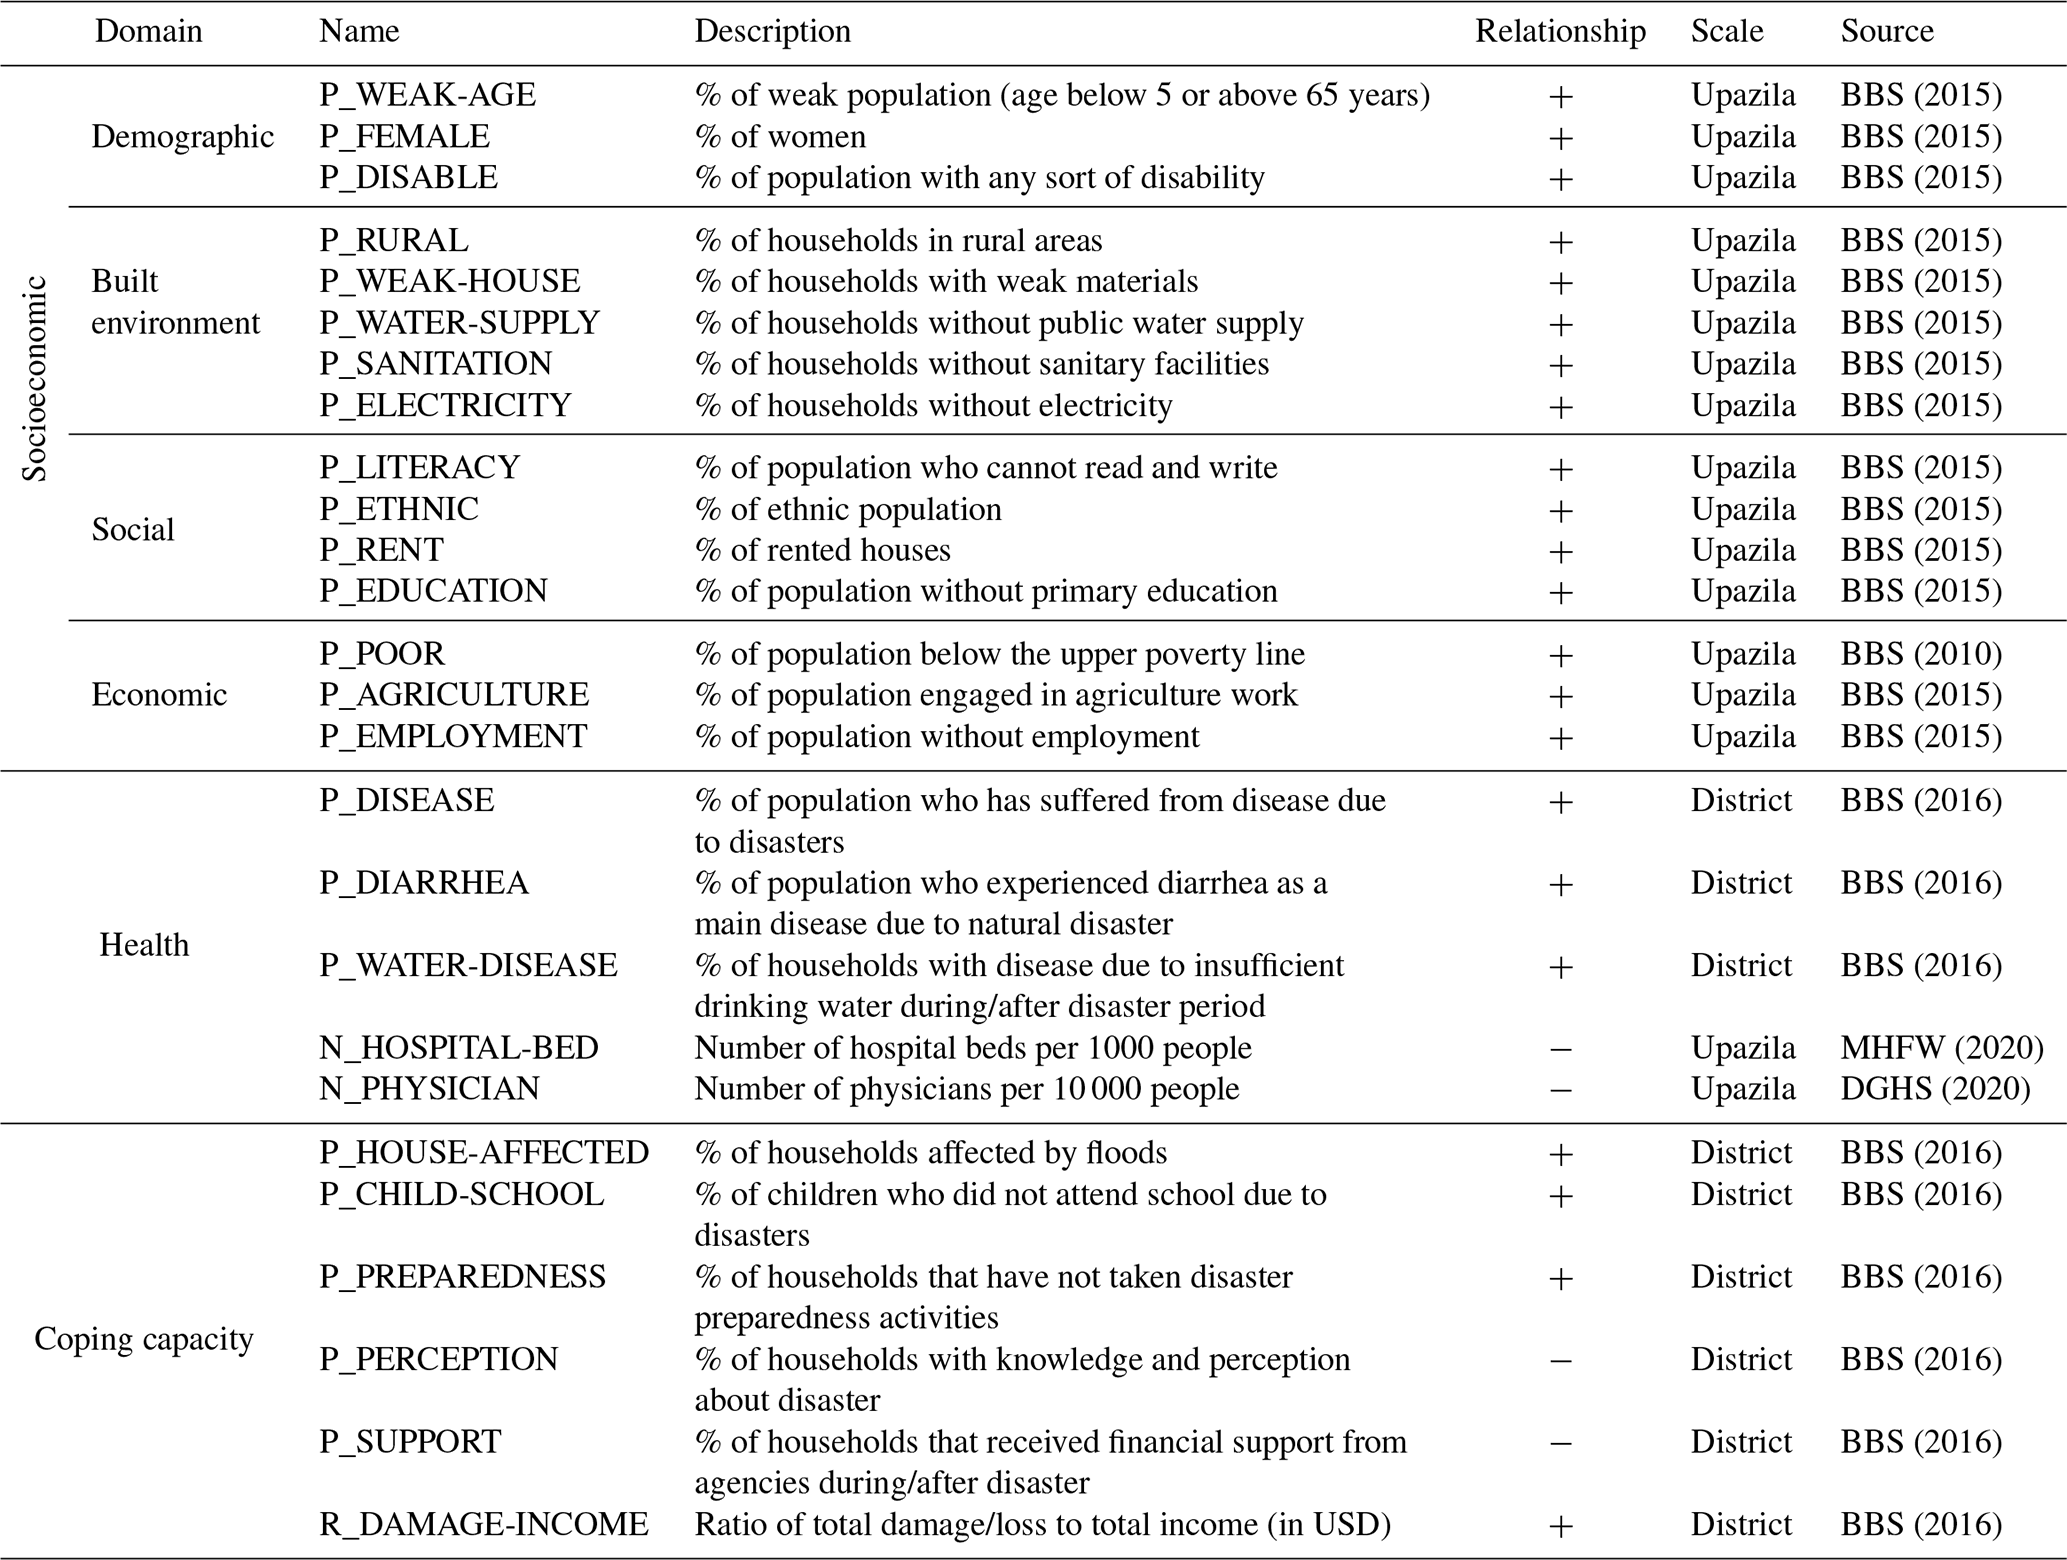
The socioeconomic domain broadly represents the potential impact of the hazard conditioned on the existing societal context. Based on the literature review, we select 15 indicators relevant to demographic (3), built environment (5), social (4), and economic (3) categories, drawing on the most recent population census data. Comparatively, the coping capacity domain represents the ability to cope with or adapt to the hazard (Birkmann, 2005; Villagrán de Léon, 2006).
In the literature, coping capacity indicators are surveyed for the local region or proxy data from the census are used, such as households with communication devices and vehicles, literacy rates, education levels (Dewan, 2013; Roy and Blaschke, 2015). For this study, we apply six indicators specifically measured to represent the level of disaster resilience in each district across Bangladesh, including: (1) percentage of households affected by floods, (2) percentage of children who did not attend to school due to disasters, (3) percentage of households that have not taken disaster preparedness activities, (4) percentage of the population with knowledge and perception about disaster, (5) percentage of households that received financial support from agencies, and (6) ratio of total damage or loss to total income (Table 2). In Bangladesh, several studies and reports investigate appropriate health indicators in the context of disaster management (DGHS, 2018; Schwartz et al., 2006; Shahid, 2010; WHO, 2013). However, most indicators are either national or local scale and thus not interpretable at a high resolution for the entire country. Here, we include five indicators representing the health domain: (1) the proportion of population having suffered from diseases caused by disasters, (2) the proportion of population having experienced diarrheal disease during disaster periods, (3) lack of drinking water due to disasters, (4) the number of hospital beds, and (5) the number of physicians.
The min–max formula is applied to derive an indicator score (IS) of Upazila i as follows:
where xi is the original value of the indicator, and xmin and xmax are the lowest and highest values of the indicator, respectively. Indicator scores range from 0 to 1, with larger values representing an increase in vulnerability (Table 2). All data are normalized to account for differences in the magnitude of units.
3.1.2 Vulnerability calculation
In this study, the equal-weight and PCA approaches are proposed to calculate DV for the three domains (Table 2). The equal-weight approach applies the addictive model with equal weights for all indicators in a domain as follows:
where DVi denotes the domain vulnerability index of Upazila i and ISi,k is kth indicator score of Upazila i (here n indicates the number of indicators in each domain shown in Table 2).
PCA is a common data-driven approach for the construction of the social vulnerability index proposed by Cutter et al. (2003). Specifically, PCA reduces the number of indicators to a smaller number of components that account for a significant portion of the variances of the indicators. Through grouping highly correlated and similar indicators, principal components (PCs) are formed. Here, varimax rotation is used to create more independence between PCs. Only PCs with eigenvalues > 1 are retained in order to meet the Kaiser criterion (Kaiser, 1960). The domain vulnerability index for each Upazila is calculated by adding the scores of all the retained PCs as follows:
Thus, each domain vulnerability contributes equally to the SHV index value. SHV scores are classified into five categories based on their values: very low vulnerability (0 to 0.2), low vulnerability (0.2 to 0.4), moderate vulnerability (0.4 to 0.6), high vulnerability (0.6 to 0.8), and very high vulnerability (0.8 to 1).
3.2 Impact assessment linking with flood forecast and satellite inundation information
Although social vulnerability is a complex function of social, economic, and cultural context, numerical vulnerability estimates are often presented in terms of fatalities, economic losses, migration, etc. (Rufat et al., 2019; Villagrán de Léon, 2006). One can imagine that a region classified as highly vulnerable may experience severe impacts from a disaster, poor resilience, slow recovery, or high rates of a particular action such as displacement or emergency shelter use (Fekete, 2009). However, validation of social vulnerability is typically challenging due to limited availability and quality of data during and after the disaster period. Moreover, given the compound characteristic of a composite vulnerability, a comparison of vulnerability with a particular disaster outcome may be difficult to validate in a traditional sense (Rufat et al., 2019). That withstanding, the objective here is to develop vulnerability measures for impact assessment and specifically evaluate its utility for the August 2017 flood by merging it with physical flood hazard information (i.e., flood forecast and satellite inundation) in order to aid in pre- and post-disaster management practices.
In 2017, after devastating floods in the pre-monsoon period (mid-April) and the monsoon period (early July), the second monsoon rains began on 11 August, causing intense floods in 42 % of the country, including five divisions and 32 districts in the northern, northeastern, and central parts of the country, affecting a total of more than 11 million people (Fig. 1). According to the Ministry of Disaster Management and Relief, this flood has been recorded as the worst in the last four decades (FFWC, 2018; NIRAPAD, 2017b).
First, we estimate the affected population based on flood forecast and satellite inundation maps and spatial population data. All spatial data are linearly downscaled to a 30 m resolution. Flood forecasts are represented as flood depths. The affected population is assumed to increase linearly from no impact at a flood depth of zero to maximum impact at a flood depth of 3 m. Satellite-based inundation conveys whether or not a grid (30 m resolution) is flooded. For flooded grids, we assume the full population of that grid is affected. We acknowledge that this may result in an overestimation of the affected population; however, explicit flood protection infrastructure data are not available widely. This approach does still capture spatial patterns of affected population.
Post-disaster records were aggregated and reported at the district level for the August 2017 flood event; therefore, we calculate the district-level domain vulnerability by taking the population-weighted average of Upazila-level domain vulnerabilities as follows:
where POP and DV are the affected population and domain vulnerability of Upazila i and district j, respectively. Thus, the district-level DV indicates the average vulnerability of the affected population in each district.
In lieu of evaluating and comparing vulnerability directly with all disaster outcomes, we group the disaster records into four index types – distress, damage, disruption, and health – as utilized by local management agencies and defined in post-disaster reports (Table 3). Specifically, the distress index includes the percentage of the affected population and the number of deaths, the damage index includes the number of damaged houses and crop land areas, the disruption index includes the number of affected educational institutions and damaged tube wells, and the health index includes the number of diarrheal and other disease cases (e.g., injury, drowning, RTI, skin, and snakebite) (Table 3).
NIRAPAD (2017a)NIRAPAD (2017a)NIRAPAD (2017a)NIRAPAD (2017a)NIRAPAD (2017a)NIRAPAD (2017a)DGHS (2020)DGHS (2020)Table 3Flood impact indices and variables considered for the August 2017 flood event.

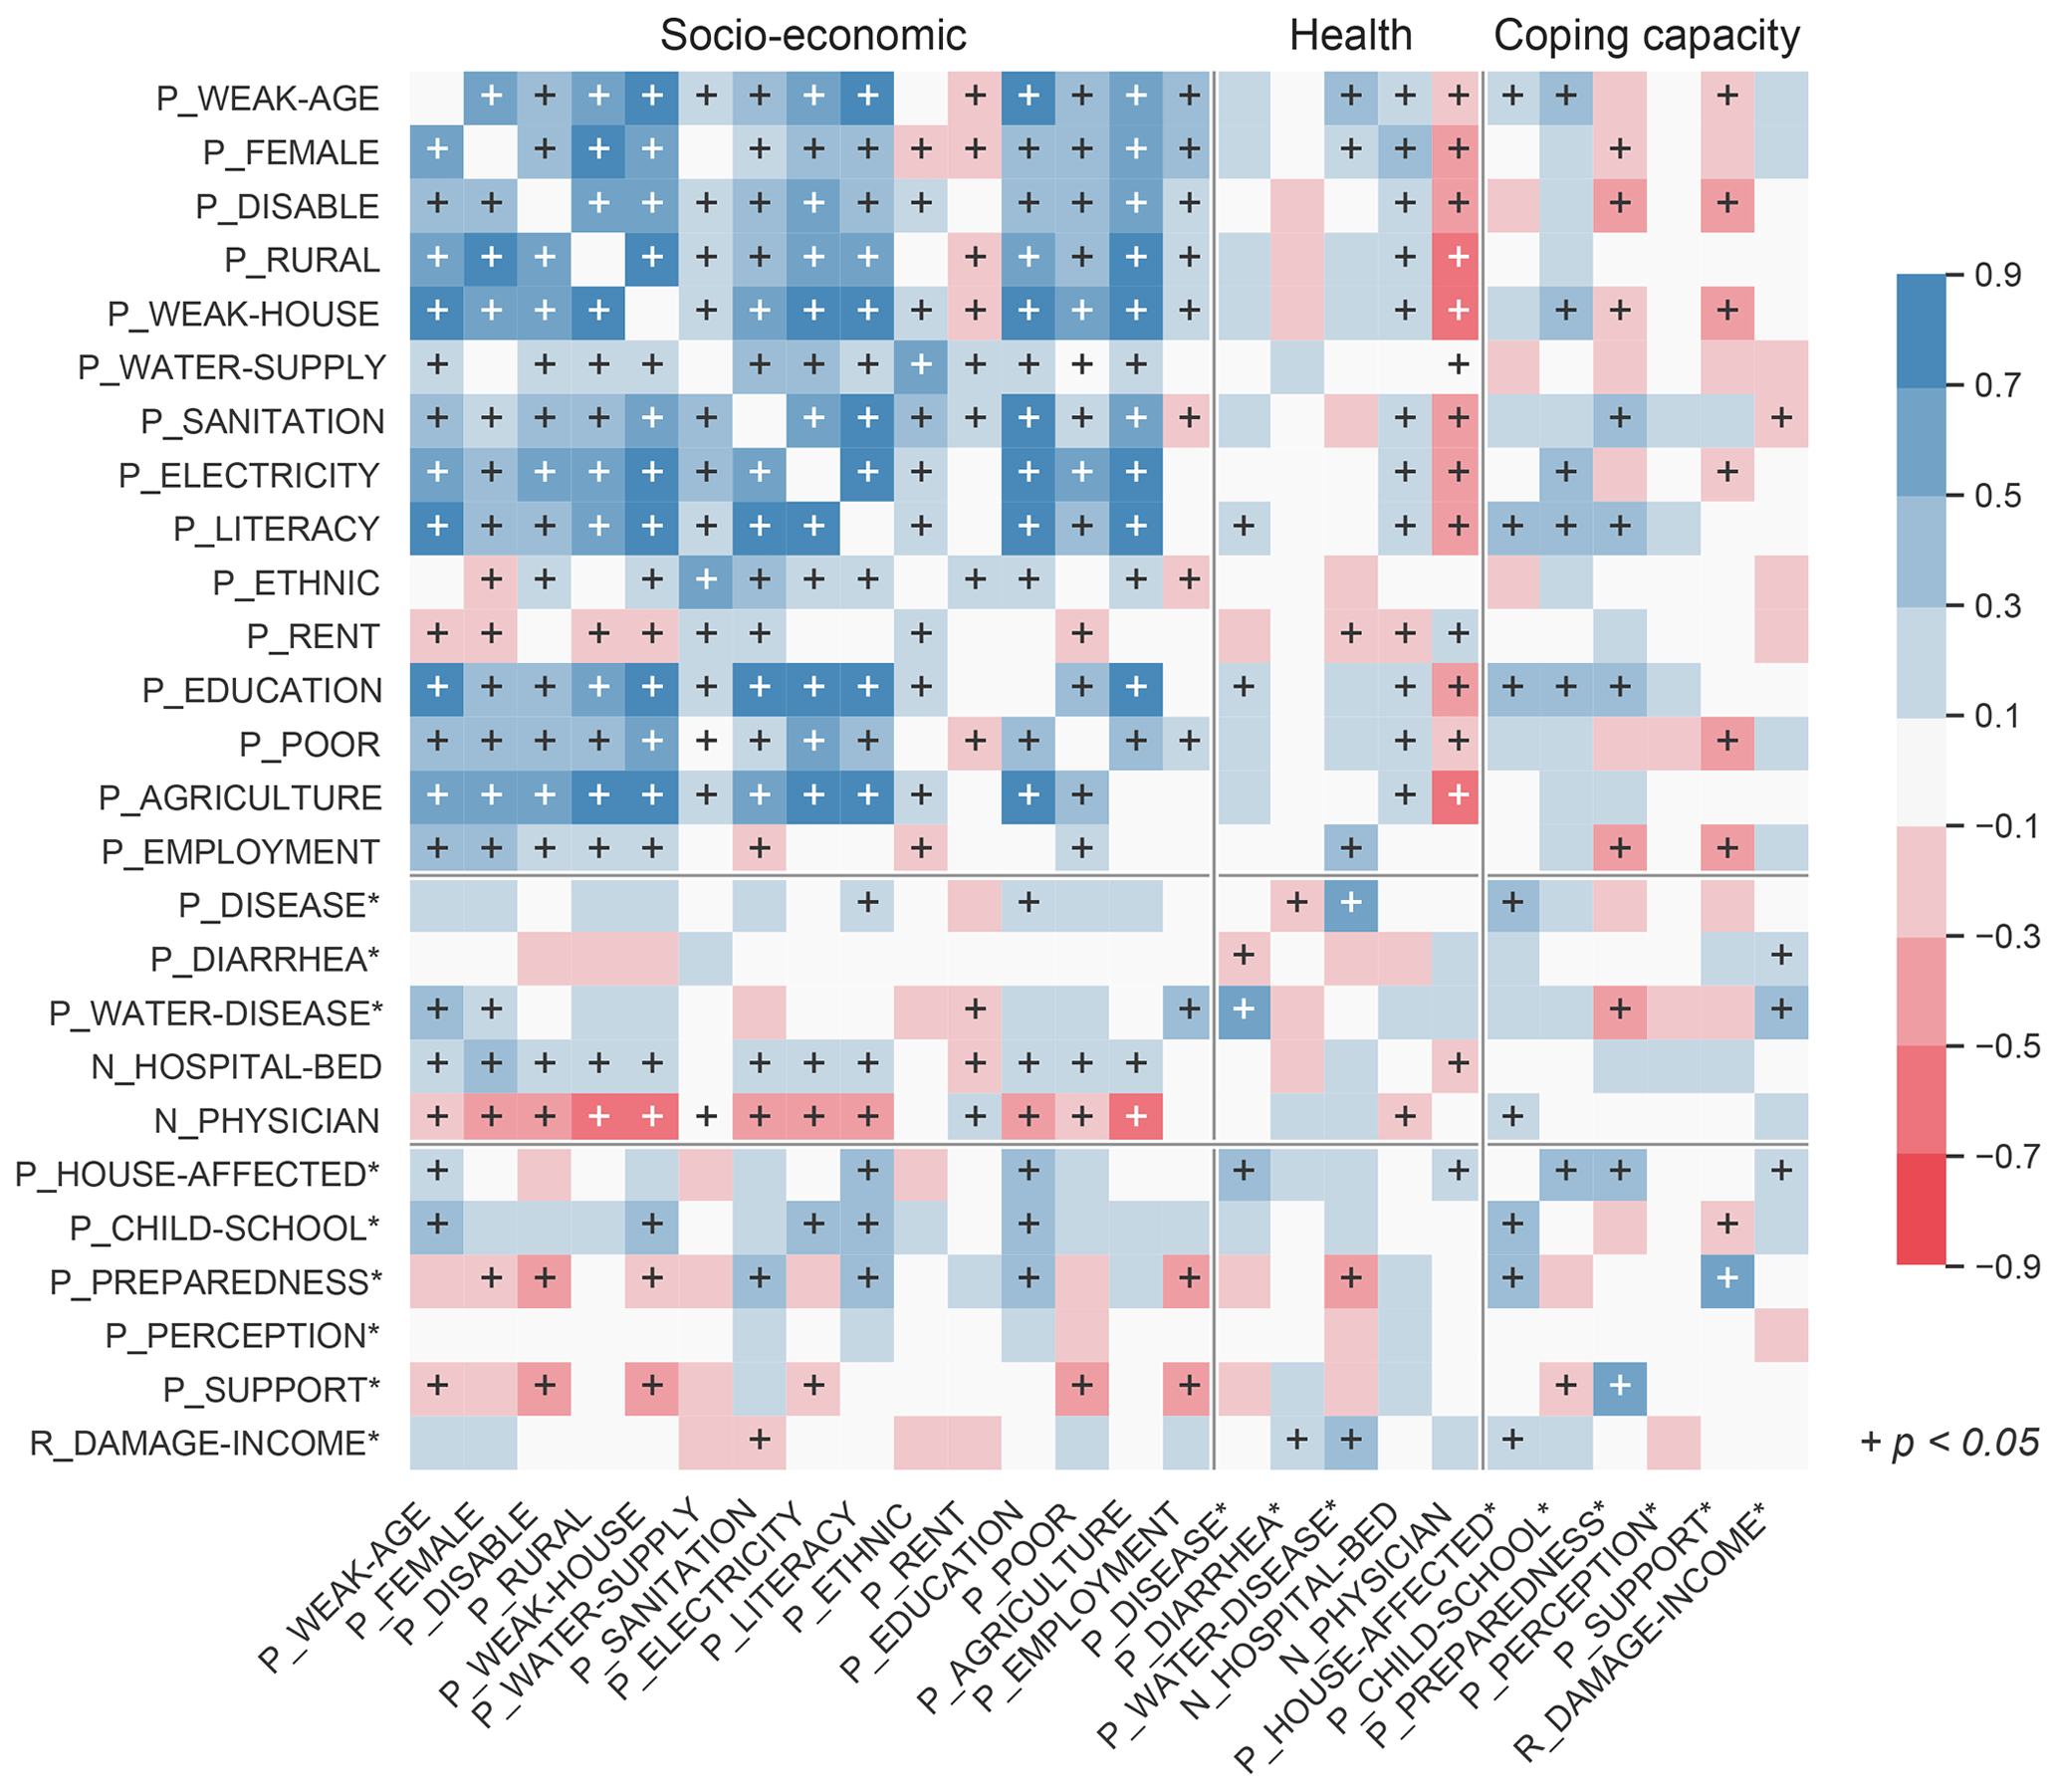
Figure 3Cross-correlation matrix of the selected indicators calculated at Upazila level unless followed by an asterisk (district level.) The plus sign indicates a statistically significant correlation (p<0.05).
The variables within each group are normalized and averaged to form a group impact score. Validation is carried out by calculating correlations between developed vulnerability scores and group flood impact scores.
4.1 Relationships between vulnerability indicators
To evaluate cross-correlations, selected indicators (Table 2) are compared at the Upazila or district levels (Fig. 3). As necessary, Upazila level indicators are upscaled to compare with district-level indicators using population or household weights.
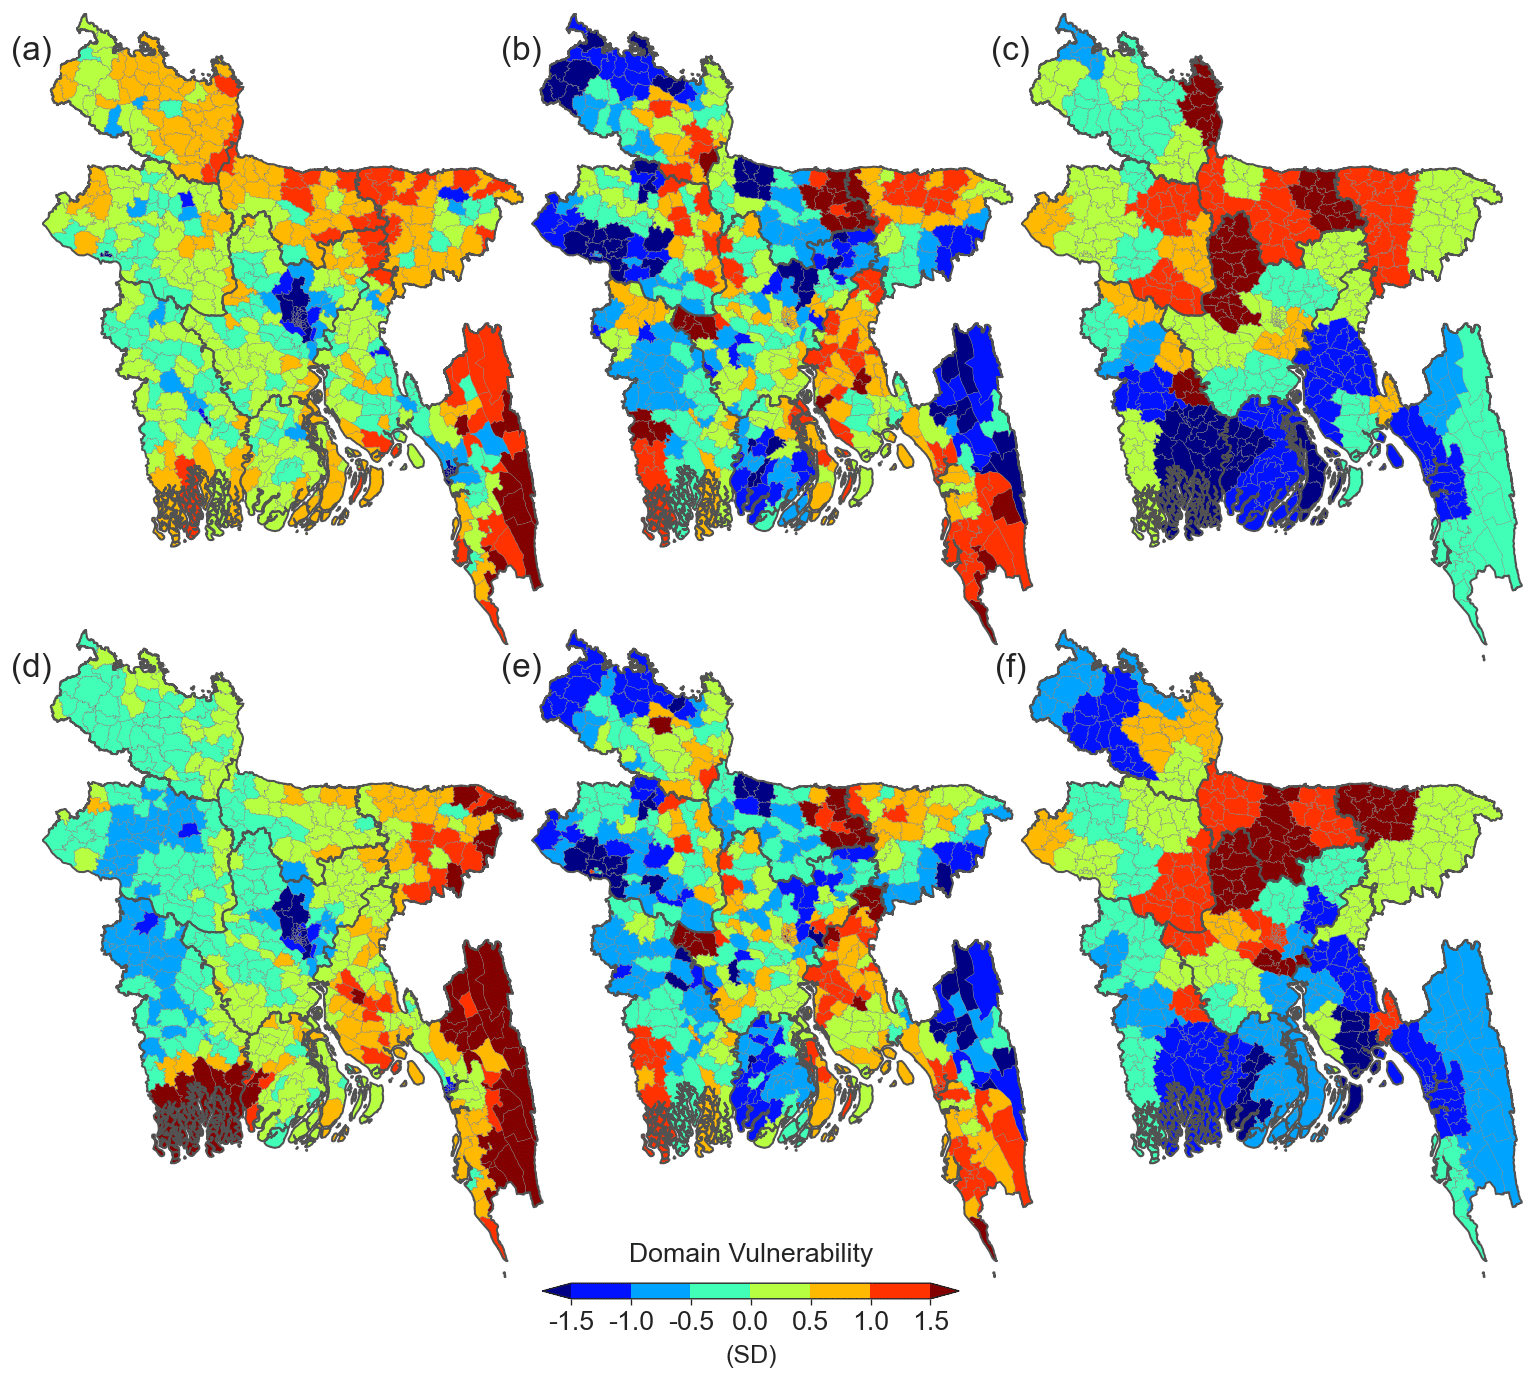
Figure 4The domain vulnerability index of (a, d) socioeconomic, (b, e) health, and (c, f) coping capacity domains using the equal-weight (a–c) and PCA (d–f) approaches. The unit is the standard deviation (SD) from the mean.
In general, socioeconomic domain indicators are positively correlated with each other. In particular, demographic and built-environment indicators have a significantly positive correlation with most socioeconomic indicators. Within the socioeconomic domain, only the ratios of ethnic population and rented houses exhibit some negative correlation with other socioeconomic indicators. The socioeconomic domain indicators show little correlation with district-level indicators in other domains, which may be due to reduced variability through the upscaling process. In the health domain, the number of hospital beds (number of physicians) show significantly positive (negative) correlations with most socioeconomic indicators. However, the percentage of the population who suffered from disease or experienced diarrhea from disaster are poorly correlated with other indicators. The coping capacity domain includes indicators that represent historic flood impacts, such as the number of households affected by floods and the number of children not attending school due to disasters. These indicators present positive correlations with indicators in the socioeconomic domain, including the percentage of weak population, building materials, electricity, literacy, and education level, which may imply their root causes. The indicator for households with disaster knowledge and perceptions does not correlate well with any other indicators due to its relatively low variability across districts.
4.2 Vulnerability assessment
Spatial representation of the DV index is determined using the equal-weight and PCA approaches for each of the three domains: socioeconomic, health, and coping capacity (Fig. 4). In the PCA analysis, three PCs are included in the socioeconomic and coping capacity domains, and two PCs are retained in the health domain per the eigenvalue criterion (Fig. S2).
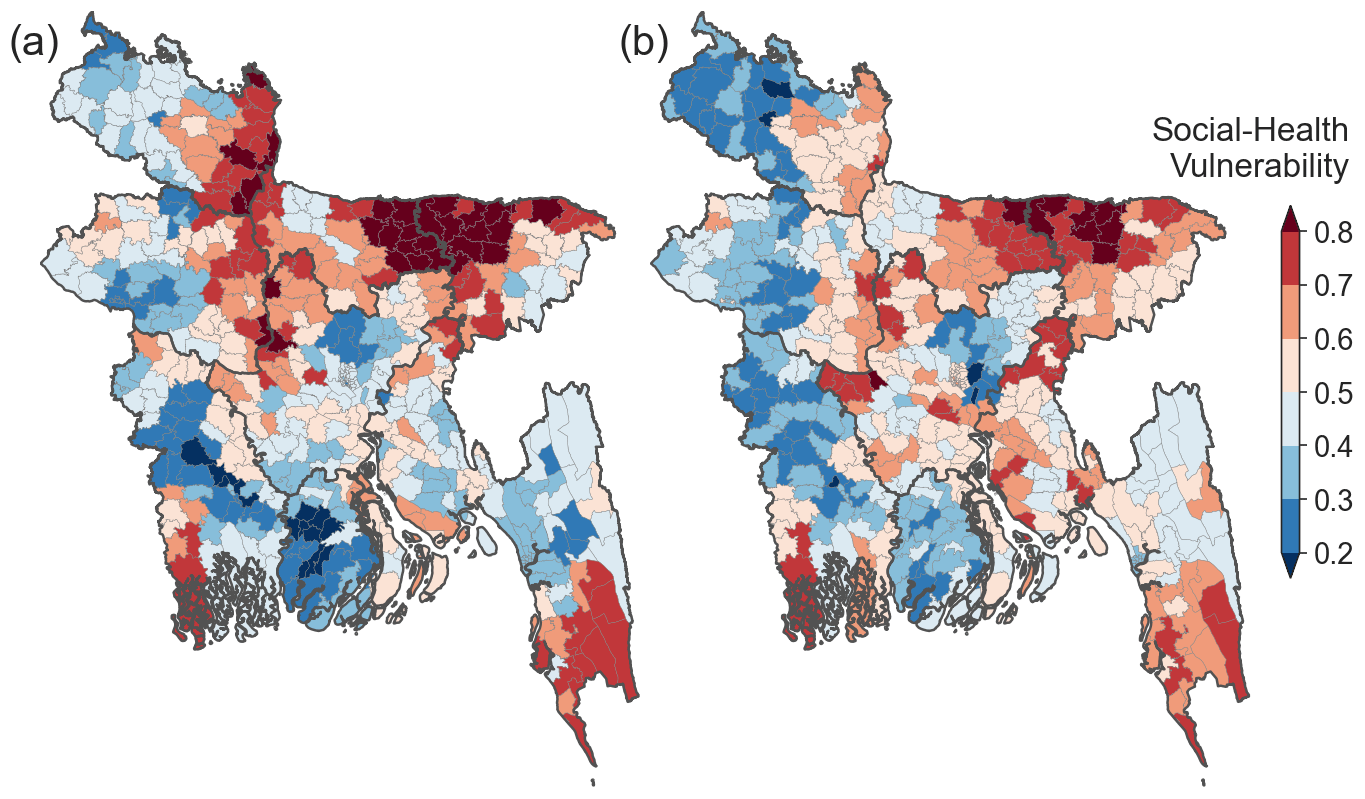
Figure 5The SHV index score estimated by (a) the equal-weight and (b) PCA approaches.
Both socioeconomic DVs based on the two approaches clearly represent the expected demographic, social, and economic characteristics of major cities; for example, lower vulnerability (standard deviation (SD) < −1.0) near the country center (Dhaka; capital city) and the southeast coast (Chittagong; the second largest city) and high vulnerability (SD > 1.0) in the northeast floodplain and sparsely populated southeast region (Fig. 4a and d). While the equally weighted socioeconomic DV results in relatively high vulnerabilities in the northern and northwestern regions, the PCA-based socioeconomic DV exhibits medium vulnerabilities in these regions. Interestingly, the first PC of the socioeconomic domain has a very similar pattern with the equally weighted socioeconomic DV (r=0.87), which implies that the equally weighted socioeconomic DV reflects the pattern with the largest variance of the variables; however, this is modulated by the other two PCs representing a relatively lower vulnerability for these regions (Fig. S2a). The PCA-based socioeconomic DV also produces exceptionally high vulnerabilities (SD > 1.5) in the southwestern coastal and southeastern mountain regions due to the second PC pattern (Figs. 4 and S2b).
The health DV exhibits very similar patterns between the two approaches (r=0.91). Relatively high health DVs are found in the northeastern floodplains, northwestern riverine areas, and southeastern regions (Fig. 4b and e). The coping capacity DV also expresses very similar patterns between the two approaches (r=0.84). The central and northern regions are highly vulnerable, while the southern regions are relatively less vulnerable. The second PC of the coping capacity DV produces the highest correlation (r=0.58) with the equally weighted coping capacity DV (Figs. 4c and S2g). Given equivalent prioritization of all three domains, regions with relatively high vulnerability in all domains tend to have high SHV scores, such as in the northeastern floodplains (Fig. 5). The major difference between the two approaches appears in the northwestern riverine regions; while the equal-weight approach indicates a relatively higher vulnerability (≥0.7), the PCA approach yields moderate vulnerability ranging from 0.4 to 0.6 (Fig. 5). As discussed above, this difference is mainly due to a relatively lower socioeconomic DV in the PCA approach (Fig. 4d).
For both approaches, vulnerable zones (≥0.6) appear proximal to major rivers and tributaries from northwest to central Bangladesh, and more broadly across low floodplains in the northeast (Haor basin; Fig. 5). Although we did not include any physical factors (e.g., proximity to river), this could imply that historical floods have led to the disruption and depreciation of riverine communities. The identification of the Haor region as vulnerable provides confidence in the framework, although not surprising given that Haor is typically flooded for 7–8 months each year and generally has a low socioeconomic status (ACAPS, 2014; Start Network, 2018). High socioeconomic, health, and coping capacity DVs (Fig. 4) contribute to this elevated vulnerability (SHV ≥ 0.8) as measured across the region by both approaches. There are also highly vulnerable zones around the southeastern border between Bangladesh and Myanmar, which are sparsely populated with high socioeconomic DVs (ACAPS, 2014) (Figs. 4 and 5)
Low (<0.4) and very low (<0.2) SHV scores exist for densely populated areas, such as Dhaka, Chittagong, and the southwestern regions (Khulna division) where socioeconomic, health, and coping capacity DVs are typically low (Figs. 4 and 5). Southern coastal regions are often classified as vulnerable regions due to periodical coastal hazards and cyclones; however, both approaches present very low coping capacity DVs () in these regions (Fig. 4). This is because our coping capacity indicators have included existing active disaster management practices and financial supports from agencies in those regions that have resulted in low coping capacity DV and SHV scores.
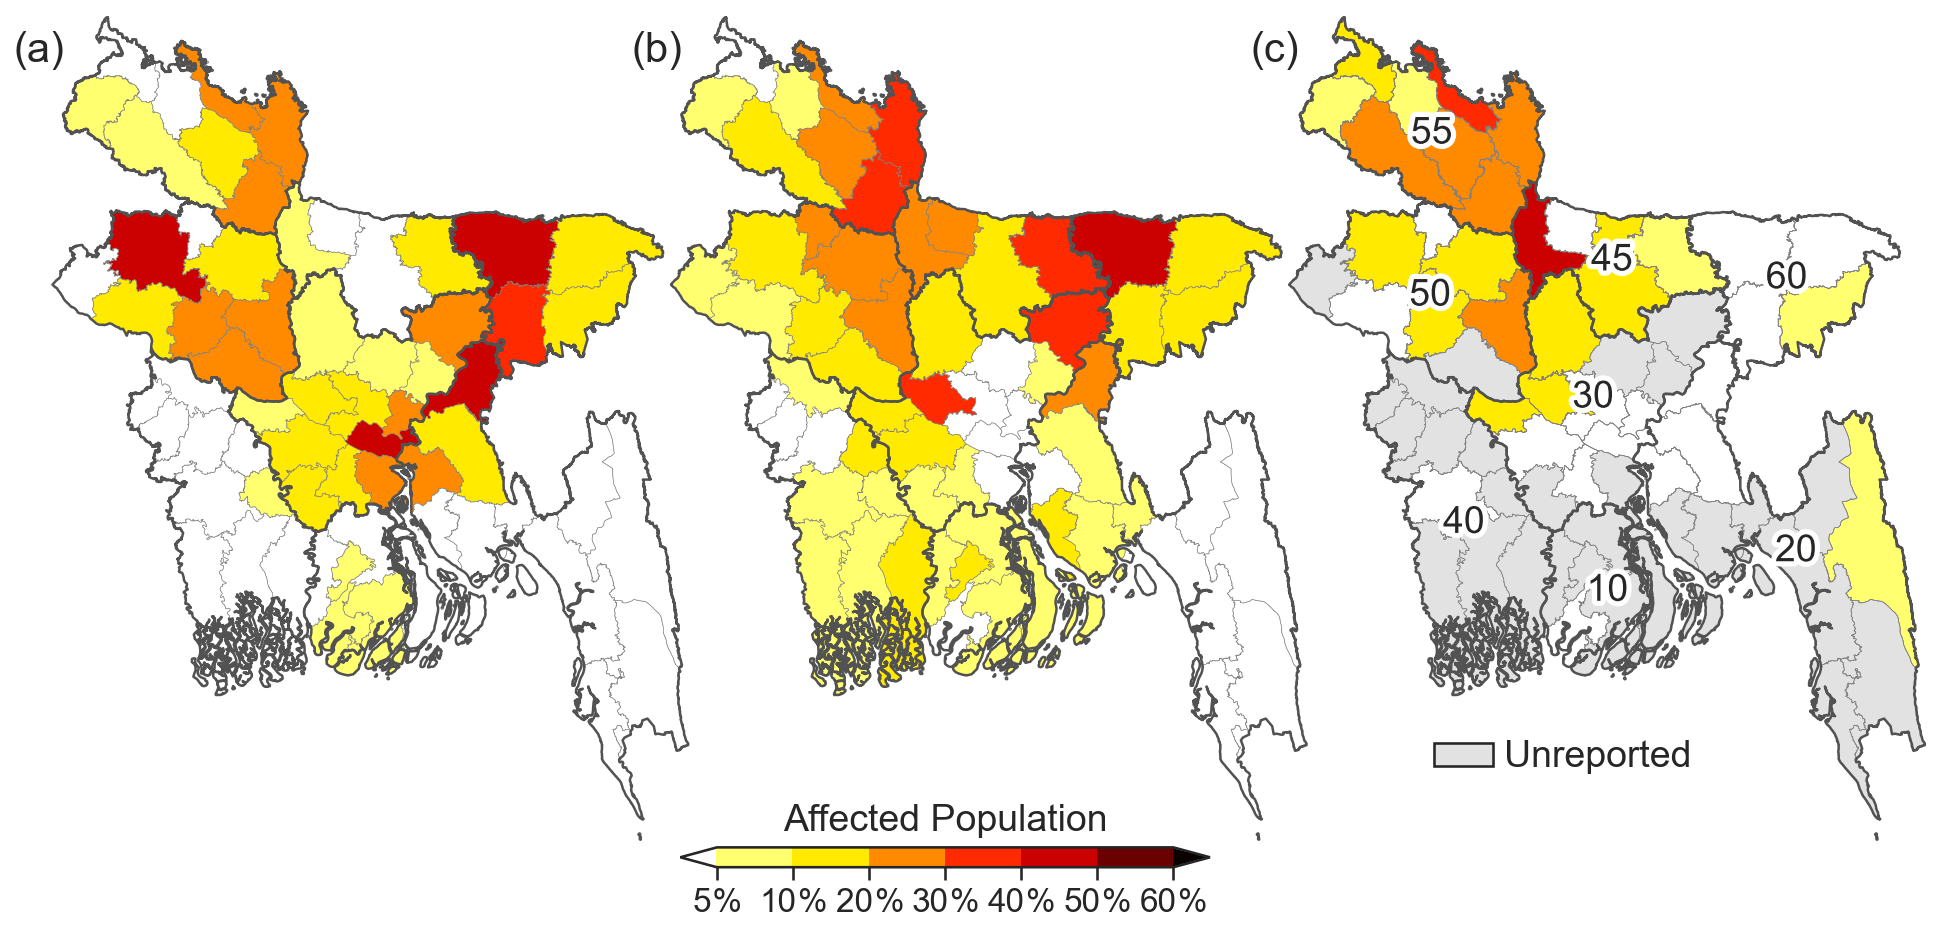
Figure 6Percentage of affected population from (a) flood forecast, (b) satellite inundation, and (c) post-disaster reports. The division codes are Barisal (10), Chittagong (20), Dhaka (30), Khulna (40), Mymensingh (45), Rajshahi (50), Rangpur (55), and Sylhet (60).
On average, considering considering both approaches, half of the country (45 %) is classified as moderately vulnerable (0.4 ≤ SHV < 0.6), with the remaining 55 % split between high vulnerability zones (SHV ≥ 0.6), including 42 million people or 26 % of the population, and low vulnerability zones (SHV < 0.4), with 46 million people or 29 % of the population. As proposed in the framework (Fig. 2), DV and SHV indices can also be merged with physical flood information to assess the predictability of flood impacts. However, identifying highly vulnerable zones based solely on indicators is also informative for government and relief agencies to enhance the resilience of these regions through long-term management practices.
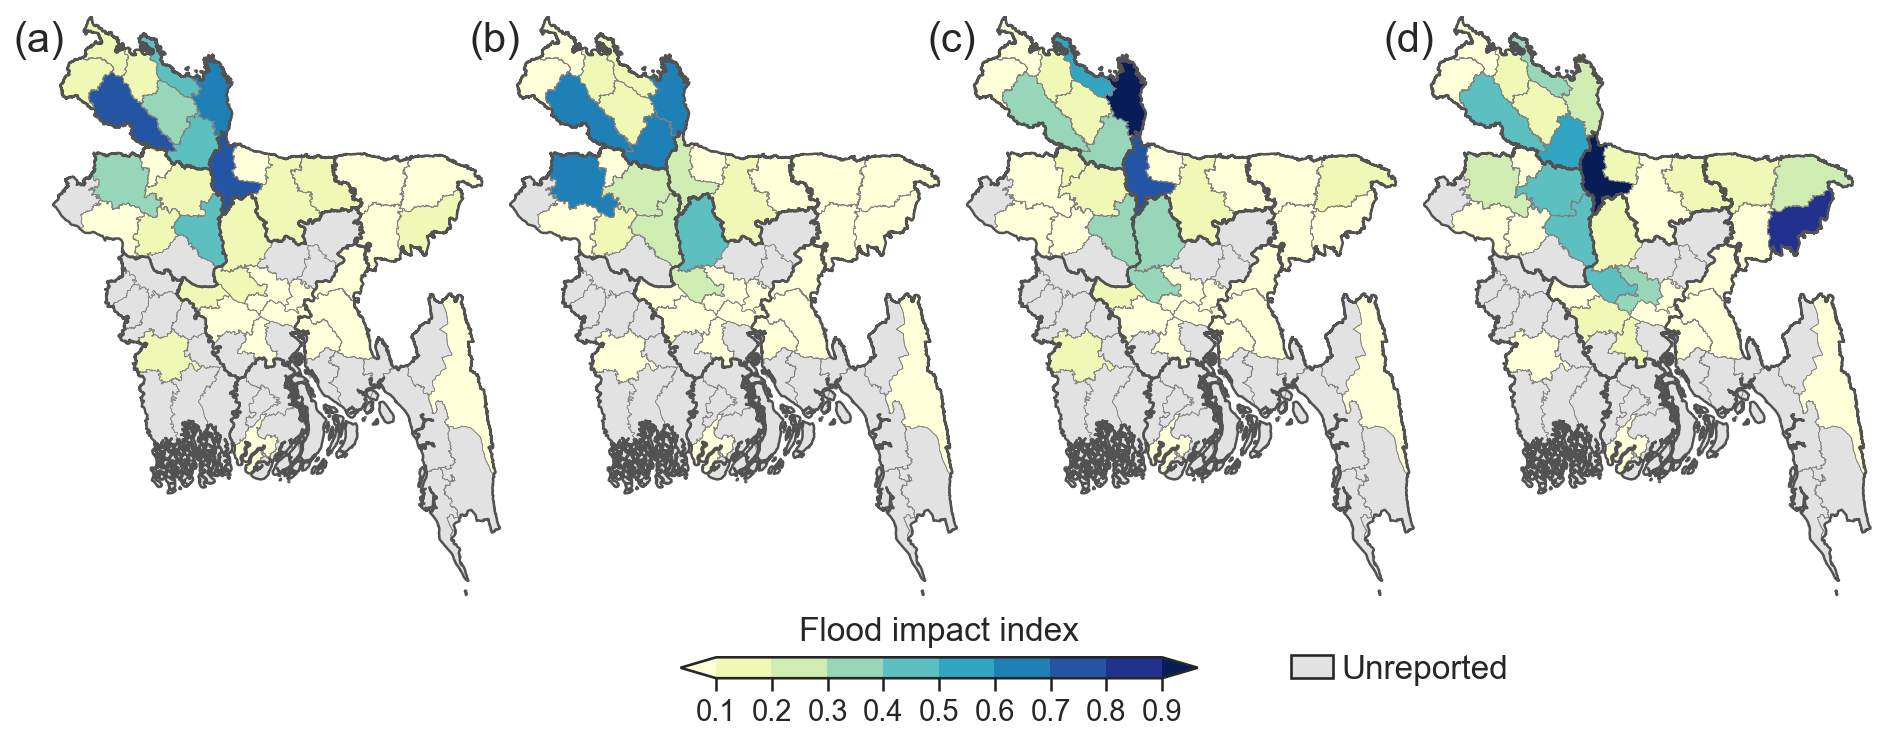
Figure 7Impact index maps of the August 2017 flood event for (a) distress, (b) damage, (c) disruption, and (d) health.
4.3 Impact assessment
For the August 2017 event, flood forecast and satellite inundation estimates indicate that 16.8 (10.6 %) and 15.3 (9.7 %) million people nationally were impacted from flood inundation, respectively. Post-disaster reports claim 9.2 million (5.8 %) people were impacted (Fig. 6). This overestimation of the affected population is likely attributable to the simplified approaches and a lack of data on flood management and properties. For example, the two approaches adopted here do not consider the level of flood protection (e.g., embankment, levee, and early warning) but rather assume that all regions have an equivalent level of protection and management. Furthermore, the current flood forecasts and satellite inundation information do not provide specific physical flood properties, such as duration of the flood, which is a key factor in increasing flood impacts, as indicated in the post-flood reports. Geographical contexts may also contribute to this discrepancy. For example, both forecasts and satellite information estimate a high number of affected people in the northeastern floodplain (i.e., Haor region), whereas a relatively low percentage of affected population is reported (Fig. 6). This region is known to be highly vulnerable to flooding, but home styles and small households (lowest population density in Bangladesh) are well adapted to regular monsoon floods (ACAPS, 2014). At the Upazila scale (Fig. S3), impacted population estimates from these two sources differ. For example, relatively highly affected populations appear near major rivers based on the forecast, such as the Jamuna (northwest) and Meghna (northeast) rivers; however, the satellite information illustrates a highly affected population more broadly around riverine areas. Spatially, satellite-based estimates correlate better with the reported affected population (r=0.6) than the forecast-based result (r=0.1). Specifically, satellite inundation captures severely flooded regions in the northwest, as reported.
Four indices of flood impact records (distress, damage, disruption, and health) are normalized and compared to the tailored district level SHVs and DVs (Figs. 7 and S4; Table 4). According to post-flood reports, the August 2017 event had a significant impact on the northwestern regions (Rangpur, Rajshahi, and Mymensingh divisions). Generally, the equal-weight approach produces higher correlations than the PCA approach (Fig. S4). This is mainly attributable to the relatively low socioeconomic DV score in the PCA approach for the northwest region. The forecast- and satellite-based DVs correlate similarly with the four indices from the two approaches, although the forecast-based DVs are marginally higher, and correlations with equal weights are notably higher than for the PCA approach (Table 4). Again, the moderate vulnerability of the PCA approach on the northwestern regions substantially depreciates its correlations with overall flood impact indices (Figs. 5 and 7).
Table 4Correlation between SHV and domain vulnerability and observed flood impact indices.
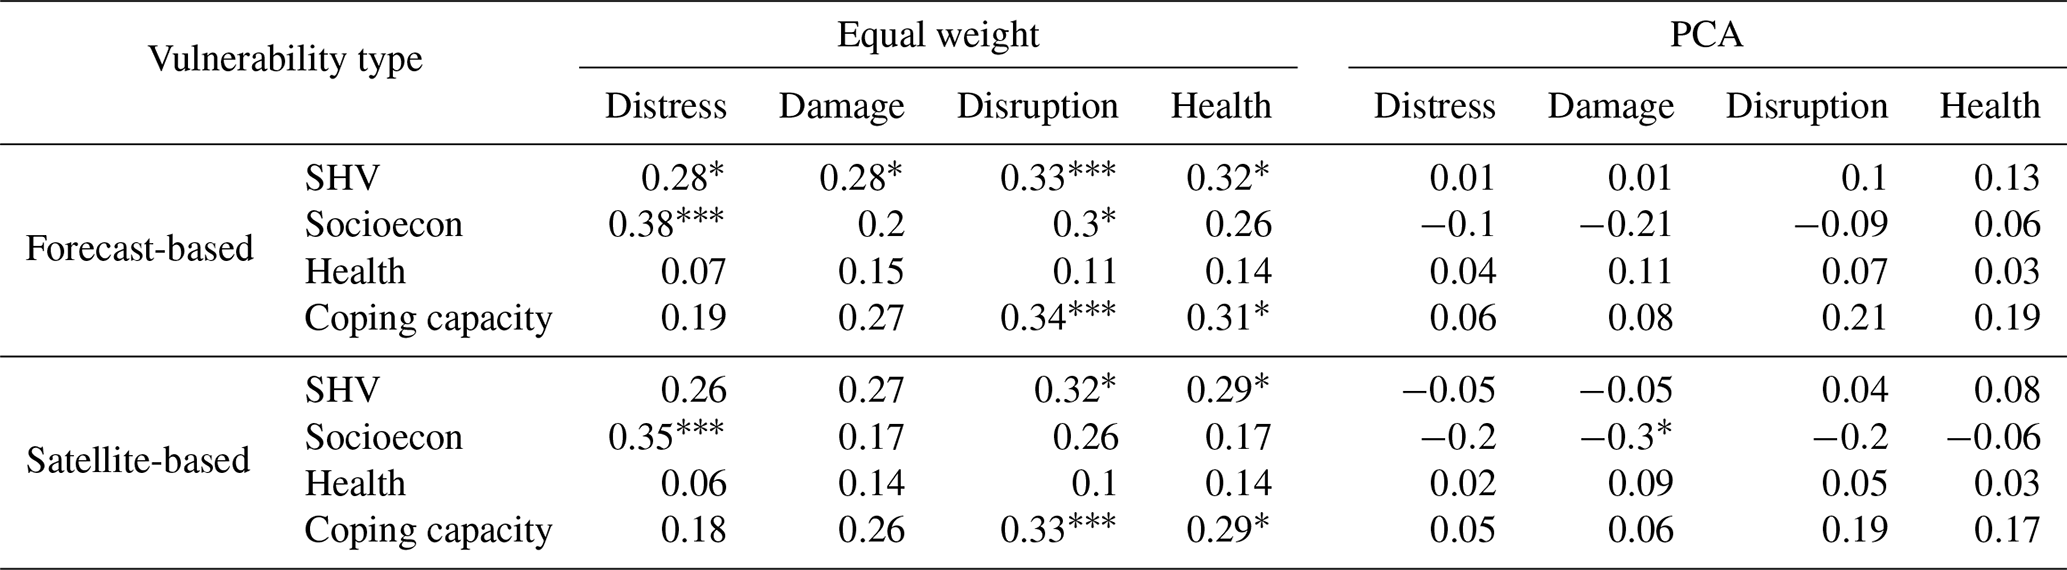
p<0.01. p<0.05. * p<0.1.
Specifically, the forecast-based socioeconomic DV spatially correlates well with the equal-weight approach indices, statistically significantly capturing the distress (r=0.38) and disruption (r=0.3) impact indices. For the same comparison, the coping capacity DV also produces statistically significant correlations with the disruption (r=0.34) and health (r=0.31) impact indices. Surprisingly, the health DV demonstrates a low correlation with the health impact index, which consists of diarrheal and other disease incidents. Given that the causes of disease outbreaks are quite complex (e.g., current vaccines and medical status) and often do not have a simple relationship with hazard (Shahid, 2010), this reiterates that considering a capability to prepare for and manage natural disasters may provide a better indication of the likelihood of flood-induced health impacts and epidemics as discussed by previous studies (Hashizume et al., 2008; Kunii et al., 2002; Schwartz et al., 2006).
Overall, the forecast-based SHV index is statistically significantly correlated with all types of flood impact indices (Table 4). This could play a critical role in disaster management by indicating comprehensive impacts across multiple sectors.
This study presents the development of flood-induced social and health vulnerability measures and evaluates the predictability of flood impacts by linking vulnerability measures to flood forecast and satellite inundation information. Vulnerability domains and indicators are developed at the Upazila level for Bangladesh based on a literature review as well as three domain vulnerability (DV) (socioeconomic, health, and coping capacity) and a composite social-health vulnerability (SHV) indices that are spatially constructed using both the equal-weight and PCA approaches (Figs. 4 and 5). The DV and SHV are scaled up to the district level conditioned on affected population weights estimated from flood forecast and satellite inundation information. The predictability of flood impacts is assessed by comparing the tailored vulnerability measures with observed flood impact indices (distress, damage, disruption, and health) aggregated from post-disaster reports on the August 2017 flood. Such an evaluation has not been previously undertaken.
The proposed approach shows promising results. First, we find highly (SHV ≥ 0.6) and very highly (SHV ≥ 0.8) vulnerable zones near the northwest riverine areas, northeast floodplains, and southwest region covering 42 million people (26 % of the total population); most indicators illustrate consistently high vulnerability levels (Fig. 5). A spatial discrepancy in SHV between the equal-weight and PCA approaches in the northwest riverine regions is evident, however, it is mainly attributable to the socioeconomic DV.
The affected population by the August 2017 flood event is estimated using flood forecast and satellite inundation information (Fig. 6). Although both sources overestimate the affected population due to a lack of information, such as flood protection and management and duration of the flood, the satellite-based information exhibits a fairly consistent spatial pattern with the reported population (r=0.6). Given that the socioeconomic DV is strongly correlated with the distress impact index, which includes the number of affected people and deaths (Table 4), the inclusion of a socioeconomic DV to represent the level of overall flood protection and management is warranted. For this analysis, the equal-weight approach has a stronger relationship with flood impact indices than the PCA approach (Table 4). Specifically, the socioeconomic DV reflects the distress impact, and the coping capacity DV captures disruption and health impacts. This suggests that thematic vulnerability can play an important role in contextualizing flood impacts.
Although the health vulnerability measure consists of indicators related to previous disease incidents, lack of drinking water, hospital capacity, and health workforce, it does not reflect well the observed health impact. However, the coping capacity DV does, suggesting that low resilience and lack of recovery mechanisms may better represent the potential for flood-induced disease outbreaks. Overall, the forecast-based SHV index exhibits a significant relationship with all flood impact indices, demonstrating its usefulness in identifying vulnerable regions. Satellite-based vulnerability measures are also promising, which may be especially useful for countries with limited capacity to build flood forecast systems. Whereas these tailored vulnerability measures can support pre- and post-flood disaster management activities, the original vulnerability measures based solely on the indicators (Fig. 5) can support identification of areas requiring long-term investment and management plans to reduce particular aspects of vulnerability. Additionally, given that current post-disaster reports include only disaster-related statistics at the district level (BBS, 2016; NIRAPAD, 2017a), the Upazila-level vulnerability measures developed in this study can provide more specific and useful information as thematic or comprehensive vulnerability and resiliency measures.
In this study, we assess three domain vulnerabilities and a composite social-health vulnerability for all of Bangladesh. Results indicate that vulnerable zones exist in the northwest riverine areas, northeast floodplains, and southwest region, potentially affecting 42 million people (26 % of the total population). Then, for the first time, we incorporate predictive information (flood forecast and satellite inundation) into the vulnerability and validate it with the recent catastrophic August 2017 flood event. Our findings suggest that the both forecast- and satellite-based vulnerabilities can better inform observed flood impacts.
Compared to conventional and existing approaches, the approach and vulnerability measures developed here have unique advantages and contributions. First, our approach covers all of Bangladesh at high resolution (Upazila). While local studies provide more specific analyses (e.g., key vulnerability factors within a city), our scale and resolution can support national-level assessment and management when massive monsoon floods affect most of the country. Second, given the lead time of flood forecasts, the predicted vulnerability can dynamically anticipate flood impacts and actively support pre- and post-disaster management rather than being applied as the static vulnerability data that conventional approaches provide. We also demonstrate, through a validation, that the thematic (domain) vulnerability can better estimate a particular aspect of flood impacts. This can potentially facilitate tailored management actions, such as prioritizing different resources (e.g., foods, cash, medical supplies, and volunteers), for the given location.
We note that the proposed framework has been validated with a single observed flood event and additional validation using more flood events is warranted. Furthermore, the validation process could be improved using up-to-date data, indicators, and flood records across the country to enhance management practices. Specifically, more detailed post-disaster impact records at the local level (e.g., Upazila scale) may improve future vulnerability and risk assessments and impact predictions. Flood forecasts have clear value; however, producing local-scale information may pose challenges in countries with limited resources; existing global-scale forecasts may be able to fill this role and should be evaluated (Alfieri et al., 2013; Emerton et al., 2018). Understanding the prospects for extending forecast lead times is also warranted and may facilitate more proactive disaster management practices (Coughlan de Perez et al., 2015). Finally, integrating more physical flood information and models to estimate the affected population may enhance flood impact predictions.
Although this study includes Bangladesh as a single case study country, the proposed approach may be transferable to different countries where sufficient data are available. Specifically, given that this approach focuses on social and health vulnerability, the demographic and socioeconomic components of vulnerability require at least sub-national level census data. In addition, data on observed flood impacts (i.e., post-disaster reports) are required to validate this approach at other locations. Integrating this approach systematically with a flood forecast system, such as a web-based tool, may be of further value to international and local disaster managers. Overall, this study provides the groundwork for the development of a multi-sectoral (flood and health) risk warning system. Actionable flood and health risk predictions can radically improve existing disaster management practices of NGOs and other private and public organizations and save lives and resources by providing advanced preparedness and response strategies.
The original data of vulnerability indicators are publicly available (see Sect. 2.1). The processed and completed indicators and vulnerabilities are available on Zenodo: https://doi.org/10.5281/zenodo.4718085 (Lee et al., 2021). The flood forecast and inundation data can be requested from the corresponding author.
The supplement related to this article is available online at: https://doi.org/10.5194/nhess-21-1807-2021-supplement.
The manuscript and its methodology were conceptualized and developed by DL and PB; the data processing, analyses, and visualization were carried out by DL. The original draft was prepared by DL and PB; further reviewing and editing was carried out by DL, PB, JP, and HA.
The authors declare that they have no conflict of interest.
The lead author would like to thank Arifuzzaman Bhuyan at the FFWC for providing the flood forecast data.
This research is partially funded by the Global Health Institute (GHI) of the University of Wisconsin-Madison, the Wisconsin Alumni Research Foundation (WARF) – UW2020, and NASA project NNX17AC50G.
This paper was edited by Olga Petrucci and reviewed by two anonymous referees.
ACAPS: Bangladesh Pre-disaster Secondary Data Review: Haor Flooding, Tech. rep., available at: https://reliefweb.int/sites/reliefweb.int/files/resources/pre_disaster_secondary_data_haor_flooding.pdf (last access: 10 June 2021), 2014. a, b, c
Ahern, M., Kovats, R. S., Wilkinson, P., Few, R., and Matthies, F.: Global health impacts of floods: Epidemiologic evidence, Epidemiol. Rev., 27, 36–46, https://doi.org/10.1093/epirev/mxi004, 2005. a
Ahsan, M. N. and Warner, J.: The socioeconomic vulnerability index: A pragmatic approach for assessing climate change led risks – A case study in the south-western coastal Bangladesh, Int. J. Disast. Risk Reduct., 8, 32–49, https://doi.org/10.1016/j.ijdrr.2013.12.009, 2014. a, b, c
Akanda, A. S., Jutla, A. S., Alam, M., De Magny, G. C., Siddique, A. K., Sack, R. B., Huq, A., Colwell, R. R., and Islam, S.: Hydroclimatic influences on seasonal and spatial cholera transmission cycles: Implications for public health intervention in the Bengal Delta, Water Resour. Res., 47, 1–11, https://doi.org/10.1029/2010WR009914, 2011. a
Alderman, K., Turner, L. R., and Tong, S.: Floods and human health: A systematic review, Environ. Int., 47, 37–47, https://doi.org/10.1016/j.envint.2012.06.003, 2012. a, b
Alfieri, L., Burek, P., Dutra, E., Krzeminski, B., Muraro, D., Thielen, J., and Pappenberger, F.: GloFAS – global ensemble streamflow forecasting and flood early warning, Hydrol. Earth Syst. Sci., 17, 1161–1175, https://doi.org/10.5194/hess-17-1161-2013, 2013. a
Batterman, S., EIsenberg, J., Hardin, R., Kruk, M. E., Lemos, M. C., Michalak, A. M., Mukherjee, B., Renne, E., Stein, H., Watkins, C., and Wilson, M. L.: Sustainable control of water-related infectious diseases: A review and proposal for interdisciplinary health-based systems research, Environ. Health Perspect., 117, 1023–1032, https://doi.org/10.1289/ehp.0800423, 2009. a
BBS: Poverty Maps of Bangladesh 2010: Technical Report, Tech. Rep. 22062, World Bank, World Food Programme, Bangladesh Bureau of Statistics, available at: http://hdl.handle.net/10986/20785 (last access: 10 June 2021), 2010. a
BBS: Population and Housing Census: Vol4, Socio-economic and Demographic report, Tech. rep., BBS – Bangladesh Bureau of Statistics, Dhaka, Bangladesh, 2015. a, b, c, d, e, f, g, h, i, j, k, l, m, n, o
BBS: Bangladesh: Disaster-related Statistics 2015: Climate Change and Natural Disaster Perspectives, Bangladesh Bureau of Statistics, available at: http://data.bbs.gov.bd/index.php/catalog/161 (last access: 15 April 2021), 2016. a, b, c, d, e, f, g, h, i, j, k, l
BBS: Disaster prone area atlas of Bangladesh: Barguna zila, Tech. rep., BBS – Bangladesh Bureau of Statistics, Ministry of Planning, Bangladesh, Dhaka, 2018. a, b
Birkmann, J.: Danger need not spell disaster But how vulnerable are we?, Tech. Rep. 1, available at: https://collections.unu.edu/view/UNU:3105 (last access: 10 June 2021), 2005. a
Birkmann, J.: Measuring vulnerability to natural hazards: Towards disaster resilient societies, in: vol. 02, United Nations University, New York, 2006. a
CEGIS: Analytical framework for the planning of Integrated Water Resources Management, December, CEGIS – Center for Environmental and Geographic Information Systems, Dhaka, Bangladesh, 2003. a
Colston, J., Olortegui, M. P., Zaitchik, B., Yori, P. P., Kang, G., Ahmed, T., Bessong, P., Mduma, E., Bhutta, Z., Shrestha, P. S., Lima, A., and Kosek, M.: Pathogen-specific impacts of the 2011–2012 La Niña-associated floods on enteric infections in the MAL-ED Peru Cohort: A comparative interrupted time series analysis, Int. J. Environ. Res. Publ. Health, 17, 487, https://doi.org/10.3390/ijerph17020487, 2020. a
Coughlan de Perez, E., van den Hurk, B., van Aalst, M. K., Jongman, B., Klose, T., and Suarez, P.: Forecast-based financing: an approach for catalyzing humanitarian action based on extreme weather and climate forecasts, Nat. Hazards Earth Syst. Sci., 15, 895–904, https://doi.org/10.5194/nhess-15-895-2015, 2015. a
Cutter, S. L., Boruff, B. J., and Shirley, W. L.: Social Vulnerability to Environmental Hazards, Social Sci. Quart., 84, 242–261, https://doi.org/10.1111/1540-6237.8402002, 2003. a, b, c
DDM: Final report of multi hazard risk and vulnerability assessment, modeling and mapping in Bangladesh: Vol. I, Hydro-meteorological hazard assessment, Tech. rep., Dhaka, Bangladesh, available at: https://geodash.gov.bd/documents/753 (last access: 10 June 2021), 2017. a, b
Dewan, A. M.: Floods in a megacity: Geospatial techniques in assessing hazards, risk and vulnerability, in: Floods in a Megacity: Geospatial Techniques in Assessing Hazards, Risk and Vulnerability, chap. 6, Springer Netherlands, Dordrecht, 1–199, https://doi.org/10.1007/978-94-007-5875-9, 2013. a, b, c, d
DGHS: Bangladesh Health-National Adaptation Plan (HNAP), Tech. rep., Ministry of Health and Family Welfare, Government of the People's Republic of Bangladesh, Bangladesh, 2018. a
DGHS: Health situation and interventions in flood affected areas of Bangladesh, 2017, available at: http://dashboard.dghs.gov.bd/webportal/pages/flood_affected_situation.php, last access: 24 November 2020. a, b, c
Doocy, S., Daniels, A., Murray, S., and Kirsch, T. D.: The human impact of floods: a historical review of events 1980–2009 and systematic literature review, PLoS Currents, available at: https://apps.who.int/iris/handle/10665/268903 (last access: 10 June 2021), 2013. a
Du, W., Fitzgerald, G. J., Clark, M., and Hou, X. Y.: Health impacts of floods, Prehospit. Disast. Med., 25, 265–272, https://doi.org/10.1017/S1049023X00008141, 2010. a
Emerton, R., Zsoter, E., Arnal, L., Cloke, H. L., Muraro, D., Prudhomme, C., Stephens, E. M., Salamon, P., and Pappenberger, F.: Developing a global operational seasonal hydro-meteorological forecasting system: GloFAS-Seasonal v1.0, Geosci. Model Dev., 11, 3327–3346, https://doi.org/10.5194/gmd-11-3327-2018, 2018. a
Fekete, A.: Validation of a social vulnerability index in context to river-floods in Germany, Nat. Hazards Earth Syst. Sci., 9, 393–403, https://doi.org/10.5194/nhess-9-393-2009, 2009. a, b
FFWC: Annual Flood Report 2017, Tech. rep., Flood Forecasting and Warning Center (FFWC), Bangladesh Water Development Board (BWDB), Dhaka, Bangladesh, available at: http://www.ffwc.gov.bd/images/annual17.pdf (last access: 10 June 2021), 2018. a, b, c
Gain, A. K., Mojtahed, V., Biscaro, C., Balbi, S., and Giupponi, C.: An integrated approach of flood risk assessment in the eastern part of Dhaka City, Nat. Hazards, 79, 1499–1530, https://doi.org/10.1007/s11069-015-1911-7, 2015. a, b, c
Hashizume, M., Wagatsuma, Y., Faruque, A. S., Hayashi, T., Hunter, P. R., Armstrong, B., and Sack, D. A.: Factors determining vulnerability to diarrhoea during and after severe floods in Bangladesh, J. Water Health, 6, 323–332, https://doi.org/10.2166/wh.2008.062, 2008. a, b, c
Hoque, M. A. A., Tasfia, S., Ahmed, N., and Pradhan, B.: Assessing spatial flood vulnerability at kalapara upazila in Bangladesh using an analytic hierarchy process, Sensors, 19, 1302, https://doi.org/10.3390/s19061302, 2019. a, b, c
Islam, A. N., Deb, U. K., Al Amin, M., Jahan, N., Ahmed, I., Tabassum, S., Ahamad, M. G., Nabi, A., Singh, N. P., Kattarkandi, B., and Bantilan, C.: Vulnerability to Climate Change: Adaptation Strategies and Layers of Resilience Quantifying Vulnerability to Climate Change in Bangladesh, Tech. rep., ICRISAT – International Crops Research Institute for the Semi-Arid Tropics, Telangana, India, available at: http://oar.icrisat.org/8117/ (last access: 10 June 2021), 2013. a, b, c
Jonkman, S. and Vrijling, J.: Loss of life due to floods, J. Flood Risk Manage., 1, 43–56, 2008. a
Kaiser, H. F.: The Application of Electronic Computers to Factor Analysis, Educ. Psychol. Meas., 20, 141–151, https://doi.org/10.1177/001316446002000116, 1960. a
Kienberger, S., Lang, S., and Zeil, P.: Spatial vulnerability units – Expert-based spatial modelling of socio-economic vulnerability in the Salzach catchment, Austria, Nat. Hazards Earth Syst. Sci., 9, 767–778, https://doi.org/10.5194/nhess-9-767-2009, 2009. a
Kosek, M., Bern, C., and Guerrant, R. L.: The global burden of diarrhoeal disease, as estimated from studies published between 1992 and 2000, Bull. World Health Organiz., 81, 197–204, 2003. a
Kovats, R. S., Bouma, M. J., Hajat, S., Worrall, E., and Haines, A.: El Niño and health, Lancet, 362, 1481–1489, https://doi.org/10.1016/S0140-6736(03)14695-8, 2003. a
Kundzewicz, Z. W. and Kundzewicz, W. J.: Mortality in Flood Disasters, in: Extreme Weather Events and Public Health Responses, edited by: Kirch, W., Bertollini, R., and Menne, B., Springer, Berlin, Heidelberg, https://doi.org/10.1007/3-540-28862-7_19, 2005. a
Kundzewicz, Z. W. and Takeuchi, K.: Flood protection and management: quo vadimus?, Hydrolog. Sci. J., 44, 417–432, 1999. a
Kunii, O., Nakamura, S., Abdur, R., and Wakai, S.: The impact on health and risk factors of the diarrhoea epidemics in the 1998 Bangladesh floods, Publ. Health, 116, 68–74, https://doi.org/10.1038/sj.ph.1900828, 2002. a, b
Lee, D., Ahmadul, H., Patz, J., and Block, P.: Supplementary data to “Predicting social and health vulnerability to floods in Bangladesh” (Version 1.0) [Data set], Zenodo, https://doi.org/10.5281/zenodo.4718085, 2021. a
Mahhzab, M.: Lagging Districts Development: Background Study Paper for Preparation of the Seventh Five-Year Plan, Tech. rep., BIDS – Bangladesh Institutue of Development Studies, Dhaka, Bangladesh, 2015. a
Mani, M. S. and Wang, L.: Climate Change and Health Impacts: How Vulnerable is Bangladesh and What Needs to be Done?, Tech. rep., World Bank Group, Washington, DC, available at: http://hdl.handle.net/10986/21820 (last access: 10 June 2021), 2014. a
Mazumder, A., Hassan, A., Islam, S., Islam, S., and Ragib Ahsan, M.: Spatial and Temporal Change in Disease Distribution for Climate Change in Bangladesh, in: Climate Change Risk and Adaptation in Bangladesh, chap. 7, edited by: Ahmadul, H. and Parsons, L., Green University Press, Dhaka, 109–115, 2015. a
MHFW: Facility Registry, available at: http://facilityregistry.dghs.gov.bd, last access: 24 November 2020. a
Nahar, N., Blomstedt, Y., Wu, B., Kandarina, I., Trisnantoro, L., and Kinsman, J.: Increasing the provision of mental health care for vulnerable, disaster-affected people in Bangladesh, BMC Publ. Health, 14, 708, https://doi.org/10.1186/1471-2458-14-708, 2014. a
Netherlands Red Cross: Bangladesh Floods – August 2017 – Flooding levels & Vulnerability, available at: https://data.humdata.org/dataset/bangladesh-floods-august-2017-vulnerability-population-density (last access: 10 June 2021), 2017. a
NIRAPAD: Bangladesh: Flood Situation – August 22, 2017, Tech. rep., NIRAPAD, available at: https://reliefweb.int/report/bangladesh/bangladesh-flood-situation-august-22-2017 (last access: 10 June 2021), 2017a. a, b, c, d, e, f, g
NIRAPAD: Overview of Hazard Incidents in August 2017, Tech. rep., NIRAPAD, Dhaka, Bangladesh, available at: https://www.nirapad.org.bd/home/resources/monthlyHazard (last access: 10 June 2021), 2017b. a, b
Patnaik, U. and Narayanan, K.: Vulnerability and Climate Change: An Analysis of the Eastern Coastal Districts of India, MPRA Paper 22062, University Library of Munich, Munich Germany, available at: https://ideas.repec.org/p/pra/mprapa/22062.html (last access: 10 June 2021), 2009. a
Rabby, Y. W., Hossain, M. B., and Hasan, M. U.: Social vulnerability in the coastal region of Bangladesh: An investigation of social vulnerability index and scalar change effects, Int. J. Disast. Risk Reduct., 41, 101329, https://doi.org/10.1016/j.ijdrr.2019.101329, 2019. a, b, c
Roy, D. C. and Blaschke, T.: Spatial vulnerability assessment of floods in the coastal regions of Bangladesh, Geomat. Nat. Hazards Risk, 6, 21–44, https://doi.org/10.1080/19475705.2013.816785, 2015. a, b, c, d
Rufat, S., Tate, E., Emrich, C. T., and Antolini, F.: How Valid Are Social Vulnerability Models?, Ann. Am. Assoc. Geogr., 109, 1131–1153, https://doi.org/10.1080/24694452.2018.1535887, 2019. a, b
Saaty, T. L. and Vargas, L. G.: Models, Methods, Concepts & Applications of the Analytic Hierarchy Process, in: vol. 175 of nternational Series in Operations Research & Management Science, Springer US, Boston, MA, https://doi.org/10.1007/978-1-4614-3597-6, 2012. a
Schwartz, B. S., Harris, J. B., Khan, A. I., LaRocque, R. C., Sack, D. A., Malek, M. A., Faruque, A. S., Qadri, F., Calderwood, S. B., Luby, S. P., and Ryan, E. T.: Diarrheal epidemics in Dhaka, Bangladesh, during three consecutive floods: 1988, 1998, and 2004, Am. J. Trop. Med. Hyg., 74, 1067–1073, https://doi.org/10.4269/ajtmh.2006.74.1067, 2006. a, b, c, d
Shahid, S.: Probable impacts of climate change on public health in Bangladesh, Asia-Pacific journal of public health/Asia-Pacific Academic Consortium for Public Health, 22, 310–319, https://doi.org/10.1177/1010539509335499, 2010. a, b, c, d
Start Network: Bangladesh Flooding Disaster Summary Sheet, Tech. rep., available at: https://reliefweb.int/report/bangladesh/bangladesh-flooding-disaster-summary-sheet-20-may-2018 (last access: 10 June 2021), 2018. a
Tapsell, S. M., Penning-Rowsell, E. C., Tunstall, S. M., and Wilson, T. L.: Vulnerability to flooding: health and social dimensions, Philos. T. Roy. Soc. A, 360, 1511–1525, https://doi.org/10.1098/rsta.2002.1013, 2002. a
Uddin, K., Matin, M. A., and Meyer, F. J.: Operational flood mapping using multi-temporal Sentinel-1 SAR images: A case study from Bangladesh, Remote Sens., 11, 1581, https://doi.org/10.3390/rs11131581, 2019. a
UNISDR: Sendai Framework for Disaster Risk Reduction 2015–2030, Tech. rep., available at: http://www.preventionweb.net/publications/view/43291 (last access: 10 June 2021), 2015. a
Villagrán de Léon, J. C.: Vulnerability: a conceptional and methodological review, UNU-EHS – UNU Institute for Environment and Human Security, available at: https://collections.unu.edu/view/unu:1871 (last access: 10 June 2021), 2006. a, b
Villagrán de Léon, J. C.: Rapid assessment of potential impacts of a tsunami: lessons from the Port of Galle in Sri Lanka, UNU-EHS – UNU Institute for Environment and Human Security, available at: https://collections.unu.edu/view/UNU:1876 (last access: 10 June 2021), 2008. a
Ward, P. J., Blauhut, V., Bloemendaal, N., Daniell, E. J., De Ruiter, C. M., Duncan, J. M., Emberson, R., Jenkins, F. S., Kirschbaum, D., Kunz, M., Mohr, S., Muis, S., Riddell, A. G., Schäfer, A., Stanley, T., Veldkamp, I. E., and Hessel, W. C.: Review article: Natural hazard risk assessments at the global scale, Nat. Hazards Earth Syst. Sci., 20, 1069–1096, https://doi.org/10.5194/nhess-20-1069-2020, 2020. a
WHO: Floods in the WHO European Region: health effects and their prevention, WHO Regional Office for Europe, Copenhagen, available at: http://www.euro.who.int/en/health-topics/environment-and-health/Climate-change/publications/2013/floods-in-the-who-european-region-health-effects-and-their- prevention (last access: 10 June 2021), 2013. a, b
World Bank: Population – Bangladesh, World Development Indicators, available at: https://data.worldbank.org/indicator/SP.POP.TOTL?locations=BD (last access: 10 June 2021), 2018. a
Worldpop, Department of Geography and Geosciences University of Louisville, Department de Geographie Universite de Namur, and CIESIN Columbia University: Global High Resolution Population Denominators Project, https://doi.org/10.5258/SOTON/WP00645, 2018. a