the Creative Commons Attribution 4.0 License.
the Creative Commons Attribution 4.0 License.
The role of geomorphology, rainfall and soil moisture in the occurrence of landslides triggered by 2018 Typhoon Mangkhut in the Philippines
Georgina L. Bennett
Adrian J. Matthews
Mark Anthony M. Matera
Fibor J. Tan
In 2018 Typhoon Mangkhut (locally known as Typhoon Ompong) triggered thousands of landslides in the Itogon region of the Philippines. A landslide inventory of the affected region is compiled for the first time, comprising 1101 landslides over a 570 km2 area. The inventory is used to study the geomorphological characteristics and land cover more prone to landsliding as well as the hydrometeorological conditions that led to widespread failure. The results showed that landslides mostly occurred on grassland and wooded slopes of clay superficial geology, predominantly facing east-southeast. Rainfall (Integrated Multi-satellitE Retrievals for Global Precipitation Measurement, IMERG GPM) associated with Typhoon Mangkhut is compared with 33 high-intensity rainfall events that did not trigger regional landslide events in 2018. Results show that landslides occurred during high-intensity rainfall that coincided with the highest soil moisture values (estimated clays saturation point), according to Soil Moisture Active Passive level 4 (SMAP-L4) data. Our results demonstrate the potential of SMAP-L4 and GPM IMERG data for landslide hazard assessment and early warning where ground-based data are scarce. However, other rainfall events in the months leading up to Typhoon Mangkhut that had similar or higher rainfall intensities and also occurred when soils were saturated did not trigger widespread landsliding, highlighting the need for further research into the conditions that trigger landslides in typhoons.
- Article
(16009 KB) - Full-text XML
- BibTeX
- EndNote
Landslides driven by typhoon and monsoon rainfall cause thousands of fatalities and millions of pesos in damage to infrastructure and commerce in the Philippines each year. The Philippines accounts for 46 % of known rainfall-triggered landslides in SE Asia, although it represents only 6 % of the land area (Kirschbaum et al., 2015; Petley, 2012). The climate characteristics, with frequent tropical cyclones and two different monsoon regimes, together with abrupt orography and unstable geologic materials make the terrain prone to multiple-occurrence regional landslide events (MORLEs) (Crozier, 2005). Despite the relevance of the phenomena, the understanding of the triggering conditions and the instability mechanisms associated with rainfall-triggered MORLEs in the Philippines has still received little attention. This combined with a lack of comprehensive landslide inventories results in hazard and risk assessment techniques that still lack accuracy in the country. Landslide hazard maps published to date in the Philippines use a heuristic approach, based on geomorphologic qualitative observations, and consider only worst-case scenarios (Aleotti and Chowdhury, 1999; Corominas et al., 2014).
The understanding of MORLEs and the assessment of their impact relies on the availability of landslide inventories (Crozier, 2005; Martino et al., 2020; Shu et al., 2019). Landslide inventories are key to evaluate the probability of slope failure based on the conditions of previous slope failures and the effects of local terrain conditions across a region and are thus a preliminary step toward landslide susceptibility, hazard and risk assessment (Fell et al., 2008; Guzzetti et al., 2005, 2012). Regardless of their importance, landslide inventories are often not available due to incomplete event records, or as a result of the lack of time and resources to update them, for example, in response to extreme events (Malamud et al., 2004). Mapping landslides across large regions using manual techniques is a highly time consuming task, which is particularly challenging in regions hit by the passage of typhoons, where the area affected by landslides can be up to hundreds of square kilometres and landslide densities very high (e.g. Tseng et al., 2015). Therefore, the use of automatic mapping tools is increasing. The current state of the art of these tools is growing, as algorithms based on different source of satellite data (visible imagery and/or radar) have been developed in the last years (Alvioli et al., 2018a; Borghuis et al., 2007; Kirschbaum and Stanley, 2018; Mondini, 2017; Prakash et al., 2020; Scheip and Wegmann, 2020). Whilst these tools show great potential, especially for the acquisition of inventories after fatal rainfall events, manual mapping is still necessary to collect accurate inventories.
In the Philippines, a nationwide inventory of >12 000 landslides is available (Lagmay et al., 2017). However, most of the landslides are mapped as points rather than polygons, precluding magnitude–frequency analysis, a major component of landslide hazard assessment (Guzzetti et al., 2005). A limited number of studies including the analysis of landslide predisposing and triggering factors in the area of Baguio have been published (Nolasco-Javier et al., 2015; Nolasco-Javier and Kumar, 2019). However, the Philippines lacks more detailed landslide susceptibility studies that may help in local planning. For example, the Philippines Mines and Geosciences Bureau (MGB) hazard map for the area of Itogon (Benguet, Luzon) is based on the most extreme scenario and hence classes most of the region at the highest hazard level, making land use planning difficult.
The analysis of the triggering rainfall conditions is also fundamental to understand MORLEs. The study of landslide-triggering rainfalls has been of interest to the scientific community in recent decades, generating extensive literature. One of the most common approaches for the prediction of landslide-triggering rainfalls is the definition of rainfall thresholds. Rainfall thresholds are used to characterize the rainfall conditions that when reached or exceeded are likely to trigger one or more landslides or torrential flows (De Vita et al., 1998). Different state-of-the-art techniques and methodologies to obtain rainfall thresholds are reviewed by Segoni et al. (2018), while their applications for early warning purposes are assessed by Guzzetti et al. (2020). Two main approaches are used to derive such thresholds: (a) physically based models, where infiltration and hydrologic behaviour of the rainfall over a susceptible soil layer is simulated (e.g. Crosta and Dal Negro, 2003; Godt et al., 2008; Papa et al., 2013); or (b) empirically derived thresholds, based on the analysis of a database of rainfalls using, for example, statistical techniques (e.g. Brunetti et al., 2010; Guzzetti et al., 2007). The thresholds are generally expressed as a correlation between the peak intensity of the rainfall for different rainfall durations or the relationship between the total rainfall versus its duration (usually in the form ), although some authors also include other triggering or antecedent rainfall parameters, as extensively reported by Segoni et al. (2018). Factors such as the location or size of the study area, the intended use of the thresholds, or simply the resources available determine the source of the rainfall data used to construct thresholds. Uncertainties on the source and both spatial and temporal resolution of the data as well as on the methods used to define the rainfall events or the rainfall thresholds will be key to their accuracy (Abancó et al., 2016; Leonarduzzi and Molnar, 2020; Nikolopoulos et al., 2015). Rainfall thresholds are used with early warning purposes in several countries and regions all over the world, although not in the Philippines to date (Guzzetti et al., 2020).
The use of satellite rainfall data for forecasting landslides is still minimal compared to other rainfall data sources, such as rain gauges or weather radar. Rainfall estimates from satellite products tend to underestimate the rainfall measurements, compared to rain gauge measurements, especially during extreme events (Mazzoglio et al., 2019). This is because rain gauges are nearly point measurements (generally corresponding to areas smaller than 1 m2) while satellite measurements are area averaged, for example over an area of 10×10 km for the Integrated Multi-satellite Retrievals for the Global Precipitation Measurement (GPM) mission (IMERG). Therefore, if a rain gauge is located on the path of a particularly intense convective cell, its records will be significantly higher than measurements from satellite products, which are averaged over the area grid cell. Despite these aspects, the usability of satellite products to forecast landslides has been proven, given that the thresholds are derived using the same source of satellite data (Brunetti et al., 2018). In fact, early warning systems based on satellite data are a really powerful tool for developing countries where rain gauges may be scarce or poorly maintained, as well as to implement early warning systems at regional scales and not just at site-based locations (Kirschbaum and Stanley, 2018; Liao et al., 2010). A clear advantage of the satellite rainfall products is the large coverage at high temporal resolution, which enables a detailed analysis of rainfall conditions that trigger multiple landslides over large regions.
The soil wetness at the beginning of the triggering rainfall has been proven to play a major role in landslide-triggering mechanisms (Bogaard and van Asch, 2002; Rahardjo et al., 2008; von Ruette et al., 2014) and therefore to help improve early warning systems (Guzzetti et al., 2020; Krogli et al., 2018; Marino et al., 2020). Although in previous works in the Baguio area of the Philippines the importance of the antecedent rainfall has been shown to be key to understanding the triggering mechanisms of MORLEs during typhoons (Nolasco-Javier et al., 2015; Nolasco-Javier and Kumar, 2018), no previous work in the region has involved the analysis of soil moisture. The Soil Moisture Active Passive (SMAP) satellite product is a global soil moisture dataset that has potential for analysis of landslide-triggering conditions and early warning (Kirschbaum and Stanley, 2018) but as yet has not been widely used in landslide research.
The municipality of Itogon (Benguet, Luzon) and its surroundings was hit by Typhoon Mangkhut (locally known as Typhoon Ompong) in September 2018, which triggered thousands of landslides, including a fatal one that killed more than 80 miners and their families (Cawis, 2019). The purpose of this work was (a) to map and characterize landslides triggered by Typhoon Mangkhut for the first time, producing one of the first inventories for a typhoon event in the Philippines; (b) to investigate the antecedent and triggering rainfall and soil moisture conditions that led to widespread landsliding; (c) to examine other geomorphologic factors that made certain slopes susceptible to landslides; and (d) to consider the potential of satellite-based rainfall and soil moisture data for early warning of these regional landslide events.
2.1 Geological and geomorphological setting
Our research was conducted over an area of 570 km2 at the NW of the Philippines' largest island, Luzon. The study area is located in the province of Benguet (16.19 to 16.31∘ N and 120.34 to 120.48∘ E), at the southern end of the Cordillera Central mountain range, the largest mountain range of the country (Fig. 1). The eastern half of the study area is characterized by the upper Agno River course (region 3 in Fig. 1), which flows N to S, and is dammed by three cascading dams used for hydroelectric power generation: Ambuklao Dam in the north, Binga Dam in the middle, and San Roque Dam in the south. In the west, the study area is characterized by smooth slopes between 600 and 1500 m a.s.l., where Baguio city and the municipality of La Trinidad are located (region 1 in Fig. 1). The mountainous region between the upper Agno River and the city and municipality in the west, in the middle of the study area, was the most affected area by Typhoon Mangkhut in 2018 (region 2 in Fig. 1). The valleys are characterized by steep slopes (30∘ on average but up to 70∘), with altitudes ranging from 263 to 2190 m.a.s.l. in the highest point. The municipality of Itogon is the main inhabited area in these valleys. Itogon is a mining town, where the extraction of gold has been one of the main economic activities since the 1990s, and some tailings dams can be observed in its surroundings. The bedrock of the area is mostly constituted by Cretaceous, Tertiary, and Quaternary igneous and sedimentary rocks, part of the magmatic arc formed mainly in response to subduction along the Manila Trench since the early Miocene (Bellon and Yumul, 2000). While the sedimentary bedrock consisting of limestones and clastic sedimentary rocks predominate in region 1 of the study area (Fig. 1), the mountainous region in the centre (region 2 in Fig. 1) and the eastern river plains (region 3 in Fig. 1) mostly consist of diorite and diorite porphyry (DENR-MGB, 1995). The study area can also be described as seismically active (Su, 1988). The whole area is covered by surficial formations consisting of loam and clays and undifferentiated mountain soils. Finally, the vegetation cover is mainly forest, but it also contains pine trees, fruit trees, shrubs and open grassland (Palangdan, 2018).
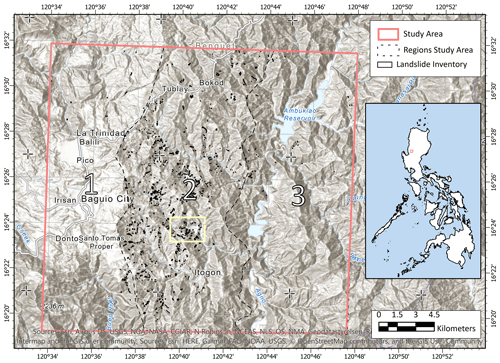
Figure 1Landslide inventory. The area affected by 1101 landslides triggered by Typhoon Mangkhut was mapped using polygons. Three regions of the study area are distinguished (see text in Sect. 2.1). The yellow area is referred in Fig. 5. Inset, location of the study area within the Philippines, in the province of Benguet (Luzon). © OpenStreetMap contributors 2021. Distributed under a Creative Commons BY-SA License.
2.2 Climate
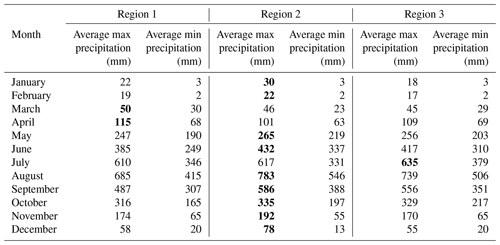
The Philippines is characterized by having several types of climate: from tropical rainforest, tropical savanna or tropical monsoon to humid subtropical, in higher altitudes, such as in our study area. The country is divided in four climatic regions, based on the distribution of rainfall as presented in the Modified Corona Climate Map of the Philippines (DOST-PAGASA, 2014). Our study area is in the Type 1 zone, characterized by having two pronounced seasons: dry from November to April and wet during the rest of the year. Most rain falls between June and September. The average annual precipitation in our study area, during the period 1960–1990 (Hijmans et al., 2005), ranges from 3276 mm in the higher elevations to 1894 mm in the floodplain, with a mean value of 2766 mm. The western and central part of the study area (regions 1 and 2 in Fig. 1) are characterized by having lower mean temperatures and higher amounts of rainfall. In contrast, in the lower elevations of the river Agno floodplain (region 3 in Fig. 1), it is warmer, and the precipitation rates are lower (Table 1). The winds are controlled by two systems in the Philippines: the northeast monsoon, active from October to late March, and the southwest monsoon, prevalent during the months of July to September. Both monsoons bring heavy rains in parts of the country where the prevailing wind affects. Moreover, from the approximately 20 tropical cyclones that enter the Philippine Area of Responsibility (PAR) every year, most of them hit northern Luzon, and seven to eight make landfall (Nolasco-Javier and Kumar, 2019; Yumul et al., 2011).
Table 1Average maximum and minimum monthly precipitation (from 1960 to 1990) in the different regions of the study area (see Fig. 1). Source: https://www.worldclim.org/ (last access: 15 June 2020), version 1.4, release 3.
2.3 Landslides related to previous typhoons
Due to the frequent passage of tropical cyclones over the landslide-prone slopes of the study area, rainfall-induced landslides are frequent. Since 2001, at least 14 typhoons causing landslides have hit the study area, according to Nolasco-Javier and Kumar (2018) and Paringit et al. (2020). The most devastating episodes in the last decades, before Typhoon Mangkhut, have been Typhoon Bilis (2006), with 53 landslides reported; Typhoon Parma (influenced by simultaneous Typhoon Melor in 2009), with 97 landslides reported; and Typhoon Koppu (2015), with 80 landslides reported to the City Disaster Risk Reduction and Management Council (CDRRMC) of the city of Baguio.
During multiple-occurrence regional landslide events (MORLEs), such as the ones triggered by typhoons and tropical storms, small or remote landslides are often unreported. Further studies from Nolasco-Javier et al. (2015) and Nolasco-Javier and Kumar (2019) demonstrate that the number of landslides caused by Typhoon Parma in the area of Tublay was, by far, larger than the reported events. Therefore, the actual complete landslide record in the area is unknown.
2.4 Typhoon Mangkhut (13–15 September 2018)
From 13–15 September 2018, the study area was hit by the passage of Typhoon Mangkhut (called Typhoon Ompong in the Philippines; Fig. 2a). Typhoon Mangkhut developed from an area of low pressure situated over the Marshall Islands and approached to the Philippines, crossing the north of Luzon island following a trajectory from east-southeast to west-northwest. The highest rainfall amount recorded during the passage of Mangkhut was at the Baguio city PAGASA weather station (at the west of the study area) and was 794 mm from 12 to 15 of September (Weather Division PAGASA, 2018). The estimations from the Global Precipitation Measurement mission (Huffman et al., 2019) show lower values over the larger area affected by landslides, with 360 mm of rainfall over a 44 h period (Fig. 2b). The typhoon triggered an elevated number of landslides in the area (Fig. 1). The landslides were typically shallow translational landslides, mud and debris flows, often with a complex behaviour: starting as a shallow landslide and becoming a flow (Varnes, 1978). However, rockslides and rockfalls were also reported. A detailed report on the landslides that occurred, followed by a hazard assessment including field surveys in six barangays within critical areas, was issued by the Mines and Geosciences Bureau just after the event (Mines and Geosciences Bureau, 2018). Some of the debris flows had extraordinarily long runouts, such as the fatal landslide that killed more than 80 miners and their families in the area of Barangay Ucab, on 15 September around 13:00 LT, further described in the following sections of this paper.
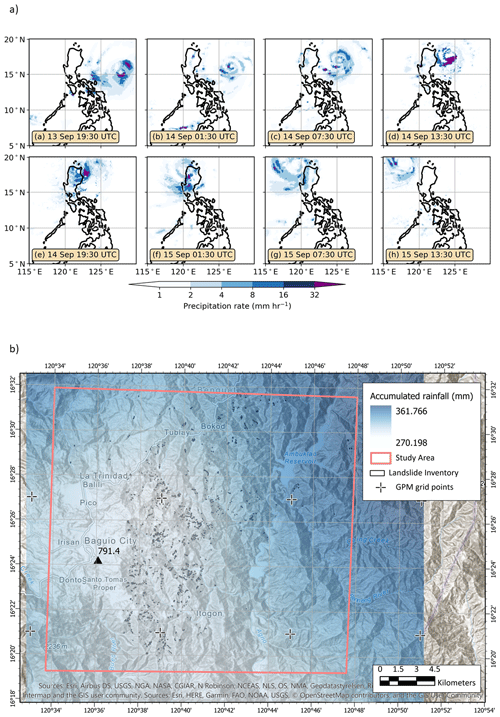
Figure 2(a) GPM IMERG data showing the evolution of Typhoon Mangkhut over the Philippines between 13 and 15 September 2018; (b) accumulated rainfall during Typhoon Mangkhut (13 September 2018 at 19:30 to 15 September 2018 at 15:30 UTC) within the study area and its surroundings, according GPM IMERG data (map) and rain gauge records in Baguio city (black triangle). © OpenStreetMap contributors 2021. Distributed under a Creative Commons BY-SA License.
3.1 Compiling a landslide inventory and magnitude–frequency analysis
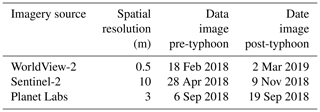
The first step to evaluate the predisposing and triggering factors of the landslides triggered by Typhoon Mangkhut was the creation of a landslide inventory. We mapped landslides manually using satellite imagery by comparing pre- and post-Typhoon Mangkhut images of the study area. The sources of the satellite imagery were of diverse resolution (Table 2) and were combined with digital terrain models as well as with the use of Google Earth™ to more clearly identify the landslides.
Despite having many advantages, such as the possibility to map large and often not accessible mountain regions (Guzzetti et al., 2012), satellite mapping has some limitations, such as the availability of good cloud-free images, within a sensible time period before and after the event. In our study, very high-resolution images have a gap of several months (pre- and post-typhoon) (Table 2). Considering that landslides are not uncommon in the area, and that the construction and mining activities are intense, some of the landslides mapped using satellite images may not have occurred during Typhoon Mangkhut but before or after. For this reason, other imagery sources with narrower time windows (only a few days in the case of Planet Labs) (Table 2) and Google Earth, together with the comparison with local reports reporting field surveys after the typhoon (Mines and Geosciences Bureau, 2018), have been used to cross-check the inventory and verify that the landslides mapped did actually occur during the passage of Typhoon Mangkhut.
Landslides were mapped as polygons, without distinguishing source and runout areas, as it was often difficult to discriminate between slides, debris flows and earth flows as well as the transition between them. In the cases where the deposition areas were clearly differentiated from failure and runout areas, these have not been included in the polygons; however, in cases where runout was not long it was difficult to differentiate them. The dense vegetation covering a major part of the slopes was useful to identify and delineate the landslides, as they are easily visible as bare soil within a body of dense vegetation. Moreover, the normalized difference vegetation index (NDVI) proved to be useful to identify such changes.
We plotted the magnitude–frequency distribution of landslides across the study area using the landslide areas obtained from the inventory. We estimated the exponent of the tail of the resulting characteristic power law distribution using the maximum likelihood estimate procedure from the complementary cumulative distribution function (CCDF) following Clauset et al. (2009).
Finally, a more detailed analysis was done on one major landslide that occurred in the area of First Gate, in Barangay Ucab (region 2 of the study area, see Fig. 5), where small scale miners were staying in a bunkhouse owned by Benguet Corporation (Palangdan, 2018). This landslide had a combined behaviour, evolving from a hillslope into a flow with a particularly long runout, which ended up in a tragedy causing the loss of life of 80 miners.
3.2 Analysis of landscape controls on landslides
In order to assess the influence of landscape characteristics on the spatial distribution of landslides, we combined the landslide inventory with topographical data and several thematic maps with terrain information using spatial analysis techniques in ArcMap 10.6.1 (ESRI, 2018). We obtained the frequency distribution for each predisposing factor both for the total of the study area (using all the pixels) and only for the areas affected by landslides (mean value of each landslide). A 5 m resolution digital surface model acquired in 2013 with IfSAR techniques (DENR-NAMRIA, 2013) provided the topographical information of the study area: elevation, slope and aspect degree. Maps on soil type (Bureau of Soils and Water Management, 2012), land cover (DENR-NAMRIA, 2010) and bedrock geology (DENR-MGB, 2006) were used to retrieve information on further terrain factors. Bedrock geology was only available for 63 % of the study area, corresponding to the boundaries of the Baguio quadrangle geological map.
3.3 Analysis of rainfall and soil moisture
Rainfall data from 2018 at a resolution of 0.1∘ (approx. 10 km) and 30 min time interval was acquired from the Global Precipitation Measurement (GPM IMERG) mission (Huffman et al., 2019) for the study area and its surroundings. These data are of particular interest to analyse: (a) the correlation between the spatial variability of the rainfall associated with Typhoon Mangkhut and its antecedent rainfall and the distribution of landslides (instead of having only the point-based data from Baguio city rain gauge (Fig. 2)) and (b) the characteristics of the Typhoon Mangkhut rainfall and soil moisture at the nearest GPM grid point to the fatal landslide in Barangay Ucab.
The definition of the rainfall duration is a key consideration in the analysis of the rainfall thresholds for landslides as this often brings uncertainty to the analysis (Abancó et al., 2016; Alvioli et al., 2018b; Luigi et al., 2020; Melillo et al., 2014). Frequently the information of the failure time of landslides is unknown, hence discriminating between the rainfall that occurred before and after the failure becomes challenging. Generally, the rainfall event is defined based on approximations of the failure date and time; however, it has been proven that if the uncertainty of the landslide occurrence spans more than 1 d, triggering rainfall can be significantly underestimated (Peres et al., 2018).
According to the reports issued after Typhoon Mangkhut, the fatal landslide in Barangay Ucab must have taken place on the 15 September, between 05:00 and 07:00 UTC. Although we could have defined for this specific case the precise “triggering rainfall” (just rainfall in the lead-up to failure), the analysis has been done using the total rainfall (from the beginning to the end of the rainfall event) to make this consistent with the comparison with other rainfall events that did not trigger landslides.
We consider that the total rainfall of the event was that which occurred between the beginning and the end of the rainfall at the nearest GPM grid point to Barangay Ucab. We assume that a rainfall event starts and ends after and before a period of 1 h of no rain, following Abancó et al. (2016).
We analysed the characteristics of the triggering rainfall (Typhoon Mangkhut) as well as other high-intensity rainfall events in the previous and following months that did not trigger landslides. In order to select high-intensity rainfall events we filtered rainfalls with intensity higher than 4 mm h−1 on average for 3 consecutive hours, which would mean an accumulated rainfall of at least 12 mm in 3 h. Although 12 mm may not seem a high amount of rainfall, the selection criteria was based on the fact that only 3 % of the 30 min rainfall records from GPM IMERG exceeded 4 mm h−1 in 2018. The mean daily rainfall of 2018 was 9 mm d−1, and only 39 rainfall events fulfilled the condition of having an intensity of 4 mm h−1 for 3 consecutive hours at the grid point near Barangay Ucab. The purpose of this analysis was to compare the characteristics of the landslide-triggering rainfall with other similar rainfall events and to better identify the conditions that caused Typhoon Mangkhut to trigger so many landslides.
In addition to calculating antecedent rainfall in the lead-up to Typhoon Mangkhut, we also analysed soil moisture data. The data are also from a satellite source, specifically from the Soil Moisture Active Passive (SMAP) mission, acquired by means of a radiometer (passive) instrument and a synthetic-aperture radar (active) instrument operating with multiple polarizations in the L-band range. SMAP data have a resolution of 9 km and 3 h. We used data between May and September 2018, from level 4 (L4), corresponding to the surface and root zone soil moisture data (0–100 cm vertical average) in the form of volume of water/volume of terrain (Reichle et al., 2017).
4.1 Landslide characteristics
A total of 1101 landslides were manually mapped, most of them located in region 2 of the study area (Fig. 1). The landslides in the study area have areas from 25 m2 up to 120 000 m2, representing a mean density of 1.9 landslides km−2 and a maximum value of 4.8 landslides km−2 in region 2. The fatal landslide in Barangay Ucab is also located in region 2 and is highlighted in Fig. 1.The exceedance probability distribution of the landslide areas has a characteristic rollover and power law tail. The exponent of the power tail is 2.65, and the rollover point is located at 190 m2 approximately (Fig. 3).
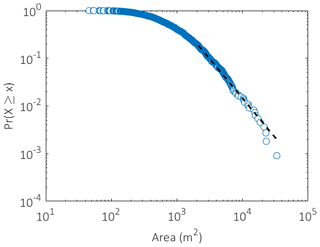
Figure 3Exceedance probability distribution for the 1101 landslide areas in the inventory, fit with theoretical power law model by the maximum likelihood method.
Elevations in the study area range between 263 and 2190 m.a.s.l. (Fig. 4a) and follow a distribution close to normal, with a peak between 1101 and 1320 m.a.s.l. The landslide density is also highest within the same range, in terms of mean elevation. However, only four landslides occurred below 660 m.a.s.l. and only one over 1760 m.a.s.l. Slope gradients that favoured landslides are shifted towards higher gradients than the study area distribution, with most landslides occurring on slopes steeper than 30∘ (Fig. 4b). However, flatter areas down to 10∘ and steeper up to 50∘ were affected by failure or runout of landslides too. Particularly striking is the aspect control on landsliding with a concentration of landslides on east-southeast-south-facing slopes (Fig. 4e).
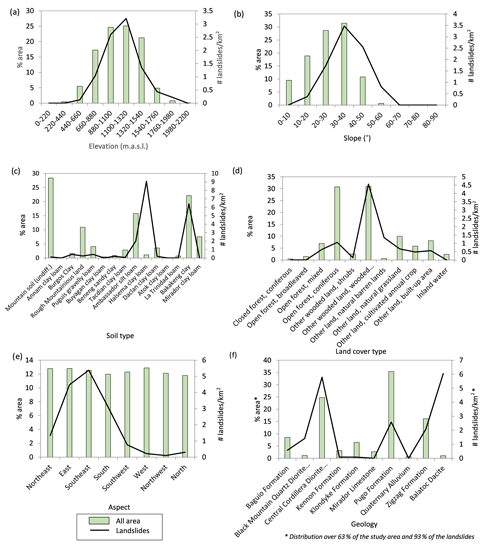
Figure 4Histograms of different geomorphological parameters over the study area and frequency of landslides for every parameter class. The geomorphological parameters are (a) elevation, (b) slope, (c) soil type, (d) land cover type, (e) aspect, and (f) geology. Note that geology is only over 63 % of the study area and 93 % of the landslides as the geology map was only available for part of the area.
The study area is covered by mountain soils, mostly Ambassador silt loam and Bakakeng clay. Nevertheless, landslides predominantly happen in Bakakeng clay and Halsema clay loam and only to some extent in the Ambassador silt but not in mountain soils (Fig. 4c), which are mostly covered by coniferous forest and natural grasslands. Landslides mostly occurred in wooded grassland, while only a small amount take place in coniferous forests (Fig. 4d). It is worth nothing that although the Halsema clay loam is scarce in the study area, the density of landslides is particularly high.
In terms bedrock geology, the area has predominantly a sedimentary sequence of basaltic and andesitic volcanic rocks (Pugo formation), followed by intrusive bodies consisting of diorites and granodiorites (Central Cordillera Diorite Complex) and a sequence of conglomerates, sandstone and shale (zigzag formation). The higher density of landslides is located in the Central Cordillera Diorite Complex and the Balatoc dacite (Fig. 4f).
4.2 Rainfall and soil moisture conditioning and triggering of landslides
4.2.1 Rainfall
The GPM IMERG rainfall data measured in the study area during the passage of Typhoon Mangkhut indicate that the highest intensities, recorded at 03:30 UTC on 15 September, occurred in the eastern region of the study area (Fig. 6), which also received the greatest accumulated rainfall over the course of the event (Fig. 2). However, the rainfall accumulated throughout the previous 2 weeks (hereafter called antecedent rainfall) was higher in the central region, where most of the landslides occurred. In this central region, the antecedent rainfall was up to 245 mm (according to GPM IMERG measurements), which is still less than the rainfall accumulated during the typhoon. The fact that the antecedent rainfall was higher in the area where most of the landslides occurred, even if the intensities were lower, suggests that the wetness of the terrain played an important role in the mechanism of failure. Notably, this area is covered by clayey materials, such that the effect of pore water pressure due to the antecedent rainfall could play a particularly crucial role.
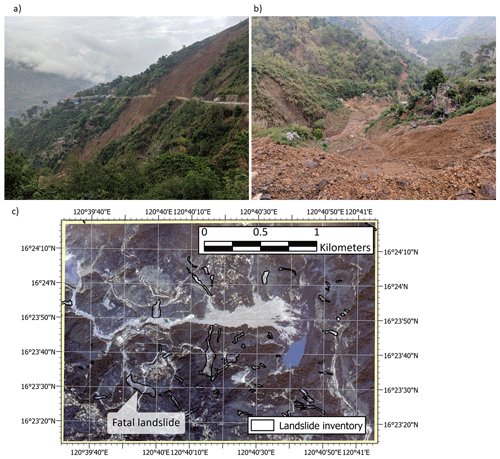
Figure 5(a) General view of the initiation area of the fatal landslide in Barangay Ucab that killed more than 80 miners; (b) view of the particularly long runout of the landslide, from the road facing downhill; and (c) location of the landslide (see yellow rectangle in Fig. 1 for the exact location within the study area). Satellite imagery from WorldView (2 March 2019).
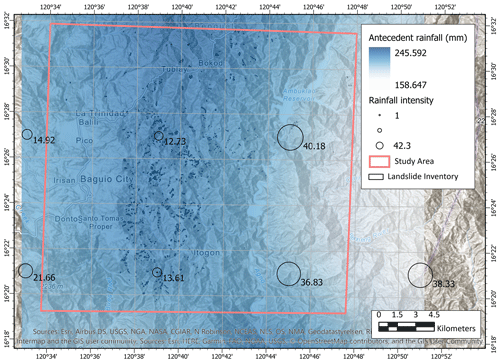
Figure 6Colour gradient represents the antecedent rainfall, accumulated during the 13 d before the typhoon. The values in the GPM IMERG grid points indicate the rainfall intensity on 15 September 2018 at 03:30 UTC (maximum intensity in the study area). © OpenStreetMap contributors 2021. Distributed under a Creative Commons BY-SA License.
A detailed analysis of rainfall and soil moisture conditions in the lead-up to landslides is based on the GPM IMERG point closest to the fatal landslide at Barangay Ucab (Fig. 5), for which time of occurrence is most precisely known. The Typhoon Mangkhut rainfall at this point was compared to 33 high-intensity rainfall events (3 h mean intensity above 4 mm h−1) over the preceding and following months that did not trigger a MORLE. While Typhoon Mangkhut rainfall had a duration of 43.5 h (34 h until the fatal landslide in Barangay Ucab was triggered), according to the criteria of 1 h without rainfall for the initiation and end of the event, the durations of the other high-intensity rainfall events spanned from 2 to 107 h. The rainfall that occurred during the passage of Typhoon Mangkhut was also not the highest in terms of accumulated rainfall, as the records show accumulations up to 409 mm in prior high-intensity rainfall events. The comparison between the intensity–duration relationships (maximum floating rainfall intensity for different durations) of the high-intensity rainfall events indicates that two events in 2018 had higher intensities (up to 2 h duration and for long durations of 48 and 72 h) than Typhoon Mangkhut (Fig. 7). Both events happened earlier in the year than Typhoon Mangkhut: on 21 May and 20 July respectively.
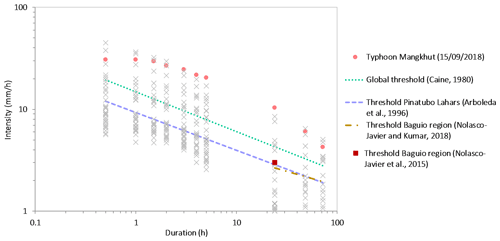
Figure 7Intensity–duration correlations (using maximum floating intensities) of rainfall associated with Typhoon Mangkhut as well as 33 high-intensity rainfalls along 2018 in the study area. The rainfalls are compared to some global and regional thresholds published in the literature.
As introduced in Sect. 3.3, the GPM IMERG data represents an average of the rainfall in each of the 0.1×0.1∘ cells, which means that even if a high peak of rainfall occurs in a cell (such as the one registered by the rain gauge at Baguio city) it is averaged above the whole area. We compared the high-intensity rainfall events selected for the analysis. The results revealed that a great number of rainfall events clearly exceed global intensity–duration thresholds (Caine, 1980) and regional thresholds (Arboleda et al., 1996; Nolasco-Javier et al., 2015; Nolasco-Javier and Kumar, 2018) (Fig. 7), despite having used data from GPM IMERG, which tends to underestimate rainfall in extreme events.
4.2.2 Soil moisture
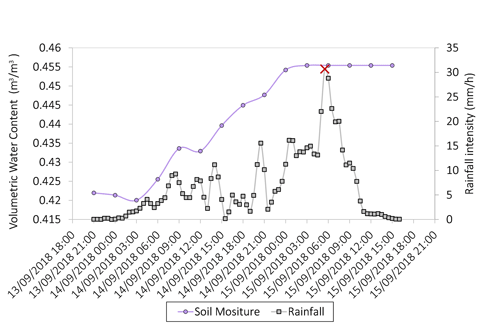
The SMAP data containing information on the soil moisture on the root zone (at 0–100 cm depth) from May to September 2018 in four different points of the study area were analysed. As can be seen in Fig. 8, soil moisture increases from May to September and the correlation with the rainfall is clear. The increments of soil moisture can be observed in two different situations: (a) after a particular high-intensity rainfall event, such as the one occurred on 20 July (that had a higher intensity than Typhoon Mangkhut); or (b) after periods of more continuous prolonged rainfall at lower intensity, for example in mid-June or early August. The increase in soil moisture with time is continuous but especially significant from July onwards. The increase in July is especially relevant in points C and A, which were lower than B and D in May, June and early July but after this event are higher. The higher levels of soil moisture achieved in the analysed months are close to 0.455 m3 m−3, which could be close to the level of full saturation limit of the soil. Typhoon Mangkhut occurred after several days of continuous rainfall, in August and early September, which kept a high continuous level of soil moisture, almost up to 0.45 m3 m−3. Figure 9 shows the timeline of the rainfall and the soil moisture (in point C) during the typhoon (13 September 2018 at 21:00 UTC until 15 September 2018 15:30 UTC), with a temporal resolution of 30 min for the rainfall and 3 h for the soil moisture.
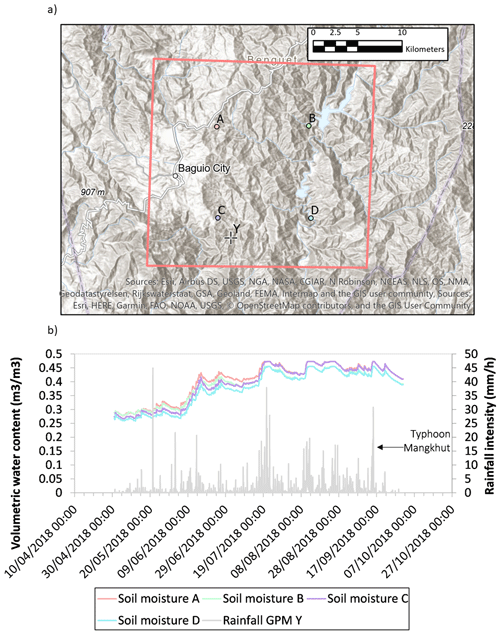
Figure 8(a) Location of SMAP-L4 and GPM IMERG grid points from which the soil moisture and rainfall data have been obtained within the study area and (b) evolution of soil moisture (in volumetric water content) in A to D and rainfall in Y from the beginning of May to the end of September 2018. © OpenStreetMap contributors 2021. Distributed under a Creative Commons BY-SA License.
In this study, we investigate the landscape and meteorological predisposing and triggering factors of the landslides triggered by Typhoon Mangkhut in a study area of the province of Benguet (Luzon, Philippines). The typhoon triggered an elevated large number of landslides, with the highest density (4.8 landslides km−2) in the central part of the study area, around the municipality of Itogon, a region with steep slopes in the southern end of the Cordillera Central. The impact of this event was significantly high, mainly due to two main aspects: (a) the heavily populated nature and thus vulnerability of the area, with a high density of mining activity and settlements; and (b) the complex behaviour of some of the landslides, with long runouts and elevated entrainment rates, which magnified their volume. We will look at landslide runout and controls on this in a separate study.
This study has been conducted using a manually mapped landslide inventory. We experimented with an automatic landslide mapping tool to map landslides more efficiently, based on the application of a threshold for NDVI using a random forest model and a post-process by filtering flat areas (Martinis, 2018). When comparing with visual observations, we found the success rate insufficient, as the tool was only designed for the use Sentinel-2 images and it was unable to detect smaller landslides (<800 m2) (Abancó et al., 2020). Despite the potential of other types of automatic tools, for this specific work the final inventory was entirely done using manual techniques, combining very-high- and high-resolution imagery in order to narrow down the time windows and ensure we were mapping landslides triggered by Typhoon Mangkhut.
The inventory was based on a single typhoon and therefore the results of the analysis may be conditioned by the characteristics of this specific event. Systematic inventories should be conducted over multiple years to provide more reliable information for the evaluation of size statistics of landslides as well as of the susceptibility of the landscape to landsliding (e.g. Guzzetti et al., 2005, 2006; Del Ventisette et al., 2014). However, our analysis gives an indication of landslide characteristics and of the landscape controls in the region that will contribute towards a future landslide hazard assessment. Furthermore, it is of great importance for the understanding of the rainfall conditions that trigger landslides in the territory and in working towards landslide early warning in the region.
5.1 Landslide characteristics and landscape predisposing factors
We present here a magnitude–frequency distribution of landslides, which is, to our knowledge, the first published one in this region of the Philippines. The magnitude–frequency distribution of the areas of the landslides in the inventory shows a characteristic shape with rollover and power law tail, with an exponent of the power tail of 2.65 and a rollover point around 190 m2. This exponent is higher than two landslide distributions triggered by typhoon events in Taiwan, with exponents of 1.42–1.60 (Chien-Yuan et al., 2006), though similar to earthquake-triggered landslide inventories in China (Li et al., 2013) and Haiti (Gorum et al., 2013): 2.63 and 2.71 respectively (Tanyaş et al., 2019). These numbers suggest that the small landslides are more frequent than larger ones, in comparison to other studies where the exponent of the power law tail is lower than 2 (Bennett et al., 2012; Van Den Eeckhaut et al., 2007). Further mapping in the region and across other regions of the Philippines will help to refine these distributions, which are a key component of a probabilistic hazard assessment (Guzzetti et al., 2005)
An interesting finding of this study is the strong aspect control on landsliding in Typhoon Mangkhut. A possible explanation for aspect control of landslides in the literature is differences in vegetation and thus root cohesion between aspects that receive differing amounts of solar insolation (Rengers et al., 2016). Indeed, landslides in the region occur within wooded grasslands and rarely in coniferous forest (Fig. 4d) with higher root binding of the soils. Another possible explanation would be that these slopes have a soil type that is more prone to landslides – Bakakeng clay and Halsema clay loam. This reddish-brown clay and the brownish clay loam are characterized by having a very slow internal drainage (low permeability) (Carating et al., 2014), which may explain their tendency to fail, i.e. under excessive pore pressure when they are saturated. Further analysis on the geotechnical properties of these clayey soils should be carried out to determine what makes them more prone to landsliding to the other soils in the study area: for example, the presence of high-plasticity clays, where their exposure to repetitive wet–dry cycles may reduce their shear strength (Khan et al., 2017); or the appearance of cracks, which may change the hydraulic conductivity and make them more prone to landsliding (Khan et al., 2019).
However, although landslides tended to happen in a certain land cover (wooded grasslands) and soil type (Bakakeng clay and Halsema clay loam), there is no evidence that this could explain the prevalent orientation of the slopes affected by landslides to the east-southeast, as there are no differences in vegetation or soil type between different aspects. We analysed the wind speed and direction using ERA-5 data (Hersbach et al., 2020), as previous studies suggest that the wind does affect rainfall intensities on various slope aspects as the leeward sides are subjected to lower rainfall intensity than the windward sides, and therefore the occurrence of landslides can be affected by the winds (de Lima, 1990; Liu and Shih, 2013). Results show that winds during the highest-intensity rainfall were coming from the west-southwest (Fig. 10), which does not reveal a clear explanation for the aspect control of the landslides as also found by other authors (e.g. Chen et al., 2019). Further research is needed to better understand the influence of wind on landslide triggering.
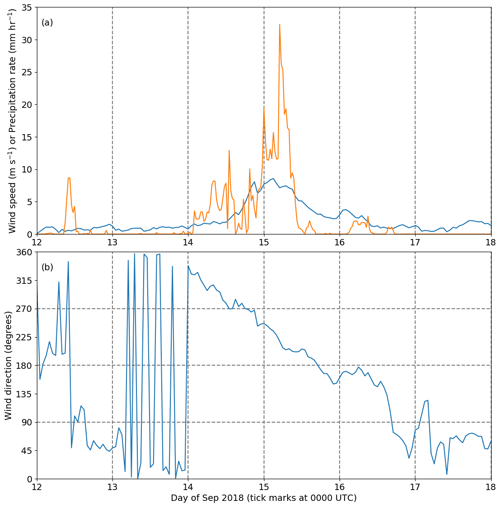
Figure 10Time series of (a) wind speed (blue line) and precipitation rate (orange line) and (b) wind direction, from 12–18 September 2018, at the GPM IMERG grid point near Barangay Ucab. Note that wind directions indicate where winds “come from” (e.g. direction 270 indicates a wind coming from the west).
Although in this study we have not considered anthropogenic factors, local reports (Mines and Geosciences Bureau, 2018) and studies (Nolasco-Javier and Kumar, 2018) have pointed out that rapid urbanization and mining activities can severely impact the susceptibility of the slopes to landsliding. The presence of underground mines in the region generates a labyrinth of underground excavations that may clearly affect the slope stability and should be looked at in further research.
5.2 Rainfall and soil moisture conditions leading to landsliding
First, the analysis of 2018 rainfall in the study region shows that more rainfall intensity does not mean more landslides, in contrast to some other studies (Chen et al., 2013; Lin and Chen, 2012). In fact, the results of this study do not support the model proposed by Crozier (2017), which suggests a higher density of landslides at the core of the rainfall intensity cell, decreasing with distance away from the cell as rainfall intensity decreases. Instead, the density of landslides was higher in areas of greater antecedent rainfall, supporting the findings of Nolasco-Javier and Kumar (2018) in the same region.
Second, Nolasco-Javier and Kumar (2018) used daily rain gauge data to suggest a potential threshold of 500 mm of rainfall accumulated over the rainy season that was needed for landsliding. However, we found that the threshold is far higher based on analysis of the rainfall that was needed to trigger landslides in 2018. If we zoom in on the rainfall accumulated at Barangay Ucab grid point, we can see that the 500 mm threshold was already reached in our study area on the 14 June 2018, yet a very intense event in July and some other intense rainfall events failed to trigger landslides according to the records and the satellite imagery available. Our study suggests that, based on 2018 data, 2600 mm of rainfall accumulated over the rainy season would have been needed for landsliding to occur. Defining rainfall thresholds is challenging, and multiple events are needed to refine thresholds.
By comparing the data registered at the GPM grid point near Barangay Ucab, we could see that multiple rainfall events exceeded the global threshold Caine (1980). This is probably because such thresholds are obtained using a high diversity of meteorological patterns, which therefore may be too low for extreme climates such as tropical regions in the Philippines.
Finally, soil moisture data provide an additional picture of the soil conditions at the time of landsliding beyond that given by antecedent rainfall data. There are several studies that have started to combine soil moisture with rainfall data to define landslide thresholds (Oorthuis et al., 2021; Mirus et al., 2018) and for landslide early warning (e.g. Kirschbaum and Stanley, 2018; Krogli et al., 2018). The analysis of soil moisture in our study area in the lead-up to Typhoon Mangkhut shows that the volumetric water content of the soil increased over the rainy season, reaching a maximum of 0.455 m3 m−3, when the typhoon happened in September 2018. This value is actually a reasonable value for the porosity of clays (Hough, 1969), which would suggest that the soil before Typhoon Mangkhut reached the saturation limit of Bakakeng clay. Any rainfall occurring in these saturated conditions would create an increase in soil pore-water pressure, which would result in a decrease in effective stress and therefore a tendency to fail. Adding information of soil moisture in early warning systems would be valuable to track the saturation point of the soil before a typhoon would hit a specific area. Ideally, thresholds should be specific for each soil type accounting for different saturation limits.
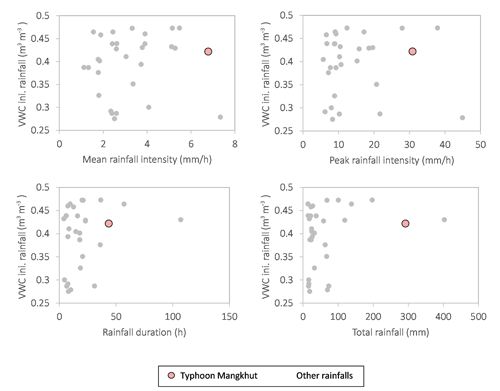
Figure 11Correlation between soil moisture (a) mean rainfall intensity of the event (total rainfall/rainfall duration), (b) peak rainfall intensity during event, (c) duration of rainfall and (d) accumulated rainfall during the event for the 33 (and Typhoon Mangkhut) high-intensity rainfalls in the study area (see Fig. 7). Soil moisture data obtained from SMAP-L4 data at point C and rainfall data from GPM IMERG at point Y (see Fig. 8).
5.3 Potential of satellite-based rainfall and soil moisture data for landslide early warning
In order to explore the potential of using satellite-based rainfall and soil moisture data for landslide early warning, we conducted a further analysis of rainfall and soil moisture conditions for the 34 high-intensity rainfalls (including Typhoon Mangkhut) (Fig. 11). The purpose of this analysis was to find out if by combining information on (a) the initial soil moisture at the beginning of a rainfall event and (b) the characteristics of the rainfall it would be possible to discriminate between landslide-triggering and non-triggering rainfalls. Results show that although Typhoon Mangkhut rainfall has one of the highest values of volumetric water content in the soil and also has high values for all four rainfall parameters analysed (mean rainfall, peak rainfall intensity, rainfall duration and total rainfall of the event), it does not clearly stand out from other rainfall events. This may be because there are other factors involved in the triggering rainfall that we have not considered here, such as the atmospheric pressure (Pelascini et al., 2020). Alternatively, it may be that satellite-based rainfall and soil moisture data do not adequately capture the conditions on the ground. Hence, satellite-based data should be used with caution in landslide early warning systems (Hidayat et al., 2019; Kirschbaum and Stanley, 2018), ensuring that threshold curves are derived using the same source of data (Brunetti et al., 2018).
Further work should be carried out in the region in order to establish a reliable threshold to identify and provide reliable early warning of landslide-triggering rainfall, using either rain gauges or satellite rainfall products or a combination. The high temporal resolution of satellite data allows more detailed thresholds, which would be more useful to be applied in early warning systems, than daily values (Nolasco-Javier and Kumar,2018; Nolasco-Javier et al.,2015). However, it is also important to consider the uncertainty that the satellite data brings compared to in situ measurements. Hence, we are working on the installation of in situ sensors to verify satellite data. A combination of satellite rainfall and soil moisture data (in real time or forecasted) with rain gauges and soil moisture sensors could potentially be combined in a future landslide early warning system.
We used satellite imagery to produce a complete inventory of landslides triggered by Typhoon Mangkhut (2018), which contains 1101 landslides. The magnitude–frequency distribution of the landslide areas, the first we are aware of for any region in the Philippines, has a characteristic rollover and power law tail, with an exponent of 2.65. The exponent is higher than in other typhoon-triggered landslide inventories, which suggests that larger landslides are less likely in the study area.
Landslides occurred predominantly in Bakakeng clay and Halsema clay loam, two clayey soils that cover some slopes in the study area, which have a low permeability. The geomorphological analysis of the inventory shows that most of the landslides happen on slopes facing east-southeast, though the reason for this is unclear and is apparently not related to land cover, soil type or wind direction. Further analysis is needed to explain the aspect control of landslides in this region. Furthermore, investigation of the influence of anthropogenic factors (such as mining activity or road constructions) on landsliding is needed. Extensive mining activities take place in the region, and it is still uncertain if the landslide prevalence in some slopes could be associated with the excavation of many interconnected underground mines or loading of slopes by mining infrastructure.
We used GPM IMERG rainfall data to analyse the spatial distribution of the rainfall associated with Typhoon Mangkhut. Antecedent rainfall in the 2 weeks leading up to the typhoon better explains the spatial landslide pattern than rainfall intensity. This result suggests, as pointed out by other studies, that the soil moisture may play a very important role in the triggering of landslides in the area. We used SMAP-L4 soil moisture data to analyse the soil moisture evolution throughout the rainy season of 2018. The results show that soil moisture increased throughout the season, achieving the highest values when Typhoon Mangkhut hit the area.
The Typhoon Mangkhut rainfall was compared to 33 other high-intensity rainfalls that occurred in 2018 and to some published global and regional rainfall thresholds. This analysis shows that, although satellite-based rainfall products tend to underestimate rainfall measurements, a great number of rainfall events (which did not trigger landslides) were above global and regional rainfall thresholds used for comparison. The need for further analysis of landslide-triggering rainfall in the area is highlighted, preferably including a comparison with ground-based measurements.
Finally, we did a preliminary analysis to assess the potential of combining satellite rainfall and soil moisture data for landslide early warning. We find that it is difficult to isolate Typhoon Mangkhut from other rainfall events that happened in the lead-up to the typhoon, which had higher intensities and coincided with equally saturated soil conditions yet did not trigger landslides. The results show that it is not possible to draw a threshold only using one single landslide-triggering event and point out that the exclusive use of satellite data has uncertainties due to the area-averaged measurements, which need to be analysed in future studies and considered in early warning systems.
The landslide inventory will be publicly available at the end of the SCaRP project (NE/S003371/1), currently scheduled for January 2022. It will be accessible at the NERC Environmental Information Data Centre (EIDC) deposit: https://eidc.ac.uk/ (Environmental Information Data Centre).
GB and CA designed the study. GB wrote the proposal obtaining funding for this work. CA mapped the landslides, analysed the data (geomorphological, rainfall and soil moisture) and led the writing of the article with contributions from GB. AM provided GPM IMERG rainfall data and contributed to the analysis of this. MM and FT provided information on the Mangkhut event and contributed to the collection of geomorphological data. All authors contributed to the writing and gave final approval of this paper.
The authors declare that no competing interests are present.
We are thankful to the Goddard Space Flight Center, precipitation measurement missions at the National Aeronautics and Space Administration (NASA), and the National Snow and Ice Data Center respectively for making GPM IMERG and SMAP datasets freely available. David Hein-Griggs is thanked for his support in the extraction and processing of SMAP-L4 data. ERA-5 data were accessed from Copernicus at https://cds.climate.copernicus.eu (last access: 8 December 2020) (https://doi.org/10.24381/cds.adbb2d47).
We are also grateful to the Mines and Geosciences Bureau (MGB) for providing the geological map from the Baguio region and the reports of the event in Itogon; the municipality of Itogon for their assistance in field work and first-hand experiences; the Philippine Atmospheric, Geophysical and Astronomical Services Administration (PAGASA) for providing the rainfall data of the Baguio rain gauge; and to Xavier Fuentes for making the soil and land cover data available through PhilGIS.org.
The researchers based in the UK (Clàudia Abancó, Georgina Bennett and Adrian Matthews) have been funded by the NERC Newton Agham fund (contract NE/S003371/1, project SCaRP), and the researchers based in the Philippines (Mark Matera and Fibor Tan) have been funded by the Department of Science and Technology – Philippine Council for Industry, Energy, and Emerging Technology Research and Development (DOST-PCIEERD, project no. 07166).
This paper was edited by Paolo Tarolli and reviewed by two anonymous referees.
Abancó, C., Hürlimann, M., Moya, J., and Berenguer, M.: Critical rainfall conditions for the initiation of torrential flows. Results from the Rebaixader catchment (Central Pyrenees), J. Hydrol., 541, 218–229, https://doi.org/10.1016/j.jhydrol.2016.01.019, 2016.
Abancó, C., Bennett, G., Briant, J., and Battiston, S.: Towards an automatic landslide mapping tool based on satellite imagery and geomorphological parameters. A study of the Itogon area (Philippines) after Typhoon Mangkhut, EGU General Assembly 2020, Online, 4–8 May 2020, EGU2020-17940, https://doi.org/10.5194/egusphere-egu2020-17940, 2020.
Aleotti, P. and Chowdhury, R.: Landslide hazard assessment: summary review and new perspectives, B. Eng. Geol. Environ., 58, 21–44, https://doi.org/10.1007/s100640050066, 1999.
Alvioli, M. ,Mondini, A. C. , Fiorucci, F. , Cardinali, M., Marchesini, I.: Topography-driven satellite imagery analysis for landslide mapping, Geomatics, Natural Hazards and Risk, 9, 544–567, https://doi.org/10.1080/19475705.2018.1458050, 2018a.
Alvioli, M., Melillo, M., Guzzetti, F., Rossi, M., Palazzi, E., von Hardenberg, J., Brunetti, M. T., and Peruccacci, S.: Implications of climate change on landslide hazard in Central Italy, Sci. Total Environ., 630, 1528–1543, https://doi.org/10.1016/j.scitotenv.2018.02.315, 2018b.
Arboleda, R., Martinez, M., Newhall, C., and Punongbayan, R.: 1992 lahars in the Pasig-Potrero river system, in: Fire and mud: eruptions and lahars of Mount Pinatubo, edited by: Newhall, C. G. and Punongbayan, R. S., Philippine Institute of Volcanology and Seismology, University of Washington Press, Seattle and London, 1996.
Bellon, H. and Yumul, G. P.: Mio-Pliocene magmatism in the Baguio mining district (Luzon, Philippines): Age clues to its geodynamic setting, CR Acad. Sci. II A, 331, 295–302, https://doi.org/10.1016/S1251-8050(00)01415-4, 2000.
Bennett, G. L., Molnar, P., Eisenbeiss, H., and McArdell, B. W.: Erosional power in the Swiss Alps: characterization of slope failure in the Illgraben, Earth Surf. Processes, 37, 1627–1640, https://doi.org/10.1002/esp.3263, 2012.
Bogaard, T. A. and van Asch, T. W. J.: The role of the soil moisture balance in the unsaturated zone on movement and stability of the Beline landslide, France, Earth Surf. Processes, 27, 1177–1188, https://doi.org/10.1002/esp.419, 2002.
Borghuis, A. M., Chang, K., and Lee, H. Y.: Comparison between automated and manual mapping of typhoon-triggered landslides from SPOT-5 imagery, Int. J. Remote Sens., 28, 1843–1856, https://doi.org/10.1080/01431160600935638, 2007.
Brunetti, M. T., Peruccacci, S., Rossi, M., Luciani, S., Valigi, D., and Guzzetti, F.: Rainfall thresholds for the possible occurrence of landslides in Italy, Nat. Hazards Earth Syst. Sci., 10, 447–458, https://doi.org/10.5194/nhess-10-447-2010, 2010.
Brunetti, M. T., Melillo, M., Peruccacci, S., Ciabatta, L., and Brocca, L.: How far are we from the use of satellite rainfall products in landslide forecasting?, Remote Sens. Environ., 210, 65–75, https://doi.org/10.1016/j.rse.2018.03.016, 2018.
Bureau of Soils and Water Management, Soil Type Map, available at: https://www.geoportal.gov.ph/ (last acces: 15 April 2020), 2012.
Caine, N.: The Rainfall Intensity: Duration Control of Shallow Landslides and Debris Flows, Geogr. Ann. A, 62, 23–27, http://www.jstor.org/stable/520449 (last access: 15 July 2020), 1980.
Carating, R. B., Galanta, R. G., and Bacatio, C. D.: The Soils of the Philippines, Springer Netherlands, Dordrecht, 2014.
Cawis, R. M. M.: Itogon to commemorate “Ompong” tragedy anniversary with rituals, available at: https://pia.gov.ph/news/articles/1027251 (last access: 24 June 2020), 2019.
Chen, Y. C., Chang, K. T., Chiu, Y. J., Lau, S. M., and Lee, H. Y.: Quantifying rainfall controls on catchment-scale landslide erosion in Taiwan, Earth Surf. Processes, 38, 372–382, https://doi.org/10.1002/esp.3284, 2013.
Chen, Y. C., Chang, K. T., Wang, S. F., Huang, J. C., Yu, C. K., Tu, J. Y., Chu, H. J., and Liu, C. C.: Controls of preferential orientation of earthquake- and rainfall-triggered landslides in Taiwan's orogenic mountain belt, Earth Surf. Processes, 44, 1661–1674, https://doi.org/10.1002/esp.4601, 2019.
Chien-Yuan, C., Fan-Chieh, Y., Sheng-Chi, L., and Kei-Wai, C.: Discussion of landslide self-organized criticality and the initiation of debris flow, Earth Surf. Processes, 32, 197–209, 2006.
Clauset, A., Shalizi, C. R., and Newman, M. E. J.: Power-law distributions in empirical data, SIAM Rev., 51, 661–703, https://doi.org/10.1137/070710111, 2009.
Corominas, J., van Westen, C., Frattini, P., Cascini, L., Malet, J.-P., Fotopoulou, S., Catani, F., Van Den Eeckhaut, M., Mavrouli, O., Agliardi, F., Pitilakis, K., Winter, M. G., Pastor, M., Ferlisi, S., Tofani, V., Hervás, J., and Smith, J. T.: Recommendations for the quantitative analysis of landslide risk, B. Eng. Geol. Environ., 73, 209–263, https://doi.org/10.1007/s10064-013-0538-8, 2014.
Crosta, G. B. and Dal Negro, P.: Observations and modelling of soil slip-debris flow initiation processes in pyroclastic deposits: the Sarno 1998 event, Nat. Hazards Earth Syst. Sci., 3, 53–69, https://doi.org/10.5194/nhess-3-53-2003, 2003.
Crozier, M. J.: Multiple-occurrence regional landslide events in New Zealand: hazard management issues, Landslides, 2, 247–256, https://doi.org/10.1007/s10346-005-0019-7, 2005.
Crozier, M. J.: A proposed cell model for multiple-occurrence regional landslide events: Implications for landslide susceptibility mapping, Geomorphology, 295, 480–488, https://doi.org/10.1016/j.geomorph.2017.07.032, 2017.
de Lima, J. L. M. P.: The effect of oblique rain on inclined surfaces: A nomograph for the rain-gauge correction factor, J. Hydrol., 115, 407–412, https://doi.org/10.1016/0022-1694(90)90218-M, 1990.
Department of Environment and Natural Resources-Mines and Geosciences Bureau (DENR-MGB): Geological Map of Baguio City Quadrangle (1:50 000), Sheet 3169 III, Quezon City, Philippines, 1995.
Department of Environment and Natural Resources-National Mapping and Resource Information Authority (DENR-NAMRIA): Land Cover Map, Taguig City, Philippines, 2010.
Department of Environment and Natural Resources-National Mapping and Resource Information Authority (DENR-NAMRIA): Interferometric Synthetic Aperture Radar-Digital Elevation Models (IfSAR-DEMs), Taguig City, Philippines, 2013.
Department of Science and Technology-Philippine Atmospheric, Geophysical and Astronomical Services Administration (DOST-PAGASA): Climate Map of the Philippines (1951–2010), Quezon City, Philippines, 2014.
De Vita, P., Reichenbach, P., Bathurst, J. C., Borga, M., Crosta, G., Crozier, M. J., Glade, T., Guzzetti, F., Hansen, A., and Wasowski, J.: Rainfall-triggered landslides: a reference list, Environ. Geol., 35, 219–233, 1998.
Del Ventisette, C., Righini, G., Moretti, S., and Casagli, N.: Multitemporal landslides inventory map updating using spaceborne SAR analysis, Int. J. Appl. Earth Obs., 30, 238–246, https://doi.org/10.1016/j.jag.2014.02.008, 2014.
Environmental Information Data Centre: https://eidc.ac.uk/, last access: 12 May 2021.
ESRI: ArcGIS Desktop version 10.6.1 user guide, Redlands, CA, Environmental Systems Research Institute, 2018.
Fell, R., Corominas, J., Bonnard, C., Cascini, L., Leroi, E., and Savage, W. Z. (on behalf of the JTC-1 Joint Technical Committee on Landslides): Guidelines for landslide susceptibility, hazard and risk zoning for land use planning, Eng. Geol., 102, 99–111, 2008.
Godt, J. W., Baum, R. L., Savage, W. Z., Salciarini, D., Schulz, W. H., and Harp, E. L.: Transient deterministic shallow landslide modeling: Requirements for susceptibility and hazard assessments in a GIS framework, Eng. Geol., 102, 214–226, 2008.
Gorum, T., van Westen, C. J., Korup, O., van der Meijde, M., Fan, X., and van der Meer, F. D.: Complex rupture mechanism and topography control symmetry of mass-wasting pattern, 2010 Haiti earthquake, Geomorphology, 184, 127–138, https://doi.org/10.1016/j.geomorph.2012.11.027, 2013.
Guzzetti, F., Reichenbach, P., Cardinali, M., Galli, M., and Ardizzone, F.: Probabilistic landslide hazard assessment at the basin scale, Geomorphology, 72, 272–299, 2005.
Guzzetti, F., Galli, M., Reichenbach, P., Ardizzone, F., and Cardinali, M.: Landslide hazard assessment in the Collazzone area, Umbria, Central Italy, Nat. Hazards Earth Syst. Sci., 6, 115–131, https://doi.org/10.5194/nhess-6-115-2006, 2006.
Guzzetti, F., Peruccacci, S., Rossi, M., and Stark, C. P.: Rainfall thresholds for the initiation of landslides in central and southern Europe, Meteorol. Atmos. Phys., 98, 239–267, https://doi.org/10.1007/s00703-007-0262-7, 2007.
Guzzetti, F., Mondini, A. C., Cardinali, M., Fiorucci, F., Santangelo, M., and Chang, K. T.: Landslide inventory maps: New tools for an old problem, Earth-Sci. Rev., 112, 42–66, https://doi.org/10.1016/j.earscirev.2012.02.001, 2012.
Guzzetti, F., Gariano, S. L., Peruccacci, S., Brunetti, M. T., Marchesini, I., Rossi, M., and Melillo, M.: Geographical landslide early warning systems, Earth-Sci. Rev., 200, 102973, https://doi.org/10.1016/j.earscirev.2019.102973, 2020.
Hersbach, H., Bell, B., Berrisford, P., Hirahara, S., Horányi, A., Muñoz-Sabater, J., Nicolas, J., Peubey, C., Radu, R., Schepers, D., Simmons, A., Soci, C., Abdalla, S., Abellan, X., Balsamo, G., Bechtold, P., Biavati, G., Bidlot, J., Bonavita, M., De Chiara, G., Dahlgren, P., Dee, D., Diamantakis, M., Dragani, R., Flemming, J., Forbes, R., Fuentes, M., Geer, A., Haimberger, L., Healy, S., Hogan, R. J., Hólm, E., Janisková, M., Keeley, S., Laloyaux, P., Lopez, P., Lupu, C., Radnoti, G., de Rosnay, P., Rozum, I., Vamborg, F., Villaume, S., and Thépaut, J. N.: The ERA5 global reanalysis, Q. J. Roy. Meteor. Soc., 146, 1999–2049, https://doi.org/10.1002/qj.3803, 2020.
Hidayat, R., Sutanto, S. J., Hidayah, A., Ridwan, B., and Mulyana, A.: Development of a landslide early warning system in Indonesia, Geosciences, 9, 1–17, https://doi.org/10.3390/geosciences9100451, 2019.
Hijmans, R. J., Cameron, S. E., Parra, J. L., Jones, P. G., and Jarvis, A.: Very high resolution interpolated climate surfaces for global land areas, Int. J. Climatol., 25, 1965–1978, https://doi.org/10.1002/joc.1276, 2005.
Hough, B. K.: Basic soils engineering, Ronald Press Co., New York, 1969.
Huffman, G. J., Stocker, E. F., Bolvin, D. T., Nelkin, E. J., and Tan, J.: GPM IMERG final precipitation L3 half hourly 0.1 degree × 0.1 degree V06. Goddard Earth Sciences Data and Information Services Center, https://doi.org/10.5067/GPM/IMERG/3B-HH/06, 2019.
Khan, M. A., Hossain, M. S., Khan, M. S., Samir, S., and Aramoon, A.: Impact of wet-dry cycles on the shear strength of high plastic clay based on direct shear testing, Geotechnical Frontiers, 280, 615–622, https://doi.org/10.1061/9780784480472.065, 2017.
Khan, S., Ivoke, J., and Nobahar, M.: Coupled effect of wet-dry cycles and rainfall on highway slope made of yazoo clay, Geosciences, 9, 341, https://doi.org/10.3390/geosciences9080341, 2019.
Kirschbaum, D. and Stanley, T.: Satellite-Based Assessment of Rainfall-Triggered Landslide Hazard for Situational Awareness, Earth's Future, 6, 505–523, https://doi.org/10.1002/2017EF000715, 2018.
Kirschbaum, D., Stanley, T., and Zhou, Y.: Spatial and temporal analysis of a global landslide catalog, Geomorphology, 249, 4–15, https://doi.org/10.1016/j.geomorph.2015.03.016, 2015.
Krøgli, I. K., Devoli, G., Colleuille, H., Boje, S., Sund, M., and Engen, I. K.: The Norwegian forecasting and warning service for rainfall- and snowmelt-induced landslides, Nat. Hazards Earth Syst. Sci., 18, 1427–1450, https://doi.org/10.5194/nhess-18-1427-2018, 2018.
Lagmay, A. M. F., Racoma, B. A., Aracan, K. A., Alconis-Ayco, J., and Saddi, I. L.: Disseminating near-real-time hazards information and flood maps in the Philippines through Web-GIS, J. Environ. Sci., 59, 13–23, https://doi.org/10.1016/j.jes.2017.03.014, 2017.
Leonarduzzi, E. and Molnar, P.: Deriving rainfall thresholds for landsliding at the regional scale: daily and hourly resolutions, normalisation, and antecedent rainfall, Nat. Hazards Earth Syst. Sci., 20, 2905–2919, https://doi.org/10.5194/nhess-20-2905-2020, 2020.
Li, W. le, Huang, R. qiu, Xu, Q., and Tang, C.: Rapid susceptibility mapping of co-seismic landslides triggered by the 2013 Lushan Earthquake using the regression model developed for the 2008 Wenchuan Earthquake, J. Mt. Sci., 10, 699–715, https://doi.org/10.1007/s11629-013-2786-2, 2013.
Liao, Z., Hong, Y., Wang, J., Fukuoka, H., Sassa, K., Karnawati, D., and Fathani, F.: Prototyping an experimental early warning system for rainfall-induced landslides in Indonesia using satellite remote sensing and geospatial datasets, Landslides, 7, 317–324, https://doi.org/10.1007/s10346-010-0219-7, 2010.
Lin, G. W. and Chen, H.: The relationship of rainfall energy with landslides and sediment delivery, Eng. Geol., 125, 108–118, https://doi.org/10.1016/j.enggeo.2011.11.010, 2012.
Liu, J. K. and Shih, P. T. Y.: Topographic correction of Wind-Driven rainfall for landslide analysis in central Taiwan with validation from Aerial and satellite optical images, Remote Sens., 5, 2571–2589, https://doi.org/10.3390/rs5062571, 2013.
Luigi, S., Massimo, G., Silvia, M., and Brunetti, M. T.: How much does the rainfall temporal resolution affect rainfall thresholds for landslide triggering?, Nat. Hazards, 100, 655–670, https://doi.org/10.1007/s11069-019-03830-x, 2020.
Malamud, B. D., Turcotte, D. L., Guzzetti, F., and Reichenbach, P.: Landslide inventories and their statistical properties, Earth Surf. Processes, 29, 687–711, https://doi.org/10.1002/esp.1064, 2004.
Marino, P., Peres, D. J., Cancelliere, A., Greco, R., and Bogaard, T. A.: Soil moisture information can improve shallow landslide forecasting using the hydrometeorological threshold approach, Landslides, 17, 2041–2054, https://doi.org/10.1007/s10346-020-01420-8, 2020.
Martinis, S.: EO Tools and Products – Specifications (HEIMDALL project Deliverable 5.1), available at: https://heimdall-h2020.eu/public-deliverables/ (last access: 15 July 2020), 2018.
Martino, S., Antonielli, B., Bozzano, F., Caprari, P., Discenza, M. E., Esposito, C., Fiorucci, M., Iannucci, R., Marmoni, G. M., and Schilirò, L.: Landslides triggered after the 16 August 2018 Mw 5.1 Molise earthquake (Italy) by a combination of intense rainfalls and seismic shaking, Landslides, 17, 1177–1190, https://doi.org/10.1007/s10346-020-01359-w, 2020.
Mazzoglio, P., Laio, F., Balbo, S., Boccardo, P., and Disabato, F.: Improving an Extreme Rainfall Detection System with GPM IMERG data, Remote Sens., 11, 677, https://doi.org/10.3390/rs11060677, 2019.
Melillo, M., Brunetti, M. T., Peruccacci, S., Gariano, S. L., and Guzzetti, F.: An algorithm for the objective reconstruction of rainfall events responsible for landslides, Landslides, 12, 311–320, https://doi.org/10.1007/s10346-014-0471-3, 2014.
Mines and Geosciences Bureau: Report on the Result of the Geohazard Assessments in the Small Scale Mining Areas in the Municipality of Itogon, Benguet Province Re: Rain-Induced Landslide Incidents due to Typhoon Ompong., Quezon City, Philippines, 170 pp., 2018.
Mirus, B. B., Becker, R. E., Baum, R. L., and Smith, J. B.: Integrating real-time subsurface hydrologic monitoring with empirical rainfall thresholds to improve landslide early warning, Landslides, 15, 1909–1919, https://doi.org/10.1007/s10346-018-0995-z, 2018.
Mondini, A. C.: Measures of spatial autocorrelation changes in multitemporal SAR images for event landslides detection, Remote Sens., 9, 554, https://doi.org/10.3390/rs9060554, 2017.
Nikolopoulos, E., Borga, M., Creutin, J. and Marra, F.: Estimation of debris flow triggering rainfall: Influence of rain gauge density and interpolation methods, Geomorphology, 243, 40–50, 2015.
Nolasco-Javier, D. and Kumar, L.: Deriving the rainfall threshold for shallow landslide early warning during tropical cyclones: a case study in northern Philippines, Nat. Hazards, 90, 921–941, https://doi.org/10.1007/s11069-017-3081-2, 2018.
Nolasco-Javier, D. and Kumar, L.: Frequency ratio landslide susceptibility estimation in a tropical mountain region, Int. Arch. Photogramm. Remote Sens. Spatial Inf. Sci., XLII-3/W8, 173–179, https://doi.org/10.5194/isprs-archives-XLII-3-W8-173-2019, 2019.
Nolasco-Javier, D., Kumar, L., and Tengonciang, A. M. P.: Rapid appraisal of rainfall threshold and selected landslides in Baguio, Philippines, Nat. Hazards, 78, 1587–1607, https://doi.org/10.1007/s11069-015-1790-y, 2015.
Oorthuis, R., Hürlimann, M., Abancó, C, Moya, J., and Carleo, L.: Monitoring of Rainfall and Soil Moisture at the Rebaixader Catchment (Central Pyrenees), Environmental and Engineering Geoscience 2021, https://doi.org/10.2113/EEG-D-20-00012, 2021.
Palangdan, V. T.: Save, recovery and development of Itogon. A Rehabilitation and recovery plan of the municipality of Itogon, Benguet (2019–2028), Itogon Local Government Unit, Itogon, Philippines, 54 pp., 2018.
Papa, M. N., Medina, V., Ciervo, F., and Bateman, A.: Derivation of critical rainfall thresholds for shallow landslides as a tool for debris flow early warning systems, Hydrol. Earth Syst. Sci., 17, 4095–4107, https://doi.org/10.5194/hess-17-4095-2013, 2013.
Paringit, M. C. R., Cutora, M. D. L., Santiago, E. H., and Adajar, M. A. Q.: Assessment of Landslide Susceptibility: a Case Study of Carabao Mountain in Baguio City, International Journal of GEOMATE, 19, 166–173, https://doi.org/10.21660/2020.71.9261, 2020.
Pelascini, L., Steer, P., Longuevergne, L., and Lague, D.: The impact of atmospheric pressure change and rainfall for triggering landslides during weather events, EGU General Assembly 2020, Online, 4–8 May 2020, EGU2020-5423, https://doi.org/10.5194/egusphere-egu2020-5423, 2020
Peres, D. J., Cancelliere, A., Greco, R., and Bogaard, T. A.: Influence of uncertain identification of triggering rainfall on the assessment of landslide early warning thresholds, Nat. Hazards Earth Syst. Sci., 18, 633–646, https://doi.org/10.5194/nhess-18-633-2018, 2018.
Petley, D.: Global patterns of loss of life from landslides, Geology, 40, 927–930, 2012.
Prakash, N., Manconi, A., and Loew, S.: Mapping landslides on EO data: Performance of deep learning models vs. Traditional machine learning models, Remote Sens., 12, 346, https://doi.org/10.3390/rs12030346, 2020.
Rahardjo, H., Leong, E. C., and Rezaur, R. B.: Effect of antecedent rainfall on pore-water pressure distribution characteristics in residual soil slopes under tropical rainfall, Hydrol. Process., 22, 506–523, https://doi.org/10.1002/hyp.6880, 2008.
Reichle, R., De Lannoy, G., Koster, R. D., Crow, W. T., and Kimball, J. S.: SMAP L4 9 km EASE-Grid Surface and Root Zone Soil Moisture Geophysical Data, Version 3, Boulder, Colorado USA, NASA National Snow and Ice Data Center Distributed Active Archive Center, https://doi.org/10.5067/B59DT1D5UMB4, 2017.
Rengers, F. K., McGuire, L. A., Coe, J. A., Kean, J. W., Baum, R. L., Staley, D. M., and Godt, J. W.: The influence of vegetation on debris-flow initiation during extreme rainfall in the northern Colorado Front Range, Geology, 44, 823–826, https://doi.org/10.1130/G38096.1, 2016.
Scheip, C. M. and Wegmann, K. W.: HazMapper: A global open-source natural hazard mapping application in Google Earth Engine, Nat. Hazards Earth Syst. Sci. Discuss. [preprint], https://doi.org/10.5194/nhess-2020-108, in review, 2020.
Segoni, S., Piciullo, L., and Gariano, S. L.: A review of the recent literature on rainfall thresholds for landslide occurrence, Landslides, 15, 1483–1501, https://doi.org/10.1007/s10346-018-0966-4, 2018.
Shu, H., Hürlimann, M., Molowny-Horas, R., González, M., Pinyol, J., Abancó, C., and Ma, J.: Relation between land cover and landslide susceptibility in Val d'Aran, Pyrenees (Spain): Historical aspects, present situation and forward prediction, Sci. Total Environ., 693, 133557, https://doi.org/10.1016/j.scitotenv.2019.07.363, 2019.
Su, S. S.: Seismic hazard analysis for the Philippines, Nat. Hazards, 1, 27–44, https://doi.org/10.1007/BF00168220, 1988.
Tanyaş, H., van Westen, C. J., Allstadt, K. E., and Jibson, R. W.: Factors controlling landslide frequency–area distributions, Earth Surf. Processes, 44, 900–917, https://doi.org/10.1002/esp.4543, 2019.
Tseng, C. M., Lin, C. W., Dalla Fontana, G., and Tarolli, P.: The topographic signature of a major typhoon, Earth Surf. Processes, 40, 1129–1136, https://doi.org/10.1002/esp.3708, 2015.
Van Den Eeckhaut, M., Poesen, J., Govers, G., Verstraeten, G., and Demoulin, A.: Characteristics of the size distribution of recent and historical landslides in a populated hilly region, Earth Planet. Sci. Lett., 256, 588–603, https://doi.org/10.1016/j.epsl.2007.01.040, 2007.
Varnes, D. J.: Slope movements types and processes. Landslides analysis and control transportation research board, Natl. Acad. Sci. Spec. Rep., 176, 11–33, 1978.
von Ruette, J., Lehmann, P., and Or, D.: Effects of rainfall spatial variability and intermittency onshallow landslide triggering patterns at a catchment scale, Water Resour. Res., 50, 7780–7799, https://doi.org/10.1002/2013WR015122, 2014.
Weather Division PAGASA: Summary Report Typhoon Ompong (Mangkhut/1822), available at: https://pubfiles.pagasa.dost.gov.ph/pagasaweb/files/tamss/weather/tcsummary/TY_Ompong_Mangkhut.pdf (last access: 15 June 2020), 2018.
Yumul, G. P., Cruz, N. A., Servando, N. T., and Dimalanta, C. B.: Extreme weather events and related disasters in the Philippines, 2004–08: A sign of what climate change will mean?, Disasters, 35, 362–382, https://doi.org/10.1111/j.1467-7717.2010.01216.x, 2011.


