 | 10 May 2021
Preface: Advances in extreme value analysis and application to natural hazards


Natural extreme events are infrequently observed events that occur with low probability, often referred to as rare or exceptional events that have widespread impact and devastating economic and social consequences. Natural extreme events encompass hazards such as floods, hurricanes, extreme temperatures and heat spells, earthquakes, tsunamis, and debris flows. Extreme value analysis (EVA) refers to efforts to characterize a hazard by estimating the intensity and the frequency of occurrence of the event. Statistically speaking, EVA is the branch of statistics dealing with the extreme deviations from the mean or the median of probability distributions. It seeks to assess, from a given sample of a random variable, the probability of a certain extreme value of the variable to occur. Such analysis may include a wide range of approaches, including, most notably, frequentist and Bayesian statistical models derived from historical event data in order to describe the behavior of extreme values. The estimation of the frequency of occurrence of extreme events using probability functions has been a common issue for many decades (e.g., Dalrymple, 1960; Cunnane, 1987; Haigh et al., 2016; Wahl et al., 2017; Hamdi et al., 2019; Parey et al., 2019).
Engineers, for example, generally need to determine the extreme value of a given return period T, i.e., the quantile XT or design value. For instance, EVA is widely used in the field of hydrology to estimate the probability of an unusually large flooding event, such as the 100-year flood. Similarly, for the design of a protection structure against coastal flooding, a coastal engineer would seek to estimate the 100-year storm surge, or similar. Traditional methods for analyzing and estimating the frequency of extreme events have been generally based on available local observations from the systematic record alone. However, it seems that these methods are not really suitable for relatively short data sets often characterized by the presence of gaps. This is just one of the challenges the EVA community is facing; others include, for example, the incorporation of non-stationarity, multiple correlated variables or hazards, and spatial and temporal clustering.
The fourth biennial Advances in Extreme Value Analysis and Application to Natural Hazards (EVAN) international conference was organized in Paris from 17 to 19 September 2019 and followed earlier conferences in Germany (2013), Spain (2015), and Southampton (2017). The conference brought together research scientists, students, practitioners, and stakeholders concerned with the complex and inter-disciplinary topic of natural hazard characterization. The conference was organized around the theme of extreme value analysis, covering a wide range of geophysical variables (flows, rainfall, snow, temperature, winds, sea level, storm surge, surface ocean waves, etc.) and development and description of probabilistic approaches useful in natural hazard characterization. The topics covered at the EVAN conference included univariate and multivariate extreme value analysis, local and regional frequency/Bayesian analysis, stationary and non-stationary extreme value analysis, multi-hazard risk analysis and compound effects, spatial analysis, extreme value analysis from a climate perspective, estimation of aleatory and epistemic uncertainties, and probabilistic risk analysis.
The main objective of this special issue is to provide an overview of the different perspectives on this complex and inter-disciplinary topic from research scientists, students, practitioners, and stakeholders who participated in the conference. It outlines the breadth of methods currently used for analyzing and estimating the extreme events to characterize natural hazards. This special issue encompasses 15 papers, all based on talks given at the fourth EVAN conference. A common objective of the contributions to this special issue is to characterize natural hazards by conducting frequency/Bayesian analysis of extreme events to establish a relationship between the magnitude and frequency of occurrence (return period) of these extreme events and for estimating the design value (the r-year return level) at a given location of interest.
The special issue summarized herein has been grouped under seven thematic areas of the statistics of extreme events.
-
Regional/spatial information. This approach is used to mitigate the paucity of data and the influence of outliers. A regional frequency analysis model assumes a homogenous behavior of the variable of interest at a regional scale.
-
Non-stationary statistical modeling. Estimating extreme values and associated uncertainties under the non-stationary assumption is a key research question, since the extreme value theory is often used to assess risks in the context of climate change.
-
Multivariate analysis. This includes the extension of univariate models to incorporate multiple variables.
-
Probabilistic. Many scenarios are used and injected to assess risk.
-
Multi-hazard/compound effects. The combination of two or more hazards/drivers in the analysis.
-
From a climate perspective. This includes all aspects of climate change, incorporated into EVA.
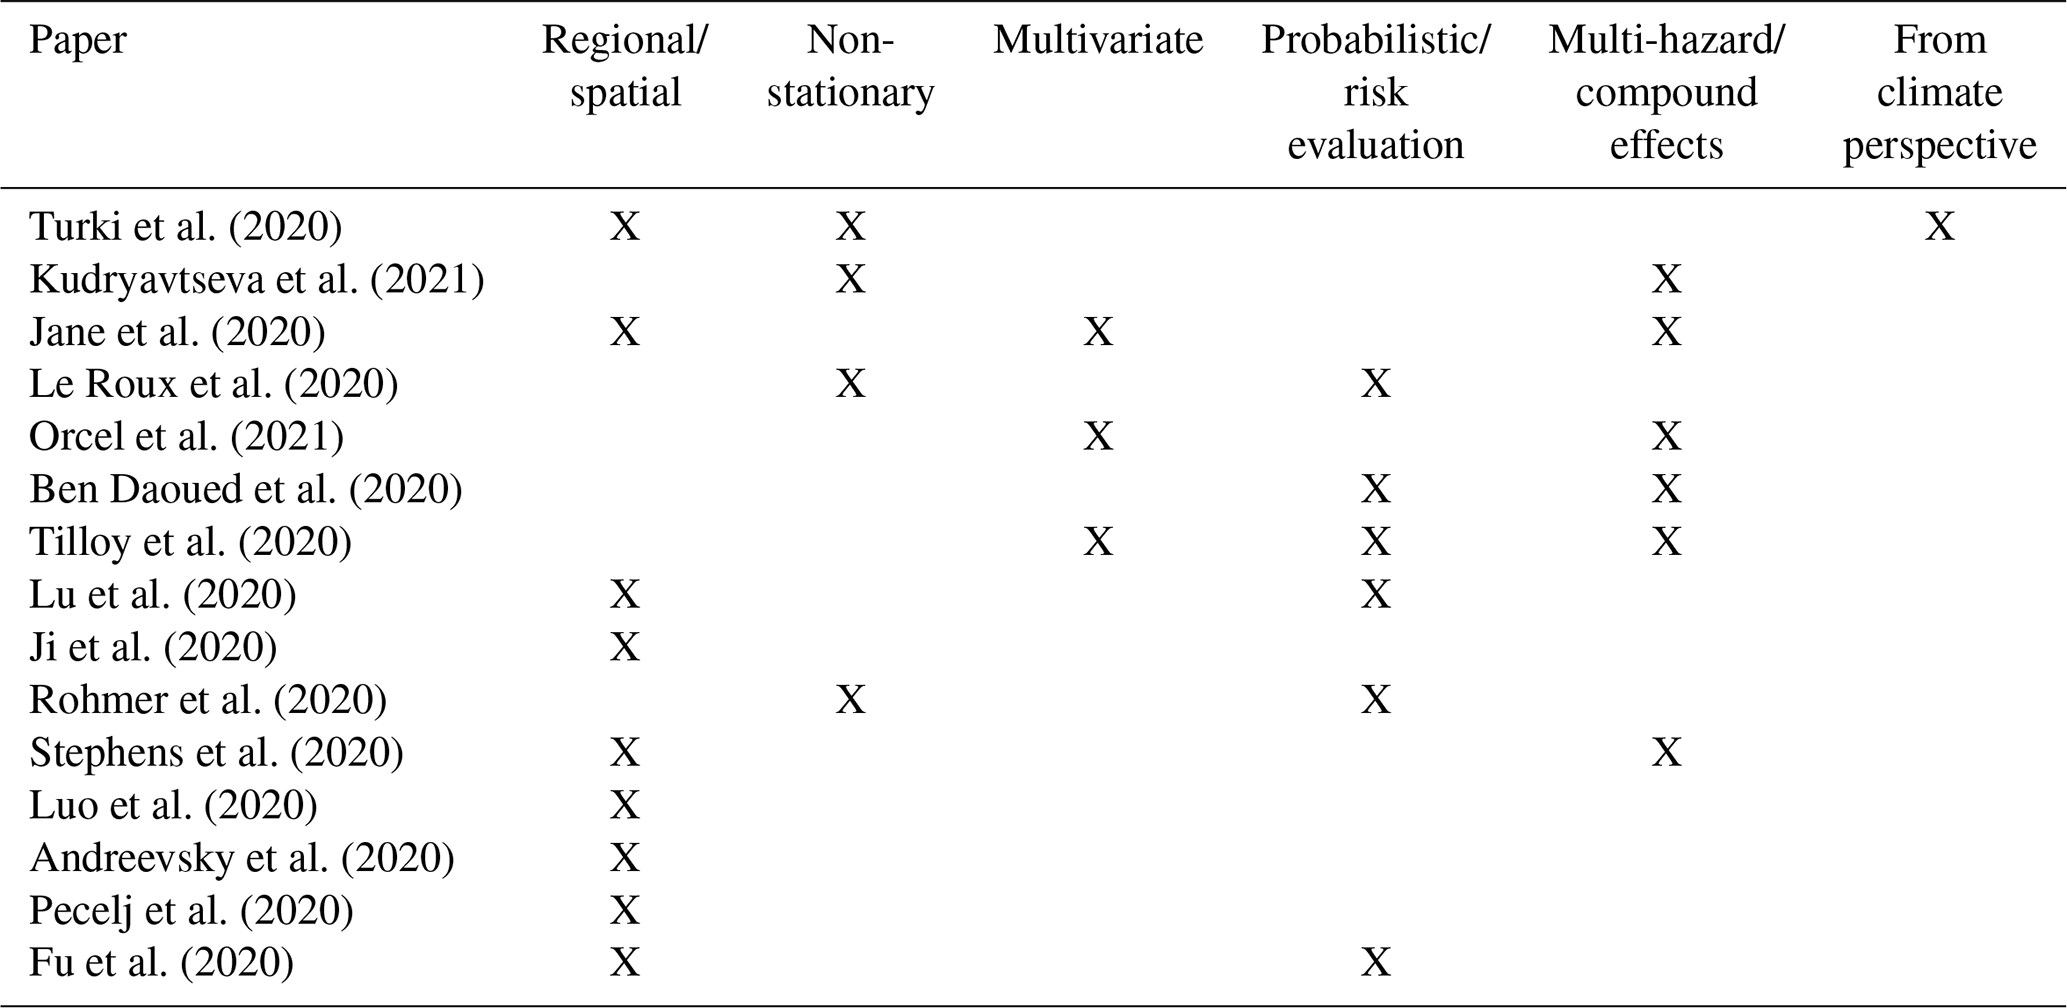
Table 1 summarizes all the papers published in the special issue according to these seven themes. Overall, the papers illustrate the multi-disciplinary composition of the special issue and multi-disciplinary aspects related to EVA in the context of natural hazard research.
Table 1 shows that the approaches proposed in this special issue were implemented locally (at-site frequency analysis) (most of the papers) or regionally (regional frequency analysis), which is used to limit unreliable extrapolation when available data record lengths are short compared to the recurrence interval of interest (Andreevsky et al., 2020), or for predicting extremes at locations where no observed data are available.
Extreme value characterization needs long and homogeneous time series, which do not exist for some variables and/or geographical areas. In such cases, it may be interesting to use gridded or reanalysis products. However, these products are produced with spatial interpolations or climate model assimilation technics and may present biases, especially for the highest values. Luo et al. (2020) compared four bias correction approaches applied to the Asian Precipitation Highly Resolved Observational Data Integration Towards Evaluation of Water Resources (APHRODITE) data set in order to study extreme precipitation in the Yarlung Tsangpo–Brahmaputra River basin. The analysis of the risk associated with extreme temperatures and heat waves was also part of this special issue. In order to characterize the biothermal heat hazard, Pecelj et al. (2020) assessed the bioclimatic conditions in Serbia during summer. The driver used in this study is the bioclimatic index UTCI (Universal Thermal Climate Index). Thresholds of this driver were compared to those of daily maximum air temperatures. The heat wave events which occurred in 2007, 2012, 2015, and 2017 in Serbia were used as case studies. Most of these events were of the longest durations and are considered to be the indicators of biothermal heat hazard. It was concluded that the UTCI associated with very strong heat stress can be considered a good indicator of heat waves. By using southwestern China as a case study, Ji et al. (2020) evaluated the formation and impact of debris flows using their susceptibility factor. A large number of typical debris flow gullies, distributed along five rivers, were evaluated to predict the susceptibility to debris flows through the establishment of a factor index system using nine indexes. The authors then developed a Type I quantification-theory-based model to predict the debris flows susceptibility factors. The reliability of the proposed model was analyzed using 10 debris flow gullies upstream of the Dadu River. The comparison of predicted and measured actual susceptibility shows that the model is right in 90 % of cases.
Despite the fact that both local and regional frequency analyses are mature disciplines and consolidated methodologies are available in the literature, Andreevsky et al. (2020) proposed a distinctive and interesting aspect in the regional frequency analysis. The authors use the spatial extremogram technique to form physically and statistically homogeneous regions centered on the target site. It quantifies the pairwise closeness between sites based on the extremal dependence between a given target site and all the other sites in the whole region.
As is mentioned earlier, almost all the papers included in this special issue have opted for the local analysis but are applied at different stations. As can be seen in Table 1, four papers deal with non-stationary extreme value analysis. Turki et al. (2020) investigated the nonstationary dynamics of extreme surges along the English Channel coasts to gain insights into the physical mechanisms relating the global atmospheric circulation to the local-scale variability of extreme surges. It was concluded that this relation significantly improves the perdition of extremes, with 30 % exhibiting their non-linear relationship with climate mechanisms. Kudryavtseva et al. (2021) assessed the non-stationarity of extreme water levels in the eastern Baltic Sea with a particular focus on the Gulf of Riga. The analysis uses tide gauge observations from 1961 to 2018 and the block maxima method to identify extreme events. The authors then analyze the changes in the parameters of the generalized extreme value (GEV) distribution through time. Changes in location and scale parameters are found to be coherent in the Gulf of Riga with linear upward trends but are different from the Baltic proper, where one station was also included in the study. The shape parameter shows significant variation, with a pronounced dip in the late 1980s indicating a change from a Fréchet to Weibull distribution.
Minimizing the risk of structure collapse in many high-latitude areas worldwide requires an assessment of extreme snow loads. Le Roux et al. (2020) utilized non-stationary extreme value models to analyze trends in the 50-year return level of ground snow load for the French Alps. Their results show a temporal decrease in the 50-year return levels of snow load between 1959 and 2019. However, despite these reductions, levels still exceed return levels designed for French building standards under a stationary assumption. The magnitude–frequency relation can also be established by using a probabilistic risk assessment approach. Rohmer et al. (2020) present a “seismic probabilistic safety assessments” which was performed at the level of a nuclear power plant. This approach used non-stationary frequency estimations as boundary conditions of a dynamic model to compute hazard and fragility curves. It provides a comprehensive framework for assessing extremes in different fields of environmental studies. The main strength of the paper is that it covers a large number of EVA fields and features. Indeed, the approach uses frequency estimations and can be extended to a Bayesian inference to better estimate uncertainties. Furthermore, it can be implemented locally in univariate and multivariate contexts, and the approach uses both stationary and non-stationary variables.
As was mentioned earlier, the special issue also aimed to promote probabilistic approaches useful in natural hazard characterization in a multi-hazard context and considering compounding effects. As shown in Table 1, several contributions in this special issue deal with probabilistic hazard approaches (e.g., Le Roux et al., 2020; Ben Daoued et al., 2020; Tilloy et al., 2020; Lu et al., 2020; Rohmer et al., 2020; Fu et al., 2020) and multi-hazard risk evaluation with compound effects (Stephens et al., 2020). Ben Daoued et al. (2020) developed a new method for modeling dependence and coincidence of extreme storm surges with high tide, using the city of Le Havre in France as a case study. Their paper highlights a bias in the maximum instantaneous storm surge-based procedure compared to the direct statistics on sea levels, and this bias is more important for high return periods. The study concluded that an appropriate coincidence probability concept, considering the dependence structure between extreme storm surges, is needed for a better assessment of the risk. Based on a case study, Lu et al. (2020) suggested a method for a quantitative assessment of the risk linked to landslides for highways. The method uses an analysis of the annual failure probability of the slope, combined with empirical correlations with the geometry of the slope, in order to assess the consequences based on a probabilistic modeling of the traffic on the highway. This approach, developed using a case study in Hong Kong, can be adapted to other regions. Fu el al. (2020) used a scenario-based probabilistic approach to evaluate the risk associated with the landslide hazard and to estimate spatial, temporal, and size probabilities. The spatial probabilities (calculated from susceptibility mapping) allowed the identification of the major controlling factors in the study area (western Hubei, China). The analysis of the hazard maps revealed that most building areas are at the foot of major slopes with very high hazard probabilities. It was then concluded that more than 1500 people and USD 18 million worth of property are threatened by landslides (i.e., a 50-year return level equivalent to a landslide volume of 50 000 m3).
In the contribution on compound effects and using tide gauge data from 1900 onwards, Stephens et al. (2020) identify 85 extreme sea level events and 135 extreme skew surge events, which are then considered for a spatiotemporal analysis along the coastline of New Zealand. Their findings highlight that most extreme sea level events are the result of moderate skew surges and high perigean spring tides and that events are typically at least 10 d apart because of the spring–neap cycle. They also identified the parts of the country where extreme events are more likely to occur (such as the east coast of the North Island) and assessed the role of seasonality, including mean sea level anomalies.
The final three contributions also deal with compound effects and hazard drivers but in a multivariate extreme value analysis context and by considering the structure of the dependence between the explanatory variables or drivers. Indeed, as was mentioned earlier, extreme events may result from a combination of different drivers which can present various types of dependence. Jane et al. (2020) analyzed the dependence structure between the principal flooding drivers at three locations across Miami-Dade County in southeast Florida. They identified the best-performing models for capturing the dependence between the principal drivers of compound flooding which leads to recommendations for revised future design frameworks. Orcel et al. (2021) introduce a copula-based approach to overcome the limitations in the widely applied DEFRA (UK Department for Environment, Food and Rural Affairs) method when assessing joint probabilities between multiple variables. Their proposed approach first identifies the most suitable bivariate copula which is fit to the variable pairs with the strongest dependence, before the function is extended to the trivariate case, and proof is provided that this function satisfies the mathematical properties of the copula. Tilloy et al. (2020) evaluate six distinct bivariate modeling approaches in a framework that considers 60 synthetic data sets. The results indicate that no single approach leads to the best results for all data sets considered, but rather highlights the strengths and weaknesses of the different approaches, depending on the application at hand. Two real-world data sets are also included to demonstrate that the modeling approaches selected from the systematic framework lead to good results.
Overall, the paper collection in this special issue provides a starting point for solving some of the most critical challenges surrounding EVA and its application to assess a wide range of natural hazards. The EVAN conference series will continue to provide a platform for scientists and practitioners to engage in conversations and initiate collaborations which ultimately benefit our society; the fifth conference will take place in Miami in 2022 and we hope to see you there. We would like to thank all the authors and reviewers who were involved in this special issue, and we hope you enjoy reading it.