the Creative Commons Attribution 4.0 License.
the Creative Commons Attribution 4.0 License.
 | 29 Apr 2021
Extreme wind return periods from tropical cyclones in Bangladesh: insights from a high-resolution convection-permitting numerical model
Hamish Steptoe
Theodoros Economou
We use high-resolution (4.4 km) numerical simulations of tropical cyclones to produce exceedance probability estimates for extreme wind (gust) speeds over Bangladesh. For the first time, we estimate equivalent return periods up to and including a 1-in-200 year event, in a spatially coherent manner over all of Bangladesh, by using generalised additive models. We show that some northern provinces, up to 200 km inland, may experience conditions equal to or exceeding a very severe cyclonic storm event (maximum wind speeds in ≥64 kn) with a likelihood equal to coastal regions less than 50 km inland. For the most severe super cyclonic storm events (≥120 kn), event exceedance probabilities of 1-in-100 to 1-in-200 events remain limited to the coastlines of southern provinces only. We demonstrate how the Bayesian interpretation of the generalised additive model can facilitate a transparent decision-making framework for tropical cyclone warnings.
Please read the corrigendum first before continuing.
-
Notice on corrigendum
The requested paper has a corresponding corrigendum published. Please read the corrigendum first before downloading the article.
-
Article
(1464 KB)
-
The requested paper has a corresponding corrigendum published. Please read the corrigendum first before downloading the article.
- Article
(1464 KB) - Full-text XML
- Corrigendum
- BibTeX
- EndNote


Bangladesh is one of the most disaster-prone countries in the world, ranking seventh in the 1999–2018 Long-Term Climate Risk Index (Eckstein et al., 2019). Large portions of the population are exposed to the multiple natural hazards, including those derived from tropical cyclones (TCs), such as high winds, storm surge and flooding (e.g. Dilley et al., 2005). In the last 30 years, TCs impacting Bangladesh, from the Bay of Bengal (BoB), have been responsible for damages of ca. USD 8.9 billion and affected 45 million people (EM-DAT, 2021), with average annual extreme-weather-event-related losses amounting to 1.8 % of GDP between 1990 and 2008 (International Monetary Fund, 2019b). The wider north Indian Ocean basin averages five cyclones per year (accounting for ca. 7 % of global tropical cyclone activity) (Sahoo and Bhaskaran, 2016); however, there is some indication of a decrease in TC frequency (Alam et al., 2003; Mohapatra et al., 2017; Rao, 2004; Singh et al., 2019) and an increase in cyclone intensity (Balaguru et al., 2014) that is projected to continue under a warming climate (Knutson et al., 2020).
Recently, the International Monetary Fund (2019b) highlighted the early response Bangladesh is taking to the challenges posed by climate change; however, they also emphasise the importance of insurance mechanisms to enhance financial cover against impacts of natural disasters (International Monetary Fund, 2019a). Insurance facilitates disaster risk resilience and adaptation by transferring residual risk away from individuals and communities. Cost-effective and risk-informed sustainable development is based on the comprehensive understanding of hazards; the vulnerability of economies, societies and governments; and the exposure of society, people and belongings (UNDRR, 2019), but the lack of understanding of one or more of these components frequently limits the use of insurance mechanisms in many regions of the world most at risk from weather and climate hazards. This leaves significant populations around the world more vulnerable to the economic consequences of events that are otherwise manageable in countries with well-developed insurance markets (von Peter et al., 2012).
Detailed understanding of hazards is an essential part of understanding risk, but a relatively sparse meteorological observational network and interrupted non-continuous data records impose fundamental constraints on the description of TC hazards. Simulations of tropical cyclones in the BoB remain challenging for the current generation of seasonal forecasting systems (Camp et al., 2015), global climate models (Shaevitz et al., 2014) and reanalyses (Hodges et al., 2017), partly due the relatively coarse spatial and temporal resolution of the numerical simulations. It is well understood that large-scale thermodynamics and vertical wind shear have a significant impact on TC intensity, but there are also numerous vortex, convective, turbulent and frictional dissipative processes (e.g. Bryan and Rotunno, 2009; Nolan et al., 2007; Tang et al., 2015 amongst others) that occur on much smaller scales and also influence TC intensity, the impacts of which are not captured in low-resolution modelling. For example, extreme gusts associated with vigorous (deep) convection will generally be underestimated without kilometre-scale grid spacing that can explicitly resolve deep convection (e.g. Leutwyler et al., 2017; Weisman et al., 1997). More generally, as summarised by Leutwyler et al. (2017, and references therein), grid spacings of O(1 km) are comparable to the size of the particularly energetic eddies in the planetary boundary layer.
Previous insights into TC hazards affecting Bangladesh focus on compiling catalogues of events (see Alam and Dominey-Howes, 2015, and references therein), or apply statistical analysis to event catalogues (e.g. Bandyopadhyay et al., 2018; Bhardwaj et al., 2020), and can only provide limited insight into the spatial extent, variability and magnitude of events based on first-hand eyewitness reports and limited observational records. Other authors take a parametric wind-field approach, combing the geostrophic (gradient) wind with a planetary boundary layer model to produce hazard maps at kilometre-scale resolution (e.g. Done et al., 2020; Krien et al., 2018; Tan and Fang, 2018); although this is a relatively computationally inexpensive approach, the quality of the result appears highly variable between global TC basins. Additionally, there are several holistic risk assessment views that combine multiple sources of hazard data, recognising that there are multiple hazards associated with TCs and that a combined risk assessment is non-trivial. However, these techniques are often limited to particular events (e.g. Hoque et al., 2016, 2019) or particular areas (e.g. Alam et al., 2020). In both cases, the quality of hazard and/or risk assessment is limited by available observational and track data.
In this study we seek to improve our understanding of the historical extreme gust speed hazard associated with recent TCs. To address the lack of observation data in this region, we use the latest-generation Met Office regional model over the BoB to simulate nine versions of 12 historical tropical cyclone cases representing 1979–2019. This generates spatially and temporally consistent counterfactual simulations (relative to observed TC cases), albeit limited by the constraints of the model configuration and computational resources. This ensemble configuration enhances our understanding of how each cyclone may evolve if a similar event were to happen again. We combine the ensemble information in a spatially coherent manner to produce hazard maps at 4.4 km resolution over Bangladesh for extreme wind (gust) hazards. Using Bayesian inference, we estimate gust speed exceedance intervals (return periods) across all of Bangladesh and demonstrate how this information can be directly integrated into a decision-making framework.
Tropical cyclone simulations are derived from a nine-member ensemble for 12 historical events, using the latest-generation Met Office Unified Model (Brown et al., 2012) convection-permitting regional atmosphere configuration RAL2-T, based on Bush et al. (2020) – hereafter referred to as RAL2. The RAL2 4.4 km domain avoids placing model boundaries over the Himalayas and covers Nepal, Bhutan, Myanmar, most of India, and parts of the Tibetan Plateau. To ensure model stability over this mountainous terrain, the RAL2 model was run with a 30 s time step. Each ensemble member requires a 24 h spin-up period as the RAL2 model adjusts from weak initial conditions taken from the ERA5 driving global model (of Hersbach et al., 2020). This initial 24 h period of model data is discarded in subsequent analysis and data files. Thereafter, each ensemble member is free running for a further 48 h, with hourly boundary conditions provided by ERA5. Collectively, the ensembles members sample a range of lead times before landfall from 12–36 h.
The parameterised RAL2 gust diagnostic represents a prediction of the 3 s average wind speed at every time step. The maximum of this 3 s average speed over an hour is then taken to give the hourly maximum 3 s gust speed. While not truly resolving deep convection, RAL2 is able to explicitly represent deep convective processes within the resolved dynamics. At these kilometre-scale resolutions the lower horizontal size limit of convective cells is still set by the effective resolution of 5 to 10 times the grid length (Boutle et al., 2014; Skamarock, 2004), and consequentially we expect that turbulent processes, as well as the dominant turbulent length scale, will still be under resolved in this 4.4 km dataset. The RAL2 model uses a gust parameterisation based on 10 m wind speed with scaling proportional to the standard deviation of the horizontal wind that also accounts for friction velocity, atmospheric stability and roughness length (Lock et al., 2019).
We use the ensemble output to first derive event “footprints” – a common method within the catastrophe modelling community to define peak hazard relating to a given event. In this case, footprints are based on the maximum wind gust speed achieved within each model run of 48 h, which implicitly collapses the time dimension to leave a 2D gust field in a longitude–latitude frame of reference. Although the original regional model data in Steptoe et al. (2021) covers a significant portion of the BoB, we crop the data to approximately 87.5 to 93.0∘ E and 20.5 to 27.5∘ N.
In general, median peak gust speeds from the RAL2 model ensemble are found to be 22 to 43 m s−1 faster compared to ERA5 reanalysis, but it is known that extreme gusts associated with vigorous convection in ERA5 are generally underestimated, sometimes by a factor of 2 (Owens and Hewson, 2018). For wind speed, the RAL2 median difference is 18 m s−1 faster compared to ERA5 and 5 and −3 m s−1 compared to the International Best Track Archive for Climate Stewardship data (IBTrACS, of Knapp et al., 2010, 2018) for the India Meteorological Department and Central Pacific Hurricane Center, Honolulu, regional forecast centres respectively. Further details of the regional modelling process and validation against IBTrACS and ERA5 reanalysis can be found in Steptoe et al. (2021).
2.1 Generalised additive modelling (GAM)
To summarise information from all nine regional model ensemble member footprints into a coherent spatial summary of the tropical cyclone hazard, we use a generalised additive model (GAM), after Hastie and Tibshirani (1986), based on the R package mgcv of Wood (2017), as a flexible spatial regression framework. GAMs are an extension of generalised linear modelling that use smooth functions of covariates to build a linear predictor and have previously been applied in similar geospatial natural hazard assessments, such as storm count data over Europe (Youngman and Economou, 2017), spatial prediction of maximum wind speed over Switzerland (Etienne et al., 2010) and return level estimation for US wind gusts (Youngman, 2019). In each case, these studies incorporate spatial information into the GAMs formation, thereby implicitly respecting the spatial interaction (autocorrelation) present in the source data, and use the spatial dependence as a source of information.
For our purposes, we use a Gaussian location-scale (GLS) model family (Wood et al., 2016) to describe the natural logarithm (log) of the gust speed, where both the mean and the log of the standard deviation are smooth functions of predictors – in this case, longitude and latitude. Although other model families were trialled (such as generalised extreme value and gamma distributions), the GLS family was found to have the best trade-off between computational efficiency and model fit. The general form of our GAM is
where yi(s) is the response variable, namely gust speed for each ensemble member i in each grid cell , N=207 081. fμ (a function of the mean) and fσ (a function of the variance) are each defined as thin-plate regression splines (Wood, 2003) – isotropic smooth functions of covariates longi and lati (longitude and latitude respectively). Each smooth function requires a user-defined maximum amount of desired flexibility (wiggliness), traditionally quantified by the number of knots. This flexibility is objectively penalised within mgcv to avoid overfitting, while optimally explaining the trends in the data (Wood, 2003). Trial and error shows that O(600) knots are required to construct thin-plate spline basis functions that avoid over-smoothing given the resolution of the regional model data. Under this model formulation, the mean μ(s) can be interpreted as an aggregated prediction across the ensemble members.
The smooth model parameters are estimated using restricted maximum likelihood (REML). However, once the model is fitted, it can be shown that it has a Bayesian interpretation. In particular, the coefficients of the smooth functions are assumed to have a multivariate normal prior distribution, whose covariance matrix determines the wiggliness penalisation (see Wood, 2017, for further details). A Gaussian approximation of the posterior distribution for the coefficients then provides a multivariate normal distribution as the posterior (Gelman et al., 2013). In practice, once a GAM model is fitted to each named storm, under the Bayesian interpretation, we obtain 1000 simulations from the posterior distribution of the smooth function coefficients via random draws from a multivariate normal distribution (MVN). The MVN mean vectors are the REML coefficient estimates, and the MVN covariance is derived as a function of the covariance matrix of the sampling distribution of the model coefficients. In Bayesian inference, sampling from the posterior distribution implies we can then derive samples from the posterior predictive distribution of gust speed for each grid cell, yi(s). The predictive distribution, a unique feature of Bayesian inference, fully quantifies estimation uncertainty and variability in gust speed across ensemble members. We take 1000 samples from the posterior predictive distribution and construct prediction intervals based on the empirical quantiles of these samples. To aggregate gust information from all ensembles of all named storms, we pool the 1000 posterior predictive simulations from each event into a total of 12 000 samples from the predictive distribution of gust speed across all 12 events. Figure 1 summarises the key parts of this process.
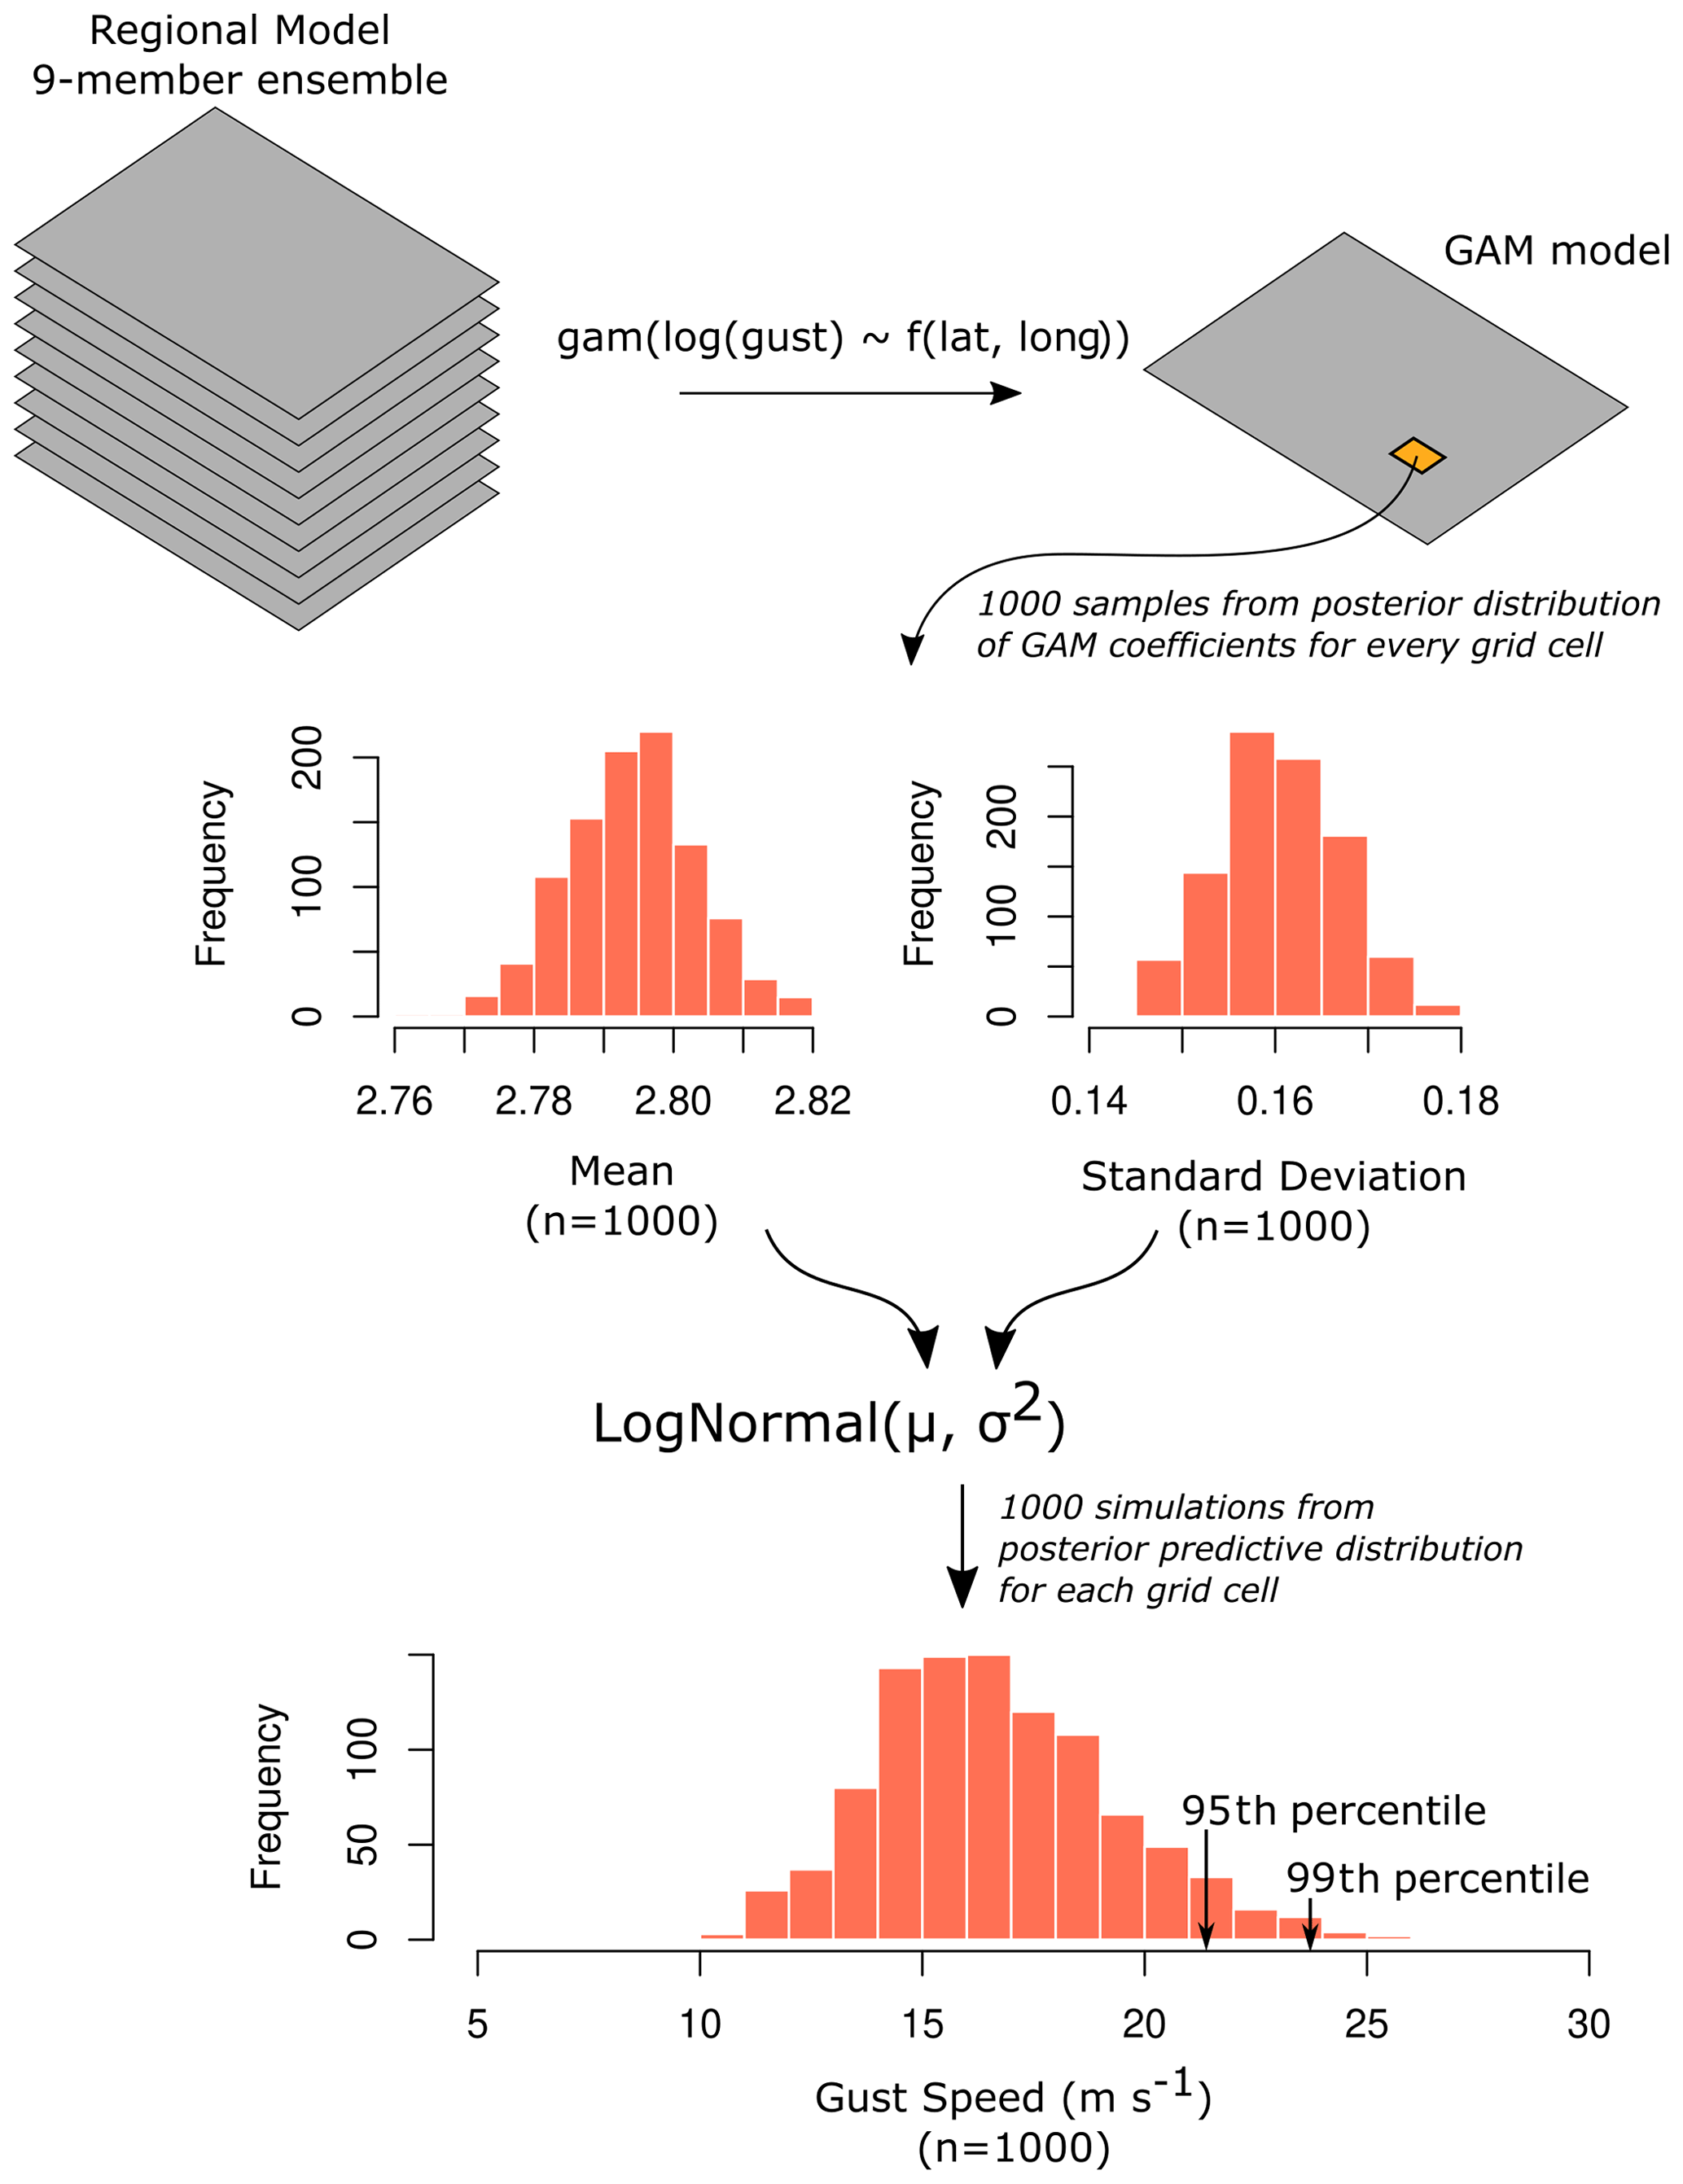
Figure 1Summary of generalised additive modelling and the derivation of the posterior predictive gust speed distribution. The posterior predictive distribution is derived for each grid cell of the regional model domain. Gust speed prediction intervals are found from the percentiles of the posterior predictive distribution.
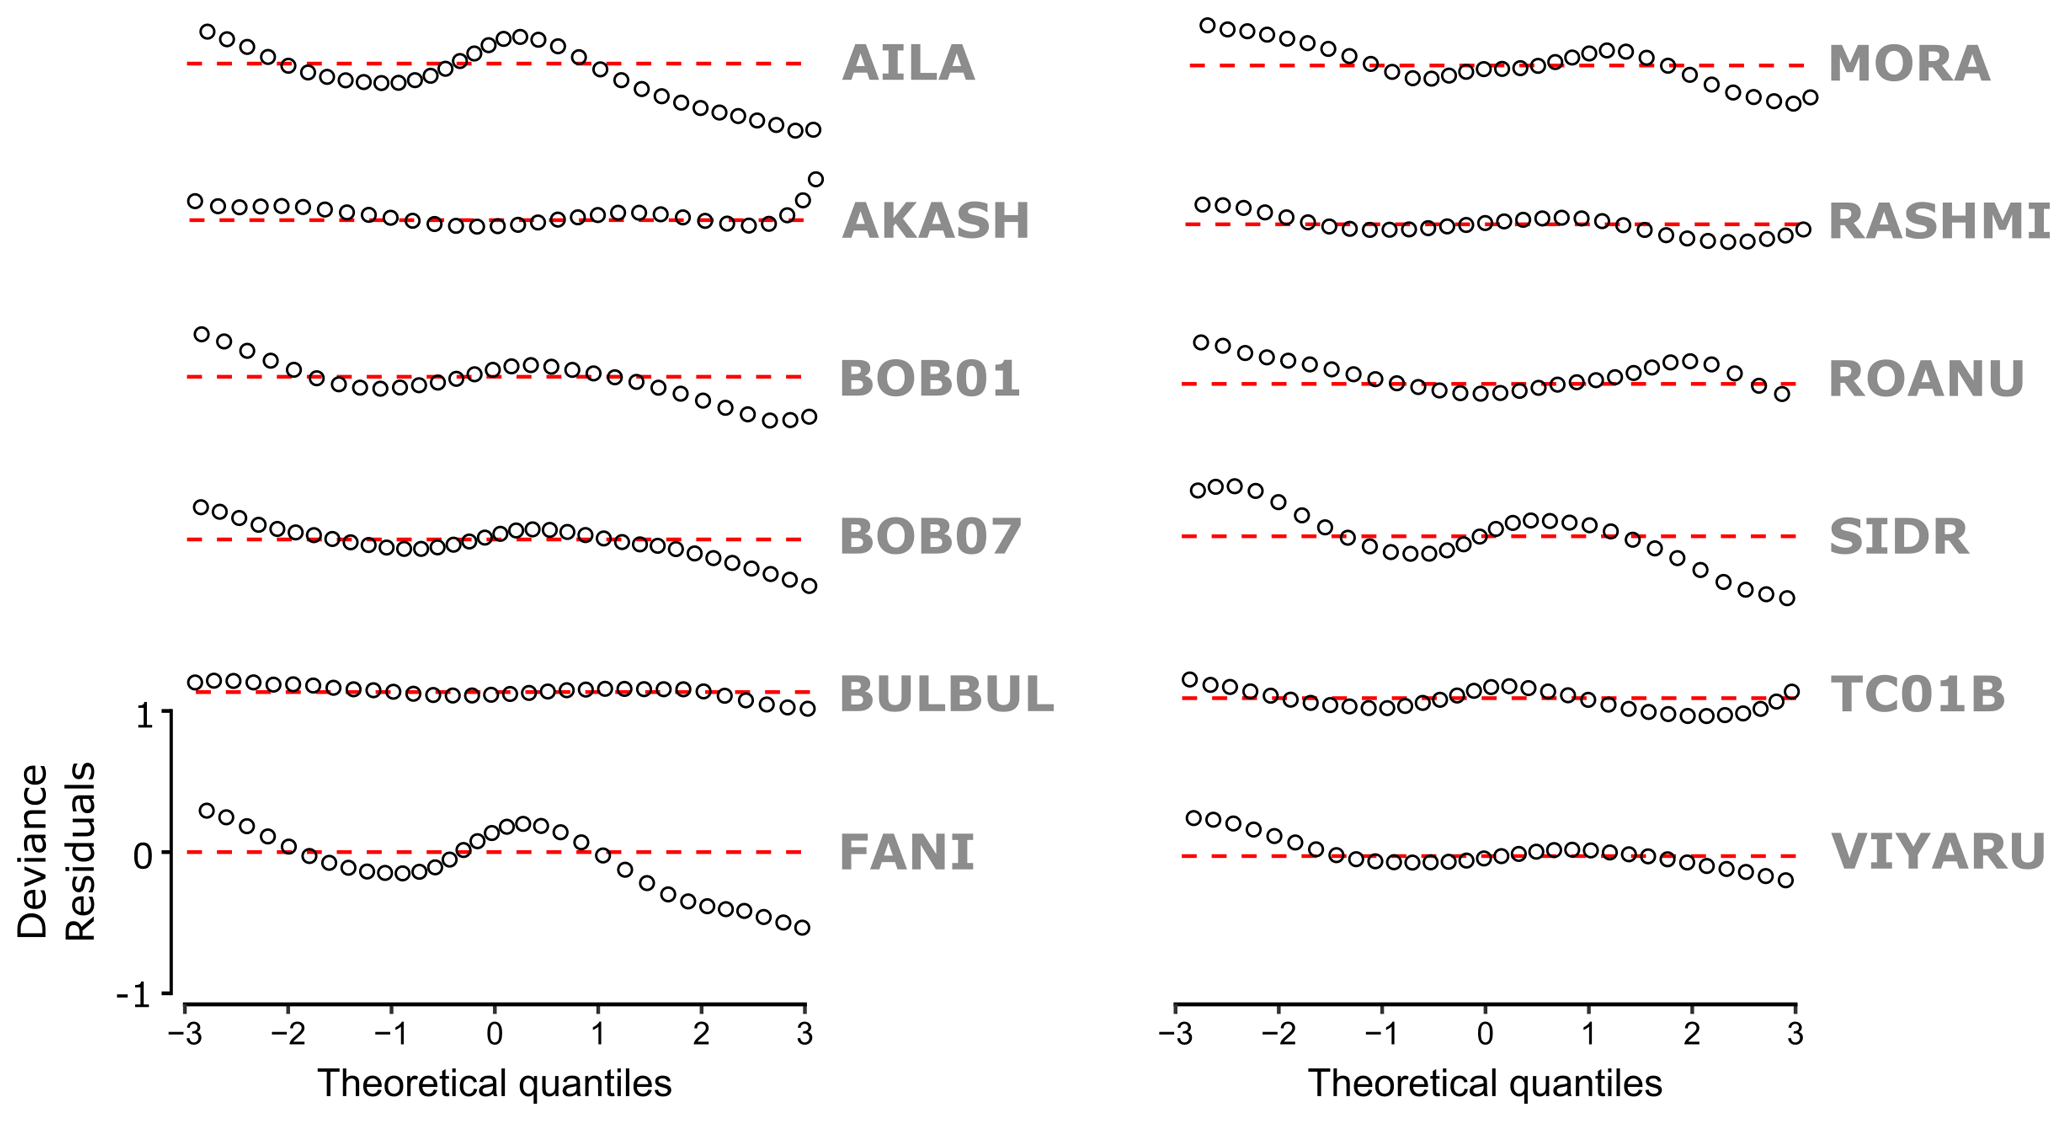
Figure 2Detrended quantile–quantile (worm) plots for each GAM model per storm. We discretise the quantiles into 50 bins (open circles). The red dashed line represents zero deviance between data and theoretical quantiles defined in the GAM. Where model quantiles deviate below (above) the zero deviance line, this implies that the model predictions are overestimated (underestimated) relative to the data: for any given theoretical model quantile, the data quantile is lower (higher). Deviance residuals respect the model family used when fitting the GAM and are calculated via the simulation method of Augustin et al. (2012).
Assessing the GAM specification for yi(s) with detrended quantile–quantile (worm) plots (based on the method of Augustin et al., 2012), Fig. 2 shows that generally storms are well represented. For some storms (such as Aila, BOB01, BOB07, Bulbul, Rashmi and TC01B) there is a tendency for the GAM to overestimate the tails of the distribution (positive kurtosis) relative to the 4.4 km data, as indicated by quantile–quantile plot points falling below the zero residual line. In these cases, the GAM will overestimate extremes. Akash is the only storm where maximum gust speeds are likely to be underestimated in the GAM relative to the 4.4 km data, but only for extreme upper-tail gust speeds. Checking for the consistency of variance over the range of predictor values, shows that the distribution of the residuals is stationary for both longitude and latitude (not shown).
Aggregating the 12 historical tropical cyclones ensembles, Fig. 3 shows the 50th, 95th and 99th percentiles of the posterior predictive maximum gust speed distribution across Bangladesh. Based on historical cases, the provinces of Chittagong, Barisal and Khulna are most exposed to high wind speed associated with tropical cyclone gusts, whilst Sylhet and Rajshahi are least exposed. The cities of Chittagong and Cox's Bazar are particularly at risk of maximum tropical cyclone gust speeds exceeding 45 m s−1 (87 kn) and 60 m s−1 (116 kn) respectively, in 5 % of events making landfall. Maximum gust speeds in Dhaka are likely to reach 35 m s−1 (68 kn) in 1 % of events, 25 m s−1 (48 kn) in 5 % to 50 % of events. We note that despite the northern provinces of Rajshahi, Rangpur and Mymensingh being over 200 km inland, they experience 95th and 99th percentile gust speeds greater than those observed in the populated provincial capitals of Dhaka, Barisal and Khulna. These extreme percentiles reflect the influence of cyclones Fani (May 2019) and Aila (May 2009) which had strong persistent in-land tracks.
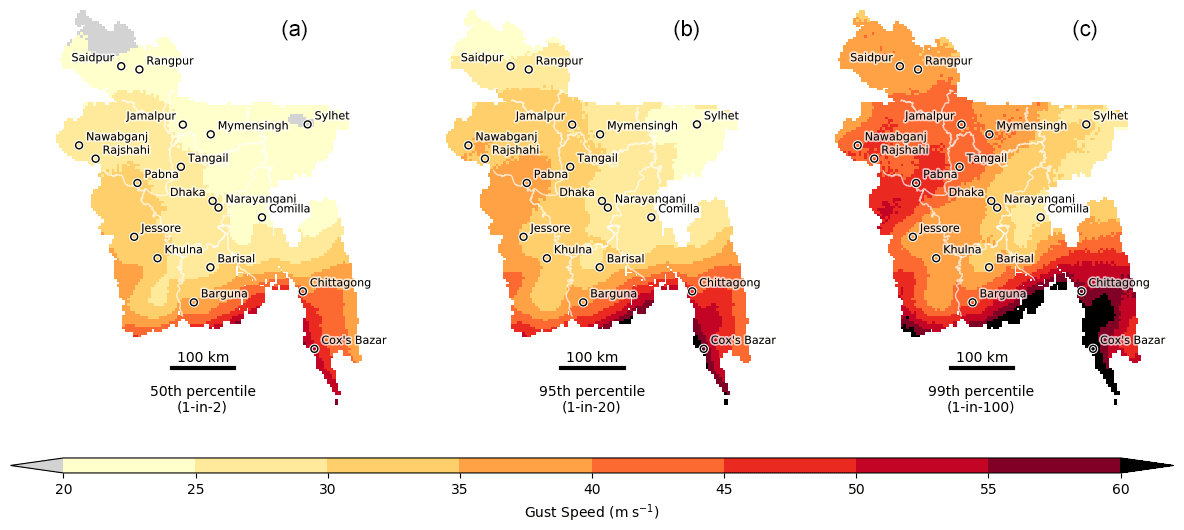
Figure 3Gust speed exceedance thresholds for the 50th (a), 95th (b) and 99th (c) percentile credible intervals. The 50th, 95th and 99th percentiles represent the maximum gust speeds expected from a 1-in-2, 1-in-20 and 1-in-100 event respectively (conditional on a tropical cyclone making landfall over Bangladesh). These credible intervals are based on the posterior model distribution derived from all 12 named tropical cyclones, conditional on a tropical cyclone making landfall in Bangladesh. The 20–60 m s−1 gust speed range roughly corresponds to a range of 39–117 kn, equivalent to the cyclonic to super cyclonic storm classification used in Bangladesh. Province boundaries are outlined in white, with the 18 most populated towns and cities marked by circles.
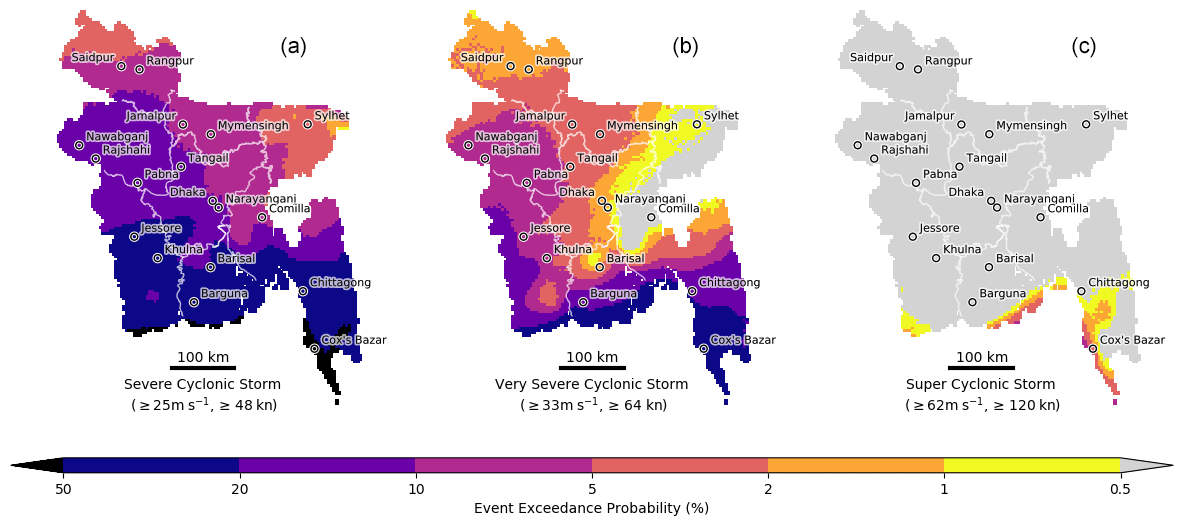
Figure 4Event exceedance probabilities for a severe cyclonic storm (a), very severe cyclonic storm (b) and super cyclonic storm (c) WMO tropical cyclone classifications used in the Bay of Bengal (WMO, 2018). Event exceedance probabilities show the likelihood of a maximum tropical cyclone gust speed being greater than or equal to the corresponding classification wind threshold, conditional on a tropical cyclone making landfall over Bangladesh. An exceedance threshold of 50 % (0.5 %) represent a 1-in-2 (1-in-200) chance of a tropical cyclone exceeding a given threshold. Areas where the exceedance probability is >50 % (<0.5 %) are shaded black (grey). Province boundaries are outlined in white, with the 18 most populated towns and cities marked by circles.
The gust speed hazard can also be considered in terms of the probability of exceeding a threshold. Using WMO thresholds for tropical cyclone wind speeds (WMO, 2018), Fig. 4 shows that significant areas of southern provinces (Khulna, Barisal and Chittagong) will experience maximum wind speed in excess of “severe” cyclonic storm condition ≥25 m s−1 (48 kn) with a probability of 20 %–50 % per tropical cyclone event. At higher wind speeds, only areas within 30 km of the coastline are predicted to experience gust speeds in excess of “very severe” cyclonic storm conditions ≥33 m s−1 (64 kn) with the same likelihood (20 %–50 % per event). Wind speeds in excess of “super cyclonic” conditions ≥62 m s−1 (120 kn) are predicted to be exceeded with a likelihood of 0.5 %–5 % per event in limited areas south of Chittagong, with a small area in the vicinity of Cox's Bazar seeing exceedances of 5 %–10 % per event.
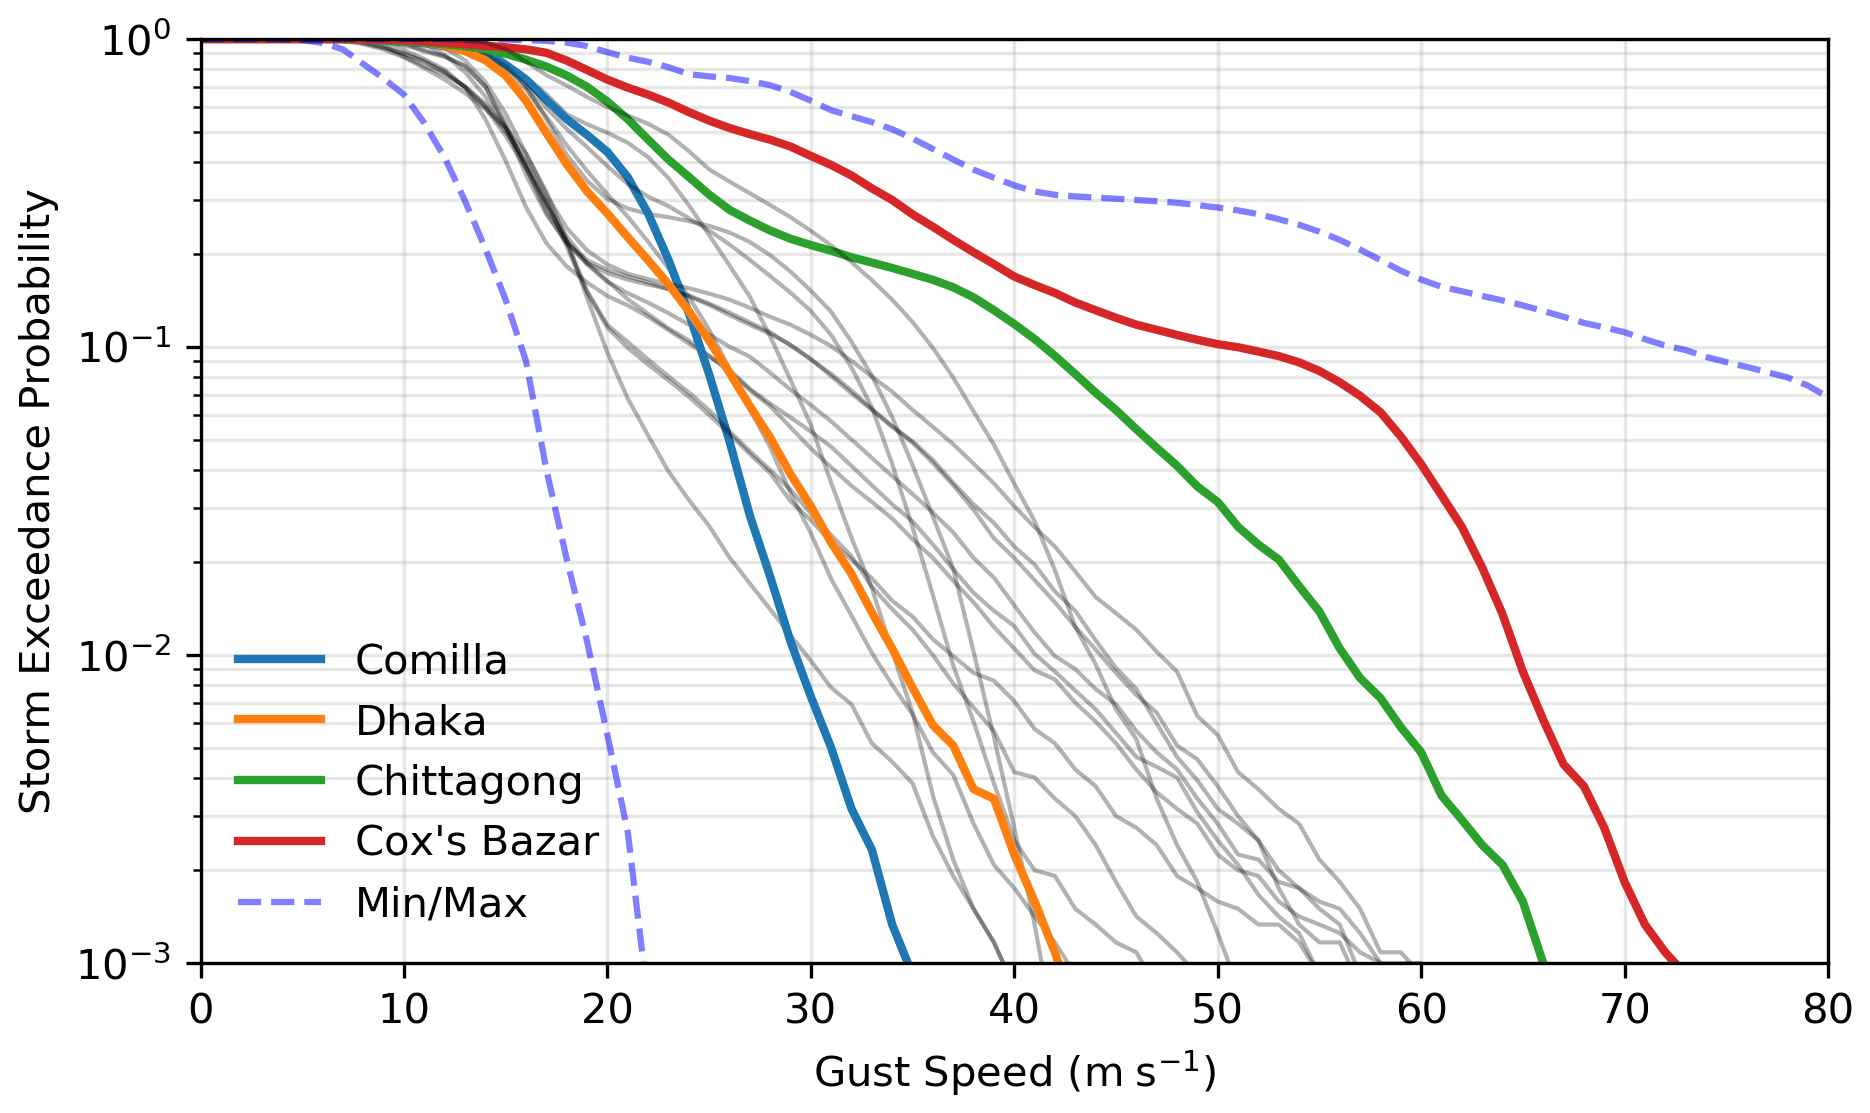
Figure 5Exceedance probability curves for 18 of the most populated towns and cities in Bangladesh (grey lines), with four key cities highlighted: Dhaka (orange), Comilla (blue), Chittagong (green) and Cox's Bazar (red). For reference, the minimum and maximum range of exceedance probabilities (across all of Bangladesh) are represented by the dashed lines. Note that storm exceedance probability is shown on a log scale.
In addition to specific thresholds, exceedance probability curves (Fig. 5) summarise information for gust speeds up to 80 m s−1 (155 kn) for 18 of the most populated towns and cities in Bangladesh (grey lines) with four key cities highlighted. The coastal cities of Cox's Bazar and Chittagong are unsurprisingly the population centres most exposed to high gust speeds. Chittagong and Cox's Bazar are roughly 2.5 and 4.8 times more likely to experience tropical cyclones exceeding very severe cyclonic storm conditions than Dhaka for a landfalling cyclone.
3.1 Decision-making under uncertainty
By defining a loss function, it is possible to exploit the information in the Bayesian posterior predictive distributions to create a warning model based on decision theory (Lindley, 1991). Following Economou et al. (2016), defining a loss function L(a,x) to quantify the consequences of the various actions a (e.g. issuing warnings) that could be taken in the event of a landfalling TC of varying intensities x (see Table 1 for an example of four discrete gust categories), provides a method of mapping predictive information onto an action. The optimum action a*, given some predictive information y (i.e. predictions of gust speed yi(s) from the GAM), is one that minimises the loss L(a,x) taking into account the uncertainty in the predictive information, expressed as the probability of TC intensity x given predictive information :
In practice, p(x|y) can be easily computed from the predictive samples from the GAM, while the loss function L(a,x) is defined subjectively. Defining L(a,x) is a non-trivial process, as it should encapsulate the relative cost of false-positive (i.e. where action against a TC was taken but the TC did not occur) and false-negative (i.e. where no action was taken but the TC did occur) events. For the purposes of demonstrating the principle of this approach, we define a dummy loss function in Table 1, based on the four TC warning levels used in Bangladesh (WMO, 2018). Here relative loss is defined on a 100-point scale, where 0 equates to no loss associated with a given landfalling event, and 100 equates to maximum loss. Evacuation typically takes places at the “great danger” level.
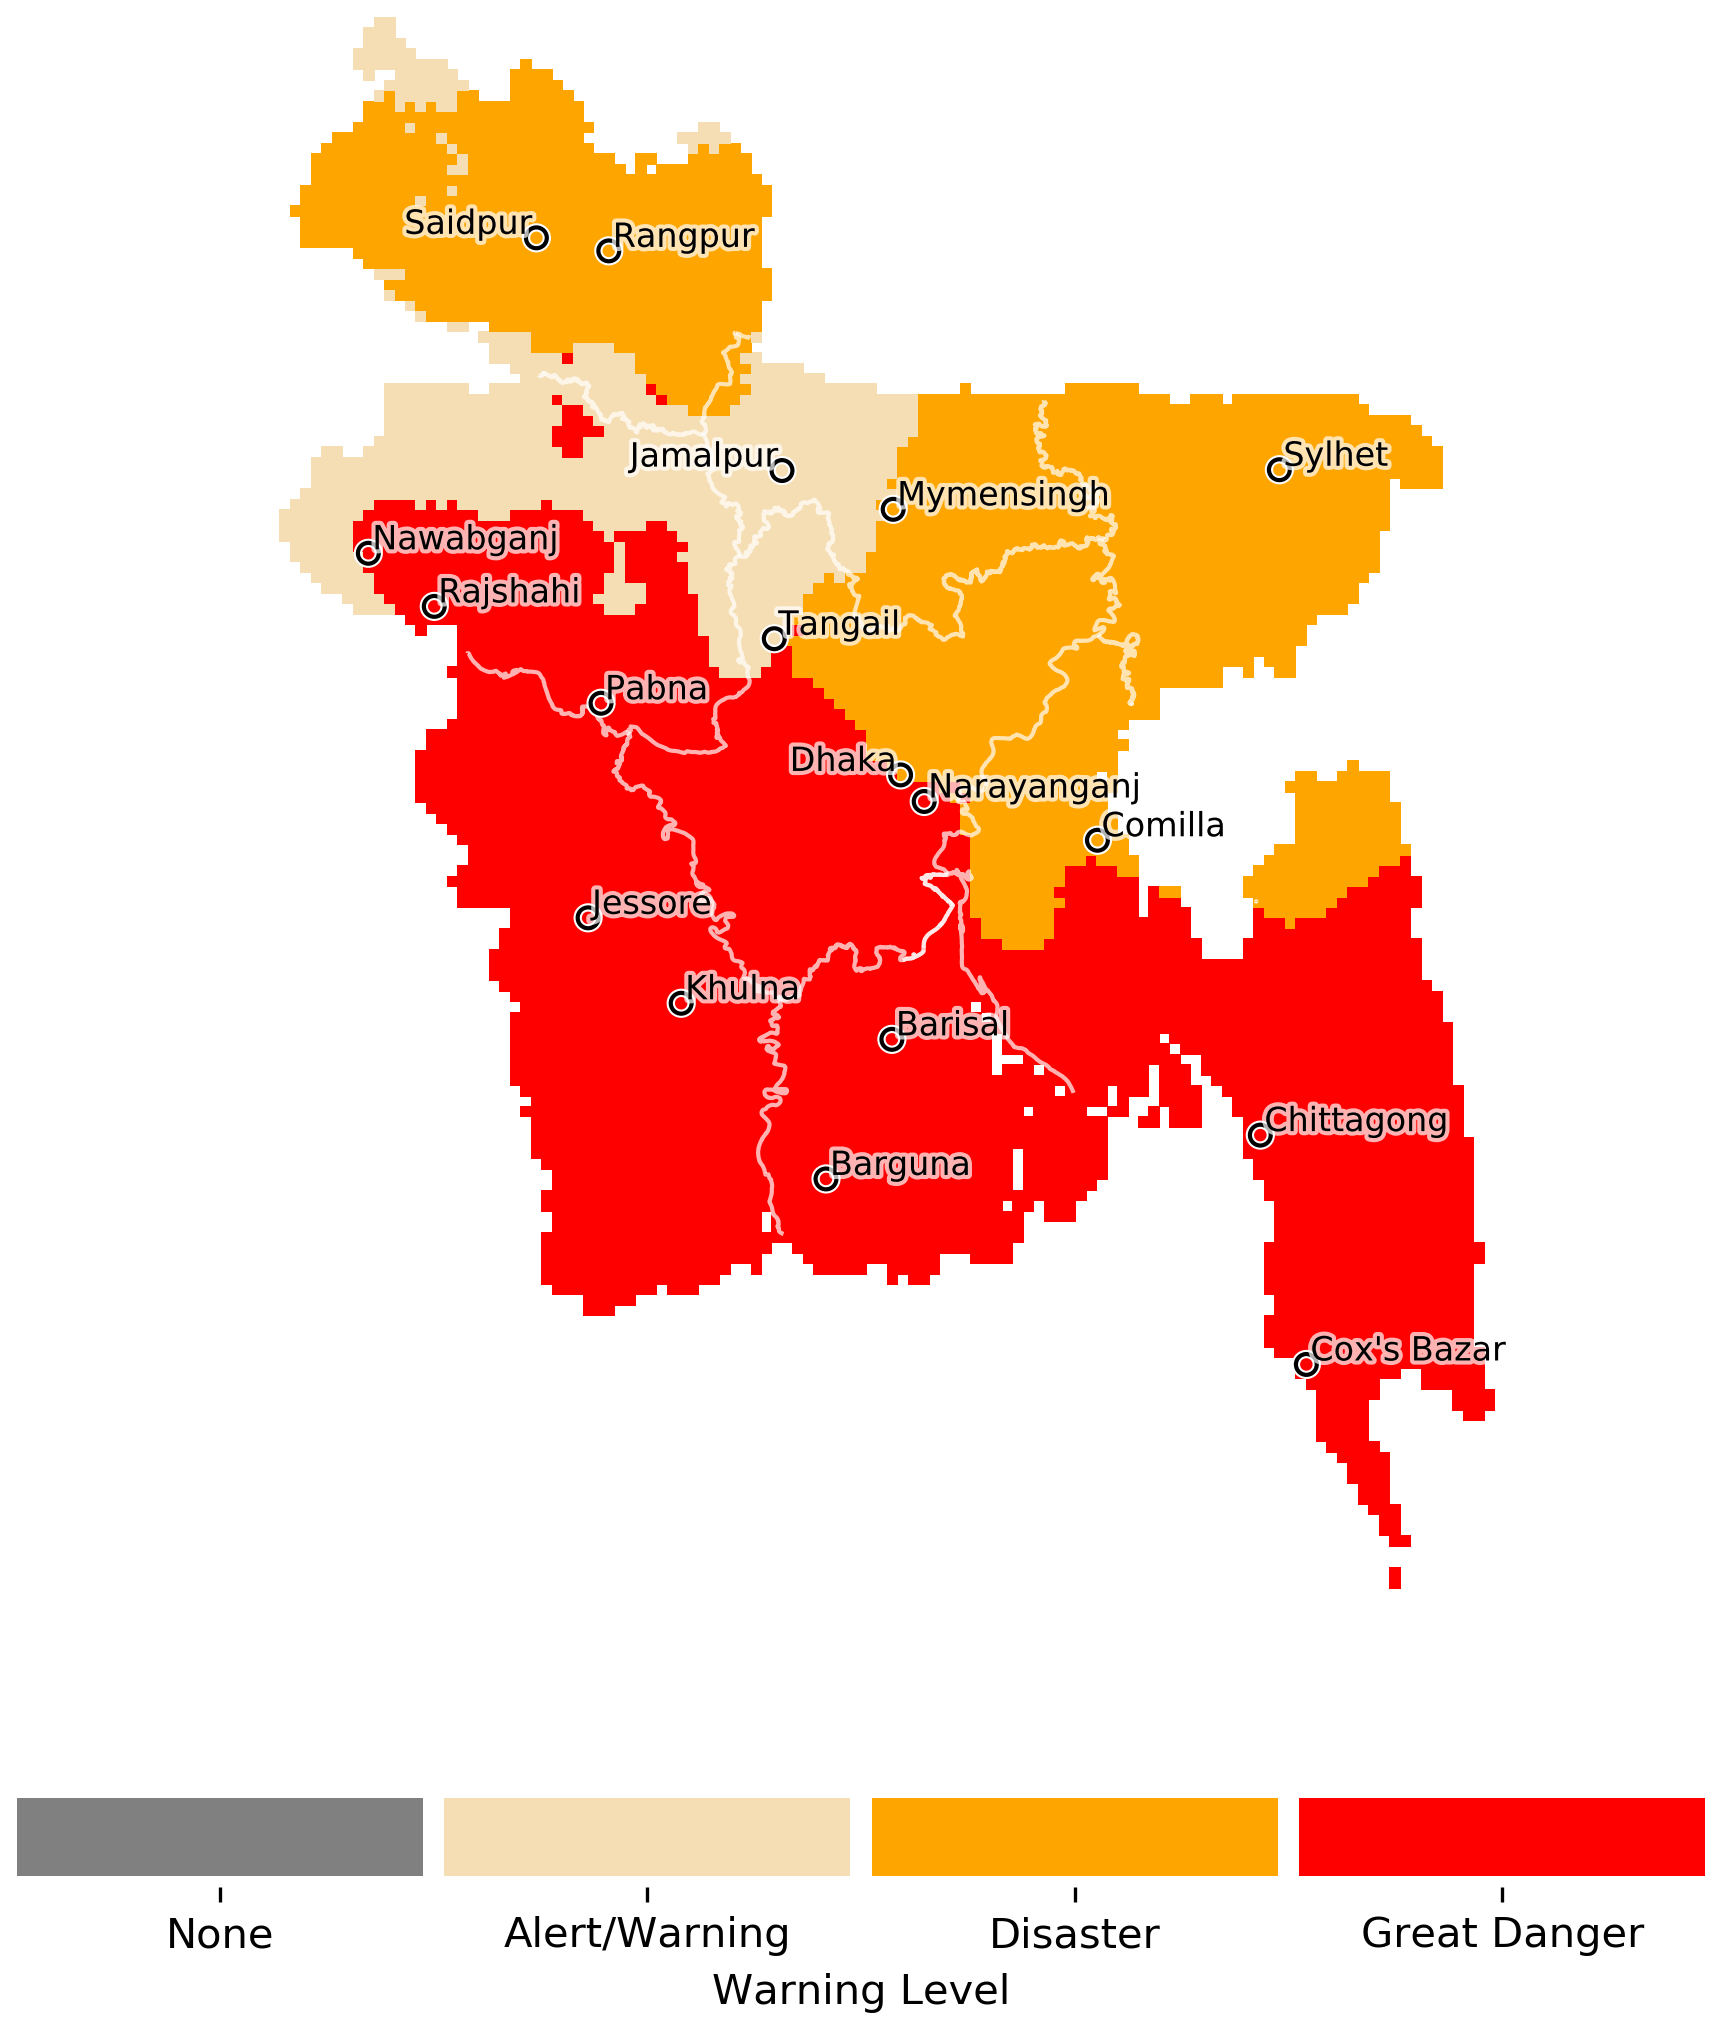
Figure 6Example warning status given an impending landfalling tropical cyclone over Bangladesh. These warnings represent the most effective action minimising the loss as defined in Table 1.
Table 1Dummy loss function for actions associated with four Bangladesh TC warning levels and their associated wind speed intensity. In this case loss is defined on a 100-point scale, where 0 means no loss and 100 means maximum loss, associated with a given landfall TC event.
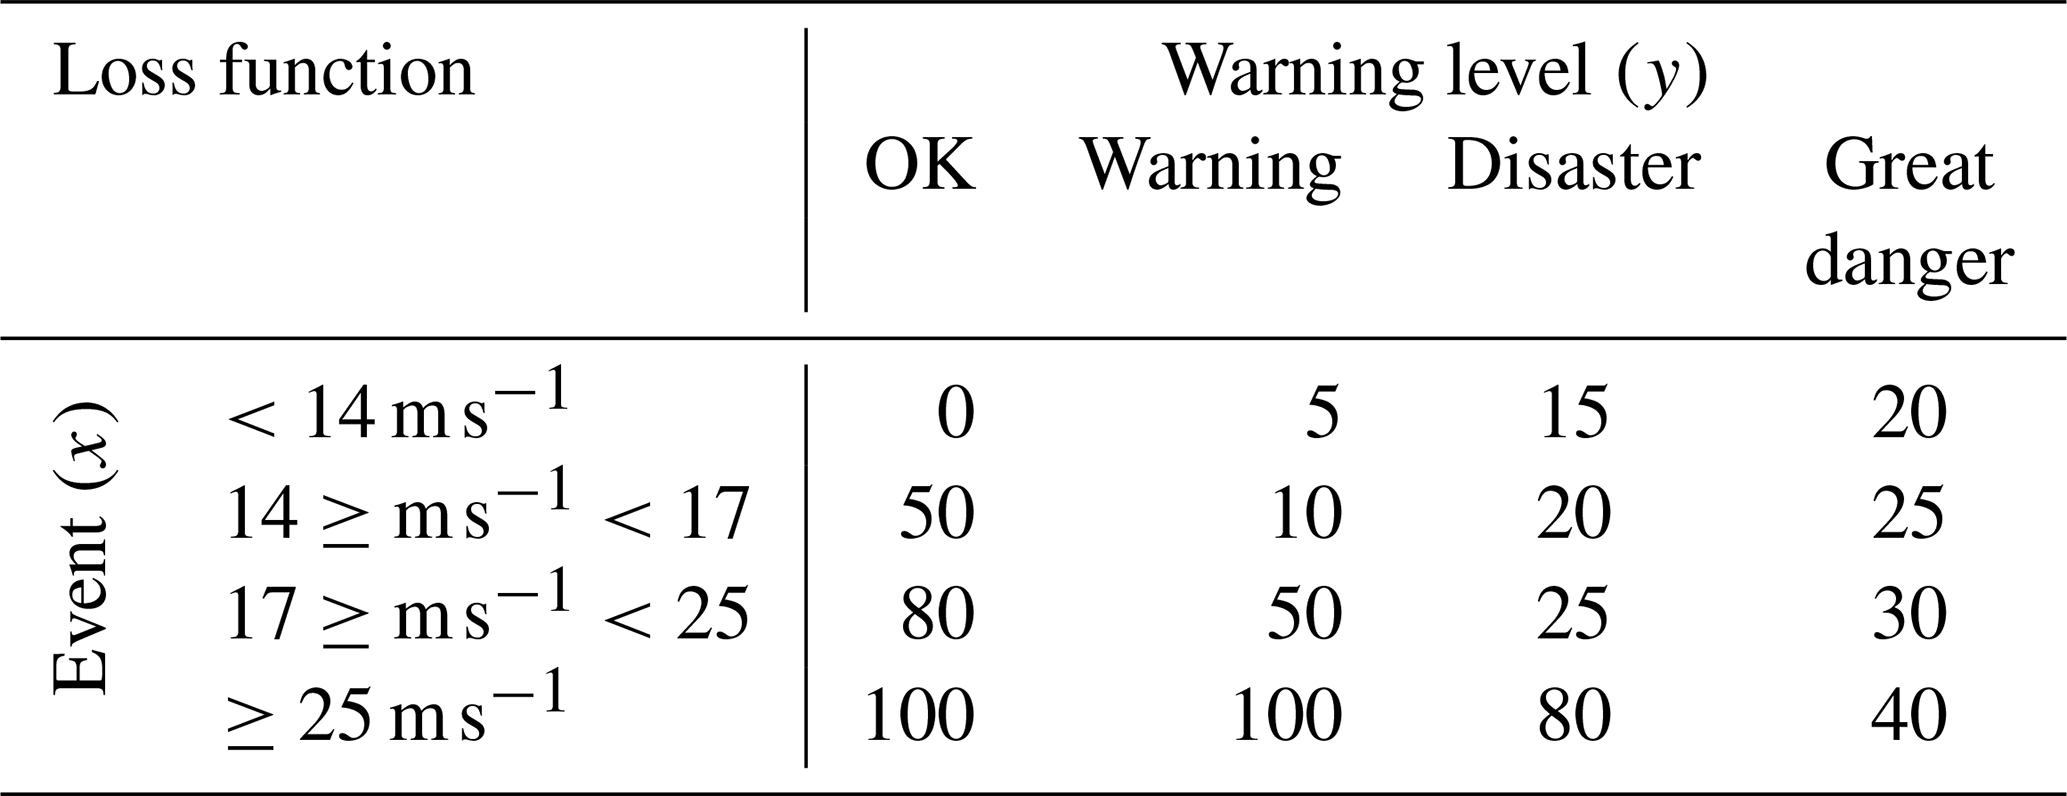
Figure 6 illustrates the optimal warning that should be issued based on Table 1 and the range of gust speed information summarised by our GAM. This can be interpreted as the default optimal action to take for planning and preparation purposes, and in this case, the northern extent of TC risk, as highlighted in Figs. 2 and 3, is again reflected in the warning level, but in practice separate loss functions could be defined for each province or for different economic sectors of society. By understanding the exposure, vulnerability and decision-making process of each user, bespoke warnings could be issued. For operational forecasting purposes, the optimal action (a*) would be updated once forecast information of a TC becomes available specific to an impending event. Actions are strongly conditioned by the loss function and the accuracy of the gust speed information, but our aim here is to demonstrate a proof-of-concept transparent workflow that clearly translates hazards into actions and which is equally applicable to short-term numerical weather prediction information as it is to hazard maps derived from historical events.
3.2 Limitations
Despite the ensemble simulation framework, our analysis is still restricted to only 12 historical cases, which represent the recent 40-year period. The number of events was determined by the availability of source data (ERA5) for driving the regional model (RAL2), for TC events that made landfall over Bangladesh – in this case limited to the period of ERA5 data availability, which at the time of analysis extended back to 1979. Given the relatively low ERA5 resolution (31 km), we selected TCs defined as at least a Category 1 event in the IBTrACS database to be sure they would be identifiable within the low-resolution ERA5 data and could be downscaled by the RAL2 model.
The initial conditions posed in the regional model play a significant role in determining the outcome of each event. In forecasting situations this is desirable behaviour: well-chosen initial conditions ensure the model retains a realistic representation of reality. Even though the modelling domain that produced these 4.4 km data had the freedom to deviate in a physically plausible way (see Steptoe et al., 2021), it does not have the ability to sample the full spectrum of possible BoB tropical cyclone events. Simulations driven by a wider range of initial conditions, derived from a wider range of historical cases, would improve the sample size of cyclonic conditions on which this analysis is based. Note that this would not necessarily reduce uncertainty in exceedance thresholds (in a frequentist paradigm), but it would update our view (i.e. our posterior estimate) of what is credible within the continuum of possible tropical cyclone events. In Bayesian parlance, our posterior view of Bangladesh tropical cyclones would become our new prior belief if subsequent simulation data became available.
A different limitation is posed by the initial aggregation of the 4.4 km model over time. This removes our ability to draw inferences on annual occurrence of (or longer-term variability in) TC events. This means that our estimates of exceedance probabilities are conditional on a tropical cyclone event actually impacting Bangladesh. For the purposes of risk assessment, we do not feel this limitation is significant – current generation weather forecast models are capable of accurately predicting the landfall location and track of tropical cyclones in the BoB many days in advance (e.g. Mohanty et al., 2021; Singh and Bhaskaran, 2020). It should also be noted that, due to the computation expense of the 4.4 km data simulation, we only chose events that specifically impacted Bangladesh, so conclusions cannot be drawn on the frequency of other TCs within the wider BoB region.
Generalised additive models (GAMs) provide a useful framework for condensing spatial hazard information in an interpretable way, from multiple numerical model simulations, into a single spatially coherent hazard map. Using a restricted maximum likelihood approach to fit the GAM allows us to interpret model predictions in a Bayesian fashion that logically provides credible exceedance estimates. High-resolution convection-permitting numerical predictions of 12 historical cyclone events, in an ensemble model set-up, give an improved sense of the plausibility and likelihood of possible extreme events without being constrained by the lack of observational history in this region. Combining ensemble simulations with a GAM then allows us to robustly quantify the likelihood of maximum gust speed exceedances in a spatially coherent manner.
Our new maps of exceedance intervals show that north-western provinces of Bangladesh are relatively exposed to high-wind-speed hazards – in some areas the exceedance probabilities are equal to those experienced along the coast. Our hazard-to-decision-making framework suggests that these areas may need to be considered in an equivalent manner to coastal regions from a disaster risk reduction perspective. In coastal areas of Cox's Bazar and Chittagong we show super cyclonic conditions may occur as frequently as 1-in-20 to 1-in-100 years. We hope that these kilometre-scale hazard maps facilitate one part of the risk assessment chain to improve local ability to make effective risk management and risk transfer decisions. Future work to co-produce a proper loss function, given wind speed thresholds, would facilitate a method of transparent operational decision-making that could be used as the basis of an operational warning system.
Python, R and data analysis code, including the fitted GAM model, is available at https://doi.org/10.5281/zenodo.3953772 (Steptoe, 2020).
The data used in this study are available at https://doi.org/10.5281/zenodo.3600201 (Steptoe et al., 2020) and released under CC-BY 4.0.
HS prepared the manuscript, with input from TE, and undertook the data analysis. TE and HS jointly developed and coded the GAM model. TE developed and coded the decision-making framework used in Sect. 3.1.
The authors declare that they have no conflict of interest.
This study is part of the Oasis Platform for Climate and Catastrophe Risk Assessment – Asia (https://www.international-climate-initiative.com/en/details/project/oasis-platform-for-climate-and-catastrophe-risk-assessment-asia-18_II_165-3018, last access: 28 April 2021).
The authors thank Saiful Islam, Erasmo Buonomo, Richard Jones, Jane Strachan, Tamara Janes and two anonymous reviewers for comments that improved early versions of this paper.
This research has been supported by the International Climate Initiative (IKI) supported by the Federal Ministry for the Environment, Nature Conservation and Nuclear Safety, based on a decision of the German Bundestag.
This paper was edited by Animesh Gain and reviewed by two anonymous referees.
Alam, A., Sammonds, P., and Ahmed, B.: Cyclone risk assessment of the Cox's Bazar district and Rohingya refugee camps in southeast Bangladesh, Sci. Total Environ., 704, 135360, https://doi.org/10.1016/j.scitotenv.2019.135360, 2020.
Alam, E. and Dominey-Howes, D.: A new catalogue of tropical cyclones of the northern Bay of Bengal and the distribution and effects of selected landfalling events in Bangladesh, Int. J. Climatol., 35, 801–835, https://doi.org/10.1002/joc.4035, 2015.
Alam, M. M., Hossain, M. A., and Shafee, S.: Frequency of Bay of Bengal cyclonic storms and depressions crossing different coastal zones, Int. J. Climatol., 23, 1119–1125, https://doi.org/10.1002/joc.927, 2003.
Augustin, N. H., Sauleau, E.-A., and Wood, S. N.: On quantile quantile plots for generalized linear models, Comput. Stat. Data An., 56, 2404–2409, https://doi.org/10.1016/j.csda.2012.01.026, 2012.
Balaguru, K., Taraphdar, S., Leung, L. R., and Foltz, G. R.: Increase in the intensity of postmonsoon Bay of Bengal tropical cyclones, Geophys. Res. Lett., 41, 3594–3601, https://doi.org/10.1002/2014GL060197, 2014.
Bandyopadhyay, S., Zahirul, S. D., Khan, H., and Wheeler, D.: Cyclonic Storm Landfalls in Bangladesh, West Bengal and Odisha, 1877–2016, A Spatiotemporal Analysis, World Bank Policy Res. Work. Pap. no. WPS 8316, January 2018, World Bank, Washington, DC, 2018.
Bhardwaj, P., Singh, O., and Yadav, R. B. S.: Probabilistic assessment of tropical cyclones' extreme wind speed in the Bay of Bengal: implications for future cyclonic hazard, Nat. Hazards, 101, 275–295, https://doi.org/10.1007/s11069-020-03873-5, 2020.
Boutle, I. A., Eyre, J. E. J., and Lock, A. P.: Seamless Stratocumulus Simulation across the Turbulent Gray Zone, Mon. Weather Rev., 142, 1655–1668, https://doi.org/10.1175/MWR-D-13-00229.1, 2014.
Brown, A., Milton, S., Cullen, M., Golding, B., Mitchell, J., and Shelly, A.: Unified Modeling and Prediction of Weather and Climate: A 25-Year Journey, B. Am. Meteorol. Soc., 93, 1865–1877, https://doi.org/10.1175/BAMS-D-12-00018.1, 2012.
Bryan, G. H. and Rotunno, R.: The Maximum Intensity of Tropical Cyclones in Axisymmetric Numerical Model Simulations, Mon. Weather Rev., 137, 1770–1789, https://doi.org/10.1175/2008MWR2709.1, 2009.
Bush, M., Allen, T., Bain, C., Boutle, I., Edwards, J., Finnenkoetter, A., Franklin, C., Hanley, K., Lean, H., Lock, A., Manners, J., Mittermaier, M., Morcrette, C., North, R., Petch, J., Short, C., Vosper, S., Walters, D., Webster, S., Weeks, M., Wilkinson, J., Wood, N., and Zerroukat, M.: The first Met Office Unified Model–JULES Regional Atmosphere and Land configuration, RAL1, Geosci. Model Dev., 13, 1999–2029, https://doi.org/10.5194/gmd-13-1999-2020, 2020.
Camp, J., Roberts, M., MacLachlan, C., Wallace, E., Hermanson, L., Brookshaw, A., Arribas, A., and Scaife, A. A.: Seasonal forecasting of tropical storms using the Met Office GloSea5 seasonal forecast system, Q. J. Roy. Meteor. Soc., 141, 2206–2219, https://doi.org/10.1002/qj.2516, 2015.
Dilley, M., Chen, R. S., Deichmann, U., Lerner-Lam, A., Arnold, M., Agwe, J., Buys, P., Kjekstad, O., Lyon, B., and Yetman, G.: Natural disaster hotspots: A global risk analysis, The World Bank, Washington, DC, USA, 2005.
Done, J. M., Ge, M., Holland, G. J., Dima-West, I., Phibbs, S., Saville, G. R., and Wang, Y.: Modelling global tropical cyclone wind footprints, Nat. Hazards Earth Syst. Sci., 20, 567–580, https://doi.org/10.5194/nhess-20-567-2020, 2020.
Eckstein, D., Künzel, V., Schäfer, L., and Winges, M.: Global Climate Risk Index 2020: Who Suffers Most from Extreme Weather Events? Weather-Related Loss Events in 2018 and 1999 to 2018, edited by: Chapman-Rose, J. and Longwitz, J., Germanwatch, Berlin, 2019.
Economou, T., Stephenson, D. B., Rougier, J. C., Neal, R. A., and Mylne, K. R.: On the use of Bayesian decision theory for issuing natural hazard warnings, P. Roy. Soc. A-Math. Phy., 472, 20160295, https://doi.org/10.1098/rspa.2016.0295, 2016.
EM-DAT: EM-DAT – The International Disaster Database (D. Guha-Sapir), CRED, UCLouvain, Brussels, Belgium, available at: https://www.emdat.be/, last access: 28 April 2021.
Etienne, C., Lehmann, A., Goyette, S., Lopez-Moreno, J.-I., and Beniston, M.: Spatial Predictions of Extreme Wind Speeds over Switzerland Using Generalized Additive Models, J. Appl. Meteorol. Clim., 49, 1956–1970, https://doi.org/10.1175/2010JAMC2206.1, 2010.
Gelman, A., Carlin, J. B., Stern, H. S., Dunson, D. B., Vehtari, A., and Rubin, D. B.: Bayesian Data Analysis, 3rd Edn., CRC Press, New York, 2013.
Hastie, T. and Tibshirani, R.: Generalized Additive Models, Stat. Sci., 1, 297–310, 1986.
Hersbach, H., Bell, B., Berrisford, P., Hirahara, S., Horányi, A., Muñoz-Sabater, J., Nicolas, J., Peubey, C., Radu, R., Schepers, D., Simmons, A., Soci, C., Abdalla, S., Abellan, X., Balsamo, G., Bechtold, P., Biavati, G., Bidlot, J., Bonavita, M., Chiara, G., Dahlgren, P., Dee, D., Diamantakis, M., Dragani, R., Flemming, J., Forbes, R., Fuentes, M., Geer, A., Haimberger, L., Healy, S., Hogan, R. J., Hólm, E., Janisková, M., Keeley, S., Laloyaux, P., Lopez, P., Lupu, C., Radnoti, G., Rosnay, P., Rozum, I., Vamborg, F., Villaume, S., and Thépaut, J.: The ERA5 global reanalysis, Q. J. Roy. Meteor. Soc., 146, 1999–2049, https://doi.org/10.1002/qj.3803, 2020.
Hodges, K., Cobb, A., and Vidale, P. L.: How Well Are Tropical Cyclones Represented in Reanalysis Datasets?, J. Climate, 30, 5243–5264, https://doi.org/10.1175/JCLI-D-16-0557.1, 2017.
Hoque, M. A.-A., Phinn, S., Roelfsema, C., and Childs, I.: Assessing tropical cyclone impacts using object-based moderate spatial resolution image analysis: a case study in Bangladesh, Int. J. Remote Sens., 37, 5320–5343, https://doi.org/10.1080/01431161.2016.1239286, 2016.
Hoque, M. A.-A., Pradhan, B., Ahmed, N., and Roy, S.: Tropical cyclone risk assessment using geospatial techniques for the eastern coastal region of Bangladesh, Sci. Total Environ., 692, 10–22, https://doi.org/10.1016/j.scitotenv.2019.07.132, 2019.
International Monetary Fund: Bangladesh: 2019 Article IV Consultation – Press Release, Staff Report, and Statement by the Executive Director for Bangladesh, IMF Ctry. Reports No. 19/299, Washington, DC, 2019a.
International Monetary Fund: Bangladesh: Selected Issues, IMF Country Report No. 19/300, Washington, DC, 16 pp., 2019b.
Knapp, K. R., Kruk, M. C., Levinson, D. H., Diamond, H. J., and Neumann, C. J.: The International Best Track Archive for Climate Stewardship (IBTrACS), B. Am. Meteorol. Soc., 91, 363–376, https://doi.org/10.1175/2009BAMS2755.1, 2010.
Knapp, K. R., Diamond, H. J., Kossin, J. P., Kruk, M. C., and Schreck, C. J. I.: International Best Track Archive for Climate Stewardship (IBTrACS) Project, Version 4, NOAA National Centers for Environmental Information, https://doi.org/10.25921/82ty-9e16, 2018.
Knutson, T., Camargo, S. J., Chan, J. C. L., Emanuel, K., Ho, C.-H., Kossin, J., Mohapatra, M., Satoh, M., Sugi, M., Walsh, K., and Wu, L.: Tropical Cyclones and Climate Change Assessment: Part II: Projected Response to Anthropogenic Warming, B. Am. Meteorol. Soc., 101, E303–E322, https://doi.org/10.1175/BAMS-D-18-0194.1, 2020.
Krien, Y., Arnaud, G., Cécé, R., Ruf, C., Belmadani, A., Khan, J., Bernard, D., Islam, A. K. M. S., Durand, F., Testut, L., Palany, P., and Zahibo, N.: Can We Improve Parametric Cyclonic Wind Fields Using Recent Satellite Remote Sensing Data?, Remote Sens.-Basel, 10, 1963, https://doi.org/10.3390/rs10121963, 2018.
Leutwyler, D., Lüthi, D., Ban, N., Fuhrer, O., and Schär, C.: Evaluation of the convection-resolving climate modeling approach on continental scales, J. Geophys. Res.-Atmos., 122, 5237–5258, https://doi.org/10.1002/2016JD026013, 2017.
Lindley, D. V.: Making Decisions, 2nd Edn., Wiley, New York, 1991.
Lock, A., Edwards, J., and Boutle, I.: Unified Model Documentation Paper 024: The Parametrization of Boundary Layer Processes, Met Office, Exeter, UK, 2019.
Mohanty, S., Nadimpalli, R., Mohanty, U. C., Mohapatra, M., Sharma, A., Das, A. K., and Sil, S.: Quasi-operational forecast guidance of extremely severe cyclonic storm Fani over the Bay of Bengal using high-resolution mesoscale models, Meteorol. Atmos. Phys., 133, 331–348, https://doi.org/10.1007/s00703-020-00751-4, 2021.
Mohapatra, M., Srivastava, A. K., Balachandran, S., and Geetha, B.: Inter-annual Variation and Trends in Tropical Cyclones and Monsoon Depressions Over the North Indian Ocean, in: Observed Climate Variability and Change over the Indian Region, edited by: Rajeevan, M. N. and Nayak, S., Springer Singapore, Singapore, 89–106, 2017.
Nolan, D. S., Moon, Y., and Stern, D. P.: Tropical Cyclone Intensification from Asymmetric Convection: Energetics and Efficiency, J. Atmos. Sci., 64, 3377–3405, https://doi.org/10.1175/JAS3988.1, 2007.
Owens, R. G. and Hewson, T. D.: ECMWF Forecast User Guide, ECMWF, Reading, UK, 2018.
Rao, B. R. S.: Decreasing trend in the strength of Tropical Easterly Jet during the Asian summer monsoon season and the number of tropical cyclonic systems over Bay of Bengal, Geophys. Res. Lett., 31, L14103, https://doi.org/10.1029/2004GL019817, 2004.
Sahoo, B. and Bhaskaran, P. K.: Assessment on historical cyclone tracks in the Bay of Bengal, east coast of India, Int. J. Climatol., 36, 95–109, https://doi.org/10.1002/joc.4331, 2016.
Shaevitz, D. A., Camargo, S. J., Sobel, A. H., Jonas, J. A., Kim, D., Kumar, A., LaRow, T. E., Lim, Y.-K., Murakami, H., Reed, K. A., Roberts, M. J., Scoccimarro, E., Vidale, P. L., Wang, H., Wehner, M. F., Zhao, M., and Henderson, N.: Characteristics of tropical cyclones in high-resolution models in the present climate, J. Adv. Model. Earth Sy., 6, 1154–1172, https://doi.org/10.1002/2014MS000372, 2014.
Singh, K., Panda, J., Sahoo, M., and Mohapatra, M.: Variability in Tropical Cyclone Climatology over North Indian Ocean during the Period 1891 to 2015, Asia-Pacific J. Atmos. Sci., 55, 269–287, https://doi.org/10.1007/s13143-018-0069-0, 2019.
Singh, K. S. and Bhaskaran, P. K.: Prediction of landfalling Bay of Bengal cyclones during 2013 using the high resolution Weather Research and Forecasting model, Meteorol. Appl., 27, e1850, https://doi.org/10.1002/met.1850, 2020.
Skamarock, W. C.: Evaluating Mesoscale NWP Models Using Kinetic Energy Spectra, Mon. Weather Rev., 132, 3019–3032, https://doi.org/10.1175/MWR2830.1, 2004.
Steptoe, H.: MetOffice/IKI-Oasis-Bangladesh, Zenodo, https://doi.org/10.5281/zenodo.3953772, 2020.
Steptoe, H., Savage, N., Sadri, S., Salmon, K., Maalick, Z., and Webster, S.: Bangladesh – Tropical Cyclone Historical Catalogue, Zenodo, https://doi.org/10.5281/zenodo.3600201, 2020.
Steptoe, H., Savage, N. H., Sadri, S., Salmon, K., Maalick, Z., and Webster, S.: Tropical cyclone simulations over Bangladesh at convection permitting 4.4 km & 1.5 km resolution, Sci. Data, 8, 62, https://doi.org/10.1038/s41597-021-00847-5, 2021.
Tan, C. and Fang, W.: Mapping the Wind Hazard of Global Tropical Cyclones with Parametric Wind Field Models by Considering the Effects of Local Factors, Int. J. Disast. Risk Sc., 9, 86–99, https://doi.org/10.1007/s13753-018-0161-1, 2018.
Tang, J., Byrne, D., Zhang, J. A., Wang, Y., Lei, X., Wu, D., Fang, P., and Zhao, B.: Horizontal Transition of Turbulent Cascade in the Near-Surface Layer of Tropical Cyclones, J. Atmos. Sci., 72, 4915–4925, https://doi.org/10.1175/JAS-D-14-0373.1, 2015.
UNDRR: Global Assessment Report on Disaster Risk Reduction, United Nations Office for Disaster Risk Reduction (UNDRR), Geneva, Switzerland, 2019.
von Peter, G., von Dahlen, S., and Saxena, S.: Unmitigated disasters? New evidence on the macroeconomic cost of natural catastrophes, BIS Work. Pap., 394, 1–38, 2012.
Weisman, M. L., Skamarock, W. C., and Klemp, J. B.: The Resolution Dependence of Explicitly Modeled Convective Systems, Mon. Weather Rev., 125, 527–548, https://doi.org/10.1175/1520-0493(1997)125<0527:TRDOEM>2.0.CO;2, 1997.
WMO: Tropical Cyclone Operational Plan for the Bay of Bengal and the Arabian Sea, WMO/TD-No. 84, TCP-No. 21, World Meteorological Organization, Geneva, Switzerland, 2018.
Wood, S. N.: Thin plate regression splines, J. R. Stat. Soc. B, 65, 95–114, https://doi.org/10.1111/1467-9868.00374, 2003.
Wood, S. N.: Generalized Additive Models: An Introduction with R, 2nd Edn., Chapman and Hall/CRC, New York, 2017.
Wood, S. N., Pya, N., and Säfken, B.: Smoothing Parameter and Model Selection for General Smooth Models, J. Am. Stat. Assoc., 111, 1548–1563, https://doi.org/10.1080/01621459.2016.1180986, 2016.
Youngman, B. D.: Generalized Additive Models for Exceedances of High Thresholds With an Application to Return Level Estimation for U. S. Wind Gusts, J. Am. Stat. Assoc., 114, 1865–1879, https://doi.org/10.1080/01621459.2018.1529596, 2019.
Youngman, B. D. and Economou, T.: Generalised additive point process models for natural hazard occurrence, Environmetrics, 28, e2444, https://doi.org/10.1002/env.2444, 2017.
The requested paper has a corresponding corrigendum published. Please read the corrigendum first before downloading the article.
- Article
(1464 KB) - Full-text XML