the Creative Commons Attribution 4.0 License.
the Creative Commons Attribution 4.0 License.
 | 31 Mar 2021
Assessing the effect of lithological setting, block characteristics and slope topography on the runout length of rockfalls in the Alps and on the island of La Réunion
Florian Haas
Tobias Heckmann
Anne Mangeney
Virginie Durand
Nicolas Villeneuve
Philippe Kowalski
Aline Peltier
Michael Becht
In four study areas within different lithological settings and rockfall activity, lidar data were applied for a morphometric analysis of block sizes, block shapes and talus cone characteristics. This information was used to investigate the dependencies between block size, block shape and lithology on the one hand and runout distances on the other hand. In our study, we were able to show that lithology seems to have an influence on block size and shape and that gravitational sorting did not occur on all of the studied debris cones but that other parameters apparently control the runout length of boulders. Such a parameter seems to be the block shape, as it plays the role of a moderating parameter in two of the four study sites, while we could not confirm this for our other study sites. We also investigated the influence of terrain parameters such as slope inclination, profile curvature and roughness. The derived roughness values show a clear difference between the four study sites and seem to be a good proxy for block size distribution on the talus cones and thus could be used in further studies to analyse a larger sample of block size distribution on talus cones with different lithologies.
- Article
(6250 KB) - Full-text XML
- BibTeX
- EndNote


Rockfall is an important geomorphic process on steep rock slopes and thus plays a significant role in geomorphic dynamics especially in high mountainous regions (e.g. Hungr and Evans, 1988; Krautblatter and Dikau, 2007; Bennett, et al., 2012; Frattini et al., 2012). Rock fragments are detached from cliff faces (primary rockfall) or remobilized from sediment stores (secondary rockfall) downslope (e.g. Rapp, 1960; Krautblatter and Dikau, 2007); move in a combination of falling, bouncing, rolling or sliding (e.g. Luckman, 2013a; Crosta et al., 2015); and are subsequently deposited on storage landforms such as talus cones. Even though rockfalls often take place in remote areas, they can still pose a potential natural hazard and can cause damage to human lives and local infrastructure facilities (e.g. Pfeiffer and Bowen, 1989; Dorren, 2003; Ravanel et al., 2010; Volkwein et al., 2011; Frattini et al., 2012; Heiser et al., 2017).
The occurrence and magnitude of rockfalls depend on the preconditioning and the preparatory factors (e.g. Meißl, 1998; Dorren, 2003; Dietze et al., 2017a) as well as on triggering events. The preconditioning and preparatory factors are mainly lithology, topography of the slope (aspect, steepness, altitude), vegetation (e.g. Meißl, 1998; Jaboyedoff and Derron, 2005), rainfall and weathering, frequency of freeze–thaw cycles, sun exposure, and root growth (e.g. Meißl, 1998; Jaboyedoff and Derron, 2005; Krautblatter and Dikau, 2007; Frattini et al., 2012; Crosta et al., 2015). Triggering events include volcanic or seismic forcing (Hibert et al., 2017; Durand et al., 2018).
Not only due to the change in the settlement structure in mountain regions but also in the context of global climate change, many studies exist about rockfall processes, focusing on the modelling of runout trajectories and the prediction of rockfall events (e.g. Kirkby and Statham, 1975; Meißl, 1998; Agliardi and Crosta, 2003; Dorren, 2003; Copons et al., 2009; Jaboyedoff and Labiouse, 2011; Frattini et al., 2012; Nappi et al., 2013; Wichmann, 2017; Volkwein et al., 2018; Caviezel et al., 2019), as well as on the measurement of rockfall activity by seismic monitoring (e.g. Vilajosana et al., 2008; Hibert et al., 2011; Farin et al., 2015; Dietze et al., 2017a, b; Durand et al., 2018; Feng et al., 2019). Most of these studies use lidar (light detection and ranging) techniques such as airborne laser scanning (ALS) as well as terrestrial laser scanning (TLS) to improve the understanding of this geomorphic process (e.g. Jaboyedoff et al., 2007; Abellán et al., 2011; Haas et al., 2012; Heckmann et al., 2012; Royán et al., 2014; Strunden et al., 2015; Sala et al., 2019). In recent times structure from motion (SfM) has also been increasingly used for such kinds of studies (e.g. Kromer et al., 2019; Vanneschi et al., 2019; Guerin et al., 2020).
In the context of hazard assessment and also for geomorphological models, not only the transported volumes but also the analysis of the maximum runout distance of blocks play an important role especially in populated mountain regions (e.g. Jaboyedoff and Labiouse, 2011; Volkwein et al., 2011; Lambert et al., 2013; Caviezel et al., 2019). Factors influencing the runout distance and the trajectory of blocks include topographic conditions, like the slope inclination, height of the fall, and curvature conditions (e.g. Meißl, 1998; Frattini et al., 2012; Leine et al., 2014). Other parameters are the surface properties including protection measures and the roughness of the slope (e.g. Meißl, 1998; Leine et al., 2014; Gratchev and Saeidi, 2019). Some studies show the influence of the properties of the rockfall itself, like the volume, geology, and size and shape of the blocks, on the runout distances (e.g. Kirkby and Statham, 1975; Meißl, 1998; Leine et al., 2014). In addition, the kinematical properties of the blocks and the restitution parameter influence the depositioning (e.g. Azzoni and de Freitas, 1995; Jaboyedoff and Labiouse, 2011; Ji et al., 2019; Sandeep et al., 2020). The size and shape of blocks and their interaction with slope properties are considered to comprise an important factor for the travel distance (e.g. Pfeiffer and Bowen, 1989; Meißl, 1998; Frattini et al., 2012; Leine et al., 2014).
The influence of block shape, block size and slope topography on the runout distance has been investigated only by a small number of studies (Azzoni and de Freitas, 1995; Haas et al., 2012; Fityus et al., 2013) and mainly in case studies or tests under laboratory conditions (Okura et al., 2000; Glover et al., 2015, Cui et al., 2017; Wang et al., 2018; Gratchev and Saeidi, 2019). Haas et al. (2012) already stated in their case study that the influence of the lithology on block shape and block size must be investigated with a broader view. This could be done e.g. in areas with different lithological settings, as the size and shape of rock fragments are determined by their lithological properties, among other influencing factors (Haas et al., 2012; Fityus et al., 2013). Some studies have described the deposition of boulders on the talus cone as gravitational sorting, where larger blocks are deposited in the distal part and smaller blocks on the upper part of the talus slope (e.g. Statham, 1973; White, 1981; Whitehouse and McSaveney, 1983; Kotarba and Strömquist, 1984; Jomelli and Francou, 2000; Sanders et al., 2009; Messenzehl and Dikau, 2017; Popescu et al., 2017; Kenner, 2019). The gravitational sorting of the blocks on the slope is a key factor for the roughness component of talus slopes and thus for the runout length of following rockfall events (Hungr and Evans, 1988), indicating a potential feedback loop in the formation of talus landforms.
The aim of this study is to carry out a comparative investigation of the morphometric properties and runout distances of rockfall fragments in mountain regions within different lithological settings. For our analysis we selected four sites with different lithological conditions, different rockfall activity and existing data with a very high quality. Due to lithological differences in the cliffs, we expected different statistical distributions of block sizes and block shapes on the talus slopes. The study is conducted using high-resolution digital terrain models (DTMs) and point clouds created from TLS surveys. Based on the research of Haas et al. (2012), we determined different block properties, sizes and shapes and analysed them in the context of runout distances and talus morphology.
Four areas in high mountainous regions were selected for this investigation. Three of these areas are situated in the Alps; one area is located on the island of La Réunion (Fig. 1). The areas differ mainly with regard to the lithological conditions.
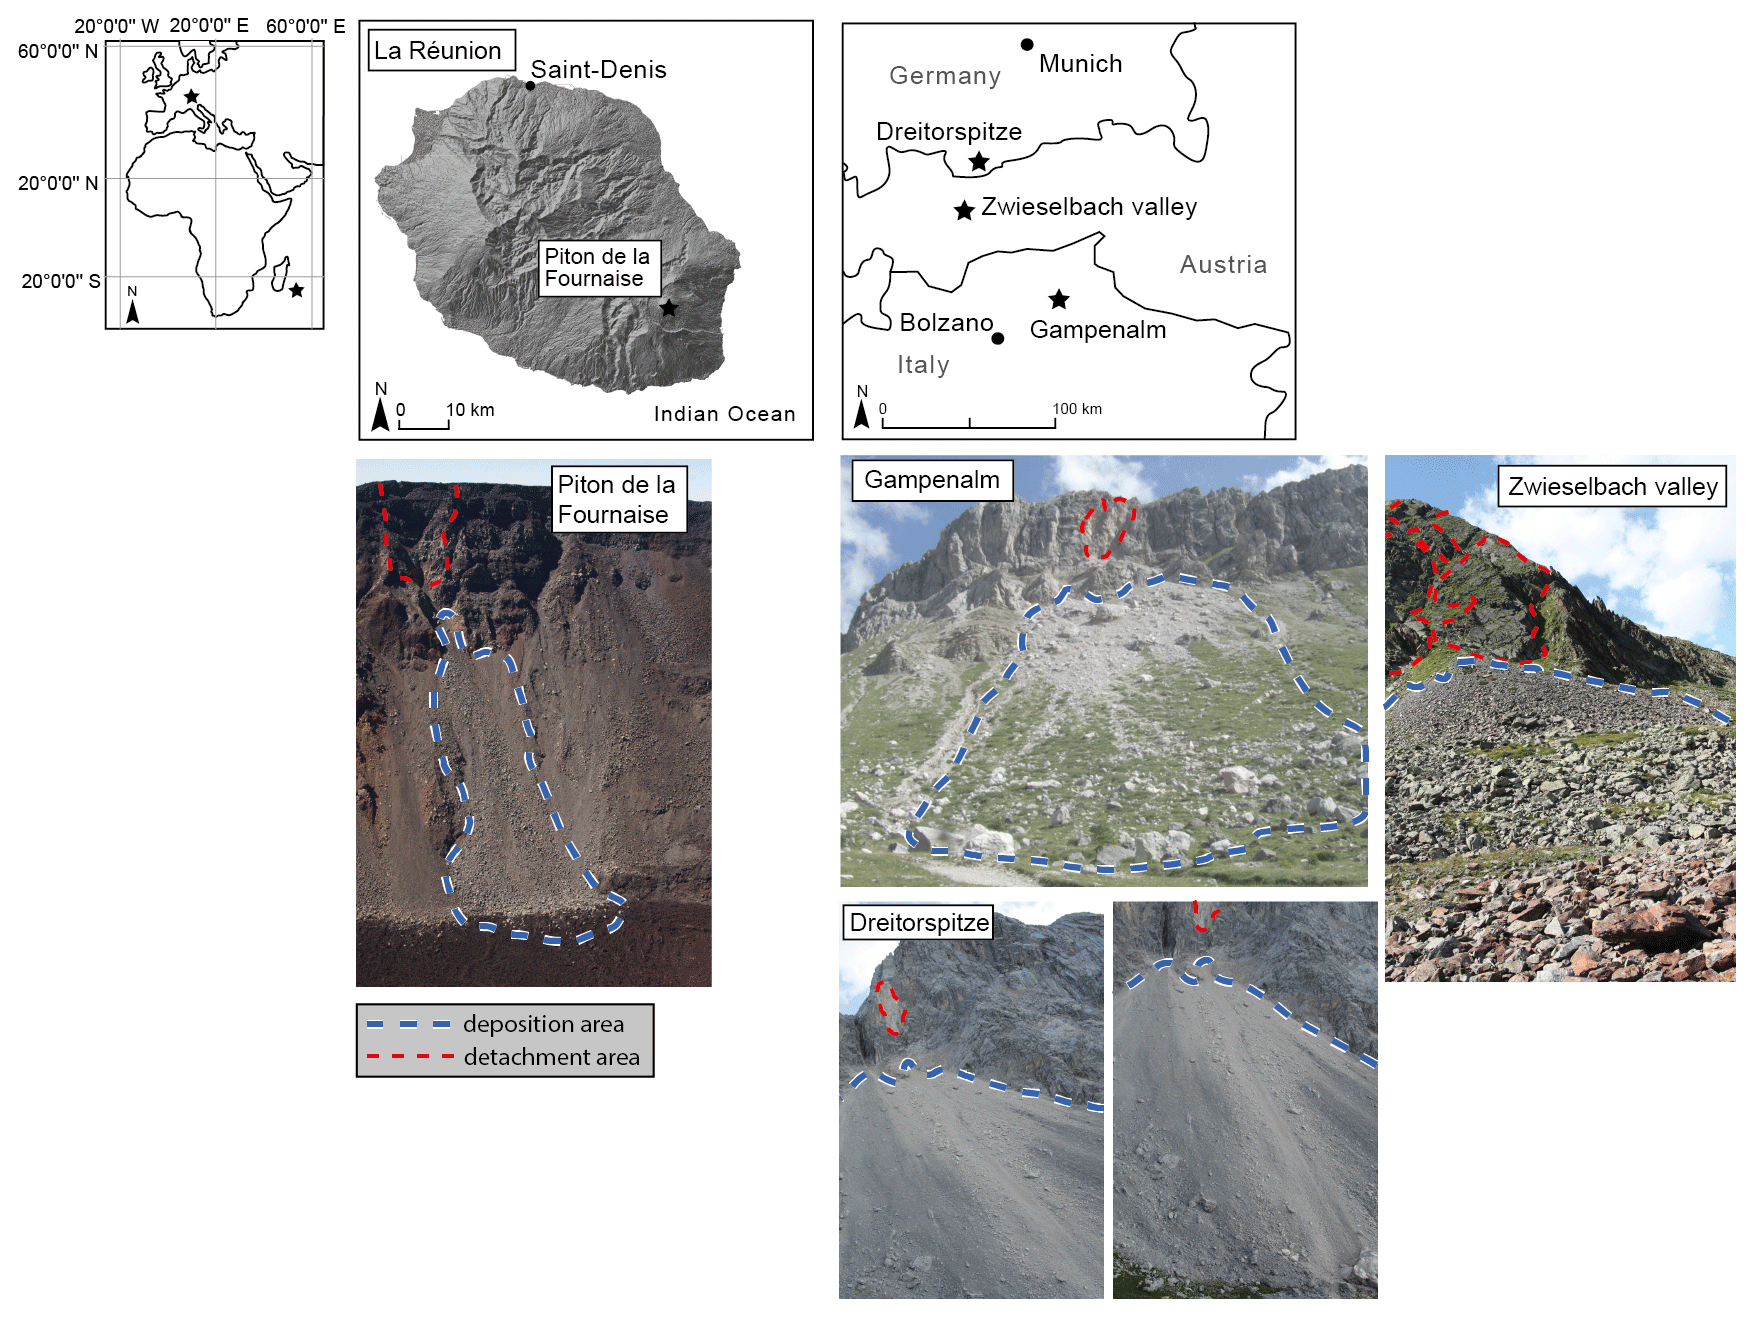
Figure 1Geographical location of the study sites located on La Réunion and in the European Alps. The stars locate the location of the study sites. The dashed red lines limit the detachment areas of the rockfall events. The dashed blue and white lines represent the deposition area. (Source of the overview base map: ESRI, HERE, Garmin, OpenStreetMap contributors and the GIS user community.)
All areas are characterized by recent rockfall activity and a clearly distinguishable rock face with an associated scree slope. The selected study sites represent different processes such as rock topples and block fall. For Gampenalm (GA) and Dreitorspitze (DTS), the blocks are assigned to one rockfall event. For Piton de la Fournaise (PF) and the Zwieselbach valley (ZBT), the slope is characterized by deposited material from continuous rockfall processes, but also major events cannot be excluded. A further criterion for the selection of the area was that both the rock faces and the talus cones were clearly and completely visible to ensure complete and dense lidar acquisition.
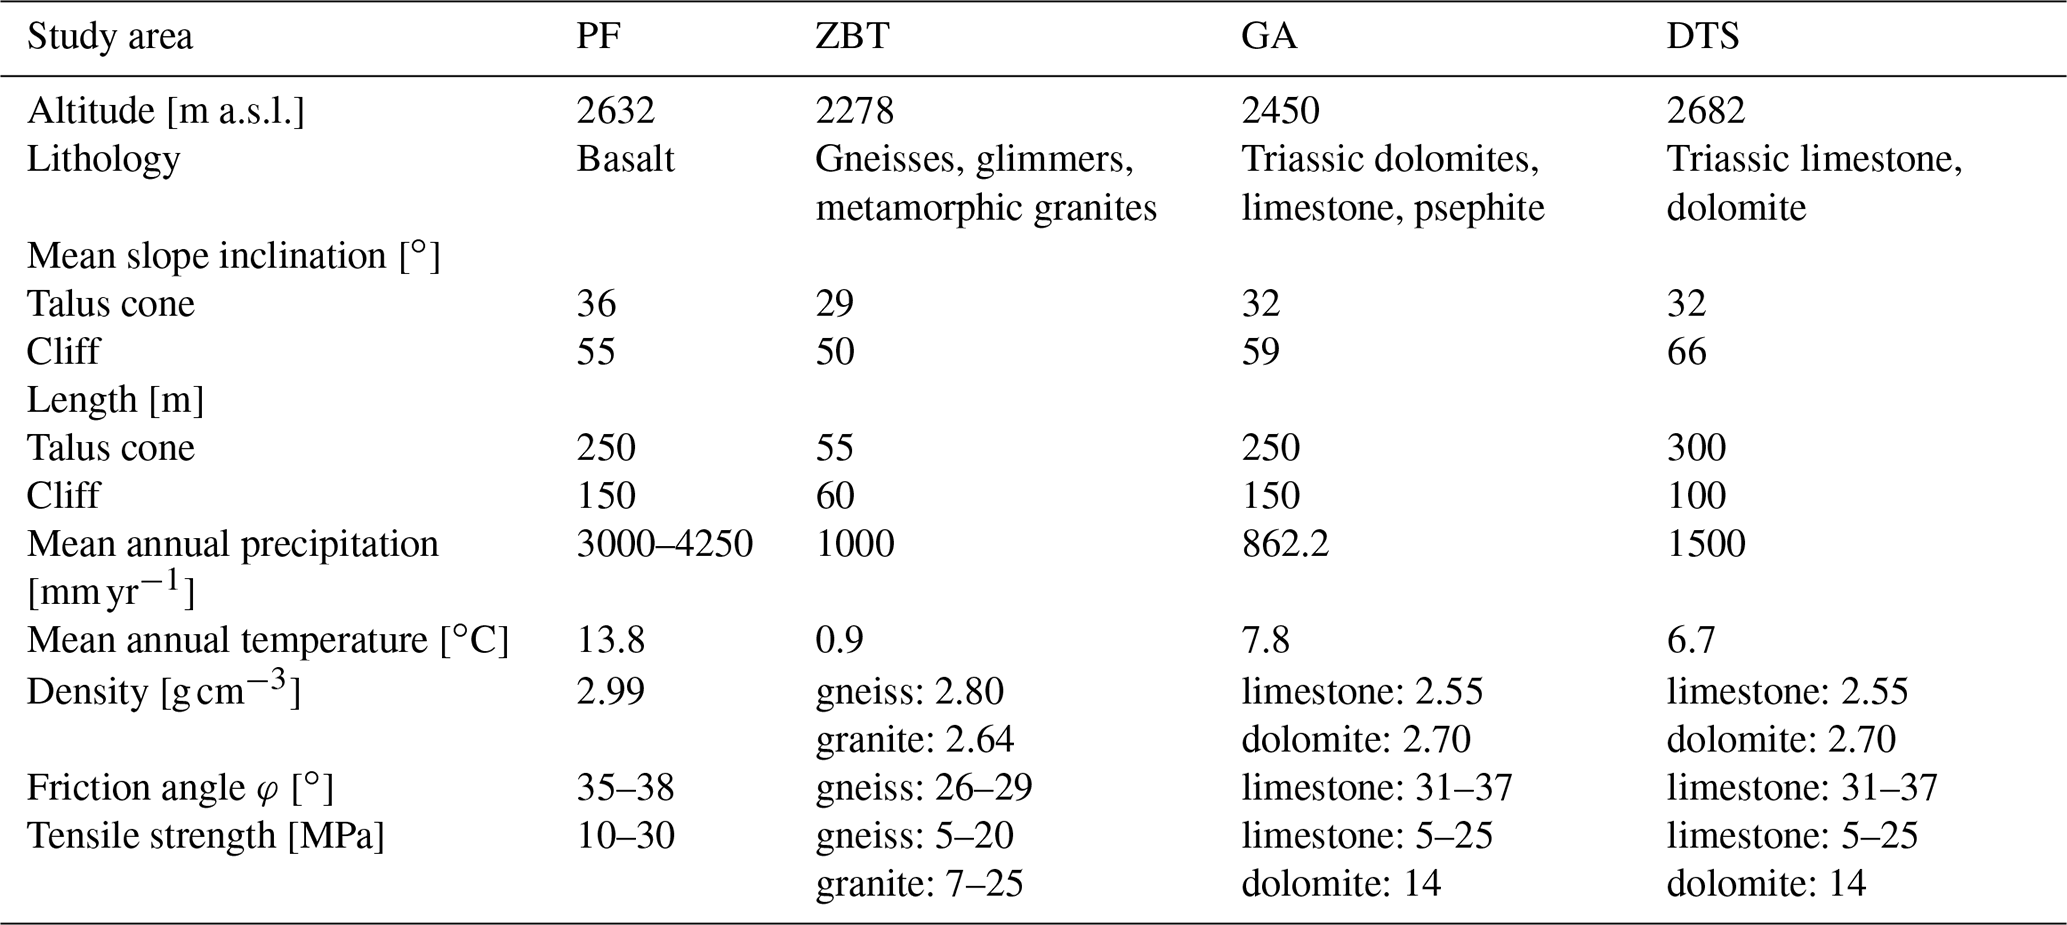
The GA and DTS areas are located in the southern and the northern Alps, respectively, and consist of sedimentary rocks specifically of different limestone formations (Table 1). The GA area is located in the Dolomites and is dominated by the thickly banked Rosengarten massif (cf. Haas et al., 2012). DTS is dominated by the thickly banked Wetterstein limestone. In both areas, major rockfall events occurred in recent years.
Table 1Morphological and lithological characteristics of all investigated talus slopes.
The ZBT in the Stubai Alps is located in the area of the crystalline Central Alps and is characterized by slated gneiss and metamorphic granites. There are not known to have been major rockfall events during the last few years, but the deposits on the talus cone indicate recent rockfall activity also including bigger blocks. For GA, DTS and the ZBT the precondition and preparatory factors cannot be determined exactly, but thawing of mountain permafrost can be excluded due to the altitude and exposure. As we do not have temperature and precipitation data, we cannot give any information about this.
The PF test site (Dolomieu crater) on La Réunion is the only area outside the Alps and is located in the Indian Ocean, east of Africa, but politically it belongs to France as an overseas department. PF is one of the most active volcanoes in the world (e.g. Peltier et al., 2009a). For the period from 1950 to 2013, 93 eruptions have been documented (Staudacher et al., 2016). Due to a summit collapse during an eruption in 2007 (e.g. Peltier et al., 2009b) a 340 m deep caldera was formed (e.g. Staudacher et al., 2016) in an area of 1100×800 m (e.g. Urai et al., 2007). On this volcano, the composition of the lava is mainly bimodal with a combination of aphyric basalts and olivine-rich basalts (e.g. Peltier et al., 2009a; Lénat et al., 2012). Due to the high tectonic stress (e.g. Merle et al., 2010; Staudacher et al., 2016), the high volcanic activity that generates deformation and seismic activity (e.g. Sens-Schönfelder et al., 2014; Peltier et al., 2018), and the layering of different lava flows, the rim is very unstable and thus prone to high rockfall activity (Hibert et al., 2017; Durand et al., 2018). This area certainly differs most clearly from all the other studied areas. Besides the volcanic rocks, both the cliff and the talus cones are very young landforms, as the geomorphic forming started directly after the emergence of the caldera in 2007. Further differences are the high deformation and seismic activity and the extremely high precipitation. Seismicity and rainfall have been show to play a role in rockfall triggering (Hibert et al., 2017; Durand et al., 2018) but should not have any influence on the runout lengths of single blocks, so for the present investigations primarily the differences in lithology and in the case of PF the age have to be considered.
3.1 Data acquisition and processing (TLS)
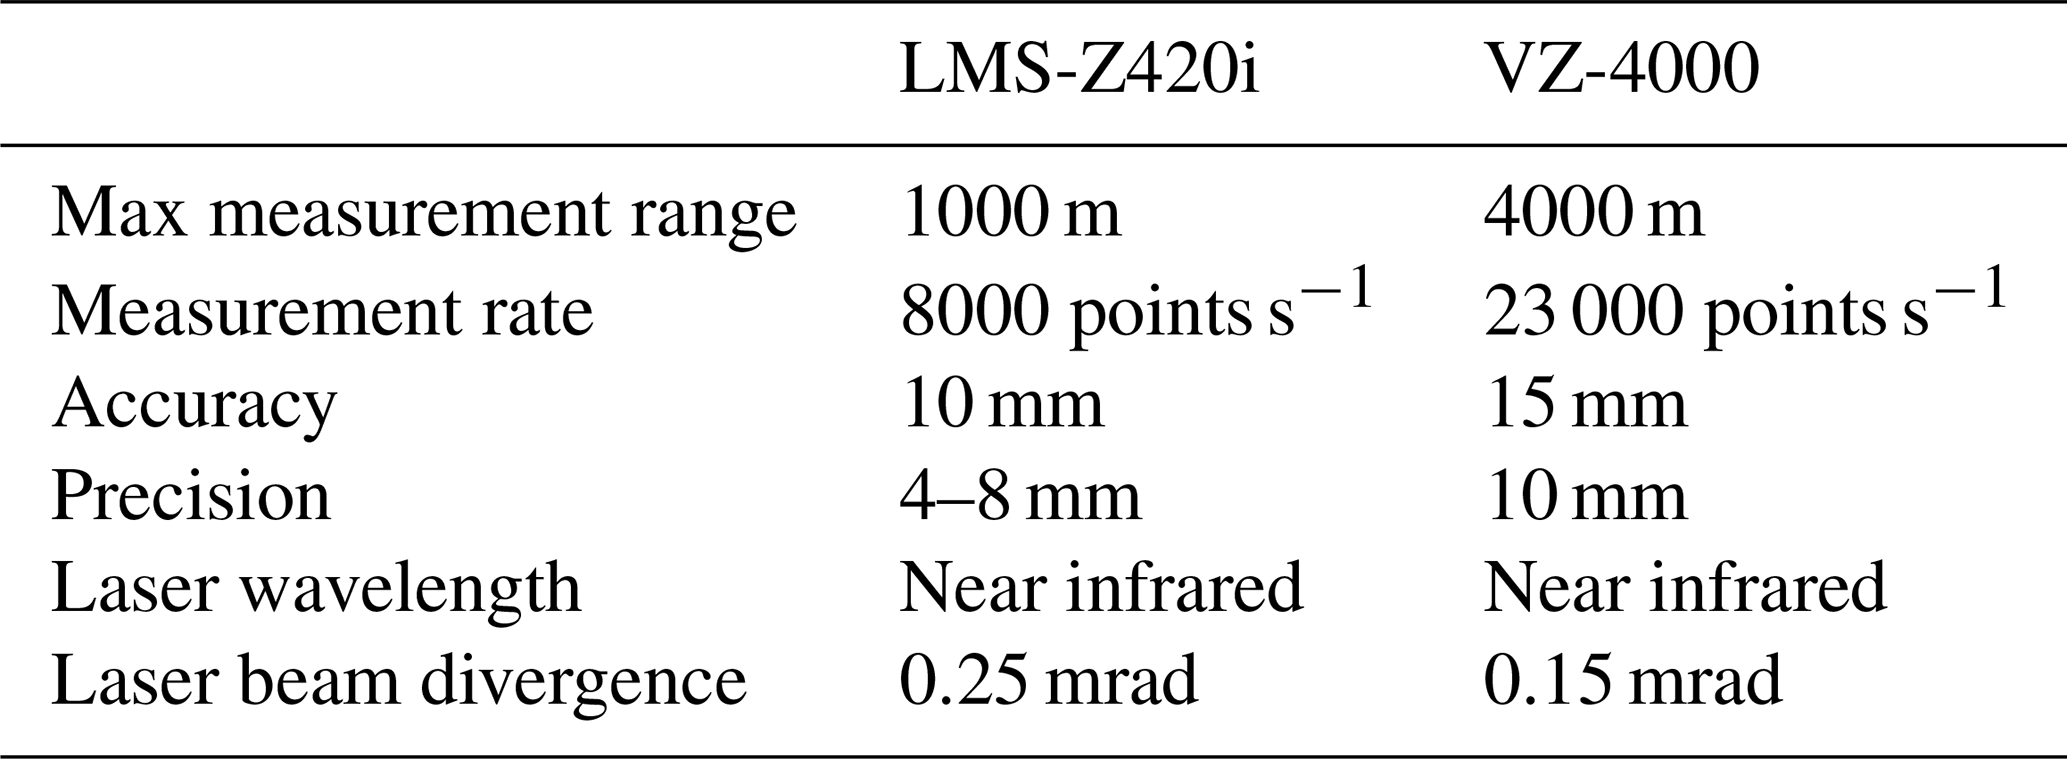
The data of all study sites have been acquired with a terrestrial 3D long-range laser scanner. Two systems were used: the Riegl LMS-Z420i and the Riegl VZ-4000. Each scanner works on the same principle of time of flight, but due to laser configurations, the scanning distance of the VZ-4000 is 4 times longer with 4000 m compared to 1000 m. Both systems provide colour information due to integrated camera systems in order to colorize the point clouds. The RGB values of the pictures allow the filtering of vegetation in the pre-processing of the data and simplify the visualization of e.g. individual blocks. All important technical information of both devices is listed in Table 2.
Table 2Technical data of the two terrestrial laser scanning systems Riegl LMS-Z420i and VZ-4000 (RIEGL Laser Measurement Systems GmbH, 2010, 2020). The values of the VZ-4000 refer to measurements at a rate of 30 kHz.
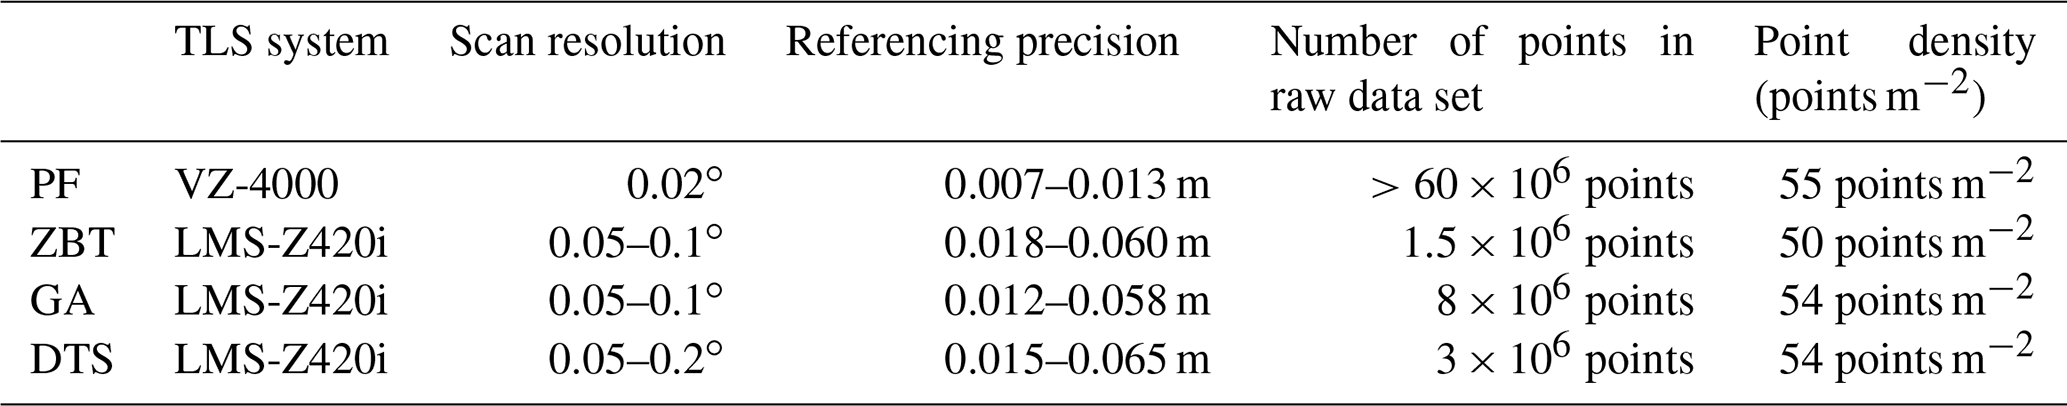
Due to the long distance between scanner and target and the poor reflectance of the volcanic material in the Dolomieu crater, we used the VZ-4000 for this study site. All other test sites were surveyed using the LMS-Z420i. To minimize shadowing effects, several scan positions were necessary at each site, which had to be referenced using manual adjustment and ICP algorithms (Table 3). Both tools are implemented in the software RiSCAN PRO (v2.2.1, http://www.riegl.com, last access date: 8 February 2021).
After the referencing, the data were exported as ASCII files containing x, y and z coordinates as well as RGB values for further analysis in SAGA GIS LIS (Conrad et al., 2015; Laserdata Information System, LIS: https://www.laserdata.at, last access: 8 February 2021). We worked on the vegetation-filtered and homogeneously thinned point clouds and created digital terrain models (DTMs) for all test sites with a raster resolution of 0.75 m using the lowest z value. Table 3 provides information about each study site including the vertical and horizontal scan resolution, the referencing precision, number of points in the raw data set, and the point density (points m−2).
3.2 Determination of block size, block shape and runout length
As the block size and shape have a great influence on the runout distance of the falling rock material, we measured according to the workflow of Haas et al. (2012) the dimensions of the three axes (a, b and c) of single boulders for every study area (PF n=255; GA n=618; ZBT n=65; DTS n=182). We selected blocks that were deposited on the talus surface beginning from the upper and going to the lower parts of the talus cones. Based on the coloured lidar point clouds every block larger than approximately ∼0.5 m was manually measured in the software RiSCAN PRO. Figure 2 shows an idealized sketch of a boulder with the three measured axes.
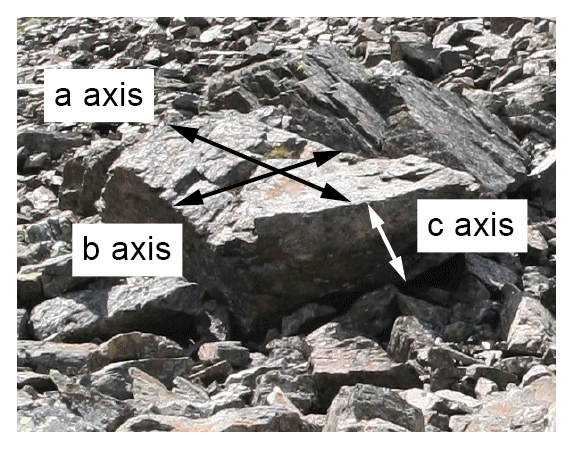
Figure 2Deposited block on the ZBT talus cone with the three measured dimensions of the axes a, b and c.
We followed the work of Haas et al. (2012), which used the formula of Valeton (1955) as an indicator of the block shape. By using the measured three axes, the volume (Eq. 1) and the axial ratio (Eq. 2) were approximated. The derived axial ratio of the measured blocks describes their block shape. For the calculation of the axial ratio, the parameter of the b axis must be set to 1 (cf. Valeton, 1955). With this method, blocks with an axial ratio of 1 can be described as a cuboid or as equant, but the method does not reflect the roundness of blocks. In the following we will also use the term of a small or low axial ratio. The larger the value of the axial ratio, the more elongated or irregularly shaped the blocks are. Here we will refer to a high axial ratio. The different lithology of the study areas determines the shape of the deposited blocks to a certain degree as predisposition (Glover et al., 2015).
Since a 3D approach to measure the blocks would be too time-consuming for this number of blocks, we decided to use the lengths of the axes of the blocks for all study sites. In order to be able to make an assessment about the overestimation of the calculated block volume, we selected a sample of 10 blocks with different sizes for each study area (Fig. 3). Using the TLS point clouds, the block volume was derived in RiSCAN PRO. The comparison between volume estimation via the three measured axes and the 3D volume calculation in RiSCAN PRO in all four areas shows that the volumes of the blocks are constantly overestimated. It is also visible that this overestimation appears relatively small in the ZBT area, which can be explained by the rather angular structure of the blocks (see Fig. 2). This provides an indication that the overestimation can be explained primarily by the fact that the axis calculation assumes rectangular edges for the volume calculation, which is certainly not true for all blocks of the other areas. However, in view of the uniform use of the axis method and the systematic overestimation in all areas, it seems permissible to us to calculate the volume via this simple method and to use it for the further analyses.
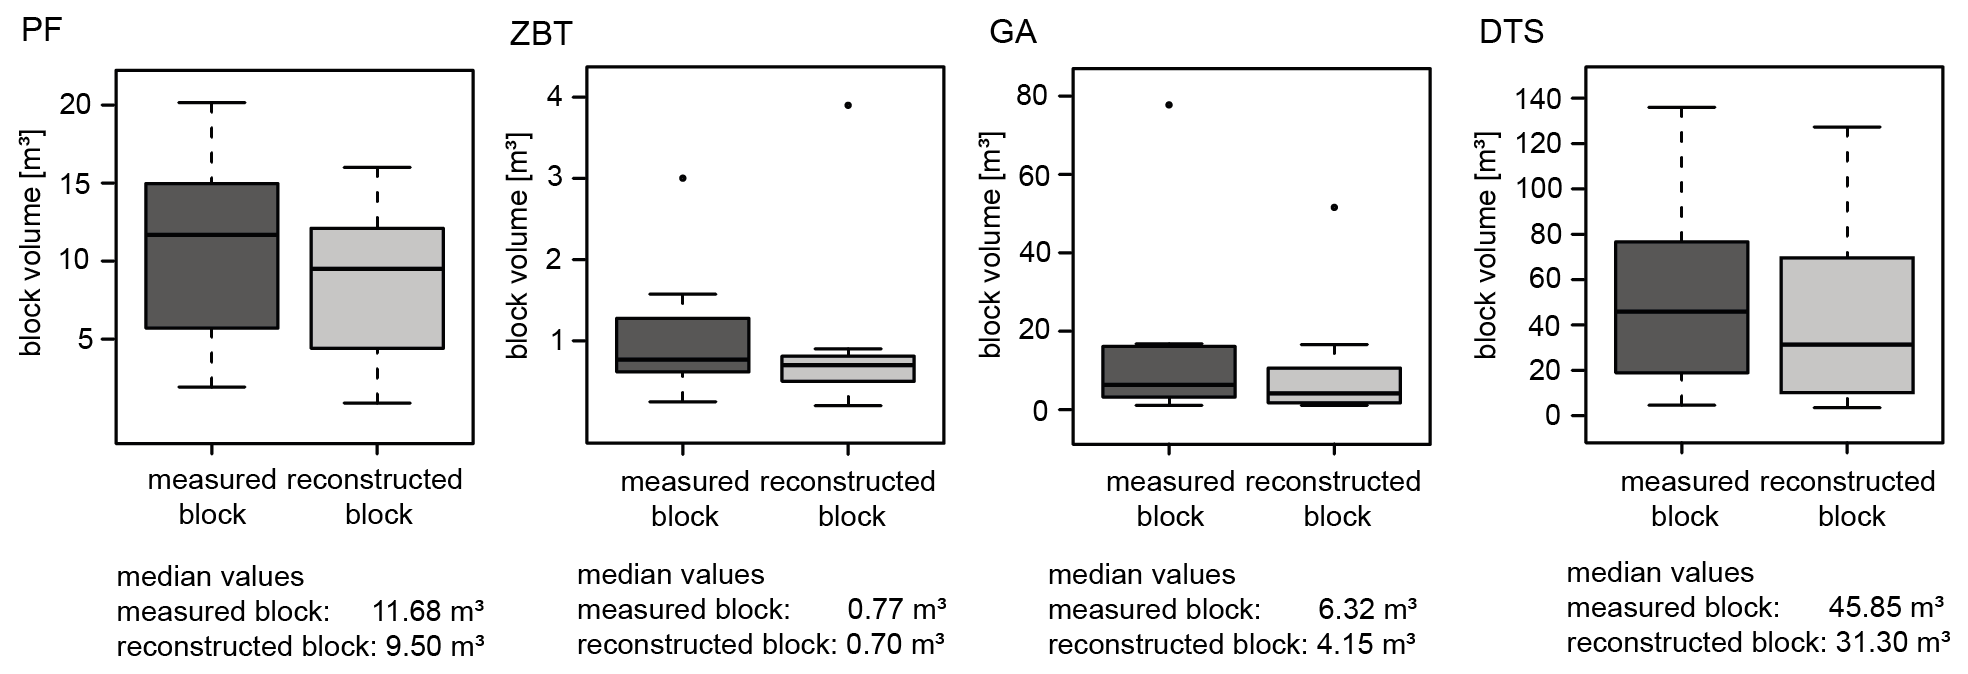
Figure 3Boxplots of measured and reconstructed block volume. The thick black lines within the boxes show the median bounded by the first quartile (25th percentile) and the third quartile (75th percentile). The boxes show the interquartile range (IQR). The whiskers of the boxplots mark the minima and maxima of the data. The circles represent data which exceed the 1.5-fold IQR.
For the study areas of DTS and GA we determined the Euclidean distance from their detachment zones to each measured boulder to obtain the runout length. Since the exact detachment zone could not be determined at PF and the ZBT, we measured the Euclidean distance from the beginning of the transition between cliff and talus cone to each boulder instead. In order to be able to compare the runout distances between the slopes of the study areas and as they differ greatly in length, we normalized the runout lengths for each talus cone to the interval [0, 1]. We have assumed that a value of 0 stands for the detachment area or the area between the rock face and the slope. The value of 1 stands for the maximum runout length of a block.
3.3 Morphometric slope properties
3.3.1 Slope inclination and curvature
Based on the high-resolution DTMs of the study sites we performed a spatial analysis of the talus cones including morphometric properties with a presumed influence on the deposition (e.g. Wang and Lee, 2010; Frattini et al., 2012; Crosta et al., 2015) and runout distances of rockfall boulders (e.g. Glover et al., 2015): slope inclination and profile curvature. The slope inclination was derived based on the DTMs according to Zevenbergen and Thorne (1987).
Additionally, we created three longitudinal profiles with a swath width of 10 m from the highest part of the cone to the distal boundary in order to characterize slope morphology of all four test sites to show changes in slope inclination and profile concavity (cf. Hergarten et al., 2014). We applied a kernel density estimation (cf. Cox, 2007) to compare the distributions of slope inclination between rock faces and talus cones and between the study sites.
3.3.2 Surface roughness
The roughness of the slope can serve as a proxy for the particle size distribution on the talus cone. This parameter could give more information regarding the gravitational sorting pattern where it indicates a coarsening towards the foot of the slope and/or a concentration of coarse material at the foot of the rock wall. This is to determine and analyse the sorting of particle sizes beyond the measured block sizes of the single debris cones. For this purpose, we calculated the roughness based on the high-resolution TLS point clouds. The algorithm used fits a plane for each point of the point cloud in its local neighbourhood with a search radius of 3 m (SAGA surface roughness module (PC); Laserdata Information System, LIS, 2010; https://www.laserdata.at, last access: 8 February 2021). Using the plane, the standard deviation of the distance to the fitted plane for each point was derived. To obtain the spatial distribution and the change in roughness along the slope for each study site, we classified the elevation values of the talus cones (z value) into 10 m classes. In order to be able to establish comparability between the study areas, we normalized the height values of the point clouds. Furthermore, we classified the block volumes to check whether they correspond to the spatially distributed roughness of the deposited blocks on the talus cone.
4.1 Morphometric analyses
4.1.1 Block size and block shapes
In Table 4 we have listed mean and median values for block size and shape for the four study sites. To show the distribution of the block properties, size and shape, we have visualized the measured blocks with the longest axis greater than ∼0.5 m in Fig. 4 using boxplots. With regard to the block volumes, the four investigated sites differ, in some cases very significantly. The smallest block sizes (Table 4) can be found in the ZBT area with a median value of 0.08 m3, and the largest block sizes can be found in the DTS area with a median value of 13.16 m3. The median is below 4 m3 in the three areas of PF (3.38m3), the ZBT (0.08 m3) and GA (1.63 m3). The data show a very homogeneous distribution and only small maximum values in PF and the ZBT, whereas in GA and DTS a very large dispersion and high maximum values (Table 4) are obvious. This indicates that a correlation between the lithological conditions and the block sizes involved in rockfall processes is very likely, as the largest blocks are mainly found in areas with banked limestones. This is clearly shown in the Wetterstein limestone and to a lesser degree in the Dolomite area. The extremely small block sizes are particularly striking in the ZBT area, which consists of metamorphic rocks. This can be explained by the rather slated and thus platy rock structure of the gneisses and by the long tectonic history of these rocks (see Fig. 2).
Table 4Mean and median values for the parameters block size and block shape for each study site. The values for block size and shape (axial ratio) were calculated using Eqs. (1) and (2) with b=1.
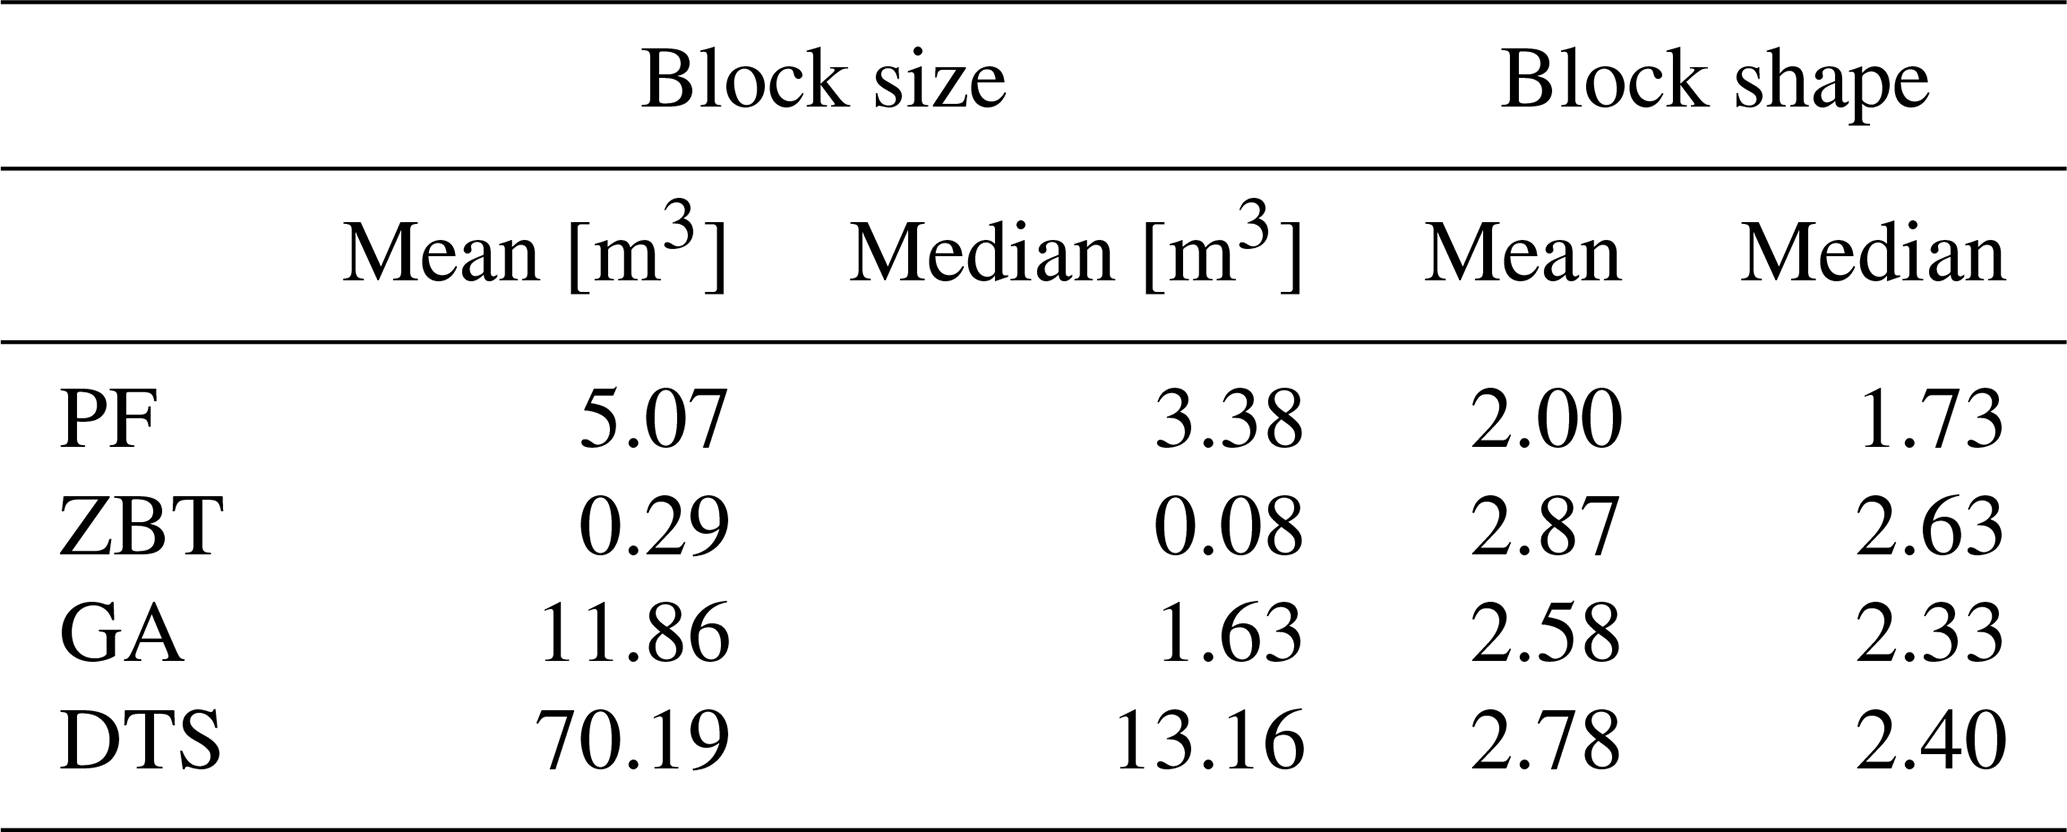
In contrast to the block sizes, the block shapes (Fig. 4) in all four areas show a high dispersion between equant and rather elongated or irregularly shaped blocks. The most elongated blocks can be found in the ZBT area with a median value of 2.63 (Table 4), which again can be explained by the slated structure of the gneisses. The limestones of the GA and DTS areas are very similar in the median, mean block shape and the dispersion of the data (Table 4, Fig. 4). The lowest values and therefore the most cuboid shaped blocks, consisting of volcanic rocks, were found in the PF area with a median value of 1.73. Whether this is due to lithology or to tectonic stresses caused by the high seismic activity and the resulting fissures and cracks cannot be finally clarified with the data of this study.
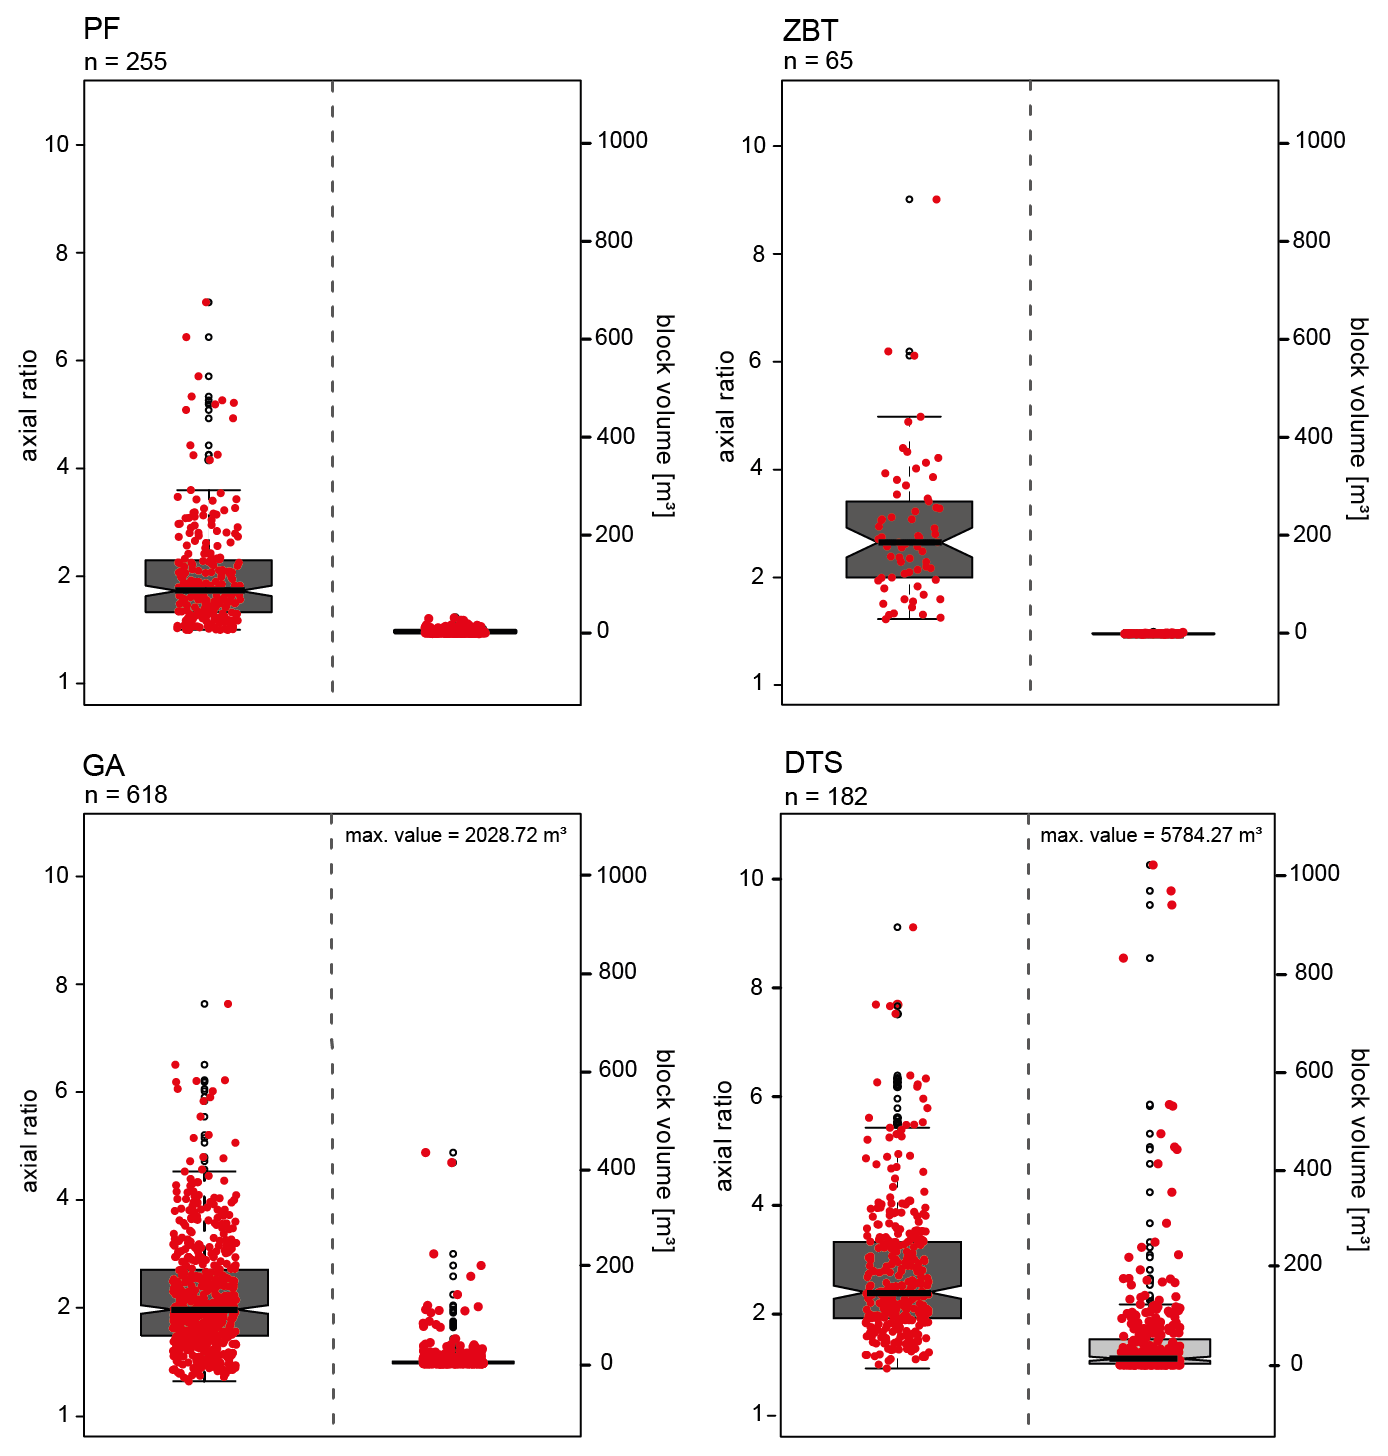
Figure 4Boxplots of volume and shapes for the measured blocks. The red-coloured points correspond to each measured block. The thick black lines within the boxes show the median bounded by the first quartile (25th percentile) and the third quartile (75th percentile). The boxes show the interquartile range (IQR). The whiskers of the boxplots mark the minima and maxima of the data. The circles represent data which exceed the 1.5-fold IQR.
With regard to the block shapes and block size distributions in the areas, however, it can be concluded that the investigated areas show sufficient differences in both block sizes and shapes, and that this is very likely a consequence of the lithological setting. This allows for a more detailed investigation of the relationships between block shape, block size and runout distance. We will also analyse how the different process activities affect the deposition and runout distance.
4.1.2 Slopes of the talus cones
In addition to the block shape and block size, the topography of the talus cones also plays an important role and has to be considered for a runout analysis. Thus, we analysed the following form parameters: slope inclination and slope profiles (curvature) (Figs. 5 and 6).
The average slope inclinations of the talus cones lie between 28 and 36∘ and thus within the range for such landforms (e.g. Pérez, 1989, 1998; Francou and Manté, 1990; Jomelli and Francou, 2000; Sanders et al., 2009; Luckman, 2013b, Popescu et al., 2017; Volkwein et al., 2018). The mean slope inclination values for the talus cones of our study sites are for PF, the ZBT, GA and DTS 29, 32, 36 and 32∘, respectively. This can provide an indication of the dependence between rock material and slope inclination of gravel or blocky material and thus supports the findings of other studies.
ZBT
Kenner (2019) reported in their study on amphibolite sediments slope angles of 35∘, and Messenzehl and Dikau (2017) described in their survey on metamorphic rocks slope angles of 34–36∘ and 33–34∘. Additionally, Gerber (1974) showed in his study a slope inclination of 33∘ for gneisses and metamorphic granites. For the ZBT we found only 28.9∘ for the metamorphic rocks, which is significantly lower than in the cited studies. It must be noted that especially in the ZBT the talus cone can be divided into two sectors, which differ very clearly in terms of slope (Fig. 5d). Thus, in the left area we find significantly higher slope inclinations with 43∘, which are higher than the values from the literature, whereas in the right area rather significantly lower slope inclinations are found.
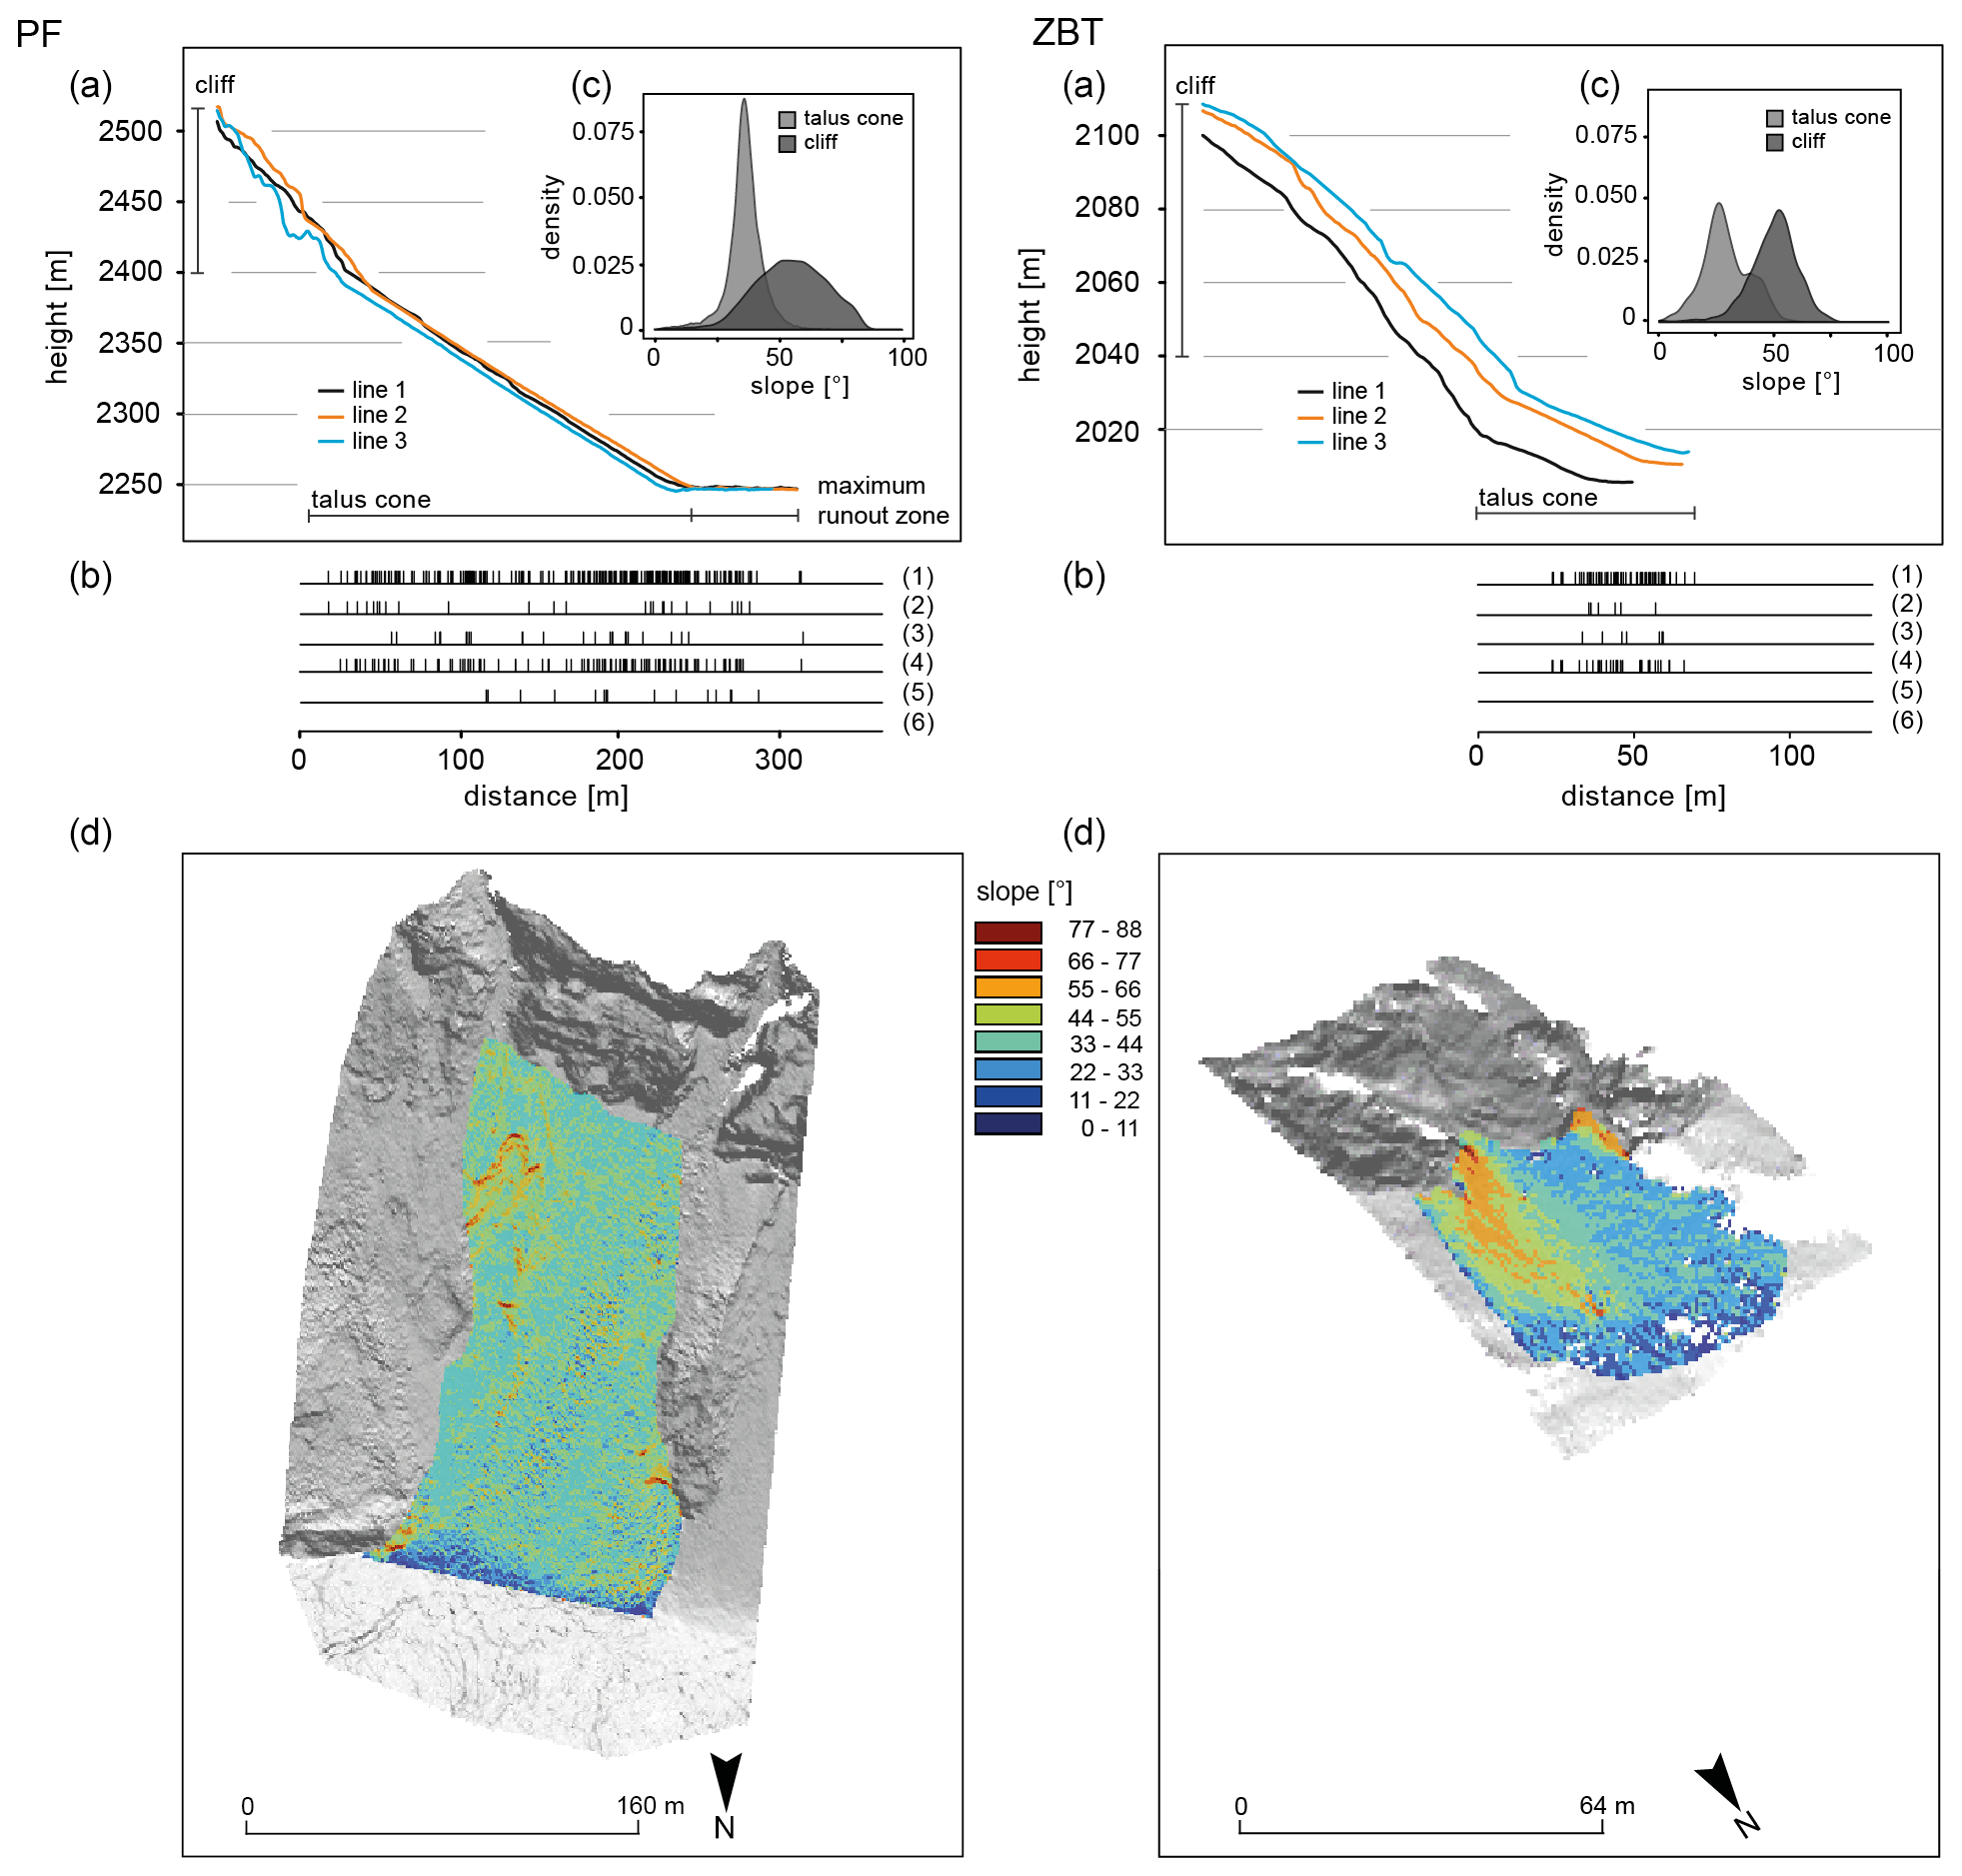
Figure 5Slope characteristics for the PF and ZBT study sites. Three swath longitudinal profiles from the cliff to the maximum runout distance (a). Statistical distribution of all measured blocks regarding their shapes and volumes on the talus cone. Every single line represents a measured block, and thus the deposition on the slope can be illustrated. For this purpose, we have presented all blocks (1) and the most (2) and least (3) spheroidal blocks, and we have classified the block volume according to 10 m3 (4), 102 m3 (5) and 103 m3 (6) (b). Kernel density estimation of slope inclination distinguished according to the cliff and the talus cone (c). Maps of slope inclination with different classes (d).
PF
The highest slope inclinations can be found on PF with 36.0∘ and its basaltic lava material. Yamamoto et al. (2005) conclude that basaltic material cannot be deposited on slopes of more than 33∘. However, the higher average slope inclination at PF compared to the findings of Yamamoto et al. (2005) can be explained by the rock surface conditions, which also play an important role, since fresh volcanic rocks in particular are characterized by a high micro-roughness, especially where the lava could cool very quickly. Thus the slope seems to be controlled by the friction coefficient of the deposited material. In particular, for PF, analysis of seismic data for rockfalls suggests a friction coefficient of 35∘ for the talus slope (Hibert et al., 2011). This is supported by the distributions of the slope inclinations (see Figs. 5c and 6c), where the data scatter is lowest in the PF area. Here the distribution is very peaked and differs clearly from the distributions of the other three areas. The shape of the slope profiles (Figs. 5a and 6a) also points in a similar direction. The talus cone of PF follows a straight line over the entire length of the slope, whereas the other cones show a slight convexity in the upper and middle slope and a basal concavity at the end of the slope, which is in good agreement with the works of Kotarba and Strömquist (1984), Luckman (2013b), and Popescu et al. (2017). Nevertheless, it is very likely that the talus cone of PF represents a pure talus cone and has been reshaped since the summit collapse in 2007 by persistent rockfalls, whereas the talus cones of the other areas represent much older forms where different types of geomorphic processes occur (e.g. debris flows, avalanche deposits).
DTS and GA
The DTS and GA talus cones show quite similar values with 31.9 and 31.6∘. Gerber (1974) measured 32∘ for talus cones consisting of limestone material, which corresponds to the study sites of GA and DTS. Serrano et al. (2019) described in their study slope inclinations for limestone formations of 32–36∘, and Knoblich (1975) gives values of 28–43∘. The two slopes are also similar regarding the longitudinal profiles (Fig. 6a). GA has a slightly basal concave talus cone downslope, while that of DTS is straighter.
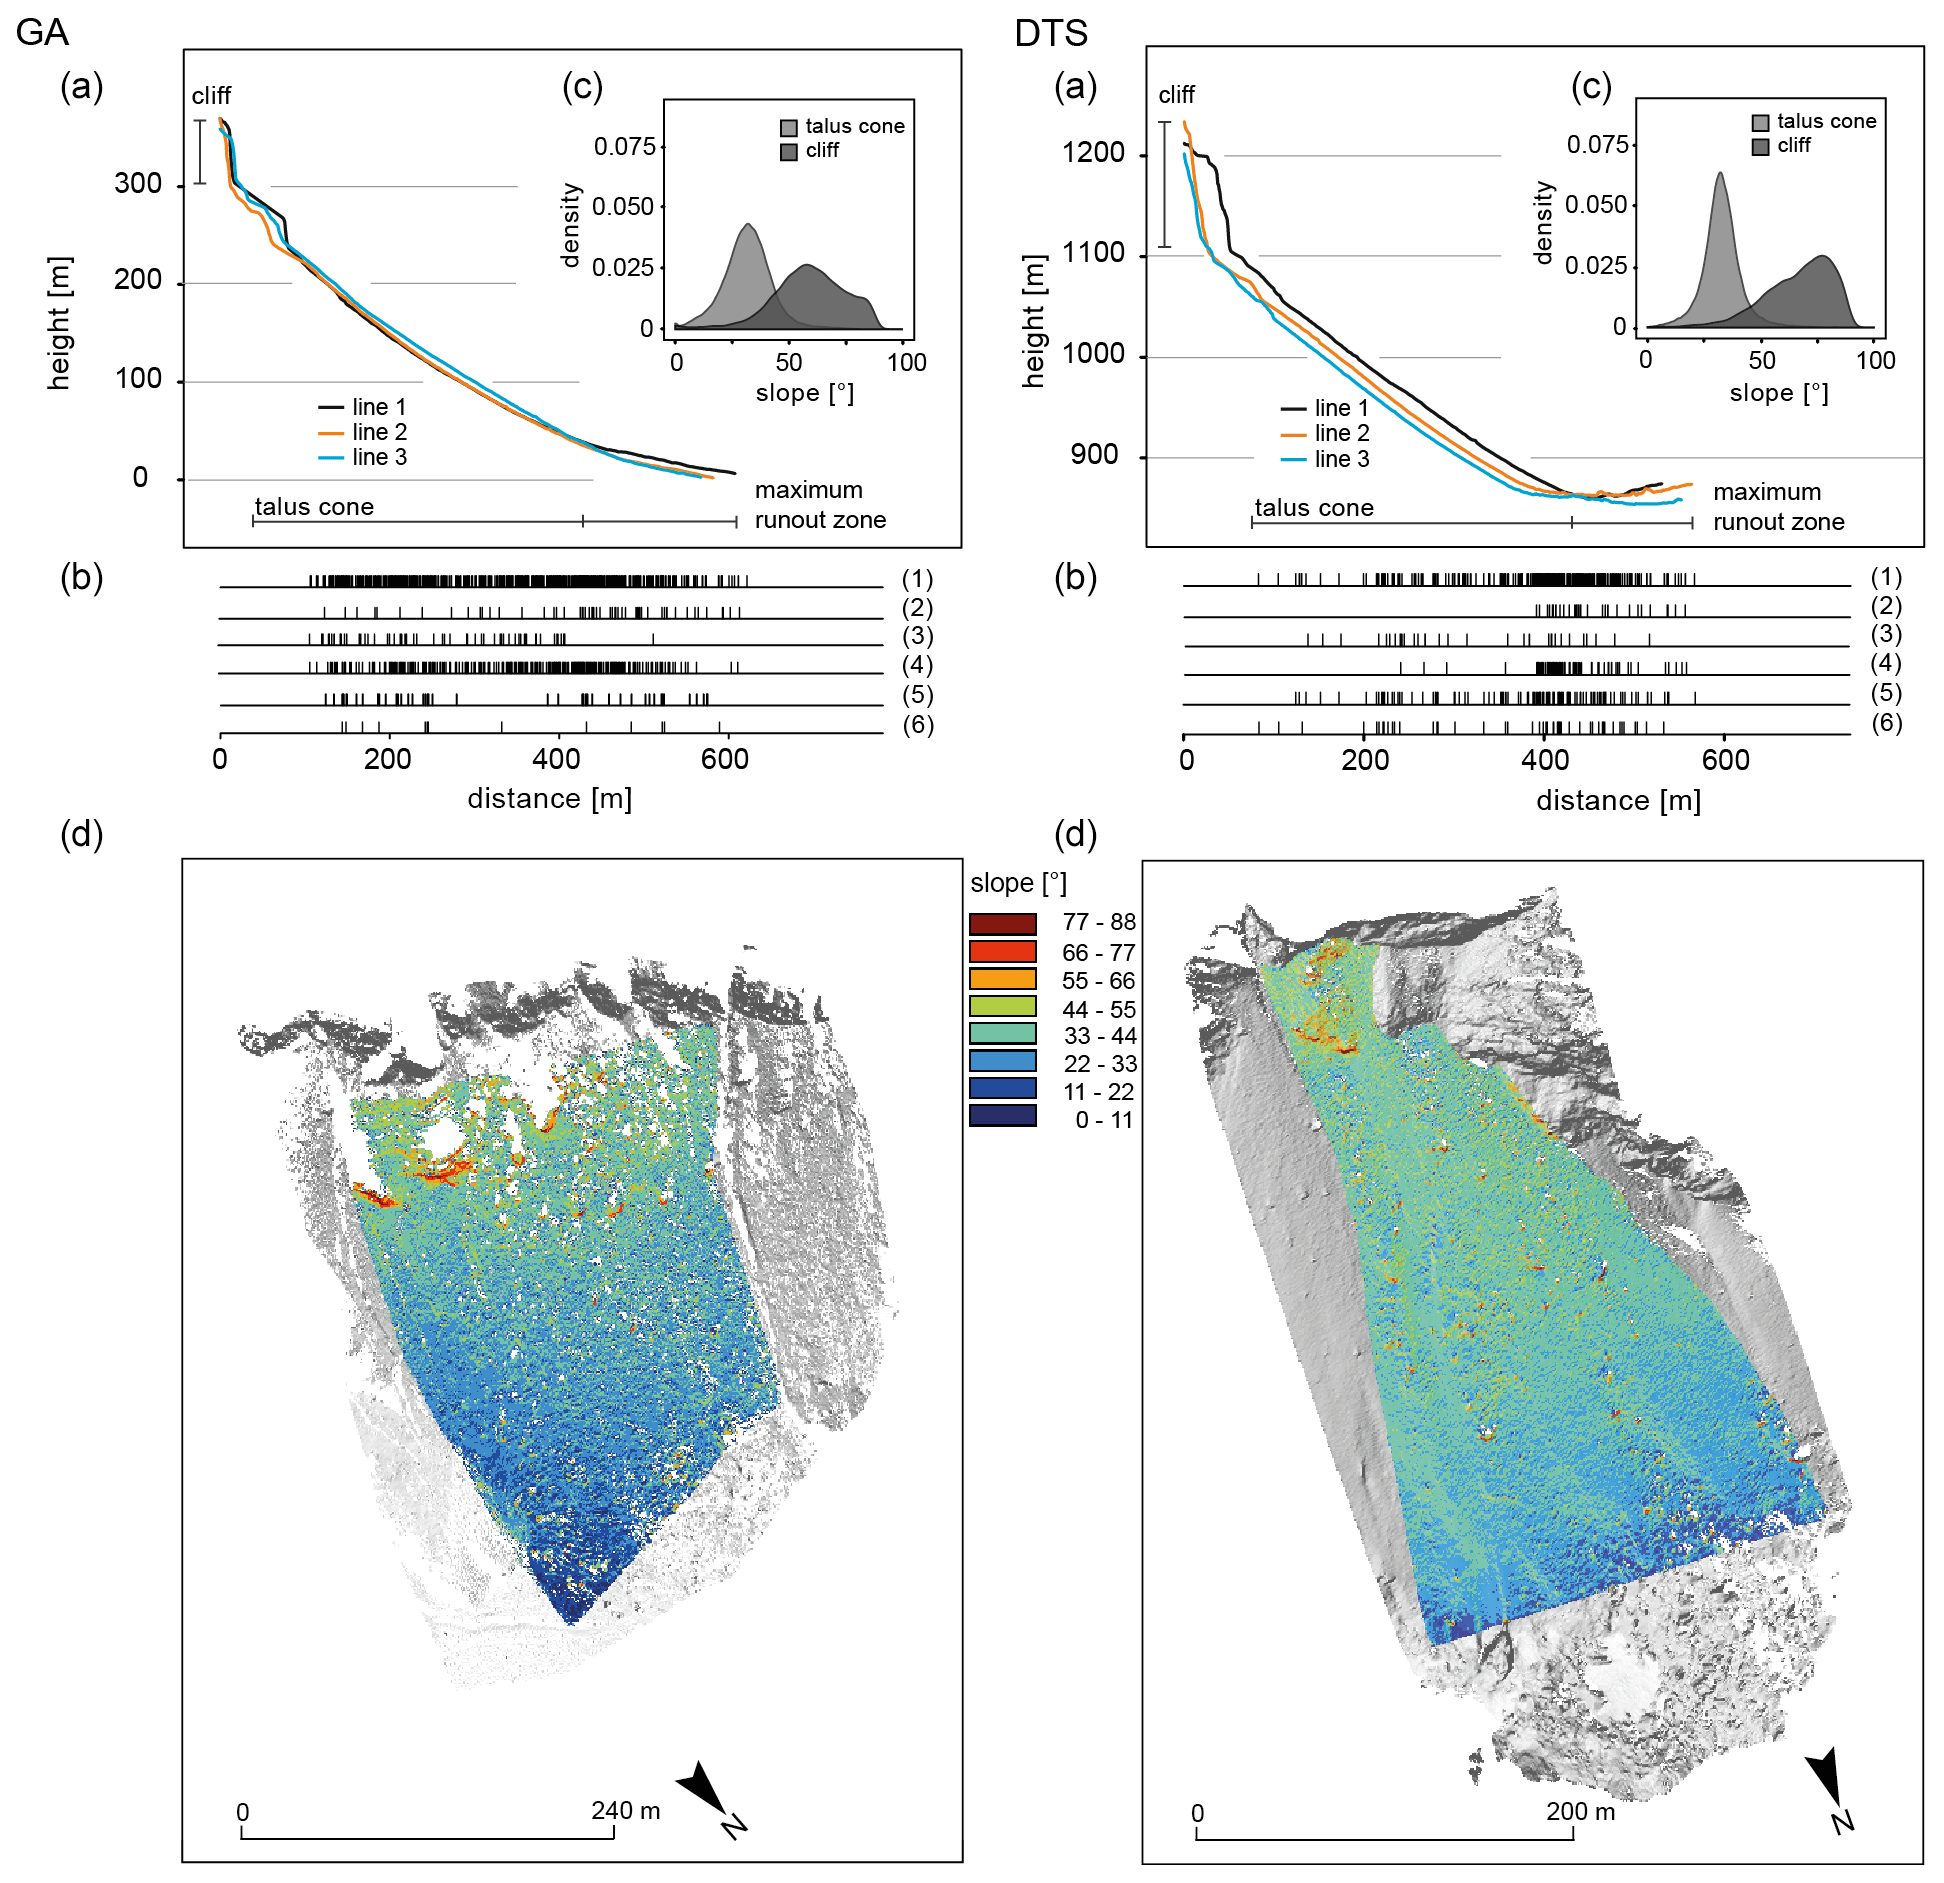
Figure 6Slope characteristics for the GA and DTS study sites. Three swath longitudinal profiles from the cliff to the maximum runout distance (a). Statistical distribution of all measured blocks regarding their shapes and volumes on the talus cone. Every single line represents a measured block, and thus the deposition on the slope can be illustrated. For this purpose, we have presented all blocks (1) and the most (2) and least (3) spheroidal blocks, and we have classified the block volume according to 10 m3 (4), 102 m3 (5) and 103 m3 (6) (b). Kernel density estimation of slope inclination distinguished according to the cliff and the talus cone (c). Maps of slope inclination with different classes (d).
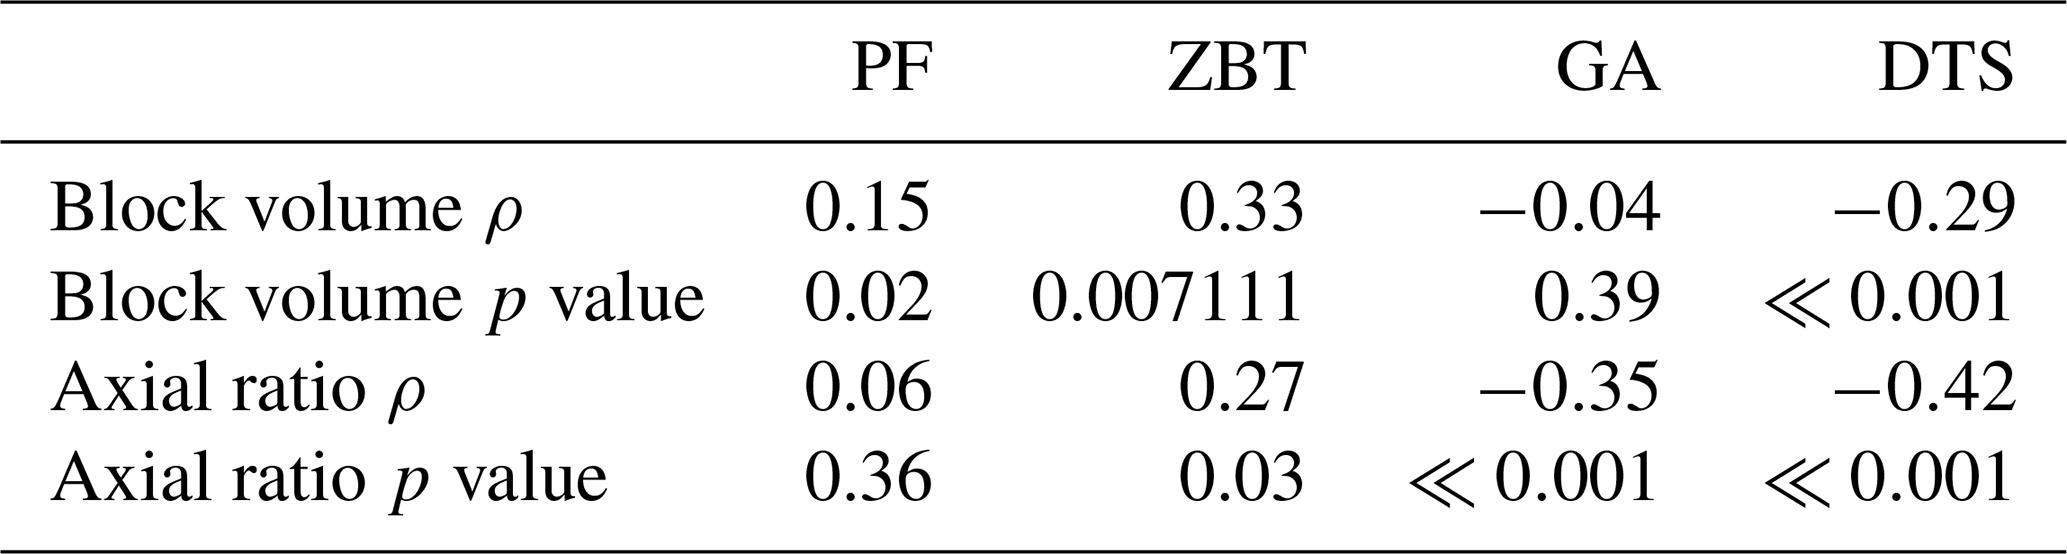
Table 5Analysis of the relationship of block volume and axial ratio against runout length by means of Spearman's rank correlation for each study site.
4.2 Relationship between block size, block shape and runout length
4.2.1 Analysis of individual boulders
In order to analyse the relationship between block volume, block shape and runout length, we calculated Spearman's rank correlation (Table 5). The results show only weak correlations between block volume and runout distance as well as weak correlations between runout length and block shape for the four test sites, which indicate no monocausal relationship.
These results are in contrast to other studies, which state that longitudinal sorting of talus cones shows an increase in block sizes downslope (Jomelli and Francou, 2000). Popescu et al. (2017) conclude that there is a gradual increase in boulder size towards the slope base, which is also stated by Copons et al. (2009), determining a dependency of rock volume and runout distance. Serrano et al. (2019) showed that the distal part of a slope is characterized by the accumulation of large blocks. In contrast to these studies Caine (1967) found a decrease in blocks sizes with distance downslope, but his results are statistically insignificant. Messenzehl and Dikau (2017) showed that there is a distinct downslope increase in block size and sphericity, which indicates a combination of these block characteristics govern the runout length. These contradictory statements are supported by the work of Meißl (1998), who described in her analysis that the shape and size of the blocks mainly influence the width and height of the jumping parabolas, the rolling speed, and the timing of the change between jumping and rolling. Meißl (1998) has also observed that larger blocks do not always reach the longest runout distances. A possible cause could be that the blocks tend to sink, depending on the slope properties, but also interactions between the blocks cannot be excluded. Moreover, the fracturing of larger blocks can additionally lead to a loss of kinetic energy, which influences the disposition of blocks (Meißl, 1998).
In order to obtain a broader view on the data and in accordance with Haas et al. (2012), we plotted the relative distance against log 10 block volume to show the relationship for every single talus cone in more detail (Figs. 7 and 8). We combined this analysis with the axial ratio of the boulders. Figures 7a and 8a show boxplots with six different quantile classes (<q10, q10–q25, q25–q50, q50–q75, q75–q90, >q90), which correspond to the 10 %, 25 %, 50 %, 75 % and 90 % quantiles of the log 10 block volume and log 10 axial ratio. To analyse the relationship of the parameters in more detail, we highlighted the 10 % and the 90 % quantile classes, which indicate blocks with a low (10 %) and high (90 %) axial ratio. These different classes are visualized with different symbols and colours in Figs. 7b and 8b.
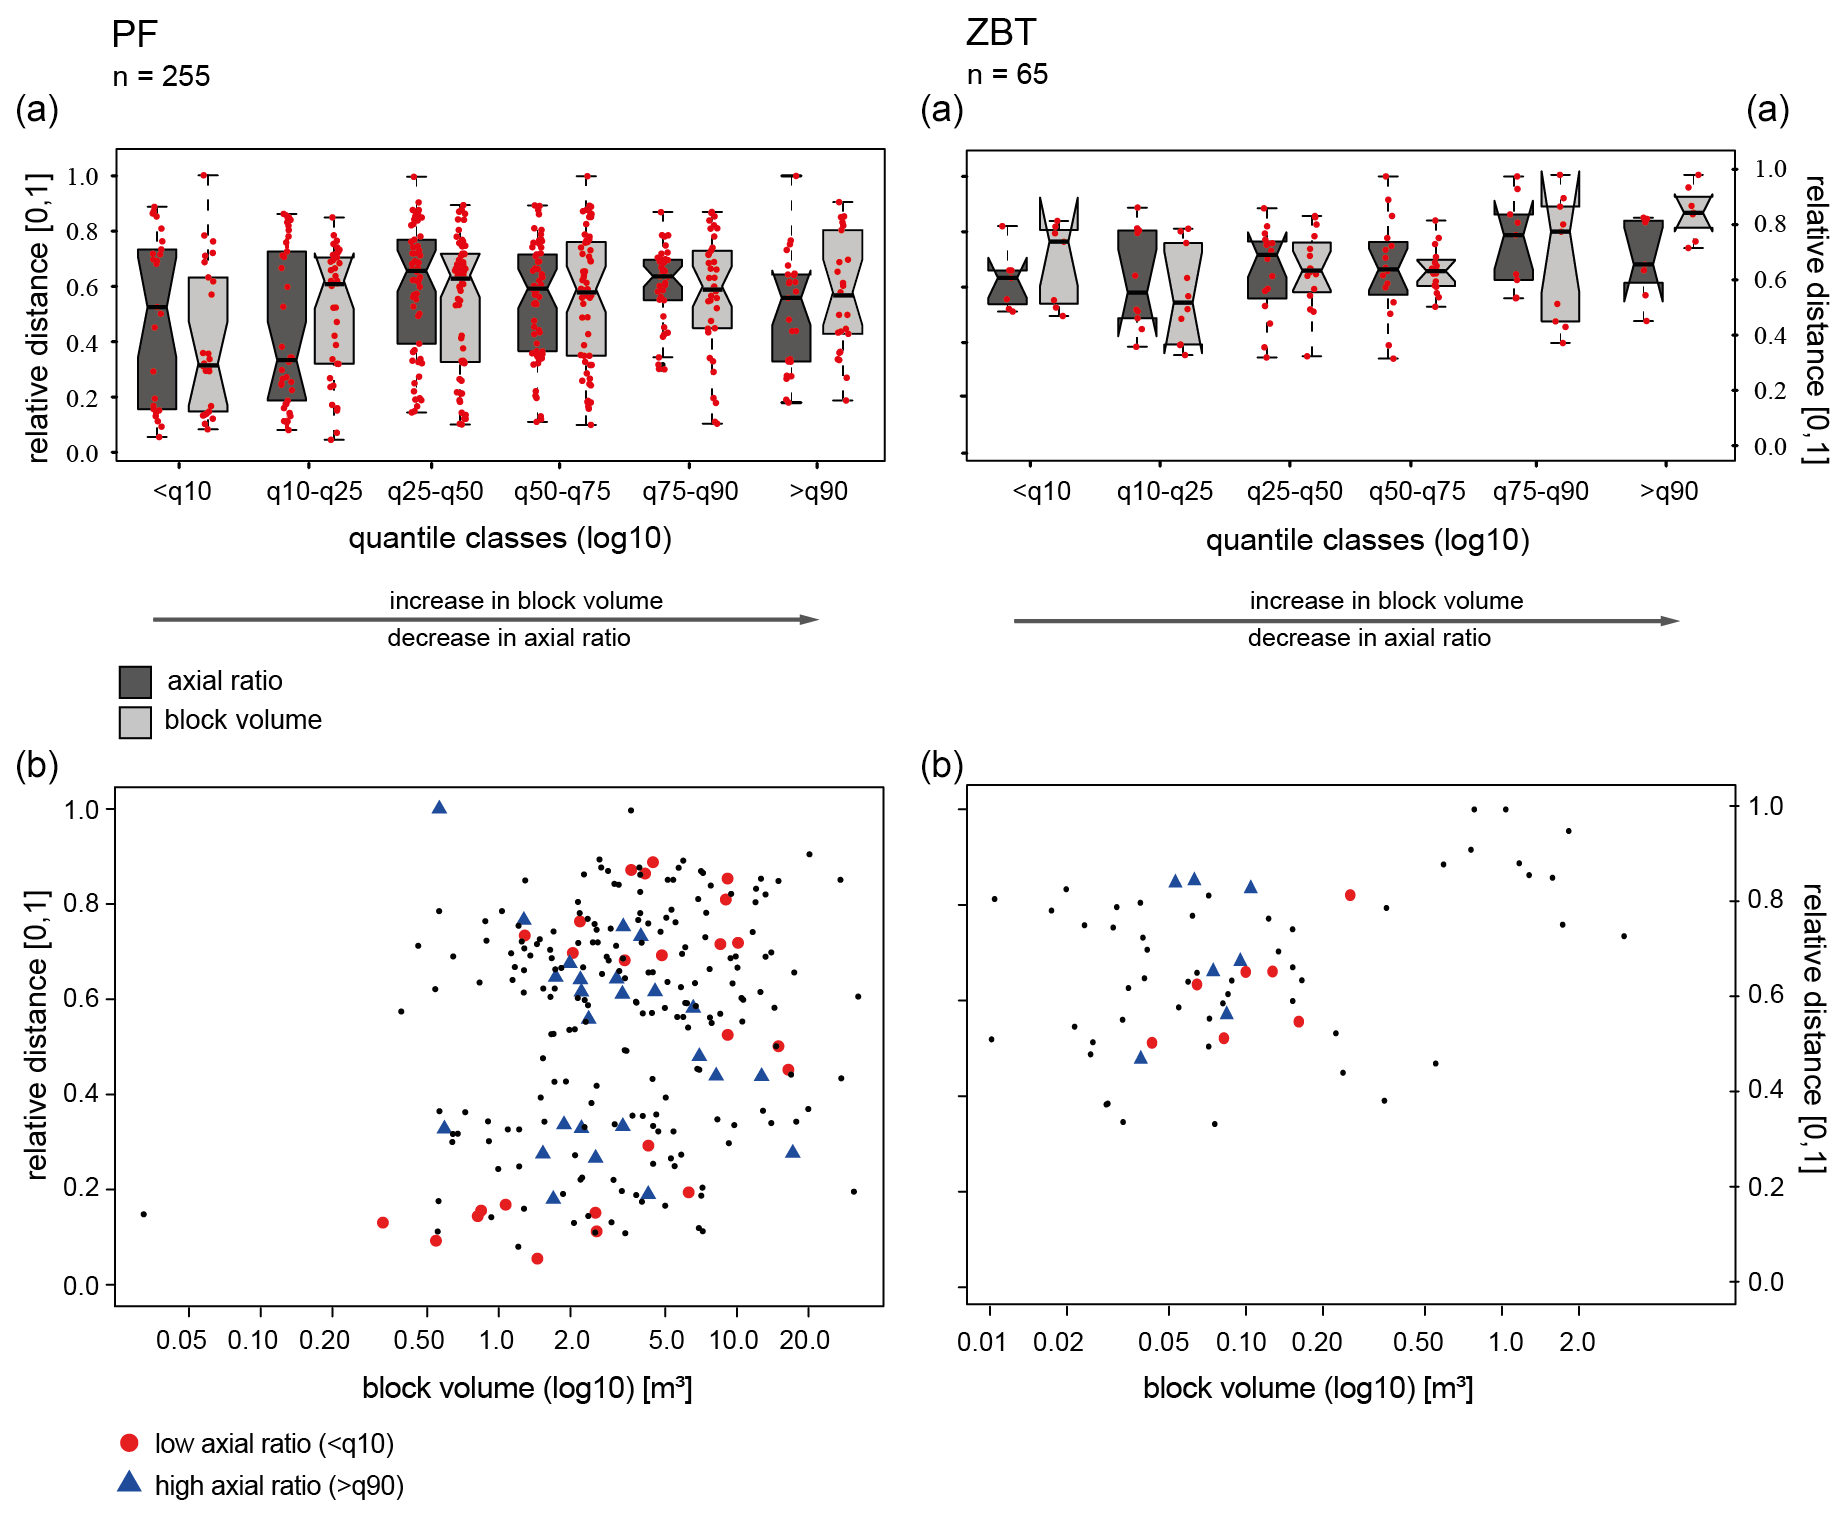
Figure 7Boxplots of relative distance versus log 10 block volume and log 10 block shapes of the measured rocks for the PF and ZBT study sites (a). The red-coloured points correspond to each measured individual block. The thick black lines within the boxes show the median bounded by the first quartile (25th percentile) and the third quartile (75th percentile). The boxes show the interquartile range (IQR). The whiskers of the boxplots mark the minima and maxima of the data. The circles represent data that exceed the 1.5-fold IQR (a). Scatterplot of relative distance versus log 10 block volume for all study sites. Blocks with a low axial ratio (<q10) and a high axial ratio (>q90) are highlighted with different colours and symbols (b).
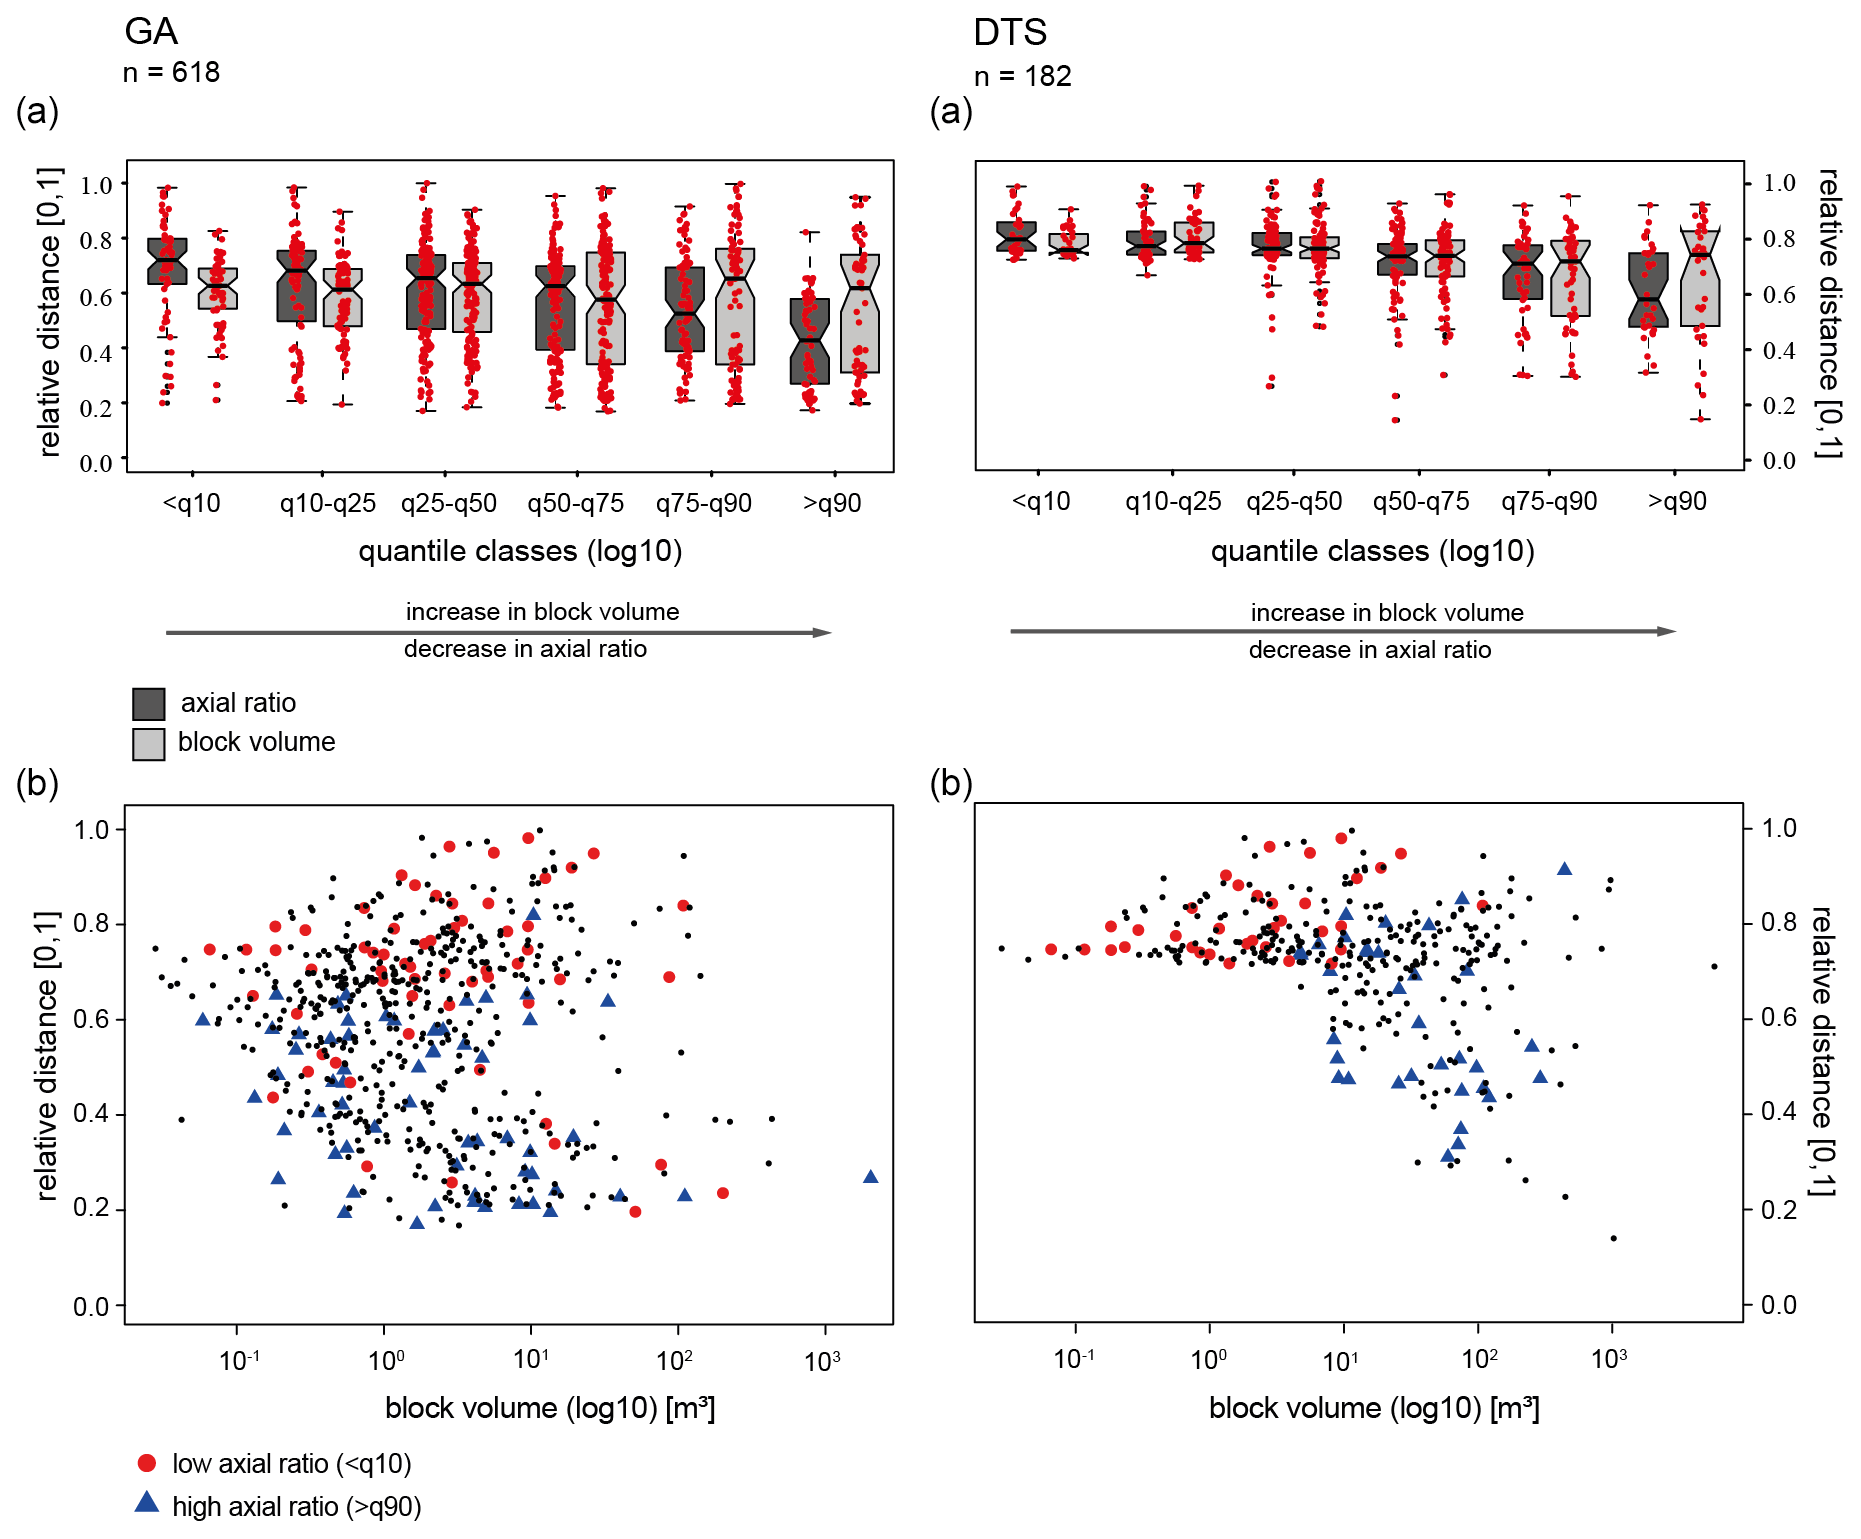
Figure 8Boxplots of relative distance versus log 10 block volume and log 10 block shapes of the measured rocks for the GA and DTS study sites (a). The red-coloured points correspond to each measured individual block. The thick black lines within the boxes show the median bounded by the first quartile (25th percentile) and the third quartile (75th percentile). The boxes show the interquartile range (IQR). The whiskers of the boxplots mark the minima and maxima of the data. The circles represent data that exceed the 1.5-fold IQR (a). Scatterplot of relative distance versus log 10 block volume for all study sites. Blocks with a low axial ratio (<q10) and a high axial ratio (>q90) are highlighted with different colours and symbols (b).
Figures 7 and 8 show that we can subdivide our study sites into two classes, regarding the runout length and block size and shape. The first class represents the study sites where the blocks can be reliably assigned to one bigger rockfall event (GA and DTS). The second class consists of the PF and ZBT sites, where we cannot reliably assign the boulders to one event and therefore have to assume continuous rockfall activity.
In the ZBT and PF areas the block sizes seem to have a recognizable influence on the runout length. Although the dispersion of the data and Spearman's rank correlation show that this correlation is not significant (Table 5), large blocks above a certain size are not present in the short runout lengths. However, Fig. 7b also shows that for PF, smaller and larger blocks are deposited in all areas of the slope. At the same time the block shape does not seem to play a major role in the runout distance, which is also indicated by Spearman's rank correlation: PF r=0.06 and ZBT r=0.27. Cuboid-shaped and elongated blocks can actually be found over the entire talus cone without any visible clustering (Fig. 7b).
GA and DTS show that the size of the blocks obviously does not play a major role in the runout length on the talus cones, as the median values do not show a significant trend, but the dispersion of the runout distances clearly increases with increasing block size. This is visible in both areas but is more pronounced at DTS. Beside this, it is also visible that blocks with larger volumes also have smaller runout distances (Figs. 7b and 8b). The scatterplots show that the block size is scattered strongly over the entire talus cone. The block size can therefore not be used as an explanation for the runout distance alone, which is in agreement with Spearman's rank correlation and supports our thesis above that there is no monocausal relationship.
The situation is different regarding the block shapes in the areas of GA and DTS. Here it is clearly visible that with an increase in axial ratio, the runout distance decreases. This is also quite consistent with the results of Spearman's rank correlation, because in these two areas a slight correlation between axial ratio and range can be stated (Table 5). This is also visible in Figs. 7b and 8b, which show the cuboid-shaped and longest blocks combined with the ranges: blocks with a low axial ratio (<q10) reach larger distances than elongated blocks (>q90) (e.g. Pérez, 1998). This can be seen in both areas from a relative distance of about 0.7 on the talus cone. We observed that the parameter axial ratio acts like a moderating parameter with regard to the deposition of blocks. Pérez (1998) and Messenzehl and Dikau (2017) conclude in their studies that equant blocks are deposited predominantly at the talus toe. As already shown by Glover et al. (2015) in their rockfall simulation, uniformly shaped blocks followed by elongated blocks achieve the largest runout distances. Platy blocks, on the other hand, are known to tend to achieve long ranges only if they manage to place themselves on the shortest axis as the axis of rotation, which will probably not be the case for all blocks. This probably explains why such blocks tend to have shorter runout distances (Glover et al., 2015). It is particularly noticeable, however, that in the DTS area all blocks (<q10) with a low axial ratio achieve very high distances and are not found at all at the shorter distances (Fig. 8b). This supports the thesis above that platy blocks only achieve high runout distances when they are placed on the short axis (wheel effect). This is different in the GA area. Here the majority of the cuboid-shaped blocks can be found not only at the end of the slope but also on the upper slope (Fig. 8b). This could be explained by the fact that the blocks collide with each other during a large rockfall event, thereby dissipating their energy, or perhaps split into smaller blocks, resulting in the different block shapes being deposited in both the lower and the upper area of the talus cone (Ruiz-Carulla and Corominas, 2020). Although this cannot be definitively confirmed with the present study, eyewitness reports speak in favour of the fact that such a collision of blocks did indeed take place at least at GA.
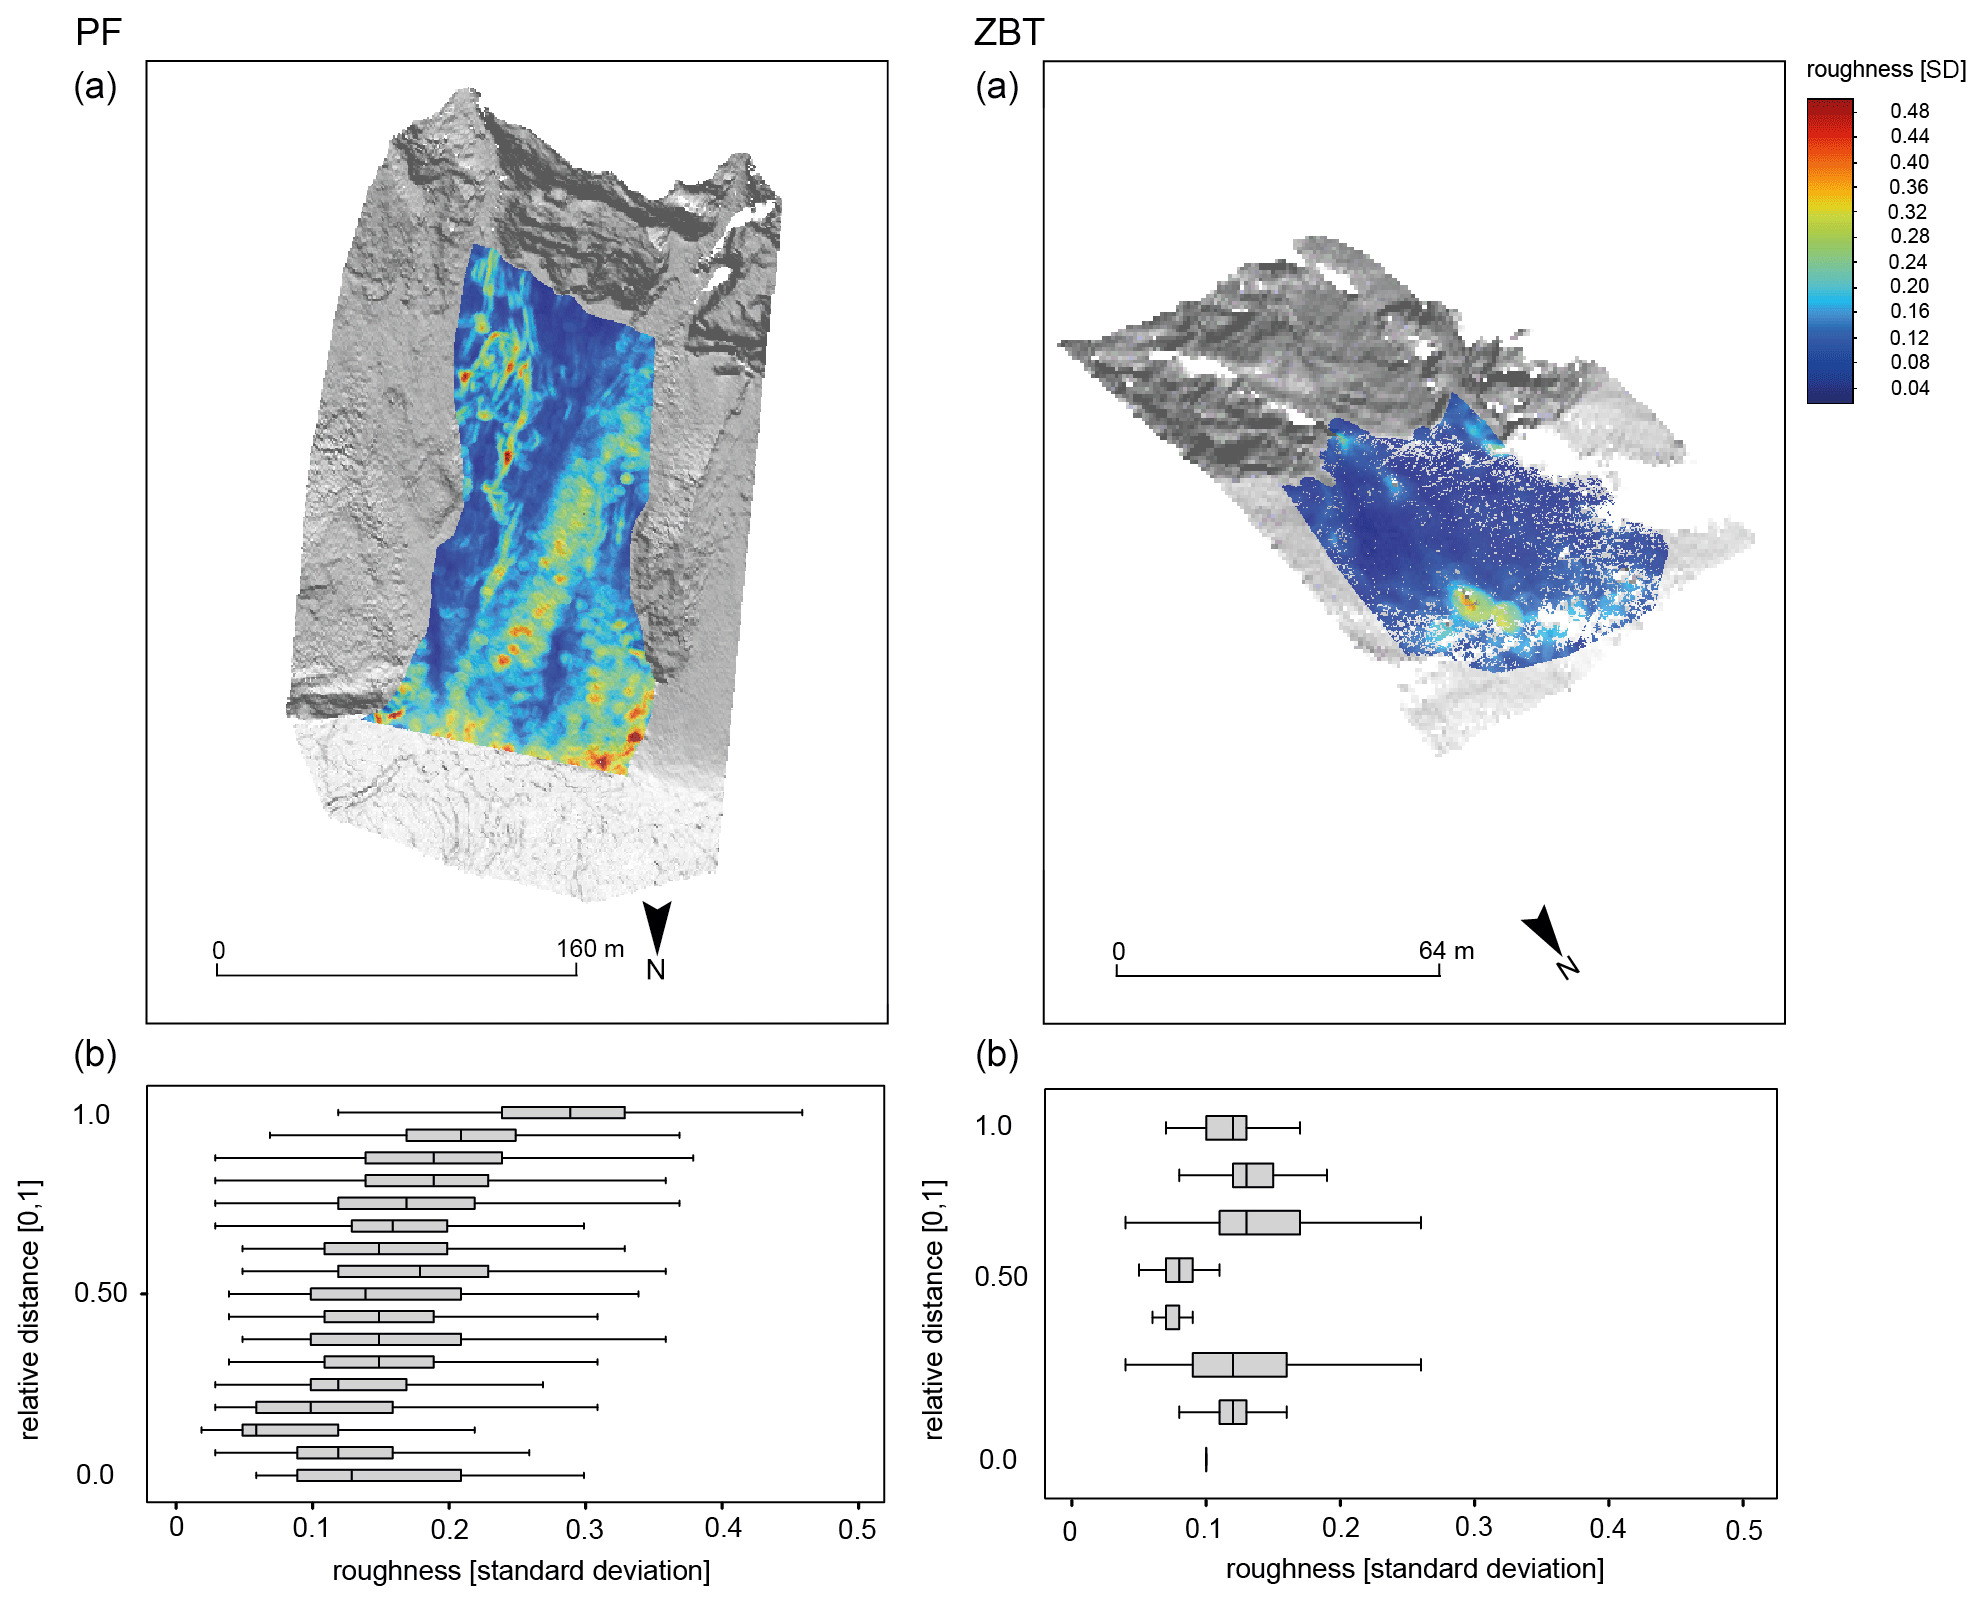
Figure 9Maps of classified slope inclination for the PF and ZBT talus cones (a). Calculated roughness (standard deviation) based on the TLS point clouds which are classified into 10 m classes of the runout distance. To compare these values, we normalized the runout length to [0,1] (b).
4.2.2 Roughness as indicator for block size distribution
To put the sampling analysis into a broader context and to verify if our single-block analysis is representative for all talus cones, we attempted to use our high-resolution data to calculate roughness on an area-wide scale for all debris cones. Here, we understand roughness as an indicator of block size, with high roughness corresponding to large blocks and low roughness corresponding to smaller blocks.
The derived roughness based on the TLS point clouds shows a clear difference between the study sites (Figs. 9 and 10), which we also found in our single-block analysis in Sect. 4.2.1. The highest roughness values on the GA and DTS talus cones can be found on the upper slope – this pattern is somewhat less pronounced in the ZBT – and then fall off and rise again towards the end of the slope. This is in good agreement with our single-block analysis, where bigger blocks tend to have longer runout distances, but some of the bigger blocks show shorter runout distances (Figs. 7 and 8). In contrast to the other talus cones the roughness in PF and the ZBT seems to be continuously increasing in the downslope direction with the lowest roughness on the upper slope and the highest roughness at the end of the slope (Fig. 9a and b). This is also in good agreement with our results of the single-block analysis in Sect. 4.2.1, where we found a recognizable influence of the runout distance by the block volume (Fig. 7). It is also visible that the ZBT shows the lowest roughness values, which fits very well with the platy structure of the gneisses, since these blocks are mostly deposited with the shortest axis perpendicular to the talus cone. Wang and Lee (2010) and Mikoš et al. (2006) simulate in their studies that the roughness of the slope has an influence on the trajectory of the blocks and accordingly influences the deposition. In their laboratory experiment, Gratchev and Saeidi (2019) also come to the conclusion that the surface properties influence the rebound angle and, accordingly, the trajectory of rockfall material.
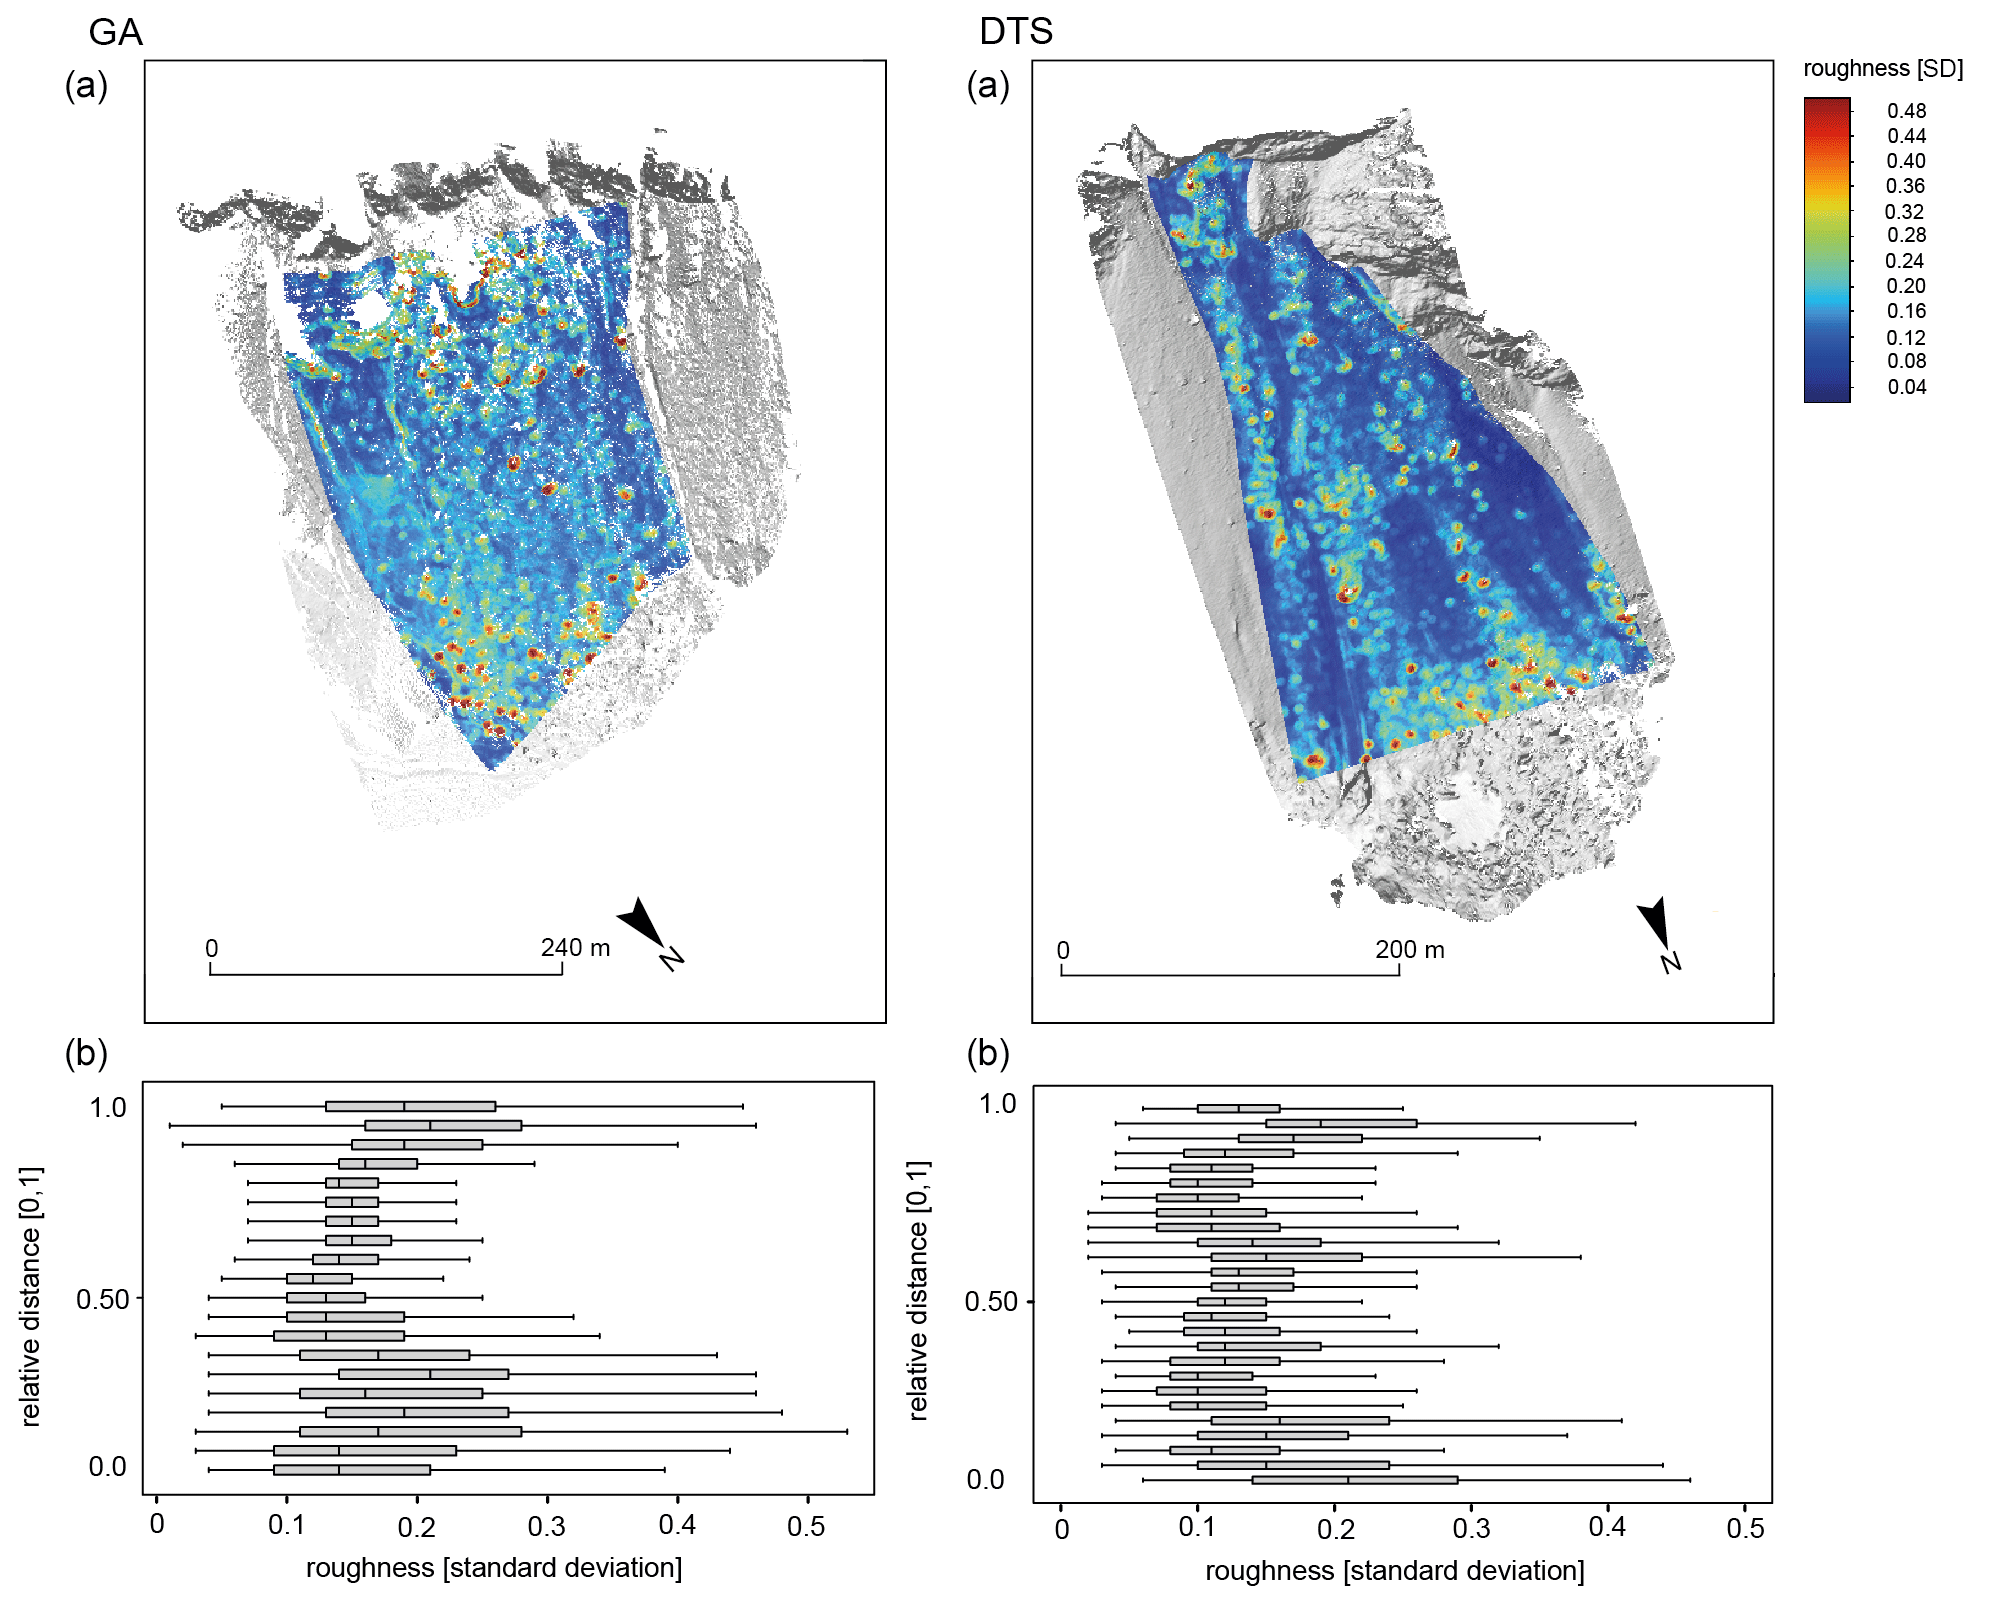
Figure 10Maps of classified slope inclination for the GA and DTS talus cones (a). Calculated roughness (standard deviation) based on the TLS point clouds which are classified into 10 m classes of the runout distance. To compare these values, we normalized the runout length to [0,1] (b).
As our data show the talus cones only for one time step and we do not have information about the pre-event roughness, we cannot draw any conclusion about how the roughness of the talus cone acts as a moderating factor for the runout distances of our single blocks. But regarding Statham (1976) it is very likely that the roughness can play a major role and thus has influenced the runout distance of blocks in the past and will also do so in the future. However, it must be taken into account that the influence of roughness is also likely to depend on the block size of the rockfall material. It must be considered that the influence of roughness for smaller particles on the slope is more decisive than for larger particles that are not stopped by coarser material (Statham, 1976).
Our investigations show a discernible relationship between the lithology and the characteristics of the rockfall material within the four test sites. We found larger blocks on the talus cones of GA and DTS with their thickly banked limestones and dolomites. In contrast smaller blocks were found in areas with slated and platy gneisses (ZBT) as well as in thinly layered basaltic lava material (PF).
In addition to block size, lithology also seems to have a significant effect on block shape. Thus, the highest axial ratios were found in the ZBT area with platy gneisses. The limestones of DTS and GA show similar mean values and a similar scatter of data, indicating that dolomites and Wetterstein limestones produce similar block sizes and block shapes to thick-bedded reef limestones. Just the scatter of the data and the block size force the block volume and the block shape to not only be controlled by the banking, which indeed tends to lead to large block sizes. An additional controlling variable seems to be the clefting of the material. The combination of irregular clefting and thick banks apparently results in blocks with large volumes but different axial ratios. In contrast to the other test sites, the material of PF with its small block sizes and low axial ratios differs clearly. Here, the thin stratification of the lava material in connection with the strong tectonic stress due to frequent earthquakes and the resulting numerous fractures in the material certainly play a significant role in block size and block shape, resulting in smaller volumes and regularly shaped boulders.
Our analyses reveal a complex relation between block size and block shape with respect to the runout distance of deposited blocks with divergences between different lithological settings. Compared to other studies (Whitehouse and McSaveney, 1983; Jomelli and Francou, 2000; Sanders et al., 2009; Luckman, 2013a; Messenzehl and Dikau, 2017; Popescu et al., 2017) and with respect to our results we can neither confirm nor reject the theory of gravitational sorting (Figs. 7b and 8b) as we did not find a clear relationship between block size and runout distance.
But for PF, GA and DTS we can confirm a tendency towards gravitational sorting to varying degrees, since blocks with a higher block volume tend to have longer runout distances. But we also find larger blocks with shorter runout distances as well as smaller blocks with longer runout distances. In contrast, almost no gravitational sorting could be detected for the ZBT area.
Thus and in agreement with other studies (e.g. Meißl, 1998; Haas et al., 2012; Glover et al., 2015; Messenzehl and Dikau, 2017) we can assume that the block size does not seem to be the only controlling variable.
According to our findings, the axial ratio of boulders for GA and DTS seems to influence the deposition of rock fragments on the talus cone such that blocks with increasing axial ratios have decreasing runout distances (Pérez, 1998; Glover et al., 2015; Messenzehl and Dikau, 2017; Volkwein et al., 2018). It seems that boulders with a low axial ratio roll over any axis and do not lose momentum, while boulders with a high axial ratio seem to either not always place themselves on the favourable axis of rotation or lose energy by tumbling due to their unfavourable axial ratio. In our study, blocks of the DTS study site with a low axial ratio achieve large runout distances. For the GA study site, blocks with a low axial ratio are found on the upper and on the lower part of the slope. But in the case of PF and the ZBT we cannot confirm the hypothesis of a moderating role of the axial ratio. For both study sites cuboid-shaped blocks as well as elongated blocks are deposited over all the slopes. Whether this is due to the different lithological setting or the fact that GA as well as DTS primarily includes blocks of one rockfall event, while the blocks in PF and the ZBT represent several individual and presumably temporally unrelated block falls, cannot finally be clarified. For this reason, singular rockfalls in different lithologies should be investigated in further studies.
The spatial roughness analysis based on the TLS point clouds shows a good agreement with single-block analysis regarding the dependencies between runout distance and block volume. Thus we can conclude that roughness can be used for such analysis instead of time-consuming single-block measurements. By using roughness as a proxy for block size, it would therefore be possible to investigate a larger number of test areas with this method and thus to investigate the implied relationships between lithology and block size in more depth in future studies. Such studies could perhaps be supplemented by a sample analysis of block shapes. Furthermore, due to the increasing number of available lidar data sets, it seems possible to include roughness as an additional influencing factor in a runout distance analysis, since information about the relief before an event would already be available for future rockfall events. We are quite sure that such a study can be carried out on the basis of ALS data or photogrammetric elevation models based on aerial photographs, where point densities are high enough to resolve blocks of a certain size, which are nowadays available for the whole of the Alps and mountain ranges worldwide.
The data used in this study are accessible upon request by contacting Kerstin Wegner (KWegner@ku.de).
KW, FH and TH designed the conceptual idea of the manuscript. KW and FH collected the terrestrial laser scanning data on La Réunion. FH collected the TLS data of DTS, the ZBT and GA. TH contributed to statistical analysis of data. VD, NV and PK acquired the dGPS data on La Réunion. NV, PK and AP contributed to fieldwork on La Réunion. AM contributed to the financial support of the travel costs to La Réunion and gave feedback on the analysis of data, references, results and interpretation. MB contributed to the acquisition of the terrestrial laser scanner. KW wrote the manuscript with discussions and improvements from all co-authors.
The authors declare that they have no conflict of interest.
Florian Haas kindly provided the photographs used for Fig. 1, in particular of La Réunion, Dreitorspitze and Zwieselbach valley. The photo of Gampenalm was taken by an installed camera as part of the ERC SLIDEQUAKES project. We greatly appreciate the constructive comments and detailed feedback by the three anonymous referees that helped to improve the quality of this paper.
Financial support for the fieldwork on La Réunion was provided by ERC-CG-2013-PE10-617472SLIDEQUAKES. This is IPGP contribution no. 4204. The open-access publication of this article was supported by the Open Access Fund of the Catholic University Eichstätt-Ingolstadt.
This paper was edited by Yves Bühler and reviewed by three anonymous referees.
Abellán, A., Vilaplana, J. M., Calvet, J., García-Sellés, D., and Asensio, E.: Rockfall monitoring by Terrestrial Laser Scanning – case study of the basaltic rock face at Castellfollit de la Roca (Catalonia, Spain), Nat. Hazards Earth Syst. Sci., 11, 829–841, https://doi.org/10.5194/nhess-11-829-2011, 2011.
Agliardi, F. and Crosta, G. B.: High resolution three-dimensional numerical modelling of rockfalls, Int. J. Rock Mech. Min., 40, 455–471, https://doi.org/10.1016/S1365-1609(03)00021-2, 2003.
Azzoni, A. and de Freitas, M. H.: Experimentally gained parameters, decisive for rock fall analysis, Rock Mech. Rock Eng., 28, 111–124, https://doi.org/10.1007/BF01020064, 1995.
Bennett, G. L., Molnar, P., Eisenbeiss, H., and McArdell, B. W.: Erosional power in the Swiss Alps: Characterization of slope failure in the Illgraben, Earth Surf. Proc. Land., 37, 1627–1640, https://doi.org/10.1002/esp.3263, 2012.
Caine, N.: The texture of talus in Tasmania, J. Sediment. Res., 37, 796–803, https://doi.org/10.1306/74D717A3-2B21-11D7-8648000102C1865D, 1967.
Caviezel, A., Demmel, S. E., Ringenbach, A., Bühler, Y., Lu, G., Christen, M., Dinneen, C. E., Eberhard, L. A., von Rickenbach, D., and Bartelt, P.: Reconstruction of four-dimensional rockfall trajectories using remote sensing and rock-based accelerometers and gyroscopes, Earth Surf. Dynam., 7, 199–210, https://doi.org/10.5194/esurf-7-199-2019, 2019.
Conrad, O., Bechtel, B., Bock, M., Dietrich, H., Fischer, E., Gerlitz, L., Wehberg, J., Wichmann, V., and Böhner, J.: System for Automated Geoscientific Analyses (SAGA) v. 2.1.4, Geosci. Model Dev., 8, 1991–2007, https://doi.org/10.5194/gmd-8-1991-2015, 2015.
Copons, R., Vilaplana, J. M., and Linares, R.: Rockfall travel distance analysis by using empirical models (Solà d'Andorra la Vella, Central Pyrenees), Nat. Hazards Earth Syst. Sci., 9, 2107–2118, https://doi.org/10.5194/nhess-9-2107-2009, 2009.
Cox, N. J.: Kernel estimation as a basic tool for geomorphological data analysis, Earth Surf. Proc. Land., 32, 1902–1912, https://doi.org/10.1002/esp.1518, 2007.
Crosta, G. B., Agliardi, F., Frattini, P., and Lari, S.: Key issues in rock fall modeling, hazard and risk assessment for rockfall protection, in: Engineering Geology for Society and Territory, 2, Landslide Processes, eds.: Lollino, G., Giordan, D., Crosta, G., Corominas, J., Azzam, R., Wasowski, J., and Sciarra, N., Springer, International Publishing, Cham, Heidelberg, New York, Dordrecht, London, Switzerland, 43–58, https://doi.org/10.1007/978-3-319-09057-3_4, 2015.
Cui, Sh., Pei, Xj., and Huang, Rq.: Rolling motion behavior of rockfall on gentle slope: an experimental approach, J. Mt. Sci., 14, 1550–1562, https://doi.org/10.1007/s11629-016-4144-7, 2017.
Dietze, M., Mohadjer, S., Turowski, J. M., Ehlers, T. A., and Hovius, N.: Seismic monitoring of small alpine rockfalls – validity, precision and limitations, Earth Surf. Dynam., 5, 653–668, https://doi.org/10.5194/esurf-5-653-2017, 2017.
Dietze, M., Turowski, J. M., Cook, K. L., and Hovius, N.: Spatiotemporal patterns, triggers and anatomies of seismically detected rockfalls, Earth Surf. Dynam., 5, 757–779, https://doi.org/10.5194/esurf-5-757-2017, 2017.
Dorren, L. K. A.: A review of rockfall mechanics and modelling approaches, Prog. Phys. Geog., 27, 69–87, https://doi.org/10.1191/0309133303pp359ra, 2003.
Durand, V., Mangeney, A., Haas, F., Jia, X., Peltier, A., Hibert, C., Ferrazzini, V., Kowalski, P., Lauret, F., Brunet, C., Satriano, C., Wegner, K., Delorme, A., Bonilla, F., and Villeneuve, N.: On the link between external forcings and slope instabilities in the Piton de la Fournaise summit crater, Reunion Island, J Geophys Res: Earth Surface, 123, 2422–2442, https://doi.org/10.1029/2017JF004507, 2018.
Farin, M., Mangeney, A., Toussaint, R., de Rosny, J., Shapiro, N., Dewez, T., Hibert, C., Mathon, C., Sedan, O., and Berger, F.: Characterization of rockfalls from seismic signal: Insights from laboratory experiments, J. Geophys. Res.-Sol. Ea., 120, 7102–7137, https://doi.org/10.1002/2015JB012331, 2015.
Feng, L., Pazzi, V., Intrieri, E., Gracchi, T., and Gigli, G.: Rockfall seismic features analysis based on in situ tests: frequency, amplitude, and duration, J. Mt. Sci., 16, 955–970, https://doi.org/10.1007/s11629-018-5286-6, 2019.
Fityus, S. G., Giacomini, A., and Buzzi, O.: The significance of geology for the morphology of potentially unstable rocks, Eng. Geol., 162, 43–52, https://doi.org/10.1016/j.enggeo.2013.05.007, 2013.
Francou, B. and Manté, C.: Analysis of the segmentation in the profile of alpine talus slopes, Permafrost Periglac., 1, 53–60, https://doi.org/10.1002/ppp.3430010107, 1990.
Frattini, P., Crosta, G. B., and Agliardi, F.: Rockfall characterization and modeling, in: Landslides, Types, Mechanisms and Modeling, eds.: Clague, J. J. and Stead, D., Cambridge University Press, Cambridge, United Kingdom, 267–281, https://doi.org/10.1017/CBO9780511740367.023, 2012.
Gerber, E.: Klassifikation von Schutthalden, Geogr. Helv., 29, 73–82, https://doi.org/10.5194/gh-29-73-1974, 1974.
Glover, J., Bartelt, P., Christen, M., and Gerber, W.: Rockfall-simulation with irregular rock blocks, in: Engineering Geology for Society and Territory, Volume 2, eds.: Lollino, G., Giordan, D., Crosta, G. B., Corominas, J., Azzam, R., Wasowski, J., and Sciarra, N., Springer, International Publishing, Cham, Heidelberg, New York, Dordrecht, London, Switzerland, 1729–1733, https://doi.org/10.1007/978-3-319-09057-3_306, 2015.
Gratchev, I. and Saeidi, S.: The effect of surface irregularities on a falling rock motion, Geomechanics and Geoengineering, 14, 52–58, https://doi.org/10.1080/17486025.2018.1508857, 2019.
Guerin, A., Stock, G. M., Radue, M. J., Jaboyedoff, M., Collins, B. D., Matasci, B., Avdievitch, N., and Derron, M.-H.: Quantifying 40 years of rockfall activity in Yosemite Valley with historical Structure-from-Motion photogrammetry and terrestrial laser scanning, Geomorphology, 356, 1–18, https://doi.org/10.1016/j.geomorph.2020.107069, 2020.
Haas, F., Heckmann, T., Wichmann, V., and Becht, M.: Runout analysis of a large rockfall in the Dolomites/Italian Alps using LIDAR derived particle sizes and shapes, Earth Surf. Proc. Land., 37, 1444–1455, https://doi.org/10.1002/esp.3295, 2012.
Heckmann, T., Bimböse, M., Krautblatter, M., Haas, F., Becht, M., and Morche, D.: From geotechnical analysis to quantification and modeling using LiDAR data: A study on rockfall in the Reintal catchment, Bavarian Alps, Germany, Earth Surf. Proc. Land., 37, 119–133, https://doi.org/10.1002/esp.2250, 2012.
Heiser, M., Scheidl, C., and Kaitna, R.: Evaluation concepts to compare observed and simulated deposition areas of mass movements, Comput. Geosci., 21, 335–343, https://doi.org/10.1007/s10596-016-9609-9, 2017.
Hergarten, S., Robl, J., and Stüwe, K.: Extracting topographic swath profiles across curved geomorphic features, Earth Surf. Dynam., 2, 97–104, https://doi.org/10.5194/esurf-2-97-2014, 2014.
Hibert, C., Mangeney, A., Grandjean, G., and Shapiro, N. M.: Slope instabilities in Dolomieu crater, Réunion island: From seismic signals to rockfall characteristics, J. Geophys. Res., 116, 1–18, https://doi.org/10.1029/2011JF002038, 2011.
Hibert, C., Mangeney, A., Grandjean, G., Peltier, A., DiMuro, A., Shapiro, N. M., Ferrazzini, V., Boissier, P., Durand, V., and Kowalski, P.: Spatio-temporal evolution of rockfall activity from 2007 to 2011 at the Piton de la Fournaise volcano inferred from seismic data, J. Volcanol. Geoth. Res., 333-334, 36–52, https://doi.org/10.1016/j.jvolgeores.2017.01.007, 2017.
Hungr, O. and Evans, S. G.: Engineering evaluation of fragmental rockfall hazards, in: Proceedings of the 5th International Symposium on Landslides, Lausanne, Switzerland, 10–15 July 1988, 894318, 685–690, 1988.
Jaboyedoff, M. and Derron, M.-H.: Hazard assessment within an Integrated Risk Assessment Process for Landslides (IRAPL), in: Proceedings of the International Conference on Landslide Risk Management, Vancouver, Canada, 31 May–3 June 2005, 2005.
Jaboyedoff M., Metzger R., Oppikofer T., Couture R., Derron M.-H., Locat J., and Turmel D.: New insight techniques to analyze rock-slope relief using DEM and 3D-imaging cloud points: COLTOP-3D software, in: Proceedings of the 1st Canada-US Rock Mechanics Symposium, Vancouver, Canada, 27–31 May 2007, ARMA-07-008, 61–68, 2007.
Jaboyedoff, M. and Labiouse, V.: Technical Note: Preliminary estimation of rockfall runout zones, Nat. Hazards Earth Syst. Sci., 11, 819–828, https://doi.org/10.5194/nhess-11-819-2011, 2011.
Ji, Z.-M., Chen, Z.-J., Niu, Q.-H., Wang, T.-J., Song, H., and Wang, T.-H.: Laboratory study on the influencing factors and their control for the coefficient of restitution during rockfall impacts, Landslides, 16, 1939–1963, https://doi.org/10.1007/s10346-019-01183-x, 2019.
Jomelli, V. and Francou, B.: Comparing the characteristics of rockfall talus and snow avalanche landforms in an Alpine environment using a new methodological approach: Massif des Ecrins, French Alps, Geomorphology, 35, 181–192, https://doi.org/10.1016/S0169-555X(00)00035-0, 2000.
Kenner, R.: Mass wasting processes affecting the surface of an alpine talus slope: Annual sediment budgets 2009–2018 at Flüelapass, eastern Swiss Alps, Land Degrad. Dev., 31, 451–462, https://doi.org/10.1002/ldr.3462, 2019.
Kirkby, M. J. and Statham, I.: Surface stone movement and scree formation, J. Geol., 83, 349–362, https://www.jstor.org/stable/30059027 (last access: 8 February 2021), 1975.
Knoblich, K.: Über den Böschungswinkel von Schutthalden, Catena, 2, 1–10, https://doi.org/10.1016/S0341-8162(75)80001-4, 1975.
Kotarba, A. and Strömquist, L.: Transport, sorting and deposition processes of Alpine debris slope deposits in the Polish Tatra mountains, Geogr. Ann. A, 66, 285–294, https://doi.org/10.1080/04353676.1984.11880116, 1984.
Krautblatter M. and Dikau R.: Towards a uniform concept for the comparison and extrapolation of rockwall retreat and rockfall supply, Geogr. Ann. A, 89, 21–40, https://doi.org/10.1111/j.1468-0459.2007.00305.x, 2007.
Kromer, R., Walton, G., Gray, B., Lata, M., and Group, R.: Development and optimization of an automated fixed-location time lapse photogrammetric rock slope monitoring system, Remote Sens., 11, 1–18, https://doi.org/10.3390/rs11161890, 2019.
Lambert, S., Bourrier, F., and Toe, D.: Improving three-dimensional rockfall trajectory simulation codes for assessing the efficiency of protective embankments, Int. J. Rock Mech. Min., 60, 26–36, https://doi.org/10.1016/j.ijrmms.2012.12.029, 2013.
Leine, R. I., Schweizer, A., Christen, M., Glover, J., Bartelt, P., and Gerber, W.: Simulation of rockfall trajectories with consideration of rock shape, Multibody Syst. Dyn., 32, 241–271, https://doi.org/10.1007/s11044-013-9393-4, 2014.
Lénat, J.-F., Bachèlery, P., and Merle, O.: Anatomy of Piton de la Fournaise volcano (La Réunion, Indian Ocean), Bull. Volcanol., 74, 1945–1961, https://doi.org/10.1007/s00445-012-0640-y, 2012.
Luckman, B. H.: Processes, transport, deposition, and landforms: rockfall, in: Mountain and Hillslope Geomorphology, Treatise on Geomorphology, edited by: Shroder, J. F., Stoffel, M., and Marston, R. A., Reference Module in Earth Systems and Environmental Sciences, 7, 174–182, https://doi.org/10.1016/B978-0-12-374739-6.00162-7, 2013a.
Luckman, B. H.: Talus slopes, ed.: Elias, S. A., The Encyclopedia of Quaternary Science, 3, 566–573, Elsevier, Amsterdam, 2013b.
Meißl, G.: Modellierung der Reichweite von Felsstürzen, Fallbeispiele zur GIS-gestützten Gefahrenbeurteilung aus dem Bayerischen und Tiroler Alpenraum, PhD thesis, Institute of Geography, University of Innsbruck, Austria, 249 pp., 1998.
Merle, O., Mairine, P., Michon, L., Bachèlery, P., and Smietana, M: Calderas, landslides and paleo-canyons on Piton de la Fournaise volcano (La Réunion Island, Indian Ocean), J. Volcanol. Geoth. Res., 189, 131–142, https://doi.org/10.1016/j.jvolgeores.2009.11.001, 2010.
Messenzehl, K. and Dikau, R.: Structural and thermal controls of rockfall frequency and magnitude within rockwall-talus systems (Swiss Alps), Earth Surf. Proc. Land., 42, 1963–1981, https://doi.org/10.1002/esp.4155, 2017.
Mikoš, M., Petje, U., and Ribičič, M.: Application of a rockfall simulation program in an Alpine valley in Slovenia, in Proceedings of the INTERPRAEVENT International Symposium Disaster Mitigation of Debris Flows, Slope Failures and Landslides, Niigata, Japan, 25–27 September 2006, 199–211, 2006.
Nappi, M., Budetta, P., Lombardi, G. and Minotta, C.: Rockfall run-out estimate comparing empirical and trajectographic approaches, in: Landslide Science and Practice Volume 6: Risk Assessment, Management and Mitigation, eds.: Margottini, C., Canuti, P., and Sassa, K., Springer, Berlin, Heidelberg, Germany, 177–182, https://doi.org/10.1007/978-3-642-31319-6_25, 2013.
Okura, Y., Kitahara, H., Sammori, T., and Kawanami, A.: The effects of rockfall volume on runout distance, Eng. Geol., 58, 109–124, https://doi.org/10.1016/S0013-7952(00)00049-1, 2000.
Peltier, A., Bachèlery, P., and Staudacher, T.: Magma transport and storage at Piton de la Fournaise (La Réunion) between 1972 and 2007: A Review of geophysical and geochemical data, J. Volcanol. Geoth. Res., 184, 93–108, https://doi.org/10.1016/j.jvolgeores.2008.12.008, 2009a.
Peltier, A., Staudacher, T., Bachèlery, P., and Cayol, V.: Formation of the April 2007 caldera collapse at Piton de la Fournaise volcano: Insights from GPS data, J. Volcanol. Geoth. Res., 184, 152–163, https://doi.org/10.1016/j.jvolgeores.2008.09.009, 2009b.
Peltier, A., Villeneuve, N., Ferrazzini, V., Testud, S., Hassen, T., Boissier, P., and Catherine, P.: Changes in the long-term geophysical eruptive precursors at Piton de la Fournaise: Implications for the response management, Front. Earth Sci., 6, https://doi.org/10.3389/feart.2018.00104, 2018.
Pérez, F. L.: Talus fabric and particle morphology on Lassen Peak, California, Geogr. Ann. A, 71, 43–57, https://doi.org/10.2307/521007, 1989.
Pérez, F. L.: Talus fabric, clast morphology, and botanical indicators of slope processes on the Chaos Crags (California Cascades), USA, Geogr. Phys. Quatern., 52, 1–22, https://doi.org/10.7202/004861ar, 1998.
Pfeiffer, T. J. and Bowen, T. D.: Computer simulations of rockfalls, Bulletin of the Association of Engineering Geologists, 26, 135–146, https://doi.org/10.2113/gseegeosci.xxvi.1.135, 1989.
Popescu, R., Vespremeanu-Stroe, A., Onaca, A., Vasile, M., Cruceru, N., and Pop, O.: Low-altitude permafrost research in an overcooled talus slope–rock glacier system in the Romanian Carpathians (Detunata Goală, Apuseni Mountains), Geomorphology, 295, 840–854, https://doi.org/10.1016/j.geomorph.2017.07.029, 2017.
Rapp, A.: Recent development of mountain slopes in Kärkevagge and surroundings, northern Scandinavia, Geogr. Ann., 42, 65–200, https://doi.org/10.1080/20014422.1960.11880942, 1960.
Ravanel, L., Allignol, F., Deline, P., Gruber, S., and Ravello, M.: Rock falls in the Mont Blanc Massif in 2007 and 2008, Landslides, 7, 493–501, https://doi.org/10.1007/s10346-010-0206-z, 2010.
RIEGL Laser Measurement Systems GmbH: Data Sheet, RIEGL LMS-Z420i, Horn, Austria, 2010.
RIEGL Laser Measurement Systems GmbH: Data Sheet, RIEGL VZ-4000, Horn, Austria, 2020.
Royán, M. J., Abellán, A., Jaboyedoff, M., Vilaplana, J. M., and Calvet, J.: Spatio-temporal analysis of rockfall pre-failure deformation using Terrestrial LiDAR, Landslides, 11, 697–709, https://doi.org/10.1007/s10346-013-0442-0, 2014.
Ruiz-Carulla, R. and Corominas, J.: Analysis of Rockfalls by Means of a Fractal Fragmentation Model, Rock Mech. Rock Eng., 53, 1433–1455, https://doi.org/10.1007/s00603-019-01987-2, 2020.
Sala, Z., Hutchinson, D. J., and Harrap, R.: Simulation of fragmental rockfalls detected using terrestrial laser scans from rock slopes in south-central British Columbia, Canada, Nat. Hazards Earth Syst. Sci., 19, 2385–2404, https://doi.org/10.5194/nhess-19-2385-2019, 2019.
Sandeep, C. S., Luo, L., and Senetakis, K.: Effect of Grain Size and Surface Roughness on the Normal Coefficient of Restitution of Single Grains, Materials, 13, 814, https://doi.org/10.3390/ma13040814, 2020.
Sanders, D., Ostermann, M., and Kramers, J.: Quaternary carbonate-rocky talus slope successions (Eastern Alps, Austria): sedimentary facies and facies architecture, Facies, 55, 345–373, https://doi.org/10.1007/s10347-008-0175-z, 2009.
Sens-Schönfelder, C., Pomponi, E., and Peltier, A.: Dynamics of Piton de la Fournaise volcano observed by passive image interferometry with multiple references, J. Volcanol. Geoth. Res., 276, 32–45, https://doi.org/10.1016/j.jvolgeores.2014.02.012, 2014.
Serrano, E. Sanjosé, J. J., Gómez-Gutiérrez, Á., and Gómez-Lende, M.: Surface movement and cascade processes on debris cones in temperate high mountain (Picos de Europa, northern Spain), Sci. Total Environ., 649, 1323–1337, https://doi.org/10.1016/j.scitotenv.2018.08.405, 2019.
Statham, I.: Scree slope development under conditions of surface particle movement, T. I. Brit. Geogr., 59, 41–53, https://doi.org/10.2307/621711, 1973.
Statham, I.: A scree slope rockfall model, Earth Surf. Proc., 1, 43–62, https://doi.org/10.1002/esp.3290010106, 1976.
Staudacher, T., Peltier, A., Ferrazzini, V., Di Muro, A., Boissier, P., Catherine, P., Kowalski, P., Lauret, F., and Lebreton, J.: Fifteen years of intense eruptive activity (1998–2013) at Piton de la Fournaise volcano: a review, in: Active Volcanoes of the Southwest Indian Ocean. Piton de la Fournaise and Karthala, eds.: Bachèlery, P., Lénat, J.-F., Di Muro, A., and Michon, L., Springer, Berlin, Heidelberg, Germany, 139–170, https://doi.org/10.1007/978-3-642-31395-0_9, 2016.
Strunden, J., Ehlers, T. A., Brehm, D., and Nettesheim, M.: Spatial and temporal variations in rockfall determined from TLS measurements in a deglaciated valley, Switzerland, J. Geophys. Res. Earth Surf., 120, 1251–1273, https://doi.org/10.1002/2014JF003274, 2015.
Urai, M., Geshi, N., and Staudacher, T.: Size and volume evaluation of the caldera collapse on Piton de la Fournaise volcano during the April 2007 eruption using ASTER stereo imagery, Geophys. Res. Lett., 34, 1944–8007, https://doi.org/10.1029/2007GL031551, 2007.
Valeton, I.: Beziehungen zwischen petrographischer Beschaffenheit, Gestalt und Rundungsgrad einiger Flussgerölle (Dependencies between petrographic conditions, shape and rounding of a few bedload gravel), Petermann Geogr. Mitt., 99, 13–17, 1955.
Vanneschi, C., Di Camillo, M., Aiello, E., Bonciani, F., and Salvini, R.: SfM-MVS photogrammetry for rockfall analysis and hazard assessment along the ancient Roman Via Flaminia road at the Furlo gorge (Italy), ISPRS Int. Geo-Inf., 8, 1–23, https://doi.org/10.3390/ijgi8080325, 2019.
Vilajosana, I., Suriñach, E., Abellán, A., Khazaradze, G., Garcia, D., and Llosa, J.: Rockfall induced seismic signals: case study in Montserrat, Catalonia, Nat. Hazards Earth Syst. Sci., 8, 805–812, https://doi.org/10.5194/nhess-8-805-2008, 2008.
Volkwein, A., Schellenberg, K., Labiouse, V., Agliardi, F., Berger, F., Bourrier, F., Dorren, L. K. A., Gerber, W., and Jaboyedoff, M.: Rockfall characterisation and structural protection – a review, Nat. Hazards Earth Syst. Sci., 11, 2617–2651, https://doi.org/10.5194/nhess-11-2617-2011, 2011.
Volkwein, A., Brügger, L., Gees, F., Gerber, W., Krummenacher, B., Kummer, P., Lardon, J., and Sutter, T.: Repetitive rockfall trajectory testing, Geosciences, 8, 1–27, https://doi.org/10.3390/geosciences8030088, 2018.
Wang, I.-T. and Lee, C.-Y.: Influence of slope shape and surface roughness on the moving paths of a single rockfall, World Academy of Science, Engineering and Technology, International Journal of Civil, Environmental, Structural, Construction and Architectural Engineering, 4, 122–128, 2010.
Wang, Y., Jiang, W., Cheng, S., Song, P., and Mao, C.: Effects of the impact angle on the coefficient of restitution in rockfall analysis based on a medium-scale laboratory test, Nat. Hazards Earth Syst. Sci., 18, 3045–3061, https://doi.org/10.5194/nhess-18-3045-2018, 2018.
White, S. E.: Alpine mass movement forms (noncatastrophic): Classification, description, and significance, Arctic Alpine Res., 13, 127–137, https://doi.org/10.2307/1551190, 1981.
Whitehouse, I. E. and McSaveney, M. J.: Diachronous talus surfaces in the Southern Alps, New Zealand, and their implications to talus accumulation, Arctic Alpine Res., 15, 53–64, https://doi.org/10.2307/1550981, 1983.
Wichmann, V.: The Gravitational Process Path (GPP) model (v1.0) – a GIS-based simulation framework for gravitational processes, Geosci. Model Dev., 10, 3309–3327, https://doi.org/10.5194/gmd-10-3309-2017, 2017.
Yamamoto, T., Takada, A., Ishizuka, Y., Miyaji, N., and Tajima, Y.: Basaltic pyroclastic flows of Fuji volcano, Japan: characteristics of the deposits and their origin, Bull. Volcanol., 67, 622–633, https://doi.org/10.1007/s00445-004-0398-y, 2005.
Zevenbergen, L. W. and Thorne, C. R.: Quantitative analysis of land surface topography, Earth Surf. Proc. Land., 12, 47–56, https://doi.org/10.1002/esp.3290120107, 1987.