the Creative Commons Attribution 4.0 License.
the Creative Commons Attribution 4.0 License.
Impact database application for natural and technological risk management
Valery Larionov
Jean Bonnin
Sergey Suchshev
Alexander Ugarov
Nataliya Malaeva
Impact database development and application for risk analysis and management promote the usage of self-learning computer systems with elements of artificial intelligence. Such system learning could be successful when the databases store the complete information about each event, parameters of the simulation models, the range of its application, and residual errors. Each new description included in the database could increase the reliability of the results obtained with application of simulation models. The calibration of mathematical models is the first step to self-learning of automated systems. The article describes the events' database structure and examples of calibrated computer models as applied to the impact of expected emergencies and risk indicator assessment. Examples of database statistics usage in order to rank the subjects of the Russian Federation by the frequency of emergencies of different character as well as risk indicators are given.
- Article
(14176 KB) - Full-text XML
- Companion paper
- BibTeX
- EndNote
Analysis of the natural and technological emergency consequences gives evidence that natural hazards and technological disasters pose an increasing threat to the safety of citizens and the economy of the Russian Federation. The increasing severity of the impact indicates the need to improve the effectiveness of measures aimed at risk reduction. The Ministry of the Russian Federation for Civil Defence, Emergencies and Elimination of Consequences of Natural Disasters (EMERCOM) of the Russian Federation considers preventive measures to be the top priority. They are based on application of information systems (IS) that provide reliable forecasts, including a reliable assessment of a spatially distributed indicator that characterises the safety of a region, which makes it possible to rationally distribute forces and resources in order to reduce risk.
Another important task, which may be solved with IS usage, is to enhance the efficiency of rescue operations. This could be achieved by higher reliability of the operational forecast of situations based on the data contained in the database (DB) of events. Examples of successful rescue operations accumulated in DB facilitate the decision-making process and reduce the time when people stay in the affected area, which results in decreasing the fatality likelihood.
The article focuses on increasing the reliability of expected emergency impact through calibration of IS mathematical models (Ranguelov and Frantzova, 2017).
The considered event DB (Kachanov et al., 2011, 2014) is interdepartmental, and since 1992 it has been maintained by the resources of the National Center for Crisis Management EMERCOM of Russia. Information about events and their impact comes from the EMERCOM departments and different agencies, including the system 112. Currently, the DB includes more than 30 000 records with a detailed description of emergency situations and rescue operations and an assessment of their effectiveness.
For seismic events that occur quite rarely in the Russian Federation, the list has been expanded retrospectively with records of earlier years from other sources. Archival data are used, the relevance of which is supported by the efforts of researchers at the Russian Academy of Sciences (RAS) and various international organisations. First of all, the following DBs are used: the “Extremum” DB, the “Strong and Felt Earthquakes of the Northern Eurasia” DB, the “EM DAT” DB of the Brussels Center for Epidemiology of Disasters, and the DB of the Swiss Re and Munich Re reinsurance companies. Important sources of information also include the “CATNAT” database, which is used to calibrate the “PAGER” IS (Allen et al., 2009), and the Cambridge Earthquake Impact Database (http://www.ceqid.org/, last access: 17 July 2019) (So, 2014; Spence et al., 2011), used for calibration of vulnerability functions for buildings and structures of various types when calculating seismic risk. Extensive macroseismic information is of great importance as well. It is available as reconnaissance team reports, scientific papers, earthquake atlases of individual countries (Kalmetieva et al., 2009; Babayan, 2006), and electronic DBs (Rovida et al., 2016; Varazanashvili et al., 2018).
The article gives examples of calibrated models as applied in near-real-time earthquake loss estimation practised at the EMERCOM of Russia. The results of EMERCOM DB statistical data analysis for statistical information in the Russian Federation with different levels of emergency frequency and various values of risk indicators are also listed.
The EMERCOM database title partially describes its content, namely data “about events”, and it accurately corresponds to the structure of the records. It allows the retrieval of the time and location of an event; operations carried out and their effectiveness; and used forces and resources, their sufficiency and estimation of the operations, and the reported social and economic losses.
Each DB entry is, to some extent, an event passport which is characterised as an emergency situation. A unique number is assigned to DB entries, which allows connection to entries in the databases belonging to different agencies interested in sharing and obtaining the information in order to normalise the emergency situation. Due to the uniqueness of entry number and the event standard description corresponding to the regulatory documentation, event entry can become part of the state or international spatial data infrastructure (https://doi.org/10.5281/zenodo.3406127) (LODGD, 2019).
The DB is part of the EMERCOM IS data storage developed and maintained up to date within the ministry information programme. In addition to the data storage, the EMERCOM IS includes software consisting of a set of blocks and interfaces. The system was developed using modern Web technologies (Izmalkov, 2017a, b).
The structure of the DB about events, which is part of the EMERCOM IS data storage, primarily aims at providing management automation and solving the following tasks with the system application:
-
inventory of hazard sources and elements at risk;
-
forecast of the level of hazard and preparation of data for warning, including the information for mass media;
-
monitoring and recording of events characterised as an emergency;
-
analytical decision support in case of emergencies, including the method of mathematical modelling of hazardous impacts, the response of elements at risk, and the forecast of losses;
-
analytical support for risk assessment and mapping;
-
drafting reports on the situation, weather conditions, needed forces and resources, and the assessment of possible losses.
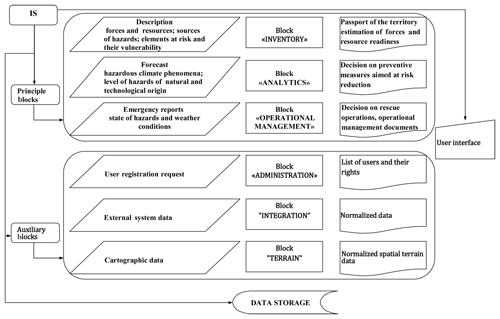
A scheme of the EMERCOM IS is presented in the figure (Fig. 1), where the enlarged functional units, the data storage, and the user interface are highlighted. The names of units reflect their functionality, which is supplemented by a description of the input and output information. The structure identifies the main units of IS, including software tools under the titles “Inventory”, “Analytics”, “Operational Management”.
The “Inventory” block is assigned to collect and process the data necessary for creating documents called the “territory passport”, which contains
-
name and affiliation of objects (territories);
-
location of the facilities subject to inventory;
-
parameters of hazard sources;
-
vulnerability functions of elements at risk;
-
availability, deployment, as well as readiness indicators of forces and resources needed for preventive measures implementation and rescue operations.
Web interface resources accessible by local (as close as possible to the source of information) employees of the unified state system of emergency prevention and response (RSES) are used to collect data. As an output, a “passport of the territory” is developed, which contains information in order to estimate matching of the hazard level, the measures taken, and the risk indices.
The “operational management” block deals with recording, qualification, and operational management of forces and resources during events characterised as an emergency. The output of this block is an “event card”. It includes descriptions of the emergency impact, which can be updated over time, and a set of documents ensuring the management of forces and resources during rescue and other urgent actions.
The “analytics” block contains mathematical models of the main types of hazardous processes and their impact, which allow a possible situation in the affected zone to be predicted. The models meet special requirements due to high demands on the speed of response to input data and ensuring the possible minimum error in results of the forecast, which may depend on input data measurement and transmission.
The “analytics” block's mathematical models are calibrated for the site of an event in order to ensure acceptable accuracy of simulation results. Zones with a set of calibration parameters of mathematical models valid for each area are visualised on the map. Calibration, in this case, largely repeats the learning process of artificial intelligence (AI) systems. After calibration, any mathematical model implemented as a calculation software module, in the first step, determines the zone of its calibration and retrieves the calibration parameters assigned to this zone. After that, the computation is done.
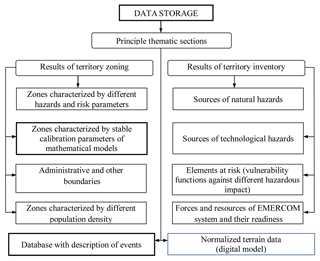
All calibration parameters associated with the territories and design modules are included in the EMERCOM IS data storage. Figure 2 shows the data storage structure and the place of calibration data tables in this structure.
In Fig. 2, bold lines highlight the “database with a description of events” and “zones with stable calibration parameters of mathematical models”. Zones are based on the collected event data in the process of calibrating mathematical models. Each zone relates to its mathematical model and set of calibration parameters.
It should be noted that the description of seismic events has some features important for understanding the examples of calibrated mathematical model application for estimating the possible shaking intensities (Ranguelov, 2011).
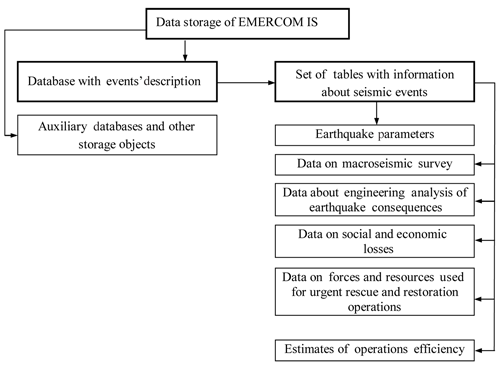
Figure 3 shows the features of the structure of tables with a description of seismic events. Structured description of a seismic event may be accompanied by various materials such as maps, tables, photos, and other documents. When calibrating the mathematical models applied for simulation of expected shaking intensities, the tables of “earthquake parameters” and “data on macroseismic survey” are used during the calibration.
In the case of the Kultuk earthquake of 2008, which was felt over a wide area in the Russian Federation and Mongolia, where the damage to buildings was recorded in settlements located 10–30 km away from the epicentre, the following field observations and their analysis complement the “data on macroseismic survey” table:
-
a map of the observed macroseismic effect, where the first two isoseismal maps show the area of ground shaking of 7–8 and 7 on the MMSK-86 intensity scale (Shebalin et al., 1986);
-
photos of damage to buildings of different types;
-
summary tables of macroseismic effect in settlements based on various data, including the behaviour of buildings and people, as well as indoor objects.
As a result of the Kurchaloy earthquake of 2008, 13 people died, the observed macroseismic effect was also 7–8 on the MMSK-86 seismic intensity scale. The earthquake was felt over a wide territory, including the Chechen Republic, the Ingush Republic, the Republic of Dagestan, the Republic of North Ossetia–Alania, Kabardino-Balkaria, the Stavropol Territory, the southern regions of Kalmykia, Georgia, and the northern regions of Azerbaijan and Armenia. The greatest destruction occurred in the Kurchaloy, Gudermes, Shalinsky, and Nozhay-Yurt districts of the Chechen Republic. The most severely affected were the settlements of Kurchaloy and Mayrtup. The entries in the database tables about this event include additional materials on observed macroseismic data and results on engineering analysis of the impact:
-
the isoseismal map of the Kurchaloy earthquake of 11 October 2008 with seismic intensity I from 7–8 to 4–5 on the MMSK-86 scale;
-
revised instrumental and macroseismic parameters of the earthquake rupture zone;
-
photos and descriptions of damage to residential buildings, healthcare facilities, schools and preschool institutions, cultural and sports facilities, and mosques and administrative buildings;
-
information about response measures, including data on medical and other assistance to the affected population.
Calibration means fitting suitable parameters of the mathematical model assigned for simulating the macroseismic field and identification of the boundary of this zone within which averaging is permissible. Calibrated models should provide acceptable accuracy of estimating the situation parameters for all events in the zone. The calibration parameters of macroseismic field model include regional intensity attenuation coefficients in the Shebalin equation (Shebalin, 1977), the orientation of the axes of macroseismic field ellipse, and the ratio k of the major and minor axes of macroseismic field ellipse (compression ratio).
The next section shows the application of the EMERCOM DB with calibrated parameters of a computational module in order to simulate the shaking intensity distribution in near real time with acceptable accuracy and to get a reliable forecast of the whole situation in the stricken area.
This section gives an example of calibrated macroseismic field model usage to simulate earthquake losses in emergency mode. We investigated the North Caucasus, which is one of the seismically active regions of the Russian Federation characterised by a high population density. Here, strong and felt earthquakes occurred quite frequently. Over the past 100 years, more than 20 earthquakes have taken place in this area with shaking intensity I0≥6: in 1976, the Chernogorskoe earthquake with M=6.4, I0=8–9; Terskoye (Eldarovskoe) earthquake on 10 August 1912 with M=5.7 and I0=8; Vedenoskoe earthquake on 24 October 1933 with M=5.2, I0=7–8; several earthquakes with I0=7; Dagestanskoe-I on 23 February 1785 with M=5.5; Argunskoe-I on 10 May 1928 with M=4.7; Argunskoe-II on 2 March 1966 with M=4.9; Achkhoy-Martanovskoe earthquake on 17 June 1969 with M=5.1; Starogroznenskoe earthquake on 26 May 1971 with M=4.1; and Salatausskoe earthquake on 23 December 1974 with M=5.0. The data on past earthquake impacts allowed us to calibrate the seismic intensity attenuation models and the vulnerability function of residential buildings. It was possible to identify the zone boundaries with stable parameters of the macroseismic field (Frolova and Ugarov, 2018). The zone boundaries are shown by the blue rectangle (Fig. 4) on the map of the epicentres of the strongest earthquakes in the central part of the Terek–Caspian trough against the background of the main structural elements according to the “scheme of seismogenic structures of the Chechen Republic and adjacent territories”. The authors came to the conclusion about the expediency of applying the Shebalin equation for Dagestan (b=1.5; ν=3.6; c=3.1) that the compression ratio k=1.5 and elliptic isoseismal orientation was at an angle of 54∘ (Frolova and Gabsatarova, 2015) for near-real-time earthquake loss assessment in the designated area.
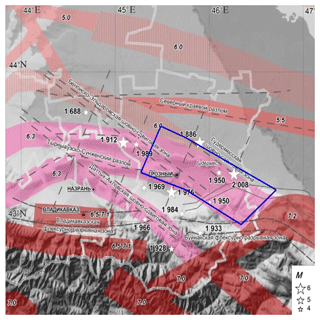
Figure 4The zone with stable parameters of macroseismic field and map background according to Nesmeyanov et al. (1996) and Rogozhin et al. (2013).
Figure 5 shows an example of evaluating the consequences of the 2008 Kurchaloy earthquake which occurred in a designated area using calibrated Extremum IS models. The number of expected fatalities in emergency mode at P=0.9 ranged from 12 to 100 people, which corresponded to the reported data on the death of 13 people during this earthquake. The error in determining shaking intensity I when using calibrated models does not exceed 30 %, unlike similar evaluations of PAGER system, where discrepancies in several settlements were 1–2 on the intensity scale.
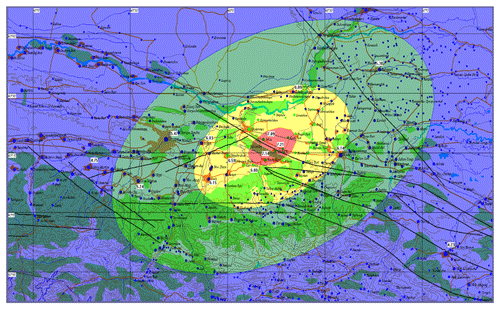
Figure 5Calibrated model application for simulation of the 2008 Kurchaloy earthquake consequences; map based on layers from the Digital Chart of the World (DCW).
Based on the macroseismic survey data from past events that have occurred in the territory of the Russian Federation and the Commonwealth of Independent States (CIS) countries, the authors obtained calibration parameters of the macroseismic field models for other earthquake-prone areas. Given different availability of macroseismic data for studied regions of the Russian Federation and neighbouring countries and their heterogeneity, not all quasi-stable parameters characterising the attenuation of seismic intensity I can be determined for identified zones. Thus, for the Sochi zone, the calibration parameters of the Shebalin equation were b=1.48, ν=4.0, and c=2.73, and the compression ratio k=2. For the Anapa zone, the tendency of elliptic isoseismal orientation towards the anti-Caucasian direction was detected, which made it possible to increase the reliability of near-real-time loss estimates, including those after the Nizhnekubanskoe earthquake of 9 November 2002.
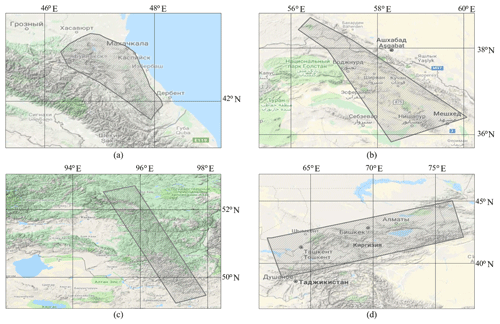
Despite the limited material, work on the calibration of the macroseismic field models continues, taking into account that in the future, when obtaining additional data, the boundaries of zones with quasi-stable parameters and the values of the parameters can be refined. The work (Frolova et al., 2019) shows the results of joint research with employees of the Federal Geophysical Survey RAS (FGS RAS) on the identification of a zone with quasi-stable parameters of the macroseismic field (Fig. 6), which can be used later for rapid calculations of damage and losses in emergency mode.
The EMERCOM DB on events for the period from 1992 to 2018 was used not only to calibrate loss assessment models to improve the reliability of near-real-time estimates, but also for statistical assessments of emergencies to visually display the situation with emergencies in the country, as well as to develop maps of risk indicators.
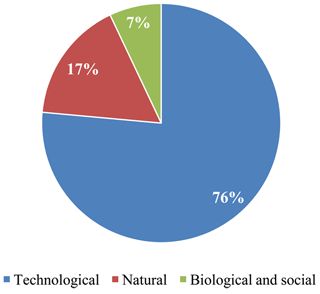
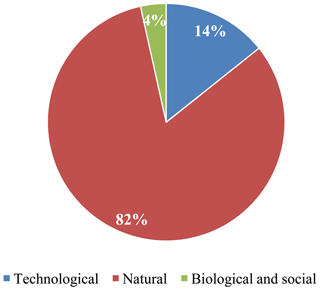
Thus, our analysis of emergencies for the period under consideration provided the distribution of the frequency of occurrence of technological, natural, and biological–social emergencies. The percentage of technological emergencies in the territory of the Russian Federation is more than 70 % of the total number of emergencies (Fig. 7). Natural hazards, due to their intensity and duration, can have a negative impact, exceeding the scale of technological emergencies. The percentage of economic loss caused by natural emergencies is more than 80 % of the emergency total loss in the Russian Federation per year (Fig. 8).
According to the analysed statistical data for the period from 1992 to 2018, more than 30 % of the subjects of the Russian Federation are characterised by the frequency of annual emergencies exceeding the average level (more than 16 emergency situations per year).
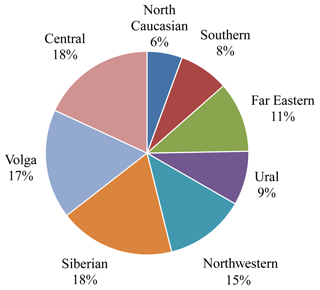
More than 50 % of emergency situations occurred in the Central (18 %), Volga (17.4 %), and Siberian (18.4 %) federal districts with a population of more than 60 % of the total population of the Russian Federation. The gross regional product of the Central, Volga, and Siberian federal districts is more than 50 % of the total gross domestic product of the Russian Federation (Fig. 9).
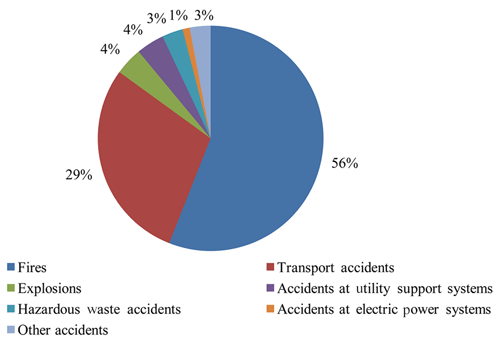
Among the EMERCOM DB data on technological emergencies, explosions and fires at sites whose affected areas extend beyond their territories are especially dangerous. Their impact results in destruction of buildings, other facilities, and structures, as well as civilian casualties. Emergencies caused by fires account for more than 50 % of the total number of technological emergencies (Fig. 10).
The frequency of emergency occurrence during transport accidents, including rail, road, sea, and pipeline transport, is about 30 % of the total number of technological emergencies.
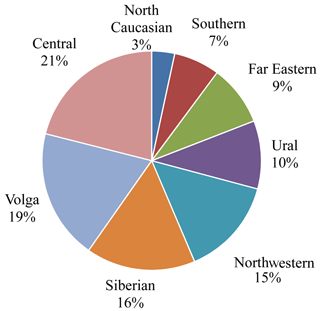
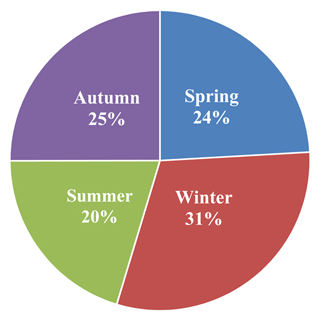
More than 50 % of technological emergencies occurred in the Central (21 %), Volga (19.2 %), and Siberian (16.1 %) federal districts with a population exceeding 60 % of the total population of the Russian Federation (Fig. 11). The rate of occurrence of such emergencies varies by seasons per year (Fig. 12). Seasonality factor is used to forecast and justify preventive measures in order to mitigate negative consequences. In winter, the frequency of emergencies increases by 30 % compared with the frequency of events in spring, summer, or autumn.
Mapping the results of statistical analysis of EMERCOM DB data for the period from 1992 to 2018 (Fig. 13) allows you to rank the subjects according to the frequency of occurrence of emergencies and select subjects for a more detailed assessment or to check the readiness of forces and resources to respond to emergencies and to implement preventive measures (Paskaleva and Ranguelov, 2015).
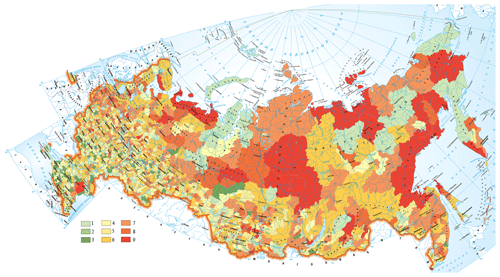
Figure 13Frequency of natural and technological emergencies according to statistical analysis of EMERCOM DB on event information about emergency consequences for the period 1992–2008: number of events per year: 1 – fewer than 1; 2 – 1 up to 10; 3 – 10 up to 50; 4 – 50 up to 100; 5 – 100 up to 150; 6 – 150 up to 300; 7 – 300 up to 600; 8 – 600 up to 1000; 9 – more than 1000; map based on layers from the National Atlas of Russia (https://xn-80aaaa1bhnclcci1cl5c4ep.xn-p1ai/cd1/english.html (last access: 6 August 2019).
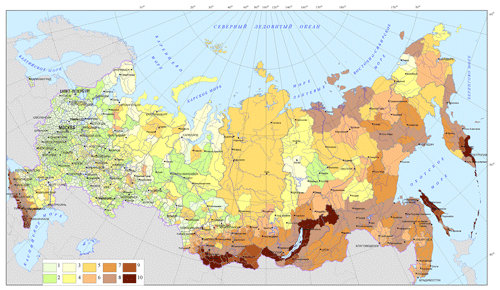
Figure 14Individual natural risk R3 for the population of the Russian Federation: risk Rs 2, 10−5 1 per year categories: 1 – less than 0.1; 2 – 0.1 up to 1; 3 – 1 up to 2; 4 – 2 up to 5; 5 – 5 up to 10; 6 – 10 up to 15; 7 – 15 up to 30; 8 – 30 up to 100; 9 – 100 up to 150; 10 – more than 150; map based on layers from DCW.
The statistical data available in the EMERCOM DB and simulation models calibrated on its basis make it possible to update the information on individual types of emergencies. Figure 14 presents an updated example for individual risk assessments due to natural hazards where we incorporate six natural disasters, viz., earthquakes, floods, storms, landslides, mudflows, and avalanches.
In our estimation of the parameters that represent an integrated risk caused by several natural disasters, we used probabilistic considerations. The probabilistic approach is in place here because an emergency situation that can occur for people is evidently stochastic. We are not in a position to determine the intensity of the damaging factor with 100 % certainty in the zone where the elements at risk are. The effects of similar factors on same-type elements at risk will yield different probabilities of damage to these elements. To calculate the risk parameters, we assumed the events to be independent, i.e. as concerns the social losses due to emergencies arising from natural disasters. We incorporated the probability of people being in the affected area, equal to the density of population in the larger cities with more than 500 000 inhabitants.
Our chief sources of data were thematic maps in vector form supplied with descriptions of the areas where various natural disasters can occur, and the associated parameters of the disasters are different. Statistical selections with descriptions of the locations and the extent of the damage due to these hazards as found in the EMERCOM DB for events and other archival databases, including the database of the Sergeev Institute of Environmental Geoscience of RAS (Osipov et al., 2010, 2011, 2017), were employed to determine vulnerability parameters due to floods, storms, landslides, mudflows, and avalanches. A set of review seismic zoning maps for the Russian Federation area (Set of review seismic zoning maps OSR-97 A, B, and C and other materials for construction standards and rules, 1998) was used as the chief data source for the level of earthquake hazards. The information about the distribution of residents and buildings was based on results of an inventory (Fig. 2).
Estimates of integrated risk parameters as found for population centres were averaged for administrative areas. We have made three maps of individual integrated risk due to natural hazards for the population of the Russian Federation (Frolova et al., 2014, 2017): Re1 is the probability of fatalities caused by the processes, Re2 is the probability of fatalities or injuries of various degrees, and Re3 is the probability of fatalities or injuries of various degrees or material losses.
The highest values of individual risk due to natural disasters in the map Re3 (Fig. 14) that apply to fatalities or injuries of various degrees, or material losses in the case of the six natural processes dealt with here, were found for Kamchatka, the Altai Republic, the Krasnodar and Trans-Baikal regions, the Republics of Buryatia and Tyva, Sakhalin Island, the Altai Krai, and North Ossetia.
The article defines the role and place of the DB containing descriptions of events and their impact in the EMERCOM IS. The ordered event data obtained by EMERCOM and various agencies as a result of field survey and by remote sensing techniques are used in the IS to address all the main problems in mitigating the impact of natural and technological emergencies.
The application of EMERCOM DB for events to calibrate IS mathematical models allows us to enhance the reliability of results from simulations of possible emergency impact, which affect the efficiency of decisions on response measures and facilitate rescue operations.
The above statistical analysis of data contained in the EMERCOM DB associated with the place and time enabled us to generate maps of emergency frequency and risk indicators, ensuring rational use of resources for preventive measure implementation aimed at risk reduction, as well as improving the adequacy of long-term forecasts for strategic investment planning.
It was noted that the activity concerned with the recording, classification, and description of natural and technological emergencies is the key issue in attempts to enhance the effectiveness of the government's activities aimed at ensuring public safety against natural disasters and technological accidents. Created for these purposes, the EMERCOM IS, supported by the efforts of the National Center for Crisis Management of EMERCOM, needs further development and integration into the network of similar systems providing services to other countries and the scientific community to minimise the level of risk. Integration involves solving problems of standard description of events, searching ways to ensure access to the functions of entering new information, and updating the existing one. In this regard, the article notes the positive experience of CODATA efforts, which address the problem of integrating and analysing big data in order to reduce the risk of natural hazards.
The EMERCOM database is available through the joint international projects upon special request.
NF, VL, and JB designed the research. NF, AU, and NM conducted the analysis and wrote the paper. SS advised on the study design, supervised the research, and revised the paper.
The authors declare that they have no conflict of interest.
This article is part of the special issue “Natural hazard impacts on technological systems and infrastructures”. It is a result of the EGU General Assembly 2018, Vienna, Austria, 8–13 April 2018.
The authors thank their colleagues for continuing support, discussion of different steps of EMERCOM IS DB on event development, and impact database usage for the Extremum system mathematical model calibration. Special thanks are extended to the staff of the Extreme Situations Research Center for their contribution to GIS environment development and colleagues in the Federal Geophysical Survey of RAS for fruitful cooperation. The authors wish to acknowledge Alexander Petrosyan for providing helpful comments on this study.
The research was fulfilled according to the state project (grant no. AAAA-A19-119021190077-6).
This paper was edited by Maria Bostenaru Dan and reviewed by two anonymous referees.
Allen, T. I., Marano, K. D., Earle, P. S., and Wald, D. J.: PAGER-CAT: A composite earthquake catalog for calibrating global fatality models, Seismol. Res. Lett., 80, 57–62, https://doi.org/10.1785/gssrl.80.1.57, 2009.
Babayan, T.: Atlas of strong earthquakes of the Republic of Armenia, Artsakh and adjacent territories from ancient times through 2003, Tigran Mets Publ., Yerevan, Armenia, p. 140, 2006.
Frolova, N. I. and Gabsatarova, I. P.: Macroseismic data application for increasing reliability of near real time loss estimations: example of Kurchaloj earthquake, in: Proceedings of the 9th international scientific and practical conference “GEORISK–2015”/Analysis, prediction and management of natural risks in the modern world, vol. 2, RUDN Publ., Moscow, Russian Federation, 391–399, 2015.
Frolova, N. I. and Ugarov, A. N.: Knowledge base about past earthquakes consequences as a tool to increase the reliability of near real time loss estimation, Geoekologiya, 6, 3–20, 2018.
Frolova, N. I., Larionov, V., Bonnin, J., and Ugarov, A.: Seismic risk cartographic visualization for crisis management, Geogr. Environ. Sustainabil., 7, 4–27, https://doi.org/10.24057/2071-9388-2014-7-4-4-27, 2014.
Frolova, N. I., Larionov, V. I., Bonnin, J., Sushchev, S. P., Ugarov, A. N., and Kozlov, M. A.: Seismic risk assessment and mapping at different levels, Nat. Hazards, 88, 43–62, https://doi.org/10.1007/s11069-016-2654-9, 2017.
Frolova, N. I., Gabsatarova, I. P., Petrova, N. V., Ugarov, A. N., and Malaeva, N. S.: Influence of shaking intensity attenuation peculiarities on reliability of earthquake loss estimation in emergency mode, Geoekologiya, 37, 23–37, https://doi.org/10.31857/S0869-78092019523-37, 2019.
Izmalkov, V. A.: Development of AIUS RSCHS as a dynamic automated system, Civ. Secur. Technol., 14, 26–31, 2017a.
Izmalkov, V. A.: Automated Information Management System of The Russian Unified Emergency Prevention and Response System AIUS RSCHS-2030: Analysis of its Operating Experience and Further Development Priorities, Civ. Secur. Technol., 14, 38–42, 2017b.
Kachanov, S. A., Nekhoroshev, S. N., and Popov, A. P.: Decision support information technology in the case of emergencies: AIUS RSCHS: yesterday, today, tomorrow, Delovoj Ekspress Publ., Moscow, Russian Federation, ISBN 978-5-93970-064-1, p. 400, 2011.
Kachanov, S., Ageev, S., Kovtun, O., Belyaeva, I., Lukina, Y., and Chernov, V.: Automated Control System of a Unified System of Professional Training for the Russian Emergencies Ministry, Civ. Secur. Technol., 11, 16–21, 2014.
Kalmetieva, Z. A., Mikolaichuk, A. V., Moldobekov, B. D., Meleshko, A. V., Jantaev, M. M., and Zubovich, A. V.: Atlas of earthquakes in Kyrgyzstan, CAIAG, Bishkek, Kyrgyzstan, p. 232, 2009.
LODGD 2019: Next Generation Disaster Data Infrastructure – White Paper, CODATA Task Group, Linked Open Data for Global Disaster Risk Research (LODGD), Paris, https://doi.org/10.5281/zenodo.3406127, 2019.
Nesmeyanov, S. A., Lutikov, A. I., Zhukin, Y. K., and Donstova, G. Y.: Seismic generating structures, in: Complex estimation of seismic hazard of the City Groznyj territory, Moscow, Minstroy of Russia, 38–47, 1996.
Osipov, V. I., Burova, V. N., Pyrchenko, V. A., and Petrasov, A. V.: The database of natural hazards as the basis for the study of their development regularities and consequences prediction, in: Extreme natural phenomena and disasters, 2 volumes, Volume 1: Assessments and ways of mitigating negative consequences of extreme natural phenomena, Probel 2000 Publ., Moscow, Russian Federation, 436–445, 2010.
Osipov, V. I., Frolova, N. I., Sushchev, S. P., and Larionov, V. I.: Assessment of seismic and natural risk for population and territory of the Russian Federation, in: Extreme Natural Phenomena and Disasters, vol. 2, PROBEL 2000 Publ., Moscow, Russian Federation, 28–48, 2011.
Osipov, V. I., Larionov, V. I., Burova, V. N., Frolova, N. I., and Sushchev, S. P.: Methodology of natural risk assessment in Russia, Nat. Hazards, 88, 17–41, https://doi.org/10.1007/s11069-017-2780-z, 2017.
Paskaleva, I. and Ranguelov, B.: Lessons learned by recently happened natural disasters and future research needs, in: Engaging the Public to Fight the Consequences of Terrorism and Disasters, NATO Sci. for Peace and Security, E: Human and Societal Dynamics, vol. 120, edited by: Apostol, I., Mamasaklihsi, J., Subotta, D., and Reimer, D., IOS Press., Amsterdam, 257–268, 2015.
Ranguelov, B.: Natural Hazards – nonlinearities and assessment, Acad. Publ. House (BAS), Sofia, ISBN 978-954-332-419-7, 327 pp., 2011.
Ranguelov, B. and Frantsova, A.: Multihazards early warnings. Research, models and Bulgarian expertise, LAMBERT Academic Publishing, Saarbrücken, ISBN 978-620-2-07727-9, 224 pp., 2017.
Rogozhin, E. A., Lutikov, A. I., and Ovcuchenko, A. N.: The Detailed Assessment of the Seismic Risk in the Territory of North Caucasus, Earthq. Eng. Construct. Saf., 5, 14–19, 2013.
Rovida, A., Locati, M., Camassi, R., Lolli, B., and Gasperini, P.: CPTI15, the 2015 version of the Parametric Catalogue of Italian Earthquakes, Istituto Nazionale di Geofisica e Vulcanologia, Roma, https://doi.org/10.6092/INGV.IT-CPTI15, 2016.
Set of review seismic zoning maps OSR-97 A, B, C and other materials for Constructions standards and rules: 1998 – SNiP “Construction in earthquake prone areas”, Joint Institute of Physics of the Earth, Moscow, 1998.
Shebalin, N. V.: Reference earthquakes and macroseismic field equations, in: New catalogue of strong earthquakes for the USSR territory from ancient times till 1975, Nauka, Moscow, Russian Federation, 20–30, 1977.
Shebalin, N. V., Ershov, I. A., Gekhman, A. S., and Shestoperov, G. S.: Development of improved version of seismic intensity scale (MMSK-86) on the bases of MSK-64 scale and scale of Joint Council on Seismology and Earthquake Engineering – 73. Report on scientific research study within the Federal Program 0.74.03, number of state registration 01814003271, Joint Council on Seismology and Earthquake Engineering, Academy of Sciences of the USSR, Moscow, Russian Federation, 1986.
So, E.: Introduction to the GEM Earthquake Consequences Database (GEMECD), GEM Technical Report 2014-14 V1.0.0, GEM Foundation, Pavia, Italy, 158 pp., https://doi.org/10.13117/GEM.VULN-MOD.TR2014.14, 2014.
Spence, R., So, E., Jenkins, S., Coburn, A., and Ruffle, S.: A Global Earthquake Building Damage and Casualty Database, in: Human Casualties in Earthquakes, Advances in Natural and Technological Hazards Research, vol. 29, edited by: Spence, R., So, E., and Scawthorn, C., Springer, Dordrecht, 65–79, https://doi.org/10.1007/978-90-481-9455-1_5, 2011.
Varazanashvili, O., Tsereteli, N., Bonali, F. L., Arabidze, V., Russo, E., Pasquaré Mariotto, F., Gogoladze, Z., Tibaldi, A., Kvavadze, N., and Oppizzi, P.: GeoInt: the first macroseismic intensity database for the Republic of Georgia, J. Seismol., 22, 625–667, https://doi.org/10.1007/s10950-017-9726-5, 2018.
- Abstract
- Introduction
- Structure of the EMERCOM database of events
- Examples of calibrated model application for earthquake loss assessment
- Results of the EMERCOM DB on event usage for statistical analysis of emergencies in risk reduction
- Conclusions
- Data availability
- Author contributions
- Competing interests
- Special issue statement
- Acknowledgements
- Financial support
- Review statement
- References


