the Creative Commons Attribution 4.0 License.
the Creative Commons Attribution 4.0 License.
 | 23 Dec 2020
Remote monitoring of seismic swarms and the August 2016 seismic crisis of Brava, Cabo Verde, using array methods
Carola Leva
Georg Rümpker
Ingo Wölbern
During the first two days of August 2016 a seismic crisis occurred on Brava, Cabo Verde, which – according to observations based on a local seismic network – was characterized by more than a thousand volcano-seismic signals. Brava is considered an active volcanic island, although it has not experienced any historic eruptions. Seismicity significantly exceeded the usual level during the crisis. We report on results based on data from a temporary seismic-array deployment on the neighbouring island of Fogo at a distance of about 35 km. The array was in operation from October 2015 to December 2016 and recorded a total of 1343 earthquakes in the region of Fogo and Brava; 355 thereof were localized. On 1 and 2 August we observed 54 earthquakes, 25 of which could be located beneath Brava. We further evaluate the observations with regards to possible precursors to the crisis and its continuation. Our analysis shows a significant variation in seismicity around Brava, but no distinct precursory pattern. However, the observations suggest that similar earthquake swarms commonly occur close to Brava. The results further confirm the advantages of seismic arrays as tools for the remote monitoring of regions with limited station coverage or access.
- Article
(9127 KB) - Full-text XML
-
Supplement
(1827 KB) - BibTeX
- EndNote


The islands of the Cabo Verde archipelago are located about 700 km west of the coast of Senegal on top of the Cape Verde Rise, which originates from a mantle plume (Courtney and White, 1986). Brava is the westernmost island of the southern chain (see Fig. 1). Although considered active, no volcanic eruptions have occurred on Brava since settlement in the 15th century. On its main plateau, pyroclastic deposits and phreatomagmatic craters are associated with recent volcanic activity on Brava, probably of Holocene age (Madeira et al., 2010). The characteristics of phreatomagmatic activity pose a potential threat to the ∼ 6000 inhabitants of the island. Volcanic unrest is documented in degassing studies and in the high seismicity beneath and around the island. High degassing of deep-seated CO2, mainly in the northeast, has been linked to magmatic processes (Dionis et al., 2015). The seismicity is dominated by volcano-tectonic earthquakes and shifts over time in location and frequency, as can be seen from past studies (e.g. Helffrich et al., 2006; Faria and Fonseca, 2014; Vales et al., 2014). In contrast to Brava, the neighbouring island of Fogo shows only minor seismic activity. Fogo is located about 20 km east of Brava. Fogo volcano is erupting at mean intervals of about 20 years. The last eruption took place from November 2014 to February 2015 (González et al., 2015; Cappello et al., 2016; Richter et al., 2016; Calvari et al. 2018).
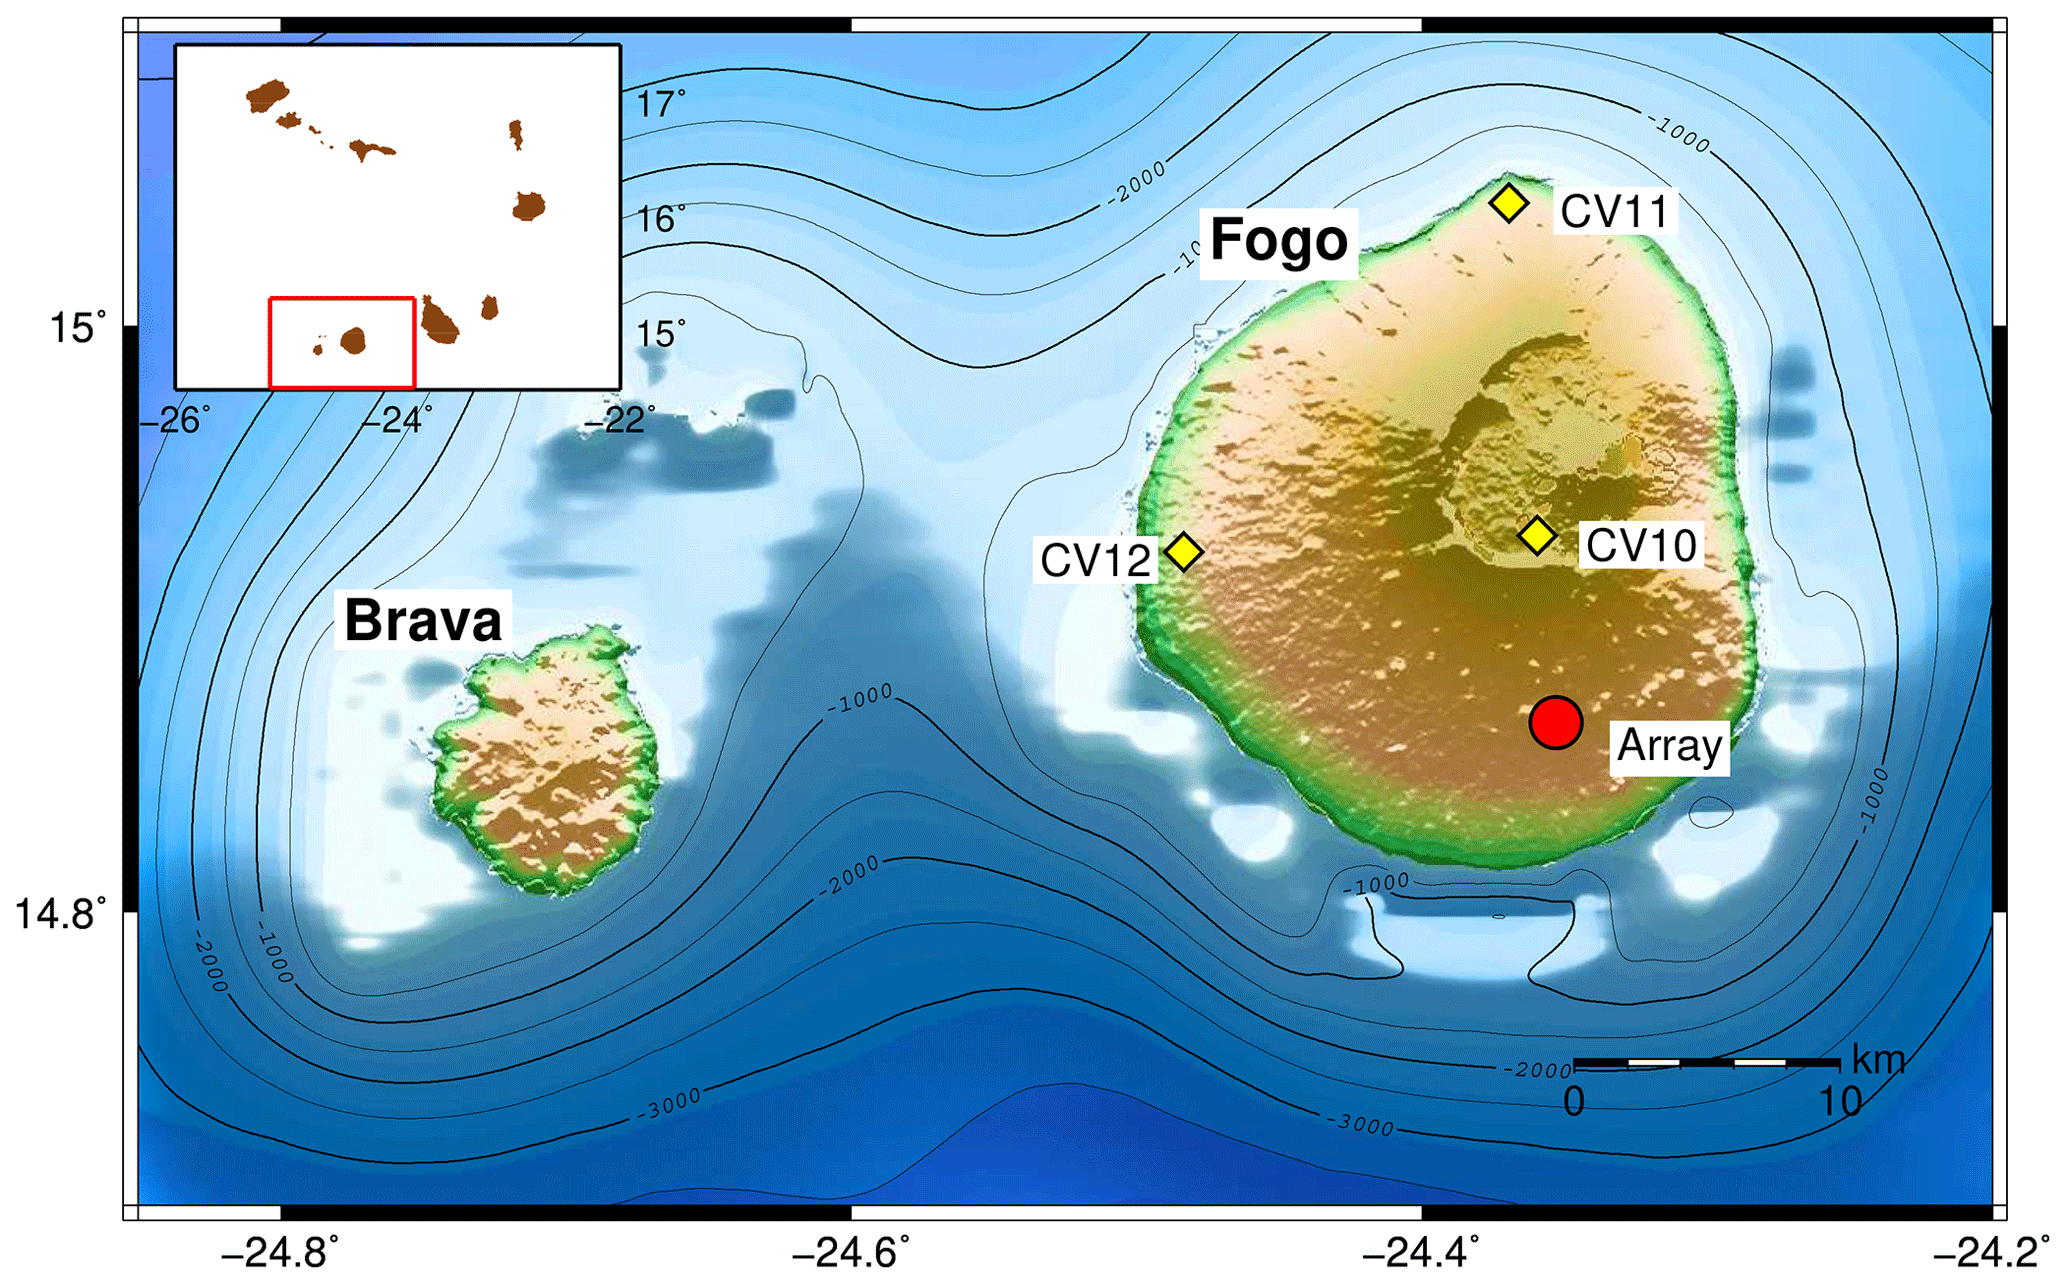
Figure 1Location of the island and station locations on Fogo. Circle: location of the array, which consists of 10 stations, of which 7 were operational. The array was operated from October 2015 to December 2016. Diamonds: additional single-broadband stations. These were operational from January 2016 to December 2016. Inset top left: map of Cabo Verde, red rectangle: current map section of Brava and Fogo. Topographic and bathymetry data are from Ryan et al. (2009).
On 1 and 2 August 2016, a seismic crisis occurred beneath Brava. According to data recorded by a permanent seismic monitoring network, the crisis comprised about 1000 shallow earthquakes and tremors (Faria and Day, 2017). Authorities decided to evacuate about 300 inhabitants from two villages (ECHO, 2016). As access to the aforementioned data is restricted by government (Bruno Faria, personal communication, 2017), we used recordings from a simultaneously operating seismic array on Fogo to analyse the earthquake activity during the crisis and extended the analysis to the period between October 2015 and December 2016. In this study we report to which extent a seismic array can be used for remote monitoring of a volcanic seismic crisis and present the seismicity beneath and around Brava. To gain information about possible precursors of this crisis and about the further development of the seismicity after the crisis, the observation of the shift of the earthquake locations in the months before and after the crisis will be emphasized.
From October 2015 to December 2016 we operated a seismic array on Fogo which served as a pilot study in preparation for a larger multi-array installation that started in 2017. The pilot array of 2016 consisted of 10 seismic stations, arranged in two circles around a central station with an aperture of 700 m. Two stations were vandalized and one failed; the remaining seven stations were equipped with short-period 4.5 Hz geophones (see Fig. 2b). The array was designed for an analysis of local events with mean frequencies of 7.5 Hz; the array transfer function for the reduced array is shown in the Supplement Fig. S1. In order to allow for classical detection and localization techniques, we deployed three additional broadband sensors on the island of Fogo (see Fig. 1). These stations were only used to better locate events beneath Fogo. All stations are equipped with CUBE data loggers and powered with 12 V batteries. Data were recorded continuously at a sample rate of 200 Hz. Some data gaps occurred due to the limited storage capacity of the data loggers (as indicated in Fig. 3 below).
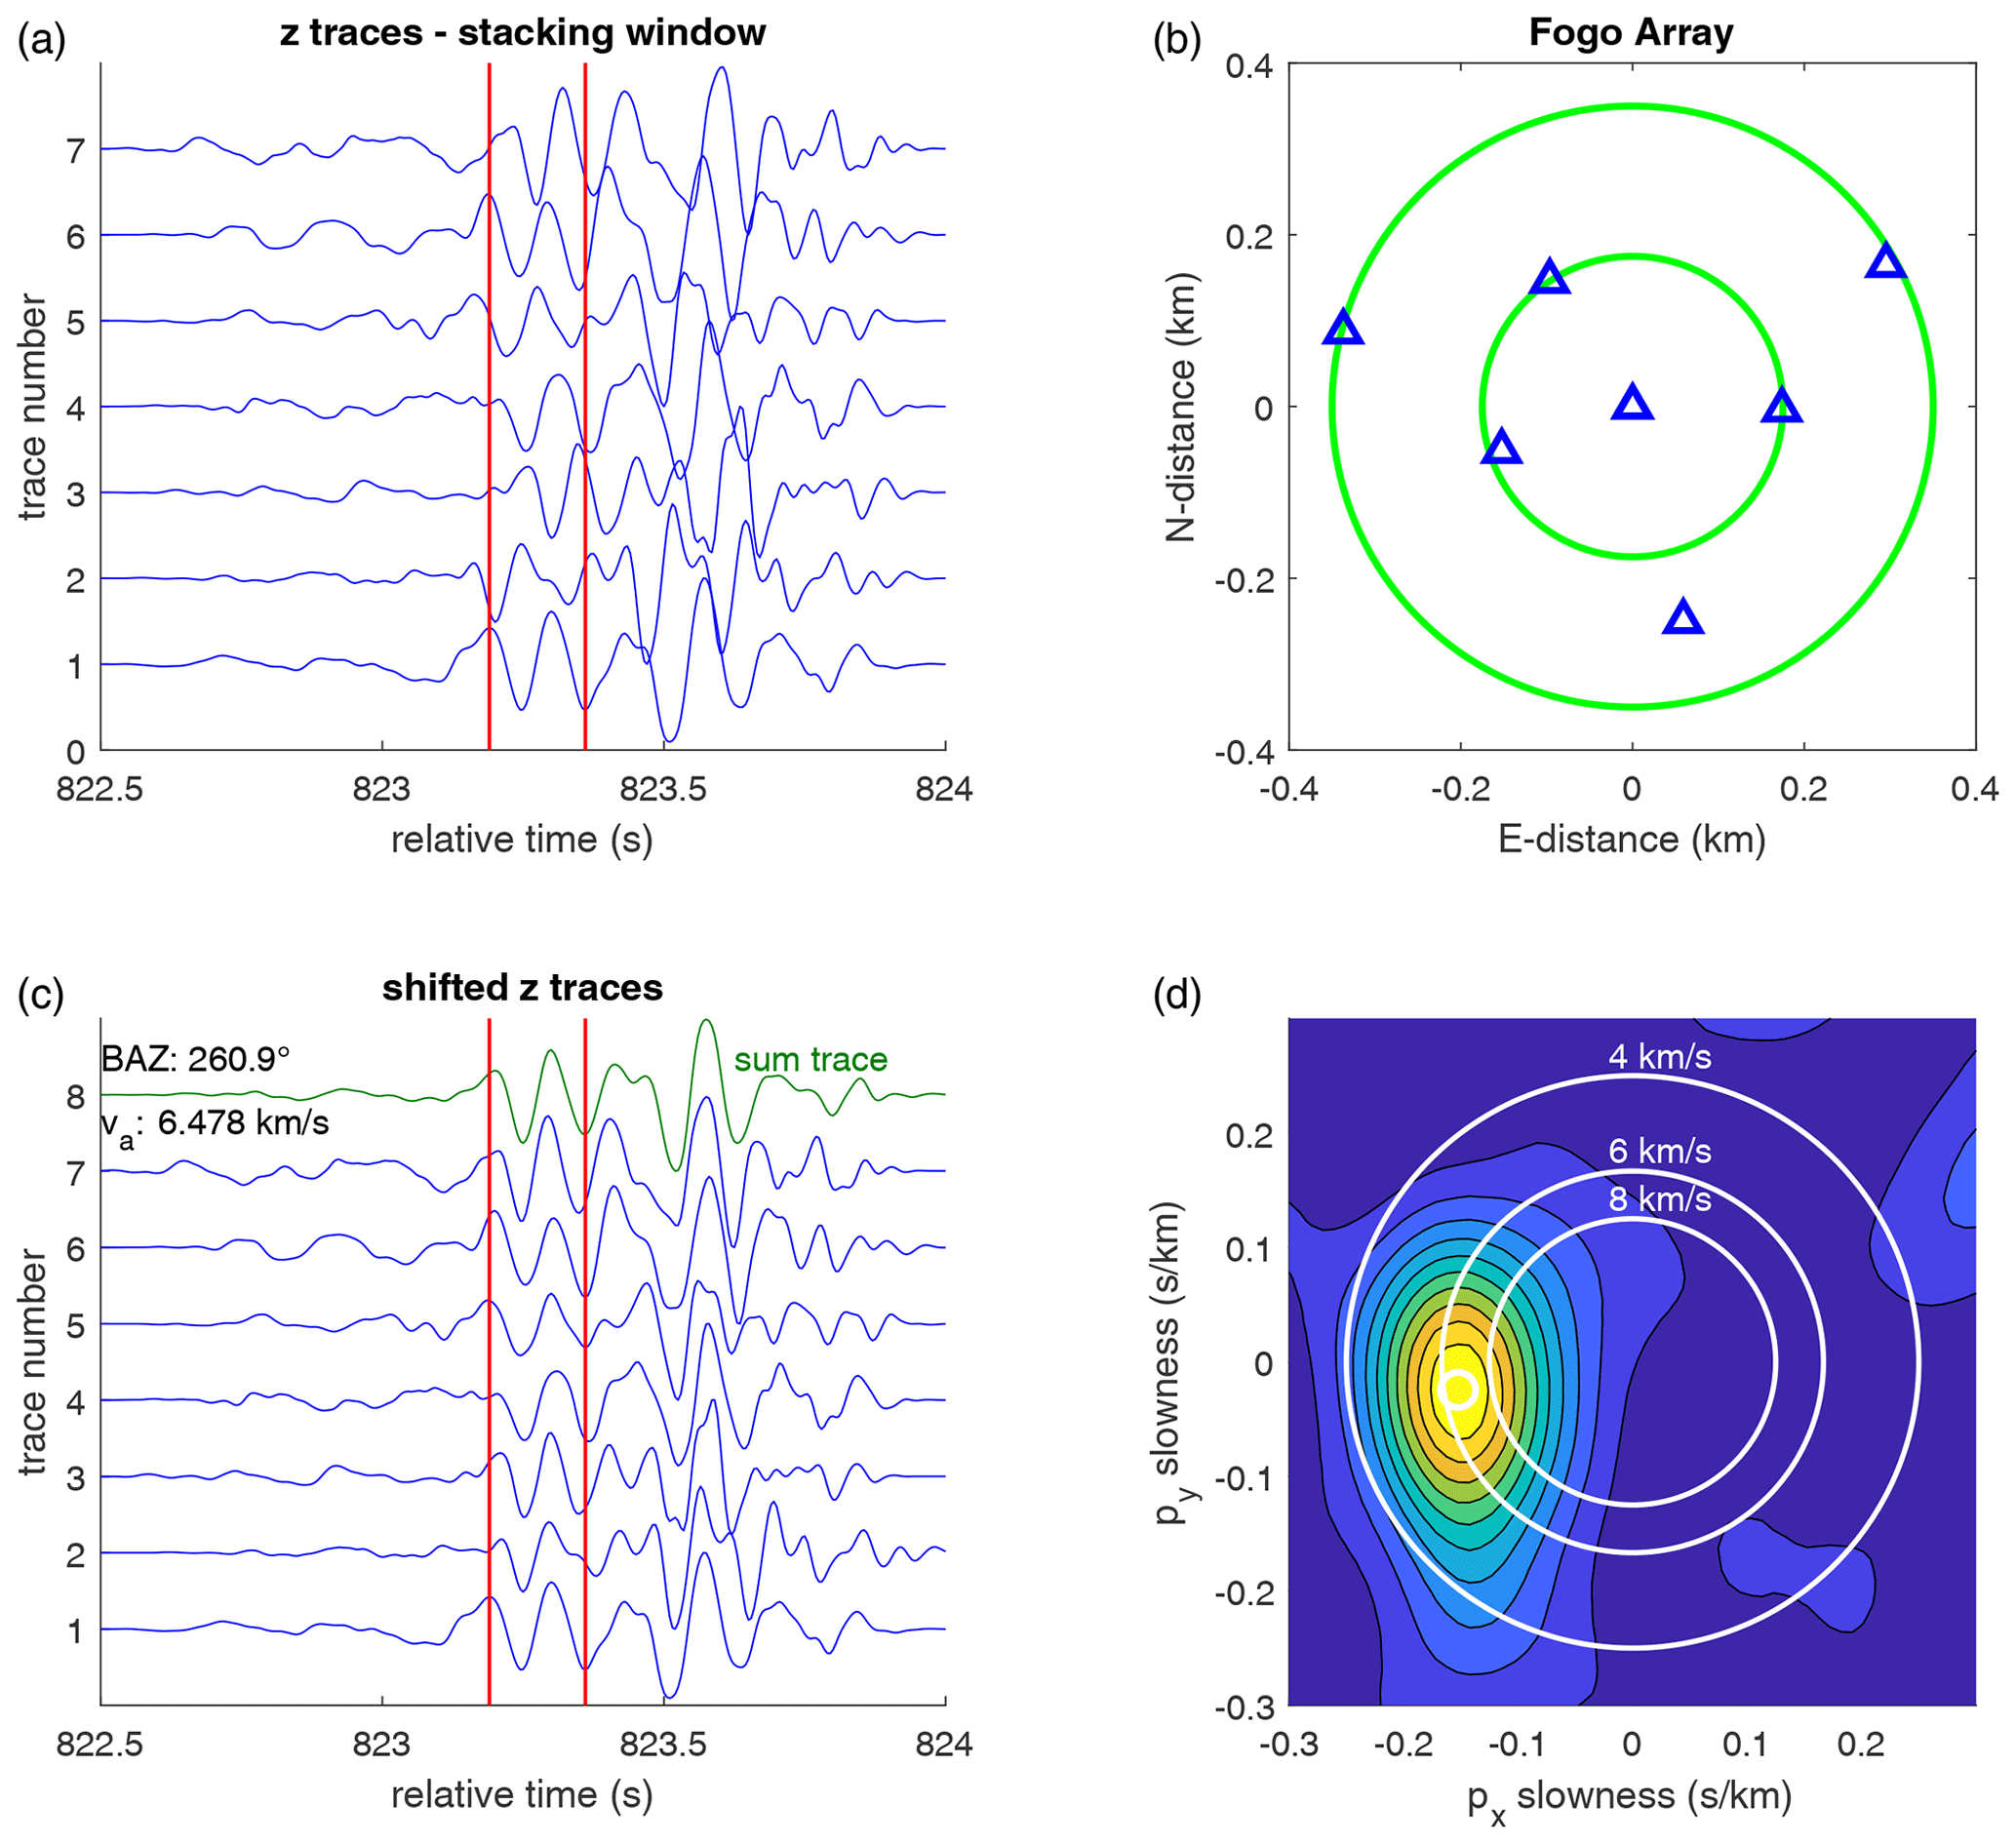
Figure 2Example of the array analysis applied to an event of the seismic crisis (2 August 2016, 01:13 (UTC)). (a) Record section before shifting and stacking. Traces of the seven array stations are filtered between 1 and 18 Hz. The time window has a length of 2.5 s; the smaller stacking window is marked in red. (b) The configuration of the seismic array. (c) Traces after shifting and stacking. The sum trace is marked in green. (d) Time-domain energy stack.
3.1 Array analysis
Array techniques provide a suitable tool to locate events at a distance outside of the network and can also be applied to events without a clear onset of phases. The latter is the case for typical seismic signals associated with volcanic activity, such as tremors, long period or hybrid events (e.g. Wassermann, 2012). While the network is located on Fogo, most earthquakes occur beneath and around Brava, mainly at distances of about 35 km from the array. The position of the seismic stations relative to the earthquakes leads to a large uncertainty when applying classical localization procedures; thus the earthquakes around and beneath Brava are located using the array. The purpose of array techniques is to improve the signal-to-noise ratio (SNR) by beamforming, i.e. by time shifting and stacking the coherent part of the signal (e.g. Schweitzer et al., 2012). The beamforming can be applied in the frequency – or in the time domain. Here, we perform the beamforming in the time domain, which is computationally more expensive, but incorporates a broad frequency band. Also, by first time-shifting the phases, we are able to select a rather narrow time window around the phases of interest which improves the coherency of the stack, even if the (initial) separation between the onsets of common signals at different stations is relatively large (see Singh and Rümpker, 2020, for details).
Array analysis is based on the assumption that the event is located sufficiently far away from the array, so the incoming wavefront can be treated as a plane wave (Schweitzer et al., 2012) traversing the array with a specific backazimuth and apparent velocity. Beamforming is utilized to determine the horizontal slowness components (sx, sy), which also yields the backazimuth of the event. From the inverse of the absolute slowness, the apparent velocity ( is determined. To obtain the horizontal slowness components, a grid search is applied. We consider a range between −0.3 and 0.3 s/km for both sx and sy with a grid size of 64×64. The slowness limits correspond to reasonable values for expected apparent velocities of incoming wavefronts from local events. The array traces are shifted according to all possible slowness values defined by the grid and are summed up in the time domain. From the maximum of the total energy (given by the integrated squared amplitudes) of the sum trace, we obtain the slowness and backazimuth of the first arriving P-wave.
The initial data processing involves application of a Butterworth filter to improve the SNR of the recordings. The cutoff frequencies are chosen from a spectral analysis of the event and are applied to all traces. We perform a time-domain array analysis by choosing a time window of about 10 times the dominant period (i.e. 1 or 2 s in most cases) around the onset of the P-wave (see Fig. 2a). Then the traces are time shifted according to the given slowness components. The next step is to define a shorter stacking window (within the first window) that spans one or two periods of the P-wave arrival and is used to calculate the total energy of the sum trace. Ideally, the total energy reaches a maximum if the time shift of the P-wave arrival across the array is properly accounted for by the given slowness. In Fig. 2a and c this stacking window is marked in red. Both time windows are selected in reference to the central array station. The trace of the central station itself is kept fixed, while the remaining traces are shifted with respected to the given slowness and distance from the central stations. The energy as a function of slowness components is displayed in Fig. 2d. From the slowness components (sx, sy) that correspond to maximum energy, the absolute slowness and the backazimuth are determined by and ), respectively. To estimate the error of the backazimuth we choose a 95 % level around the maximum peak of energy. The maximum and minimum backazimuth within this energy level are then selected as errors, typically leading to uncertainties of about 10∘ in the backazimuth of the earthquakes in our study.
3.2 Epicentral distance estimates
The array localization does not provide information about the epicentral distance and the event depth. Here, the distance between an event and a station is determined from the S–P travel-time difference. First, the theoretical arrival times of P- and S-waves are estimated by using a two-layer model with mean velocities of 6.1 and 8.0 km/s representing the crust and the upper mantle, respectively (in view of Vales et al., 2014). We assume the Moho at a depth of 14 km and a fixed event depth of 5 km, in line with previous studies of events near Brava (Faria and Fonseca, 2014). Even though some authors (Vales et al., 2014) reported a larger event depth of about 10 km, the error which results from the uncertainty of the depth is well within the error of the distance estimation (see below). From the P- and S-wave travel-time curves for this model, differential arrival times are obtained as a function of epicentral distance. During the localization process the epicentral distance is determined for each array station. From the distance values the mean distance and standard deviation are computed. The error is estimated by evaluating the effect of the different parameters on the distance calculation for the two-layer model. For this purpose, we systematically varied the crustal and mantle velocities, the event depth and the Moho depth. It turns out that the variation of the crustal velocity has the largest impact on the distance estimation. For the events of interest, we generally assume a minimum distance error of 10 %, which exceeds the error due to variations of the crustal velocity. This error thus incorporates the uncertainties of the simple two-layer assumption, including the uncertainties due to event depth, Moho depth and the velocities. Only, if the standard deviation of the distance (as described above) is even larger, we assign this as the error. However, this applies only to a few events. Typically, the absolute error in epicentral distance is in the range of 5 to 8 km.
Note that the distance estimation used here is appropriate for events that occur within the crust. To ensure that this is the case, the apparent velocity derived from the array analysis is used as an indicator, as it corresponds to the velocity at the ray turning point. An apparent velocity within the range of typical crustal velocities thus indicates a ray path that is confined to the crust (see Leva et al., 2019).
During the study period our stations on Fogo recorded mainly volcano-tectonic earthquakes that occurred beneath and around Brava. We were able to analyse a total of 355 earthquakes. The volcano-tectonic earthquakes exhibit frequencies typically between 10 and 30 Hz (Fig. 4). The magnitudes generally range between 0.7 and 2.7; however, the smallest magnitude is 0.3 and the highest 3.7. On average we recorded four earthquakes per day (Fig. 3). The precise locations, magnitudes and errors of each analysed event are given in the Supplement along with maps that contain the error ellipses. The seismicity is characterized by highly variable earthquake locations over the period of more than one year. To better constrain the variation of the seismicity close to Brava in the time before the seismic crisis in the beginning of August 2016, we analysed the locations of earthquake clusters month by month. In the following we will describe the changes in seismicity over time and emphasize the occurrence of earthquake clusters and periods with elevated seismicity (Fig. 3).

Figure 3Blue: number of detected earthquakes per day from October 2015 to December 2016. Green: accumulated number of earthquakes. Red lines indicate periods with data gaps.
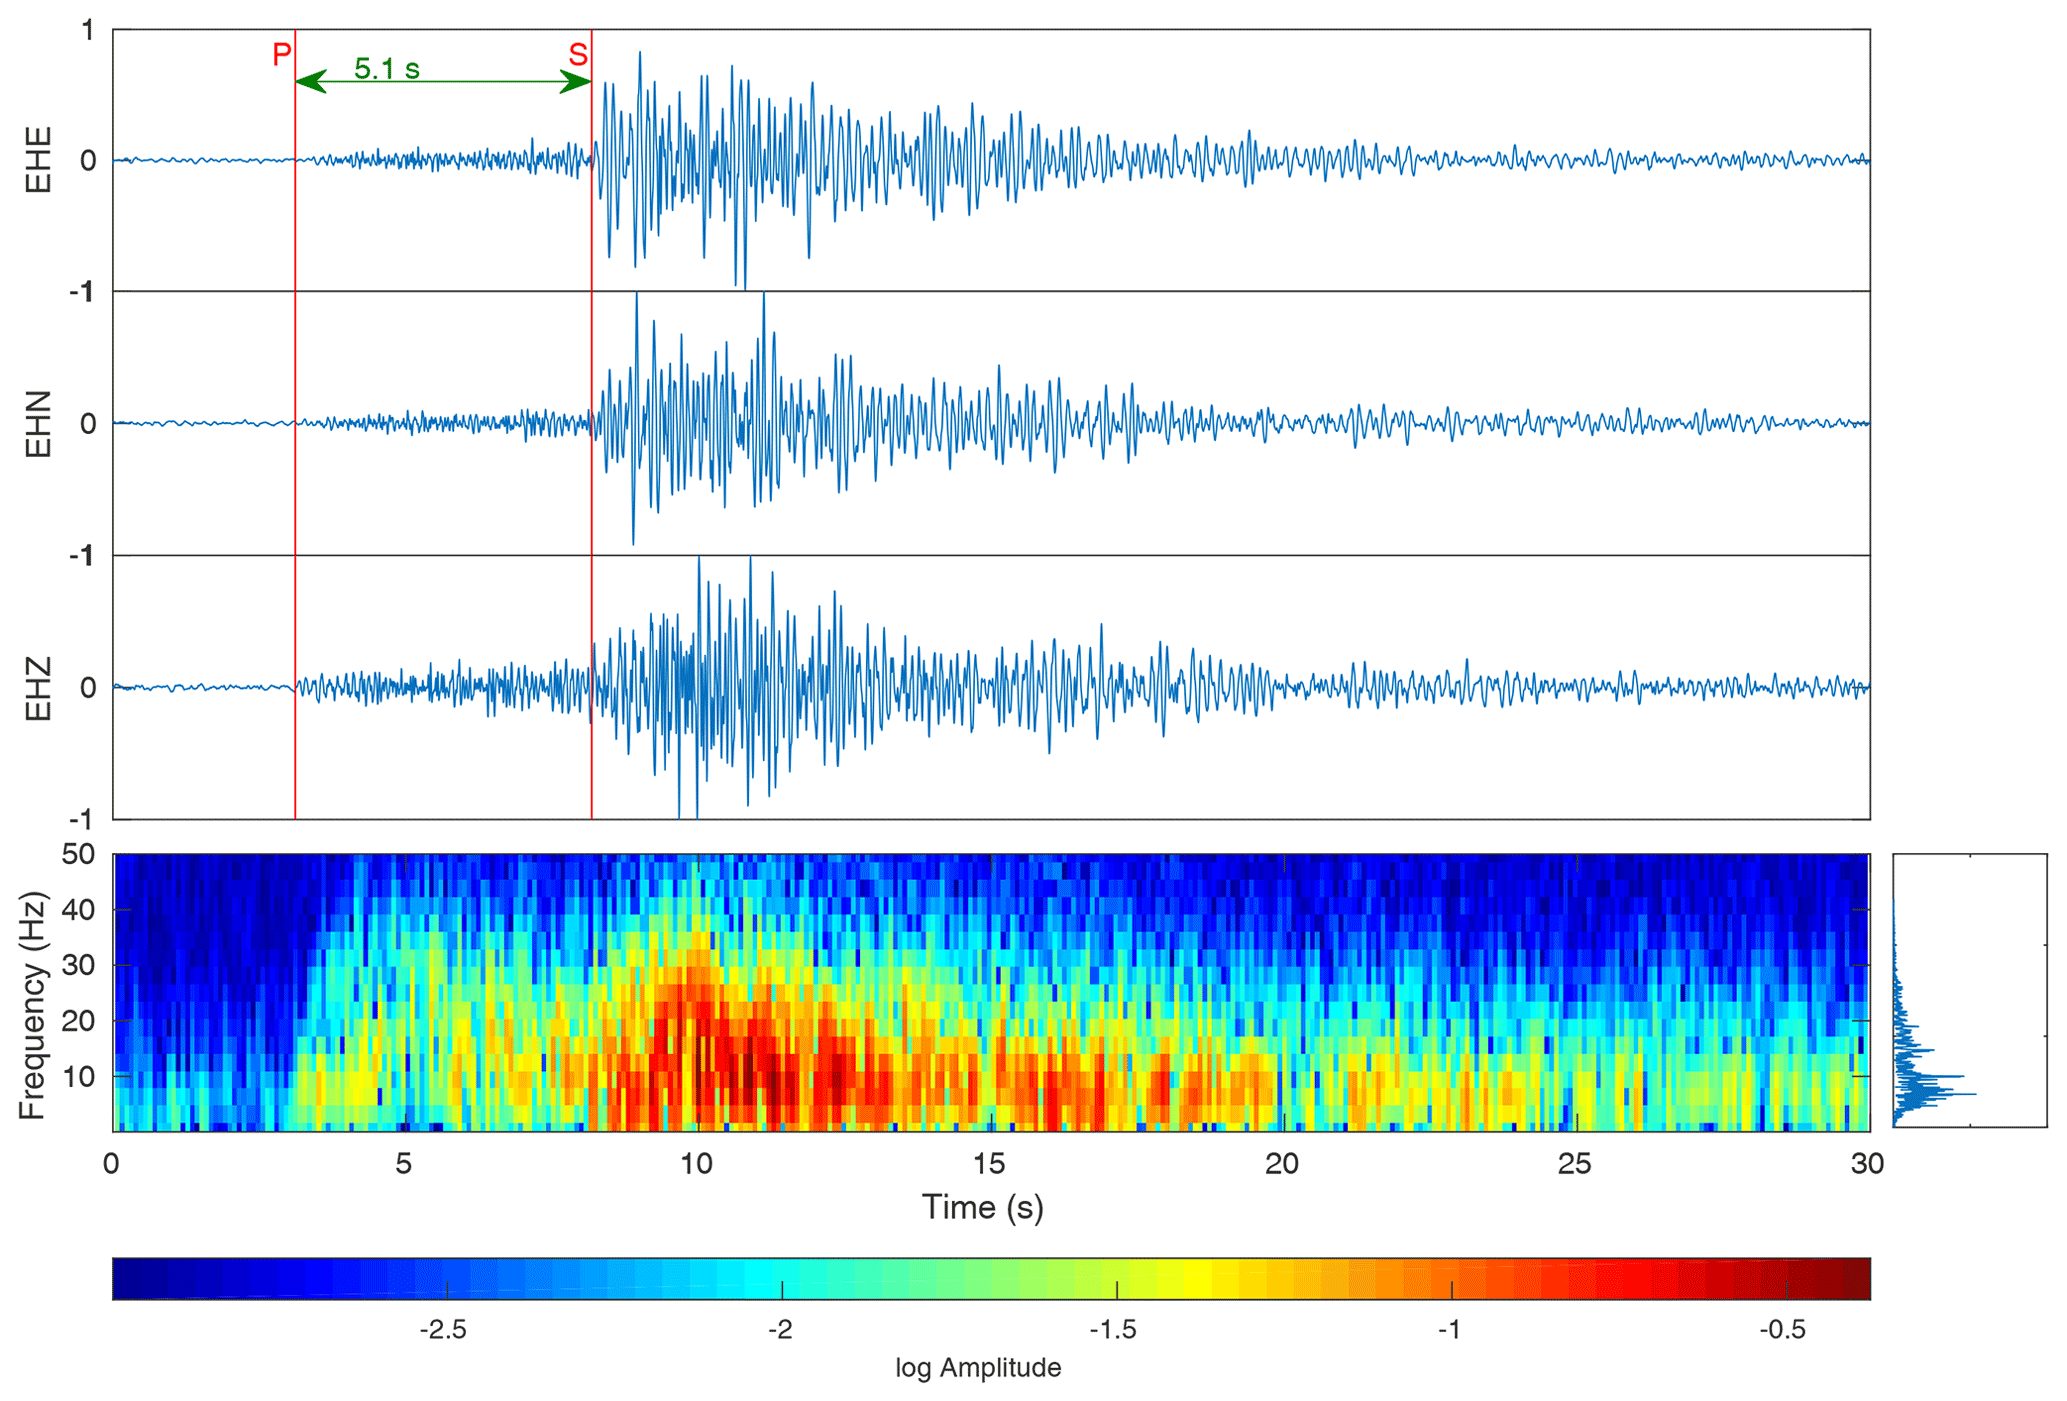
Figure 4Top: example of a typical earthquake near Brava, recorded on 2 August 2016, 01:13 (UTC), at a short-period station of the array on Fogo. A Butterworth filter is applied with cutoff frequencies of 0.5 to 50 Hz and traces are normalized. Bottom left: spectrogram of the vertical component. Bottom right: frequency content of the recording.
4.1 October 2015 to July 2016 – before the seismic crisis
In October 2015 we observed a peak in seismicity (see Fig. 3) with two earthquake clusters (Fig. 5a). One cluster occurred on 8 and 9 October and was located southwest of Brava. From 10 to 15 October the second cluster to the northwest of Brava became active. On 19 October the dominant seismic activity occurs again in the area southwest of Brava, where it remained until 23 October. After that, we observed a shifting back to the position of the second cluster northwest of Brava.
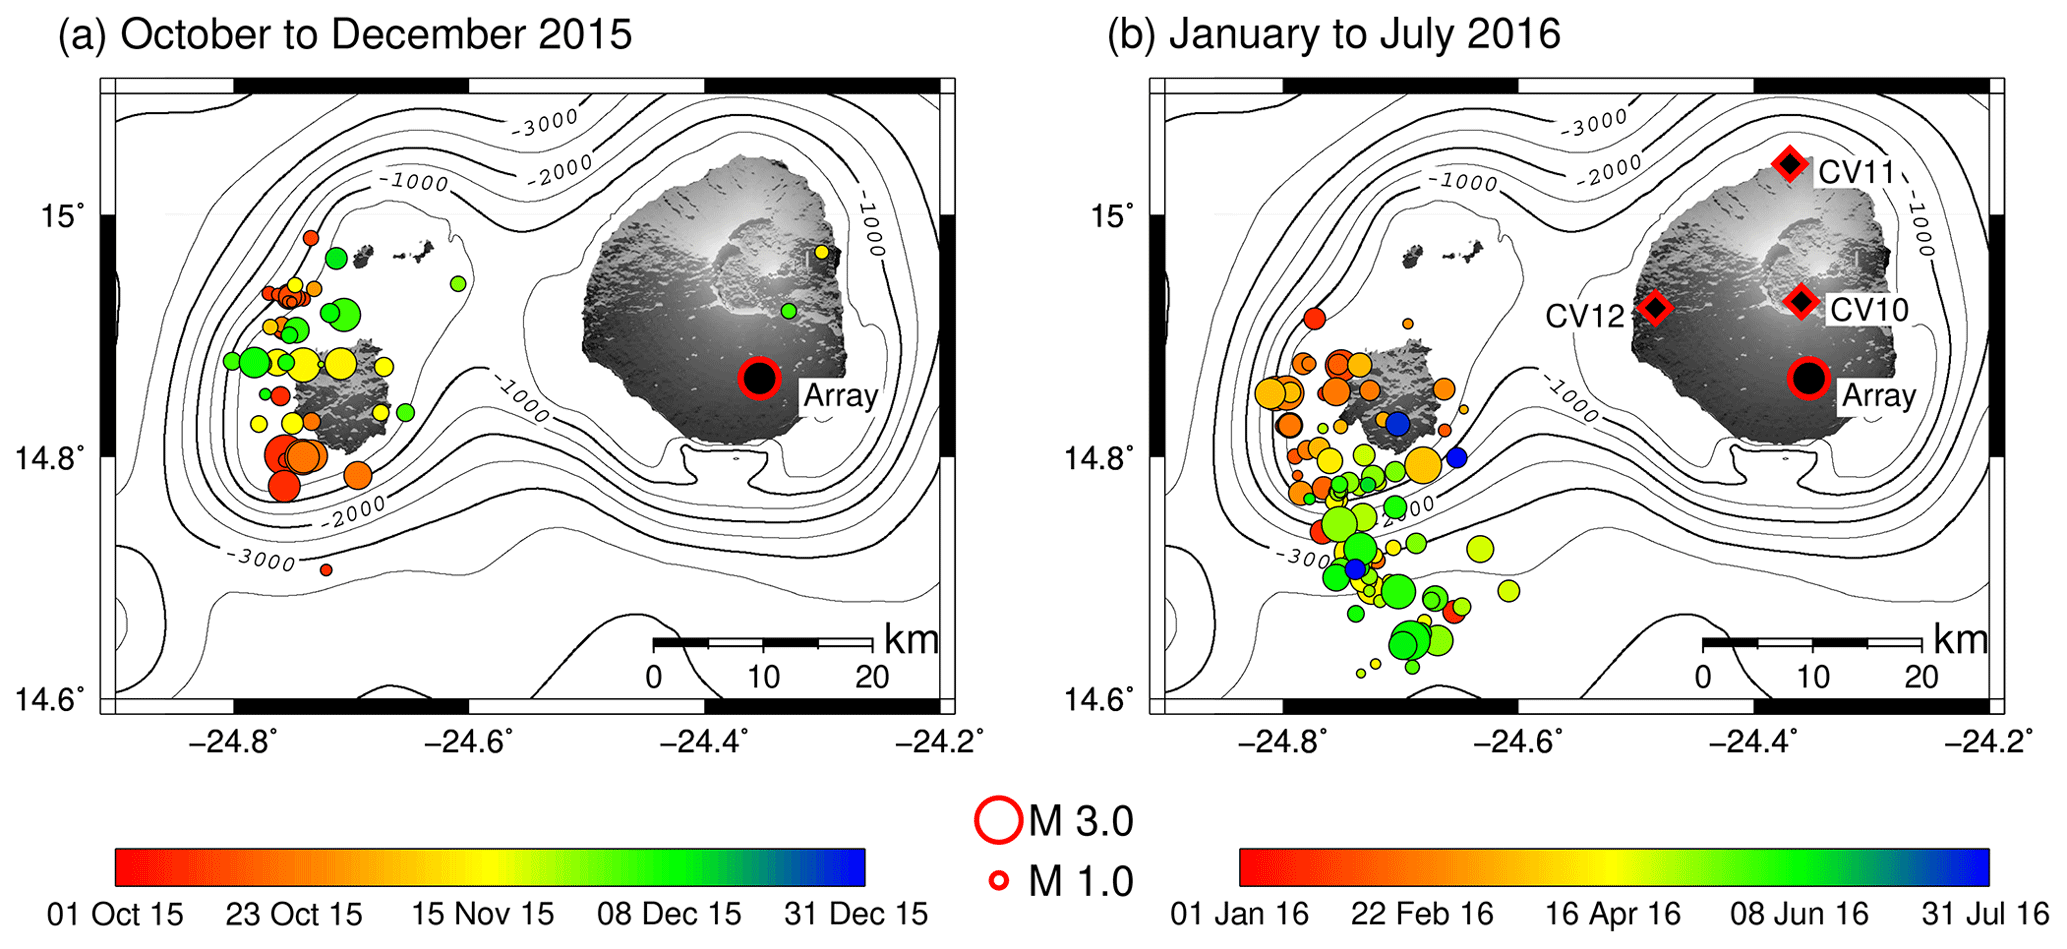
Figure 5(a) Earthquake locations from 8 October to 19 December 2015. Red/black circle: position of the array on Fogo. (b) Earthquake locations from 15 January to 31 July 2016. Red/black circle: position of the array, red/black diamond: additional broadband stations on Fogo. Topographic and bathymetry data are from Ryan et al. (2009).
On 12 November, the number of recorded earthquakes per day reached 13 (Fig. 3), exceeding the average number of earthquakes per day, but the locations of the earthquakes were rather widespread in the north of Brava (see Fig. 5a). In February the earthquakes shifted to an area west of Brava with an increased seismicity on 18 and 19 February (Fig. 5b). From 7 to 11 April a high seismic activity was recorded with events originating from an area extending from southwest offshore Brava about 20 km towards south–southeast (Fig. 5b). Seismicity reached another peak on 10 May (Fig. 3), but the locations remained in the area south of Brava until August (Fig. 5b). From April to June the southern station of the array was out of operation, leading to a possible bias in earthquake locations. A more detailed analysis shows that true locations are somewhat closer to Brava (by about 8 km) than shown here. Seismic events during June still are located mainly offshore south of Brava (Fig. 6). A data gap occurred from 17 June to 18 July due to limited storage capacities of the data loggers. During the last days of July, we observed very few earthquakes distributed over a wider area (Fig. 5b).
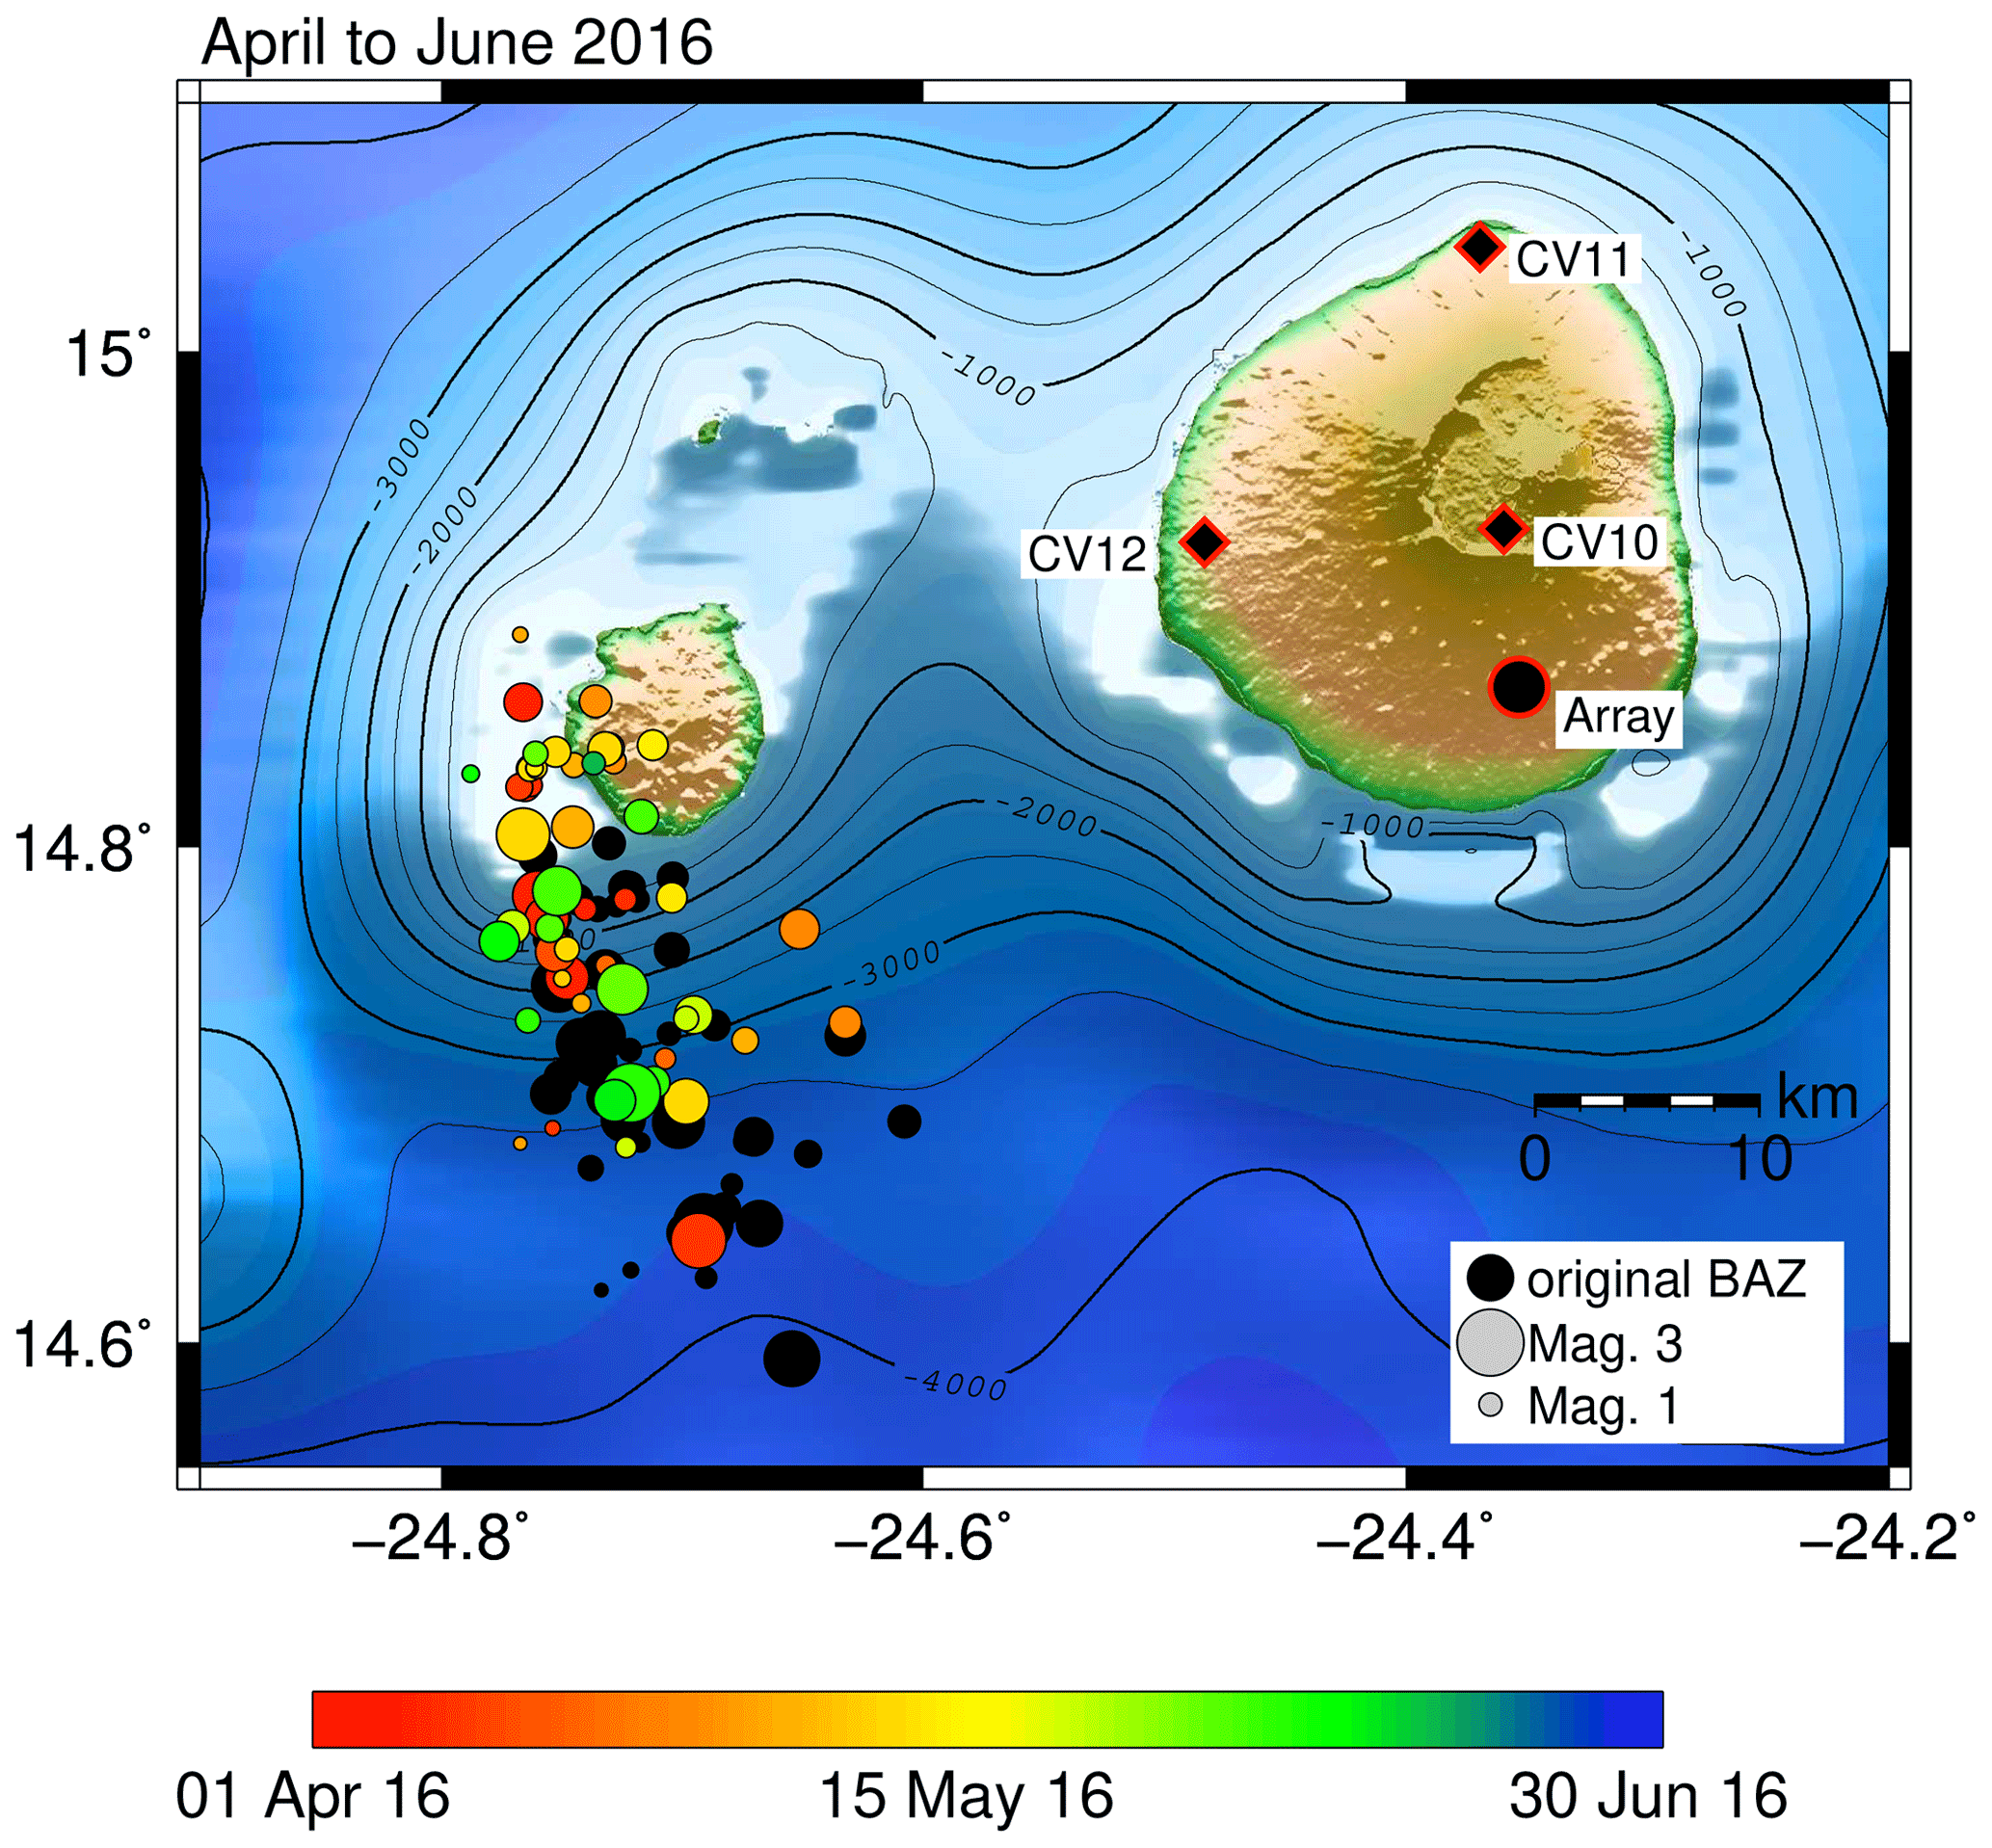
Figure 6Earthquake locations from April to June 2016. From April to June 2016 the southernmost array station was out of operation. Comparison of events recorded in other time periods shows that the outage of this station leads to a bias of about 8.9∘ in backazimuth towards the south. Original locations of the earthquakes are marked by black symbols; the corrected locations (with a mean correction of 8.9∘ in the backazimuth determination) are marked by coloured symbols. Topographic and bathymetry data are from Ryan et al. (2009).
4.2 August 2016 – during the seismic crisis
On 1 and 2 August the seismic crisis occurred on Brava (Faria and Day, 2017). We detected 54 earthquakes during these two days and were able to locate 25 individual events of this swarm. Most of the volcano-tectonic earthquakes are located beneath the southern part of Brava (Fig. 7a). The magnitudes ranged from 0.5 to 2.8, and the b value is 0.83 (Fig. 8c). We estimated the b value following Gutenberg and Richter (1944) with , where N represents the cumulative number of earthquakes with magnitudes larger than M. The magnitude of completeness is determined using the maximum curvature method (Wiemer and Wyss, 2000), as this method has been shown to be relatively reliable for catalogues with small sample sizes (Mignan and Woessner, 2012). The constants a and b are obtained from fitting the Gutenberg–Richter relation for values above the magnitude of completeness. However, the b value is difficult to estimate with certainty, as the number of earthquakes is relatively low (see Roberts et al., 2015). This is underlined by the variation of N (blue) with respect to the straight line (black) fitted to the data (Fig. 8). The analysis of a possible temporal evolution of the b value is added to the Supplement.
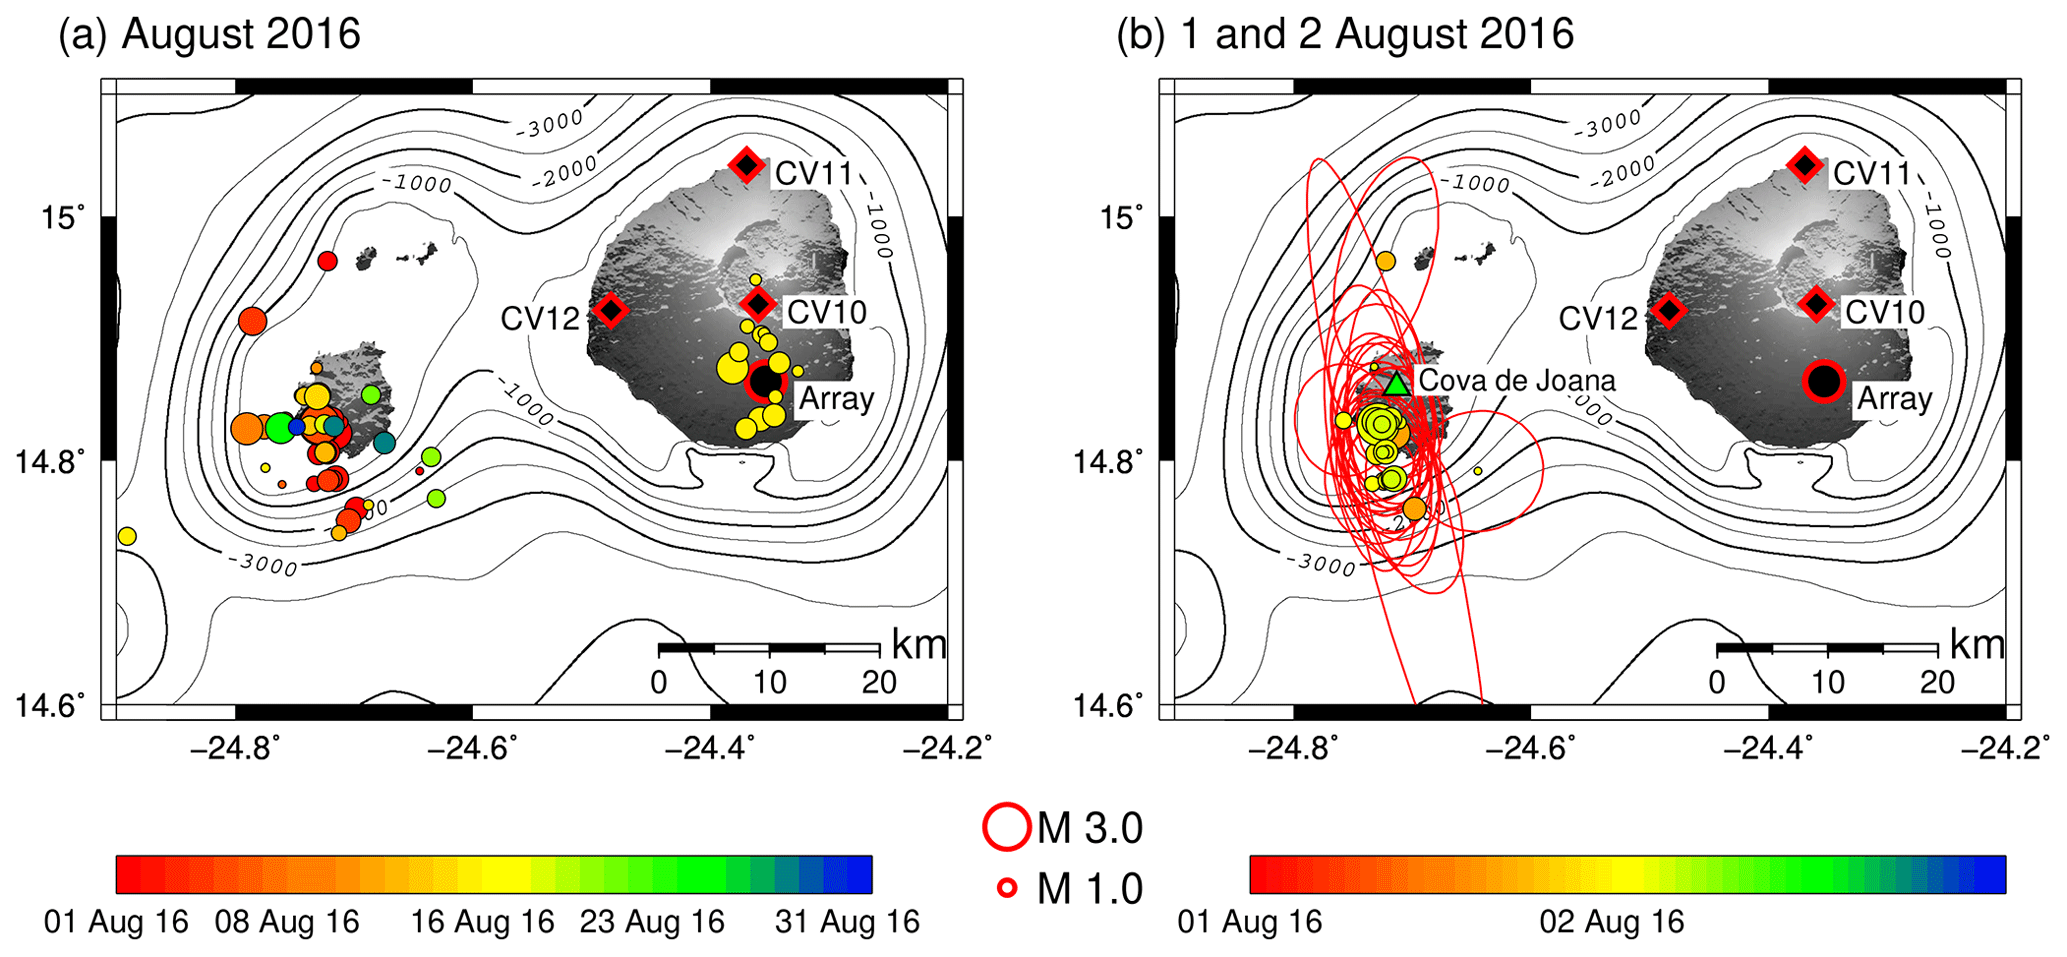
Figure 7(a) Earthquake locations during August 2016, including the seismic crisis. Red/black circle: position of the array, red/black diamond: additional broadband stations on Fogo. (b) Earthquake locations during the seismic crisis on 1 and 2 August 2016. Red ellipses: errors in backazimuth and distance as determined for the array analysis. Red/black circle: position of the array, red/black diamond: additional broadband stations on Fogo. Green triangle: village Cova de Joana, evacuated during the seismic crisis. Topographic and bathymetry data are from Ryan et al. (2009).
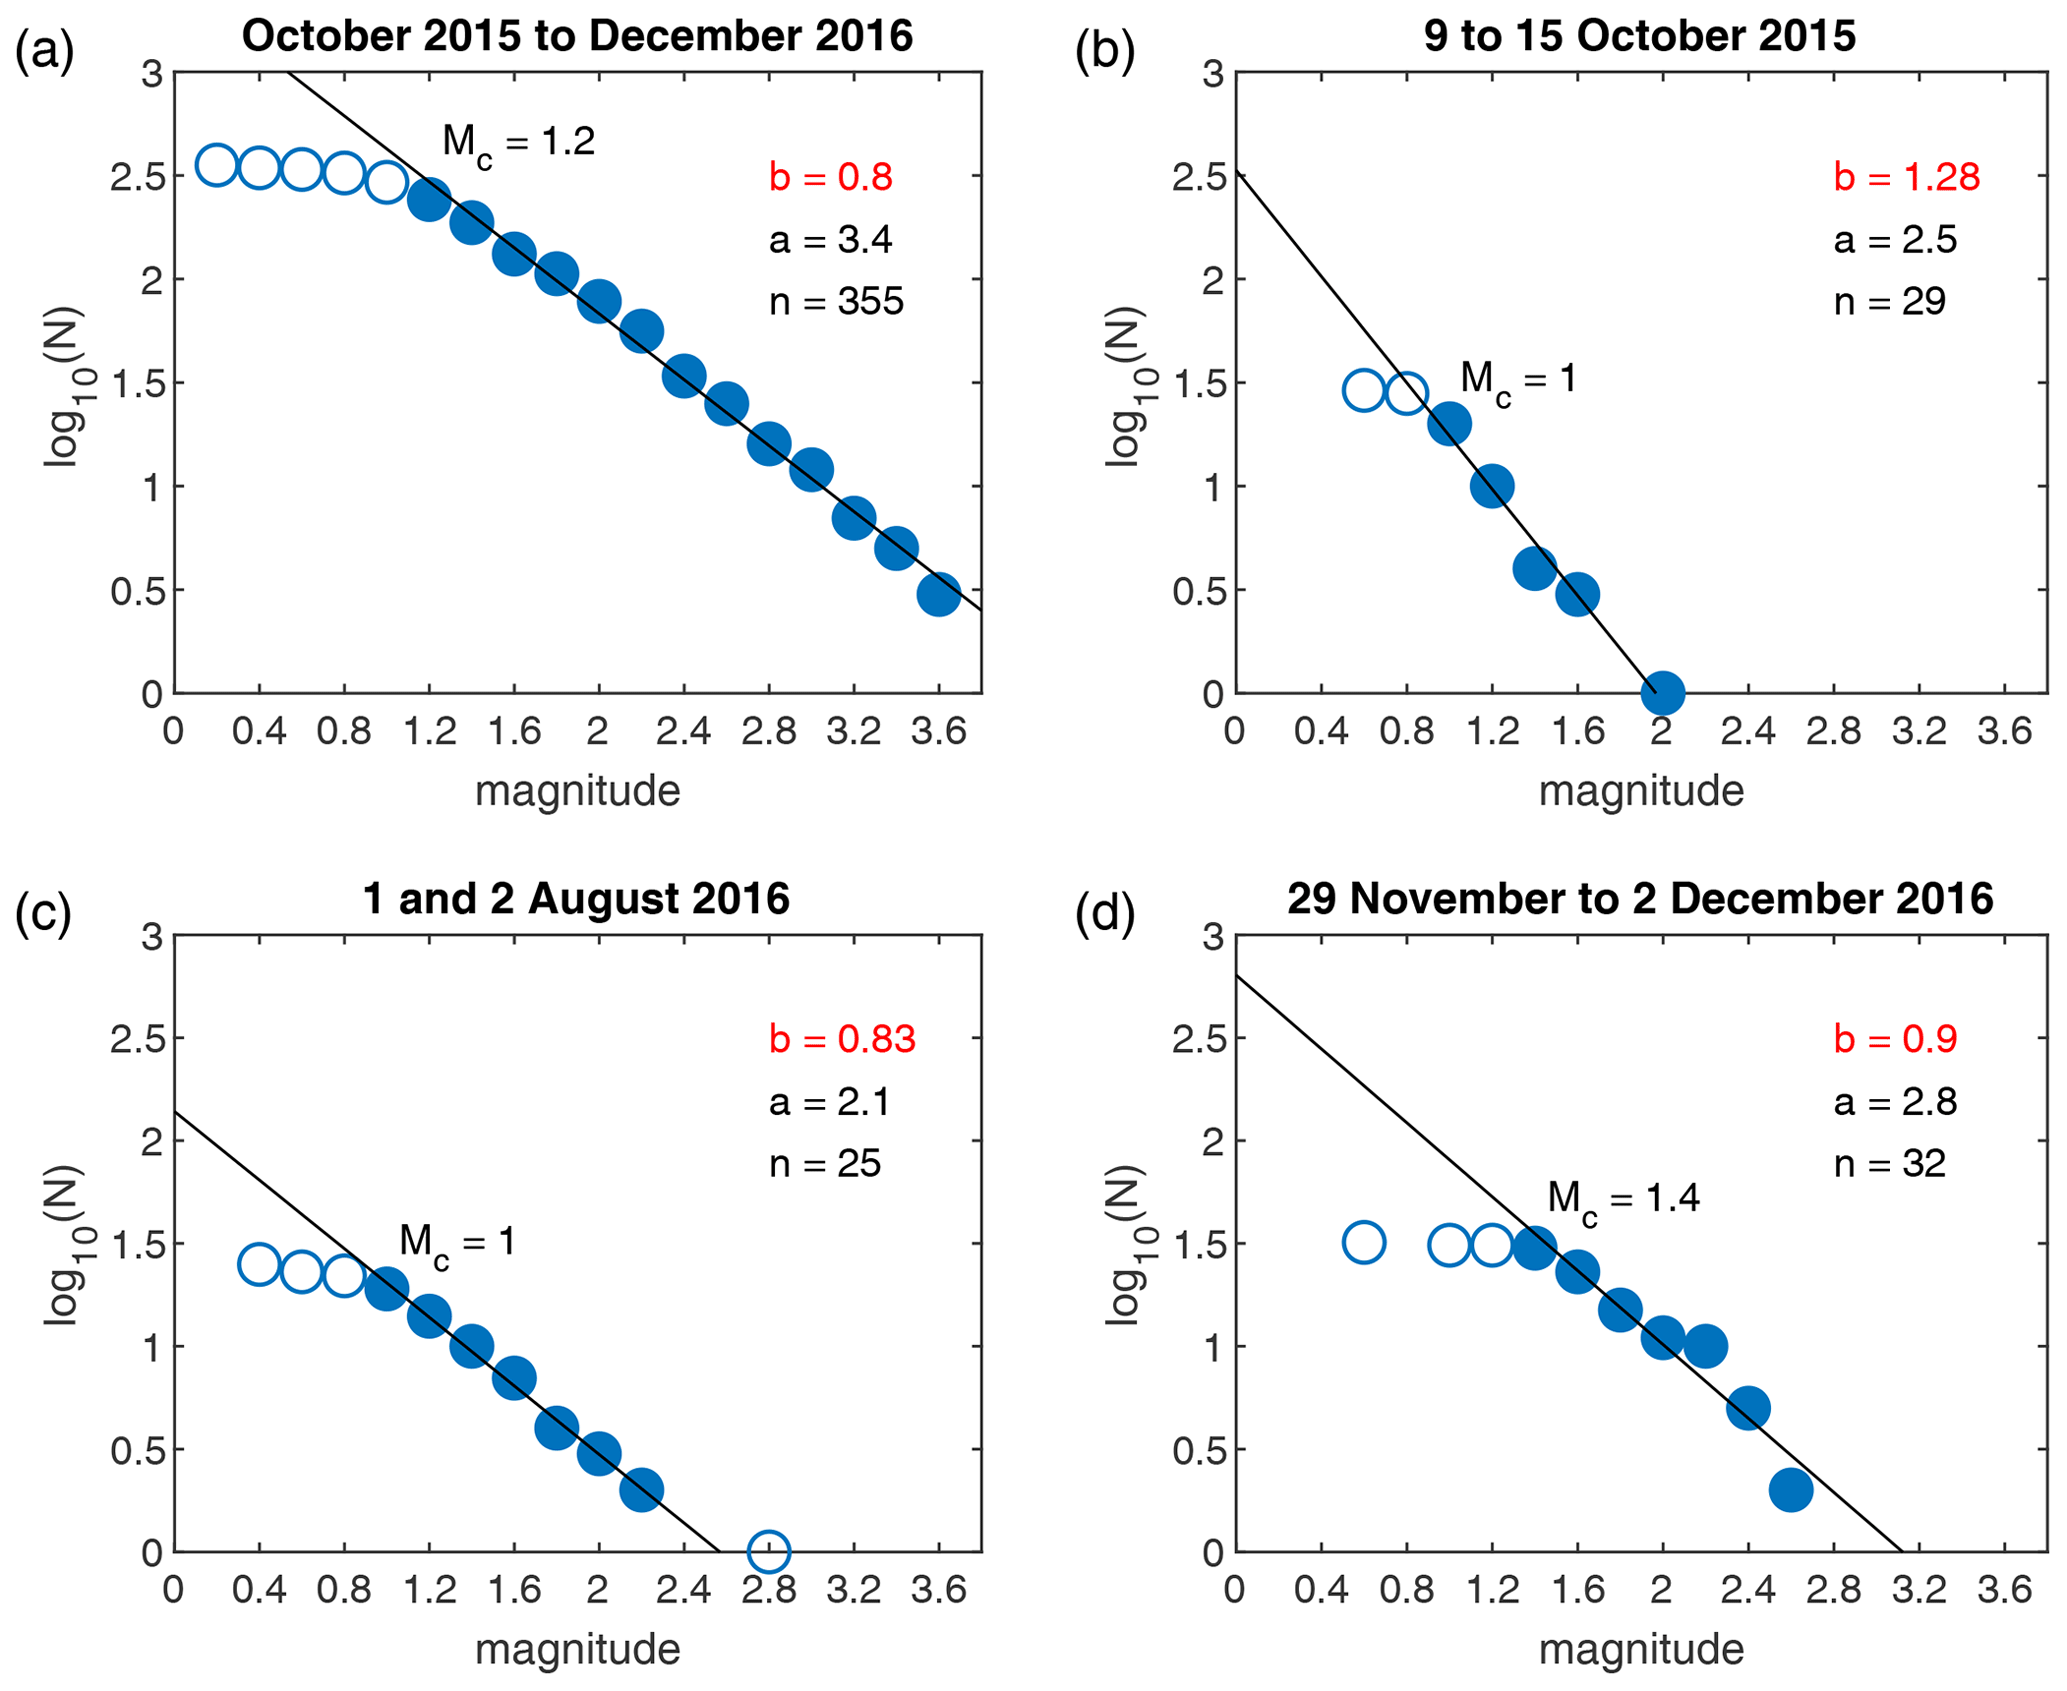
Figure 8Magnitude–frequency relation for earthquakes observed during (a) the study period, (b) the period of elevated seismic activity from 9 to 15 October 2015, (c) the seismic crisis on 1 and 2 August 2016, and (d) the period of elevated seismic activity from 29 November to 2 December 2016. Magnitudes are binned in steps of 0.2, and n corresponds to the number of events during the period under consideration. Data points used to fit the straight line for the determination of a and b are marked with filled dots.
In the aftermath of the crisis, seismicity remained at an elevated level. Until 15 August, earthquakes were again located west and south offshore, but relatively close to the island (Fig. 7b). Afterwards the seismicity around Brava decreased and was distributed over a broader area. On 15 August, a swarm of deep subcrustal earthquakes occurred beneath Fogo. Due to their proximity to the array, the earthquakes were analysed and located by conventional network-based methods only (using the additional network stations on Fogo). These deep events are further discussed in Leva et al. (2019).
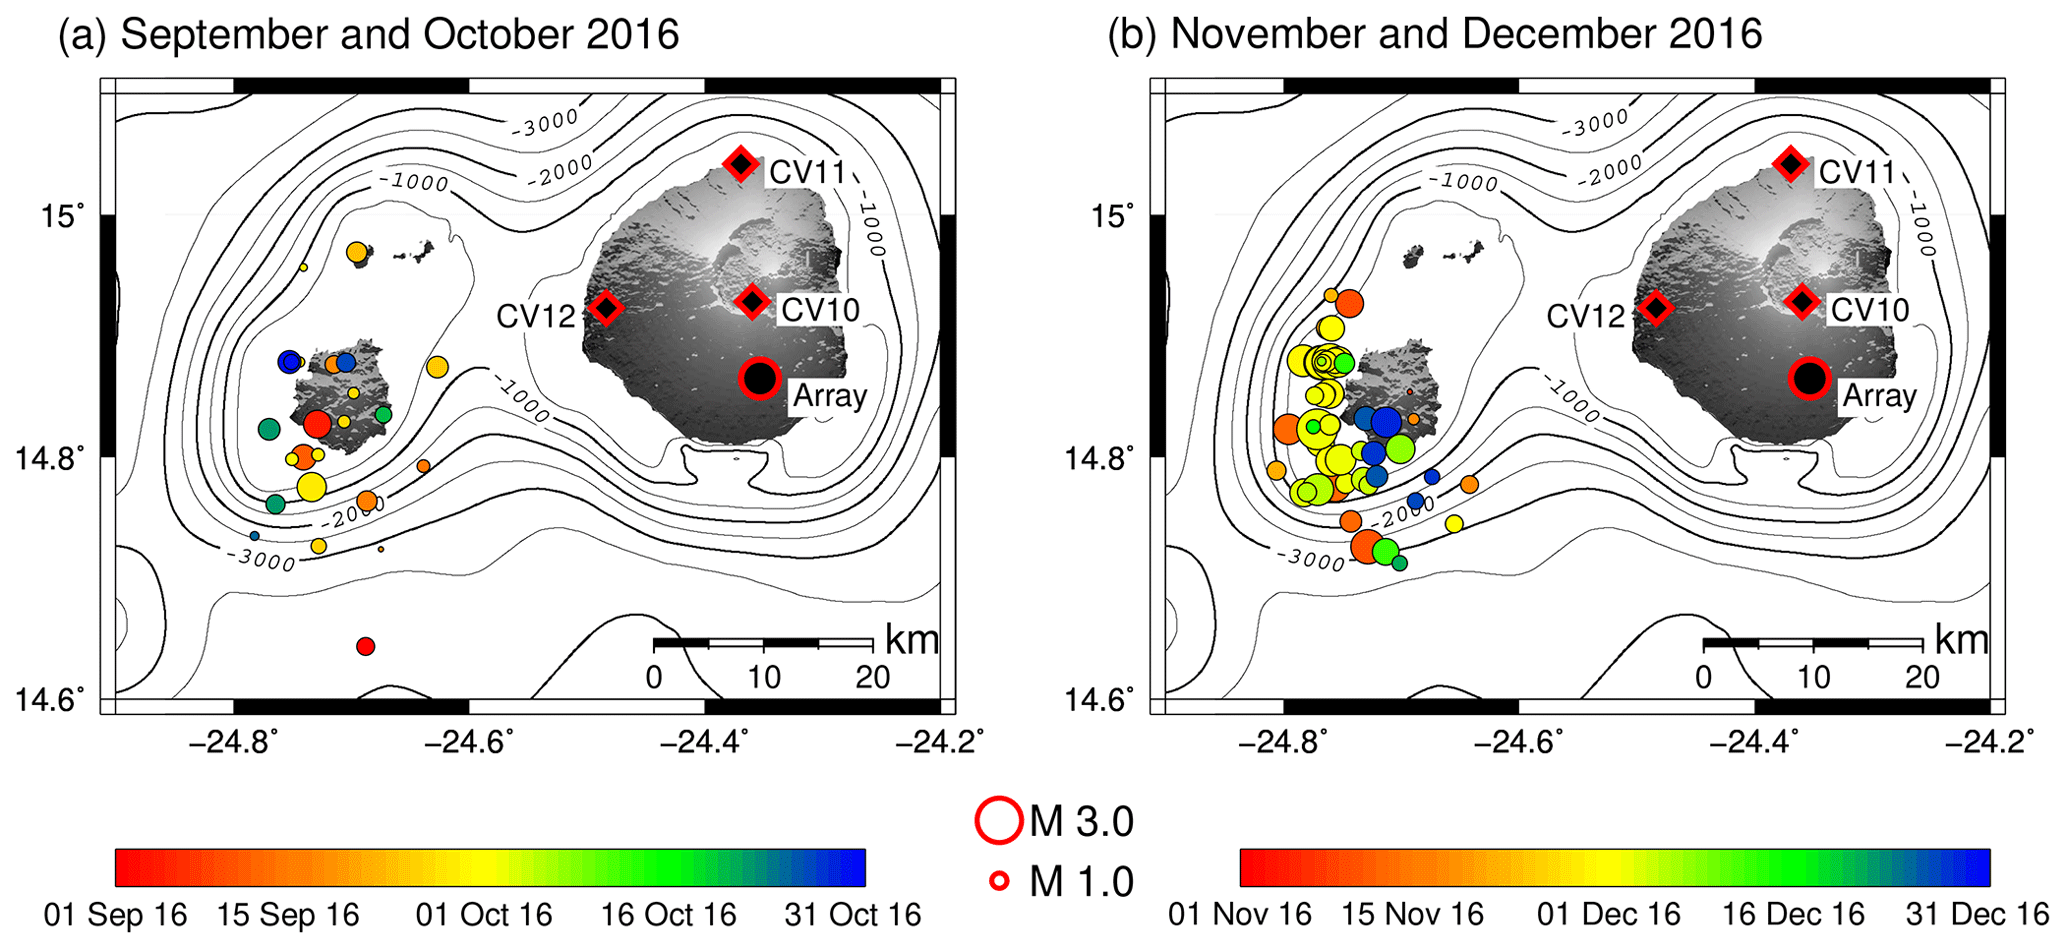
Figure 9(a) Earthquake locations during September and October 2016. Red/black circle: position of the array, red/black diamond: additional broadband stations on Fogo. (b) The same for November and December 2016. Topographic and bathymetry data are from Ryan et al. (2009).
4.3 September 2016 to December 2016 – after the seismic crisis
In September and October, we still observed earthquakes beneath Brava (see Fig. 9a), but they did not cluster locally and the seismic activity was relatively low during this time. An elevated level of seismicity was recorded on 12 and 13 November, extending from west to south offshore of Brava (Fig. 9b). From 29 November to 2 December we recorded a total of 150 earthquakes (see Fig. 3). On 29 and 30 November, a swarm was located directly northwest of the coast of Brava (Fig. 9b). In the following two days the seismic activity shifted towards the south to an area south-west of Brava's coast. During the rest of December, earthquakes mainly occurred beneath the southern part of Brava and offshore the southern coast (Fig. 9b).
4.4 Periods with increased seismicity
Figure 3 indicates that periods with elevated seismicity frequently occurred beneath and around Brava during the time of our study. Apart from the swarms in August 2016, we observed four additional peaks, where the records show more than 20 earthquakes per day: 9 to 15 October 2015, 7 to 11 April, 10 May and 29 November to 2 December 2016. These earthquakes have in common that they occur offshore (Fig. 10). B values for the earthquakes from 9 to 15 October 2015 and 29 November to 2 December 2016 are 1.28 and 0.9, respectively (Fig. 8b, d). For the other two periods the number of earthquakes was too low to determine the b value.
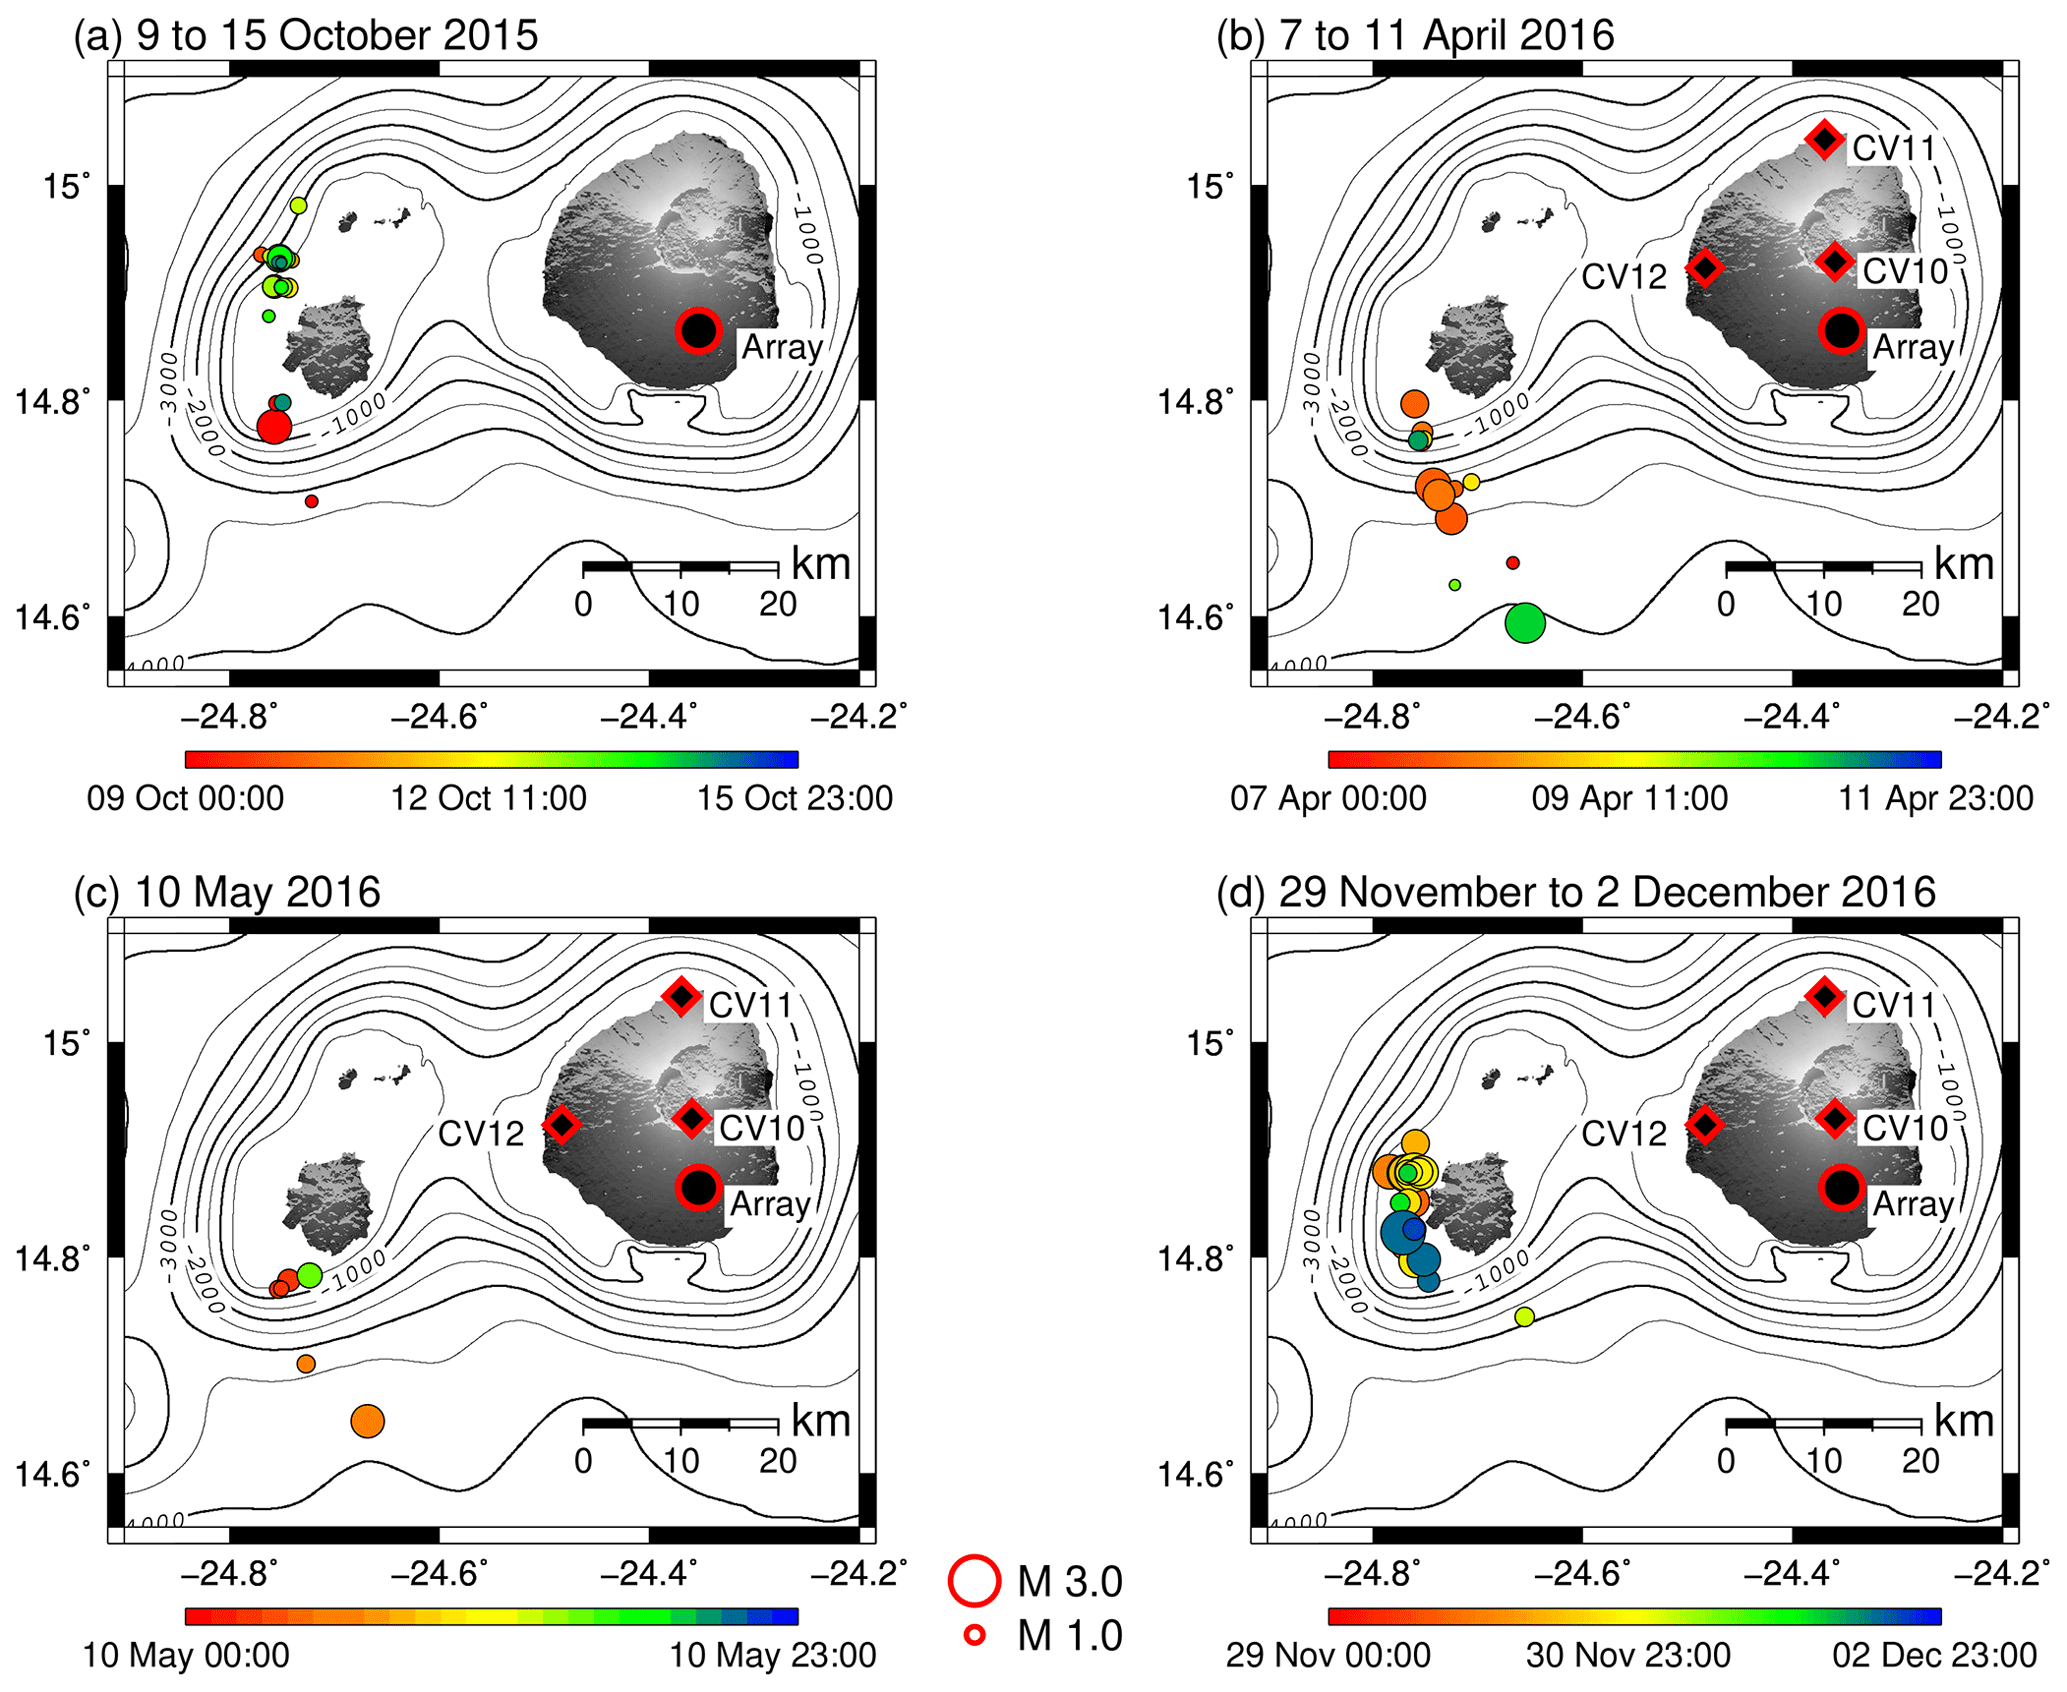
Figure 10Earthquake locations for four different time periods of elevated seismicity: (a) 9–15 October 2015, (b) 7–11 April 2016, (c) 10 May 2016, and (d) 29 November to 2 December 2016. Red/black circle: position of the array, red/black diamonds: additional broadband stations on Fogo. Topographic and bathymetry data are from Ryan et al. (2009).
The seismicity beneath and around Brava is characterized by a significant variation in the location of the highest activity. This also becomes evident when comparing the results of previous studies, which show different areas of high seismic activity around Brava (e.g. Heleno and Fonseca, 1999; Helffrich et al., 2006; Faria and Fonseca, 2014; Vales et al., 2014). In our study from October 2015 to December 2016 we observe several periods with increased seismicity (Fig. 3), which originate from different areas. During the first months of 2016 we observe a shift of the volcano-tectonic earthquakes from west of Brava (during February to March) towards an area south of Brava (during April to July). On 1 and 2 August a seismic crisis occurred on Brava. According to Faria and Day (2017) about 1000 shallow earthquakes and tremors were recorded by the local seismic network on Brava. We observed 54 earthquakes with our network on Fogo and were able to locate 25 earthquakes with magnitudes from 0.5 to 2.8. The discrepancy in the number of detected earthquakes is due to the distance of about 35 km between our network and the area of high seismic activity. Small earthquakes are therefore masked by seismic background noise. Also, in our data, we do not observe tremors or long-period events originating on Brava. However, we cannot exclude the occurrence of such events, as they may not be detectable at the distance of the array. However, from the magnitude–frequency relation (see Fig. 8c) we can estimate that magnitudes must have been as low as −1 to reach the high number of events detected by Faria and Day (2017). For our observations, the magnitude of completeness is 1 and the b value 0.83. Due to the small number of earthquakes in the swarm, it is possible that the b value is underestimated (as also discussed further below). The locations of earthquakes that we observed cluster mainly southwest of Brava at a distance of about 3.5 to 4 km south of the reportedly evacuated village Cova de Joana. However, considering the errors in our localization (see Fig. 7b), the main activity may indeed have occurred close to the village as indicated by the results of Faria and Day (2017). The array analysis is not suited to observe a possible depth migration of the events. In the aftermath of the crisis most earthquakes still arose beneath Brava; in October the dominant seismic activity shifted back to the regions west and south of Brava, where it remained until December 2016.
Seismic arrays can exhibit systematic aberrations, which may influence the localization of seismic events. In order to determine a possible systematic deviation from the true earthquake locations, we compare the backazimuth and slowness values of the array analysis with those obtained by classical network analysis at a later time (e.g. Schweitzer et al., 2012). Within a more comprehensive study from January 2017 to January 2018, we operated a seismic network consisting of three arrays and seven single stations equipped with short-period sensors on both Fogo and Brava (see Fig. S3). The shape and location of the array AF in that study coincide with the array used during the pilot study presented here. By determining the systematic aberration of array AF, we can therefore draw conclusions for the location accuracy of both arrays. For earthquake locations on Brava, we determine a mean deviation of the backazimuth of about 6.5∘ towards the south. Further details of the analysis are given in the Supplement. Figure 11 shows the resulting new locations of the earthquakes during the seismic crisis, after taking the correction into account. As a result, the earthquake locations tend to be shifted closer to the village of Cova de Joana.

Figure 11Earthquake locations during the seismic crisis of 1 and 2 August 2016. Yellow circles: original location of the earthquakes determined from the array data; red circles: corrected locations according to the mean systematic deviation of 6.5∘ in the backazimuth determination (see text for details). Topographic and bathymetry data are from Ryan et al. (2009).
Our observation of a shift in earthquake locations from west to south of Brava prior to the crisis does not provide evidence for a distinct precursory signal related to the seismic crisis in the beginning of August, especially when considering the days just before the crisis, for which we observe seismicity distributed over a broad area. Another point is the variation in seismic activity afterwards, especially from November to December, which again shows a shift from the west to the south without invoking another crisis. During the time of our experiment, a dispersed occurrence of earthquake clusters seems to be rather common in the study area. Faria and Day (2017) report on a change in seismicity around Brava after an earthquake of magnitude M4 in September 2015. However, as their data are restricted, we cannot comment on this observation in detail.
As depicted in Sect. 4.4, during the time of our study we recorded four additional periods, apart from the swarms in August, where the number of earthquakes exceeded 20 per day. These times with elevated seismicity occurred from 9 to 15 October 2015, 7 to 11 April, 10 May, and 29 November to 2 December 2016. From 9 to 15 October 2015, the dominant seismic activity occurred northwest of Brava. Clustering of earthquakes only occurred during the period from 29 November to 2 December. For these two periods the b values are estimated as 1.28 and 0.9, respectively. However, this estimation is rather uncertain, as the number of earthquakes is low (see Roberts et al., 2015), and the detections performed by the array are biased towards larger events. The magnitudes of completeness are difficult to assess, and the corresponding b values are likely underestimated, even when considering the whole study period for which we estimated a b value of 0.8 (Fig. 8a). High b values significantly above 1 would be expected for volcano-tectonic earthquake swarms (Roberts et al., 2015). To better constrain the underlying processes, analyses of focal mechanisms are helpful but not available due to limited azimuthal coverage provided by the array. The observed clustering and frequent variations in earthquake locations are characteristic of volcano-tectonic earthquake swarms (e.g. Zobin, 2012), and their origin is likely attributed to magmatic processes, as also suggested by other authors (e.g. Faria and Fonseca, 2014). In previous studies of volcano-tectonic earthquakes their origin, often, was attributed to dyke inflation or dyke propagation (Roman and Cashman, 2006). Earthquake swarms without a typical mainshock–aftershock sequence usually occur in response to fluid migration or volatile and CO2 releases, causing reduced fault resistance or stress changes (e.g. Lindenfeld et al., 2012). In previous studies examining the seismicity of Cabo Verde, earthquake swarms west of Brava have been linked to a shallow volcano-tectonic structure with a NE–SW alignment between the Cadamosto Seamount and Brava (Vales et al., 2014). Earthquake swarms NE and SW offshore Brava have been associated with submarine volcanic cones and earthquakes close to or beneath Brava to magmatic intrusions into the crust (Faria and Fonseca, 2014).
Comparing the additional periods of elevated seismicity with the seismic crisis in the beginning of August, it seems that the potential risk for the population on Brava may have been increased during the seismic crisis, as earthquake locations cluster beneath the island. However, we cannot determine the depth of the events, which is another crucial parameter in estimating the potential hazard. The occurrence of this seismic crisis on a dormant volcano characterized by previous phreatomagmatic activity clearly underlines the importance of the local monitoring network, which was established in 2011 (Faria and Fonseca, 2014). There are several documented cases of failed eruptions accompanied by swarms of volcano-tectonic earthquakes at dormant volcanoes. A failed eruption is characterized by magma intrusion into the upper crust, accompanied, for example, by seismic swarms, which stops without an eruption (Moran et al., 2011). These volcanic unrests are indistinguishable from unrests leading to eruptions, which makes a forecast difficult (Zobin, 2012). For example, in 1989 an unrest of Mammoth Mountain, California, was documented on the basis of increased seismic activity with several earthquakes clusters active at different episodes with rather small magnitudes (M≤3), long-period and very-long-period earthquakes, together with outgassing of magmatic CO2 and fumaroles with increased 3He ∕ 4He ratios. This unrest has been interpreted as ascent of magma from the mid-crust to the upper crust (Hill and Prejean, 2005). Therefore, a possible scenario for the mechanisms leading to the seismic crisis on Brava could be that magma has been transported into the upper crust, where the process came to a halt. Diffuse carbon dioxide (CO2) degassing surveys were regularly conducted on Brava during the period from 2010 to 2018 (Albertos et al., 2019), and the observed spatial–temporal changes on ground CO2 efflux value and diffuse CO2 emission rates are geochemical evidence which supports a volcanogenic source for the 2016 anomalous seismic activity registered at Brava (García-Merino et al., 2017; Albertos et al., 2019).
Taken together our observations of 2016 and the observation of a change in seismicity after a large earthquake in September 2015 (Faria and Day, 2017), the seismicity following in 2016 could potentially be part of an uplift episode. As reported by Madeira et al. (2010) and Ramalho et al. (2010a), Brava experienced significant uplift, which cannot be explained by a regional uplift across the Cabo Verde swell. Magmatic intrusions below the volcanic edifice could cause this uplift (Ramalho et al., 2010a, b). A failed eruption could contribute to such an uplift; however we cannot comment on the amount of material added and thus on a potential uplift.
The village of Cova de Joana on Brava is in the vicinity of a volcano-tectonic lineament, and it has been suggested that the volcanism on Brava could be controlled by tectonic stresses (Madeira et al., 2010). Also an interaction of regional tectonic and volcanic stresses, as observed at El Hierro, Canary Islands (López et al., 2017), could be a possible mechanism causing the earthquakes beneath Brava. The clear identification of the mechanism behind the events during the seismic crisis and their relationship to faults on Brava would require more precise locations, and focal mechanisms of the earthquakes, in addition to observations from other disciplines such as geochemistry and geodesy.
In this study we remotely monitored a seismic crisis by tracking the shifting of swarms of volcano-seismic events using array methods. We observe changes in seismic activity before, during and after the seismic crisis. In general, seismic arrays are valuable tools for the remote seismic monitoring of regions that are difficult to access.
The array of this study was located on Fogo, Cabo Verde, about 35 km away from the neighbouring island of Brava, and was operational from October 2015 to December 2016. We analysed the seismic crisis that occurred on 1 and 2 August on Brava and observed an elevated level of seismicity. A total of 54 earthquakes were detectable on those two days, and 25 could be located. During the first six months of 2016 the seismicity around Brava shifted over time from a region located offshore west of Brava to another offshore area south of the island. During this time, the number of earthquakes per day exceeded 20 earthquakes per day during three periods (9 to 15 October 2015, 7 to 11 April and 10 May 2016). However, during these periods the earthquakes occurred offshore and in a rather large area. On the last days of July we recorded only very few earthquakes, which we located in a widespread area around and beneath Brava. This leads to the conclusion that we did not find any evidence for seismic precursors of the crisis, such as a shift of the volcano-tectonic earthquakes towards the island.
After the two days of the seismic crisis the activity beneath Brava remained at an elevated level until October, where we find a widely distributed seismicity around and beneath Brava. During the end of November and the beginning of December another swarm of earthquakes occurred offshore west of Brava. Thus, it appears that the seismicity shifted away from the island again. We conclude that the seismic crisis might be an example of a failed eruption, likely caused by the transport of magma and/or CO2 into the upper crust, as it has been suggested by the observed changes on diffuse CO2 degassing surveys (García-Merino et al., 2017; Albertos et al., 2019).
Although the seismic array used in this study provided important independent information about the seismic crisis on Brava in August 2016, the inclusion of additional (e.g. geochemical and geodetical) data is highly desirable and required. In general, the combination of different observables could significantly improve the assessment of volcanic hazards.
The data are available for download at GEOFON (https://geofon.gfz-potsdam.de, GEOFON, 2020). Please refer to Wölbern et al. (2019, https://doi.org/10.14470/0Z7560909466).
The supplement related to this article is available online at: https://doi.org/10.5194/nhess-20-3627-2020-supplement.
CL analysed the data and prepared the figures for the work presented here. CL wrote the manuscript as part of her PhD, under supervision of GR. The manuscript was revised by GR and IW. The study and the setup of the seismic array were initiated and conceived by GR and IW. IW was also responsible for project administration. All authors took part in the field work.
The authors declare that they have no conflict of interest.
We thank Bruno Faria for his support, and we would like to acknowledge the efforts of José Levy in customs handling and logistics. Paulo Fernandes Teixeira and José Antonio Fernandes Dias Fonseca are thanked for their assistance during field work. The Geophysical Instrument Pool Potsdam provided three seismic instruments of the pilot study in 2016 and the instruments of the main study in 2017. We further thank Carmen López and an anonymous reviewer for their comments and suggestions, which helped to improve the manuscript.
The project was funded by Goethe University Frankfurt and by Deutsche
Forschungsgemeinschaft (DFG) through grants to Georg Rümpker and Ingo Wölbern (grant no. WO 1723/3-1), respectively.
This open-access publication was funded
by the Goethe University Frankfurt.
This paper was edited by Giovanni Macedonio and reviewed by Carmen López and one anonymous referee.
Albertos, V. T., Hopson, J. D., Silva, S. V., Pereira, J. M., Padrón, E., Melián, G. V., Hernández, P. A., and Pérez N. M.: Diffuse CO2 degassing from Brava Volcanic System, Cape Verde: a valuable tool to forecast volcanic unrest episodes, Geophysical Research Abstracts, 21, EGU2019-1403, 2019.
Calvari, S., Ganci, G., Silva, S. V., Hernandez, P. A., Perez, N. M., Barrancos, J., Alfama, V., Dionis, S., Cabral, J., Cardoso, N., Fernandes, P., Melian, G., Pereira, J. M., Semedo, H., Padilla, G., and Rodriguez, F.: Satellite and Ground Remote Sensing Techniques to Trace the Hidden Growth of a Lava Flow Field: The 2014-2015 Effusive Eruption at Fogo Volcano (Cape Verde), Remote Sens., 10, 1115, https://doi.org/10.3390/rs10071115, 2018.
Cappello, A., Ganci, G., Calvari, S., Pérez, N. M., Hernández, P. A., Silva, S. V., Cabral, J., and Del Negro, C.: Lava flow hazard modeling during the 2014–2015 Fogo eruption, Cape Verde, J. Geophys. Res.-Sol. Ea., 121, 2290–2303, https://doi.org/10.1002/2015JB012666, 2016.
Courtney, R. C. and White, R. S.: Anomalous heat flow and geoid across the Cape Verde Rise: evidence for dynamic support from a thermal plume in the mantle, Geophys. J. Roy. Astr. Soc., 87, 815–867, https://doi.org/10.1111/j.1365-246X.1986.tb01973.x, 1986.
Dionis, S. M., Pérez, N. M., Hernández, P. A., Melián, G., Rodríguez, F., Padrón, E., Sumino, H., Barrancos, J., Padilla, G. D., Fernandes, P., Bandomo, Z., Silva, S., Pereira, J. M., Semedo, H., and Cabral, J.: Diffuse CO2 degassing and volcanic activity at Cape Verde islands, West Africa, Earth Planets Space, 67, 48, https://doi.org/10.1186/s40623-015-0219-x, 2015.
ECHO: Brava Island (Cape Verde) – Seismic Activity – ECHO Daily Map | 03/08/2016, European Commission's Directorate–General for European Civil Protection and Humanitarian Aid Operations, available at: https://reliefweb.int/map/cabo-verde/brava-island-cape-verde-seismic-activity-echo-daily-map-03082016 (last access: 2 April 2020), 2016.
Faria, B. and Fonseca, J. F. B. D.: Investigating volcanic hazard in Cape Verde Islands through geophysical monitoring: network description and first results, Nat. Hazards Earth Syst. Sci., 14, 485–499, https://doi.org/10.5194/nhess-14-485-2014, 2014.
Faria, B. and Day, S. J.: Patterns of seismicity in a complex volcanic crisis at Brava, Cabo Verde, American Geophysical Union, Fall Meeting 2017, New Orleans, USA, 11–15 December 2017, abstract #U43A-02, 2017.
García-Merino, M., García-Hernández, R., Montrond, E., Dionis, S., Fernandes, P., Silva, S. V., Alfama, V., Cabral, J., Pereira, J. M., Padrón, E., and Pérez, N. M.: Anomalous increase of diffuse CO2 emission from Brava (Cape Verde): evidence of volcanic unrest or increase gas release from a stationary magma body?, Geophysical Research Abstracts, 19, EGU2017-8905, 2017.
GEOFON: GFZ German Research Center for Geosciences, available at: https://geofon.gfz-potsdam.de, last access: 19 November 2020.
González, P. J., Bagnardi, M., Hooper, A. J., Larsen, Y., Marinkovic, P., Samsonov, S. V., and Wright, T. J.: The 2014–2015 eruption of Fogo volcano: Geodetic modeling of Sentinel–1 TOPS interferometry, Geophys. Res. Lett., 42, 9239–9246, https://doi.org/10.1002/2015GL066003, 2015.
Gutenberg, B. and Richter, C. F.: Frequency of earthquakes in California, B. Seismol. Soc. A, 34, 185–188, 1944.
Heleno, S. I. N. and Fonseca, J. F. B. D.: A Seismological Investigation of the Fogo Volcano, Cape Verde Islands: Preliminary Results, J. Volcanol. Seismol., 20, 199–217, 1999.
Helffrich, G., Heleno, S. I. N., Faria, B., and Fonseca, J. F. B. D.: Hydroacoustic detection of volcanic ocean–island earthquakes, Geophys. J. Int., 167, 1529–1536, https://doi.org/10.1111/j.1365-246X.2006.03228.x, 2006.
Hill, D. P. and Prejean, S.: Magmatic unrest beneath Mammoth Mountain, California, J. Volcanol. Geoth. Res., 146, 257–283, https://doi.org/10.1016/j.jvolgeores.2005.03.002, 2005.
Leva, C., Rümpker, G., Link, F., and Wölbern, I.: Mantle earthquakes beneath Fogo volcano, Cape Verde: Evidence for subcrustal fracturing induced by magmatic injection, J. Volcanol. Geoth. Res., 386, 106672, https://doi.org/10.1016/j.jvolgeores.2019.106672, 2019.
Lindenfeld, M., Rümpker, G., Link, K., Koehn, D., and Batte, A.: Fluid–triggered earthquake swarms in the Rwenzori region, East African Rift—Evidence for rift initiation, Tectonophysics, 566–567, 95–104, https://doi.org/10.1016/j.tecto.2012.07.010, 2012.
López, C., Benito-Saz, M. A., Martí, J., del-Fresno, C., García-Cañada, L., Albert, H., and Lamolda, H.: Driving magma to the surface: The 2011–2012 El Hierro Volcanic Eruption, Geochem. Geophy. Geosy., 18, 3165–3184, https://doi.org/10.1002/2017GC007023, 2017.
Madeira, J., Mata, J., Mourão, C., da Silveira, A. B., Martins, S., Ramalho, R., and Hoffmann, D. L.: Volcano–stratigraphic and structural evolution of Brava Island (Cape Verde) based on 40Ar/39Ar, U–Th and field constraints, J. Volcanol. Geoth. Res., 196, 219–235, https://doi.org/10.1016/j.jvolgeores.2010.07.010, 2010.
Mignan, A. and Woessner, J.: Estimating the magnitude of completeness for earthquake catalogs, Community Online Resource for Statistical Seismicity Analysis, https://doi.org/10.5078/corssa-00180805, 2012.
Moran, S. C., Newhall, C., and Roman, D. C.: Failed magmatic eruptions: late-stage cessation of magma ascent, Bull. Volcanol., 73, 115–122, https://doi.org/10.1007/s00445-010-0444-x, 2011.
Ramalho, R., Helffrich, G., Schmidt, D. N., and Vance, D.: Tracers of uplift and subsidence in the Cape Verde archipelago, J. Geol. Soc., 167, 519–538, https://doi.org/10.1144/0016-76492009-056, 2010a.
Ramalho, R., Helffrich, G., Cosca, M., Vance, D., Hoffmann, D., and Schmidt, D. N.: Vertical movements of ocean island volcanoes: insights from a stationary plate, Mar. Geol., 275, 84–95, https://doi.org/10.1016/j.margeo.2010.04.009, 2010b.
Richter, N., Favalli, M., de Zeeuw-van Dalfsen, E., Fornaciai, A., da Silva Fernandes, R. M., Pérez, N. M., Levy, J., Victória, S. S., and Walter, T. R.: Lava flow hazard at Fogo Volcano, Cabo Verde, before and after the 2014–2015 eruption, Nat. Hazards Earth Syst. Sci., 16, 1925–1951, https://doi.org/10.5194/nhess-16-1925-2016, 2016.
Roberts, N. S., Bell, A. F., and Main, I. G.: Are volcanic seismic b-values high, and if so when?, J. Volcanol. Geoth. Res., 308, 127–141, https://doi.org/10.1016/j.jvolgeores.2015.10.021, 2015.
Roman, D. C. and Cashman, K. V.: The origin of volano–tectonic earthquake swarms, Geology, 34, 457–460, https://doi.org/10.1130/G22269.1, 2006.
Ryan, W. B. F., Carbotte, S. M., Coplan, J. O., O'Hara, S., Melkonian, A., Arko, R., Weissel, R. A., Ferrini, V., Goodwillie, A., Nitsche, F., Bonczkowski, J., and Zemsky, R.: Global Multi–Resolution Topography synthesis, Geochem. Geophy. Geosy., 10, Q03014, https://doi.org/10.1029/2008GC002332, 2009.
Schweitzer, J., Fyen, J., Mykkeltveit, S., Gibbons, S. J., Pirli, M., Kühn, D., and Kværna, T.: Seismic Arrays, in: Bormann, P. (Ed.), New Manual of Seismological Observatory Practice 2 (NMSOP-2), Potsdam: Deutsches GeoForschungsZentrum GFZ, 1–80, https://doi.org/10.2312/GFZ.NMSOP-2_ch9, 2012.
Singh, M. and Rümpker, G.: Seismic gaps and intraplate seismicity around Rodrigues Ridge (Indian Ocean) from time-domain array analysis, Solid Earth Discuss., https://doi.org/10.5194/se-2020-56, in review, 2020.
Vales, D., Dias, N. A., Rio, I., Matias, L., Silveira, G., Madeira, J., Weber, M., Carrilho, F., and Haberland, C.: Intraplate seismicity across the Cape Verde swell: A contribution from a temporary seismic network, Tectonophysics, 636, 325–377, https://doi.org/10.1016/j.tecto.2014.09.014, 2014.
Wassermann, J.: Volcano Seismology, in: Bormann, P. (Ed.), New Manual of Seismological Observatory Practice 2 (NMSOP–2), Potsdam: Deutsches GeoForschungsZentrum GFZ, 1–77, https://doi.org/10.2312/GFZ.NMSOP-2_ch13, 2012.
Wiemer, S. and Wyss, M.: Minimum Magnitude of Completeness in Earthquake Catalogs: Examples from Alaska, the Western United States, and Japan, B. Seismol. Soc. Am., 90, 859–869, https://doi.org/10.1785/0119990114, 2000.
Wölbern, I., Rümpker, G., and Leva, C.: FOSA, GFZ Data Services, Other/Seismic Network, https://doi.org/10.14470/0Z7560909466, 2019.
Zobin, V. M.: Introduction to Volcanic Seismology, second edition, Elsevier, London, 2012.