the Creative Commons Attribution 4.0 License.
the Creative Commons Attribution 4.0 License.
 | 14 Dec 2020
Tailings-flow runout analysis: examining the applicability of a semi-physical area–volume relationship using a novel database
Negar Ghahramani
Andrew Mitchell
Nahyan M. Rana
Scott McDougall
Stephen G. Evans
W. Andy Take
Tailings flows result from the breach of tailings dams. Large-scale tailings flows can travel over substantial distances with high velocities and cause significant loss of life, environmental damage, and economic costs. Runout modelling and inundation mapping are critical components of risk assessment for tailings dams. In an attempt to develop consistency in reporting tailings data, we established a new tailings-flow runout classification system. Our data analysis applies to the zone corresponding to the extent of the main solid tailings deposit, which is characterized by visible or field-confirmed sedimentation, above typical surface water levels if extending into downstream water bodies. We introduced a new database of 33 tailings dam breaches by independently estimating the planimetric inundation area for each event using remote sensing data. This paper examines the applicability of a semi-physical area–volume relationship using the new database. Our results indicate that the equation A= cV2∕3, which has been used previously to characterize the mobility of other types of mass movements, is a statistically justifiable choice for the relationship between total released volume and planimetric inundation area. Our analysis suggests that, for a given volume, tailings flows are, on average, less mobile than lahars but more mobile than non-volcanic debris flows, rock avalanches, and waste dump failures.
- Article
(9751 KB) - Full-text XML
- BibTeX
- EndNote


Tailings dams are a critical piece of mining infrastructure (Blight, 2009). These dams retain mine tailings, a waste product of the mineral processing operations that includes finely ground rock and process water. Some of these wastes may be classified as hazardous material (Vick, 1990). When a tailings dam breach occurs, a destructive flow of mine tailings can develop (e.g. Macías et al., 2015). These flows may travel over substantial distances and impact large areas (Rico et al., 2008a). The ability to understand and predict the motion of flowing tailings is a crucial step in protecting people, infrastructure, and the environment from these events.
More than 350 tailings dam breaches have been recorded worldwide since the early twentieth century (Chambers and Bowker, 2019; International Commission on Large Dams (ICOLD, UNEP), 2001; Rico et al., 2008a; Santamarina et al., 2019; WISE, 2020) (Fig. 1). The records indicate that approximately one-third of these events led to loss of life and/or the release of more than 100 000 m3 of tailings and/or water (Chambers and Bowker, 2019). For example, the fluorite tailings dam at Stava, Italy, failed in 1985 and released a total volume of 185 000 m3 of muddy debris. As a result, the Stava and Tesero villages were destroyed and 243 people lost their lives (Chandler and Tosatti, 1995; Luino and De Graff, 2012; Pirulli et al., 2017; WISE, 2020). The 2014 Mount Polley tailings dam failure in British Columbia, Canada, resulted in the release of about 25 million cubic metres of water and tailings into Polley Lake, Hazeltine Creek, and Quesnel Lake. The tailings inundation area was estimated to be approximately 2.4 million square meters (Cuervo et al., 2017; Miller and Zapf-Gilje, 2016). The 2015 Fundão tailings dam failure in Brazil resulted in the release of about 35 million cubic metres of tailings materials. This event killed 19 people and caused long-lasting environmental damage to several water channels in the basin of the Doce River (Carmo et al., 2017; Hatje et al., 2017; WISE, 2020). More recently, another disastrous tailings dam breach occurred at the Feijão mine near Brumadinho, Brazil, on 25 January 2019. Almost 12 million cubic metres of tailings left the impoundment and the resulting tailings flow travelled for almost 9 km and inundated an area of approximately 3.0 million square meters before reaching the river Paraopeba (WISE, 2020); 259 people were reported killed, and 11 were reported missing as a result of this failure (WISE, 2020). All of these events also resulted in substantial financial losses for the mine operators and investors.
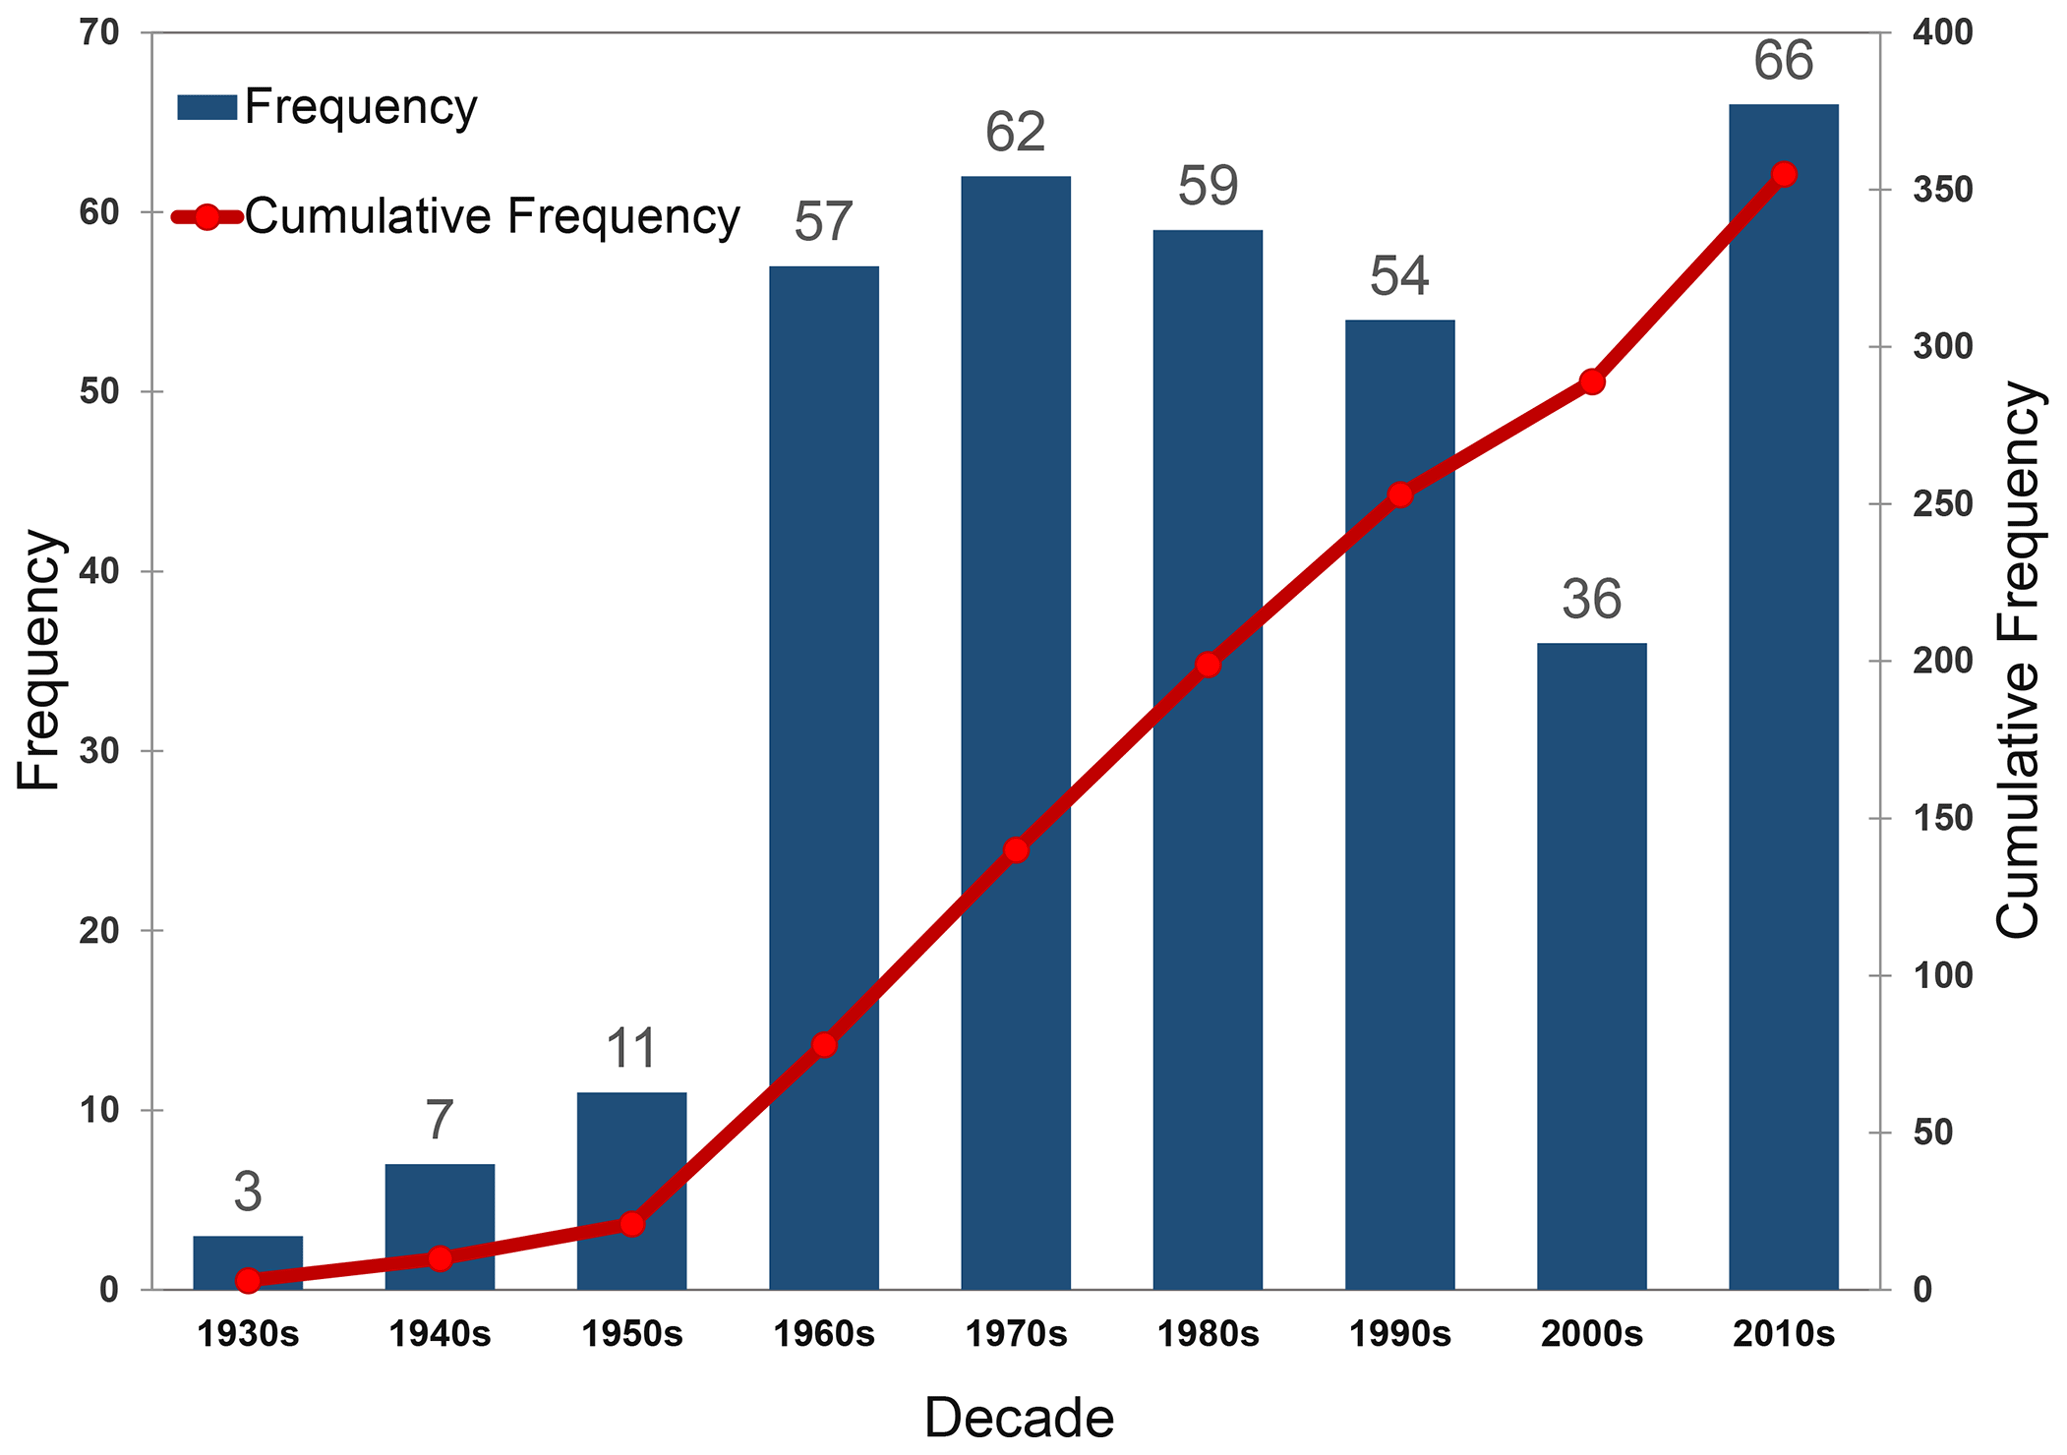
Figure 1Decadal frequency and cumulative frequency of tailings dam breaches worldwide (n= 355) between 1930 and 2019. Sources: Chambers and Bowker (2019), ICOLD, UNEP (2001), and WISE (2020).
Tailings dam breach runout analysis studies the behaviour of tailings flows. The term “tailings flow” refers to various forms of tailings outflow movement resulting from the breach of a tailings dam. This may include a partial or a total release of the stored tailings and associated water (Blight, 2009; Rico et al., 2008a, b; Villavicencio et al., 2014). Tailings flows exhibit different characteristics depending on various factors, including sediment concentration, the presence of surface water, embankment configuration, failure mechanism, liquefaction potential, and downstream topography (Martin et al., 2019; Small et al., 2017). Tailings flows can take various forms, ranging from a massive debris flood consisting of water and sediment to a flowslide (Hungr et al., 2014). These flows can travel long distances at extremely rapid velocities (> 5 m s−1) (Blight, 1997; Blight et al., 1981; Harder and Stewart, 1996; Jeyapalan et al., 1983a, b; Kossoff et al., 2014; Macías et al., 2015; Rico et al., 2008a). Runout modelling and inundation mapping of tailings dam breaches are essential steps for estimating the potential consequences of a tailings dam failure, determining appropriately stringent design criteria and developing emergency response and preparedness plans (Canadian Dam Association (CDA), 2014; Knight Piésold Ltd., 2014; Martin et al., 2015, 2019; McDougall, 2017). In recent years, there has been an increase in the study of the consequences of tailings dam breaches following several major disasters worldwide (Roche et al., 2017; Santamarina et al., 2019; Schoenberger, 2016). However, much uncertainty still exists in this field. The number of available empirical–statistical runout models is limited (Sect. 2). Most of the commonly used numerical models were developed primarily for either clear water flood analysis (Brunner, 2016; Danish Hydraulic Institute (DHI), 2007; Martin et al., 2019) or the analysis of flow-like landslides (McDougall, 2017; McDougall and Hungr, 2004; Pastor et al., 2002; Pirulli et al., 2017) and do not necessarily account for the compositional variety of tailings and its potential influence on the downstream flow behaviour (Dibike et al., 2018; Macías et al., 2015; Pirulli et al., 2017). Due to these limitations, hazard maps delimiting potential inundation areas based on current techniques may not reliably characterize the extent and intensity (e.g. flow depth and velocity) of possible tailings dam breach scenarios.
The purpose of this paper is to (i) introduce a runout zone classification method in an attempt to develop consistency in reporting runout distances and inundation areas of tailings flows, (ii) introduce a new database of 33 tailings dam breaches where released volume was reported and the planimetric inundation areas were quantitatively measured for all of the events, (iii) examine the applicability of a semi-physical area–volume relationship for tailings-flow cases to help characterize the mobility and potential impacts of these types of failures, and (iv) investigate the effects of additional attributes of the tailings and downstream topography, such as tailings mine types and confinement of travel path, which could potentially be used to refine these empirical–statistical relationships. The present work builds on previous work described in Ghahramani et al. (2019).
2.1 Empirical runout studies for tailings dam breaches
Empirical runout analysis of tailings dam breaches is a relatively new research topic. Rico et al. (2008a) proposed a set of empirical correlations that relates tailings-flow characteristics (e.g. released volume and runout distance) to the geometric characteristics of tailings dams (e.g. dam height and total impoundment volume). A database of 28 tailings dam breaches (from 1965 to 2000) containing information on released volume and runout distance was used in their study (Rico et al., 2008a).
Rico et al. (2008a) found positive correlations between (i) the total volume of the tailings in the impoundment at the time of failure and the released tailings volume and (ii) the released tailings volume and the tailings runout distance. The released tailings volumes in their work were extracted from existing databases and publications with no information on the distinction between the volume of released solid tailings, interstitial (pore) water, and surface (free) water. A parameter referred to as the “dam factor” (the product of the dam height and released tailings volume, H×VF) was used to improve the correlations in their study. This parameter was originally developed by Hagen and the Committee on the Safety of Existing Dams for the peak discharge estimation of water dam breaks (Committee on the Safety of Existing Dams, 1983; Costa, 1985; Hagen, 1982). The related equations by Rico et al. (2008a) are provided in Table 1.
The Tailings Dam Breach Working Group (WG) of the Canadian Dam Association (CDA) Mining Dam Committee compiled a tailings dam breach database that includes the 28 cases presented by Rico et al. (2008a), plus 51 additional cases (Small et al., 2017). Their study discussed the limited information provided in the Rico et al. (2008a) database and listed additional factors that could influence the behaviour of tailings flows. The WG proposed a four-element classification matrix based on two main factors: (i) the presence of free standing water in close proximity to the breach and (ii) tailings liquefaction potential. The empirical relationships of Rico et al. (2008a) were re-examined based on the proposed classification (Small et al., 2017).
Larrauri and Lall (2018) updated the database presented in Rico et al. (2008a) and reexamined their empirical correlations. They introduced a new predictor, called Hf, which is defined as H× (, where VT is the total volume of the tailings impoundment and VF is the total released volume. Using the updated database, they concluded that the relationship between Hf and runout distance has a stronger correlation (R2= 0.53, Table 1) than the relationship between dam factor and runout distance (R2= 0.44) (Larrauri and Lall, 2018). However, arguably both correlations are fairly weak, and the physical basis of the Hf factor was not discussed in their study. Rico et al. (2008a) and Larrauri and Lall (2018) both noted that uncertainties in their databases suggest that the results need to be treated with caution.
Table 1Empirical relationships proposed by others for the runout analysis of tailings dam breaches.
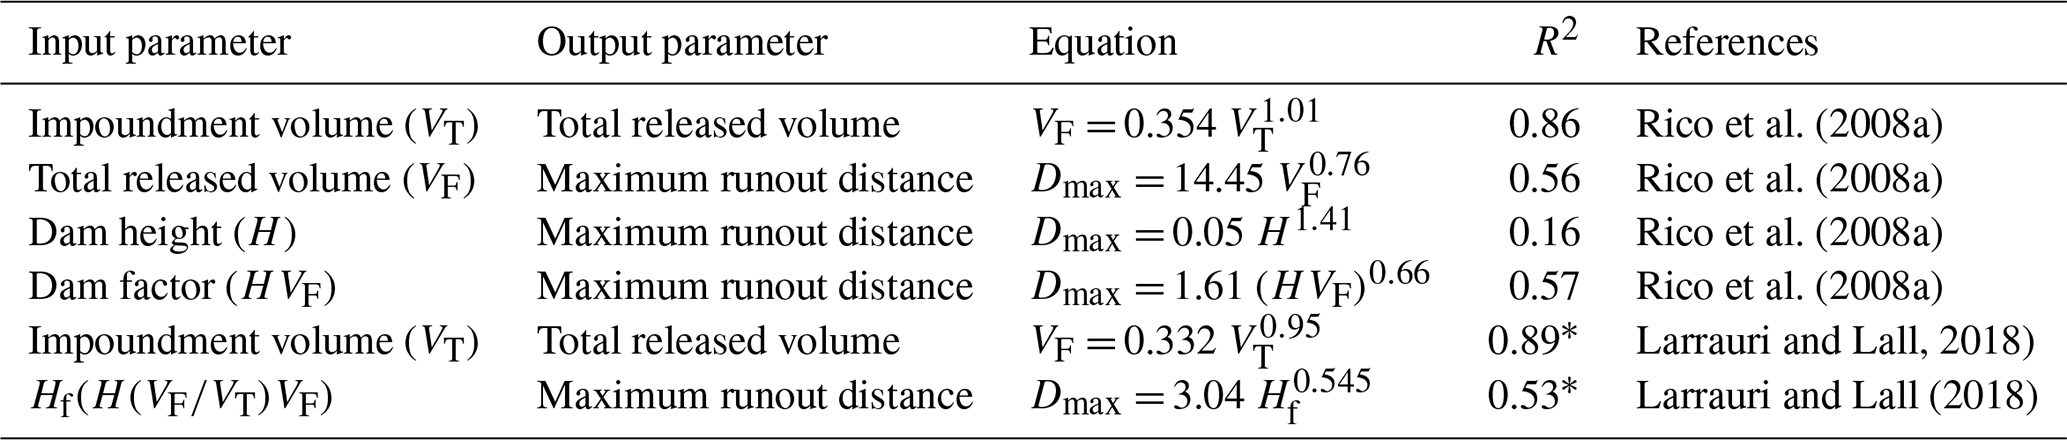
* These values were calculated using a different database from Rico et et al. (2008a). In all the relationships, VT and VF are in millions of cubic metres, H is in metres, and Dmax is in kilometres.
2.2 Empirical runout relationships – area and volume
Several authors have investigated the relationship between inundation or deposit area (A) and flow volume (V) for different types of flow-type landslides (e.g. Berti and Simoni, 2007; Davies, 1982; Delaney and Evans, 2014; Golder Associates Ltd., 1995; Griswold and Iverson, 2008; Hungr, 1981; Hungr and Evans, 1993; Iverson et al., 1998; Li, 1983; Simoni et al., 2011) (Table 2). Li (1983) presented an empirical relationship between rock avalanche deposit area and volume for 76 major European rock avalanches. The deposit area and volume were logarithmically transformed to apply a linear least-squares regression analysis (Li, 1983). Hungr and Evans (1993) applied a similar methodology to a different dataset of rock avalanches. However, they made an assumption that the deposits at various scales retain a similar geometry, which resulted in the following scaling relation for the area–volume relationship:
where A is the inundation area, V is the total flow volume, and c is a constant related to flow mobility (Hungr and Evans, 1993) (i.e. for a given event volume, a higher mobility flow results in a higher planimetric inundation area). Golder Associates Ltd. (1995) derived an area–volume relationship for mine waste dump failures using a database of 22 cases. Iverson et al. (1998) presented similar area–volume relationships as in Hungr and Evans (1993) for lahars (Table 2). Statistical analysis of a dataset containing 27 lahars was used to calibrate and test the validity of those equations (Iverson et al., 1998). Berti and Simoni (2007) and Griswold and Iverson (2008) extended the same methodology to non-volcanic debris flows. Griswold and Iverson (2008) also substantially expanded the database of rock avalanches and found a slightly different correlation than Hungr and Evans (1993) (Table 2).
Table 2Selected empirical relationships between volume and inundation area proposed by others for various landslide types.
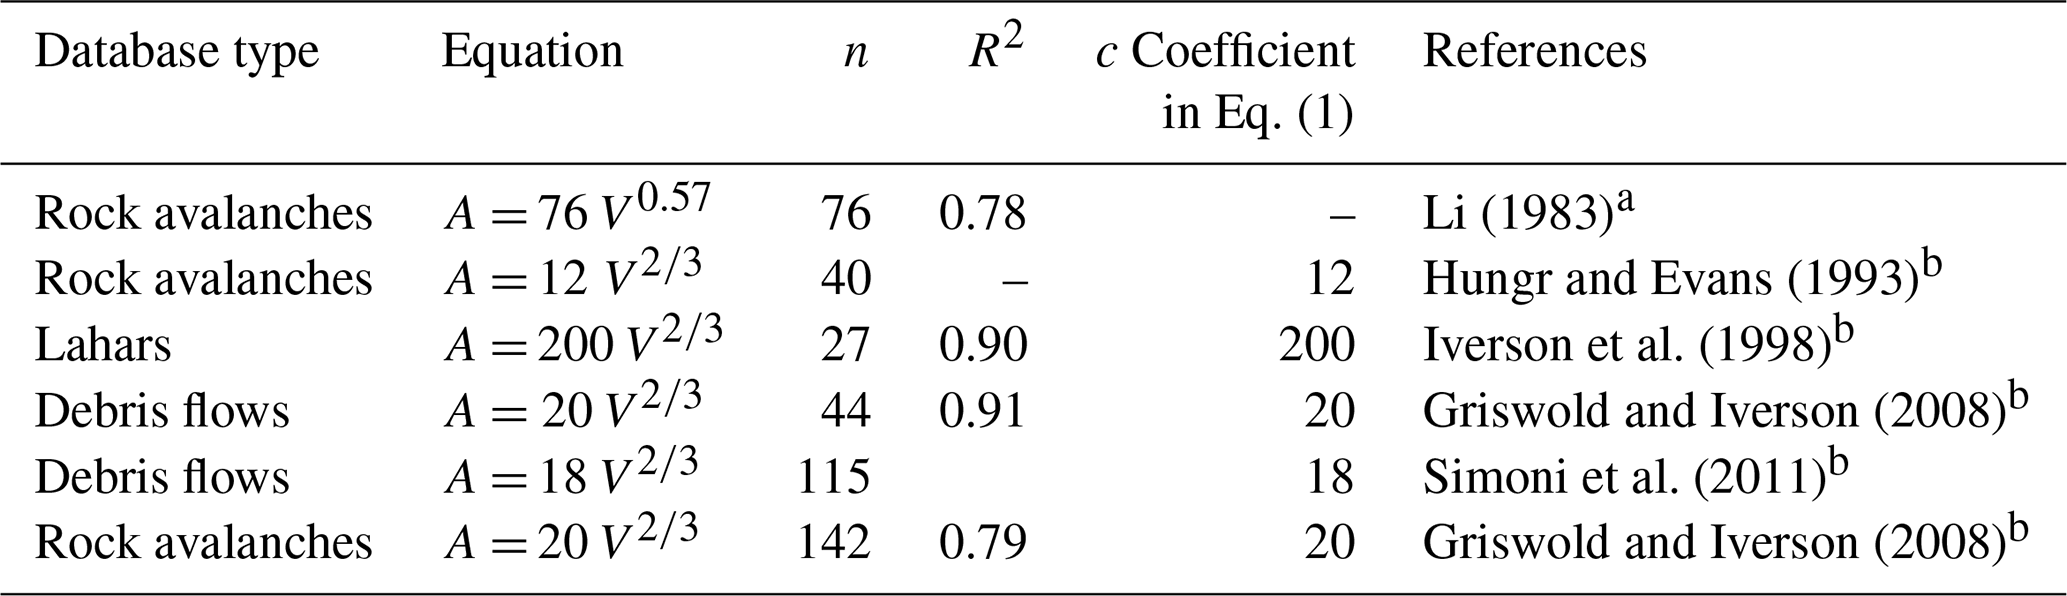
a The original equation from Li (1983) is presented in power-law format to facilitate comparison. b A and V are planimetric area and flow volume, respectively (A is in square metres and V is in cubic metres).
3.1 Dataset compilation
Tailings dam breaches have been recorded since the beginning of the twentieth century (Chambers and Bowker, 2019; ICOLD, UNEP, 2001). Several compilations and summaries of the characteristics of significant tailings dam breaches can be found in the literature (Chambers and Bowker, 2019; ICOLD, UNEP, 2001; Small et al., 2017; WISE, 2020). These summaries contain key information about the events, such as dates, causes and triggers of failure, dam heights and construction methods, and the volumes of released and impounded tailings. However, most of the records lack consistency in the reported data related to runout, including information related to factors that may better characterize tailings flows, due to the lack of a systematic methodology in reporting. In the present study, we first compiled available information for 71 tailings dam breaches and then assessed the runout characteristics of each case individually. Data sources included existing literature on individual tailings dam breach events, existing databases, and remote sensing data obtained from satellite images or aerial photos.
We classified the inundation areas into two zones (Fig. 2). Zone 1 is the primary impact zone, defined as the extent of the main solid tailings deposit, which is characterized by remotely visible or field-confirmed sedimentation, above typical bankfull elevations if extending into downstream river channels. Zone 2 is the secondary impact zone, defined as the area downstream of Zone 1 that is further impacted by the tailings flow in some form. Secondary impacts may include flood or displacement wave impacts (i.e. fluid impacts above typical downstream water levels) and sediment plume impacts (i.e. below typical downstream water levels).
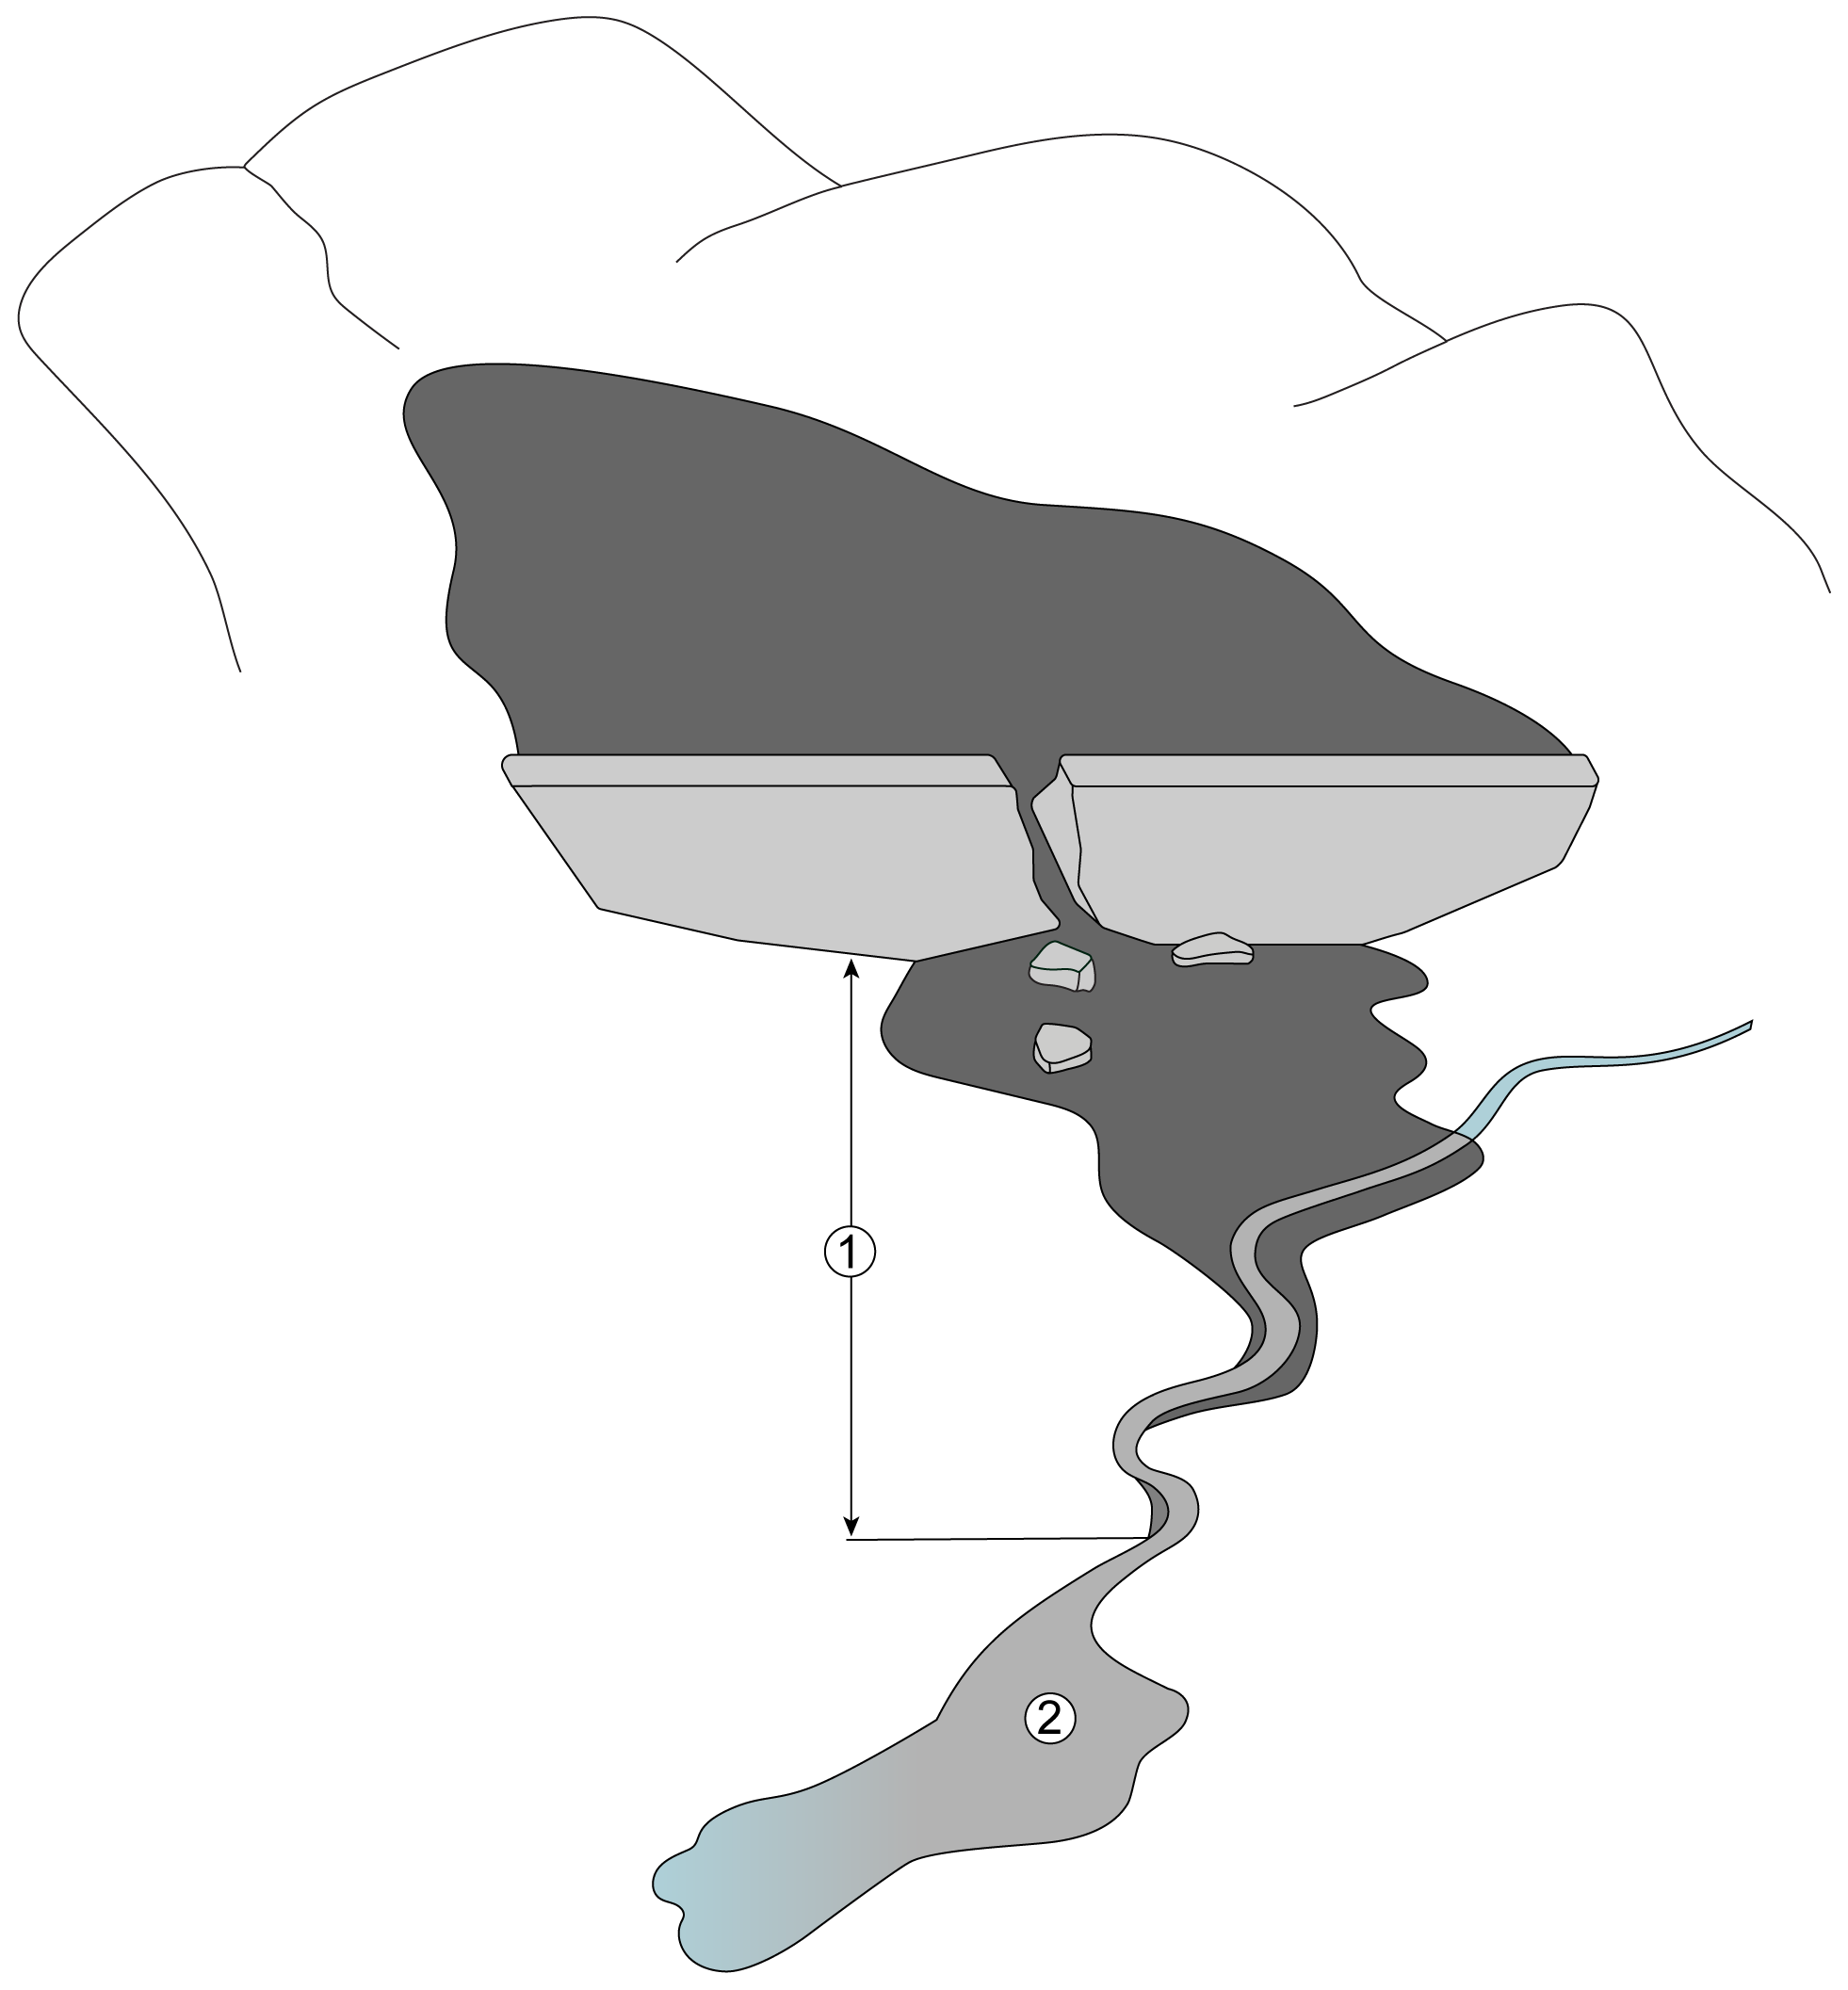
Figure 2An idealized representation of a tailings dam breach showing the two runout limit classifications. Zone 1 represents the primary impact zone, defined as the extent of the main solid tailings deposit, which is characterized by remotely visible or field-confirmed sedimentation, above typical water levels if extending into downstream streams. Zone 2 is the secondary impact zone, defined as the area downstream of Zone 1 that is still impacted by the tailings flow in some form and includes the distal limit of the flow.
Figure 3 shows a flowchart that summarizes our data compilation methodology, including the screening of data sources, the impact zone classification, the delineation of Zone 1, and the estimation of uncertainty due to image resolution. The extent of Zone 2 is typically more challenging to estimate than the extent of Zone 1, due to the variability of downstream flow mixing conditions, the relatively transient nature of secondary impacts, and the inherent limitations (e.g. image resolution) of the remote detection methods used. The focus of this study was therefore on Zone 1.
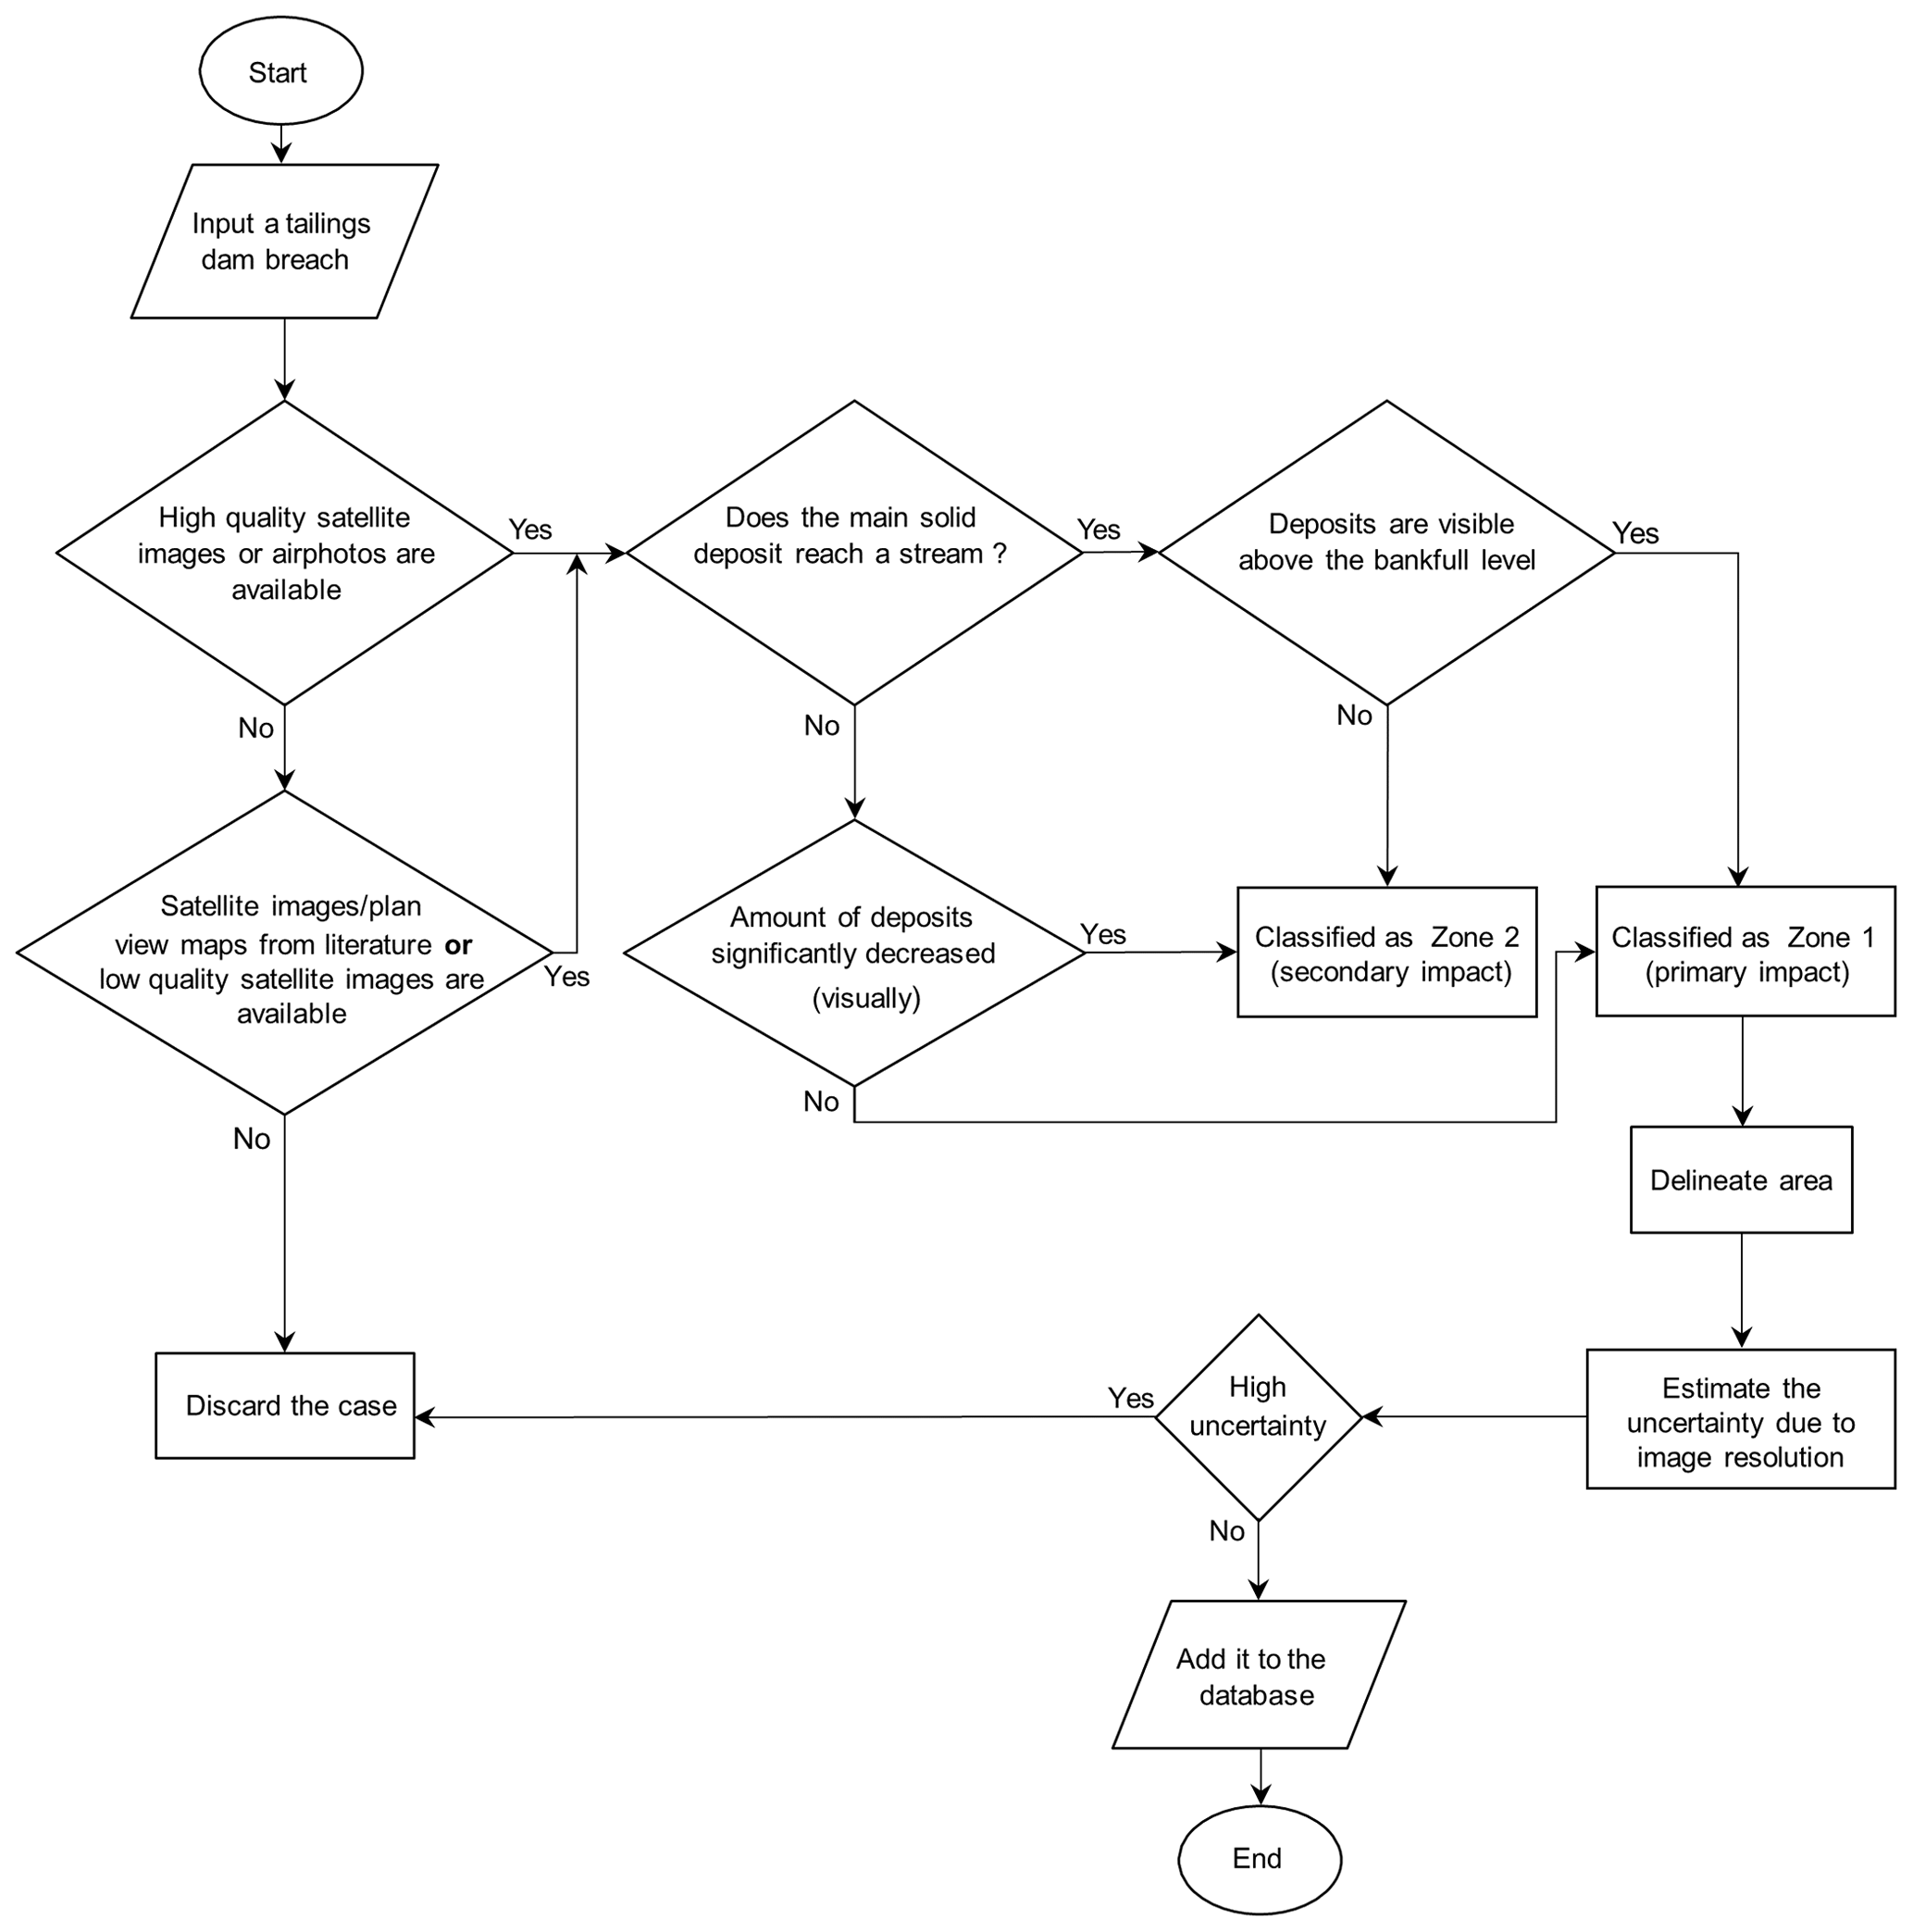
Figure 3Schematic representation of the methodology applied to obtain data for tailings-flows inundation area.
Applying our methodology to the preliminary database comprising 71 tailings dam breaches resulted in 33 cases for which we were able to obtain satisfactory imagery and independently estimate runout distance and planimetric inundation area (Table 3). Figures 4 and 5 illustrate two examples of delineating the extent of Zones 1 and 2 for the tailings dam breaches at the Feijão mine near Brumadinho, Brazil, 2019, and the Cieneguita mine in Mexico, 2018, respectively. The primary impact zone for Feijão (red dashed polygon in Fig. 4) was established through a detailed comparison of pre-event and post-event PlanetScope (3 m) imagery. After entering the Paraopeba River, the Feijão tailings flow exhibited no visible sedimentation above the bankfull level (blue dashed line in Fig. 4) and the channel width stayed the same. However, we observed changes in water colour for over 100 km downriver, which we interpret to represent the secondary impact zone (Zone 2). A similar methodology was applied for the Cieneguita mine tailings dam breach on 4 June 2018 in Mexico, for which the runout distance was reported to be between 26 and 29 km (Chambers and Bowker, 2019; WISE, 2020). Based on our methodology, the transition between Zone 1 and Zone 2 occurs where the extent of the tailings deposits significantly decreased. Normalized difference vegetation index (NDVI) change detection analysis (Fig. 5 inset a) was used to help identify the tailings deposits. The estimated Zone 1 runout distance was approximately 15 km.

Figure 4Aerial view of the tailings dam breach at the Feijão mine near Brumadinho, Brazil, 25 January 2019. Zone 1 is shown in the red dashed polygon. The portion of Zone 2 that is visible in this image is shown in the blue dashed polygon. Image courtesy of Planet Labs, Inc. (29 January 2019).
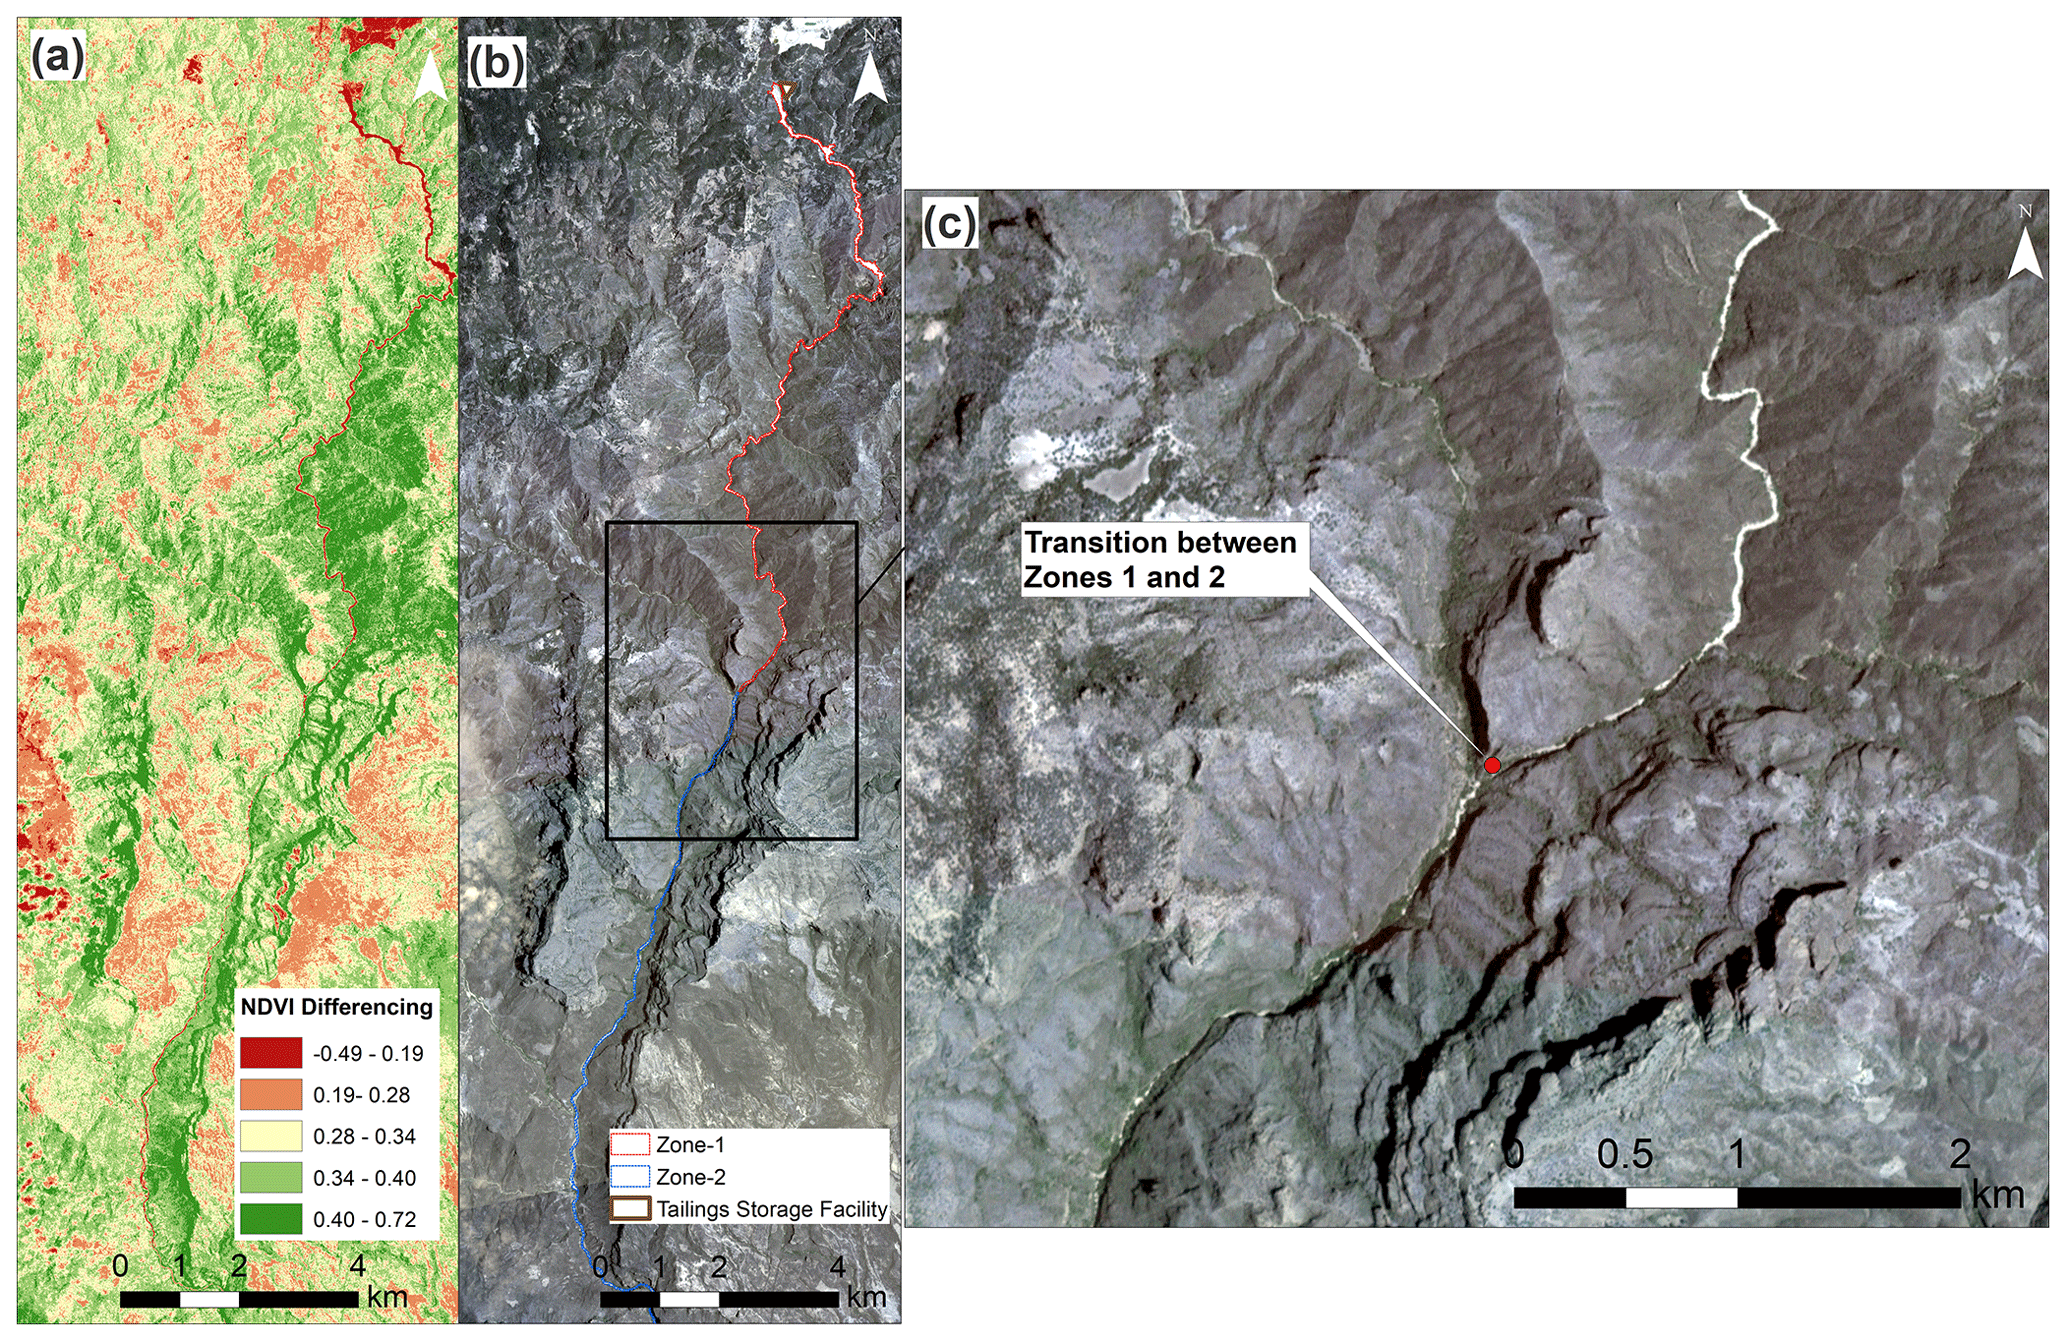
Figure 5Aerial views of the tailings dam breach at the Cieneguita mine in Mexico, 4 June 2018. The NDVI differencing change detection technique was used to help delineate Zones 1 and 2 inundation areas (a). Zones 1 and 2 are shown in the red and blue dashed polygons, respectively (b). The inset image (c) shows the transition between Zones 1 and 2 (red dot). Image courtesy of Planet Labs, Inc. (12 June 2018).
Compared with the hundreds of tailings dam breach cases listed in previous databases (Chambers and Bowker, 2019; ICOLD, UNEP, 2001; Rico et al., 2008a; Small et al., 2017), the relatively limited number of cases (33) in our new database reflects the limited availability of suitable imagery, especially for older cases that predate satellite imagery. We used a simple approach to quantitatively estimate the uncertainty due to limitations in image resolution in our area measurements based on the pixel sizes of the images. The maximum percentage uncertainty due to image resolution was considered to be equal to the ratio of the total area of the pixels intersected by the perimeter of Zone 1 to the inundation area multiplied by 100. Our database contains information on the percentage uncertainty of each case (Table 3).
Additional key attributes are included in our database (Table 3). We classified our cases using the four-element classification matrix in Small et al. (2017), described above. We also used the following two categories proposed by Golder Associates Ltd. (1995) to classify the confinement of the travel path: (i) confined, in which the flow path is constrained by relatively steep side slopes of a gully or valley, and (ii) unconfined, in which the flow path is on an open slope or relatively flat surface and the topography permits spreading of the tailings flow from an early stage. Similarly, to classify the tailings mine type, we used the following two categories introduced by Small et al. (2017): (i) hard-rock mine tailings, which includes lead–zinc, copper, gold–silver, molybdenum, nickel from sulfide deposits, and uranium, and (ii) soft-rock mine tailings, which includes coal, potash, fluorite, gypsum, and aluminum (Bussière, 2007; Small et al., 2017; Vick, 1990).
The dam height and total released volume data were collected from existing databases and publications. We also included information on the volume of free water released, if available. However, for the empirical analysis, only the total reported released tailings volume was considered. We note that there is limited information available on how the reported released volumes within the existing databases were obtained (including the distinction between the volume of released solid tailings, interstitial water, and surface water).
Table 3Database of 33 tailings dam breaches (tailings flows) containing independently estimated measurements of Zone 1 runout distance and planimetric inundation area.
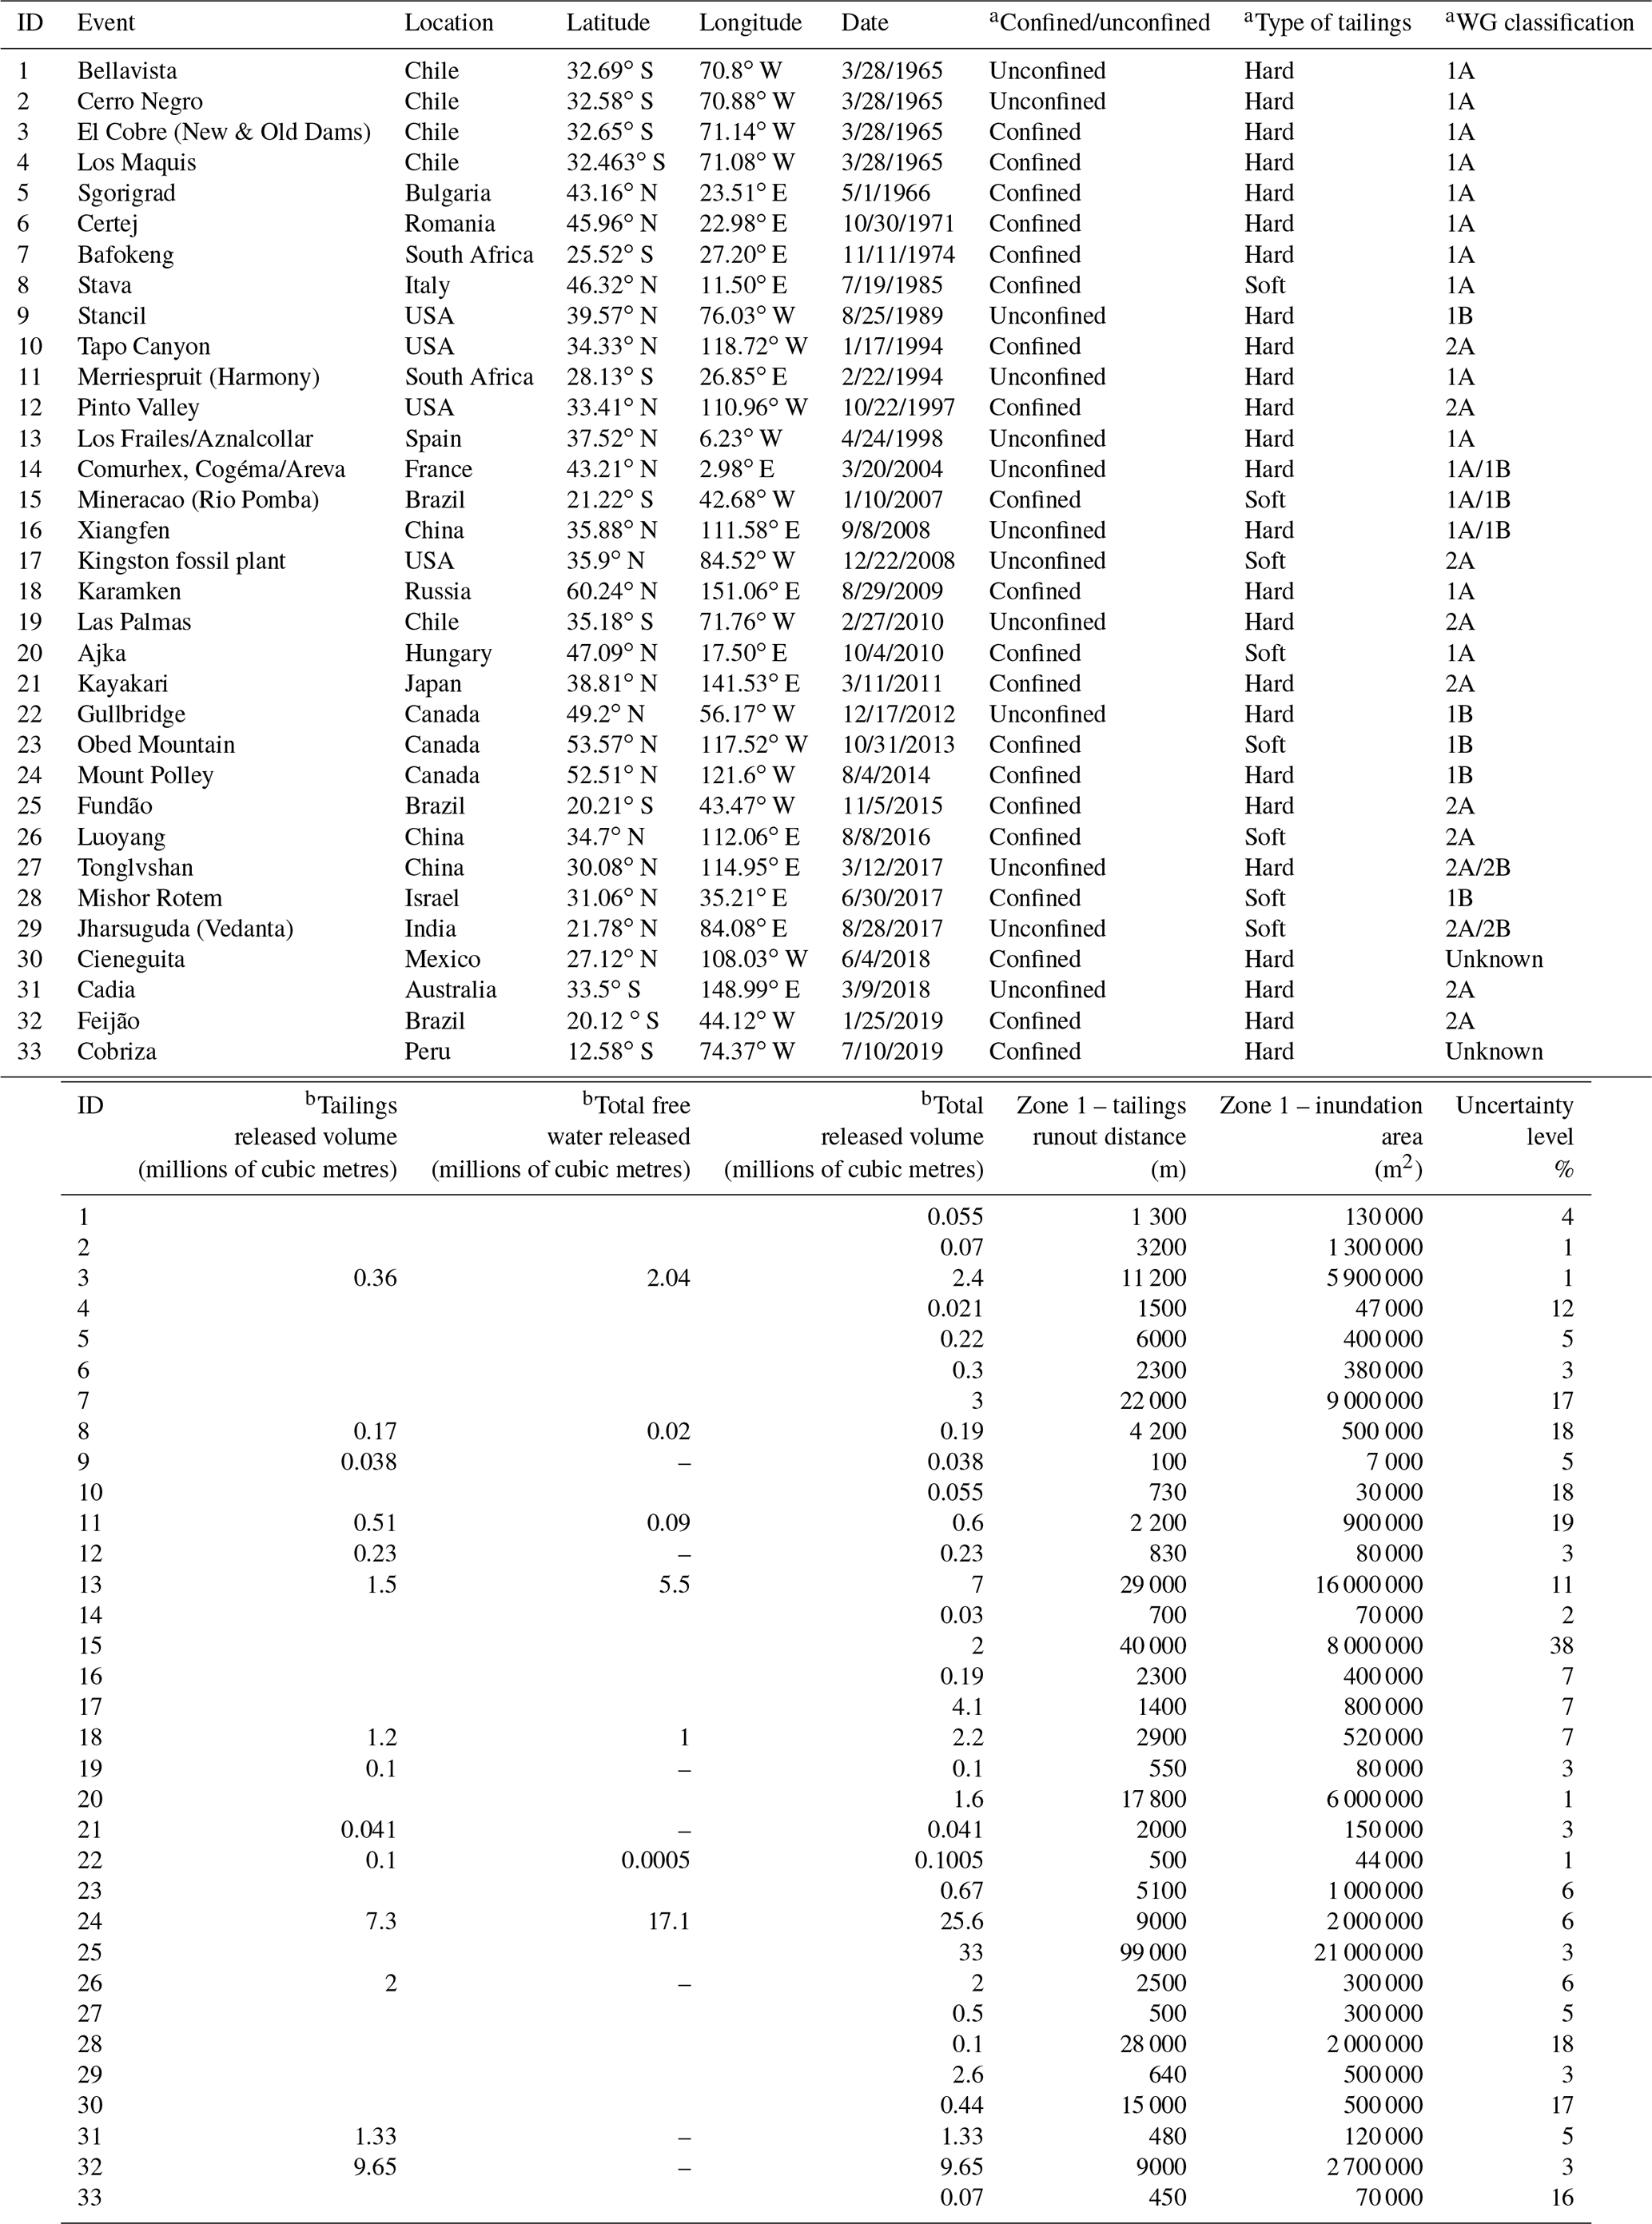
a The procedures used to classify the cases based on path confinement and tailings type and WG classification matrix can be found in Sect. 3.1. b Information on released volumes was collected from other databases (tailings released volume is the released volume of solids and interstitial water; free water released volume is the released volume of surface water).
3.2 Statistical analysis
3.2.1 Volume dependency of Zone 1 inundation area
In this study, the scaling relationship adopted in previous studies (Davies, 1982; Golder Associates Ltd., 1995; Griswold and Iverson, 2008; Hungr and Evans, 1993; Iverson et al., 1998; Li, 1983) was applied to the new tailings-flow database. The analysis relates the estimated Zone 1 inundation area (dependent variable) to the reported total released volume (independent variable) in Table 3. A simplifying assumption was made that the released volume approximately matches the volume deposited downstream in Zone 1 (i.e. the potential contribution of entrainment and erosion to the total volume of the deposited material was not considered).
We used our tailings dam breach database (n= 33) to fit a regression model and examine the applicability of Eq. (1) for tailings flows. We transformed the data into a log-log scale and applied the standard least-squares linear regression method. A linear regression model was fit to the data using a specified two-thirds slope and was compared to the standard least-squares linear regression. The uncertainty in the tailings release volume estimates is not considered for this analysis.
3.2.2 Effect of other factors on Zone 1 inundation area
Exploratory analyses were completed to investigate the effects of qualitative factors, such as the tailings mine type and travel path topographic confinement, on the area–volume relationship. This analysis was achieved by creating box plots of the regression residuals and colour-coding the data points in the area–volume plot to visually assess whether there were trends that could potentially be incorporated into the regression analysis to reduce the uncertainty.
Figure 6 shows the log-linear regression line for Zone 1 inundation area as a function of total released volume with the 95 % confidence interval of the best-fit regression line. Please note that the 95 % confidence intervals account for the uncertainty of the regression line and not the individual observations. The regression with a specified two-thirds slope (i.e. based on Eq. 1) plots within the 95 % confidence interval of the best-fit regression, supporting the hypothesis that this scaling relationship is valid for the tailings breach data. Table 4 compares the output from the regression analysis for the best-fit and the specified two-thirds slope regression models. The following regression equation was obtained in power-law form for the specified two-thirds slope regression model:
where VR (m3) is the total released volume and A (m2) is the planimetric inundation area.
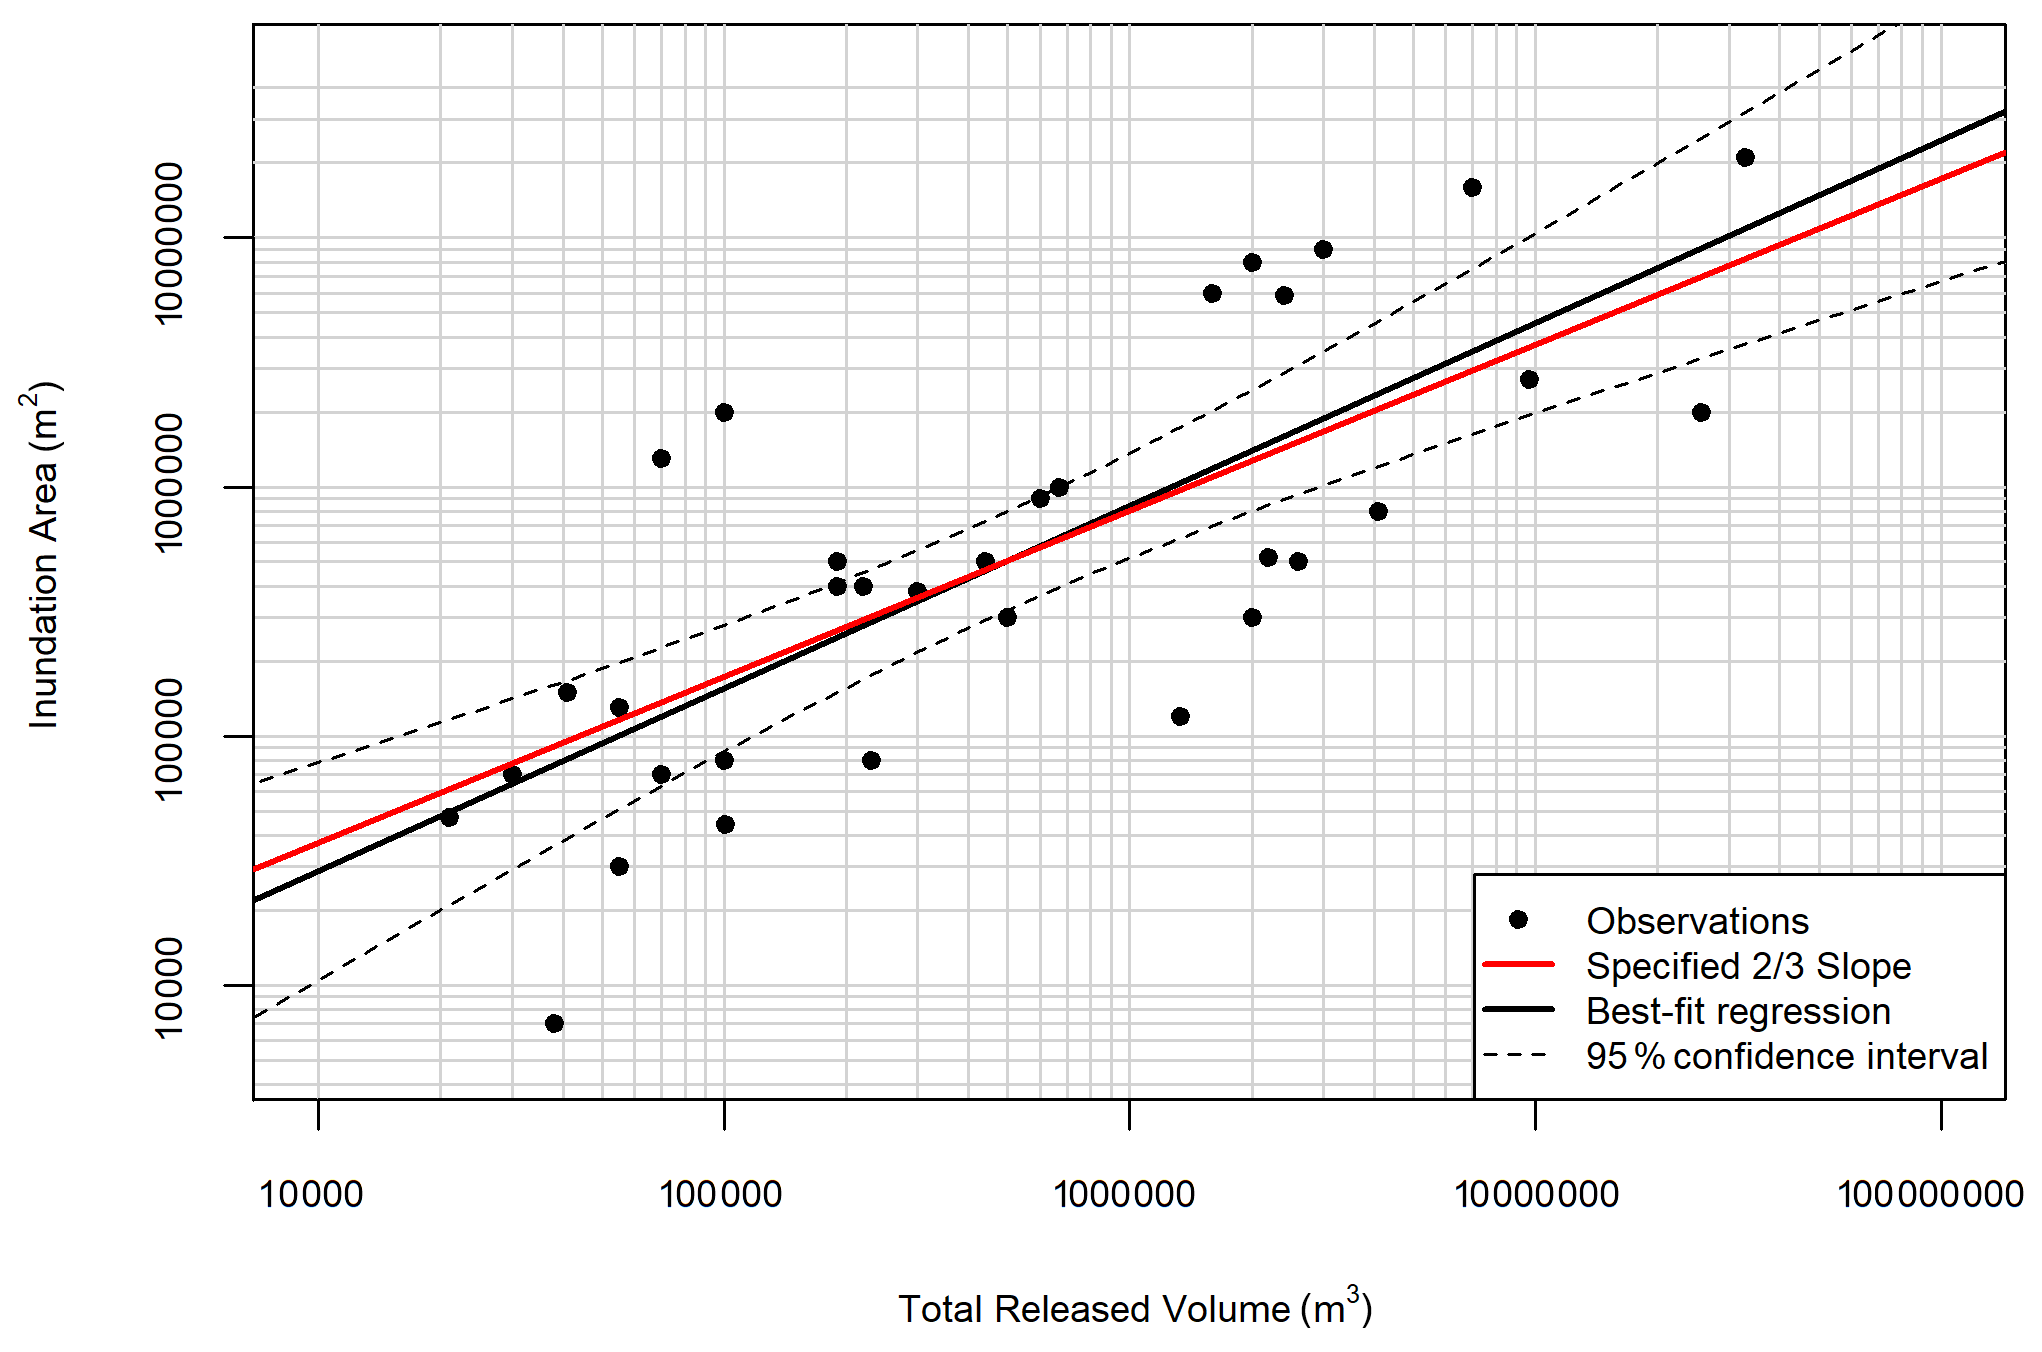
Figure 6Log-log scatter plot of planimetric Zone 1 inundation area versus total released volume for 33 tailings-flow cases (Table 3). The specified two-thirds slope regression line (in red) is fitted to the data. The best-fit regression line (in black) and the 95 % confidence intervals (dashed lines) of the best-fit regression are plotted for comparison.
Table 4Statistical results of the regression analysis for the best-fit and specified two-thirds slope models. n/a stands for not applicable.
The power-law form of the equation: A=(β)Vα. The linear form of the equation in log-log scale: Log(A) =α Log(V) + Log(β). For , β=c coefficient in Eq. (1).
The residuals (i.e. observed inundation area minus predicted inundation area) of the regression line with a specified two-thirds slope were analyzed to investigate whether the variation could be explained through qualitative descriptions of the tailings type or confinement of the tailings runout path. This analysis was completed by plotting the distribution of the regression residuals as a box plot, where the lowest bar is the minimum of the residual distribution, the lower box represents the first quartile to the median residual, the upper box is from the median to the third quartile, and the upper bar is the maximum of the residual distribution. If the distributions show stratification (e.g. one distribution has all four quartiles that are lower than the quartiles for a second predictor), it is an indication that there is a consistent difference in behaviour based on the descriptive predictors.
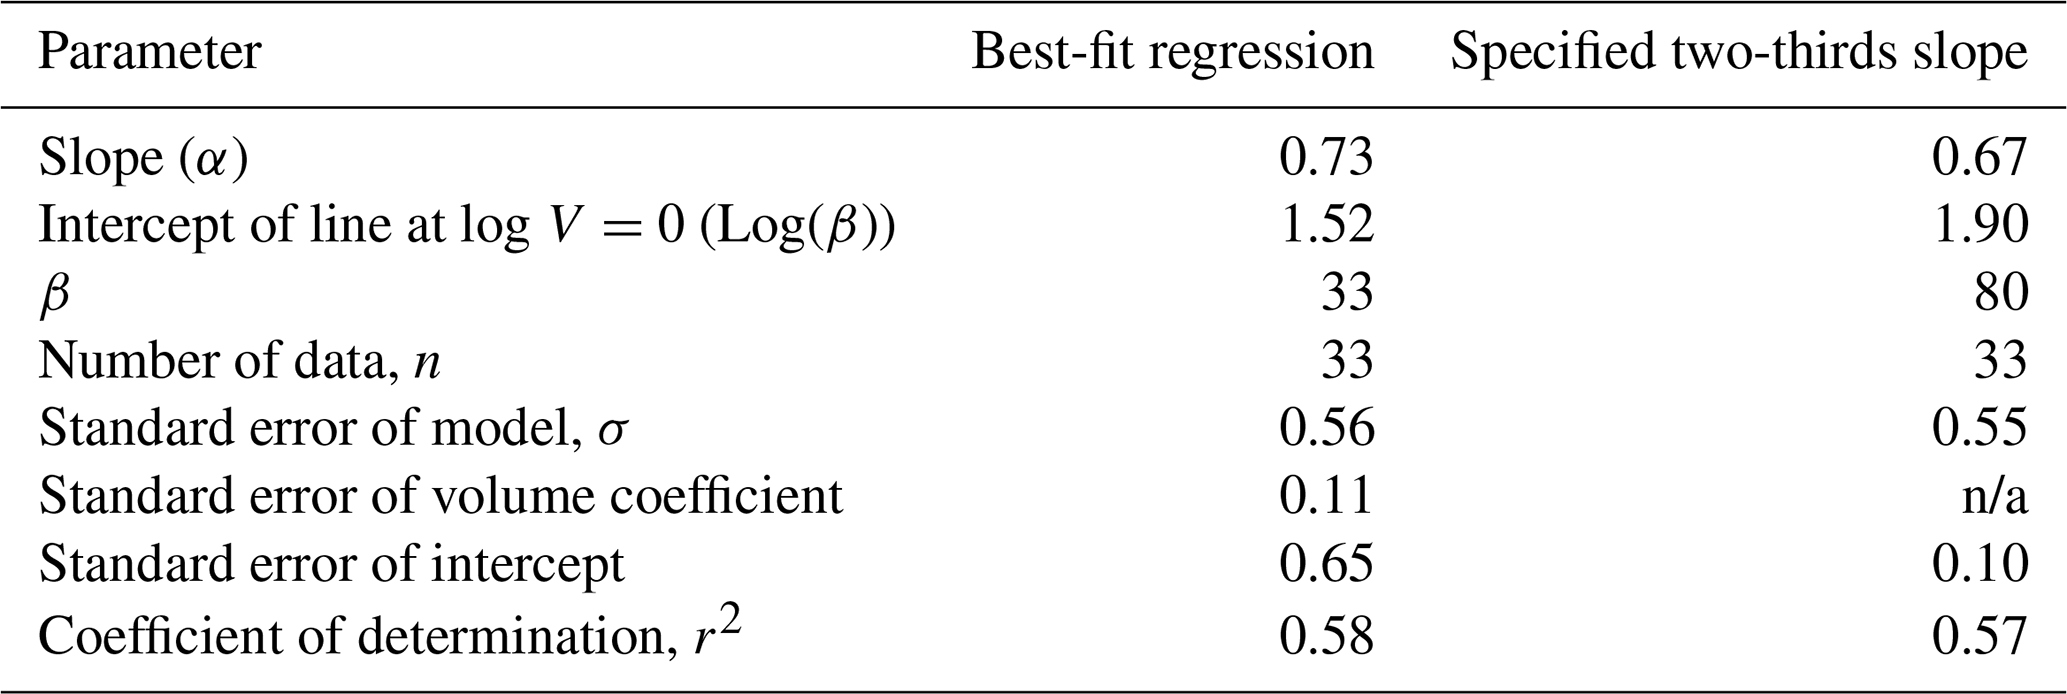
Figure 7a shows that, for a given volume, the inundation area for unconfined flow paths tends to be smaller than that for confined flow paths. Similarly, Fig. 7b shows that, for a given volume, the inundation area for hard-rock mine tailings tends to be smaller than that for soft-rock mine tailings. While these differences in the mean or median values can also be observed in the respective box plots, the regression residuals are not strongly stratified overall. These qualitative factors were used as indicator variables to fit new regression models, but the associations were found to be too weak for application.
Figure 7Colour-coded data points with respect to path confinement (a) and tailings type (b). The solid black line is the specified two-thirds regression line. The insets show the box plots of the area–volume residuals for the bivariate regression line with a specified two-thirds slope.
The results listed in Table 4 indicate that Eq. (1) is a statistically justifiable expression for the relationship between total released volume and planimetric Zone 1 inundation area, with coefficients of determination of 0.65 and 0.64 for the best-fit and the two-thirds slope regressions, respectively. Furthermore, the specified two-thirds slope line falls within the 95 % confidence interval curves for the best-fit regression, suggesting that the scaling relationship adopted by previous studies to characterize the geometry of other types of mass movements is also valid for tailings flows. An analysis of the residuals from the regression grouped by tailings type and flow path confinement indicates that these factors have an effect on the mobility (i.e. the extent of planimetric inundation area for a given volume) of tailings flows; soft-rock mine tailings tend to have greater mobility than hard-rock mine tailings, and confined flow paths tend to enhance mobility relative to unconfined paths; however, the data are not stratified enough to incorporate these factors into the regression analysis yet.
Figure 8 shows Zone 1 inundation area as a function of total released volume with the specified two-thirds regression line and its 95 % prediction intervals, which account for the uncertainty of the individual data points. The difference between the lower and upper 95 % prediction intervals reflects the variability of tailings flows and the considerable uncertainties in the prediction of inundation area using this approach. Nonetheless, the prediction range that is achievable with this method is useful for first-order (screening level) risk assessment purposes, ideally within a probabilistic framework that acknowledges the level of uncertainty. This method is also useful for cross-checking numerical dam breach modelling results (i.e. to confirm that the simulated inundation area falls within a reasonable range relative to the cases included in this database). Note that, while the method is able to provide independent estimates of inundation area, it must be combined with other empirical and/or numerical methods that estimate cross-sectional area and runout distance in order to determine an appropriate spatial distribution of the estimated area, similar to the approaches that have been used for other hazard types, such as Iverson et al. (1998) and Mitchell et al. (2020). Further study is currently underway to estimate the cross-sectional area for tailings flows and incorporate both volume–planimetric and cross-sectional area relationships in a GIS-based empirical model (Innis et al., 2020). Regardless of the approach used, significant professional judgement must be applied in interpreting the empirical results.
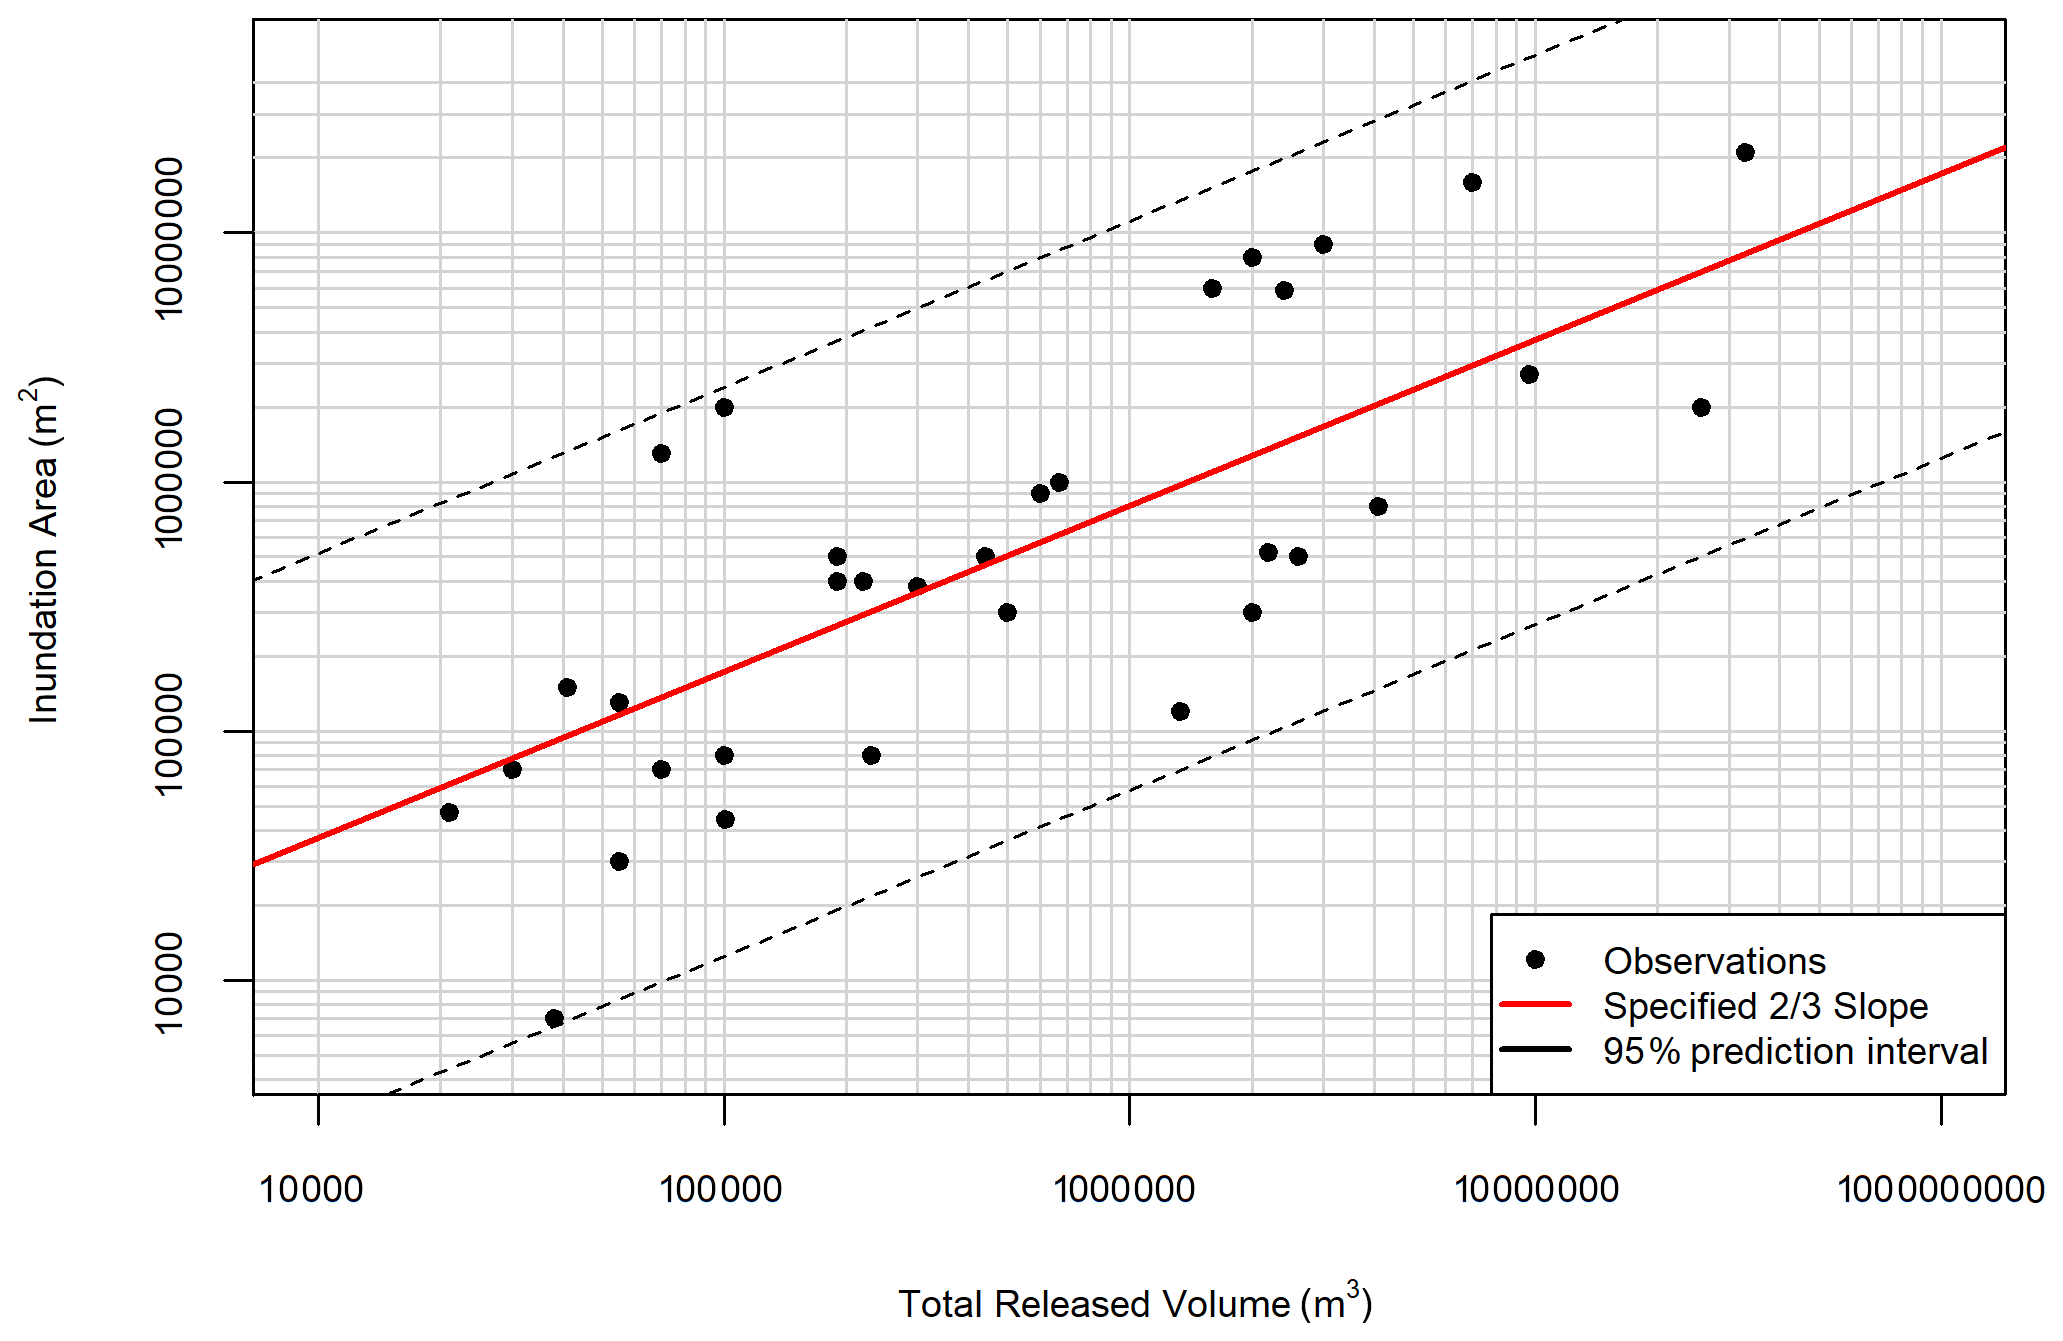
Figure 8Log-log scatter plot of planimetric Zone 1 inundation area versus total released volume for the 33 tailings-flow cases. The specified two-thirds slope regression line (in red) is fitted to the data, and the 95 % prediction intervals (dashed lines) of this regression line are also plotted.
Figure 9 shows the area–volume scatter plot of tailings flows alongside previously published data for lahars (Iverson et al., 1998), debris flows, rock avalanches (Griswold and Iverson, 2008), and mine waste dumps (Golder Associates Ltd., 1995). The tailings data points clearly show a positive linear pattern along with the other data, although the scatter is relatively high, especially at higher volumes. The area–volume data for tailings flows show considerable overlap with other databases, corresponding with the upper volume range for debris flows and the lower volume ranges for lahars and rock avalanches (Fig. 9). One of the possible impacts of the assumption that the released volume approximately matches the volume deposited downstream in Zone 1 (Sect. 3.2.1) is the deposited volume may be underestimated due to the entrainment of material along the flow path. This simplification may lead to overestimating the y intercept of the regressions.
The differences between the c coefficient of Eq. (1) indicate the relative mobility of the various mass movement processes, on average (Berti and Simoni, 2007; Griswold and Iverson, 2008; Jakob, 2005). A comparison of c coefficients for different types of mass movements is shown in Table 2. The coefficient of c= 80 obtained for the tailings-flow data indicates that, on average, tailings flows are less mobile than lahars but more mobile than mine waste dumps, debris flows, and rock avalanches for a given volume. There is a significant amount of scatter in all of the datasets shown in Fig. 9, which highlights the importance of considering the potential variability in these events for forward analysis (i.e. using probabilistic methods).

Figure 9Comparison of the runout inundation area as a function of flow volume for tailings flows (red symbols; n =33)), waste dump failures (yellow symbols; n= 22), lahars (green symbols; n= 27), non-volcanic debris flows (pink symbols; n= 44), and rock avalanches (blue symbols; n= 142). The black two-thirds slope line is drawn as a guide for visual comparison only.
Five tailings dam breaches exhibit higher inundation areas than lahars for their given volumes (Fig. 9), and among those cases, the tailings dam breaches at the Ajka bauxite mine in Hungary in 2010 and the Mishor Rotem phosphate mine in Israel in 2017 (ID numbers 20 and 28 in Table 3) were examined in greater detail to demonstrate how site-specific information can be used to infer conditions that enhance mobility.
At the Ajka mine, a release of approximately 1.6 million cubic metres of high-pH bauxite tailings, about 30 % of which was solid residue, occurred through the northwest corner of the embankment (Bánvölgyi, 2018; Mecsi, 2013). The release produced a Zone 1 runout distance of approximately 18 km, despite the near-horizontal topography of the flow path (∼ 0.2∘), and covered approximately 6 million square meters. The Ajka bauxite tailings had very weak geotechnical properties, with medium- to high-plasticity, thixotropic (shear thinning) clays with very loose structure and slow consolidation rates, thus reducing pore fluid drainage and increasing the potential for liquefied flows (Mecsi, 2013). In addition to the volume of interstitial water, the bauxite tailings were overlain by a large supernatant pond that deepened towards the northwest corner of the impoundment; the average and maximum depths of the pond were 4.45 and 8 m, respectively, which greatly exceeded the maximum permitted pond depth of 1.5 m (Bánvölgyi, 2018). We therefore attribute this secondary source of water, along with the observed thixotropic behaviour of bauxite tailings, to the augmented mobility of the Ajka tailings flow.
The Mishor Rotem mine failure is estimated to have released approximately 0.1 million cubic metres of highly acidic phosphogypsum tailings (Bowker, 2017). The ensuing tailings flow travelled for 28 km through a dry creek channel with an average travel path angle of about 1.6∘ and inundated a Zone 1 area of approximately 1.8 km2. As of yet, very limited information is available for this tailings flow, but a few authors have commented on the dominant contribution of high water content to the composition of phosphogypsum tailings (80 %–97 %) compared to that of typical metal tailings (40 %–60 %) (Bowker, 2017; Tao et al., 2010; Wang et al., 2014). We, therefore, propose three factors that contributed to the extreme runout behaviour (i.e. long runout distance and large inundation area for the given total released volume) of the Mishor Rotem tailings flow: (i) high water content (interstitial and supernatant); (ii) a narrow, dry channel situated within a stable desert environment with no physical obstacles to flow; and (iii) a potential increase in the transported volume due to entrainment along the narrow channel.
Unlike natural hazards, tailings dams are human-made structures with impoundment volumes that increase over the course of mine operation. In most cases, when a dam breach occurs, only a portion of the impounded material is released. The amount of this portion depends on a variety of factors, such as the presence of a water pond, the tailings rheological properties, breach geometry, the age of the impounded material, and the triggering factors (Rico et al., 2008a).
The maximum volume that can be released in an extreme scenario equals the total impoundment volume. Compared with some types of landslides, the source volume of a tailings dam breach is relatively well-constrained. The uncertainty associated with this input parameter can, therefore, be accounted for explicitly when using Eq. (1) to make runout predictions. However, we note that relatively high confidence in the released volume estimate does not necessarily translate into high confidence in the inundation area estimate. Information on tailings type and topographic factors such as confined or unconfined travel path can potentially be used to better constrain the uncertainty in predicting the inundation area as more data points are added.
Further investigation should focus on increasing the size of high-quality tailings-flow databases, which should lead to more robust statistical analyses. Some effort should also focus on quantifying the potential contribution of entrainment to the total volume of the deposited material.
Our empirical investigation of historical tailings dam breaches provides new insights into tailings-flow processes and characteristics and introduces new relationships that can potentially be used for first-order inundation mapping. In this study, we established a data compilation methodology and introduced a runout zone classification system to improve consistency and reduce uncertainties associated with previously reported data. Using this methodology, we compiled a database of 33 tailings dam breach case studies and estimated the planimetric Zone 1 inundation areas for all of the events. The degree of mobility of the events in the database was investigated using a well-established semi-physical area–volume relationship, and the result was compared with similar relationships established for other mass flow processes. Our analysis suggests that the relationship A= cV2∕3 is a statistically valid relationship between total released volume (VR) and planimetric inundation area (A). The c coefficient of 80 from the analysis of our database suggests that, on average, tailings flows are less mobile than lahars (c=200) but more mobile than mine waste dumps, debris flows (c=17–20), and rock avalanches (c=12–20). This paper is part of an ongoing project. We are currently building the database and investigating the effects of other attributes of the tailings and downstream topography, which could potentially be used to refine the area–volume empirical–statistical relationship.
All datasets presented in the current study are included in this published article.
NG and SM conceived the research idea and NG developed the methodology. NG and NMR performed investigation. AM and NG performed the statistical analysis. NMR, NG, and AM verified the compiled database. SM, SGE, and WAT supervised the project. SM, SGE, and WAT provided financial support for the project leading to this publication. NG prepared the original draft with contributions from all co-authors.
The authors declare that they have no conflict of interest.
The authors would like to acknowledge the support of the Department of Natural Resources of Newfoundland for providing the information on the inundation area of the 2012 Gullbridge tailings dam breach. We would like to thank Sophia Zubrycky for her assistance with graphic design and Sahar Ghadirianniari for her assistance with data collection. The authors also wish to acknowledge valuable discussions with Vanessa Cuervo during the early stages of this work.
This research has been supported by The University of British Columbia, Department of Earth, Ocean and Atmospheric Sciences (grant no. 6456) and the Natural Sciences and Engineering Research Council of Canada (NSERC) (grant no. 533226-18). This work is part of the CanBreach Project, which is supported by funding through an NSERC Collaborative Research Development Grant and from the following industrial partners: Imperial Oil Resources Inc., Suncor Energy Inc., BGC Engineering Inc., Golder Associates Ltd., and Klohn Crippen Berger.
This paper was edited by Filippo Catani and reviewed by Renato Macciotta and one anonymous referee.
Bánvölgyi, G. G.: The Failure of the Embankment of the Red Mud Reservoir at Ajka (Hungary), in: Proceedings of the 36th International ICSOBA Conference, 29 October–1 November 2018, Belem, Brazil, 387–399, 2018.
Berti, M. and Simoni, A.: Prediction of debris flow inundation areas using empirical mobility relationships, Geomorphology, 90, 144–161, https://doi.org/10.1016/j.geomorph.2007.01.014, 2007.
Blight, G. E.: Destructive mudflows as a consequence of tailings dyke failures, Proc. Inst. Civ. Eng. Eng., 125, 9–18, 1997.
Blight, G. E.: Geotechnical Engineering for Mine Waste Storage Facilities, CRC Press, London, 2009.
Blight, G. E., Robinson, M. J., and Diering, J. A. C.: The flow of slurry from a breached tailings dam, J. South. African Institue Min. Metall. South, 81, 1–8, 1981.
Bowker, L. N.: Tsunami of Phosphate Tailings from ICL Plant Inundate 20 km of Dry Valley near Dead Sea, available at: https://lindsaynewlandbowker.wordpress.com/2017/07/09/ tsunami-of-phophate-tailings-from-icl-plant-inundate-20km-of-dry-valley-near-dead-sea/ (last access: 11 February 2019), 2017.
Brunner, G.: HEC-RAS River Analysis System – Hydraulic Reference Manual, Version 5.0, Hydrol. Eng. Cent. (HEC), US Army Corps Eng., Davis, California, USA, 960 pp., 2016.
Bussière, B.: Colloquium 2004: Hydrogeotechnical properties of hard rock tailings from metal mines and emerging geoenvironmental disposal approaches, Can. Geotech. J., 44, 1019–1052, https://doi.org/10.1139/T07-040, 2007.
Canadian Dam Association (CDA): Application of dam safety guidelines to mining dams, Technical Bulletin, 1–43, 2014.
Carmo, F. F. D., Kamino, L. H. Y., Junior, R. T., de Campos, I. C., do Carmo, F. F., Silvino, G., de Castro, K. J. S. X., Mauro, M. L., Rodrigues, N. U. A., de Miranda, M. P. S., and Pinto, C. E. F.: Fundão tailings dam failures: the environment tragedy of the largest technological disaster of Brazilian mining in global context, Perspect. Ecol. Conserv., 15, 145–151, https://doi.org/10.1016/j.pecon.2017.06.002, 2017.
Chambers, D. M. and Bowker, L. N.: Tailings dam failures 1915–2018, available at: https://worldminetailingsfailures.org/ (last access: 12 June 2020), 2019.
Chandler, R. J. and Tosatti, G.: THE STAVA TAILINGS DAMS FAILURE, ITALY, JULY 1985, Proc. Inst. Civ. Eng. Geotech. Eng., 113, 67–79, https://doi.org/10.1680/igeng.1995.27586, 1995.
Committee on the Safety of Existing Dams: Safety of existing dams: evaluation and improvement, National Academy Press, Washington, DC, USA, 1983.
Costa, J. E.: Floods from Dam Failures, Open File Report, US Geological Survey, Denver, CO, USA, 85-560, p. 59, 1985.
Cuervo, V., Burge, L., Beaugrand, H., Hendershot, M., and Evans, S. G.: Downstream Geomorphic Response of the 2014 Mount Polley Tailings Dam Failure, British Columbia, in: Workshop on World Landslide Forum, edited by: Mikoš, M., Vilímek, V., Yin, Y., and Sassa, K., Springer International Publishing, Cham, Switzerland, 281–289, 2017.
Danish Hydraulic Institute (DHI): MIKE Flood User Manual, Horsholm, Denmark, 108 pp., 2007.
Davies, T. R. H.: Spreading of rock avalanche debris by mechanical fluidization, Rock Mech., 15, 9–24, 1982.
Delaney, K. B. and Evans, S. G.: The 1997 Mount Munday landslide (British Columbia) and the behaviour of rock avalanches on glacier surfaces, Landslides, 11, 1019–1036, https://doi.org/10.1007/s10346-013-0456-7, 2014.
Dibike, Y. B., Shakibaeinia, A., Droppo, I. G., and Caron, E.: Modelling the potential effects of Oil-Sands tailings pond breach on the water and sediment quality of the Lower Athabasca River, Sci. Total Environ., 642, 1263–1281, https://doi.org/10.1016/j.scitotenv.2018.06.163, 2018.
Ghahramani, N., McDougall, S., Mitchell, A., Evans, S. G., Take, A., and Cuervo, V.: Introducing a Runout Zone Classification for the Analysis of Tailings Flows, in: Proceedings Tailings and Mine Waste Conference, 17–20 November, Vancouver, Canada, 555–568, 2019.
Golder Associates Ltd.: Mined rock and overburden piles: runout characteristics of debris from dump failures in mountainous terrain, Stage 2: analysis, modelling and prediction. Interim Report, Report No. 932-1493, Prepared in association with O. Hungr Geotechnical Research Ltd., British Columbia Mine Waste Rock Pile Research Committee and CANMET, 1995.
Griswold, J. P. and Iverson, R. M.: Mobility Statistics and Automated Hazard Mapping for Debris Flows and Rock Avalanches Scientific Investigations Report 2007, : US Department of the Interior, US Geological Survey, USGS Sci. Investig. Rep., 2007-5276, 67 pp., 2008.
Hagen, V. K.: Re-evaluation of design floods and dam safety, in: Proceedings of the 14th International Congress on Large Dams, Commission on Large Dams Congress, Rio de Janeiro, Brazil, 9 August 1982, 475–491, 1982.
Harder, L. F. and Stewart, J. P.: Failure of Tapo Canyon Tailings Dam, J. Perform. Constr. Facil., 10, 109–114, https://doi.org/10.1061/(ASCE)0887-3828(1996)10:3(109), 1996.
Hatje, V., Pedreira, R. M. A., De Rezende, C. E., Schettini, C. A. F., De Souza, G. C., Marin, D. C., and Hackspacher, P. C.: The environmental impacts of one of the largest tailing dam failures worldwide, Sci. Rep.-UK, 7, 1–13, https://doi.org/10.1038/s41598-017-11143-x, 2017.
Hungr, O.: Dynamics of rock avalanches and other types of slope movements, PhD thesis, University of Alberta, Edmonton, Canada, 506 pp., 1981.
Hungr, O. and Evans, S. G.: The Failure Behaviour of Large Rockslides in Mountainous Regions, (Open File 2598), Geol. Surv. Canada, Ottawa, Canada, 277 pp., 1993.
Hungr, O., Leroueil, S., and Picarelli, L.: The Varnes classification of landslide types, an update, Landslides, 11, 167–194, https://doi.org/10.1007/s10346-013-0436-y, 2014.
ICOLD, UNEP: Tailings Dams–Risk of Dangerous Occurrences, Lessons Learnt From Practical Experiences (Bulletin 121), Commission Internationale des Grands Barrages, Paris 155, 2001.
Innis, S., Ghahramani, N., Rana, N. M., McDougall, S., Evans, S. G., Take, W. A., and Kunz, N.: Automated Hazard Mapping of Tailings Storage Facility Failures, in: Proceedings of Tailings and Mine Waste Conference, 15–18 November, Colorado, USA, 661–669, 2020.
Iverson, R. M., Schilling, S. P., and Vallance, J. W.: Objective delineation of lahar-inundation hazard zones, Geol. Soc. Am. Bull., 110, 972–984, https://doi.org/10.1130/0016-7606(1998)110<0972:ODOLIH>2.3.CO;2, 1998.
Jakob, M.: Debris-flow hazard analysis, in: Debris-flow Hazards and Related Phenomena, edited by: Jakob, O. and Hungr, M., Praxis, Chichester, UK, 411–443, 2005.
Jeyapalan, J. K., Duncan, J. M., and Seed, H. B.: Analyses of Flow Failures of Mine Tailings Dams, J. Geotech. Eng., 109, 150–171, 1983a.
Jeyapalan, J. K., Seed, H. B., and Duncan, J. M.: Investigation of Flow Failures of Tailings Dams, J. Geotech. Eng., 109, 172–189, 1983b.
Knight Piésold Ltd.: Dam breach analyses and inundation studies for the Afton Tailings Storage Facility (TSF), Canada, 80 pp., 2014.
Kossoff, D., Dubbin, W. E., Alfredsson, M., Edwards, S. J., Macklin, M. G., and Hudson-Edwards, K. A.: Mine tailings dams: Characteristics, failure, environmental impacts, and remediation, Appl. Geochem., 51, 229–245, https://doi.org/10.1016/j.apgeochem.2014.09.010, 2014.
Larrauri, P. C. and Lall, U.: Tailings Dams Failures: Updated Statistical Model for Discharge Volume and Runout, Environments, 5, 28, https://doi.org/10.3390/environments5020028, 2018.
Li, T.: A mathematical model for predicting the extent of a major rockfall., Zeitschrift für Geomorphologie Stuttgart, 27, 473–482, 1983.
Luino, F. and De Graff, J. V.: The Stava mudflow of 19 July 1985 (Northern Italy): a disaster that effective regulation might have prevented, Nat. Hazards Earth Syst. Sci., 12, 1029–1044, https://doi.org/10.5194/nhess-12-1029-2012, 2012.
Macías, J. L., Corona-Chávez, P., Sanchéz-Núñez, J. M., Martínez-Medina, M., Garduño-Monroy, V. H., Capra, L., García-Tenorio, F., and Cisneros-Máximo, G.: The 27 May 1937 catastrophic flow failure of gold tailings at Tlalpujahua, Michoacán, Mexico, Nat. Hazards Earth Syst. Sci., 15, 1069–1085, https://doi.org/10.5194/nhess-15-1069-2015, 2015.
Martin, V., Fontaine, D., and Cathcart, J.: Challenges with conducting tailings dam breach studies, in: Proceedings of Tailings and Mine Waste Conference, Vancouver, Canada, October, 314–328, 2015.
Martin, V., Al-Mamun M., and Small A.: CDA technical bulletin on tailings dam breach analyses. Sustainable and Safe Dams Around the World: in: Proceedings of the ICOLD 2019 Symposium, (ICOLD 2019), 9–14 June, Ottawa, Canada, 3484–3498, 2019.
McDougall, S.: 2014 Canadian Geotechnical Colloquium: Landslide runout analysis – current practice and challenges, Can. Geotech. J., 54, 605–620, https://doi.org/10.1139/cgj-2016-0104, 2017.
McDougall, S. and Hungr, O.: A model for the analysis of rapid landslide motion across three-dimensional terrain, Can. Geotech. J., 41, 1084–1097, https://doi.org/10.1139/t04-052, 2004.
Mecsi, J.: Some technical aspects of the tailing dam failure at the Ajka red mud reservoirs, in: 18th International Conference on Soil Mechanics and Geotechnical Engineering: Challenges and Innovations in Geotechnics, ICSMGE, Paris, 2–6 September 2013, 3309–3312, 2013.
Miller, T. and Zapf-Gilje, R.: Mount Polley Mine Tailings Storage Facility, Perimeter Embankment Breach Update Report; Post-Event Environmental Impact Assessment. Prepared for Mount Polley Min-ing Corporation by Golder Associates Ltd. Report 1411734-124, 2016.
Mitchell, A., McDougall, S., Aaron, J., and Brideau, M.: Rock Avalanche-Generated Sediment Mass Flows: Definitions and Hazard, Front. Earth Sci., 8, 1–18, https://doi.org/10.3389/feart.2020.543937, 2020.
Pastor, M., Quecedo, M., Merodo, J. A. F., Herrores, M. I., Gonzalez, E., and Mira, P.: Modelling tailings dams and mine waste dumps failures, Geotechnique, 52, 579–591, 2002.
Pirulli, M., Barbero, M., Marchelli, M., and Scavia, C.: The failure of the Stava Valley tailings dams (Northern Italy): numerical analysis of the flow dynamics and rheological properties, Geoenvironmental Disasters, 4, 1–15, https://doi.org/10.1186/s40677-016-0066-5, 2017.
Rico, M., Benito, G., and Díez-Herrero, A.: Floods from tailings dam failures, J. Hazard. Mater., 154, 79–87, https://doi.org/10.1016/j.jhazmat.2007.09.110, 2008a.
Rico, M., Benito, G., Salgueiro, A. R., Díez-Herrero, A., and Pereira, H. G.: Reported tailings dam failures, A review of the European incidents in the worldwide context, J. Hazard. Mater., 152, 846–852, https://doi.org/10.1016/j.jhazmat.2007.07.050, 2008b.
Roche, C., Thygesen, K., and Baker, E.: Mine tailings storage: safety is no accident, A UNEP Rapid Response Assessment, United Nations Environment Programme and GRID-Arendal, Nairobi, Kenya and Arendal, Norway, 2017.
Santamarina, J. C., Torres-Cruz, L. A., and Bachus, R. C.: Why coal ash and tailings dam disasters occur, Science, 364, 526–528, https://doi.org/10.1126/science.aax1927, 2019.
Schoenberger, E.: Environmentally sustainable mining: The case of tailings storage facilities, Resour. Policy, 49, 119–128, https://doi.org/10.1016/j.resourpol.2016.04.009, 2016.
Simoni, A., Mammoliti, M., and Berti, M.: Uncertainty of debris flow mobility relationships and its influence on the prediction of inundated areas, Geomorphology, 132, 249–259, https://doi.org/10.1016/j.geomorph.2011.05.013, 2011.
Small, A., James, M., and Al-mamun, M.: Advancing the State of Practice for Tailings Dam Breach Assessment Using Empirical Correlations, in: Proceedings of the Canadian Dam Association, CDA 2017 Annual Conference, Kelowna, BC, Canada, 16–18 October 2017, 17 pp., 2017.
Tao, D., Parekh, B. K., Zhao, Y., and Zhang, P.: Pilot-scale demonstration of deep cone™ paste thickening process for phosphatic clay/sand disposal, Sep. Sci. Technol., 45, 1418–1425, https://doi.org/10.1080/01496391003652783, 2010.
Vick, S. G.: Planning, Design and Analysis of Tailings Dams, BiTech Publishers Ltd., Vancouver, BC, Canada, 1990.
Villavicencio, G., Espinace, R., Palma, J., Fourie, A., and Valenzuela, P.: Failures of sand tailings dams in a highly seismic country, Can. Geotech. J., 51, 449–464, https://doi.org/10.1139/cgj-2013-0142, 2014.
Wang, C., Harbottle, D., Liu, Q., and Xu, Z.: Current state of fine mineral tailings treatment: A critical review on theory and practice, Miner. Eng., 58, 113–131, https://doi.org/10.1016/j.mineng.2014.01.018, 2014.
WISE: Chronology of major tailings dam failures, World Information Service on Energy, available at: http://www.wise-uranium.org/mdaf.html, last access: 12 June 2020.