the Creative Commons Attribution 4.0 License.
the Creative Commons Attribution 4.0 License.
 | 28 Oct 2020
Investigating beach erosion related with tsunami sediment transport at Phra Thong Island, Thailand, caused by the 2004 Indian Ocean tsunami
Ryota Masaya
Anawat Suppasri
Kei Yamashita
Fumihiko Imamura
Chris Gouramanis
Natt Leelawat
The 2004 Indian Ocean tsunami and the 2011 Tōhoku earthquake and tsunami caused large-scale topographic changes in coastal areas. Whereas much research has focused on coastlines that have or had large human populations, little focus has been paid to coastlines that have little or no infrastructure. The importance of examining erosional and depositional mechanisms of tsunami events lies in the rapid reorganization that coastlines must undertake immediately after an event. A thorough understanding of the pre-event conditions is paramount to understanding the natural reconstruction of the coastal environment. This study examines the location of sediment erosion and deposition during the 2004 Indian Ocean tsunami event on the relatively pristine Phra Thong Island, Thailand. Coupled with satellite imagery, we use numerical simulations and sediment transportation models to determine the locations of significant erosion and the areas where much of that sediment was redeposited during the tsunami inundation and backwash processes. Our modeling approach suggests that beaches located in two regions on Phra Thong Island were significantly eroded by the 2004 tsunami, predominantly during the backwash phase of the first and largest wave to strike the island. Although 2004 tsunami deposits are found on the island, we demonstrate that most of the sediment was deposited in the shallow coastal area, facilitating quick recovery of the beach when normal coastal processes resumed.
- Article
(6505 KB) - Full-text XML
- BibTeX
- EndNote


The 2004 Indian Ocean tsunami and the 2011 Tōhoku earthquake and tsunami caused large-scale geomorphologic changes in coastal areas during the erosional phases of inflow and outflow (Pari et al., 2008; Goto et al., 2011a; Tanaka et al., 2011; Haraguchi et al., 2012; Hirao et al., 2012; Udo et al., 2013; Imai et al., 2015). In each tsunami event, the erosional phases translocated sediments onshore and offshore and primed the coastal zone for rapid (months to decades) recovery (Choowong et al., 2009; Ali and Narayama, 2015; Udo et al., 2016; Saegusa et al., 2017; Koiwa et al., 2018). However, little information exists to identify real-time sediment dynamics during the erosional and depositional phases of tsunami events. In particular, erosive phases mobilize sediments into the onshore (e.g., Jankaew et al., 2008; Gouramanis et al., 2017) and offshore environments (e.g., Feldens et al., 2009). Following the tsunami event, both offshore environment and coastal environments are primed for natural processes to resume and redistribute sediments onshore to restore the coastal environment to similar pre-tsunami configurations.
However, in many regions, such as the area affected by the 2011 tsunami, extensive engineering interventions (e.g., levee construction and land level raising) are affecting the natural recovery processes of the coastal zone. In Japan, plans for coastal reconstruction and defenses are typically formulated shortly after a tsunami, preventing natural recovery processes (Suppasri et al., 2016), and many locations have not undergone or been allowed to recover naturally (Udo et al., 2016). These political and engineering interventions make it difficult to observe or predict the natural recovery processes of coastal areas.
Before an understanding of the recovery processes of a tsunami-affected coastal zone can be achieved, a thorough understanding of the sediment budget must be determined. The relocation of sediments during the main tsunami erosion and deposition phases establishes the pre-recovery or baseline conditions upon which natural processes can act to facilitate the recovery of the coastal zone. To determine the locations of sediment deposition during a tsunami event, the sediment transport dynamics during the tsunami must be defined.
Unfortunately, real-time data from observations have not been possible to establish quantitative estimates of sediment erosion and deposition during a tsunami event, though qualitative spatial patterns of the sediment process (Udo et al., 2016; Yamashita et al., 2016) have been examined through analysis of video footage. Prior studies have mainly estimated sediment transport dynamics such as erosion and sediment deposition through remote sensing (e.g., Fagherazzi and Du, 2008; Choowong et al., 2009; Liew et al., 2010) and sedimentological and stratigraphic analysis (e.g., Paris et al., 2007; Hawkes et al., 2007; Switzer et al., 2012). However, the information obtained regarding the final results of the sediment transport process is limited. It is difficult to obtain information on where sediment has eroded and deposited (e.g., Pham et al., 2018) and whether topographic changes caused by the local sediment runoff or deposition are the results of action from inflow or backwash (e.g., Choowong et al., 2009; Paris et al., 2007; Switzer et al., 2012). This information determines the sediment budget in the system before and after the tsunami and is therefore important for considering geomorphic recovery.
Numerical simulations using wave dynamics of an area can reproduce spatial–temporal variations in the sediment mobility and deposition and can effectively model the sediment transport process using the wave and sediment characteristics of the natural system. In recent years, numerical modeling of tsunami sediment transport has been developed (e.g., Takahashi et al., 2000), improved (e.g., Takahashi et al., 2011; Apotsos et al., 2011a; Li and Huang, 2013; Morishita and Takahashi, 2014; Yamashita et al., 2018) and applied in the field (e.g., Gelfenbaun et al., 2007; Takahashi et al., 2008; Apotsos et al., 2011b, c; Gusman et al., 2012; Li et al., 2014; Arimitsu et al., 2017; Yamashita et al., 2017), and reproducibility has been confirmed by comparison between the calculated and measured values (e.g., Li et al., 2012; Ranasinghe et al., 2013; Sugawara et al., 2014a; Yamashita et al., 2015; Yamashita et al., 2016).
An important consideration in the sediment dynamics during catastrophic marine events (e.g., typhoon and tsunami) is the degree of development and human modification of the coastal zone prior to the event. Artificial structures, such as sea walls, roads and buildings interfere with washover processes, and these areas are often targeted from reconstruction and rehabilitation through rapid engineering reconstruction. Little is known about the recovery processes in sparsely developed and unpopulated areas. As such, the largely anthropogenically undisturbed Phra Thong Island, western Thailand, is an ideal location to model the sediment dynamics, coastal erosion and deposition following a major tsunami event.
The main objective of this study is to investigate the short-term conditions of sediment transport such as erosional and depositional process and establishes the baseline sediment conditions that led to further investigation of the long-term recovery of the Phra Thong Island coastline after the 2004 Indian Ocean tsunami. We used tsunami sediment transport calculations to spatiotemporally reproduce the sediment transport processes occurring during the tsunami and identify zones of sediment deposition in the offshore and onshore areas and validate these modeling results with published observational data of the 2004 Indian Ocean tsunami deposits on the island. Due to the largely natural environment, Phra Thong Island is a rare case that is useful for verifying tsunami sediment transport models where few artificial features can generate model uncertainties.
Examining the sediment transport processes on Phra Thong Island is also expected to elucidate phenomena and improve numerical calculation models for the future and is applicable to other areas. Furthermore, at least three paleotsunami deposits were identified in areas impacted by the 2004 Indian Ocean tsunami on Phra Thong Island (Jankaew et al., 2008; Sawai et al., 2009; Fujino et al., 2009; Fujino et al., 2010; Prendergast et al., 2012; Brill et al., 2012a, b; Gouramanis et al., 2017; Pham et al., 2018). Thus, clarifying the sediment transport conditions of the 2004 tsunami will also be important for future estimations of history, scope and cause of older tsunamis on Phra Thong Island and elsewhere in the coastal areas of the Indian Ocean.
2.1 Phra Thong Island, Thailand
During the 2004 Indian Ocean tsunami, a wave of approximately 7 m inundated the northern portion of Phra Thong Island (Fig. 1) and measurements up to 20 m were recorded from the southernmost tip of the island (Jankaew et al., 2008). Over 70 people were lost and a village of 100 households disappeared. Geomorphologically, the western coast of the island has a beach ridge sequence trending parallel to the coast, which formed during the sea level regression following mid-Holocene sea level highstand about 6000 BP (Brill et al., 2015). The eastern shore of the island is extensively covered by mangroves along the shores of tidal channels. The island has a tropical climate. Additionally, paleotsunami deposits are preserved in swales in the beach ridge system along the western coast of Thailand (e.g., Jankaew et al., 2008; Gouramanis et al., 2015, 2017). Furthermore, although local beaches were lost in the 2004 tsunami, satellite photography showed rapid natural recovery within 18 months (e.g., Choowong et al., 2009).

Figure 1Location of Phra Thong Island.
2.2 Topography and bathymetry data
The topography and bathymetry data used for the tsunami sediment transport calculations were created based on various water depths and elevations. Figure 2 shows the terrain data that were created. Topographic data were downscaled from Region 1, which includes the Andaman Sea, to Region 6, which includes all of Phra Thong Island. The grid spacing decreases from Region 1 (the spatial grid size Δx1=1215 m) to Region 6 (Δx6=5 m). In the tsunami sediment transport calculations, UTM zone 47N was used to geospatially constrain the horizontal modeling coordinates of Phra Thong Island. Region 1 is the projection of depth data of the 30 s grid provided by GEBCO (2014) on the Cartesian coordinate system UTM 47N. Regions 2–4 use a digital marine chart with 300 m resolution based on a survey by the Royal Thai Navy. Regions 5 and 6 use an original 5 m (terrain data) and 15 m (sea depth data) grid spacing to create mean terrain and water depth data based on analysis of satellite images by EOMAP and elevation data provided by the Land Development Department of Thailand (LDD, 2018). The terrain data of Region 4, created from the digital marine chart of 300 m resolution, showed discontinuity at the boundary with Region 5, which had a higher resolution. The discontinuity was therefore removed to the extent possible by interpolation with an inverse distance weighting method using all terrain data.

Figure 2Terrain data. The black frame shows Region 1 to Region 6, and the black line in Region 6 shows the cross section where calculation was performed. Dashed squares are the beach where erosion was confirmed from satellite images.
2.3 Tsunami source model
The tsunami source model proposed by Suppasri et al. (2011) was used as the tsunami source of the 2004 Indian Ocean tsunami as the model focused on the coast of Thailand and accurately reproduced the inundation area and surveyed trace height of the 2004 Indian Ocean tsunami. The fault model is divided into six small faults from satellite image analysis and survey results, and it is assumed that each small fault slides simultaneously and instantaneously. For the tsunami source, the vertical tectonic displacement in each fault was calculated according to Okada (1985). Table 1 shows the fault parameters of each fault and Fig. 3 shows the initial water level.
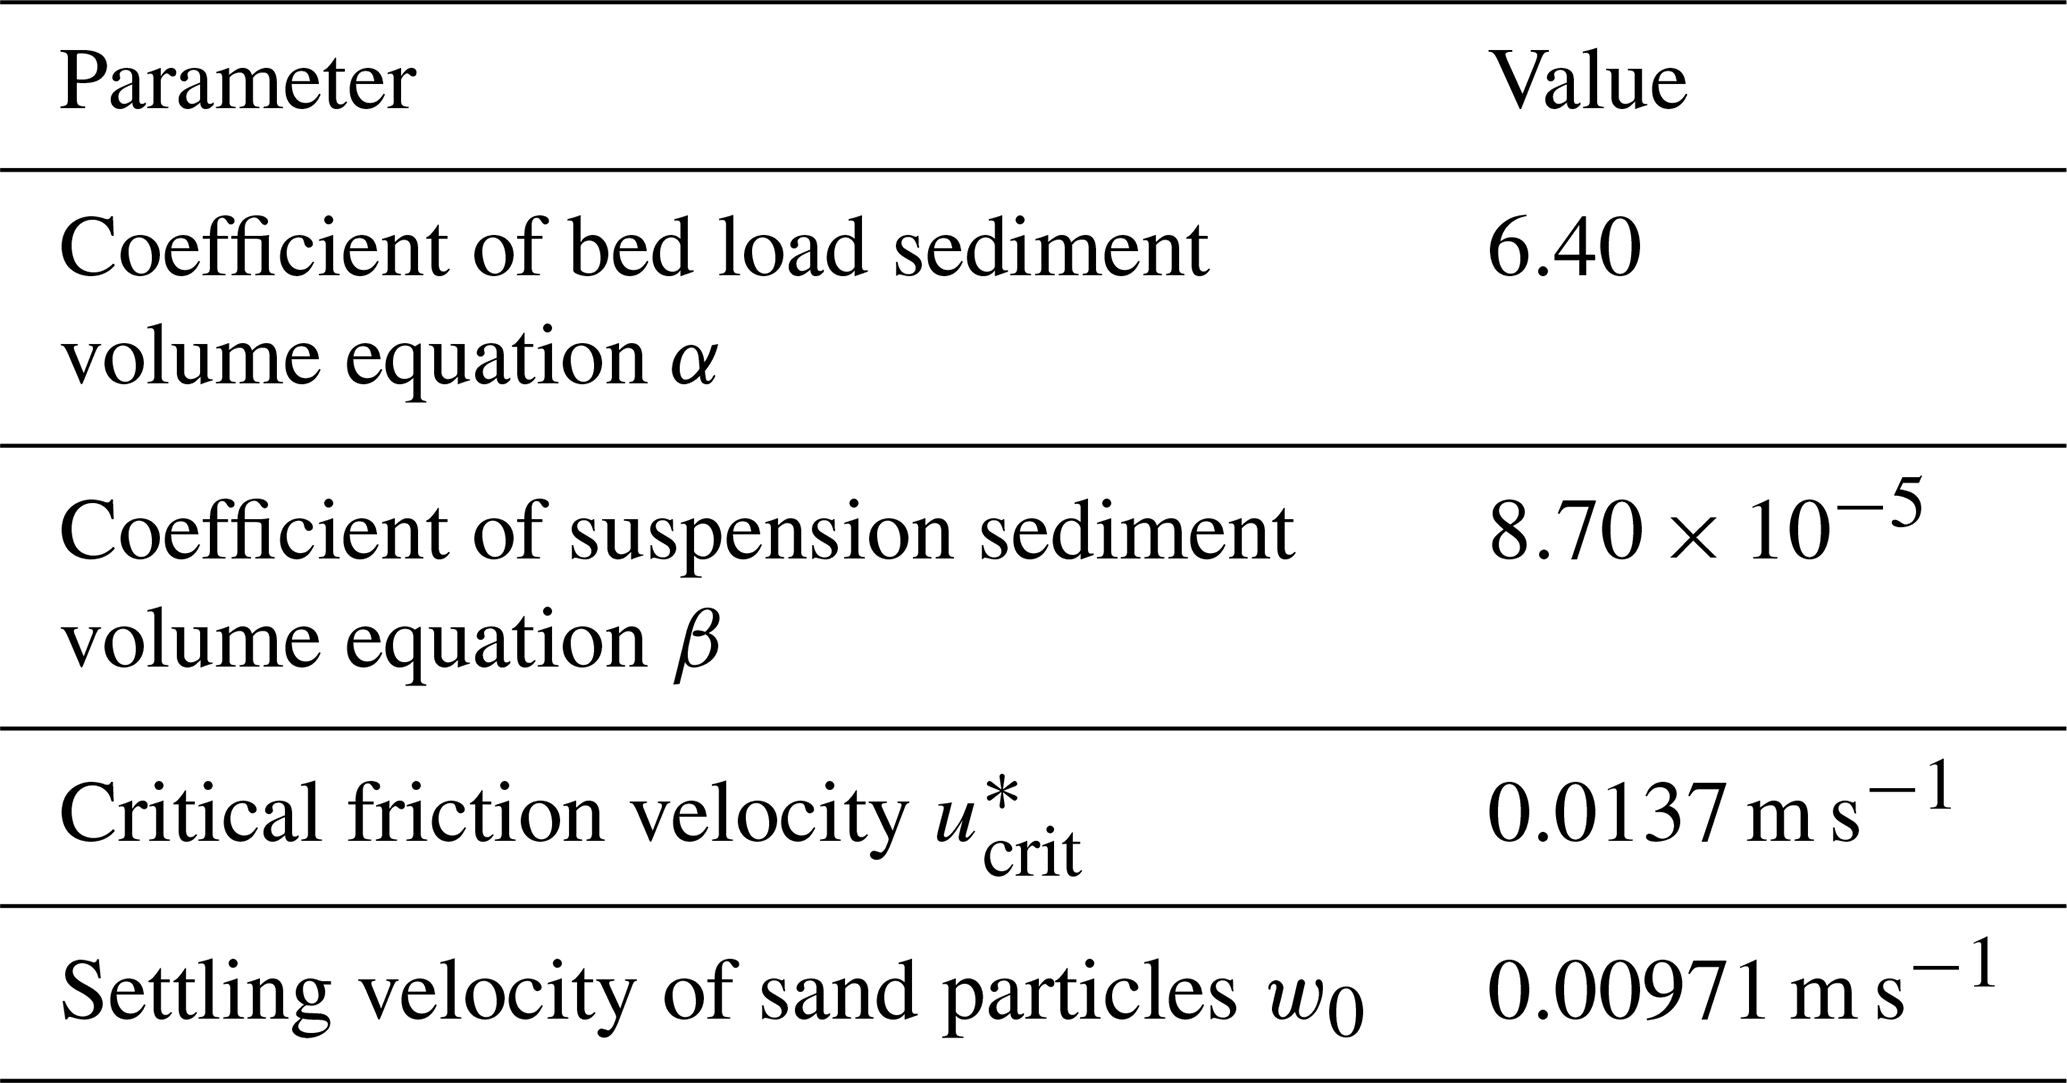
Table 1Earthquake fault parameters for calculating initial water level (Suppasri et al., 2011).

2.4 Tsunami sediment transport calculation
2.4.1 Tsunami propagation and run-up model
Tohoku University's Numerical Analysis Model for Investigation of Near-field tsunamis, No. 2 (TUNAMI-N2) is based on the nonlinear long wave theory and was used as the tsunami propagation and run-up model (Imamura, 1996).
Here, η is the change in water level from the still-water surface, D is the total water depth from the bottom to the water surface and g is the acceleration of gravity. The bottom friction is expressed according to the Manning formula, where n is Manning's roughness coefficient (n=0.025 s m). M and N are the total flow fluxes in the x and y directions, respectively, and are given by integrating the horizontal flow velocity u, v from the water bottom h to the water surface η. It is assumed that the horizontal flow velocity is uniformly distributed in the vertical direction.
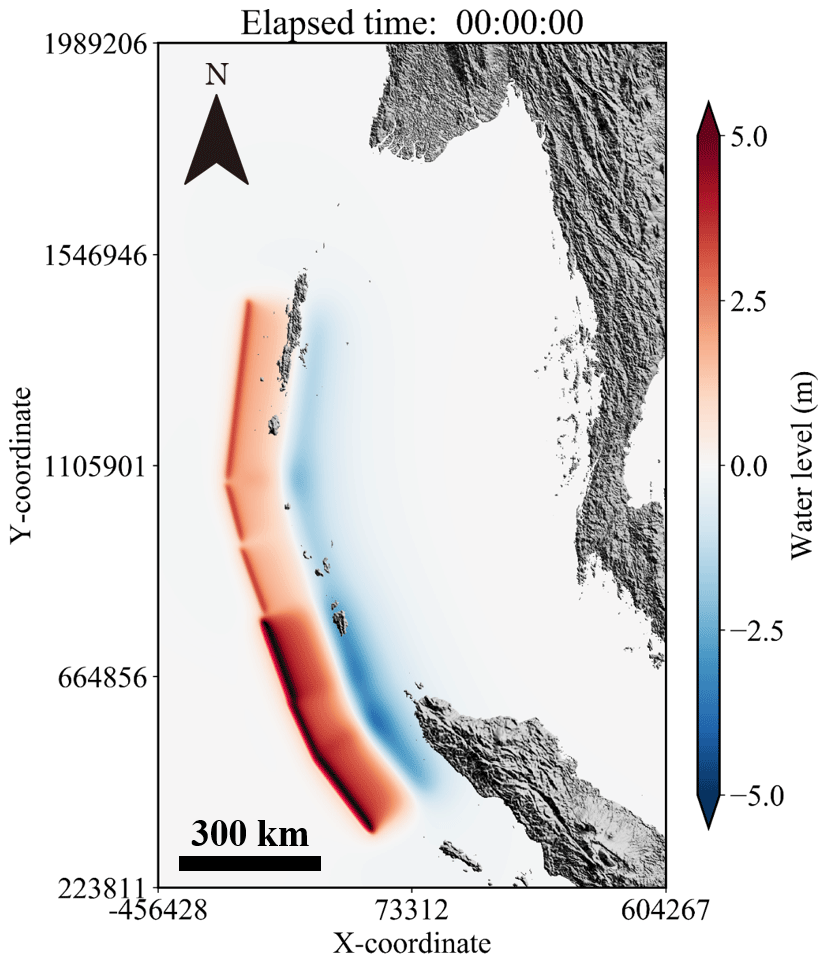
Figure 3Initial water level after earthquake occurrence.
The nonlinear long wave theory consists of a continuous equation that is derived from (1) the principle of conservation of mass (continuity equation) and (2) the conservation of momentum (equation of motion). These two equations are obtained by vertical integration from the seabed to the water surface.
When the water depth is about 50 m or less, the effects of the second, third and fifth terms of the advection and seabed friction terms (Eqs. 2 and 3) are reduced; therefore wave theory that omits these terms is often used at depths shallower than 50 m. Meanwhile, the Message Passing Interface (MPI) parallel was implemented in the model for highly efficient calculations. Both the advection term and the bottom friction term were therefore considered in the calculations without reducing accuracy in deeper waters.
The reproducibility of the calculated results is based on the tsunami height data (IUGG; available at http://www.nda.ac.jp/~fujima/TMD/index.html, last access: 19 October 2020) for the 2004 Indian Ocean tsunami and is discussed using the geometric mean K and geometric standard deviation κ proposed by Aida (1978).
Here, np is the number of points, Ri is the tsunami height at the ith point, Hi is the calculated value at the ith point and
2.4.2 Sediment transport model
For the tsunami movable bed model, we used the numerical sediment transport model (STM) proposed by Takahashi et al. (2000), which solves the time evolution of sediment transport considering the exchange sediment volume of the bed and suspended load layers according to the flow conditions of the TUNAMI-N2 model based on nonlinear long wave theory. For each time step in the finest calculation region (region 6), the STM receives the total flow fluxes from TUNAMI-N2 and calculates the change of seafloor and land surface and feeds this to the next time step of the TUNAMI-N2 model.
In this model, tsunami sediment transportation is divided into two layers, bed load layer and suspended load layer. In the bed layer, the sediment particles are transported through rolling, sliding or saltating. In the suspended load layer, the sediment particles are uplifted and transported by the dynamic of flowing suspension. The governing equations consist of continuous equations for the bed load layer and the suspended load layer:
Here, λ is the porosity of the sand particles, ZB is the bottom height from the reference plane, qB is the amount of bed load sediment, C is the average suspended load layer concentration, hs is the suspended load layer thickness (equal to total water depth) and M, N are the water discharges in the x direction and y direction. w0 is the settling velocity of the sand particles.
Equation (6) is a continuous equation for within the bed load layer. The first term is the exchange sediment volume with the bottom, the second term is the balance of sediment flow volume moving in a tractive form in the flow direction and the third term defines the balance of suspension flux, caused by diffusion, and sedimentation flux, caused by gravity, as the exchange sediment volume between the bed load layer and the suspended load layer.
Equation (7) is a continuous equation for within the suspended load layer. The first and second terms are bed load sediment moving in a suspended state in the flow direction, the third term is the exchange sediment volume between the bed load layer and the suspended load layer, and the fourth term is the increase or decrease in the sediment flow in the suspended load layer.
In Eqs. (8) and (9), the equations defining the bed load sediment volume qB and the equation defining the exchange sediment volume wex of the bed load layer and suspended load layer are necessary, but according to Takahashi et al. (2000), they are obtained by the following.
Here, α is the coefficient of the bed load sediment volume equation, β is the coefficient of the suspension volume equation, s is the density ratio of the sand particles (; ρs and ρw are the density of sand particles and water, respectively; ρs= 2650 kg m−3 and ρw=1000 kg m−3, g is the acceleration of gravity, d is the grain diameter, w0 is the settling velocity of the sediment grains, τ* is the Shields parameter (Eq. 10), is the critical Shields parameter, u* is the friction velocity obtained from Manning's law (). ns is the roughness coefficient for STM. It is worthwhile to mention that in the tsunami calculation, roughness coefficient n is the parameter to calculate the shear stress from ground surface which differs from ns, the parameter for calculating the shear stress which exerts force on the surface of sand particles.
The grain-size-dependent parameter for bed load (α) and exchange rate (β) in Eqs. (8) and (9) is derived from Eqs. (11) and (12) based on the hydraulic experiments by Takahashi et al. (2011).
However, the functions should not be applied when d is outside the 0.166 mm to 0.394 mm range as the validity of extrapolated d values may produce erroneous results.
Equation (13) is a settling velocity of the sand particles by Rubey (1933). Here, ν is the kinematic viscosity coefficient ( m2 s−1).
Considering the effect from the bed slope (Watanabe et al., 1984), the formulation of the bed load, qB, Eq. (6), is rewritten as QB as shown in Eqs. (14) and (15):
where ε is the parameter which is related to the diffusion coefficient of the sediments (ε=2.5; Sugawara et al., 2014a).
Sediment transport during tsunami largely occurs as suspension (Takahashi et al., 2000). In such situations, suspended sediments are maintained in the water column by turbulence while the energy of the turbulence is dissipated due to the increased suspended sediment concentration. This induced an equilibrium state in which no further sediment supply from the bottom occurs. The resulting concentration is called the saturated sediment concentration. The expression for saturation concentration of suspended sediments Cs is applied as (Van Rijn, 2007; Sugawara et al., 2014a)
where es is the efficiency coefficient (es=0.025; Bagnold, 1966). Note that in the sediment transport calculation, the saturation concentration of suspended sediments given by Eq. (16) is applied entrainment of sediment from the bottom layer. Namely, sediment supply from the bottom to the water column (suspended load layer) by wex is not permitted if C ≥Cs. However, supersaturation (C≥Cs) due to sediment advection, or sudden decrease in Cs due to the change of flow parameters, is permitted. In this calculation, when C exceeds maximum concentration Cmax was set to 37.7 %, based on the observed value (Xu, 1999a, 1999b).
In Eqs. (6) and (7), the bottom height (ZB) is determined from the reference plane, and the average suspended sediment concentration (C) is the initial values before the tsunami and the flow flux (M). Because suspended sediment thickness (hs) is given by the equation of motion of a fluid and the continuous equation, sea level fluctuation can be determined over time. Further, the MPI parallel was implemented to enable relatively efficient wide-area calculations (e.g., Yamashita et al., 2016).
2.5 Calculation conditions
The initial conditions for the numerical simulations used the terrain data (Fig. 2) and tsunami source (Fig. 3). The simulations were performed using a 3:1 nested grid that increased the resolution from a 1215 m2 grid to a 5 m2 grid. Additionally, the target region of the sediment transport calculation was limited to Region 6, with a grid spacing of 5 m2.
The simulations were calculated over a 0.05 s increment with a 6 h period in which the test case with a 12 h period showed the suspended sediment concentration in the vicinity of the shoreline decreased and stabilized. Therefore, the 6 h simulation was used for the reproduction of the 2004 tsunami as well as further sensitivity analysis of the grain size and roughness coefficient.
For the bottom conditions of STM, the roughness coefficient was fixed at ns=0.030 s m, and the entire area of Region 6 was considered the movable bed. In general, when simulating tsunami sediment transport, it is necessary to determine the roughness coefficient according to land use. However, since there is no land use map before the tsunami on Phra Thong Island, a fixed value was used, similar to previous studies (e.g., Sugawara et al., 2014a, b; Yamashita et al., 2015, 2016). However, Sugawara et al. (2014a) showed that the variation in Manning's roughness coefficient for the sand beds may affect the general distribution pattern of sediment deposits and erosions across the artificial topographic features with much higher roughness coefficient such as artificial canals, roads and populated residential areas. Therefore, a sensitivity analysis on the roughness coefficient was performed. Phra Thong Island has no such artificial topographic features and using the single roughness coefficient should sufficiently capture the overall roughness. However, to ensure robust conclusions, a sensitivity analysis for two bottom conditions was performed at ns=0.025 s m and ns=0.035 s m, which are within the range of previously used estimates of roughness (e.g., Sugawara et al., 2014a, b).
The grain size was based on one sediment dataset (Gouramanis et al., 2017) from the locally eroded region and was considered a representative value for all of the tsunami sediment grain sizes. A uniform grain size of d=0.127 mm was used. The critical Shields parameter in Eqs. (9) and (10) was obtained using Eqs. (17) and (18) according to Iwagaki et al. (1956).
Here, is the critical friction velocity and ρ is the density of water. Table 2 shows each parameter used for the sediment transport calculations in this study.
The numerical model used in this paper can only consider a single grain size, so the model cannot resolve the grading observed in the sand layers (e.g., Gouramanis et al., 2017). Additionally, initial bed grain size can have a large effect on erosion and deposition (e.g., Apotsos et al., 2011b; Sugawara et al., 2014a; Jaffe et al., 2016). Furthermore, the sediment data we used to set the grain size are from a single location in the north of the island and are assumed to be a representative grain size for the tsunami deposits. As such we performed a sensitivity analysis on the grain size. Pham et al. (2018) investigated the surface grain size offshore (water depth >15 m), nearshore (water depth <15 m) and onshore on Phra Thong Island, which they considered to be the source of sediments that formed the tsunami deposits. Pham et al. (2018) recorded a mean grain size of 0.314 mm in the offshore area, 0.129 mm in the nearshore area and 0.285 mm in the onshore area. Based on these mean grain sizes, we conducted a sensitivity analysis for two grain sizes (0.285 and 0.314 mm representing the offshore and onshore sediments).
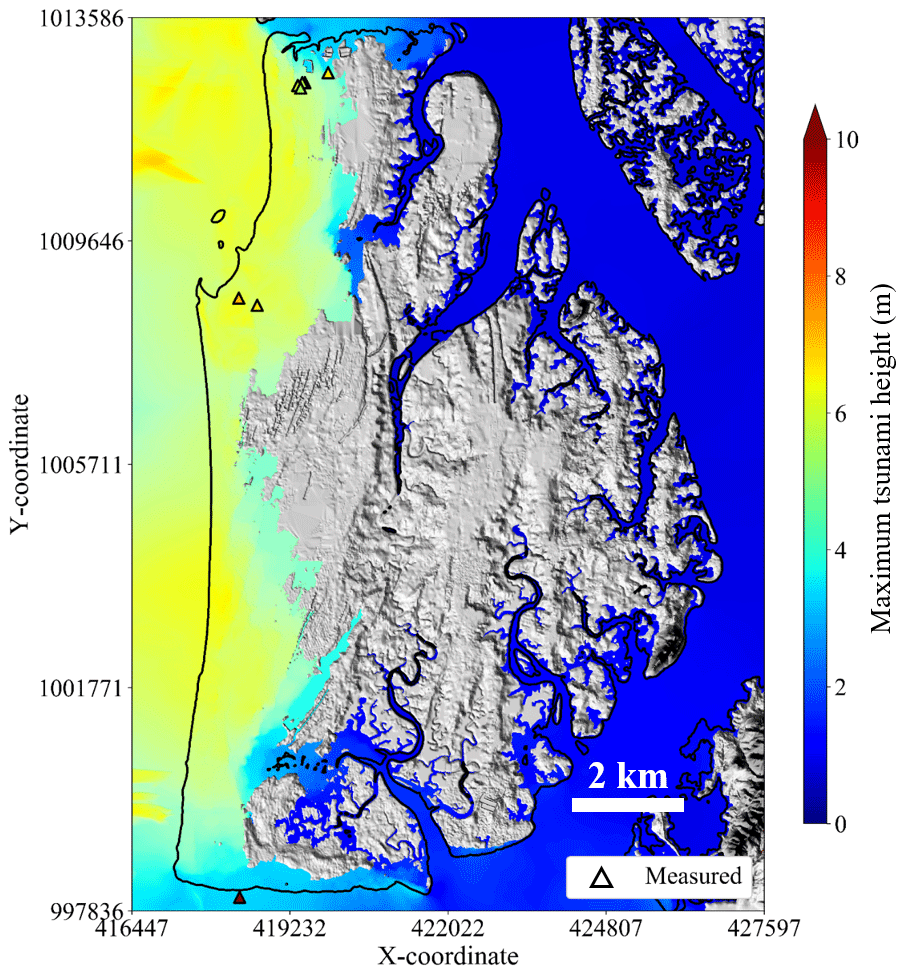
Figure 4Comparison of calculated and measured maximum tsunami height.
3.1 Verification of reproducibility
3.1.1 Tsunami height
Figure 4 shows the results of the calculation of the maximum tsunami heights and the seven measured tsunami heights on Phra Thong Island. From Eqs. (4) and (5), K=1.16 and κ=1.40 are obtained. The JSCE (2002) consider 0.95<K<1.05 and κ<1.45 as guides for evaluating reproducibility of tsunami numerical calculations. Although the K value is slightly higher than the guideline, this is because of an uncertain 19.6 m measured in the southern part of the Island. Additionally, the source model used in this calculation gives K=0.84 and κ=1.30 for reproducibility of tsunami height in the wide area along the coast of Thailand (Suppasri et al., 2011). Therefore, it can be said that this calculation has the same tsunami reproducibility as the previous study.

Figure 5Topographic change and shoreline position caused by the tsunami (solid and dashed lines show the coastline after and before the tsunami in the simulation; P and Q are the points of confirmed local beach erosion in regions (a) and (b); blue and red map erosion and deposition after the tsunami in the simulation).
3.1.2 Shoreline changes
Our sediment transport models identify the locations of significant sediment erosion, which are confirmed from post-tsunami satellite images. Figure 5 shows the pre-2004 Indian Ocean tsunami topographical and geomorphological features (dashed line) and the modeled changes caused by the tsunami (solid line). Erosion typically occurs locally where small tidal channels breach the youngest beach ridge system (Fig. 5a and b). Comparison with the satellite image shows that the position of erosion in both regions is consistent (Fig. 6). Although the actual amount of erosion is unknown, this indicates that the planar spread of the eroded component can be well reproduced by the calculation. Region (a) was further investigated in detail, as the area corresponds to the point where sediment outflow occurred (Jankaew et al., 2008).
.

Figure 6Comparison of observed shoreline position from Fig. 5 regions (a) and (b) derived from satellite images before and after the tsunami (20 December 2004 and 30 January 2005), which is overlain by the modeled extent of erosion showing that the modeled results closely match the observed changes. The red line is the calculated shoreline after the tsunami, and the yellow line is the shoreline before the tsunami (© CNES, 2019, Distribution Airbus DS”). (a1) Satellite image before the tsunami in region (a). (a2) Satellite image after the tsunami in region (a). (b1) Satellite image before the tsunami in region (b). (b2) Satellite image after the tsunami in region (b)
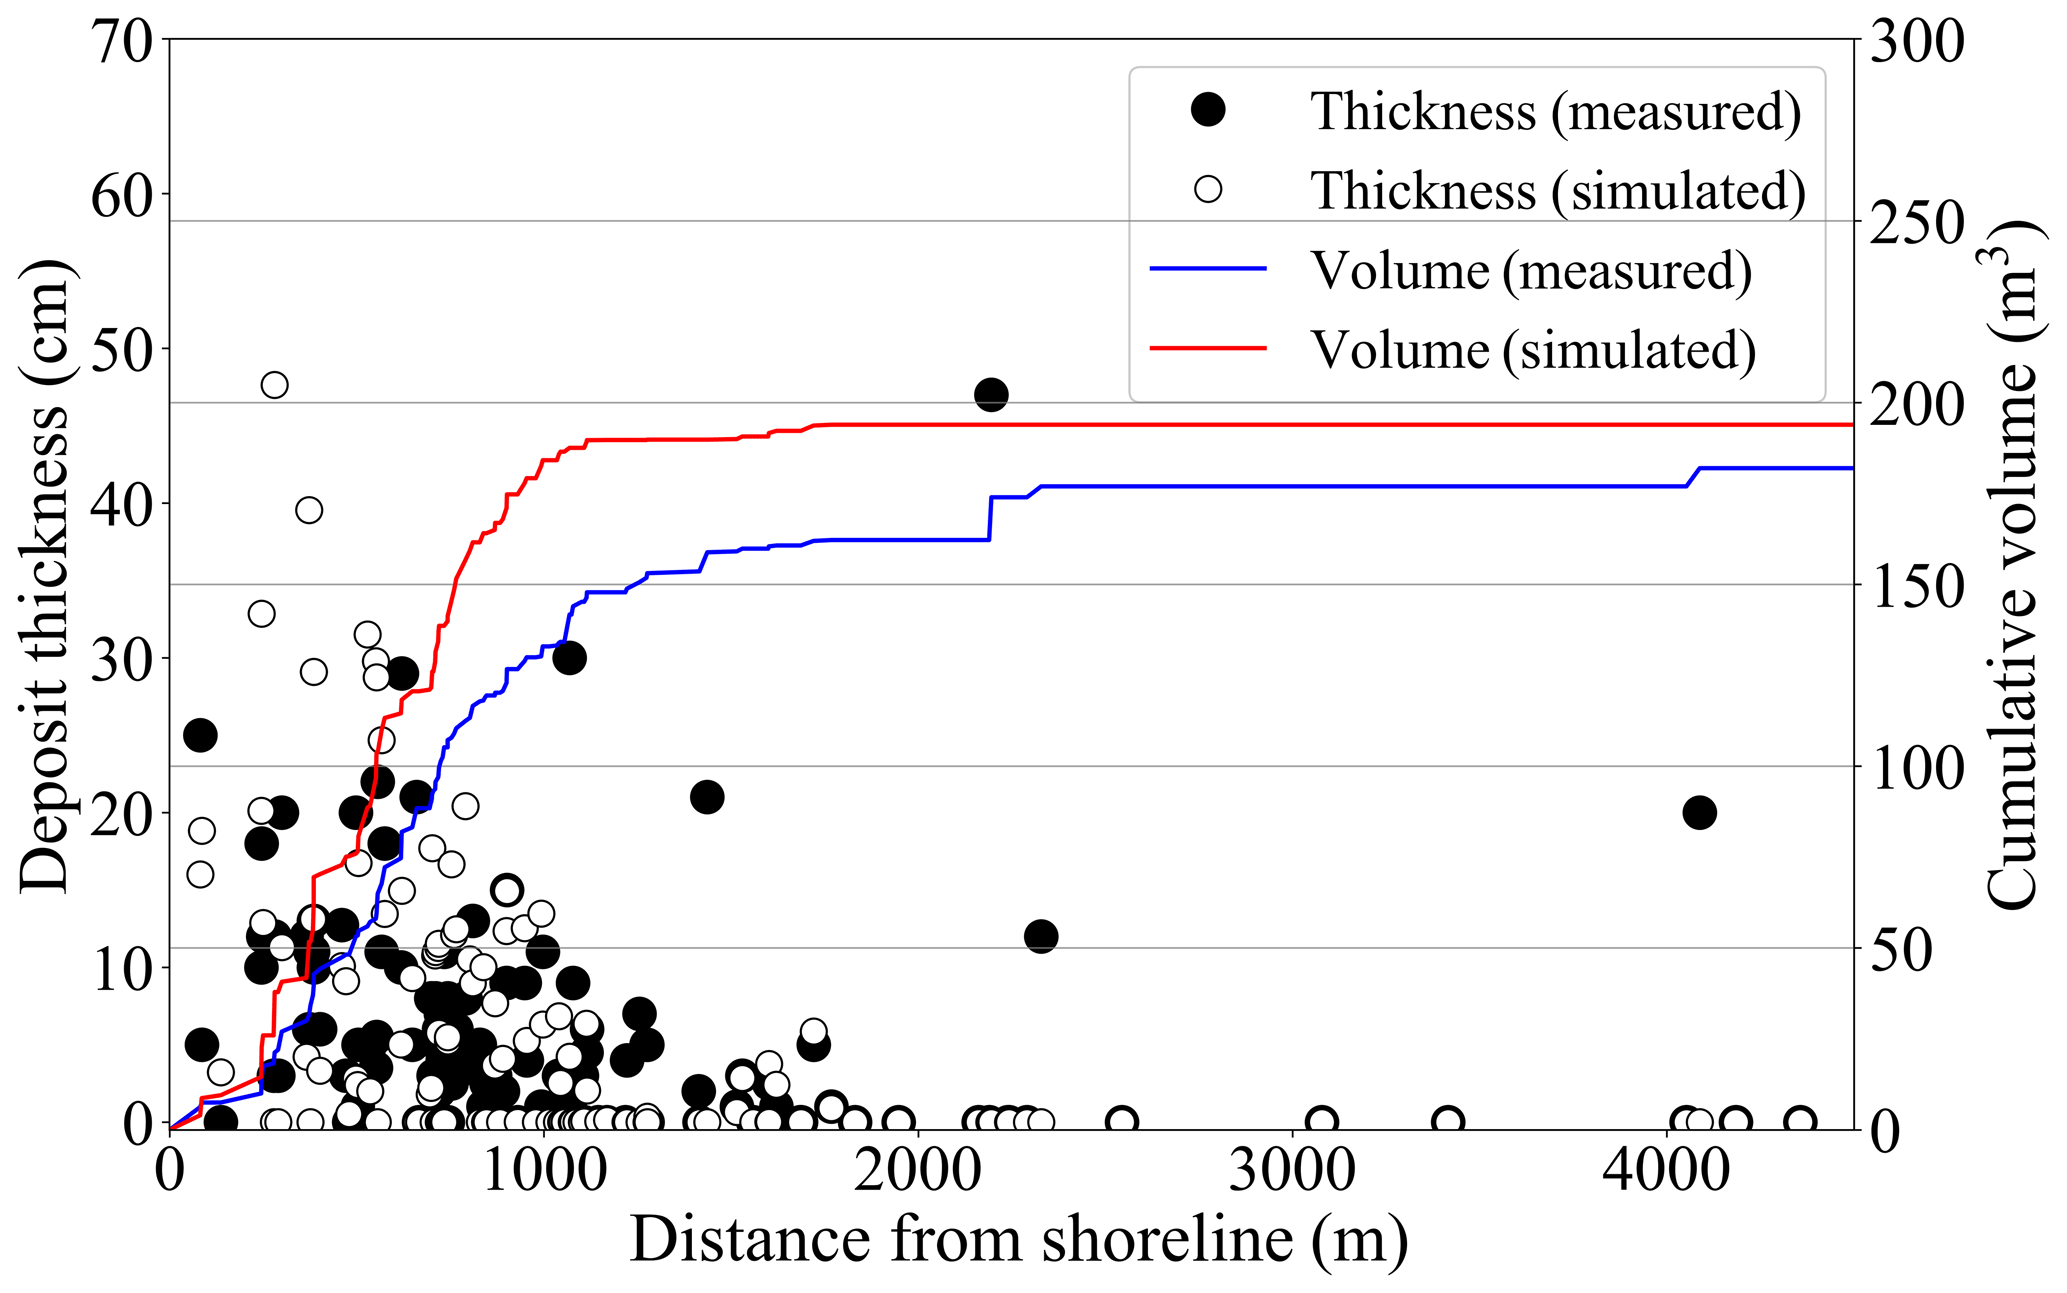
Figure 7Comparison of field-measured and simulated tsunami deposit thickness using a representative grain size of d=0.127 mm. The black point shows the measured thickness by Jankaew et al. (2008) and Gouramanis et al. (2017), and the white point shows the simulated thickness. The blue and red lines show the cumulative curves of measured data and simulated data.
3.1.3 2004 Indian Ocean tsunami onshore sediment deposition
In addition to the erosional features, the model simulated the deposition of 2004 Indian Ocean tsunami sediments across the island. The thickness of these simulated deposits is compared with 133 measured 2004 Indian Ocean tsunami deposit thicknesses (Jankaew et al., 2008; Gouramanis et al., 2017). Figure 7 shows a comparison of layer thicknesses at each site (black circles for measured results and white circles for simulated results), which shows that most of the sites are overestimated within 1 km from the shoreline and underestimated at distances greater than 2 km from the shoreline. The model specification and topographical data can be considered the major causes of this error.
First, considering the overestimation within 1 km of the inundation distance, it is found that the STM has a setting of the maximum suspended concentration, Cmax as 37.7 % (Xu, 1999a and b). The computed suspended concentration in this area is higher than Cmax. Therefore, the surplus sediment is forced to be deposited in this zone, causing overestimation. Pham et al. (2018) found that the source of tsunami deposits in Phra Thong Island is mainly the sediment from the nearshore zone. In other words, the first wave, which had the highest wave height, eroded a large amount of sediment in the nearshore and transported a large amount of sediment inland. Therefore, it is considered that the maximum concentration was reached during the first wave run-up because of the very high concentration of suspended sediment, which led to the overestimation of the forced sedimentation in the simulation.
Second, considering the underestimation of the deposition in inundation distances of 2 km or more, the most likely reason is the computational grid and the model specification. Previous studies have shown that tsunami deposits are highly affected by locality features (e.g., Sugawara et al., 2014a; Watanabe et al., 2018). As shown in three locations with the actual measured deposit thickness (dashed boxes) in Fig. 8, it can be seen that most of the measured thickness is zero, which indicates and supports the reasons of localized deposition from the 2011 tsunami (Goto et al., 2011b; Abe et al., 2012; Chagué-Goff et al., 2012). Although the computational grid is very fine (Δx6=5 m), it is difficult to reproduce local sedimentation with averaged elevation data. It is worth noting that STM adopts only single grain size and can only perform deposits which consist of sand. Sugawara et al. (2014a) conducted a tsunami sediment transport simulation on the Sendai Plain and discussed the transportation possibility of finer-grained sandy and muddy sediment. Muddy sediments were also found in the Sendai Plain at a distance of 2 km or more from the 2011 tsunami. The STM-based tsunami sediment transport simulation of Sugawara et al. (2014a) could not be reproduced for Phra Thong Island. This can be attributed to the limitation of sandy sediment and single grain size model. Therefore, it is possible that muddy or very fine-grained sediment was deposited at the three sites but was underestimated in the simulations using the current model.
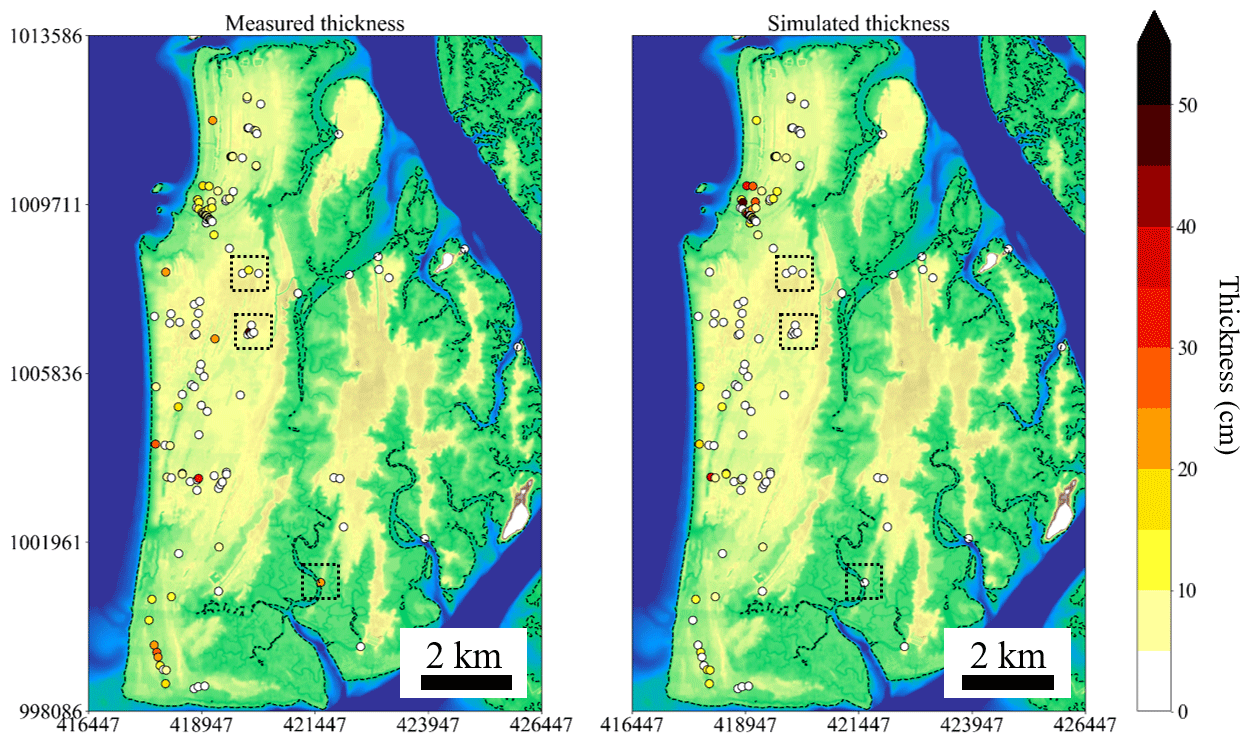
Figure 8Spatial distribution of measured and simulated thickness of tsunami deposits. The black dotted lines indicate that the calculated values are underestimated at distances greater than 2 km.
For all above-mentioned reasons, it is more practical to evaluate the simulation results by the overall trend of the tsunami deposit rather than comparing the thickness point by point. In Fig. 7, the line of “cumulative volume” shows the cumulative deposition expressed at each point by the sediment thickness multiplied by the area of the computational grid. In general, the tsunami deposits are greatly affected by local micro-topography (Sugawara et al., 2014a; Jaffe et al., 2016), and it is difficult to fit the modeled layer thickness with the observed layer thickness using DEM averaged in a computational grid. Therefore, we introduce the concept of cumulative sedimentation and evaluated the scale of the amount of sediment movement generated. Although the modeled layer thickness typically overestimates the observed layer thickness by +7 %, such low variation suggests a relatively successful reproduction of the observed dataset (Fig. 7). The modeled overestimation is likely due to the assumption that the entire exposed land area would act as a movable bed. In reality, this is an oversimplification of the true ground surface, which contains vegetation that binds and traps the soil and wet regions (i.e., in swales) that would have higher degrees of sediment cohesion, reducing the area that would be eroded. In addition, the model also reproduces the inland thinning of the 2004 Indian Ocean tsunami deposit. Based on these results, comparison of the sediment layer thickness of the 2004 tsunami shows that the scale and the overall sediment transport trend are comparable, and therefore, the results are sufficiently reproducible with confidence to evaluate the actual sediment transport.
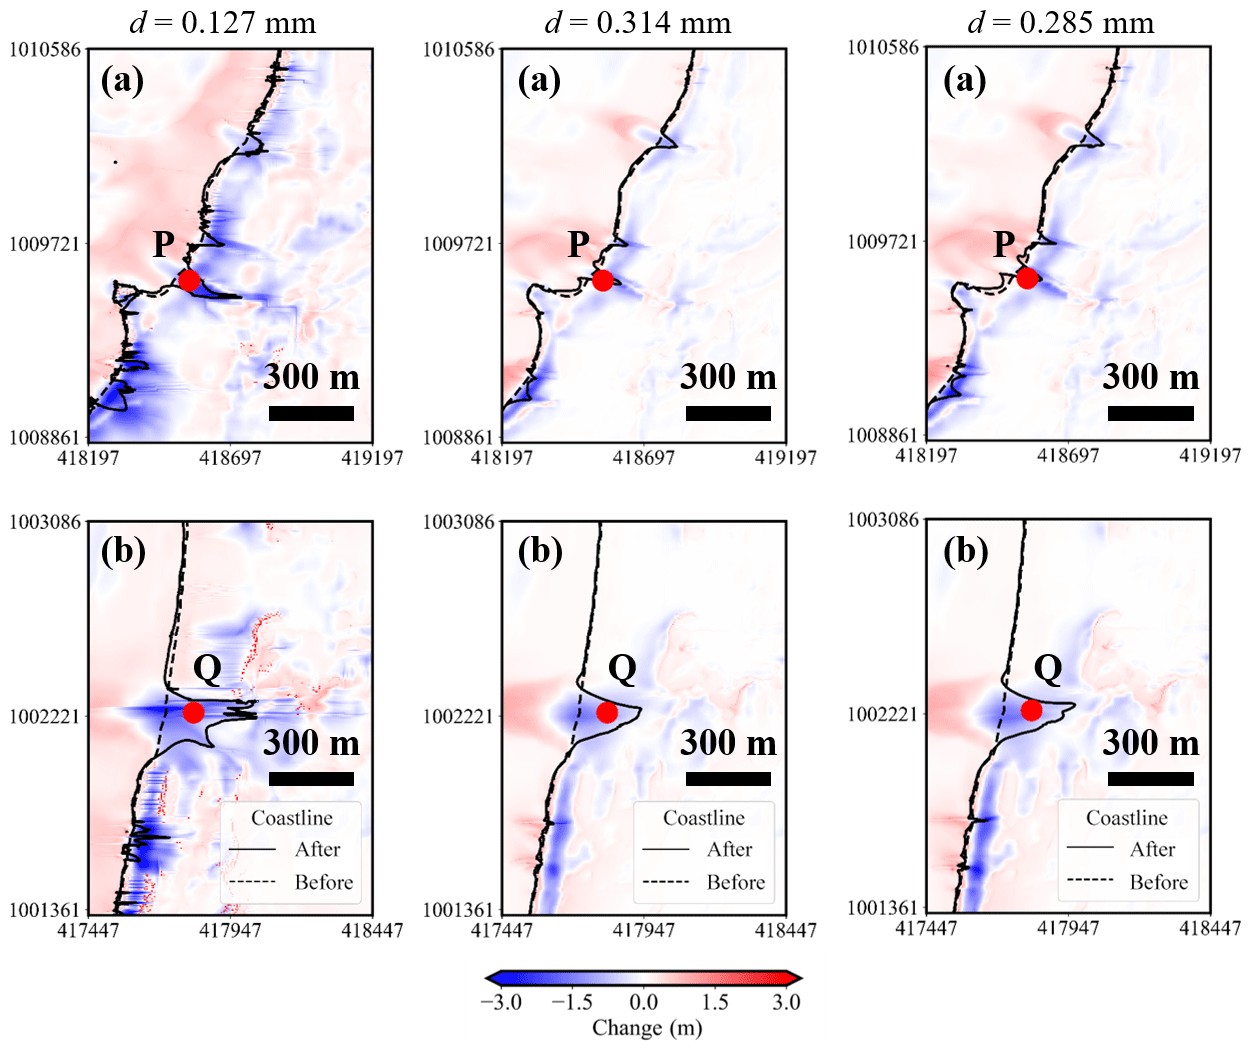
Figure 9Topographic change and shoreline position caused by the tsunami for each grain size.
Table 3Volume of erosion and deposition in regions (a) and (b) for each grain size (percentage shows the ratio to reference).
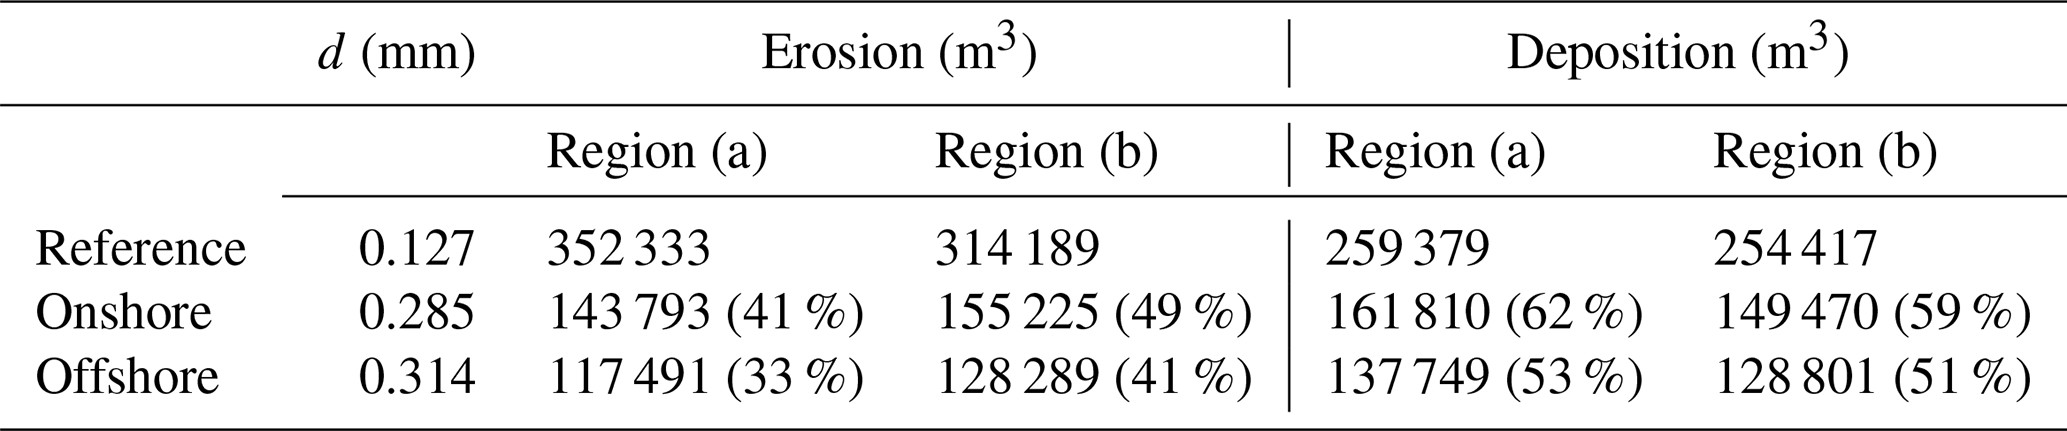

Figure 10Comparison of field-measured and simulated tsunami deposit thickness for each grain size.
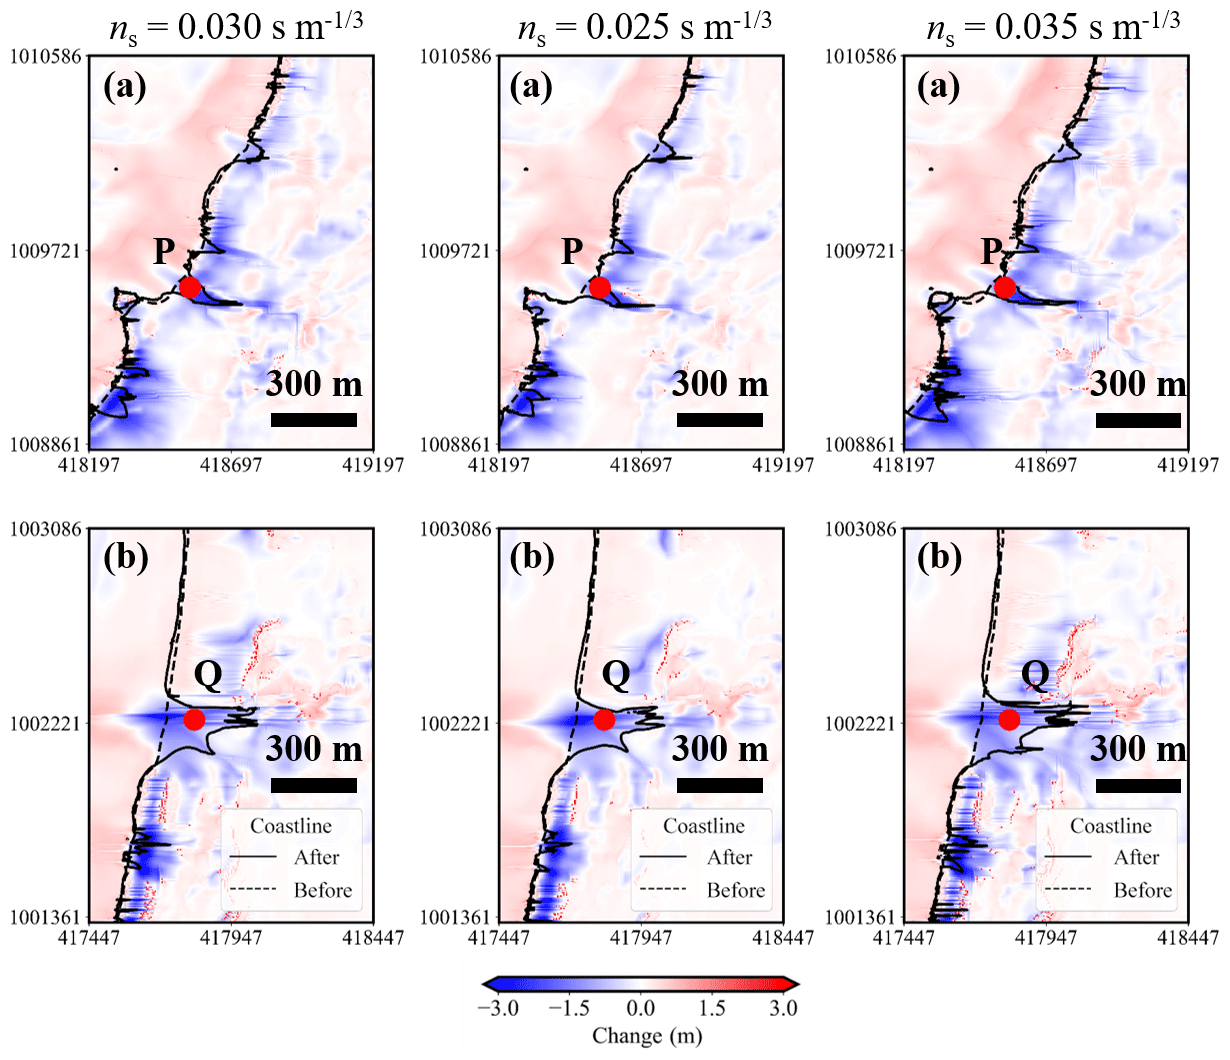
Figure 11Topographic change and shoreline position caused by the tsunami for each roughness coefficient.
Table 4Volume of erosion and deposition in regions (a) and (b) for each roughness coefficient (percentage shows the ratio to reference).
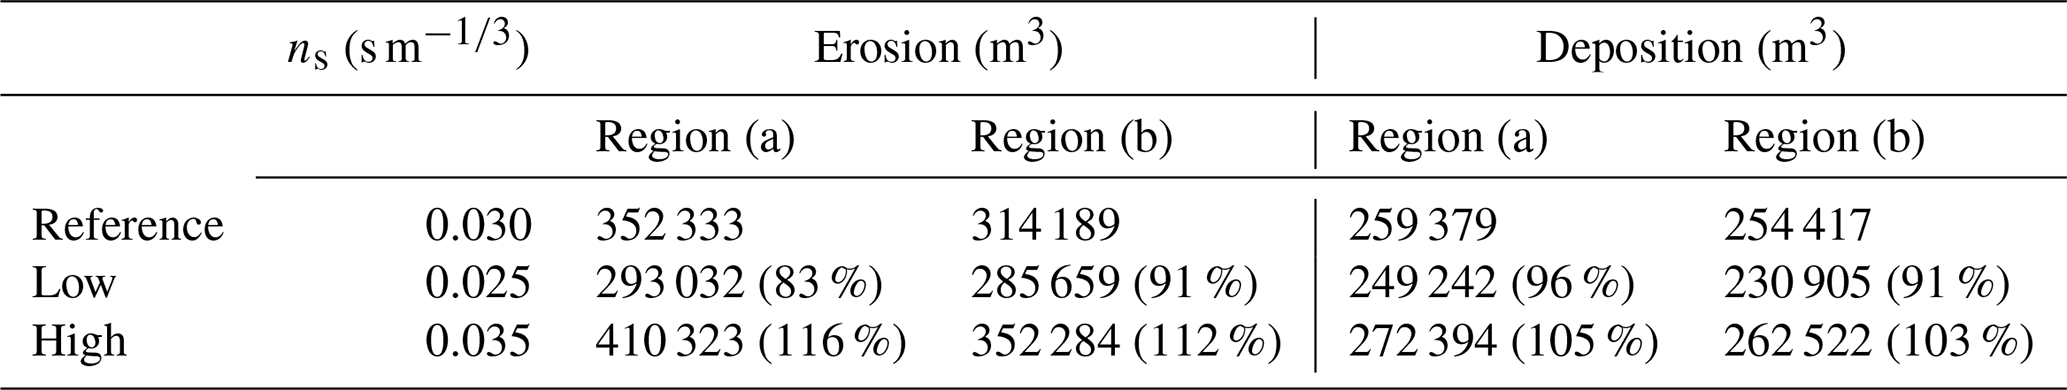

Figure 12Comparison of field-measured and simulated tsunami deposit thickness for each roughness coefficient.
3.1.4 Sensitivity analysis for grain size and roughness
Figure 9 shows the topographical changes and the thickness of the sediment layers used in this calculation for each grain size, and Table 3 shows the volume of erosion and deposition in regions (a) and (b). These figures show that the smaller the grain size is, the greater the topographic change. This can be understood as the smaller the grain size, the larger the Shields parameter in Eq. (10), which indicates the ease of sediment transport, and the greater the amount of bed load in Eq. (8). However, Fig. 9 suggests that the qualitative characteristics of sediment transport are the same in the three cases, due to the fact that the local erosion position of the beach in regions (a) and (b) did not change for any grain size. And then, comparing the tsunami sediment thickness in Fig. 10 the errors of the cumulative volume of d=0.314 mm and d=0.285 mm are −63 % and −55 %. Therefore, the grain size of d=0.127 mm is considered to show the better reproducibility.
Figure 11 shows the topographical changes and thickness of sediment layer in this calculation for each bottom roughness coefficient, and Table 4 shows the volume of erosion and deposition in regions (a) and (b). These figures show that the larger the value of roughness coefficient ns is, the greater the topographic change. This can be understood as the larger the roughness, the larger the Shields parameter in Eq. (10) because the friction velocity is proportionate to ns. Therefore, an increase in the roughness coefficient indicates the ease of sediment transport and the greater the amount of bed load in Eq. (8). However, Fig. 11 suggests that the qualitative characteristics of sediment transport are the same in the three cases, due to the local erosion position of the beach in regions (a) and (b) not changing for any bottom conditions. And then, comparing the tsunami sediment thickness in Fig. 12, the errors of the cumulative volume of ns= 0.025 s m and ns= 0.035 s m are −8 % and 13 %. Therefore, the roughness coefficient of ns= 0.030 s m is considered to show the better reproducibility.
3.2 Sediment transport process
Although the model reproduces the zones of sediment erosion and deposition well, the sediment transport processes during the tsunami event are further examined in regions (a) and (b) in Fig. 5. The modeled time series of the changes of water height and elevation at point P in region (a) and point Q in region (b) are shown in Fig. 13. The modeling results show that the first wave arrived 2 h 40 min after the earthquake, and backwash was generated 10 min later (Fig. 13). In addition, the ground surface elevation increased by about 30 cm through sediment deposition during the first inflowing wave, and more than 1.5 m was eroded during the backwash transporting sediment towards the ocean, so beach loss in both regions is considered to be a result of erosion during the backwash (red line in Fig. 13).
In addition, no major topographic changes occurred on the beaches in both areas after the second wave backwashed; most of the sediment movement on the eroded beaches is considered to have been completed by the second wave drawback. In other words, the sediment transport processes during this period are the most important to examine the shoreline changes that occurred during the tsunami and set up the primary conditions for beach recovery post-tsunami. As such, there are two narrow time periods that highlight the key factors for establishing the initial conditions of the recovery process. First, why was the beach not eroded by the inflowing waves? Second, how did the sediment flowing seaward in the first wave move?
Based on the waveform (which assumes a flat surface), a shore-normal cross-section calculation was carried out along the transect in Fig. 2. The transect covers the region (b) from 1000 m offshore across the shoreline and 1000 m inland. Beyond these distances the planar effect was considered to be negligible. Figure 14 shows the changes in ground level, water level, suspended sediment concentration and saturation of suspended sediment concentration on the transect at each unit of time as waves washed in and out.
3.2.1 Why was the beach not eroded by the pushing wave?
As shown in Fig. 14, prior to the first wave, the ocean receded to below approximately 8 m below mean sea level. As inflow of the first wave began, sediment was eroded from the sea floor at about 5–10 m below mean sea level. This nearshore erosion increased the suspended sediment concentration as the first wave propagated onshore. At the shoreline, the suspended sediment concentration saturated and sedimentation could begin at the shoreline. In other words, it is estimated that sediment eroded the nearshore (5 m < depth <10 m) environment during the first inflowing wave, and much of this sediment was transported shoreline and inland.
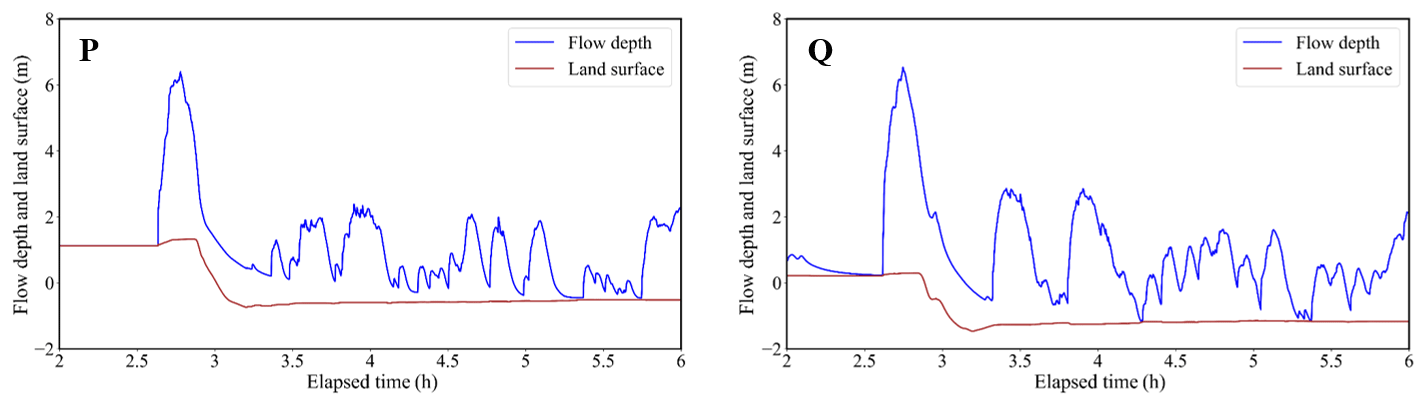
Figure 13Chronological change of flow depth and land surface at points P and Q in regions (a) and (b) (the blue line shows the flow depth and the red line shows the land surface).
It should be noted that there will be no increase in suspended sediment when the suspended sediment is saturated in the model and is the likely reason that the beach was not eroded by the inflowing first wave. Although there is a possibility that the beach was actually eroded, the numerical results suggest that the erosion in shallow coastal waters (deeper than 5 m but shallower than 10 m) resulted in a very high concentration of suspended sediment when the inflowing first wave entered −5 m to the beach section of the coast and sediment ceased to be entrained. Pham et al. (2018) found that the source of the 2004 Indian Ocean tsunami deposits on Phra Thong Island was from the nearshore (depth <15 m). This means that large-scale erosion in shallow water has occurred and a large amount of sediment has been transported inland, which agrees with the simulation results. Therefore, it is highly likely that the sediment concentration was very high when it reached the beach during the first inflowing wave. Takahashi (2012) showed that when the suspended sediment is in a high concentration state, turbulence is suppressed and the ability to retain suspended sediment may decrease. Therefore, it is highly probable that the same phenomenon occurred on Phra Thong Island and the beach erosion during the inflowing wave was suppressed.
3.2.2 How did the sediment flowing seaward in the first wave move?
In Fig. 14, at the initiation of backwash, the suspended sediment concentration is low. As backwash flows towards the ocean, the velocity increases, which increases erosion and causes the suspended sediment concentration to increase. This finding is consistent with the changes recorded in Fig. 13. Beach erosion due to backwash has also been confirmed for the 2004 Indian Ocean tsunami in Sri Lanka and the 2011 tsunami along the Sendai Plain and at Rikuzentakata (e.g., Tanaka et al., 2007, 2011; Yamashita et al., 2015, 2016). On the Sendai Plain, the estuary section of the old river tends to increase the return flow due to the tsunami (Tanaka et al., 2007, 2011). Therefore, there is a possibility that regions (a) and (b) (Figs. 2, 5 and 6) where local beach erosion of the backwash occurred on Phra Thong Island are the old river part.
Conversely, the entire beach was eroded by the return flow in Rikuzentakata (Yamashita et al., 2015, 2016), but no erosion was observed along the entire beach on Phra Thong Island and the Sendai Plain. Yamashita et al. (2015, 2016) suggested that the difference between Rikuzentakata and the Sendai Plain may be related to the horizontal distance of the plains. On the Sendai Plain, the inland topographic gradient is small, the inundation distance is long and the inland inundation depth tends to be small. Therefore, the potential energy that the inundation depth changes to kinetic energy during the backwash (return flow) becomes relatively small. The Sendai Plain and Phra Thong Island are flooded plains over 2 km inland and have similar topographical features.
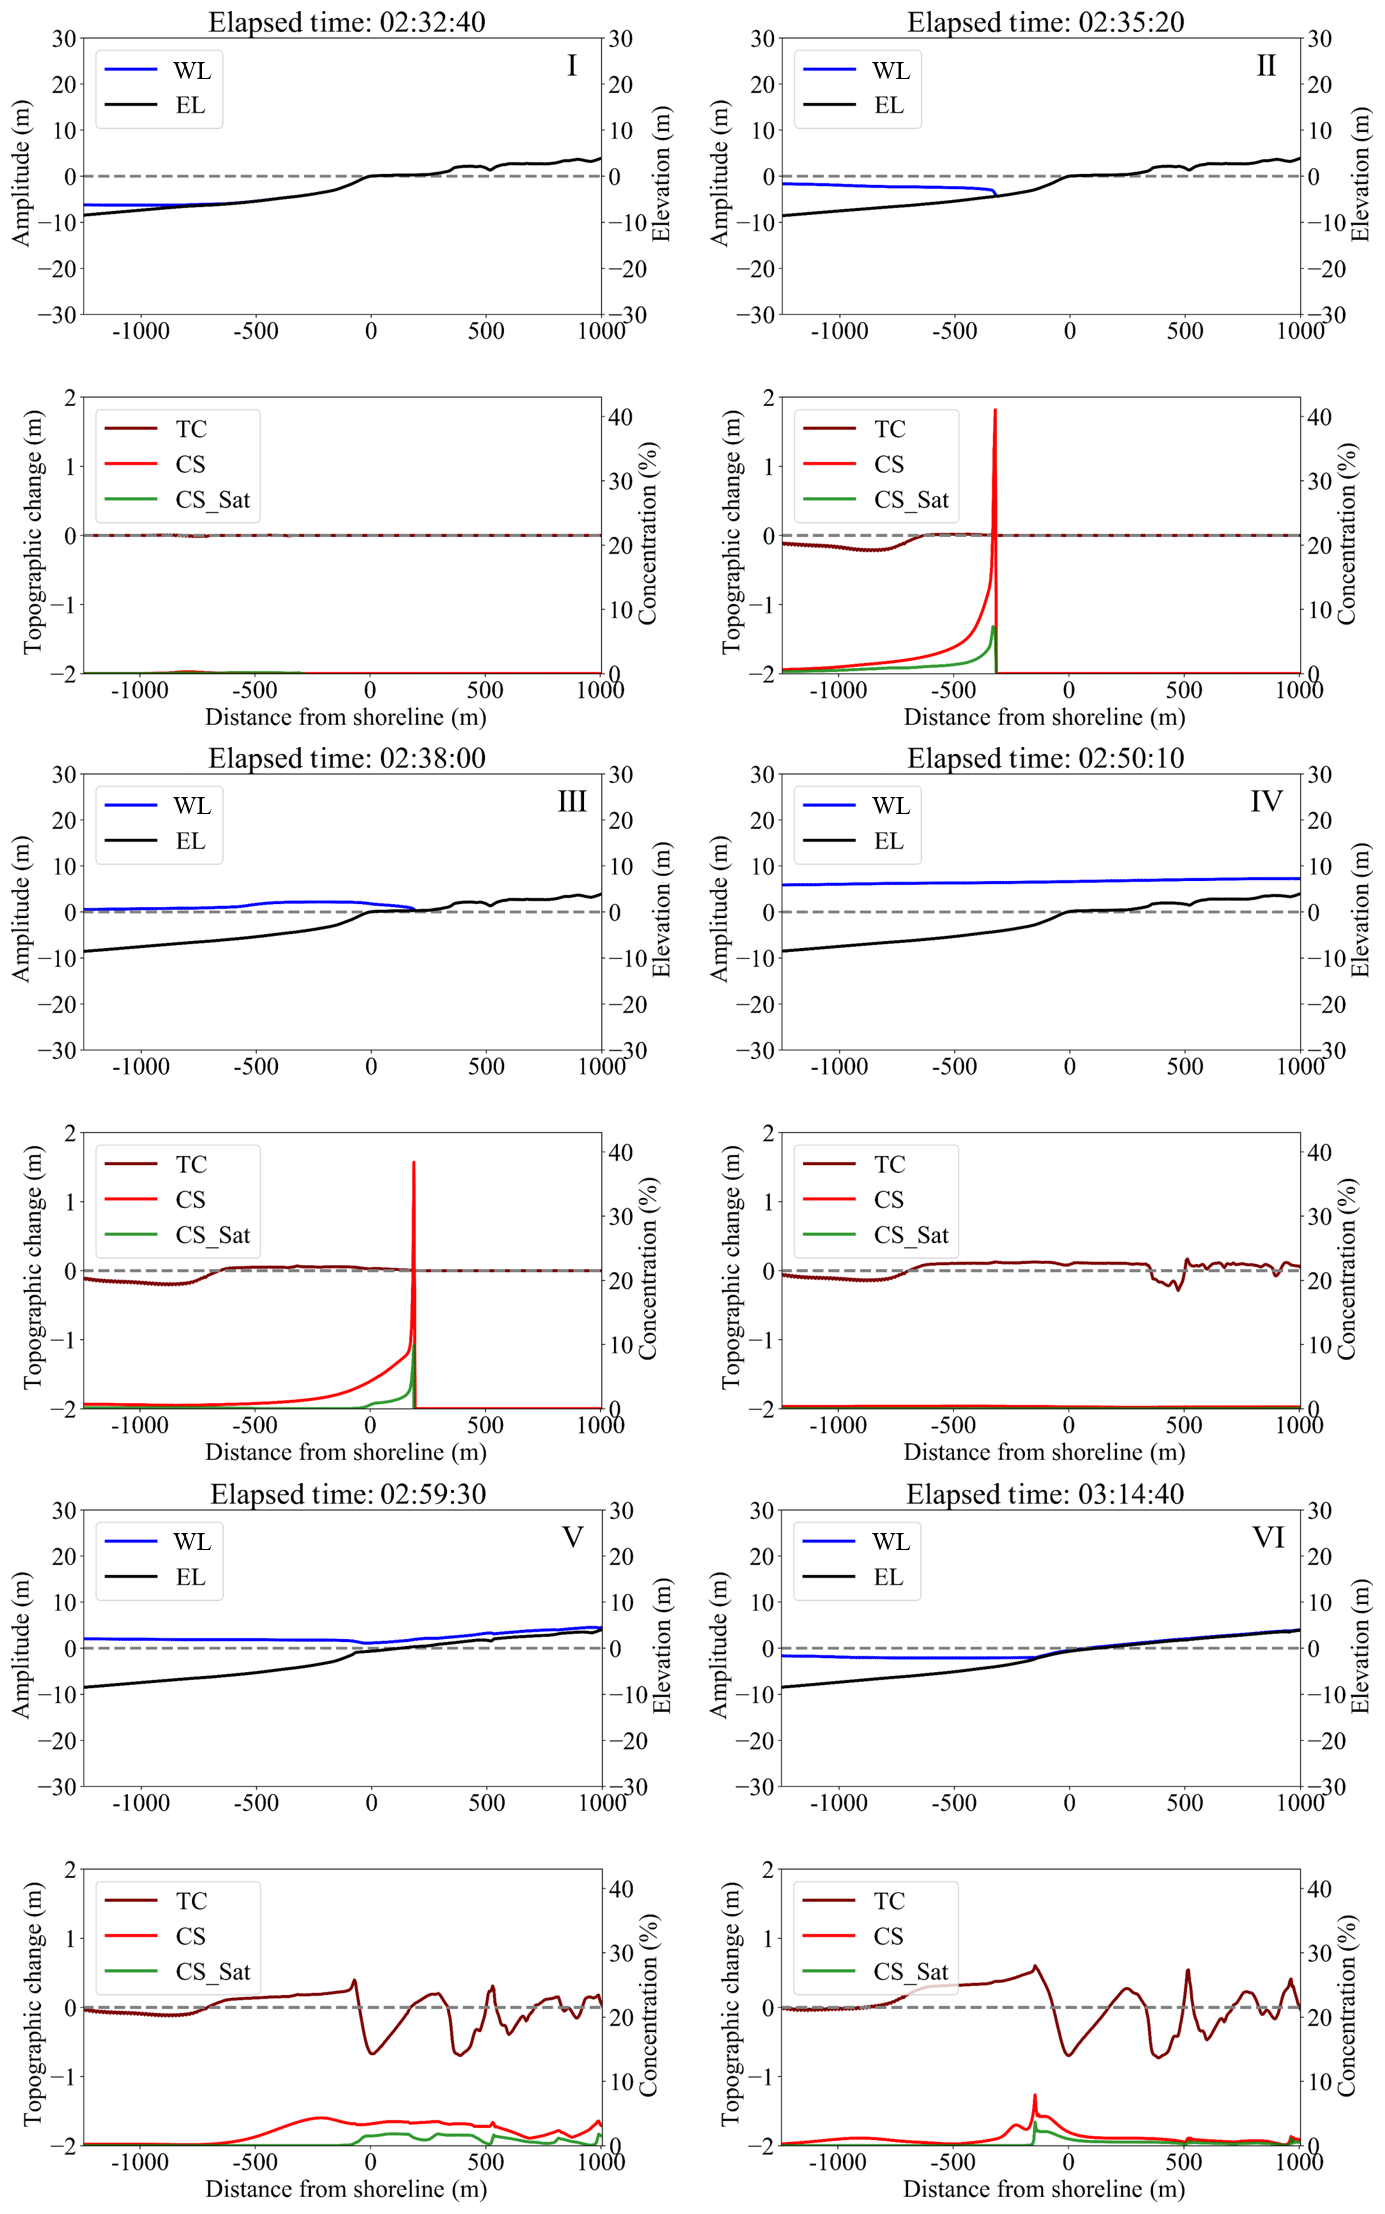
Figure 14Change in water level (WL), land surface (EL), topographic change (TC), suspended sediment concentration (CS) and saturation suspended sediment concentration (CS_Sat) by section calculation along the survey line in region (b). (I) before the first inflowing wave, (II) Advance of first leading wave in shallow water. (III) Start of first leading wave run-up. (IV) Maximum of first leading wave. (V) Advance of second backwash. (VI) Maximum of second backwash.
For the above reasons, the local beach erosion due to the return flow on Phra Thong Island occurred at the mouths of tidal channels and within tidal channels, and minimal erosion occurred across the wider beach ridge strand plain. As backwash of the first wave ended, the water still contained a high suspended sediment concentration and this was deposited in the nearshore environment at less than 5 m water depth (Fig. 15). After that, no significant topographic change was found. Thus, modeling shows that most of the sediment that eroded from the onshore area was deposited in the shallow nearshore zone.
4.1 Sediment transport process and beach erosion
Regions (a) and (b) were selected for detailed investigation of the simulation results and discussed. On Phra Thong Island, the 2004 Indian Ocean tsunami wave was large enough to expose the nearshore sediments and entrained most of its sediments from the shallow offshore region (below 5m). The wave ran up the exposed nearshore area while retaining sediment from the shallow offshore region. The sediment concentration gradually increases as the wave runs up the relatively long distance of the exposed nearshore zone and becomes sediment-saturated as the wave reaches the shoreline, making it difficult for new sediment to be eroded further. This explains why there was little erosion of the beach during the inflowing wave and may be a characteristic sediment transport property of shallow beaches like those on Phra Thong Island. The numerical simulation results suggest that there is little transportation of sediments from the beach by the first inflowing wave and that inland tsunami deposits originated from the nearshore environment. This finding validates the observation of Sawai et al. (2009) that the 2004 Indian Ocean tsunami entrained diatoms from shallow offshore waters at Phra Thong Island, and the observation of Pham et al. (2018) that sediment grain sizes and mineralogy were most similar to those of nearshore sediments. Figure 15 shows the results of the calculated sediment deposition both onshore and offshore of Phra Thong Island. From the modeling results, most of the eroded sediment was deposited in shallow nearshore environments in water less than approximately 5 m deep.
The simulations show that the eroded sediments were deposited in the nearshore zone during backwash (Fig. 15), which primed the coastal zone for rapid coastal recovery. The removal of sediment from the onshore coastal zone also generated accommodation space that may have contributed to the coastal recovery process. Future studies can build on these findings to determine the extent of sediment transport and deposition and identify the processes of coastal recovery on Phra Thong Island.
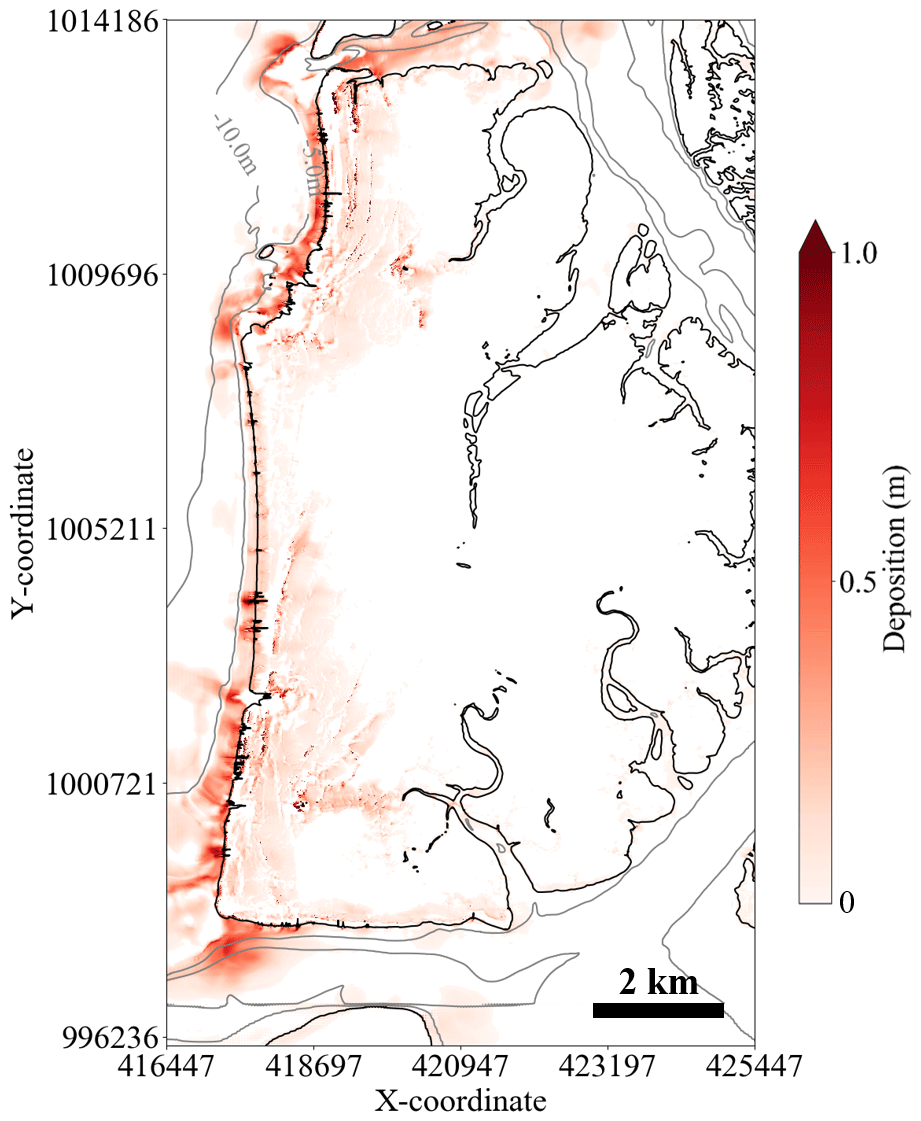
Figure 15Sediment distribution derived from the simulation (showing depth contours at 5 m intervals in the sea area).
Geomorphologically, the Sendai Plain, which was inundated by the 11 March 2011 Tōhoku tsunami, is similar to the beach ridge plain on Phra Thong Island (Tanaka et al., 2011), but most of the tsunami sediment deposited onshore came from terrestrial sources (Goto et al., 2012; Szczuciński et al., 2012; Takashimizu et al., 2012; Sugawara et al., 2014b). However, the Tōhoku tsunami differed from the 2004 Indian Ocean tsunami as the Japanese event had a much smaller receding wave (Nationwide Ocean Wave information network for Ports and HArbourS, NOWPHAS; available at http://www.milt.go.jp/kowan/nowphas, last access: 19 October 2020). As such the Japanese tsunami may not have achieved sediment saturation as the wave approached the shoreline, thereby containing a lower sediment concentration and allowing large volumes of sediment to be entrained from the beach for subsequent formation of inland deposits. The different sources of deposited sediment in the two areas reflect contrasting sediment transport mechanisms on shallow beaches and may be useful for identifying paleotsunami from coastal recovery and geological records.
4.2 Limits of calculation results
This study analyzed tsunami sediment transport on Phra Thong Island using numerical calculations and assumed that the island was unvegetated and lacked topography. However, the western half of the island has an undulating surface caused by the beach ridge and swale system and is extensively vegetated with trees and dense grasses on the ridges and thick grasses within the swales. The eastern half of the island has wide tidal channels and an extensive fringing mangrove system. Both topography and differing vegetation types add complexity to the inundation and backflow sediment transport models not captured here. In the future, it is necessary to consider the influence of vegetation and topography on tsunami sediment transport.
Another potential limitation of the model is the selection of a single (median) grain size for the sediments. As shown in previous studies (e.g., Sugawara et al., 2014a, b), the assumption of transport of single-grain-sized sediment differs from actual situations because of the distribution of grain sizes mobilized and deposited by tsunami. Therefore, it is important to set representative grain sizes and fully study how grain size affects tsunami sediment transport. Future modeling may consider simulating the suite of grain sizes individually or simulating a population of grain sizes that are identified in the modern environment and in preserved tsunami deposits.
Furthermore, although the calculation was performed considering the entire area a movable bed, the existence of fixed beds, such as rocky areas, should be considered. We consider this a minor component of this research as the rocky headlands that serve as fixed beds are relatively small in area and would contribute little to the overall simulations in our models.
Sugawara et al. (2014b) consider the simulation result of sediment layer thickness using the tsunami sediment transport calculation to be affected by grain size, bottom conditions and topographic data. Their study showed that the layer thickness increases as grain size becomes finer, and the layer thickness distribution tendency was unchanged regardless of grain size. Similar results were obtained in this study.
Because of insufficient knowledge about the topographic recovery process after a tsunami, this study used sediment transport modeling to identify the erosional and depositional processes affecting the coastal zone at Phra Thong Island, Thailand, during the 2004 Indian Ocean tsunami.
First, it was confirmed by comparing simulated results of the shoreline and sediment layer thickness that the location of beach runoff identified on Phra Thong Island was reproducible and consistent with sediment transport results (Figs. 6 and 7). Based on the sediment transport results, we conclude that the processes of sediment erosion and deposition on Phra Thong Island are characterized by the following sequence:
-
erosion caused by the inflowing waves occurred at a relatively shallow location in the offshore area, and the transported sediment was deposited near the shoreline;
-
the inflowing waves caused minimal erosion of the shoreline; and
-
erosion of the shoreline was largely caused by backwash resulting in onshore sediments deposited in the shallow nearshore zone.
These erosional and depositional processes demonstrate the locations of sediment removal and subsequent deposition during the different phases of the first tsunami wave on Phra Thong Island which will serve as an important baseline of sediment sources for further study of the recovery process. The simulations also show that the zones of erosion and deposition across the island and offshore coastal zone are non-uniform. In particular, the zones of erosion and deposition highlighted in the simulations establish the environmental conditions that existed in the transitional phase between catastrophic tsunami and normal coastal processes that facilitated coastal recovery.
We would like to express our gratitude for the support from Dr. Panon Latcharote of the Faculty of Engineering, Mahidol University; Supot Teachavorasinskun, Dean of Faculty of Engineering, Chulalongkorn University; Pitcha Jongvivatsakul, Department of Civil Engineering, Chulalongkorn University; Sorot Sawatdiraksa, Thai Meteorological Department; Ratchaneekorn Thongthip, International Tsunami Museum (Thailand); and the Royal Thai Navy for data. This work is a contribution to IGCP project 639, “Sea-level Change from Minutes to Millennia”.
This research has been supported by the JSPS Grant-in-Aid for Scientific Research (A) (grant no. 17H01631), the JSPS Bilateral program for joint research with the National Research Council of Thailand (NRCT), the NUS start-up grant (grant no. R-109-000-223-133), and the Ratchadapisek Sompoch Endowment Fund (2019), Chulalongkorn University (grant no. 762003-CC).
This paper was edited by Maria Ana Baptista and reviewed by Pedro Costa and four anonymous referees.
Abe, T., Goto, K., and Sugawara, D.: Relationship between the maximum extent of tsunami sand and the inundation limit of the 2011 Tohoku–oki tsunami on the Sendai Plain, Japan, Sediment. Geol., 282, 142–150, 2012.
Aida, I.: Reliability of a tsunami source model derived from fault parameters, J. Phys. Earth, 26, 57–73, 1978.
Ali, P. Y. and Narayana, A. C.: Short-term morphological and shoreline changes at Trinkat Island, Andaman and Nicobar, India, after the 2004 tsunami, Mar. Geod., 38, 26–39, 2015.
Arimitsu, T., Kawasaki, K., and Nimura, M.: Numerical simulation of sediment transport and bottom topography change due to tsunami with large scale eddy, Journal of JSCE, B2 (Coastal Engineering), 73, 643–648, 2012.
Arimitsu, T., Matsuda, S., Murakami, Y., Shikata, T., Kawasaki, K., Mishima, T., Shimizu, R., and Sugawara D.: Influence of computational parameters on accuracy of movable bed model for tsunamis, Coast. Eng., 73, 589–594, 2017.
Apotsos, A., Buckley, M., Gelfenbaum, G., Jaffe, B., and Vatvani, D.: Nearshore tsunami inundation model validation: toward sediment transport applications, Pure Appl. Geophys., 168, 2097–2119, 2011a.
Apotsos, A., Gelfenbaum, G., and Jaffe, B.: Process-based modeling of tsunami inundation and sediment transport, J. Geophys. Res., 116, F01006, https://doi.org/10.1029/2010JF001797, 2011b.
Apotsos, A., Gelfenbaum, G., Jaffe, B., Watt, S., Peck, B., Buckley, M., and Stevens, A.: Tsunami inundation and sediment transport in a sediment-limited embayment on American Samoa, Earth-Sci. Rev., 107, 1–11, 2011c.
Bagnold, R. A.: An approach to the sediment transport problem from general physics, US government printing office, Washington, D.C., 1966.
Brill, D., Klasen, N., Jankaew, K., Brückner, H., Kelletat, D., Scheffers, A., and Scheffers, S.: Local inundation distances and regional tsunami recurrence in the Indian Ocean inferred from luminescence dating of sandy deposits in Thailand, Nat. Hazards Earth Syst. Sci., 12, 2177–2192, https://doi.org/10.5194/nhess-12-2177-2012, 2012a.
Brill, D., Klasen, Brückner, H., Jankaew, K., Scheffers, A., Kelletat, D., and Scheffers, S.: OSL dating of tsunami deposits from Phra Thong Island, Thailand, Quat. Geochronol., 10, 224–229, 2012b.
Brill, D., Jankaew, K., and Bruckner, H.: Holocene evolution of Phra Thong's beach-ridge plain (Thailand) – Chronology, processes and driving factors, Geomorphology, 245, 117–134, 2015.
Chagué-Goff, C., Andrew, A., Szczuciński, W., Goff, J., and Nishimuira, Y.: Geochemical signatures up to the maximam inundation of the 2011 Tohoku–oki tsunami – Implications for the 869 AD Jogan and other palaeotsunamis, Sediment. Geol., 282, 65–77, 2012.
Choowong, M., Phantuwongraj, S., Charoentitirat, T., Chutakositkanon, V., Yumuang S., and Charusiri, P.: Beach recovery after 2004 Indian Ocean tsunami from Phang–nga, Thailand, Geomorphology, 104, 134–142, 2009.
Fagherazzi, S. and Du, X.: Tsunamigenic incisions produced by the December 2004 earthquake along the coasts of Thailand, Indonesia and Sri Lanka, Geomorphology, 99, 120–129, 2008.
Feldens, P., Schwarzer, K., Szczuciński, W., Stattegger, K., Sakuna, D., and Somgpongchaiykul, P.: Impact of 2004 tsunami on seafloor morphology and offshore sediments, Pakarang Cape, Thailand, Pol. J. Environ. Stud., 18, 63–68, 2009.
Fujino, S., Naruse H., Matsumoto, D., Jarupongsakul T., Sphawajruksakul A., and Sakakura, N.: Stratigraphic evidence for pre–2004 tsunamis in southwestern Thailand, Mar. Geol., 262, 25–28, 2009.
Fujino, S., Naruse, H., Matsumoto, D., Sakakura, N., Suphawajruksakul, A., and Jarupongsakul, T.: Detailed measurements of thickness and grain size of a widespread onshore tsunami deposit in Phang–nga Province, southwestern Thailand, Isl. Arc, 19, 389–398, 2010.
Gelfenbaum, G., Vatvani D., Jaffe B., and Dekker F.: Tsunami inundation and sediment transport in vicinity of coastal mangrove forest, Coastal Sediments, 7, 1117–1128, 2007.
Goto, K., Takahashi, J., Oie, T., and Imamura, F.: Remarkable bathymetric change in the nearshore zone by the 2004 Indian Ocean tsunami: Kirinda Harbor, Sri Lanka, Geomorphology, 127, 107–116, 2011a.
Goto, K., Chagué-Goff, C., Fujino, S., Goff, J., Jaffe B., Nishimura, Y., Richmond, B., Sugawara, D., Szczuciński, W., Tappin, R. D., Witter, C. R., and Yuliant, E., New insights of tsunami hazard from the 2011 Tohoku–oki event, Mar. Geol., 290, 46–50, 2011b.
Goto, K., Chagué-Goff, C., Goff, J., and Jaffe, B.: The future of tsunami research following the 2011 Tohoku–oki event, Sediment. Geol., 282, 1–13, 2012.
Gouramanis, C., Switzer, A. D., Polivka, P. M., Bristow, C. S., Jankaew, K., Dat, P. T., Pile, J., Rubin, C. M., Yingsin, L., Ildefonso, S. R., and Jol, H. M.: Ground penetrating radar examination of thin tsunami beds – A case study from Phra Thong Island, Thailand, Sediment. Geol., 329, 149–165, 2015.
Gouramanis, C., Switzer, A. D., Jankaew, K., Bristow, C. S., Pham, D. T., and Ildefonso, S. R.: High-frequency coastal overwash deposits from PHRA thong Island, Thailand, Sci. Rep., 7, 1–9, 2017.
Gusman, A. R., Tanioka, Y., and Takahashi, T.: Numerical experiment and a case study of sediment transport simulation of the 2004 Indian Ocean tsunami in Lhok Nga, Banda Aceh, Indonesia., Earth Planets Space, 64, 817–827, 2012.
Haraguchi, T., Takahashi, T., Hisamatsu, R., Morishita, Y., and Sasaki, I.: A Field Survey of Geomorphic Change on Kessennuma Bay caused by the 2010 Chilean Tsunami and the 2011 Tohoku Tsunami, Journal of JSCE, B2 (Coastal Engineering), 68, 231–235, 2012.
Hawkes, A. D., Bird, M., Cowie, S., Grundy-Warr, C., Horton, B. P., Hwai, A. T. S., Law, L., Macgregor, C., Nott, J., Ong, J. E., Rigg, J., Robinson, R., Tan-Mullins, M., Sa, T. T., Yasin, Z., and Aik, L. W.: Sediments deposited by the 2004 Indian Ocean Tsunami along the Malaysia–Thailand Peninsula, Mar. Geol., 242, 169–190, 2007.
Hirao, R., Tanaka, H., Umeda, M., Adityawan, M. B., Mano, A., and Udo, K.: Breaching of Sandy Coast and Spit Due To The 2011 Tsunami and Their Recovery, Journal of JSCE, B2(Coastal Engineering), 68, 581–585, 2012.
Imai, K., Sugawara, D., Takahashi, T., Iwama, S., and Tanaka, H.: Numerical study for sediment transport due to tsunami around the Kitakami River mouth, Journal of JSCE, B2(Coastal Engineering), 71, 247–252, 2015.
Imamura, F.: Review of tsunami simulation with a finite difference method, in: Long-Wave Runup Models, edited by: Yeh, H., Liu, P., and Synolakis, C. E., World Scientific Publishing Co., Singapore, 25–42, 1996.
Iwagaki, Y.: Hydrodynamical study on critical tractive force, Trans. JSCE, 41, 1–21, 1956.
Jaffe, B., Goto, K., Sugawara, D., Gelfenbaum, G., and La Selle, S.: Uncertainty in tsunami sediment transport modeling, Journal of Disaster Research, 11, 647-661, 2016.
Jankaew, K., Atwater, B. F., Sawai, Y., Choowong, M., Charoentitirat, T., Martin, M. E., and Prendergast, A.: Medieval forewarning of the 2004 Indian Ocean tsunami in Thailand, Nature, 455, 1228–1231, 2008.
JSCE – Japan Society of Civil Engineers: Tsunami assesment method for nuclear power plants in Japan, available at: https://www.jsce.or.jp/committee/ceofnp/Tsunami/eng/JSCE_Tsunami_060519.pdf (last access: 19 October 2020, 2002.
Koiwa, N., Takahashi, M., Sugisawa, S., Ito, A., Aki Matsumoto, H., Tanavud, C., and Goto, K.: Barrier spit recovery following the 2004 Indian Ocean tsunami at Pakarang Cape, southwest Thailand, Geomorphology, 306, 314–324, 2018.
Land Development Department of Thailand (LDD) Maps and mapping information, available at: http://www.ldd.go.th/www/lek web/web.jsp?id=19273 (last access: 18 October 2017), 2018.
Li, L. and Huang, Z.: Modeling the change of beach profile under tsunami waves: a comparison of selected sediment transport models, J. Earthq. Tsunami, 7, 1350001, https://doi.org/10.1142/S17934311135000122013, 2013.
Li, L., Qiu, Q., and Huang, Z.: Numerical modeling of the morphological change in Lhok Nga, west Banda Aceh, during the 2004 Indian Ocean tsunami: understanding tsunami deposits using a forward modeling method, Nat. Hazards, 64, 1549–1574, 2012.
Li, L., Huang, Z., and Qiu, Q.: Numerical simulation of erosion and deposition at the Thailand Khao Lak coast during the 2004 Indian Ocean tsunami, Nat. Hazards, 74, 2251–2277, 2014.
Liew, S. C., Gupta, A., Wong, P. P., and Kwoh, L. K.: Recovery from a large tsunami mapped over time: The Aceh coast, Sumatra, Geomorphology, 114, 520–529, 2010.
Morishita, Y. and Takahashi, T.: Accuracy improvement of movable bed model for tsunamis by applying for Kesennuma bay when the 2011 Tohoku tsunami arrived, Journal of JSCE, B2(Coastal Engineering), 70, 491–495, 2014.
Ranasinghe, D. P. L., Goto, K., Takahashi, T., Takahashi, J., Wijetunge, J. J., Nishihata, T., and Imamura, F.: Numerical assessment of bathymetric changes caused by the 2004 Indian Ocean tsunami at Kirinda Fishery Harbor, Sri Lanka, Coast. Eng., 81, 67–81, 2013.
Rubey, W. W.: Settling velocity of gravel, sand, and silt particles, Am. J. Sci., 148, 325–338, 1933.
Saegusa, S., Tanaka, H., and Mitobe, Y.: Recovery processes of bathymetry of Sendai Bay after the 2011 tsunami, Journal of JSCE, B2(Coastal Engineering), 73, 817–822, 2017.
Okada, Y.: Surface deformation due to shear and tensile faults in a half-space, B. Seismol. Soc. Am., 75, 1135–1154, 1985.
Pari, Y., Ramana Murthy, M. V., Jaya Kumar, S., Subramanian, B. R., and Ramachandran, S.: Morphological changes at Vellar estuary, India – Impact of the December 2004 tsunami, J. Environ. Manage., 89, 45–57, 2008.
Paris, R., Lavigne, F., Wassmer, P., and Sartohadi, J.: Coastal sedimentation associated with the December 26, 2004 tsunami in Lhok Nga, west Banda Aceh (Sumatra, Indonesia), Mar. Geol., 238, 93–106, 2007.
Pham, T. D., Gouramanis, C., Switzer, M. A., Rubin, M. C., Jones, G. B., Jankaew, K., and Carr, F. P.: Elemental and mineralogical analysis of marine and coastal sediments from Phra Thong Island, Thailand: Insights into the provenance of coastal hazard deposits, Mar. Geol., 385, 274–292, 2018.
Prendergast, L. A., Cupper L. M., Jankaew, K., and Sawai, Y.: Indian Ocean tsunami recurrence from optical dating of tsunami sand sheets in Thailand, Mar. Geol., 295–298, 20–27, 2012.
Sawai, Y., Jankaew K., Martin, E. M., Prendergast, A., Choowong, M., and Charoentitirat, T.: Diatom assembles in tsunami deposits associated with the 2004 Indian Ocean tsunami at Phra Thong Island, Thailand, Mar. Micropaleontol., 73, 70–79, 2009.
Sugawara, D., Goto, K., and Jaffe, B. E.: Numerical models of tsunami sediment transport – Current understanding and future directions, Mar. Geol., 352, 295–320, 2014a.
Sugawara, D., Takahashi, T., and Imamura, F.: Sediment transport due to the 2011 Tohoku-oki tsunami at Sendai: Results from numerical modeling, Mar. Geol., 358, 18–37, 2014b.
Suppasri, A., Koshimura, S., and Imamura, F.: Developing tsunami fragility curves based on the satellite remote sensing and the numerical modeling of the 2004 Indian Ocean tsunami in Thailand, Nat. Hazards Earth Syst. Sci., 11, 173–189, https://doi.org/10.5194/nhess-11-173-2011, 2011.
Suppasri, A., Latcharote, P., Bricker, J. D., Leelawat, N., Hayashi, A., Yamashita, K., Makinoshima, F., Roeber, V., and Imamura, F.: Improvement of tsunami countermeasures based on lessons from the 2011 great east japan earthquake and tsunami – Situation after five years –, Coast. Eng. J., 58, 1640011, https://doi.org/10.1142/S0578563416400118, 2016.
Switzer, A. D., Srinivasalu, S., Thangadurai, N., and Ram Mohan, V.: Bedding structures in Indian tsunami deposits that provide clues to the dynamics of tsunami inundation, Geological Society, London, Special Publications, 361, 61–77, 2012.
Szczuciński, W., Kokociński, M., Rzeszewski, M., Chahué–Goff, C., Cachão, M., Goto, K., and Sugawara, D.: Sediment sources and sedimentation processes of 2011 Tohoku–oki tsunami deposits on the Sendai Plain, Japan – Insights from diatoms, nannoliths and grain size distribution, Sediment. Geol., 282, 40–56, 2012.
Takahashi, T., Shuto, N., Imamura, F., and Asai, D.: Modeling sediment transport due to tsunamis with exchange rate between bed load layer and suspended load layer, in: Proceedings Of International Conference of Coastal Engineering, 16–21 July 2000, Sydney, Australia, 1508–1519, 2000.
Takahashi, J., Goto, K., Oie, T., Yanagisawa, H., and Imamura, F.: Inundation and topographic Change due to the 2004 Indian Ocean Tsunami at the Kirinda port, Sri Lanka, Journal of JSCE, B2(Coastal Engineering), 55, 251–255, 2008.
Takahashi, T., Kurokawa, T., Fujita, M., and Shimada, H.: Hydraulic experiment on sediment transport due to tsunamis with various sand grain size, Journal of JSCE, B2(Coastal Engineering), 67, 231–235, 2011.
Takahashi, T.: Numerical modeling if sediment transport due to tsunamis and its problem, Journal of the Sedimentological Society of Japan, 71, 149–155, 2012.
Takashimizu, Y., Urabe, A., Suzuki, K., and Sato, Y.: Deposition by the 2011 Tohoku–oki tsunami on coastal lowland controlled by beach ridges near Sendai, Japan, Sediment. Geol., 282, 124–141, 2012.
Tanaka, H., Ishino, K., Nawarathna, B., Nakagawa, H., and Yano, S.: Coastal and river mouth morphology change in Sri Lanka due to the 2004 Indian Ocean Tsunami, in: Coastal Sediments' 07, 842–855, 2007.
Tanaka, H., Mano, A., and Udo, K.: Beach Morphology Change Induced by The 2011 Great East Japan Earthquake Tsunami, Journal of JSCE, B2(Coastal Engineering), 67, 571–575, 2011.
Udo, K., Tanaka, H., Mano, A., and Takeda, Y.: Beach Morphology Change of Southern Sendai Coast due to 2011 Tohoku Earthquake Tsunami, Journal of JSCE, B2(Coastal Engineering), 69, 391–395, 2013.
Udo, K. and Takeda, Y.: Comparison between characteristics of shoreline changes due to the 2004 Indian Ocean tsunami and the 2011 Great East Japan tsunami, Journal of JSCE, B3(Coastal Engineering), 72, 175–180, 2016.
Van Rijn, L. C.: Unified view of sediment transport by currents and waves. I: Initiation of motion, bed roughness, and bed-load transport, J. Hydraul. Eng., 133, 649–667, 2007.
Watanabe, A., Maruyama, Y., Shimizu, T., and Sakakiyama, T.: Numerical prediction model of three-dimensional beach transformation due to installed structures, Journal of JSCE(Coastal Engineering), 31, 406–410, 1984.
Watanabe, M., Goto, K., Bricker, J. D., and Imamura, F.: Are inundation limit and maximum extent of sand useful for differentiating tsunamis and storms? An example from sediment transport simulations on the Sendai Plain, Japan, Sediment. Geol., 364, 204–216, 2018.
Xu, J.: Grain-size characteristics of suspended sediment in the Yellow River, China, Catena, 38, 243–263, 1999a.
Xu, J.: Erosion caused by hyperconcentrated flow on the Loess Plateau of China, Catena, 36, 1–19, 1999b.
Yamashita, K., Sugawara, D., Takahashi, T., Imamura, F., Saito, Y., Imato, Y., Kai, T., Uehara, H., Kato, T., Nakata, K., Saka, R., and Nishikawa, A.: Numerical simulation of large-scale sediment transport due to the 2011 tohoku earthquake tsunami in Rikuzentakata city, Journal of JSCE, B2(Coastal Engineering), 71, 499–504, 2015.
Yamashita, K., Sugawara, D., Takahashi, T., Imamura, F., Saito, Y., Imato, Y., and Saka, R.: Numerical simulations of large-scale sediment transport caused by the 2011 Tohoku Earthquake Tsunami in Hirota Bay, Southern Sanriku Coast, Coast, Eng. J., 58, 640015, https://doi.org/10.1142/S0578563416400155, 2016.
Yamashita, K., Shigihara, Y., Sugawara, D., Arikawa, T., Takahashi, T., and Imamura, F.: Effect of sediment transport on tsunami hazard and building damage –an integrated simulation of tsunami inundation, sediment transport and drifting vessels in Kesennuma city, Miyagi prefecture during the great east Japan, Journal of JSCE, B2(Coastal Engineering), 73, 355–360, 2017.
Yamashita, K., Sugawara, D., Arikawa, Y., Takahashi, T., and Imamura, F.: Improvement of tsunami-induced sediment transport model by considering saturated concentration in suspension with strong unsteady flows, Journal of JSCE, B2(Coastal Engineering), 69, 325–330, 2018.