the Creative Commons Attribution 4.0 License.
the Creative Commons Attribution 4.0 License.
 | 18 Sep 2020
Intra-annual variability of the Western Mediterranean Oscillation (WeMO) and occurrence of extreme torrential precipitation in Catalonia (NE Iberia)
Joan Albert Lopez-Bustins
Laia Arbiol-Roca
Javier Martin-Vide
Antoni Barrera-Escoda
Marc Prohom
In previous studies the Western Mediterranean Oscillation index (WeMOi) at daily resolution has proven to constitute an effective tool for analysing the occurrence of episodes of torrential precipitation over eastern Spain. The western Mediterranean region is a very sensitive area, since climate change can enhance these weather extremes. In the present study we created a catalogue of the extreme torrential episodes (≥200 mm in 24 h) that took place in Catalonia (NE Iberia) during the 1951–2016 study period (66 years). We computed daily WeMOi values and constructed WeMOi calendars. Our principal result reveals the occurrence of 50 episodes (0.8 cases per year), mainly concentrated in the autumn. We confirmed a threshold of WeMOi ≤ −2 to define an extreme negative WeMO phase at daily resolution. Most of the 50 episodes (60 %) in the study area occurred on days presenting an extreme negative WeMOi value. Specifically, the most negative WeMOi values are detected in autumn, from 11 to 20 October, coinciding with the highest frequency of extreme torrential events. On comparing the subperiods, we observed a statistically significant decrease in WeMOi values in all months, particularly in late October and in November and December. No changes in the frequency of these extreme torrential episodes were observed between both subperiods. In contrast, a displacement of the extreme torrential episodes is detected from early to late autumn; this can be related to a statistically significant warming of sea temperature.
- Article
(9565 KB) - Full-text XML
- BibTeX
- EndNote


The Mediterranean seasonal precipitation regime is characterised by rainy winters and dry summers, linked to the westerly atmospheric circulation in winter and to the subtropical anticyclone belt in summer. Nevertheless, in some regions of the Mediterranean basin, the seasonal precipitation regime differs from the typically Mediterranean one; for example, most of eastern Iberia (Spain) displays a seasonal precipitation maximum in autumn and a secondary one in spring (De Luis et al., 2010; González-Hidalgo et al., 2011). This bimodal precipitation pattern is recorded in few regions of the world. It only occurs over approximately 7 % of the global land surface and is commonly associated with locations within the tropics (Knoben et al., 2019). This bimodal behaviour in eastern Spain is mainly due to the physical geographic complexity of the Iberian Peninsula, which comprises several mountain ranges, all of which present different slope orientations. Furthermore, the Mediterranean Sea is practically cut off from other water bodies, which favours a higher sea surface temperature (SST) than in the Atlantic at the same latitude, especially in summer and autumn (Pastor et al., 2015). This contributes to the development of high vertical gradients of air temperature in some months over the Mediterranean basin (Estrela et al., 2008; Pérez-Zanón et al., 2018). These physical geographical factors give rise to a high concentration of daily precipitation in the Mediterranean basin, i.e. torrential precipitation events, above all in the western Mediterranean (Beguería et al., 2011; Cortesi et al., 2012; Caloiero et al., 2019); all this reveals the need for water management in Spain to be based upon precipitation variability rather than on the precipitation mean (Lopez-Bustins, 2018). Heavy precipitation in the western Mediterranean is mainly centred in eastern Spain, the south of France and the region of Liguria (NW Italy) (Peñarrocha et al., 2002). These torrential events can cause dangerous floods and can have serious social and economic consequences, even human casualties, in the Mediterranean regions, e.g. in eastern Spain (Olcina et al., 2016; Kreibich et al., 2017; Nakamura and Llasat, 2017; Martin-Vide and Llasat, 2018) and in southern Spain (Gil-Guirado et al., 2019; Naranjo-Fernández et al., 2020). Climatological studies on torrential precipitation frequency and intensity are therefore relevant with regard to improving emergency plans and mitigating flood damage. Extreme precipitation is expected to increase with global warming as a result of greater atmospheric water content (Papalexiou and Montanari, 2019); for instance, extreme peak river flows are predicted to increase in southern Europe during the current century (Alfieri et al., 2015) and the frequency of heavy precipitation events is projected to be higher for the 2011–2050 period (Barrera-Escoda et al., 2014).
Previous studies have associated extreme daily precipitation events in Spain with synoptic patterns (Martin-Vide et al., 2008; Peña et al., 2015); these studies have addressed several different tropospheric levels (Romero et al., 1999; Merino et al., 2016; Pérez-Zanón et al., 2018). Furthermore, many studies have also statistically correlated several teleconnection indices (El Niño–Southern Oscillation, North Atlantic Oscillation, Arctic Oscillation, Mediterranean Oscillation, Western Mediterranean Oscillation, etc.) with precipitation series for the Iberian Peninsula at different timescales (Rodó et al., 1997; Rodríguez-Puebla et al., 2001; Trigo et al., 2004; Lopez-Bustins et al., 2008; González-Hidalgo et al., 2009; Ríos-Cornejo et al., 2015a; Merino et al., 2016). Among these indices, the Western Mediterranean Oscillation (WeMO) was found to be the index most statistically and significantly correlated with annual, monthly and daily precipitation on the littoral fringe of eastern Spain (Martin-Vide and Lopez-Bustins, 2006; González-Hidalgo et al., 2009). The daily timescale of the WeMO index (WeMOi) could constitute a potential tool for analysing the frequency of torrential events in some regions of the western Mediterranean basin.
Most torrential events in the Mediterranean region present a cyclonic centre at the surface level (Jansà et al., 1996; Rigo and Llasat, 2003). These cyclonic centres, which are mainly mesoscale lows, can contribute to the structure of low-level flows and therefore to the creation or intensification of a low-level warm and wet current that can feed and sustain convection in favourable environmental conditions (Jansà and Genovés, 2000; Jansà et al., 2000). Furthermore, the Mediterranean Sea moistens and warms the low level of the atmosphere. Consequently, the southerly-to-easterly flow that prevails before and during torrential events in the western Mediterranean transports the air under conditional instability towards the coasts, where convection is often triggered by an interaction between the flow and the orography. Studies based upon mesoscale modelling, such as the research conducted by Lebeaupin et al. (2006), show that an increase (or a decrease) in SST by several degrees intensifies (or weakens) convection. In addition, the presence of a cut-off low in the upper troposphere might be playing a significant role in the occurrence of heavy precipitation, creating a cyclonic circulation in the lower troposphere, thus enabling Atlantic air to be carried over the Mediterranean Sea. This warm and very wet air in the lower layers impinges on the coastal mountains ranges, and the forced ascent is sufficient to trigger potential instability. This meteorological configuration is accounted for in the negative phase of the WeMO, which defines a synoptic pattern prone to producing torrential precipitation and floods on the eastern Iberian coast. Daily precipitation amounts over 200 mm are not unusual in such cases, particularly in eastern Spain, where many catastrophic floods are related to the presence of a cut-off low (Llasat, 2009). Thus, these catastrophic floods in the northwestern Mediterranean basin are generally of synoptic origin and are defined by the negative phase of the WeMO and enhanced by certain mesoscale factors (Gilabert and Llasat, 2018).
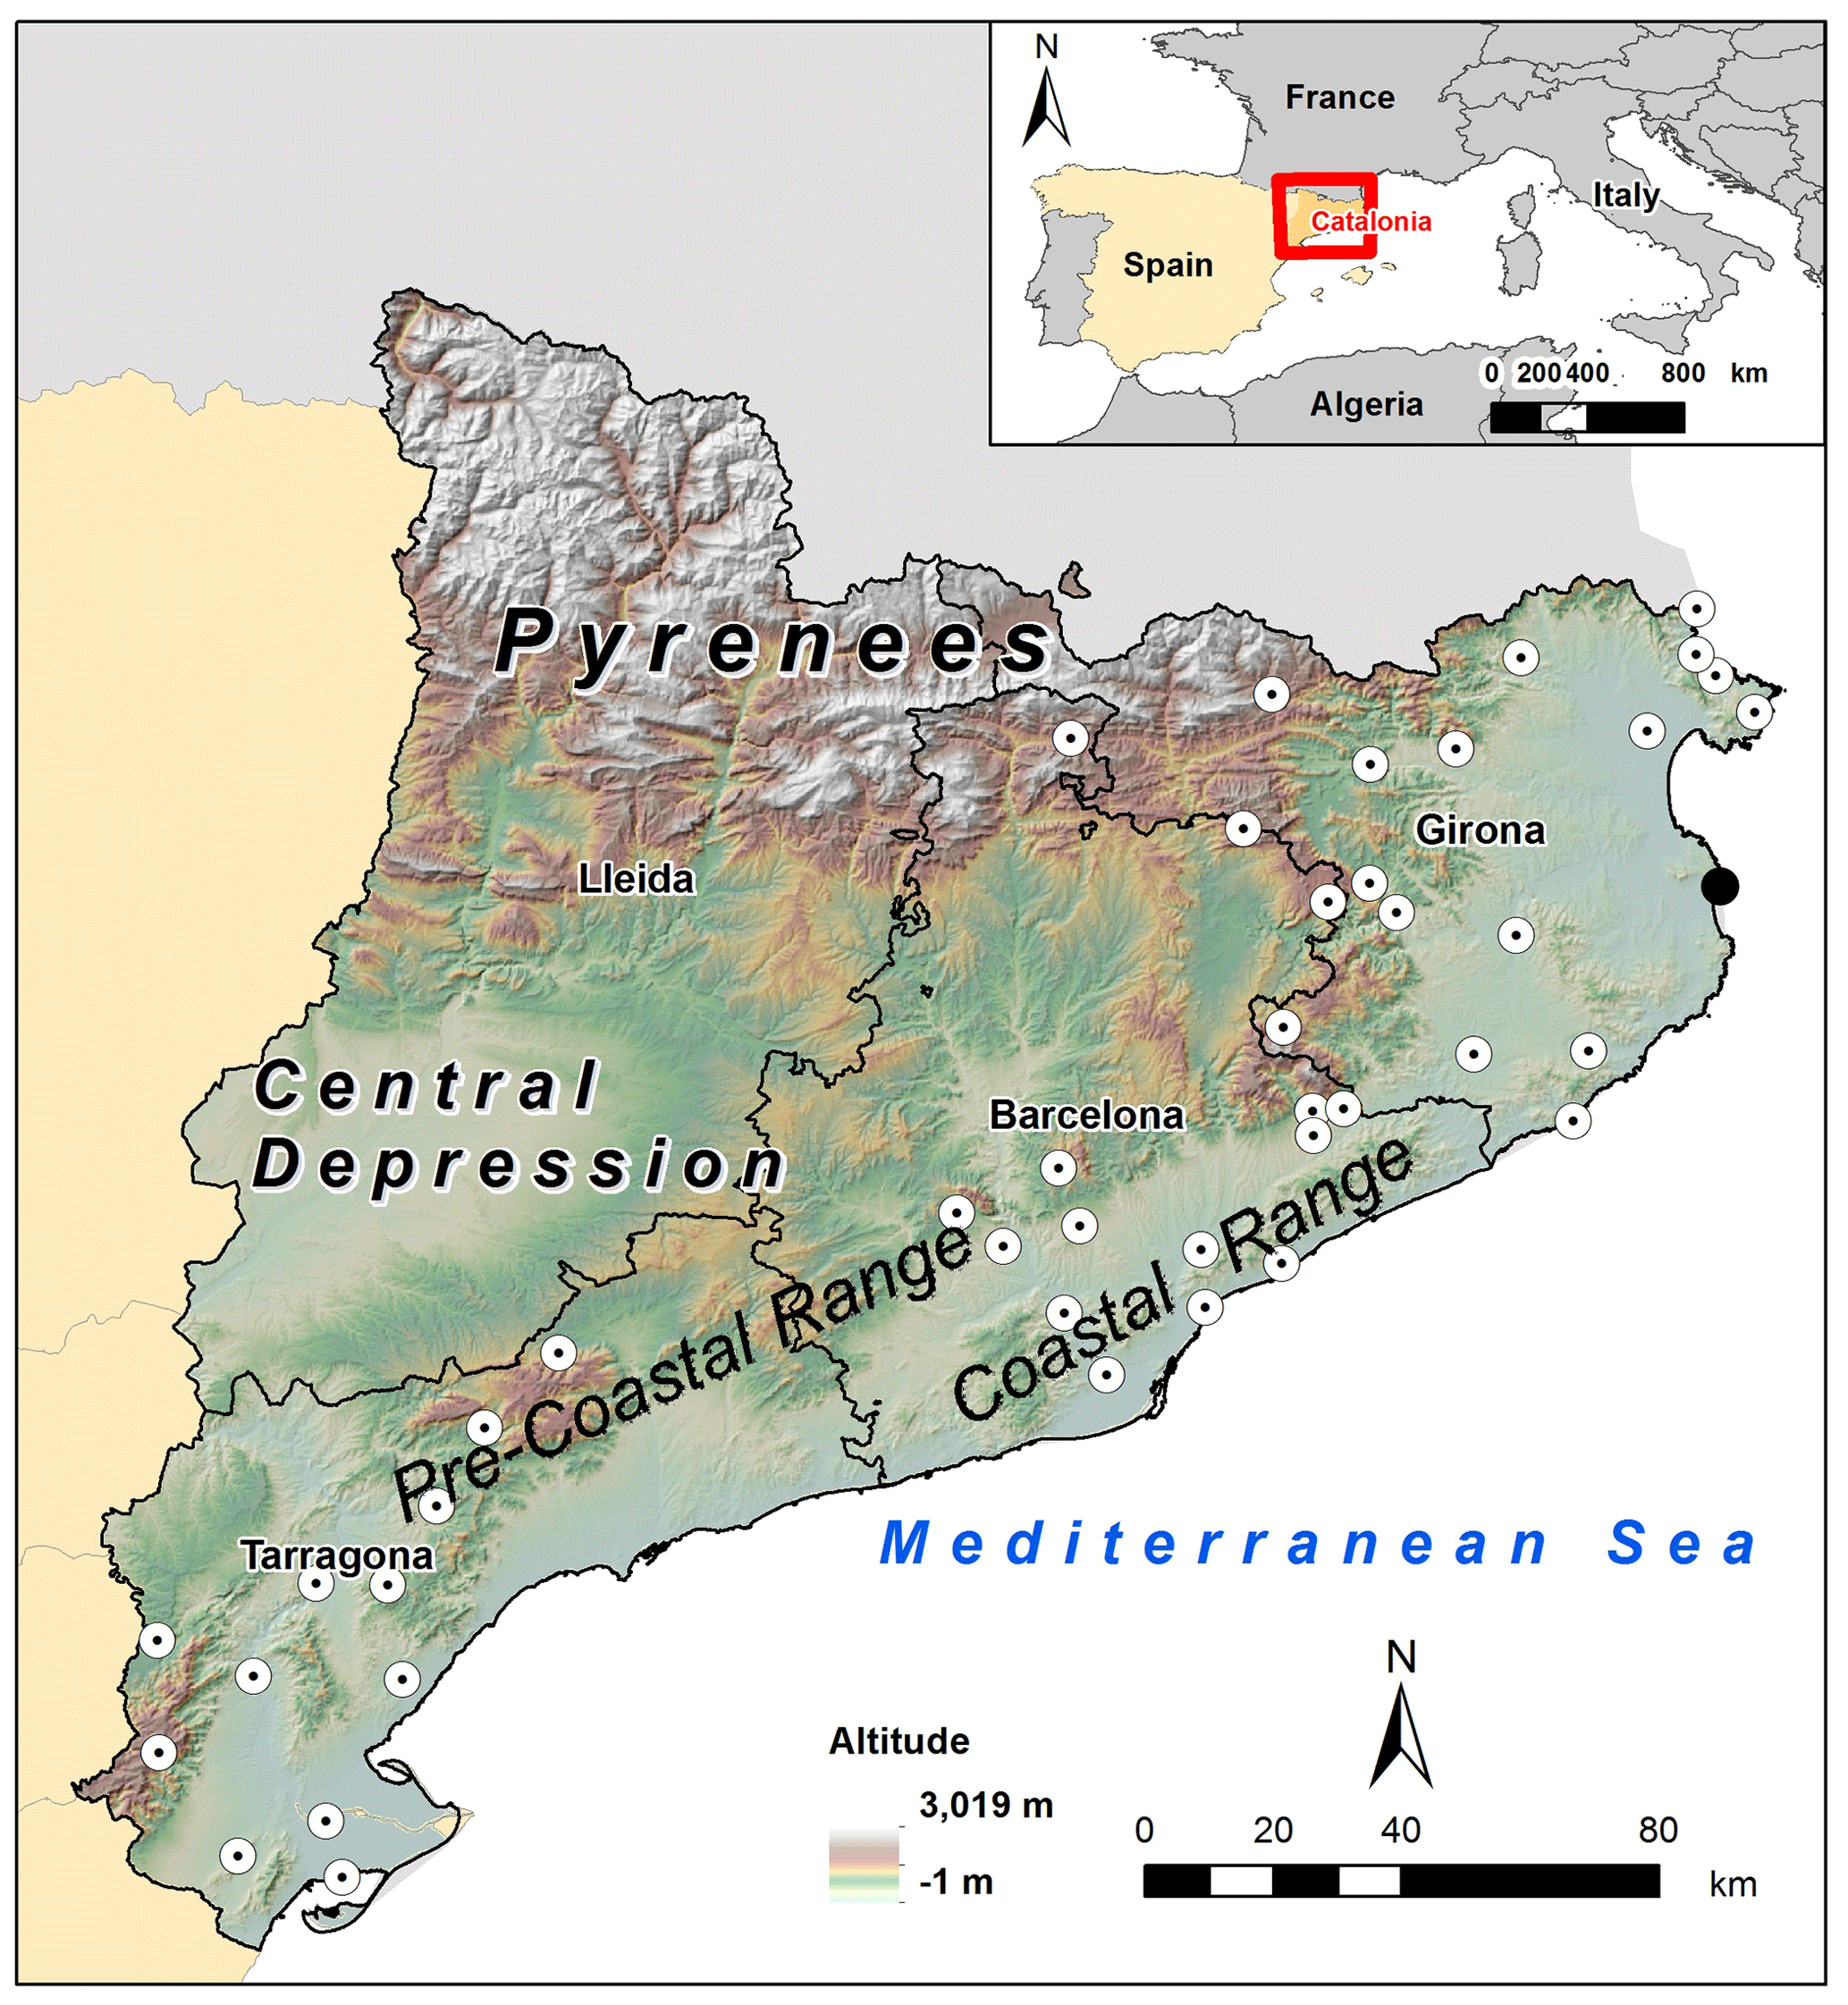
Figure 1Location of Catalonia (NE Spain) within Europe – altitude and provinces. The white dots indicate the 43 different weather stations that have recorded the highest precipitation amount during an extreme torrential event at least once in Catalonia during the 1951–2016 study period. The black dot indicates the location of the sea temperature series. Base map provided by the Cartographic and Geological Institute of Catalonia.
The present study provides an exhaustive inventory of the most intense daily precipitation events in Catalonia (NE Iberia) over the last few decades (1951–2016) in order to provide a better understanding of their temporal distribution. Moreover, we will analyse changes in frequency according to subperiods, since the western Mediterranean basin constitutes a global warming hotspot, where a decrease in mean annual precipitation is expected for the following decades, particularly in summer, together with a potential rise in storm-related precipitation and drought duration (Christensen et al., 2013; Barrera-Escoda et al., 2014; Cramer et al., 2018; Greve et al., 2018). The main aim of our study involves creating a catalogue of extreme torrential events in Catalonia in order to establish a period of high potential torrentiality in the area analysed at daily resolution. Most studies delimit the wet season of a region to 1 month or several months (Kottek et al., 2006), and do not employ a smaller timescale than the monthly one. Consequently, the present research attempts to use a more accurate timescale than the monthly one in order to determine the period with the highest accumulation of heavy precipitation episodes according to fortnights and 10 d periods. The intra-annual variability in the daily WeMOi values may help to establish the period with the highest propensity for torrential events in Catalonia. Additionally, we analyse SST in order to establish a sea–atmosphere interaction to explain WeMOi values and changes in the frequency of events. Seawater constitutes an energy store, i.e. recharge areas, which can influence water vapour content and can intensify precipitation episodes (Pastor et al., 2018; Iizuka and Nakamura, 2019) by means of a sea–atmosphere moisture exchange. Furthermore, a significant release of latent heat occurs during atmospheric convection over a warm sea like the Mediterranean at the end of summer and the beginning of autumn (Pastor et al., 2015).
In Sect. 2, we describe the main orographic and pluviometric features of the study area. The data and methods followed to calculate daily WeMOi values and construct the WeMOi calendar are explained in Sect. 3. In Sect. 4, the results of the intra-annual variability in torrential episodes, WeMOi values and sea temperature trends are analysed and discussed. Finally, in Sect. 5 we derive the conclusions.
Catalonia covers an area of 32 100 km2 in northeast Spain; it is physically separated from France by the Pyrenees (Fig. 1). Altitude ranges from 0 m a.s.l. (littoral) to 3100 m a.s.l. (northwestern Pyrenees). The Coastal and Pre-Coastal ranges, with an altitude ranging from 500 to 1700 m a.s.l., present a SW–NE orientation. On the western border, the Central Depression is approximately 200–300 m a.s.l., constituting the driest part of the study area (350 mm annual mean precipitation; Fig. 2a). The wettest part of Catalonia is located in the Pyrenees, with an annual mean precipitation of over 1200 mm. In general terms, southern Lleida and Barcelona, as well as almost the entire province of Tarragona, make up the dry part of Catalonia (<700 mm). The rainy part of Catalonia (≥700 mm) comprises the province of Girona and the northern halves of the provinces of Lleida and Barcelona.
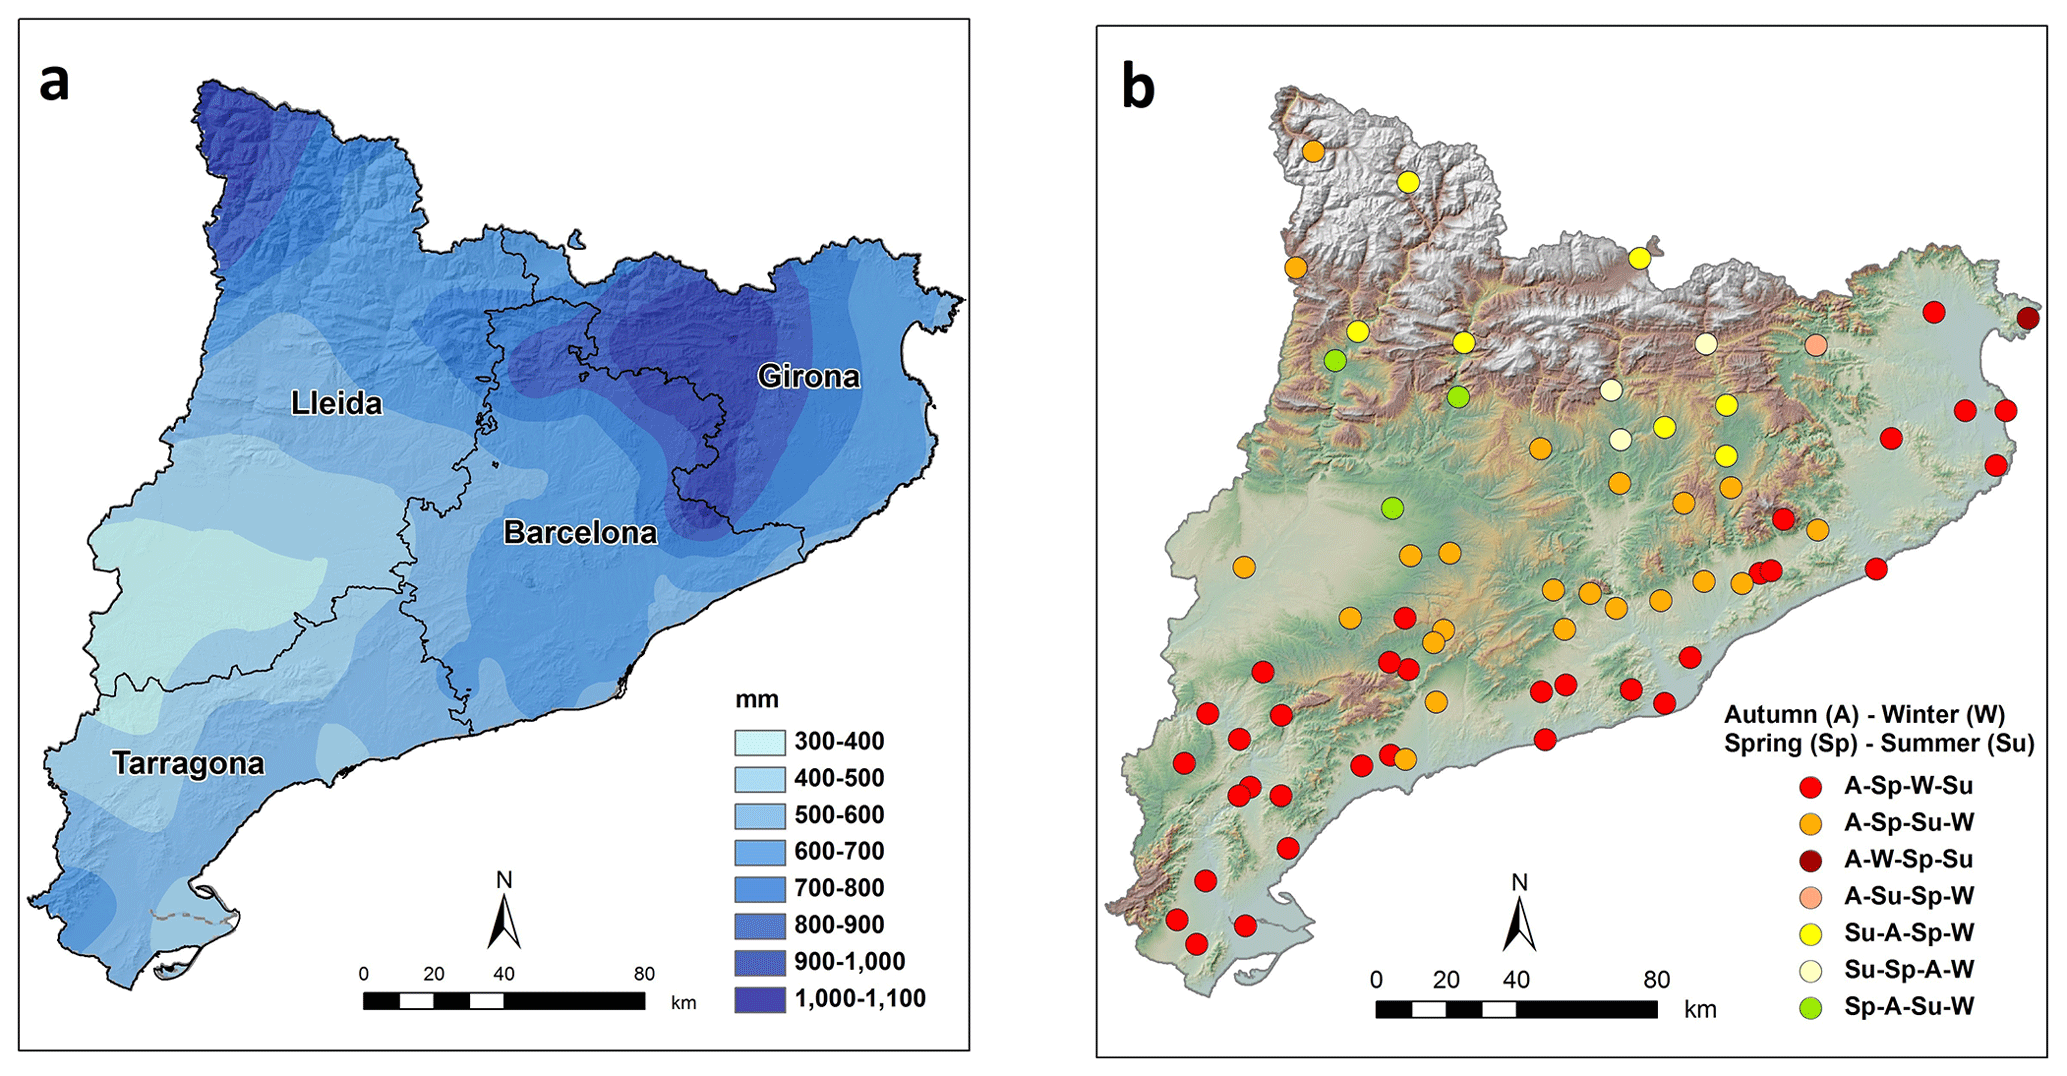
Figure 2(a) Annual mean precipitation (mm) and (b) seasonal precipitation regimes for 70 weather stations in Catalonia for the 1951–2016 study period. Data source: SMC (2017). Base map provided by the Cartographic and Geological Institute of Catalonia.
Catalonia's complex orography, as well as the fact that it comes under the influence of the Atlantic Ocean and the Mediterranean Sea, endows it with a highly heterogeneous spatial distribution of seasonal precipitation regimes throughout the study area. Using 70 monthly precipitation series (1951–2016) homogenised and provided by the Meteorological Service of Catalonia (SMC, 2017), we ascertained that, of the total of 24 possible permutations between winter, spring, summer and autumn as dominant and subdominant precipitation seasons, 7 of these are detected in Catalonia (Fig. 2b) (Martin-Vide and Raso-Nadal, 2008). A clear predominance of autumn precipitation can be observed, followed by spring precipitation, especially in the coastal zone. The driest season on the coast is summer; however, the driest time of year inland is winter. Many areas of the Pyrenees, above all in the east, exhibit their maxima in summer as a result of convective precipitation.
3.1 Selection of torrential events
Several studies have selected the torrential precipitation events in Spain based on the threshold of 100 mm in 24 h (Pérez-Cueva, 1994; Martin-Vide and Llasat, 2000; Armengot, 2002; Riesco and Alcover, 2003; Martin-Vide et al., 2008). Herein we chose the extreme torrential episodes (≥200 mm in 24 h; Martin-Vide, 2002; Lopez-Bustins et al., 2016) that took place over Catalonia during the 1951–2016 study period (66 years). We consider the threshold of 200 mm in 24 h to present a natural risk in most cases, with significant consequences. Episodes involving ≥100 mm in 24 h are more frequent but sometimes have no direct impact or quite a negligible effect, because other factors are the main drivers of floods, e.g. precipitation duration (Jang, 2015), initial soil moisture conditions and hydrological parameters (Norbiato et al., 2008; Martina et al., 2009). Furthermore, the area affected by episodes of ≥100 mm in 24 h is sometimes local and is therefore not easily associated with advective synoptic patterns (Gilabert and Llasat, 2018).
In order to select the extreme torrential events, we considered all available precipitation data sources in Catalonia (Meteorological Service of Catalonia, Spanish State Meteorological Agency, Catalan Water Agency and Ebro Hydrographic Confederation). Thus, 1466 weather stations were identified during 1951–2016, of which 986 were manually managed (67.3 %) and provided one register per day, at 07:00 UTC. Until 1987 the manual weather stations constituted the only precipitation data source in Catalonia. The remaining 480 weather stations were automatic observatories, reporting hourly or semi-hourly data depending on the network and period. The 1988–2016 period was covered by both manual and automatic stations. We considered the pluviometric day as 07:00–07:00 UTC in both types of observatories in order to ensure a homogeneous criterion when selecting episodes along the whole study period and analysing any temporal changes in their frequency. We conducted an exhaustive spatial and temporal verification of the extreme torrential episodes identified. We tested the reliability of the events considering the daily precipitation recorded in neighbouring stations and examining the original handwritten observation cards. Furthermore, we rectified several episodes recorded by weather stations the day after the pluviometric day, and we eliminated events derived from the accumulation of precipitation for over 1 d.
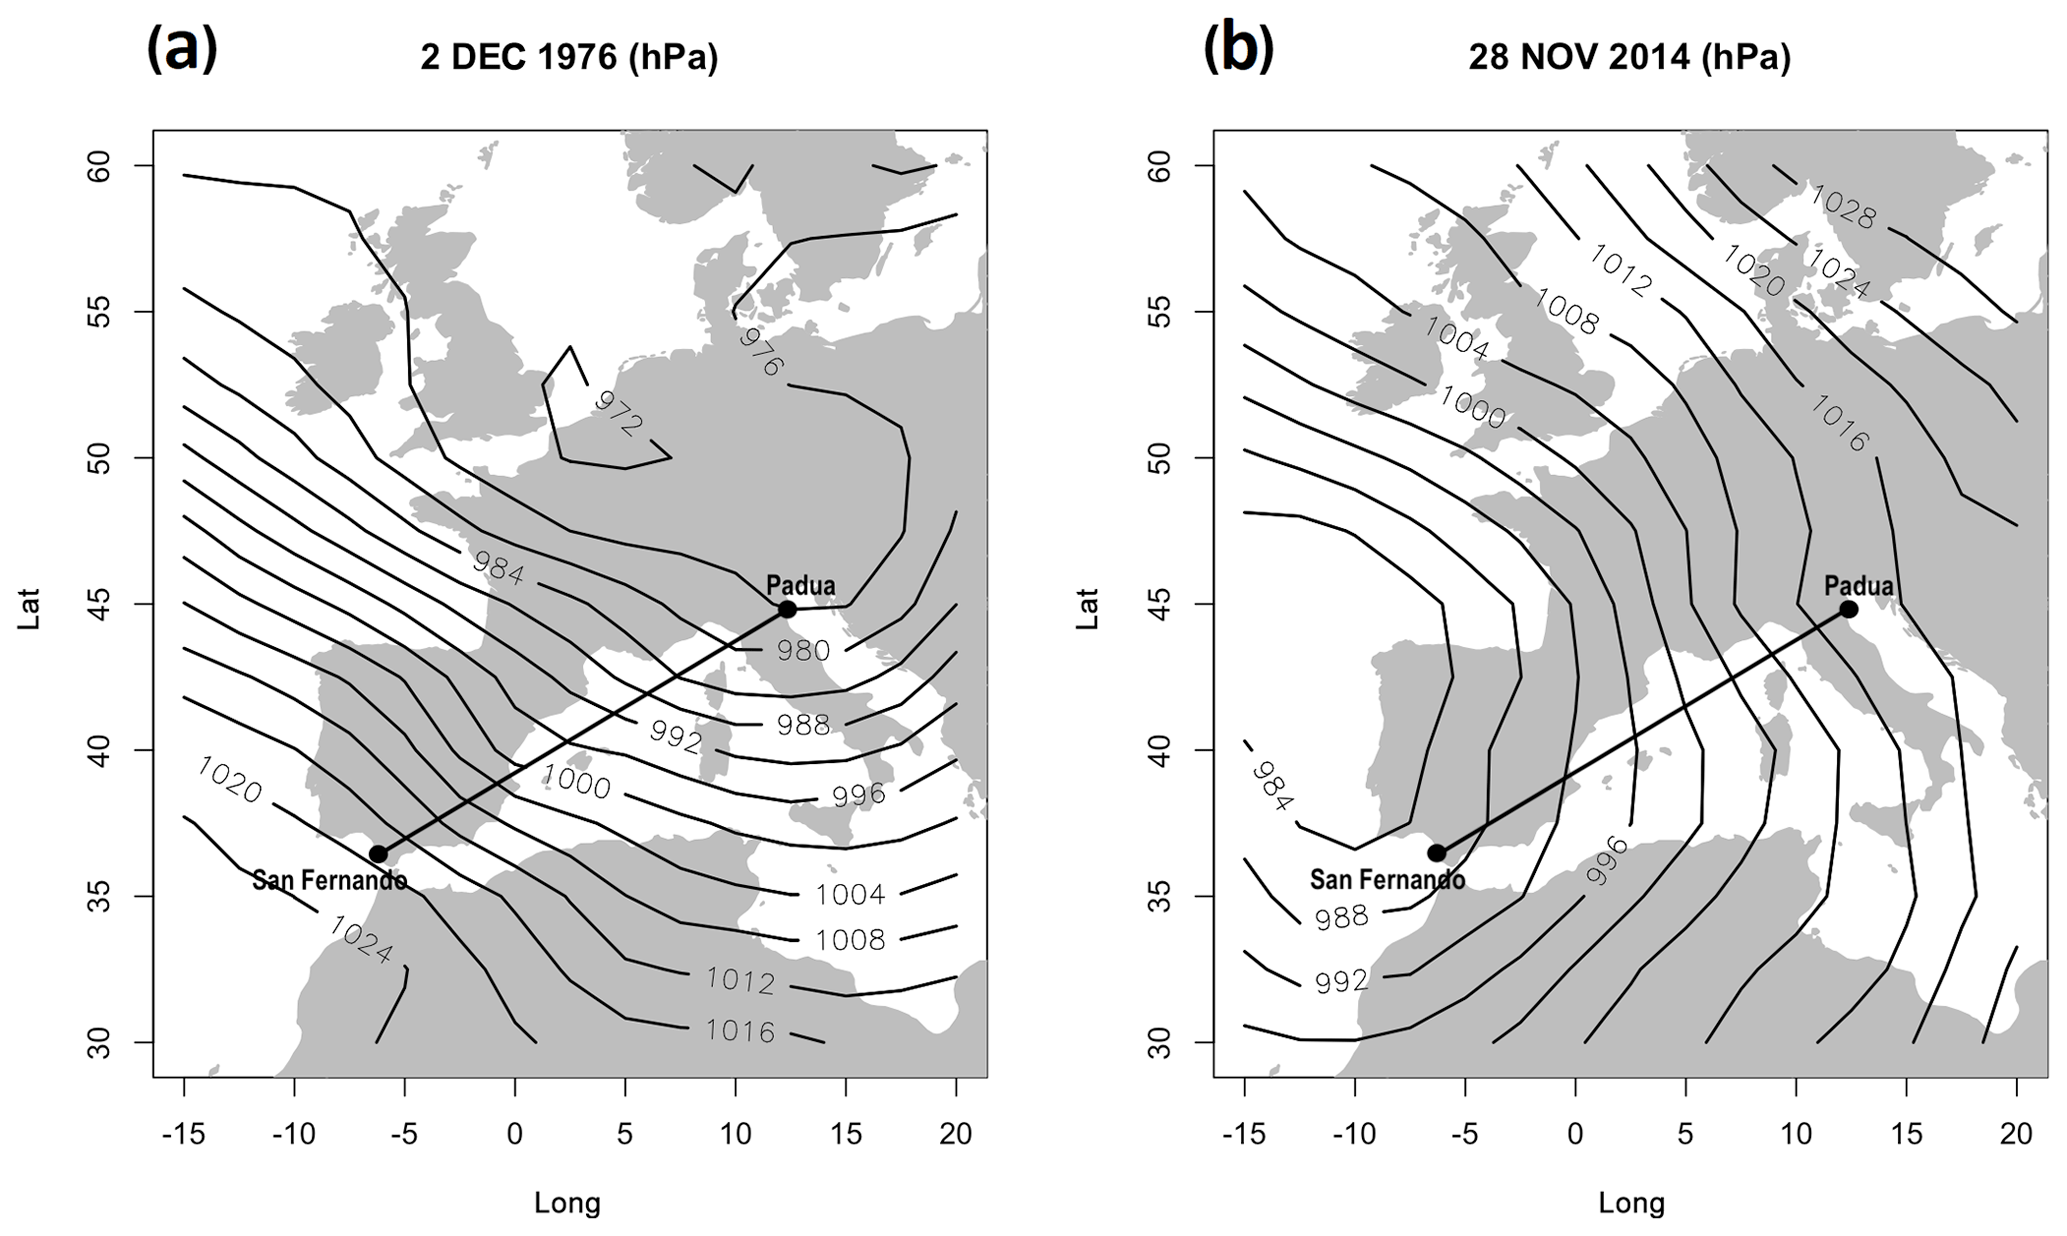
Figure 3(a) Most extreme positive phase of the Western Mediterranean Oscillation (WeMO) in a daily synoptic situation during the 1951–2016 study period (2 December 1976). (b) Most extreme negative WeMO phase in a daily synoptic situation during the 1951–2016 study period (28 November 2014). Data source: NCEP Reanalysis data provided by the NOAA/OAR/ESRL PSD, Boulder, Colorado, USA.
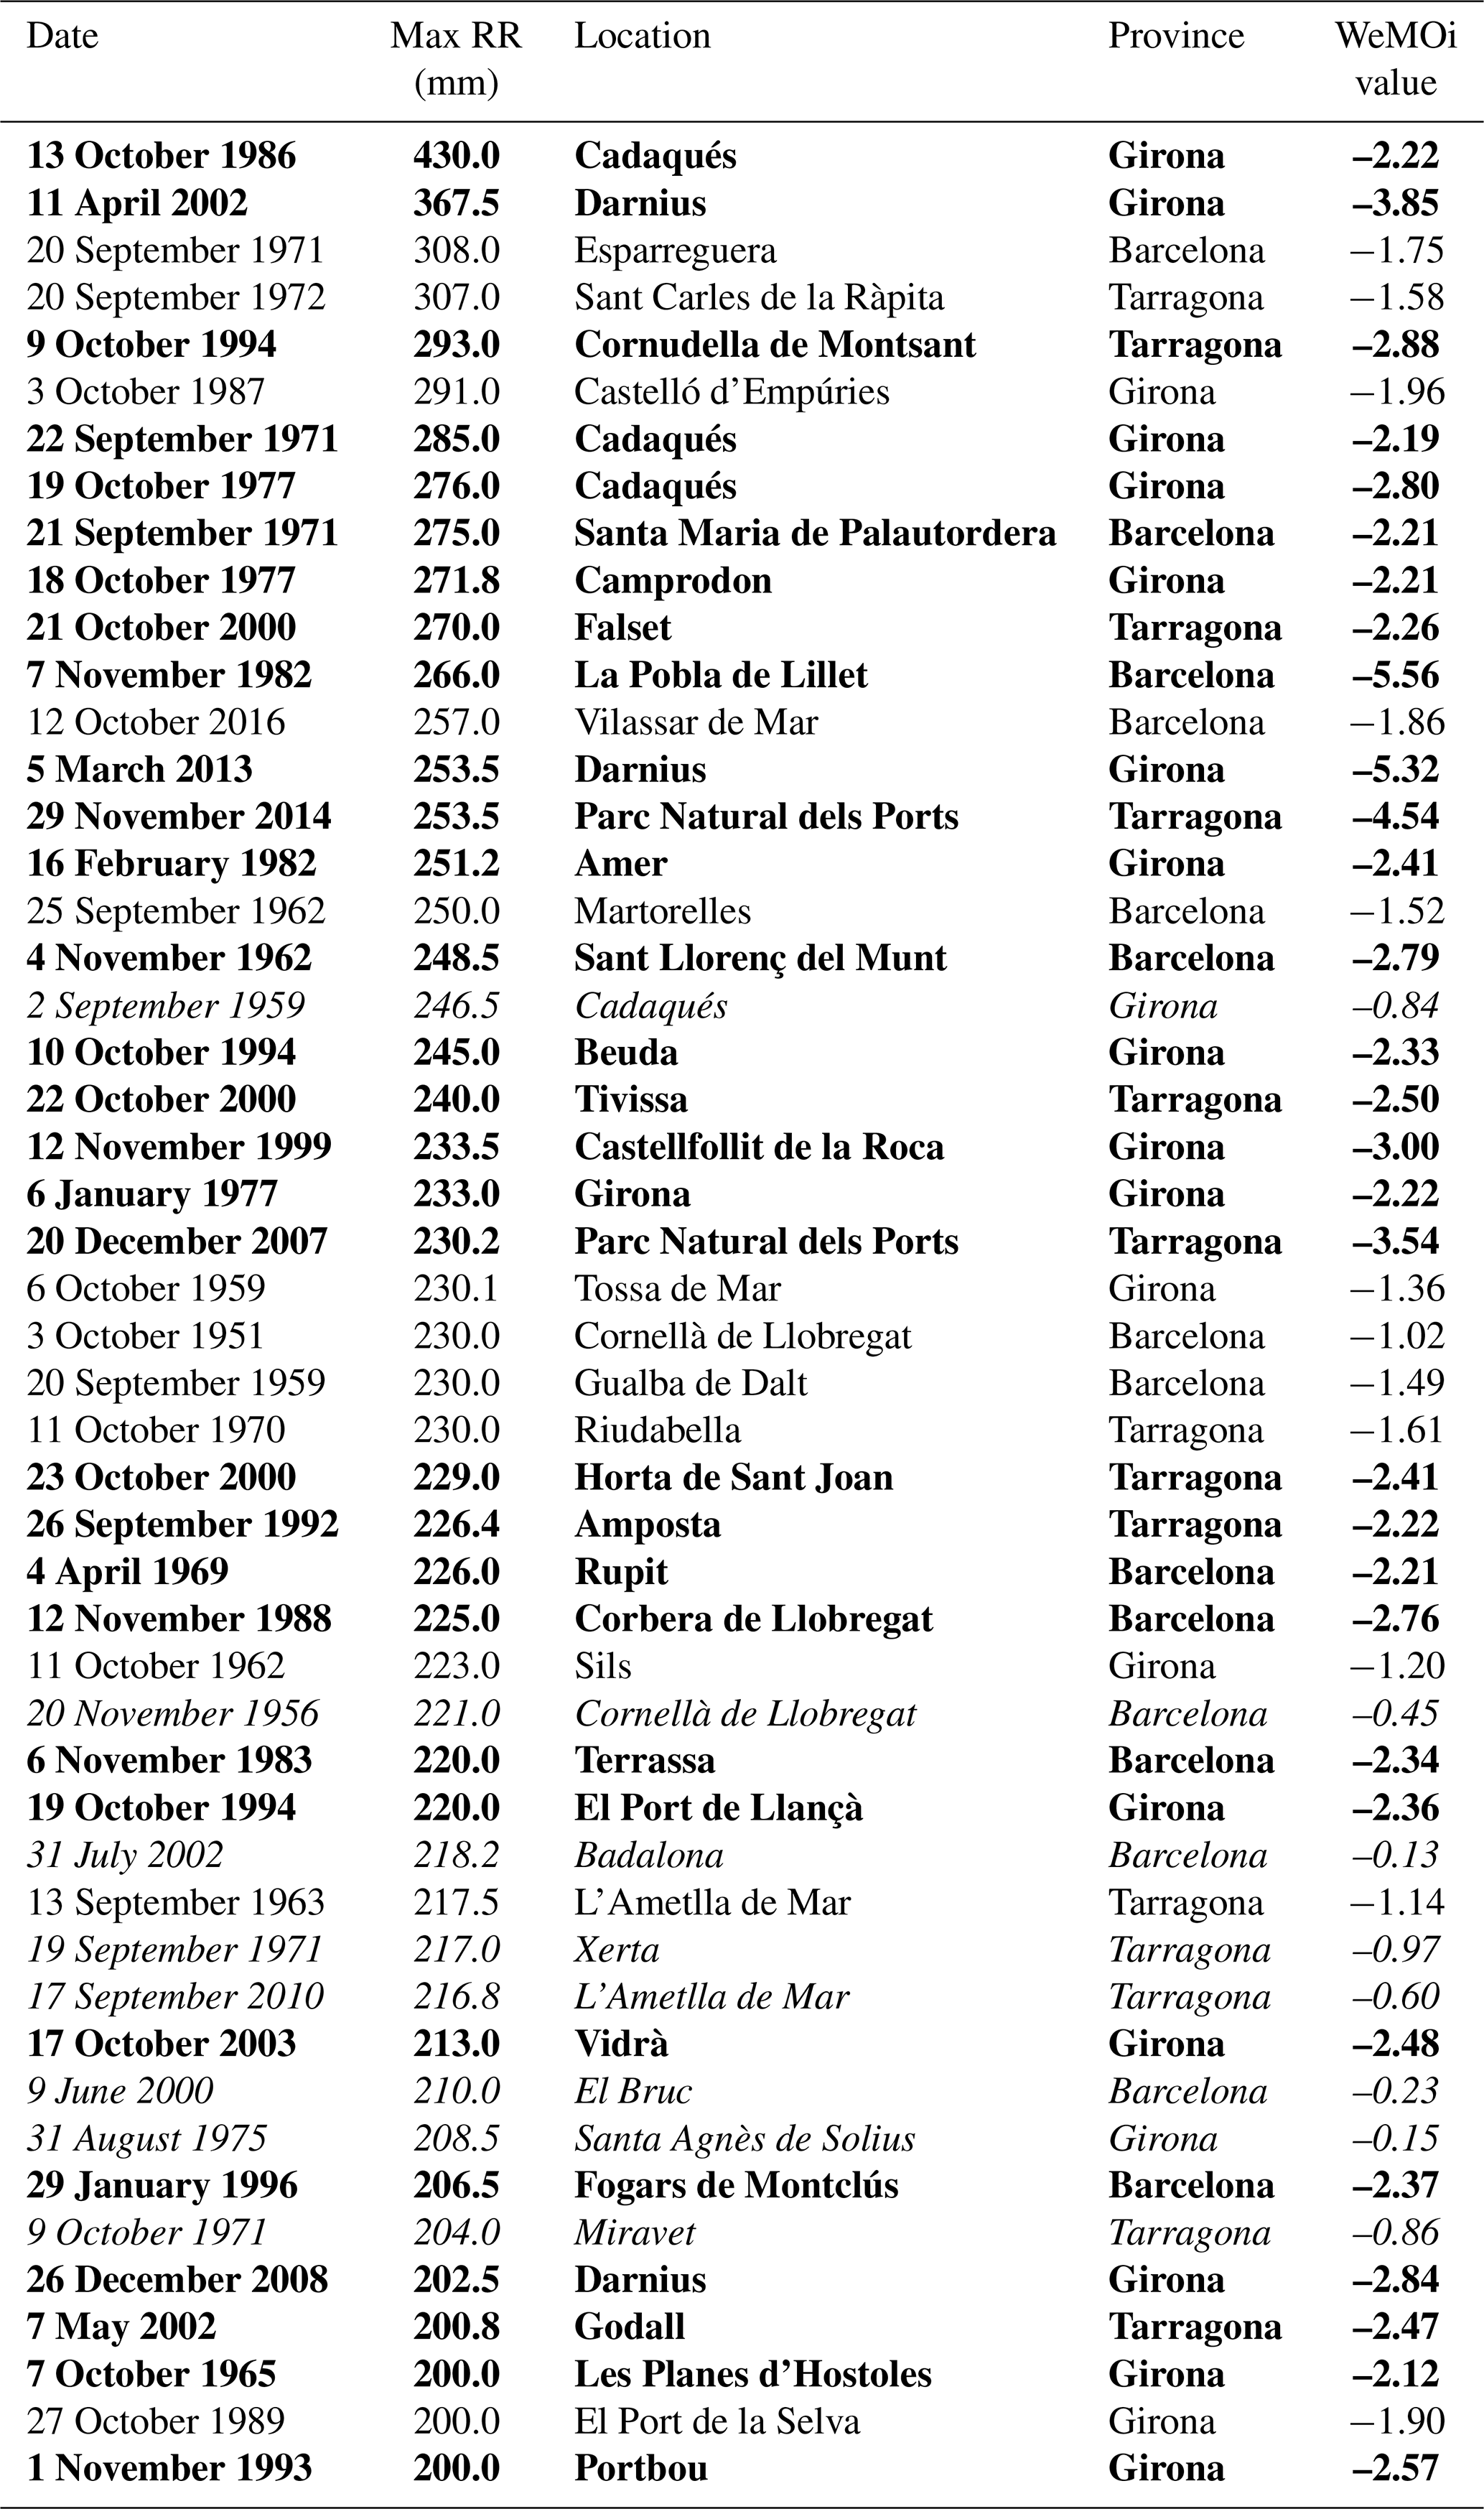
The catalogue of extreme torrential events in Catalonia contains the following columns: date, maximum precipitation in 24 h, location, province and daily WeMOi value. Several observatories in Catalonia can occasionally register ≥200 mm in 24 h on the same date, but only the highest amount was taken into account. Finally, we obtained 50 extreme torrential events for consideration in the present study (Table 1). A total of 32 out of the 50 episodes (64 %) have a decimal place of 0, and 10 out of the 50 episodes (20 %) present a decimal place of 5. Most of these episodes were registered by manual weather stations prior to the 1990s. This is known as the rounding effect (Wergen et al., 2012): a weather observer rounds off the daily precipitation accumulation value during heavy precipitation events. This effect has no influence on the results of the present research.
Table 1Catalogue of extreme torrential events (≥200 mm in 24 h, 07:00–07:00 UTC) in Catalonia (NE Iberia) during the 1951–2016 period. Max RR is the highest precipitation accumulation of the episode. The events are classified according to the extreme negative Western Mediterranean Oscillation (WeMO) phase (bold), the negative WeMO phase and the slight negative WeMO phase (italics).
3.2 Daily WeMOi values
The WeMOi is a regional teleconnection index defined within the western Mediterranean basin (Martin-Vide and Lopez-Bustins, 2006) and already used in a wider range of studies (Azorin-Molina and Lopez-Bustins, 2008; Vicente-Serrano et al., 2009; Caloiero et al., 2011; El Kenawy et al., 2012; Coll et al., 2014; Ríos-Cornejo et al., 2015b; Lana et al., 2017; Jghab et al., 2019). WeMOi values are computed by means of surface pressure data from the San Fernando (SW Spain) and Padua (NE Italy) weather stations (Fig. 3); the synoptic window 30–60∘ N and 15∘ W–20∘ E is found to best represent WeMO phases (Arbiol-Roca et al., 2018). Pressure data for both series were extracted from Martin-Vide and Lopez-Bustins (2006), who performed a statistical treatment of homogenisation, and the Climatology Group (University of Barcelona) periodically update the data. The positive phase of the WeMO corresponds to the anticyclone over the Azores encompassing the southwest quadrant of the Iberian Peninsula and low pressures in the Gulf of Genoa (Fig. 3a); its negative phase coincides with an anticyclone located over central or eastern Europe and a low-pressure centre, often cut off from the northern latitudes, within the framework of the Iberian southwest (Fig. 3b). Martin-Vide and Lopez-Bustins (2006) found that the WeMOi was significantly and statistically correlated with precipitation over areas that were weakly influenced by the North Atlantic Oscillation (NAO): these areas are the northernmost and easternmost parts of Spain. Precipitation over the Cantabrian fringe (northern Spain) is strongly and positively correlated with the WeMOi, and precipitation over Spain's eastern façade is strongly and negatively correlated with the WeMOi.
Application of the daily WeMOi is a methodological contribution by Martin-Vide and Lopez-Bustins (2006). It converts the low-frequency feature of the teleconnection patterns into a high-frequency mode. It is suitable for application both to the regional scale of the WeMO teleconnection pattern and to the lesser variability in atmospheric pressure at Mediterranean latitudes. Patterns have rarely been used at daily resolution (Baldwin and Dunkerton, 2001; Beniston and Jungo, 2002; Azorin-Molina and Lopez-Bustins, 2008; Liu et al., 2018). The method selected consists of previously standardising each series of the dipole. It is necessary to use the daily mean and standard deviation of the 1961–1990 reference period of all days of the year (1 January 1961–31 December 1990).
For example, the WeMOi on 1 January 1981,
where P is pressure, SF is San Fernando, PD is Padua, is mean and S is standard deviation.
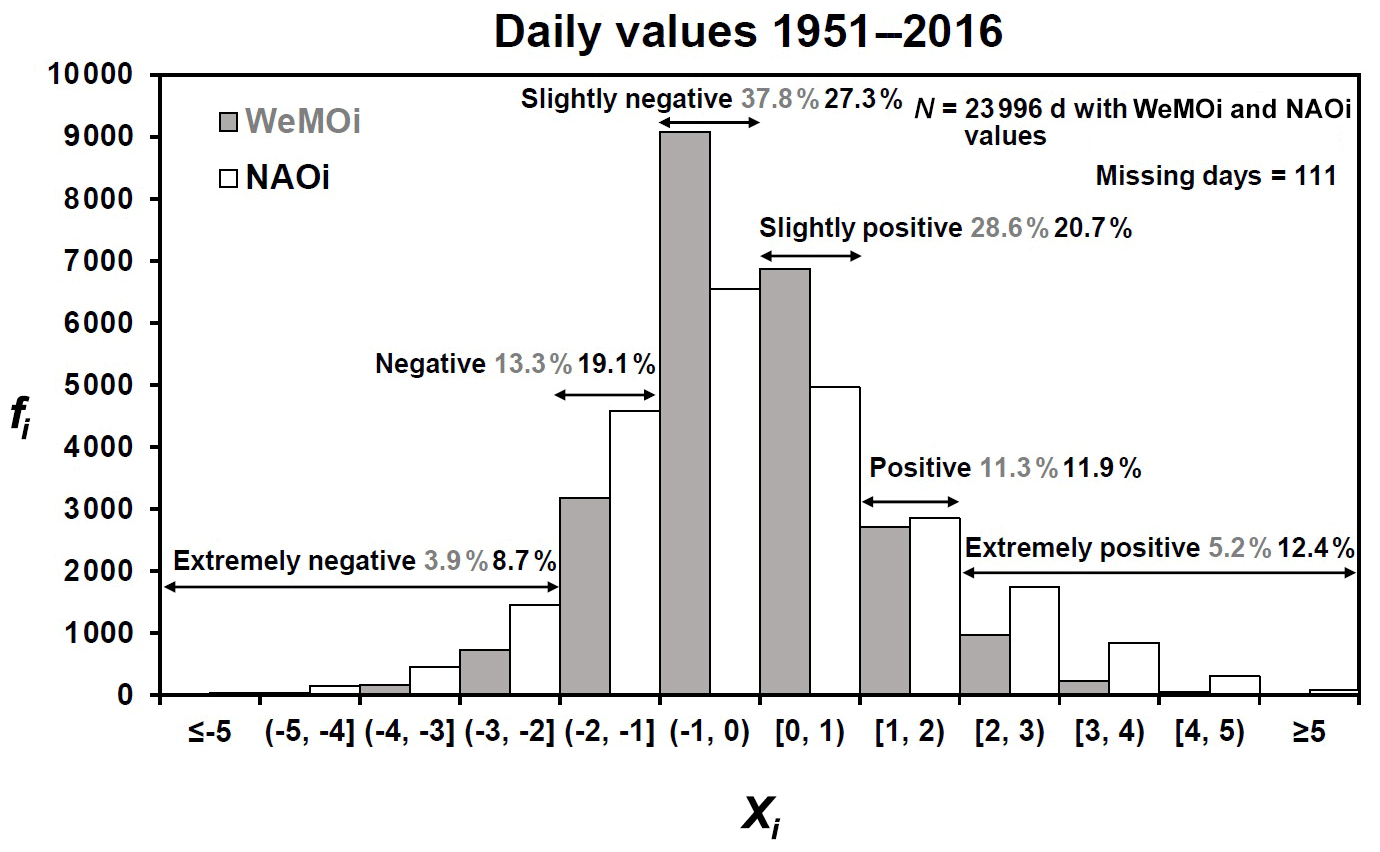
Figure 4Frequency histogram of all daily WeMO index (WeMOi) values and daily North Atlantic Oscillation index (NAOi) values during the 1951–2016 study period.
This calculation method, which considers all days of the year in the reference period, enables all Mediterranean flows (negative WeMO phase) to be detected, even if they are very weak. Otherwise, these moderate Mediterranean winds would not be detected in autumn, since the WeMOi means are clearly negative during this season. Likewise, the weak Mediterranean flows would be overestimated in winter due to the high WeMOi mean during the coldest months. According to previous studies (Martin-Vide and Lopez-Bustins, 2006; Azorin-Molina and Lopez-Bustins, 2008), in the histogram of daily WeMOi frequencies, WeMOi values between −1.00 and 1.00 are considered to constitute a neutral WeMO phase, values ranging from 1.00 to 1.99 are considered a positive WeMO phase, those between −1.99 and −1.00 a negative WeMO phase, values ≥2.00 are deemed to represent an extreme positive WeMO phase and those to indicate an extreme negative WeMO phase. The most positive WeMOi value (+5.99) of the 1951–2016 study period refers to 2 December 1976 (Fig. 3a), when an intense precipitation episode was recorded in the Basque Country (northern Spain), according to the European Climate Assessment (ECA) dataset (Klein Tank et al., 2002; Cornes et al., 2018). The most negative WeMOi value (−5.97) during the 1951–2016 period corresponds to 28 November 2014 (Fig. 3b), when 253.5 mm was registered in the Parc Natural dels Ports (Tarragona) during the following day (Table 1). Lana et al. (2016) studied the statistical complexity and predictability of the WeMOi and demonstrated the Gaussian distribution of this index. Most daily WeMOi values are negative (55 %), and two-thirds of the 23 996 d displaying WeMOi values correspond to a neutral WeMO phase (Fig. 4). The positive (negative) WeMO phase was detected in 16.5 % (17.2 %) of the total days presenting a WeMOi value. The extreme WeMOi values, both positive (5.2 %) and negative (3.9 %), represent less than 10 % of the total number of days for which WeMOi values are available. Daily NAO index (NAOi) values are also used for comparison with WeMOi values and to enhance the role played by the WeMO in torrential precipitation. Following the calculation method based on daily WeMOi values, daily NAOi values are computed by means of surface pressure data from the San Fernando (SW Spain) and Reykjavík (SW Iceland) weather stations; the data for Reykjavík were provided by the ECA dataset (Klein Tank et al., 2002). The NAOi values present the same percentage as that of the negative WeMOi daily values (55.1 %), and almost half of the days are around 0. The distribution of the daily values of the NAOi presents more extreme positive and negative values than the WeMOi distribution, 12.4 % vs. 5.2 % and 8.7 % vs. 3.9 %, respectively (Fig. 4).
3.3 Construction of calendars
Construction of calendars is a common procedure in climatological studies (Soler and Martin-Vide, 2002; Azorin-Molina and Lopez-Bustins, 2008; Meseguer-Ruiz et al., 2018). The calendars enable the intra-annual variability in the climate variable to be visualised. We computed daily WeMOi values for the 1951–2016 (66 years) study period, constructing two WeMOi calendars based upon the mean values obtained for each month, a 15 d period (i.e. a fortnight) and a 10 d period; the latter timescale corresponds approximately to the baroclinic prediction period (Holton, 2004). The first climate calendar will show the annual cycle of the WeMOi values according to months (12 values); the second will display a more detailed intra-annual oscillation with 24 values; and, finally, the 36 WeMOi values derived from the 10 d calendar will enable the slightest intra-annual variations in the WeMOi to be detected. We will add to these calendars all the extreme torrential events in order to observe correspondences between WeMOi values and heavy precipitation events over the year. In order to detect any changes in the calendars throughout the study period, we consider two subperiods for the construction of two additional calendars: 1951–1983 (33 years) and 1984–2016 (33 years). We statistically tested the mean WeMOi values according to subperiods in order to detect statistically significant differences. This statistical significance is computed by means of a normal distribution test according to several confidence levels: 95.0 % (Z=1.960), 99.0 % (Z=2.576) and 99.9 % (Z=3.291).
Additionally, we analysed these calendars according to subperiods, together with changes in SST and subsurface temperature at several depths (20, 50 and 80 m b.s.l.) at a site located on the coast of Girona province (Fig. 1). These data constitute a reference series of sea temperature observations for Spain and for the Mediterranean basin due to their long temporal range (almost half a century) and to their availability at several subsurface levels (Salat et al., 2019); the data on the 1973–2017 period were provided by the Meteorological Service of Catalonia. We calculated monthly temporal trends in sea temperatures using least-squares linear fitting, and we estimated the statistical significance by means of the Mann–Kendall non-parametric test (Sneyers, 1992). The standardised values (Z) of sea temperatures were computed at 10 d resolution, and the Z differences were obtained between two 5-year subperiods from the beginning and the end of the 1973–2017 period: 1973–1977 and 2013–2017. We showed the Z differences for the months of the wet season (September, October and November) for most of Catalonia (Fig. 2b) and also for December in order to detect a potential temporal shift in sea warming rates towards the early winter.
4.1 Frequency and temporal evolution of the extreme torrential events
During the 1951–2016 period, 50 episodes presenting ≥200 mm in 24 h were detected (0.8 cases per year) in Catalonia (Table 1); these were mainly concentrated in the eastern Pyrenees (Girona) and southern Catalonia (Tarragona; Fig. 1), where mountain ranges run in a N–S direction, constituting an orographic barrier to the humid easterly flows (Lopez-Bustins and Lemus-Canovas, 2020). In the province of Lleida no maximum values for precipitation episodes have been recorded, because this province is less influenced by easterly flows as a result of its continental features. Other parts of Iberia register a higher frequency of extreme torrential events, e.g. in the Valencia region, eastern Spain, there were two cases per year during the 1971–2000 period (Riesco and Alcover, 2003). The highest frequency of torrential events (≥100 mm in 24 h) over the Iberian Peninsula also corresponds to the Valencia region, where more than one case per year can be recorded by the same observatory (Pérez-Cueva, 1994) and approximately 11 cases per year by all the stations in the Valencia region (Riesco and Alcover, 2003). Catalonia exhibits a lower frequency of these torrential events (i.e. ≥100 mm in 24 h), five to six cases per year for the whole region (Martin-Vide and Llasat, 2000; Lopez-Bustins et al., 2016). The highest precipitation amount during 07:00–07:00 UTC ever recorded in Catalonia is 430 mm. This occurred in Cadaqués (Cap de Creus, in the easternmost part of the Iberian Peninsula) on 13 October 1986. It was an extraordinary episode which also affected the region of Pyrénées-Orientales (S France; Vigneau, 1987), albeit with a lower amount of precipitation than that produced by other extreme torrential events of over 800 mm in the Liguria region (NW Italy), Valencia region (E Spain) and this region of Pyrénées-Orientales (Peñarrocha et al., 2002).
Most of the episodes in Catalonia (60 %; 30 events) took place in an extreme negative (2.00) WeMO phase (Fig. 5), whereas less than 4 % of the total number of days with WeMOi data showed a value equal to or lower than −2.00 (Fig. 4). Moreover, 24 % (12 events) of the episodes occurred in a negative (−2.00, −1.00] WeMO phase. The remaining 8 events (16 %) took place in a slightly negative (−1.00, 0.00) WeMO phase. No extreme torrential episodes presenting a positive WeMOi value occurred in Catalonia during the study period. Furthermore, Martin-Vide and Lopez-Bustins (2006) found no positive daily WeMOi values for torrential episodes (≥100 m in 24 h) in Tortosa (south Catalonia) during the 1951–2000 period. On the other hand, the maximum concentration of extreme torrential events according to NAOi values falls within the interval (−1.00, 0.00), and both negative and positive NAOi values can account for an event. This result demonstrates the fact that daily WeMOi values are more useful than daily NAOi values. This is further evidenced by the fact that only 24 % of the total number of events took place during an extreme negative () NAO phase, whereas this percentage rises to 60 % in an extreme negative WeMO phase.
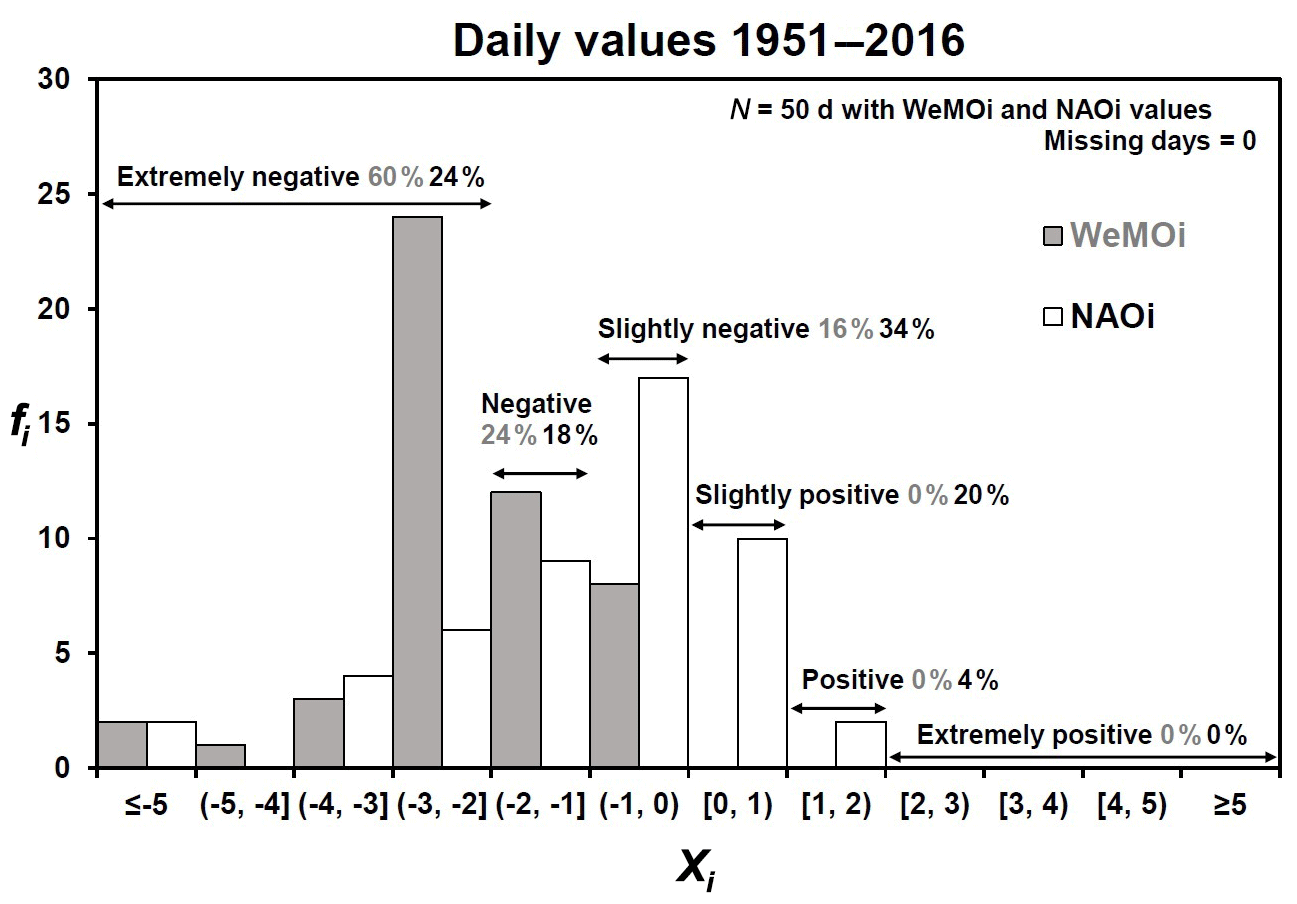
Figure 5Frequency histogram of the daily WeMOi and NAOi values of the 50 extreme torrential events recorded in Catalonia during the 1951–2016 study period.
Most of the years in the 1951–2016 period present no episodes or only one (Fig. 6); in six of the years there were two or three episodes, depending on the year, and in just two of the years (1971 and 2000) we detected over three episodes in 1 year. The greatest accumulation of cases can be observed in 1971, when a long-lasting torrential episode exceeded the threshold of 200 mm in 24 h during 4 consecutive days in September, with another 1 d episode occurring in October. The former is one of the most noteworthy episodes recorded in Catalonia (Llasat, 1990; Martin-Vide and Llasat, 2000) in the last few decades. It started on 19 September in southern Catalonia and ended on 22 September in the northeast of the study area (Llasat et al., 2007). During the last decade, there has been no more than one episode in 1 single year. However, for torrential events (≥100 mm in 24 h) in Catalonia, Lopez-Bustins et al. (2016) detected a 45 % increase in cases between the 1950–1981 and 1982–2013 subperiods. In accordance with this rise in torrential precipitation events, many studies on Iberian precipitation have shown an increase in precipitation of Mediterranean origin in eastern Spain (Miró et al., 2009; Lopez-Bustins et al., 2008; De Luis et al., 2010); this contributes to an increase in precipitation variability over the western Mediterranean (Hartmann et al., 2013, Caloiero et al., 2019). On the other hand, a non-statistical temporal trend is observed in the annual frequency of the extreme torrential episodes (i.e. ≥200 m in 24 h) in Catalonia during the study period (Fig. 6). This is in line with Llasat et al. (2016), who found non-statistical temporal trends in extreme daily precipitation in Catalonia during the last decades.
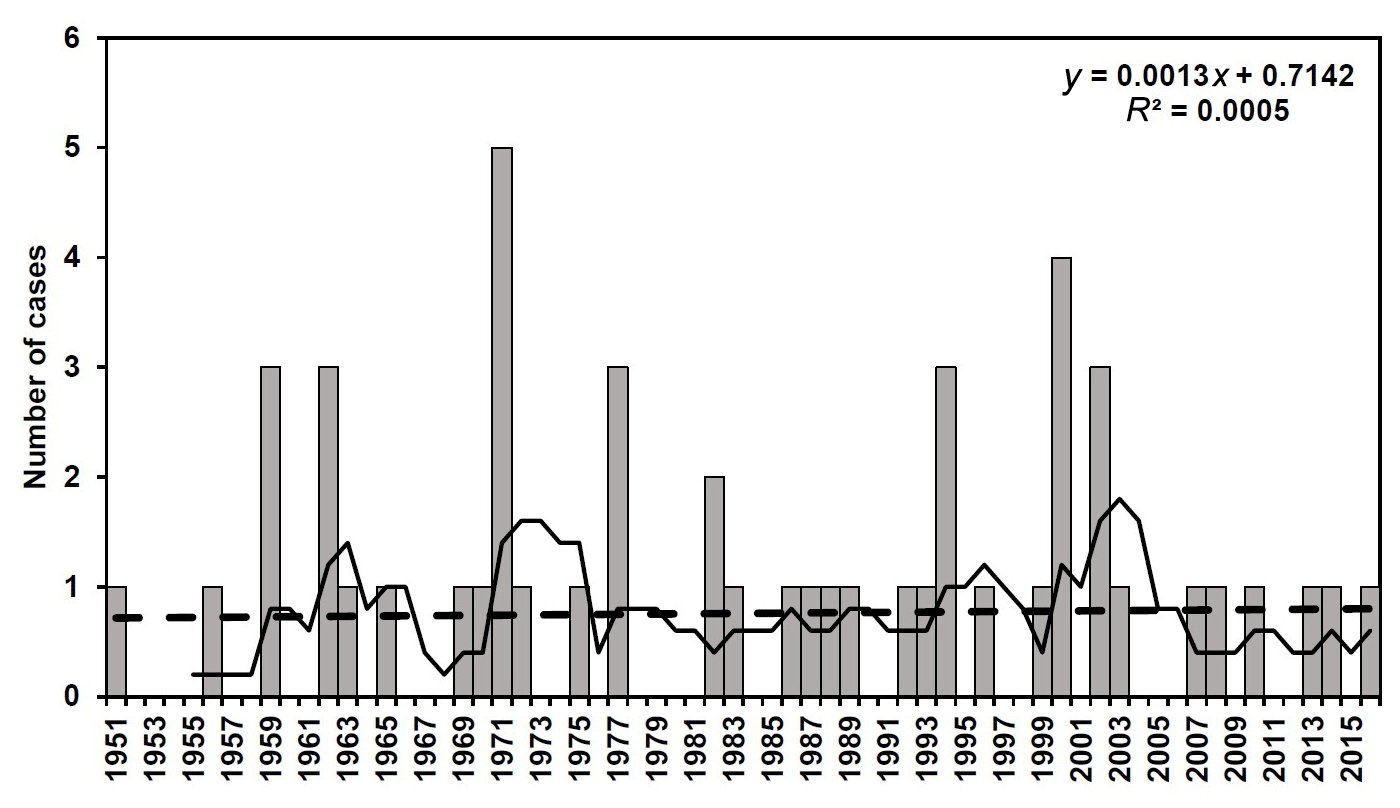
Figure 6Temporal evolution of the annual frequency of extreme torrential events (≥200 mm in 24 h) throughout the 1951–2016 study period. The figure shows the linear regression (dashed line) and 5-year running mean (black line).
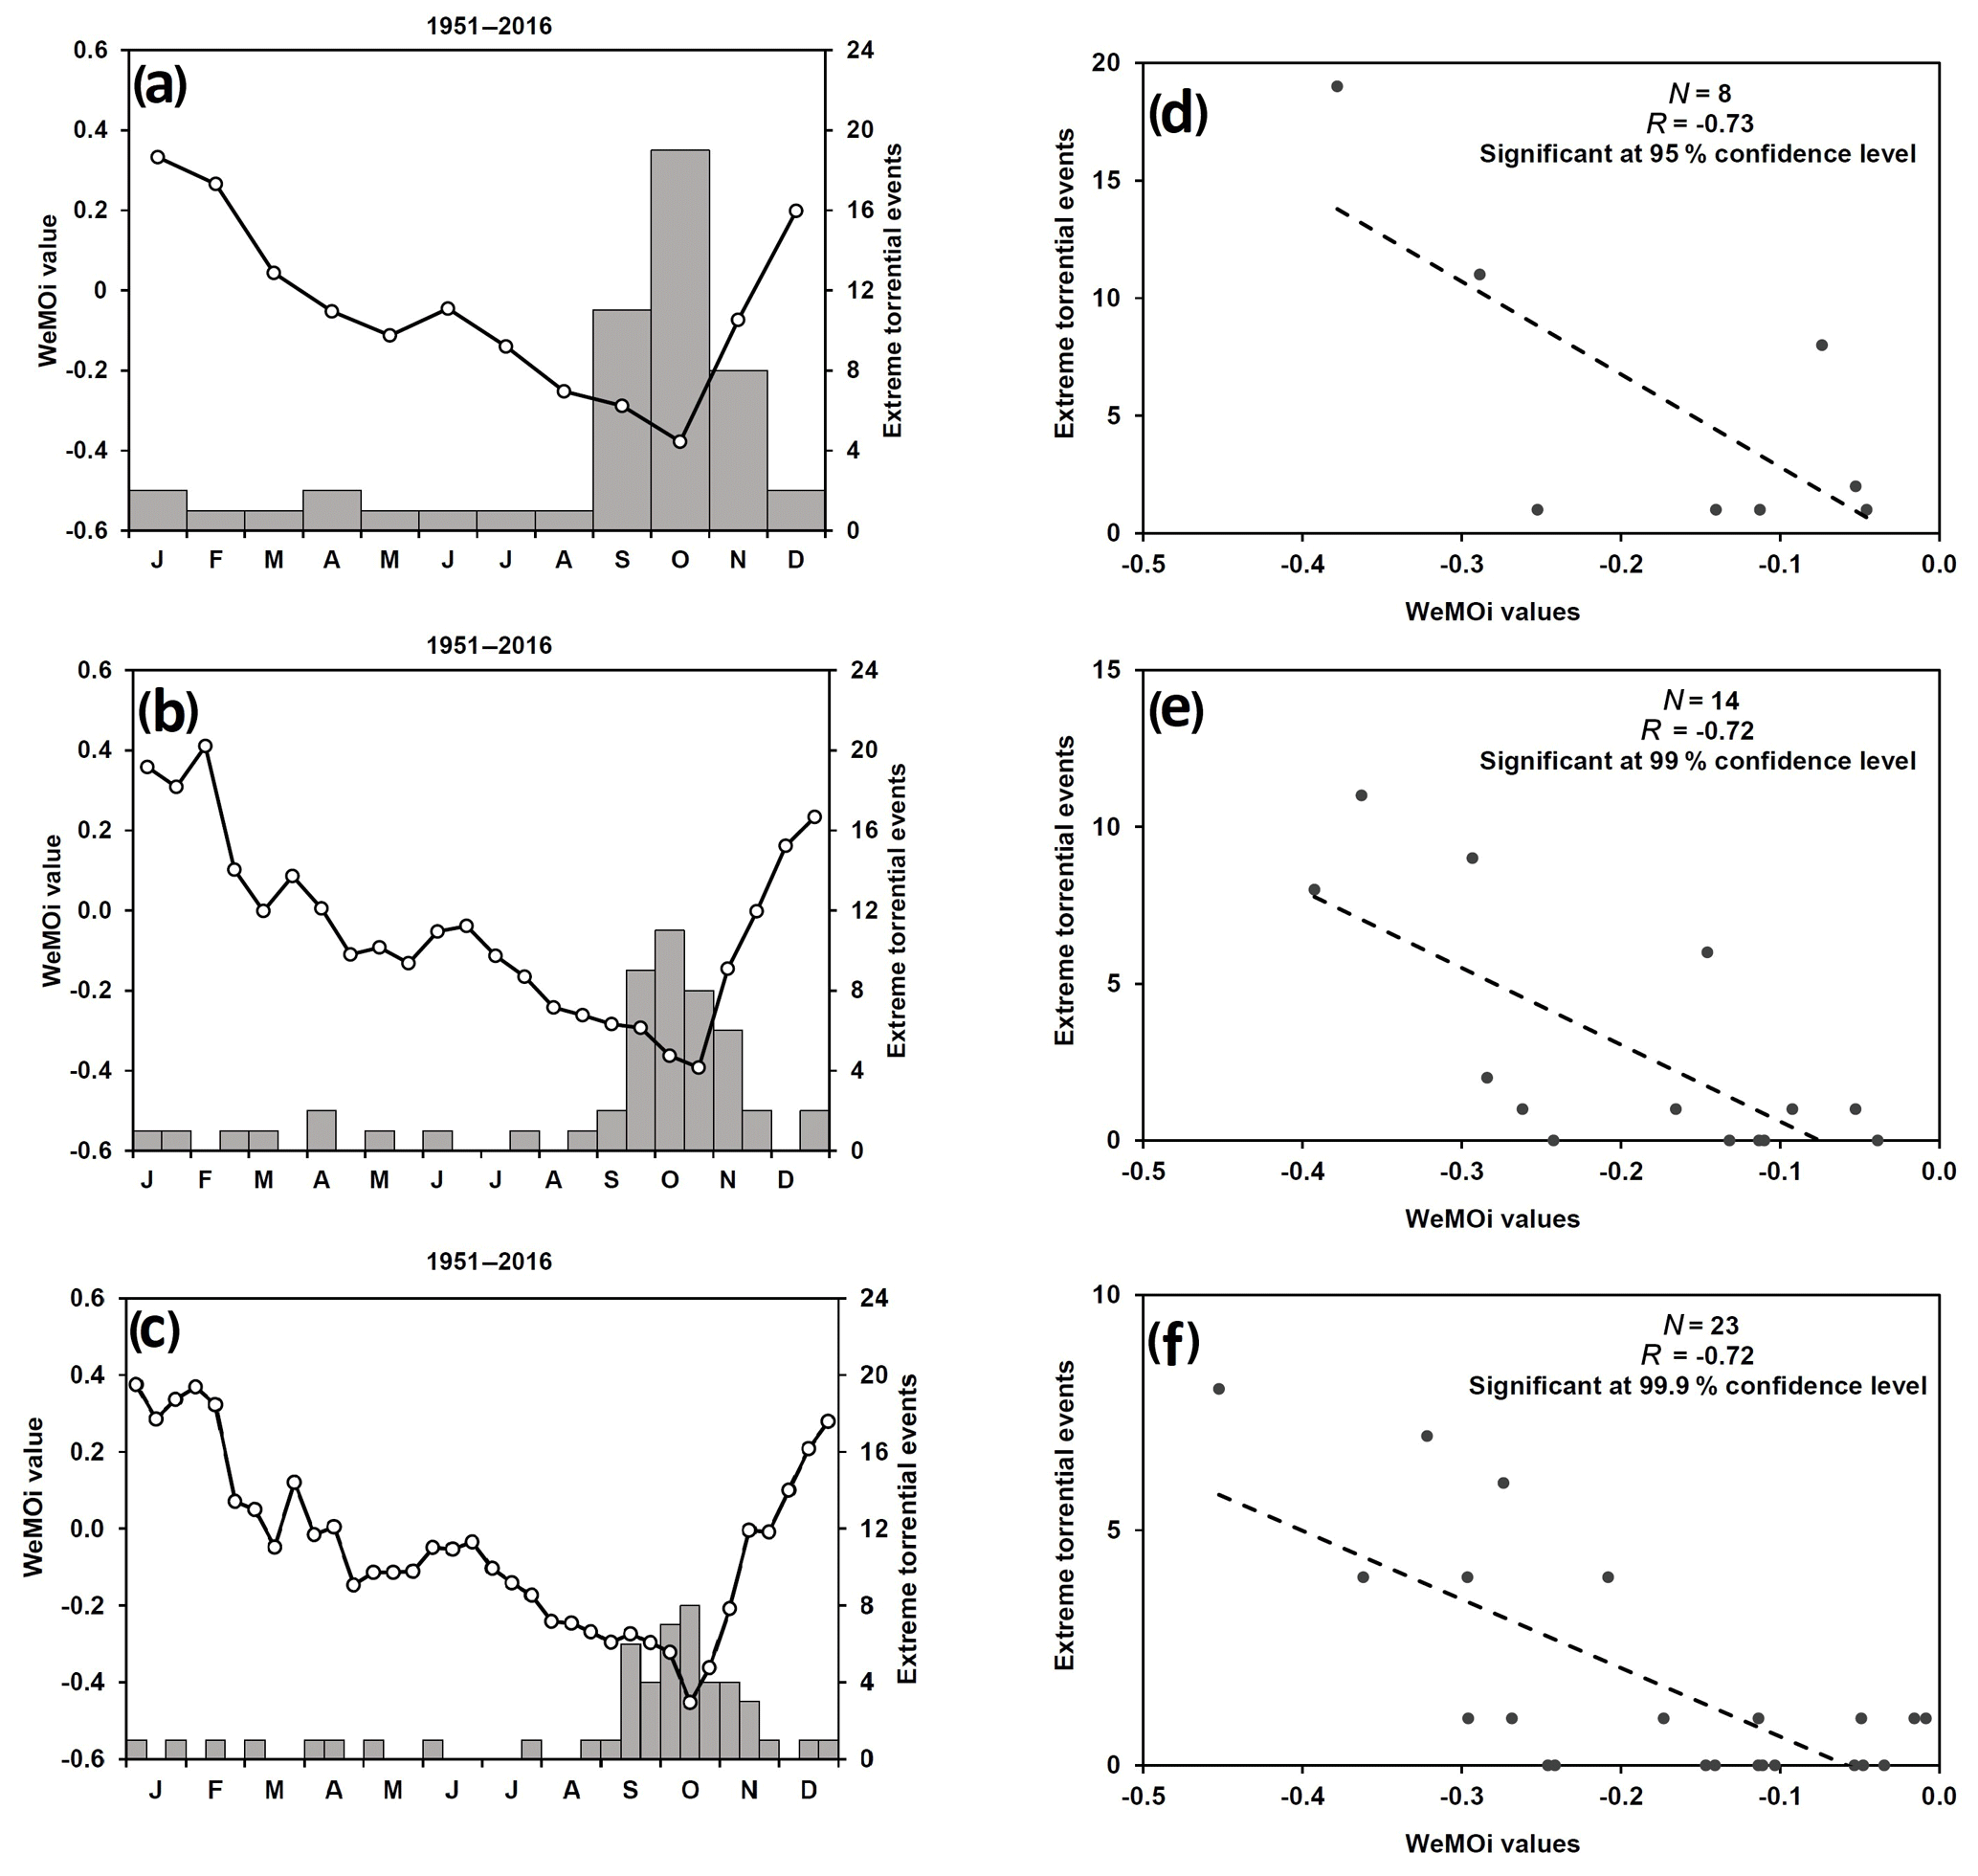
Figure 7WeMOi calendars (lines) and frequency of extreme torrential episodes (bars) at several timescales: monthly (a), fortnightly (b) and 10 d (c). Scatter plot of the relationship between extreme torrential events and negative WeMOi values at several timescales: monthly (d), fortnightly (e) and 10 d (f); the linear regression is shown as a dashed line.
4.2 Calendars of the daily WeMOi values
The lowest WeMOi values are detected in autumn, especially in October (−0.38; Fig. 7a), usually with humid easterly flows from the Mediterranean Sea. This explains why autumn and October are the wettest season and month, respectively, on most of Spain's eastern façade (De Luis et al., 2010). The greatest accumulation of extreme torrential events in Catalonia is in October, with 19 events (38 % of all cases). This is coherent with subsurface sea temperature, which reaches its annual maximum in autumn (not shown). September also shows a remarkable accumulation of events (11 cases), displaying the second-lowest WeMOi monthly value (−0.29). Positive WeMOi values are observed from December to March, with very few events occurring. Sea temperature decreases after the wet season, and the first months of the year constitute the period when seawater is the coldest (not shown). Additionally, WeMOi values are very high in January and February, and the precipitation–convection phenomenon can therefore be halted by a strong decrease in SST (Lebeaupin et al., 2006). Although negative WeMOi values are detected from April to November, very few episodes are registered in late spring and summer; the predominance of atmospheric stability during the warm season reduces the chances of extreme torrential events occurring over the study area. At the fortnightly timescale, we detected the minimum WeMOi value (−0.39) during the second half of October (Fig. 7b). The greatest accumulation of episodes, however, is in the first half of October. The lowest WeMOi values are found from 16 September to 31 October. This short period of the year (46 d) accumulates over one-half of the total number of extreme torrential events (28 cases, 56 %). The most positive WeMOi values are detected in the winter months, particularly from 1 January to 15 February, and only two episodes are registered.
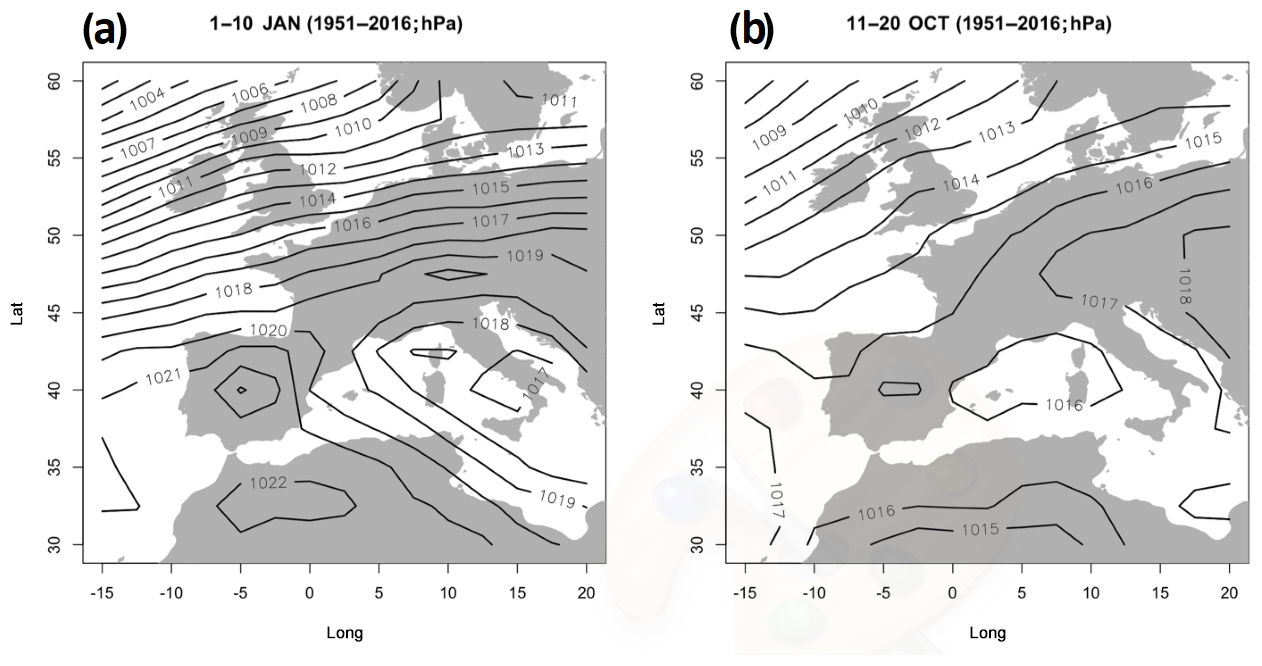
Figure 8Sea level pressure (SLP) mean of the synoptic window 30–60∘ N and 15∘ W–20∘ E from 1 to 10 January (a) and from 11 to 20 October (b) during the 1951–2016 study period. Data source: NCEP Reanalysis data provided by the NOAA/OAR/ESRL PSD, Boulder, Colorado, USA.
At the 10 d timescale, we observed the WeMOi minimum value (−0.45) from 11 to 20 October (Fig. 7c). This 10 d period also presents the largest accumulation of extreme torrential events in Catalonia (eight cases; 16 % of the total number of cases). At least four cases are registered in each 10 d period from 11 September to 10 November. This period of the year (61 d) accumulates two-thirds (33 cases, 66 %) of all extreme torrential events. WeMOi values are lower than −0.20 from 1 August to 10 November, fitting well with the period of highest frequency of extreme torrential events in Catalonia. From 1 August to 10 September, only two cases are registered due to the above-mentioned atmospheric conditions in summer. From 11 September to 10 November, favourable conditions can arise for the occurrence of extreme torrential events in Catalonia: a high SST in the western Mediterranean Sea and the early cut-off of subpolar lows travelling to Mediterranean latitudes (Estrela et al., 2008; Lopez-Bustins et al., 2016; Pérez-Zanón et al., 2018). The positive WeMOi values are observed from December to March, and each 10 d period presents either no episode or only a single one. The most positive WeMOi value is observed from 1 to 10 January (+0.38); this indicates the total predominance of the positive phase of the teleconnection during these days, according to the 1951–2016 study period (Fig. 8a). During this 10 d period, the occurrence of extreme torrential events in eastern Iberia is strongly inhibited by the NW atmospheric circulation over the study area; seawater is cold and the Genoa low is well represented. The remaining 10 d periods in winter also present a predominance of the western circulation over the Iberian Peninsula. This pattern causes positive pressure differences between the Gulf of Cadiz (at a lower latitude) and the north of Italy (at a higher latitude), which produces positive WeMOi values and inhibits precipitation in eastern Iberia because of its location in the lee of the westerlies. On the other hand, the mean sea level pressure (SLP) map from 11 to 20 October shows a predominance of the negative WeMO phase, with humid easterly flows over Iberia, low pressure usually located in the western Mediterranean basin, and a blocking anticyclone over central and eastern Europe (Fig. 8b).
This is approximately 60 % of the year falling under negative WeMOi values at monthly N=8 (out of 12; Fig. 7d), fortnightly N=14 (out of 24; Fig. 7e) and 10 d N=23 (out of 36; Fig. 7f) timescales. The linear regression between negative WeMOi values and episodes is statistically significant at all timescales, providing an R of −0.73 (Fig. 7d), −0.72 (Fig. 7e) and −0.72 (Fig. 7f). There is a statistically significant increase in the occurrence of events as the WeMOi value decreases. The linear fitting is especially significant at 10 d resolution.
The WeMO teleconnection pattern can exert its influence upon precipitation variability in other regions of southern Europe (Caloiero et al., 2011; Milosevic et al., 2016; Mathbout et al., 2020). This central period of October may be the most prone to torrential events over many regions of the western Mediterranean due to presenting the lowest WeMOi value of the year. On the Iberian Peninsula, the Almanzora River (SE Spain) suffered two of the four most catastrophic floods in the last 450 years within this central interval in October (Sánchez-García et al., 2019). Moreover, the deadliest torrential episodes in the Valencia region (E Spain) occurred on 13–14 October 1957 and 19–20 October 1982 (Olcina et al., 2016; Miró et al., 2017).
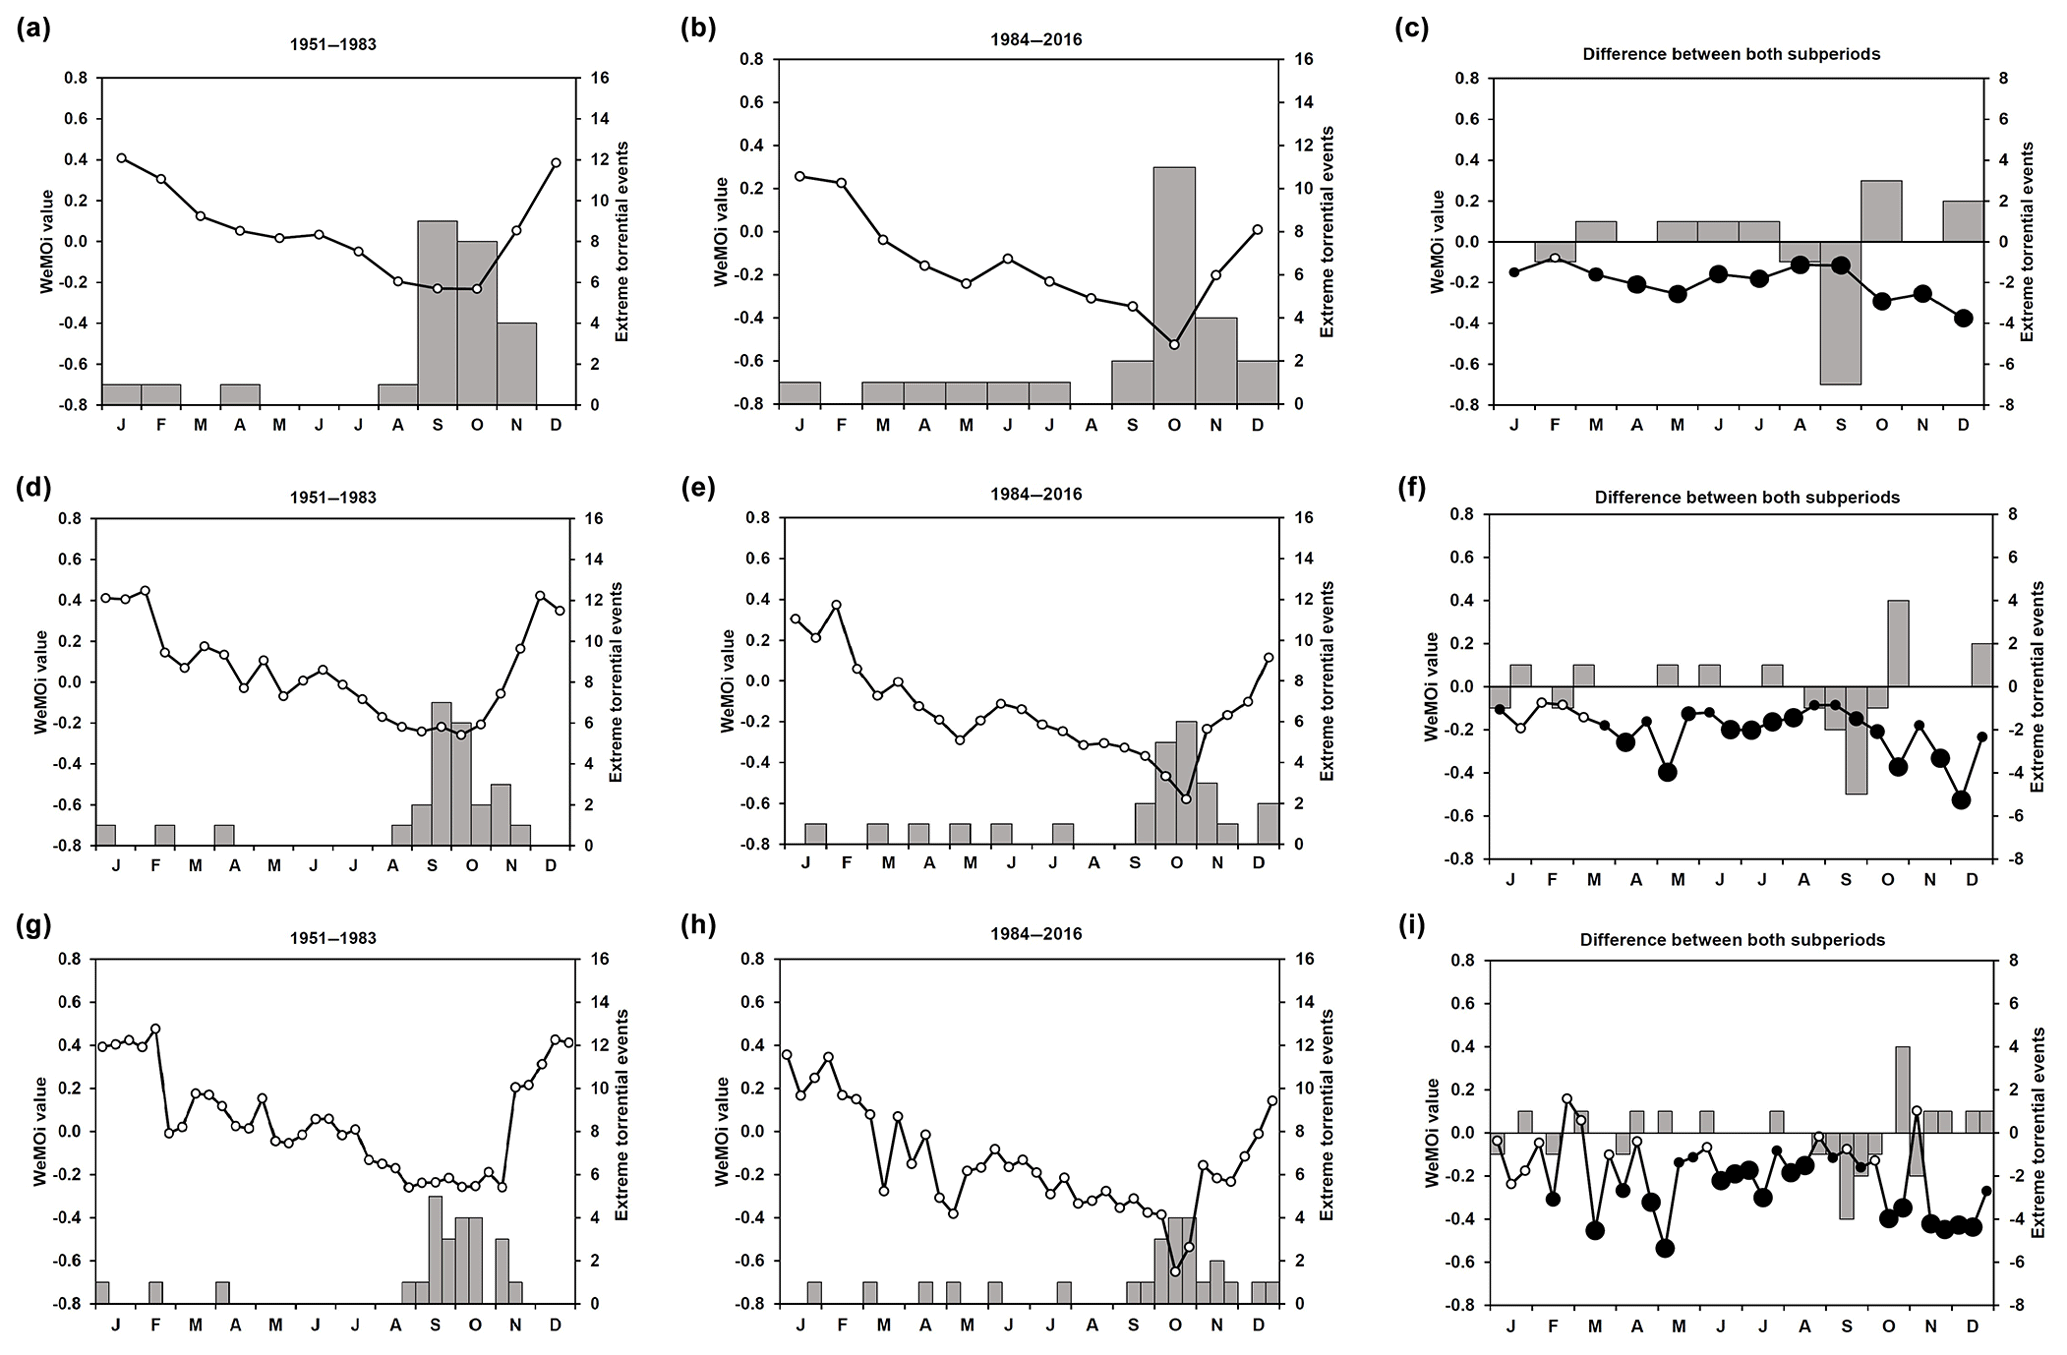
Figure 9WeMOi calendars (lines) and frequency of extreme torrential episodes (bars) at several timescales: monthly (a–c), fortnightly (d–f) and 10 d (g–i) for the 1951–1983 (a, d, g) and 1984–2016 (b, e, h) subperiods. Panels (c, f, i) show the difference in the number of episodes and WeMOi values between both subperiods (for WeMOi values: white dots indicate not statistically significant differences, and small-, medium- and large-sized black dots show statistically significant differences at the 95.0 %, 99.0 % and 99.9 % confidence levels, respectively).
4.3 Subperiods and differences in the calendars
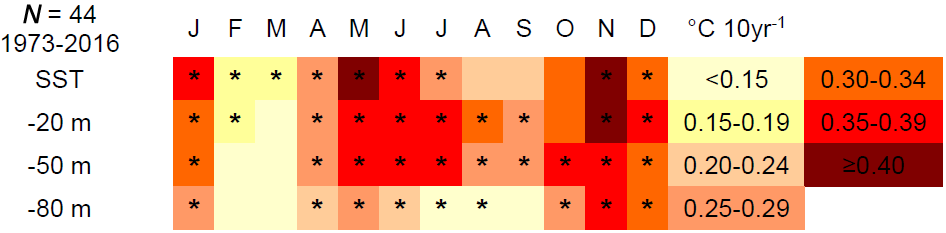
In relation to the calendars, and according to subperiods, we observed an overall decrease in WeMOi values throughout the year (Fig. 9). On the contrary, no change was observed in the frequency of episodes between both subperiods; exactly 25 extreme torrential events occurred in each subperiod. At the monthly timescale, the extreme torrential period takes place in September and October during the first half (1951–1983). For the second half (1984–2016), the maximum accumulation of cases shifts from September–October to October–November, with the highest concentration of cases in October, whilst new cases occur during early winter (December). All WeMOi values are statistically and significantly lower during the second subperiod than during the first one in all months, especially from October to December. In the summer months, the decrease in WeMOi values is moderate, albeit statistically significant due to the low variability in the WeMOi values during the warm months. All these seasonal changes can be related to trends in SST during the last few decades; the highest rate of SST warming is in November (0.42 ∘C per decade; Table 2). Higher SST is directly associated both with a high rate of seawater evaporation and with more intense latent heat transfer to the atmosphere (Pastor et al., 2015), which is necessary with regard to greatly increasing the precipitable water in the column. A general warming of sea temperature occurred over the year at all levels (surface, 20, 50 and 80 m b.s.l.), particularly in spring, late autumn and early winter, a fact which might explain these more negative WeMOi values during the second subperiod; the warming of the lowest level of the atmosphere over the western Mediterranean Sea contributes to the formation of mesoscale lows (Jansà et al., 2000). Similar rates of warming at near-surface sea level have been recorded in other locations in the north Mediterranean Sea (Raicich and Colucci, 2019). The highest warming rates have been observed at the sea surface and 20 m b.s.l., but the statistical significance has been greater at the deepest levels, i.e. 50 and 80 m b.s.l. (Table 2). Figure 10 shows that changes in WeMOi values between both subperiods are negatively and statistically correlated with sea temperature trends, above all in the underlying layers, especially at 80 m b.s.l., where sea temperature displays a low interannual and intra-annual variability and sea heat content hardly varies (Sparnocchia et al., 2006).
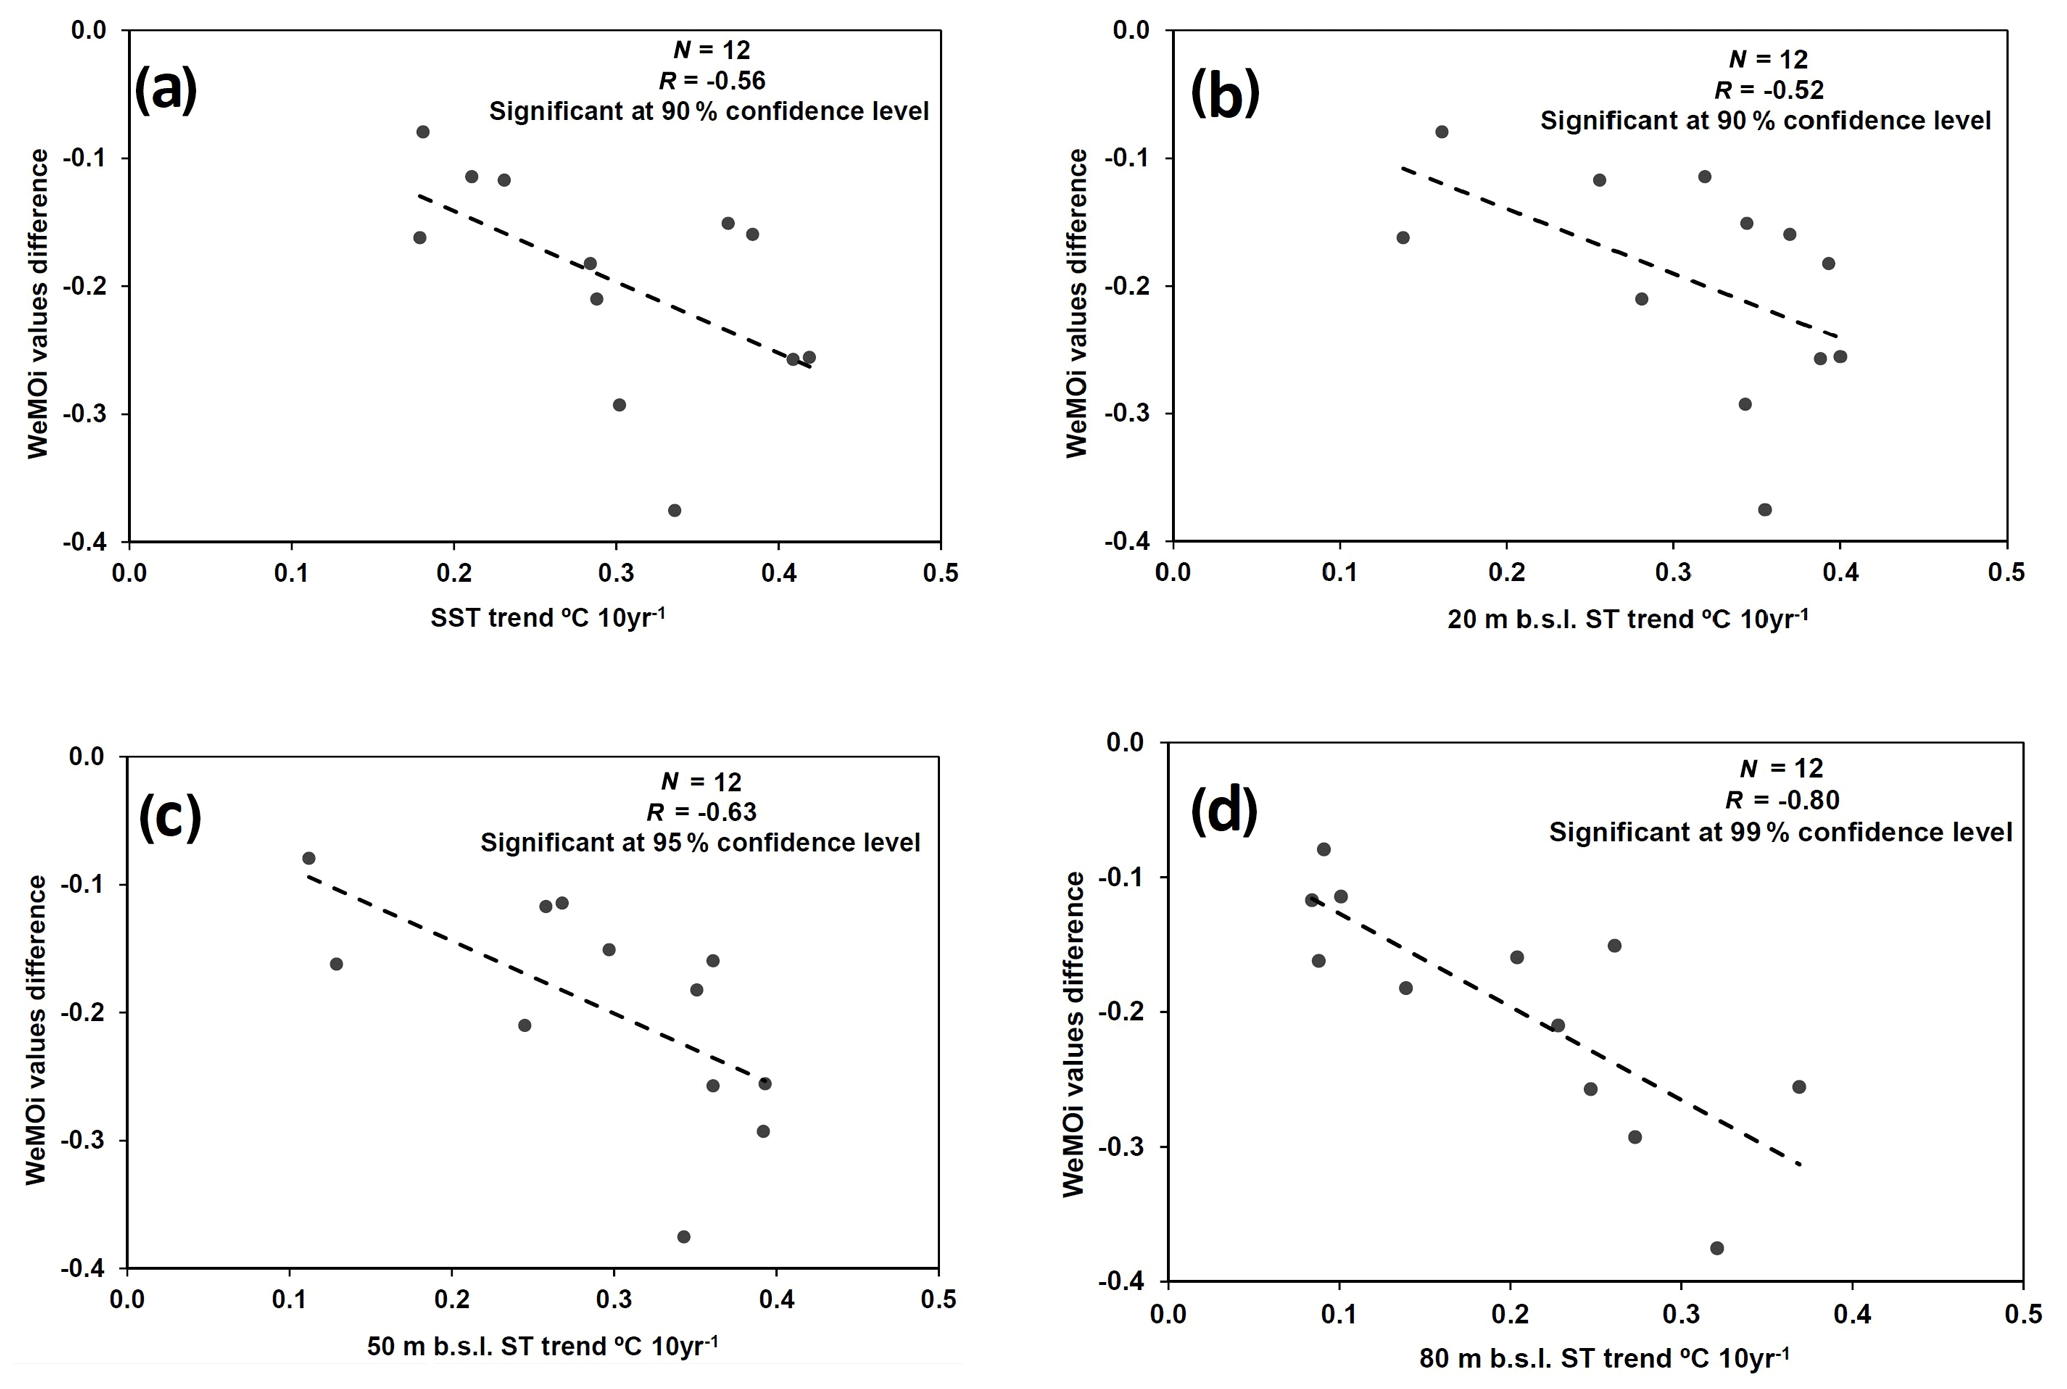
Figure 10Scatter plot of the monthly relationship between the WeMOi value differences (1984–2016 minus 1951–1983) and sea temperature (ST) trends during the 1973–2016 period at surface (SST; a), 20 m b.s.l. (b), 50 m b.s.l. (c) and 80 m b.s.l. (d). A dashed line indicates the linear regression.
Table 2Monthly sea temperature trends at surface (SST), 20, 50 and 80 m b.s.l. during 1973–2016 (* statistically significant trends at the 95 % confidence level by means of the Mann–Kendall non-parametric test).
At the fortnightly timescale, a shifting in maximum torrentiality is observed from 16 September–15 October to 1–31 October. The lowest WeMOi value of the calendar from 1951 to 1983 was in the first fortnight of October (−0.26); however, the lowest value is observed in the second fortnight of October during the 1984–2016 period (−0.58). All WeMOi values according to fortnights showed a statistical and significant decrease during the second period, except from 16 January to 15 March. The sharpest decline in WeMOi values is in the first fortnight of May, the second fortnight of October, the second fortnight of November and the first fortnight of December. The lowest WeMOi value during the second subperiod is detected in the second fortnight of October, when the greatest increase in extreme torrential events is observed.
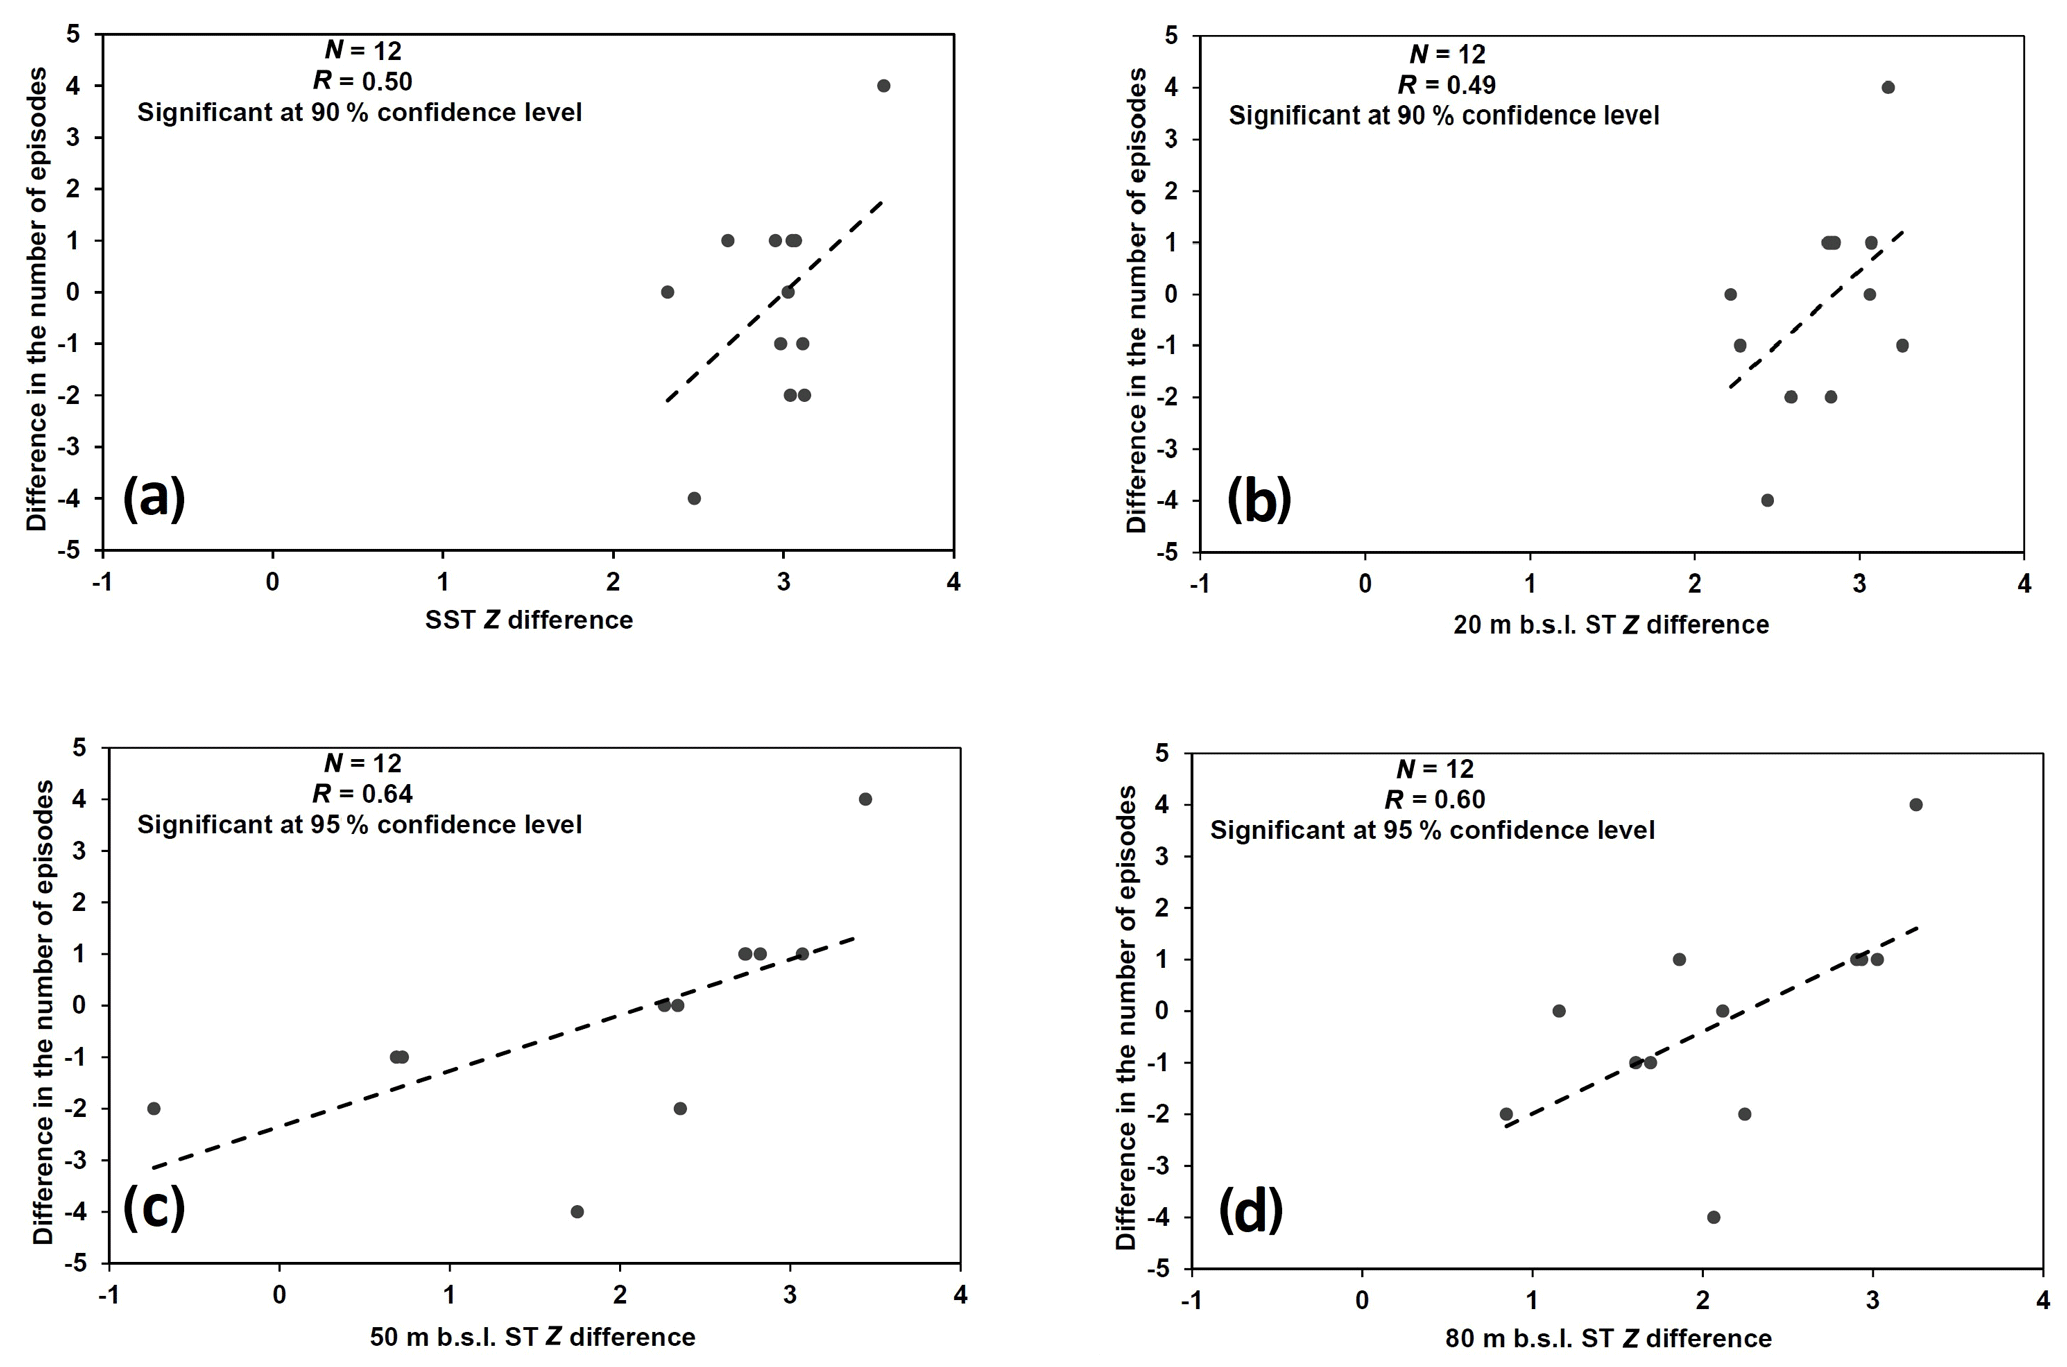
Figure 11Scatter plot of the 10 d relationship between the differences in the number of episodes (1984–2016 minus 1951–1983) and ST Z differences for two 5-year subperiods (2013–2017 minus 1973–1977) at surface (a), 20 m b.s.l. (b), 50 m b.s.l. (c) and 80 m b.s.l. (d) during the wet season (from September to November) and December (a dashed line indicates the linear regression).
Table 310 d period ST standardised value (Z) differences for two 5-year subperiods (2013–2017 minus 1973–1977) at surface, 20, 50 and 80 m b.s.l. during the wet season (from September to November) and December.
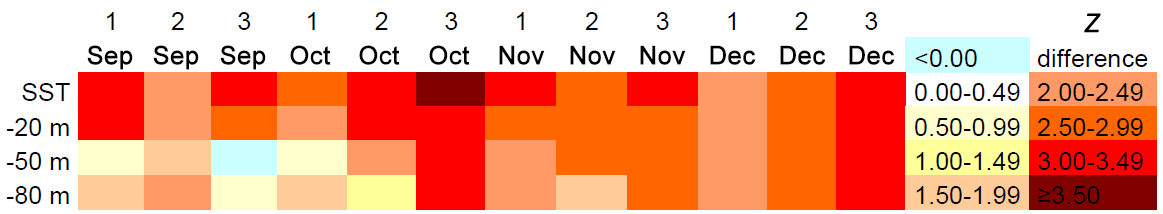
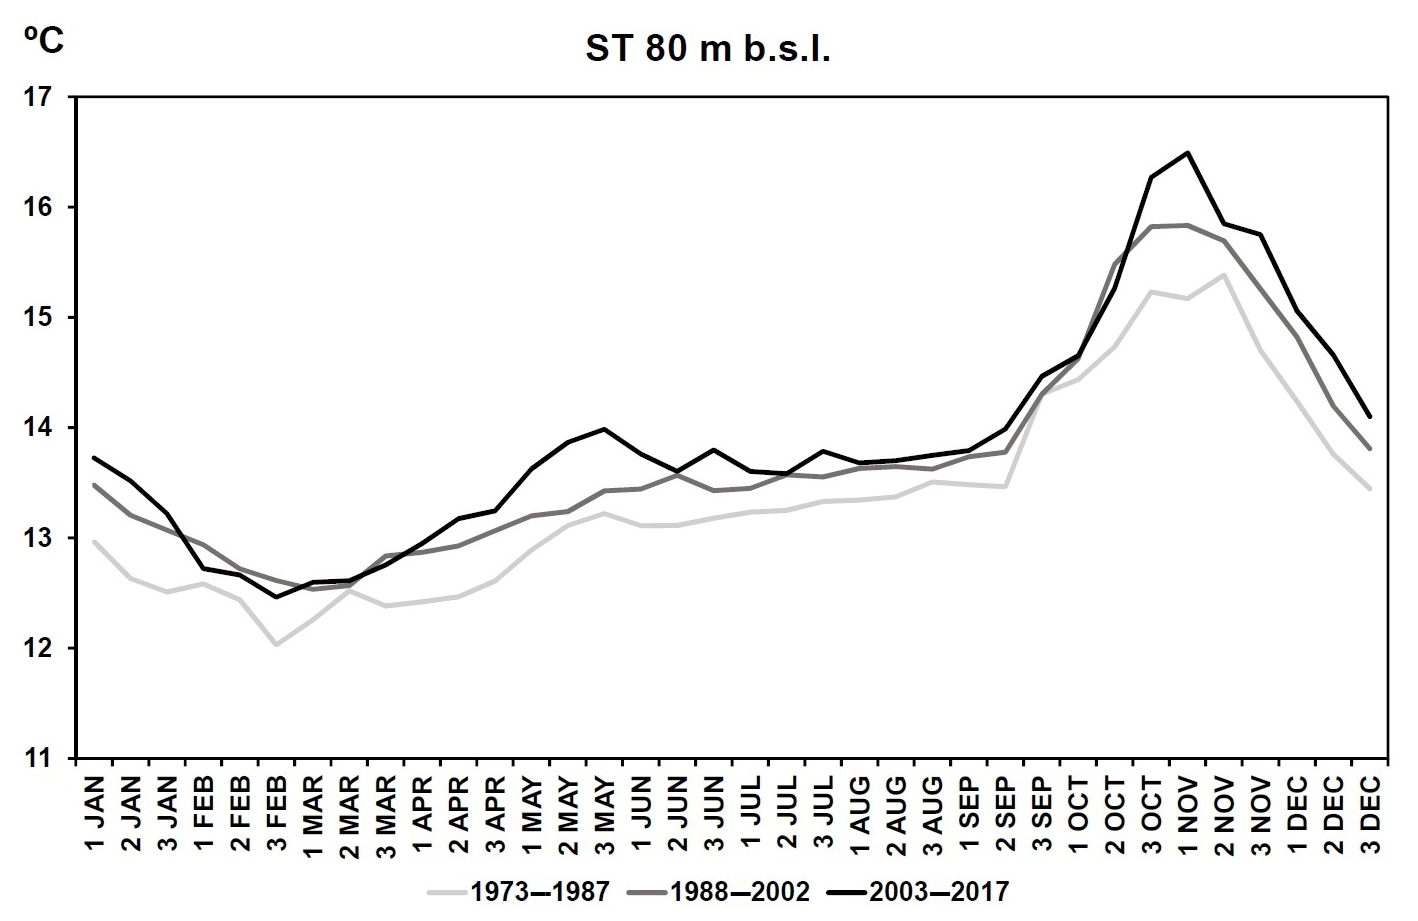
Figure 12ST 10 d calendar at 80 m b.s.l. for three 15-year subperiods: 1973–1987, 1988–2002 and 2003–2017.
At the 10 d timescale the lowest WeMOi values remain relatively constant from the end of August to the beginning of November during the first subperiod, which corresponds well with the occurrence of extreme torrential events. During the second subperiod, the lowest WeMOi values are found from 11 to 31 October, with an accumulation of eight cases (32 % of the total number of cases of the second subperiod). A continuous and statistically significant decrease in WeMOi values (at the 99.9 % confidence level) is observed from 16 October to 20 December during the second subperiod, except for the first 10 d period of November. The increase in torrential events is especially concentrated from 21 to 31 October. From 21 August to 10 October there is an overall decline in extreme torrential events, which might be associated with the fact that the WeMOi values hardly show a decrease over these 10 d periods of the year during the second subperiod. This is in line with the fact that the warming was moderate or that there was even a certain degree of cooling during the first 10 d periods of the wet season, i.e. from 1 September to 20 October, in the underlying sea layers (Table 3); and consequently, episodes might not have been favoured during the second subperiod. The highest sea temperature increase at all levels during the wet season is in the third 10 d period of October (Table 3), when the highest increase in extreme torrential episodes is observed (Fig. 9). The changes in the frequency of episodes are statistically correlated with sea temperatures at subsurface layers, i.e. 50 and 80 m b.s.l. (Fig. 11). The deepest level (80 m b.s.l.) shows the strongest warming in late autumn (from 21 October to 30 November), whereas this warming is weak in early autumn (from 1 September to 20 October; Fig. 12). This could be related to some recent changes in thermocline depth and time of destruction thereof due to warming of the Mediterranean Sea over the last few decades (Salat et al., 2019). The subsurface temperature may show a more constant warming of the Mediterranean Sea than SST, because the latter is usually affected by local phenomena.
In general terms, no more cases of extreme torrential events are observed during the 1984–2016 period in comparison with the 1951–1983 period. Nonetheless, a greater accumulation of cases can be observed during late autumn and a lesser accumulation in early autumn during the second subperiod in comparison with the first one. A sharp and continuous drop in WeMOi values is observed at the very end of autumn, which might indicate a shift in the seasonality of the extreme torrential period from September–October to October–November and an increase in precipitation irregularity due to a deeper WeMO negative phase (Lopez-Bustins and Lemus-Canovas, 2020). This seasonal shifting might be caused by a recent increase in sea temperature in the western Mediterranean basin, particularly in November (Table 2) and late October (Table 3) (Lopez-Bustins, 2007; Estrela et al., 2008; Lopez-Bustins et al., 2016; Arbiol-Roca et al., 2017). Pastor et al. (2018) used satellite data to identify an overall increase in SST throughout the Mediterranean basin during the 1982–2016 period, highlighting its role in torrential events in the western Mediterranean.
The present research confirms the usefulness of the WeMOi at daily resolution as an effective tool for analysing the occurrence of episodes of torrential precipitation over NE Spain. October is the rainiest month in most regions of the northwestern Mediterranean basin and can account for the lowest value of the year on the WeMOi monthly calendar, together with the warmest sea temperature of the year at the subsurface level. Moreover, most torrential episodes take place during a very short period in the middle of this month.
Catalonia is located in the northwestern Mediterranean basin, and its extreme precipitation is highly dependent upon the atmospheric circulation over the Mediterranean. The present study considers the threshold of 200 mm in 24 h for extreme torrential episodes, due to the fact that this precipitation accumulation in 1 d can cause serious widespread damage over a large area. Having thoroughly reviewed several databases and contrasted these results with the original files and nearby weather stations, we confirmed that Catalonia registered 0.8 cases per year (50 episodes in 66 years) of extreme torrential episodes during the 1951–2016 study period, in accordance with the 07:00–07:00 UTC pluviometric day.
The 10 d period from 11 to 20 October exhibits both the greatest accumulation of extreme torrential episodes in Catalonia and the lowest intra-annual WeMOi value. This 10 d period has been demonstrated to be the most prone to torrential events in this northwestern Mediterranean area, according to the WeMOi values. The most intense torrential event in Catalonia ever recorded by an official weather station is in Cap de Creus (the easternmost part of the Iberian Peninsula) within the 10 d period most susceptible to torrential precipitation (13 October 1986), with a total amount of 430 mm. The most positive WeMO phase of the year usually takes place in January, especially from 1 to 10 January, when the synoptic and sea temperature conditions of this time of the year inhibit torrential events.
No extreme torrential episodes in Catalonia occurred in a positive WeMO phase. Additionally, 60 % of the cases occurred in an extreme negative WeMO phase, i.e. a WeMOi value equal to or lower than −2.00. In the present study this threshold is considered to constitute the onset of a rainstorm favoured by a strong Mediterranean flow. The lower WeMOi value is related to an increase in extreme torrential events at all timescales. On comparing both study subperiods (1951–1983 and 1984–2016), an overall statistically significant decrease is detected in most WeMOi values of the year, especially at the end of October and in some periods in November and December. This might have been caused by an overall increase in sea temperature throughout the year, particularly in late autumn; this sea warming can enhance air convection (a decrease in surface pressure) over the western Mediterranean basin. On the other hand, extreme torrential events show no changes in frequency between both subperiods; no temporal trend is observed either during the 1951–2016 study period. The most notable change involves the displacement of extreme torrential episodes from early to late autumn; this is in accordance with the lower WeMOi values detected in the last 3 months of the year during the second subperiod. Increases in sea temperatures in the underlying layers during the end of the wet season can provide an understanding of these changes in extreme torrential events and in the WeMOi calendars. Sea temperature is an additional factor influencing torrential episodes in Catalonia; higher (lower) precipitation amounts can be registered in accordance with warmer-than-normal (colder-than-normal) seawater (Lebeaupin et al., 2006). The main causes of heavy precipitation in Catalonia involve easterly humid flows at the surface level with an upper cut-off low (Martin-Vide et al., 2008) and troughs in the upper troposphere with an advection maximum of positive vorticity on their front edge (Lolis and Türkeş, 2016).
The WeMOi data can be downloaded from the Climatology Group (University of Barcelona) website: http://www.ub.edu/gc/en/wemo/ (last access: 15 September 2020) (Climatology Group, 2020).
JALB performed the analysis and wrote the paper. LAR updated the WeMOi data and plotted the pressure maps. JMV discussed the results. ABE elaborated the inventory of the episodes and discussed the results. MPD discussed the results.
The authors declare that they have no conflict of interest.
The present study was conducted within the framework of the Climatology Group of the University of Barcelona (2017 SGR 1362, Catalan Government) and the Spanish CLICES project (CGL2017-83866-C3-2-R, AEI/FEDER, UE). Our research benefited from the daily precipitation data provided by the Meteorological Service of Catalonia. We are especially indebted to the meteorological observer from L'Estartit (Girona province), Josep Pascual, who has painstakingly recorded sea temperature data over the last few decades.
This research has been supported by the Spanish CLICES project (CGL2017-83866-C3-2-R, AEI/FEDER, UE).
This paper was edited by Ricardo Trigo and reviewed by two anonymous referees.
Alfieri, L., Burek, P., Feyen, L., and Forzieri, G.: Global warming increases the frequency of river floods in Europe, Hydrol. Earth Syst. Sci., 19, 2247–2260, https://doi.org/10.5194/hess-19-2247-2015, 2015.
Arbiol-Roca, L., Lopez-Bustins, J. A., and Martin-Vide, J.: The role of the WeMOi in the occurrence of torrential rainfall in Catalonia (NE Iberia), in: Abstracts book: 6th International Conference on Meteorology and Climatology of the Mediterranean (MetMed), ACAM, Zagreb, Croatia, 2017.
Arbiol-Roca, L., Lopez-Bustins, J. A., Esteban-Vea, P., and Martin-Vide, J.: Cálculo del índice de la Oscilación del Mediterráneo Occidental con técnicas de análisis multivariante, in: El Clima: Aire, Agua, Tierra y Fuego, edited by: Montávez-Gómez, J. P., Gómez-Navarro, J. J., López-Romero, J. M., Palacios-Peña, L., Turco, M., Jerez-Rodríguez, S., Lorente, R., and Jiménez-Guerrero, P., Asociación Española de Climatología (AEC), Cartagena, Spain, 761–771, 2018.
Armengot, R.: Las lluvias intensas en la Comunidad Valenciana, Ministerio de Medio Ambiente, Dirección General del Instituto Nacional de Meteorología, Madrid, Spain, 263 pp., 2002.
Azorin-Molina, C. and Lopez-Bustins, J. A.: An automated sea breeze selection based on regional sea-level pressure difference: WeMOi, Int. J. Climatol., 28, 1681–1692, https://doi.org/10.1002/joc.1663, 2008.
Baldwin, M. P. and Dunkerton, T. J.: Stratospheric harbingers of anomalous weather regimes, Science, 294, 581–584, https://doi.org/10.1126/science.1063315, 2001.
Barrera-Escoda, A., Gonçalves, M., Guerreiro, D., Cunillera, J., and Baldasano, J. M.: Projections of temperature and precipitation extremes in the North Western Mediterranean Basin by dynamical downscaling of climate scenarios at high resolution (1971–2050), Climatic Change, 122, 567–582, https://doi.org/10.1007/s10584-013-1027-6, 2014.
Beguería, S., Angulo-Martínez, M., Vicente-Serrano, S. M., López-Moreno, J. I., and Kenawy, A.: Assessing trends in extreme precipitation events intensity and magnitude using non-stationary peaks-over-threshold analysis: a case study in northeast Spain from 1930 to 2006, Int. J. Climatol., 31, 2102–2114, https://doi.org/10.1002/joc.2218, 2011.
Beniston, M. and Jungo, P.: Shifts in the distributions of pressure, temperature and moisture in the Alpine region in response to the behaviour of the North Atlantic Oscillation, Theor. Appl. Climatol., 71, 29–42, https://doi.org/10.1007/s704-002-8206-7, 2002.
Caloiero, T., Coscarelli, R., Ferrari, E., and Mancini, M.: Precipitation change in Southern Italy linked to global scale oscillation indexes, Nat. Hazards Earth Syst. Sci., 11, 1683–1694 https://doi.org/10.5194/nhess-11-1683-2011, 2011.
Caloiero, T., Coscarelli, R., and Gaudio, R.: Spatial and temporal variability of daily precipitation concentration in the Sardinia region (Italy), Int. J. Climatol., 39, 5006–5021, 2019.
Christensen, J. H., Krishna Kumar, K., Aldrian, E., An, S.-I., Cavalcanti, I. F. A., de Castro, M., Dong, W., Goswami, P., Hall, A., Kanyanga, J. K., Kitoh, A., Kossin, J., Lau, N.-C., Renwick, J., Stephenson, D. B., Xie, S.-P., and Zhou, T.: Climate Phenomena and their Relevance for Future Regional Climate Change, in: Climate Change 2013: The Physical Science Basis, Contribution of Working Group I to the Fifth Assessment Report of the Intergovernmental Panel on Climate Change, edited by: Stocker, T. F., Qin, D., Plattner, G.-K., Tignor, M., Allen, S. K., Boschung, J., Nauels, A., Xia, Y., Bex, V., and Midgley, P. M., Cambridge University Press, Cambridge, UK and New York, NY, USA, https://doi.org/10.1017/CBO9781107415324.028, 2013.
Climatology Group: WEMO, available at: http://www.ub.edu/gc/en/wemo/, last access: 15 September 2020.
Coll, M., Carreras, M., Ciércoles, C., Cornax, M. J., Gorelli, G., Morote, E., and Sáez, R.: Assessing fishing and marine biodiversity changes using fishers' perceptions: the Spanish Mediterranean and Gulf of Cadiz case study, PLoS ONE, 9, e85670, https://doi.org/10.1371/journal.pone.0085670, 2014.
Cornes, R., van der Schrier, G., van den Besselaar, E. J. M., and Jones, P. D.: An Ensemble Version of the E-OBS Temperature and Precipitation Datasets, J. Geophys. Res.-Atmos., 123, 9391–9409, https://doi.org/10.1029/2017JD028200, 2018.
Cortesi, N., Gonzalez-Hidalgo, J. C., Brunetti, M., and Martin-Vide, J.: Daily precipitation concentration across Europe 1971–2010, Nat. Hazards Earth Syst. Sci., 12, 2799–2810, https://doi.org/10.5194/nhess-12-2799-2012, 2012.
Cramer, W., Guiot, J., Fader, M., Garrabou, J., Gattuso, J. P., Iglesias, A., Lange, M. A., Lionello, P., Llasat, M. C., Paz, S., Peñuelas, J., Snoussi, M., Toreti, A., Tsimplis, M. N., and Xoplaki, E.: Climate change and interconnected risks to sustainable development in the Mediterranean, Nat. Clim. Change, 8, 972–980, https://doi.org/10.1038/s41558-018-0299-2, 2018.
De Luis, M., Brunetti, M., Gonzalez-Hidalgo, J. C., Longares, L. A., and Martin-Vide, J.: Changes in seasonal precipitation in the Iberian Peninsula during 1946–2005, Global Planet. Change, 74, 27–33, https://doi.org/10.1038/s41558-018-0299-2, 2010.
El Kenawy, A., López-Moreno, J. I., and Vicente-Serrano, S. M.: Trend and variability of surface air temperature in northeastern Spain (1920–2006): Linkage to atmospheric circulation, Atmos. Res., 106, 159–180, https://doi.org/10.1016/j.atmosres.2011.12.006, 2012.
Estrela, M. J., Pastor, F., Miró, J., and Valiente, J. A.: Precipitaciones torrenciales en la Comunidad Valenciana: La temperatura superficial del agua del mar y áreas de recarga, Primeros resultados, in: Riesgos climáticos y cambio global en el mediterráneo español? hacia un clima de extremos?, edited by: Estrela Navarro, M. J., Colección Interciencias, Valencia, Spain, 121–140, 2008.
Gil-Guirado, S., Pérez-Morales, A., and Lopez-Martinez, F.: SMC-Flood database: a high-resolution press database on flood cases for the Spanish Mediterranean coast (1960–2015), Nat. Hazards Earth Syst. Sci. 19, 1955–1971, https://doi.org/10.5194/nhess-19-1955-2019, 2019.
Gilabert, J. and Llasat, M. C.: Circulation weather types associated with extreme flood events in Northwestern Mediterranean, Int. J. Climatol., 38, 1864–1876, https://doi.org/10.1002/joc.5301, 2018.
González-Hidalgo, J. C., Lopez-Bustins, J. A., Stepanek, P. Martin-Vide, J., and De Luis, M.: Monthly precipitation trends on the Mediterranean fringe of the Iberian Peninsula during the second-half of the twentieth century (1951–2000), Int. J. Climatol., 29, 1415–1429, https://doi.org/10.1002/joc.1780, 2009.
González-Hidalgo, J. C., Brunetti, M., and de Luis, M.: A new tool for monthly precipitation analysis in Spain: MOPREDAS database (monthly precipitation trends December 1945–November 2005), Int. J. Climatol., 31, 715–731, https://doi.org/10.1002/joc.2115, 2011.
Greve, P., Gudmundsson, L., and Seneviratne, S. I.: Regional scaling of annual mean precipitation and water availability with global temperature change, Earth Syst. Dynam., 9, 227–240, https://doi.org/10.5194/esd-9-227-2018, 2018.
Hartmann, D. L., Klein Tank, A. M. G., Rusticucci, M., Alexander, L. V., Brönnimann, S., Charabi, Y., Dentener, F. J., Dlugokencky, E. J., Easterling, D. R., Kaplan, A., Soden, B. J., Thorne, P. W., Wild, M., and Zhai, P. M.: Observations: Atmosphere and Surface, in: Climate Change 2013: The Physical Science Basis, Contribution of Working Group I to the Fifth Assessment Report of the Intergovernmental Panel on Climate Change, edited by: Stocker, T. F., Qin, D., Plattner, G.-K., Tignor, M., Allen, S. K., Boschung, J., Nauels, A., Xia, Y., Bex, V., and Midgley, P. M., Cambridge University Press, Cambridge, UK and New York, NY, USA, https://doi.org/10.1017/CBO9781107415324.008, 2013.
Holton, J. R.: An Introduction to Dynamic Meteorology, in: International Geophysics Series, vol. 88, 4th Edn., Elsevier Academic Press, Oxford, UK, 535 pp., 2004.
Iizuka, S. and Nakamura, H.: Sensitivity of midlatitude heavy precipitation to SST: A case study in the Sea of Japan area on 9 August 2013, J. Geophys. Res.-Atmos., 124, 4365–4381, https://doi.org/10.1029/2018JD029503, 2019.
Jang, J. H.: An advanced method to apply multiple rainfall thresholds for urban flood warnings, Water, 7, 6056–6078, https://doi.org/10.3390/w7116056, 2015.
Jansà, A. and Genovés, A.: Western Mediterranean cyclones and heavy rain. Part 1: Numerical experiment concerning the Piedmont flood case, Meteorol. Appl., 7, 323–333, https://doi.org/10.1017/S1350482700001663, 2000.
Jansà, A., Genovés, A., Riosalido, R., and Carretero, O.: Mesoscale cyclones vs heavy rain and MCS in the Western Mediterranean, MAP Newslett., 5, 24–25, 1996.
Jansà, A., Genovés, A., Picornell, M., Campins, J., Riosalido, R., Carretero, O.: Western Mediterranean cyclones and heavy rain. Part 2: Statistical approach, Meteorol. Appl., 8, 43–56, https://doi.org/10.1017/S1350482701001049, 2000.
Jghab, A., Vargas-Yañez, M., Reul, A., Garcia-Martìnez, M. C., Hidalgo, M., Moya, F., Bernal, M., Ben Omar, M., Benchoucha, S., and Lamtai, A.: The influence of environmental factors and hydrodynamics on sardine (Sardina pilchardus, Walbaum 1792) abundance in the southern Alboran Sea, J. Mar. Syst., 191, 51–63, https://doi.org/10.1016/j.jmarsys.2018.12.002, 2019.
Klein Tank, A. M. G., Wijngaard, J. B., Können, G. P., Böhm, R., Demarée, G., Gocheva, A., Mileta, M., Pashiardis, S., Hejkrlik, L., Kern-Hansen, C., Heino, R., Bessemoulin, P., Müller-Westermeier, G., Tzanakou, M., Szalai, S., Paálsdóttir, T., Fitzgerald, D., Rubin, S., Capaldo, M., Maugeri, M., Leitass, A., Bukatis, A., Aberfeld, R., van Engelen, A. F. V., Forland, E., Mietus, M., Coelho, F., Mares, C., Razuvaev, V., Nieplova, E., Cegnar, T., López, J. A., Dahlström, B., Moberg, A., Kirchhofer, W., Ceylan, A., Pachaliuk, O., Alexander, L. V., and Petrovic, P.: Daily dataset of 20th-century surface air temperature and precipitation series for the European climate assessment, Int. J. Climatol., 22, 1441–1453, https://doi.org/10.1002/joc.773, 2002.
Knoben, W. J. M., Woods, R. A., and Freer, J. E.: Global bimodal precipitation seasonality: A systematic overview, Int. J. Climatol., 39, 558–567, https://doi.org/10.1002/joc.5786, 2019.
Kottek, M., Grieser, J., Beck, C., Rudolf, B., and Rubel, F.: World Map of the Köppen–Geiger climate classification updated, Meteorol. Z., 15, 259–263, https://doi.org/10.1127/0941-2948/2006/0130, 2006.
Kreibich, H., Di Baldassarre, G., Vorogushyn, S., Aerts, J. C. J. H., Apel, H., Aronica, G. T., Arnbjerg-Nielsen, K., Bouwer, L. M., Bubeck, P., Caloiero, T., Chinh, D. T., Cortés, M., Gain, A. K., Giampá, V., Kuhlicke, C., Kundzewicz, Z.W., Llasat, M.C., Mård, J., Matczak, P., Mazzoleni, M., Molinari, D., Dung, N.V., Petrucci, O., Schröter, K., Slager, K., Thieken, A. H., Ward, P. J., and Merz, B.: Adaptation to flood risk: Results of international paired flood event studies, Earth's Future, 5, 953–965, https://doi.org/10.1002/2017EF000606, 2017.
Lana, X., Burgueño, A., Martínez, M. D., and Serra, C.: Complexity and predictability of the monthly Western Mediterranean Oscillation index, Int. J. Climatol., 36, 2435–2450, https://doi.org/10.1002/joc.4503, 2016.
Lana, X., Burgueño, A., Martínez, M. D., and Serra, C.: Monthly rain amounts at Fabra Observatory (Barcelona, NE Spain): fractal structure, autoregressive processes and correlation with monthly Western Mediterranean Oscillation index, Int. J. Climatol., 37, 1557–1577, https://doi.org/10.1002/joc.4797, 2017.
Lebeaupin, C., Ducrocq, V., and Giordani, H.: Sensitivity of Mediterranean torrential rain events to the sea surface temperature based on high-resolution numerical forecasts, J. Geophys. Res., 111, D12110, https://doi.org/10.1029/2005JD006541, 2006.
Liu, Y., Li, Z., and Yin, H.: A timely El Niño-Southern Oscillation forecast method based on daily Niño index to ensure food security, in: 2018 7th International Conference on Agro-geoinformatics, 6–9 August 2018, Hangzhou, China, https://doi.org/10.1109/Agro-Geoinformatics.2018.8476070, 2018.
Llasat, M. C.: Influencia de la orografía y de la inestabilidad convectiva en la distribución espacial de lluvias extremas en Cataluña, Acta Geolog. Hispan., 25, 197–208, 1990.
Llasat, M. C.: High magnitude storms and floods, in: The Physical Geography of the Mediterranean, edited by: Woodwar, J. C., Oxford University Press, Oxford, UK, 513–540, 2009.
Llasat, M. C., Martín, F., and Barrera, A.: From the concept of `kaltluftropfen' (cold air pool) to the cut-off low. The case of September 1971 in Spain as an example of their role in heavy rainfalls, Meteorol. Atmos. Phys., 96, 43–60, https://doi.org/10.1007/s00703-006-0220-9, 2007.
Llasat, M. C., Marcos, R., Turco, M., Gilabert, J., and Llasat-Botija, M.: Trends in flash flood events versus convective precipitation in the Mediterranean region: The case of Catalonia, J. Hydrol., 541, 24–37, https://doi.org/10.1016/j.jhydrol.2016.05.040, 2016.
Lolis, C. J. and Türkeş, M.: Atmospheric circulation characteristics favouring extreme precipitation in Turkey, Clim. Res., 71, 139–153, https://doi.org/10.3354/cr01433, 2016.
Lopez-Bustins, J. A.: The Western Mediterranean Oscillation and Rainfall in the Catalan Countries, PhD Thesis, Department of Physical Geography and Regional Geographical Analysis, University of Barcelona, Barcelona, 184 pp., 2007.
Lopez-Bustins, J. A.: Lluvias fuertes, pero mal repartidas. El caso del clima mediterráneo, Biblio3W Revista Bibliográfica de Geografía y Ciencias Sociales, 23, 1243, https://doi.org/10.1344/b3w.0.2018.26493, 2018.
Lopez-Bustins, J. A. and Lemus-Canovas, M.: The influence of the Western Mediterranean Oscillation upon the spatiotemporal variability of precipitation over Catalonia (northeastern of the Iberian Peninsula, Atmos. Res., 236, 104819, https://doi.org/10.1016/j.atmosres.2019.104819, 2020.
Lopez-Bustins, J. A., Martin-Vide, J., and Sanchez-Lorenzo, A.: Iberia winter rainfall trends based upon changes in teleconnection and circulation patterns, Global Planet. Change, 63, 171–176, https://doi.org/10.1016/j.gloplacha.2007.09.002, 2008.
Lopez-Bustins, J. A., Martin-Vide, J., Prohom, M., and Cordobilla, M. J.: Variabilidad intraanual de la Oscilación del Mediterráneo Occidental (WeMO) y ocurrencia de episodios torrenciales en Cataluña, in: Clima, sociedad, riesgos y ordenación del territorio, edited by: Olcina, J., Rico, A. M., and Moltó, E., Asociación Española de Climatología (AEC), Alicante, Spain, 171–182, 2016.
Martin-Vide, J.: Aplicación de la clasificación sinóptica automática de Jenkinson y Collison a días de precipitación torrencial en el este de España, in: La información climática como herramienta de gestión ambiental, edited by: Cuadrat, J. M., Vicente-Serrano, S., and Saz, M. A., University of Zaragoza, Zaragoza, Spain, 123–127, 2002.
Martin-Vide, J. and Llasat, M. C.: Las precipitaciones torrenciales en Cataluña, Serie Geográfica, 9, 17–26, 2000.
Martin-Vide, J. and Lopez-Bustins, J. A.: The Western Mediterranean Oscillation and rainfall in the Iberian Peninsula, Int. J. Climatol., 26, 1455–1475, https://doi.org/10.1002/joc.1388, 2006.
Martin-Vide, J. and Raso-Nadal, J. M.: Atles Climàtic de Catalunya, 1961–1990, Servei Meteorológic de Catalunya, Departament de Medi Ambient i Habitatge, Generalitat de Catalunya, Barcelona, Spain, 32 pp., 2008.
Martin-Vide, J., Sanchez-Lorenzo, A., Lopez-Bustins, J. A., Cordobilla, M. J., Garcia-Manuel, A., and Raso, J. M.: Torrential rainfall in northeast of the Iberian Peninsula: synoptic patterns and WeMO influence, Adv. Sci. Res., 2, 99–105, https://doi.org/10.5194/asr-2-99-2008, 2008.
Martin-Vide, J. P. and Llasat, M. C.: The 1962 flash flood in the Rubí stream (Barcelona, Spain), J. Hydrol., 566, 441–454, https://doi.org/10.1016/j.jhydrol.2018.09.028, 2018.
Martina, M. L. V., Todini, E., and Libralon, A.: Rainfall thresholds for flood warning systems: a Bayesian decision approach, in: Hydrological Modelling and the Water Cycle. Water Science and Technology Library, vol. 63, edited by: Sorooshian, S., Hsu, K. L., Coppola, E., Tomassetti, B., Verdecchia, M., and Visconti, G., Springer, Berlin, Heidelberg, Germany, 203–227, https://doi.org/10.1007/978-3-540-77843-1_9, 2009.
Mathbout, S., Lopez-Bustins, J. A., Royé, D., Martin-Vide, J., and Benhamrouche, A.: Spatiotemporal variability of daily precipitation concentration and its relationship to teleconnection patterns over the Mediterranean during 1975–2015, Int. J. Climatol., 40, 1435–1455, https://doi.org/10.1002/joc.6278, 2020.
Merino, M., Fernández-Vaquero, M., López, L., Fernández-González, S., Hermida, L., Sánchez, J. L., García-Ortega, E., Gascón, E.: Large-scale patterns of daily precipitation extremes on the Iberian Peninsula, Int. J. Climatol., 36, 3873–3891, https://doi.org/10.1002/joc.4601, 2016.
Meseguer-Ruiz, O., Lopez-Bustins, J. A., Arbiol-Roca, L., Martin-Vide, J., Miró J., and Estrela, M. J.: Episodios de precipitación torrencial en el este y sureste ibéricos y su relación con la variabilidad intraanual de la Oscilación del Mediterráneo Occidental (WeMO) entre 1950 y 2016, in: El Clima: Aire, Agua, Tierra y Fuego, edited by: Montávez-Gómez, J. P., Gómez-Navarro, J. J., López-Romero, J. M., Palacios-Peña, L., Turco, M., Jerez-Rodríguez, S., Lorente, R., and Jiménez-Guerrero, P., Asociación Española de Climatología (AEC), Cartagena, Spain, 53–63, 2018.
Milosevic, D. D., Savic, S. M., Pantelic, M., Stankov, U., Ziberna, I., Dolinaj, D., and Lescesen, I.: Variability of seasonal and annual precipitation in Slovenia and its correlation with large-scale atmospheric circulation, Open Geosci., 8, 593–605, https://doi.org/10.1515/geo-2016-0041, 2016.
Miró, J., Estrela, M. J., Pastor, F., and Millán, M.: Análisis comparativo de tendencias en la precipitación, por distintos inputs, entre los dominios hidrológicos del Segura y del Júcar (1958–2008), Investigaciones Geográficas, 49, 129–157, 2009.
Miró, J. J., Caselles, V., and Estrela, M. J.: Multiple imputation of rainfall missing data in the Iberian Mediterranean context, Atmos. Res., 197, 313–330, https://doi.org/10.1016/j.atmosres.2017.07.016, 2017.
Nakamura, I. and Llasat, M. C.: Policy and systems of flood risk management: a comparative study between Japan and Spain, Nat. Hazards, 87, 919–943, https://doi.org/10.1007/s11069-017-2802-x, 2017.
Naranjo-Fernández, N., Guardiola-Albert, C., Aguilera, H., Serrano-Hidalgo, C., Rodríguez-Rodríguez, M., Fernández-Ayuso, A., Ruiz-Bermudo, F., and Montero-González, E.: Relevance of spatio-temporal rainfall variability regarding groundwater management challenges under global change: case study in Doñana (SW Spain), Stoch. Environ. Res. Risk A., 34, 1289–1311, https://doi.org/10.1007/s00477-020-01771-7, 2020.
Norbiato, D., Borga, M., Esposti, S. D., Gaume, E., and Anquetin, S.: Flash flood warning based on rainfall thresholds and soil moisture conditions: An assessment for gauged and ungauged basins, J. Hydrol., 362, 274–290, https://doi.org/10.1016/j.jhydrol.2008.08.023, 2008.
Olcina, J., Sauri, D., Hernández, M., and Ribas, A.: Flood policy in Spain: a review for the period 1983–2013, Disast. Prevent. Manage., 25, 41–58, https://doi.org/10.1108/DPM-05-2015-0108, 2016.
Papalexiou, S. M. and Montanari, A.: Global and regional increase of precipitation extremes under global warming, Water Resour. Res., 55, 4901–4914, https://doi.org/10.1029/2018WR024067, 2019.
Pastor, F., Valiente, J. A., and Estrela, M. J.: Sea surface temperature and torrential rains in the Valencia region: modelling the role of recharge areas, Nat. Hazards Earth Syst. Sci., 15, 1677–1693, https://doi.org/10.5194/nhess-15-1677-2015, 2015.
Pastor, F., Valiente, J. A., and Palau, J. L.: Sea Surface Temperature in the Mediterranean: Trends and Spatial Patterns (1982–2016), Pure Appl. Geophys., 175, 4017–4029, https://doi.org/10.1007/s00024-017-1739-z, 2018.
Peña, J. C., Aran, M., Pérez-Zanón, N., Casas-Castillo, M. C., Rodríguez-Solá, R., and Redaño, A.: Análisis de las situaciones sinópticas correspondientes a episodios de lluvia severa en Barcelona, in: Libro de Resuìmenes de la XXXV Reunión Bienal de la Real Sociedad Española de Física, Real Sociedad Española de Física (RSEF), Gijón, Spain, 450–451, 2015.
Peñarrocha, D., Estrela, M. J., and Millán, M.: Classification of daily rainfall patterns in a Mediterranean area with extreme intensity levels: the Valencia region, Int. J. Climatol., 22, 677–695, https://doi.org/10.1002/joc.747, 2002.
Pérez-Cueva, A. J.: Atlas Climátic de la Comunitat Valenciana (1961–1990), Generalitat Valenciana, Valencia, Spain, 205 pp., 1994.
Pérez-Zanón, N., Casas-Castillo, M. C., Peña, J. C., Aran, M., Rodríguez-Solá, R., Redaño, A., and Solé, G.: Analysis of synoptic patterns in relationship with severe rainfall events in the Ebre Observatory (Catalonia), Acta Geophys., 66, 405–414, https://doi.org/10.1007/s11600-018-0126-1, 2018.
Raicich, F. and Colucci, R. R.: A near-surface sea temperature time series from Trieste, northern Adriatic Sea (1899–2015), Earth Syst. Sci. Data, 11, 761–768, https://doi.org/10.5194/essd-11-761-2019, 2019.
Riesco, J. and Alcover, V.: Predicción de precipitaciones intensas de origen marítimo mediterráneo en la Comunidad Valenciana y la Región de Murcia, Centro de Publicaciones, Secretaría General Técnica, Ministerio de Medio Ambiente, Madrid, Spain, 124 pp., 2003.
Rigo, T. and Llasat, M. C.: Features of convective systems in the NW of the Mediterranean Sea, in: Proceedings of the 5th EGU Plinius Conference on Mediterranean Storms, European Geosciences Union, 1–2 October 2003, Ajaccio, France, 73–79, 2003.
Ríos-Cornejo, D., Penas, A., Álvarez-Esteban, R., and del Riío, S.: Links between teleconnection patterns and precipitation in Spain, Atmos. Res., 156, 14–28, https://doi.org/10.1016/j.atmosres.2014.12.012, 2015a.
Ríos-Cornejo, D., Penas, A., Álvarez-Esteban, R., and del Río, S.: Links between teleconnection patterns and mean temperature in Spain, Theor. Appl. Climatol., 122, 1–18, https://doi.org/10.1007/s00704-014-1256-2, 2015b.
Rodó, X., Baert, E., and Comin, F. A.: Variations in seasonal rainfall in Southern Europe during the present century: relationships with the North Atlantic Oscillation and the El Niño-Southern Oscillation, Clim. Dynam., 13, 275–284, 1997.
Rodríguez-Puebla, C., Encinas, A. H., and Sáenz, J.: Winter precipitation over the Iberian peninsula and its relationship to circulation indices, Hydrol. Earth Syst. Sci., 5, 233–244, https://doi.org/10.5194/hess-5-233-2001, 2001.
Romero, R., Sumner, G., Ramis, C., and Genovés, A.: A classification of the atmospheric circulation patterns producing significant daily rainfall in the Spanish Mediterranean area, Int. J. Climatol., 19, 765–789, 1999.
Salat, J., Pascual, J., Flexas., M., Chin, T. M., and Vazquez-Cuervo, J.: Forty-five years of oceanographic and meteorological observations at a coastal station in the NW Mediterranean: a ground truth for satellite observations, Ocean Dynam., 69, 1067–1084, 2019.
Sánchez-García, C., Schulte, L., Carvalho, F., and Peña, J. C.: A 500-year flood history of the arid environments of southeastern Spain. The case of the Almanzora River, Global Planet. Change, 181, 102987, https://doi.org/10.1016/j.gloplacha.2019.102987, 2019.
SMC – Servei Meteorológic de Catalunya: Yearly Bulletin of Climate Indicators, 2016, Technical report, Meteorological Service of Catalonia, Department of Territory and Sustainability, Government of Catalonia, Barcelona, 88 pp., available at: https://static-m.meteo.cat/wordpressweb/wp-content/uploads/2017/05/29072030/00_BAIC-2016_TOT.pdf (last access: 15 September 2020), Climate monthly series available at: https://www.meteo.cat/wpweb/climatologia/serveis-i-dades-climatiques/series-climatiques-historiques/ (last access: 15 September 2020), 2017.
Sneyers, R.: On the use of statistical analysis for the objective determination of climate change, Meteorol. Z., 1, 247–256, 1992.
Soler, X. and Martin-Vide, J.: Los calendarios climáticos. Una propuesta metodológica, in: El Agua y el Clima, edited by: Guijarro, J. A., Grimalt, M., Laita, M., and Alonso, S., Asociación Española de Climatología, Mallorca, Spain, 577–586, 2002.
Sparnocchia, S., Schiano, M. E., Picco, P., Bozzano, R., and Cappelletti, A.: The anomalous warming of summer 2003 in the surface layer of the Central Ligurian Sea (Western Mediterranean), Ann. Geophys., 24, 443–452, https://doi.org/10.5194/angeo-24-443-2006, 2006.
Trigo, R. M., Pozo-Vázquez, D., Osborn, T. J., Castro-Díez, Y., Gámiz-Fortis, S., and Esteban-Parra, M. J.: North Atlantic Oscillation influence on precipitation, river flow and water resources in the Iberian Peninsula, Int. J. Climatol., 24, 925–944, https://doi.org/10.1002/joc.1048, 2004.
Vicente-Serrano, S. M., Beguería, S., López-Moreno, J. I., El Kenawy, A. M., and Angulo-Martínez, M.: Daily atmospheric circulation events and extreme precipitation risk in northeast Spain: Role of the North Atlantic Oscillation, the Western Mediterranean Oscillation, and the Mediterranean Oscillation, J. Geophys. Res., 114, D08106, https://doi.org/10.1029/2008JD011492, 2009.
Vigneau, J.-P.: 1986 dans les Pyrénées Orientales: deux perturbations méditerranéennes aux effets remarquables, Revue Géographique des Pyrénées et du Sud-Ouest, 58, 23–54, https://doi.org/10.3406/rgpso.1987.4969, 1987.
Wergen, D., Volovik, D., Redner, S., and Krug, J.: Rounding Effects in Record Statistics, Phys. Rev. Lett., 109, 164102, https://doi.org/10.1103/PhysRevLett.109.164102, 2012.