the Creative Commons Attribution 4.0 License.
the Creative Commons Attribution 4.0 License.
 | 03 Jan 2020
Evaluation of a combined drought indicator and its potential for agricultural drought prediction in southern Spain
María del Pilar Jiménez-Donaire
Ana Tarquis
Juan Vicente Giráldez
Drought prediction is crucial, especially where the rainfall regime is irregular, such as in Mediterranean countries. A new combined drought indicator (CDI) integrating rainfall, soil moisture and vegetation dynamics is proposed. Standardized precipitation index (SPI) is used for evaluating rainfall trends. A bucket-type soil moisture model is employed for keeping track of soil moisture and calculating anomalies, and, finally, satellite-based normalized difference vegetation index (NDVI) data are used for monitoring vegetation response. The proposed CDI has four levels, at increasing degrees of severity: watch, warning, alert type I and alert type II.
This CDI was thus applied over the period 2003–2013 to five study sites, representative of the main grain-growing areas of SW Spain. The performance of the CDI levels was assessed by comparison with observed crop damage data.
Observations show a good match between crop damage and the CDI. Important crop drought events in 2004–2005 and 2011–2012, distinguished by crop damage in between 70 % and 95 % of the total insured area, were correctly predicted by the proposed CDI in all five areas.
- Article
(5757 KB) - Full-text XML
- BibTeX
- EndNote


Drought is a recurrent phenomenon on the Earth's surface. It is triggered by lack of water, or “an extended imbalance between supply and demand” in the precise expression of Hobbins et al. (2016), and may have economic, social and environmental impacts (Wilhite, 2000). Drought is one of the most important natural disasters threatening our society. In spite of its relevance, there is no proper definition of drought. Tannehill (1947) called drought “the creeping phenomenon”, given the complexity of accurately delimiting its start time and end time and of adequately demarcating the spatial extent of its effects.
Wilhite and Glantz (1985) distinguished four main types of droughts according to how the effects were noticed: (i) meteorological, due to the scarcity of rainfall; (ii) hydrological, detected by low streamflow; (iii) agricultural, when soil water is not sufficient to maintain a crop; and (iv) socioeconomic, when it affects the normal functioning of society.
Drought occurs worldwide but it is especially frequent in the Mediterranean region. In a recent analysis of a tree-ring-based reconstruction of the summer season, the Palmer drought severity index (PDSI) (Keyantash and Dracup, 2002) for the period from 1100 to 2012, Cook et al. (2015, 2016) detected the gravity of recent events in the area, which were apparently induced by anthropogenic activity. Combining two drought indices, one meteorological, the Standardized Precipitation Index (SPI), for water supply, and the other hydrological, the standardized precipitation–evapotranspiration index (SPEI), for water loss tendency, Stagge et al. (2017) observed, for the European continent in the period 1958–2014, that droughts were mainly driven by a temperature rise with the inherent increase in the evapotranspiration rate, whereas rainfall did not change appreciably. In the southwestern United States, Ting et al. (2018) found that, under a CO2 warming scenario, earlier spring drying was mainly due to a decreased mean moisture convergence. A “flash” drought occurring suddenly is frequently triggered by high temperatures or by severe water deficits (Wang and Yuan, 2018). Under the influence of global warming, a hypothesis has been formulated in which dry regions will tend to become drier while wet regions will tend to become wetter, the DDWW paradigm. Nevertheless, Yang et al. (2019) have observed that, on the global scale, this paradigm is mainly confirmed in precipitation-driven drought, when the plant and soil conditions are not considered.
One additional problem of drought is that it can spread towards other regions, as Herrera-Estrada et al. (2017) discovered in their Lagrangian analysis in several Earth regions. Andreadis et al. (2005) have elaborated on severity-area-duration maps, modifying an earlier proposal of Dalezios et al. (2000) for severity-duration-frequency maps. Therefore, drought is a present-day risk at least for a part of our society.
Drought characterization depends on the perspective of the user. The meteorological drought is possibly the simplest type to evaluate since it is reduced to a mere consideration of the rainfall. The two main meteorological drought indices are those mentioned above, the PDSI and SPI. Hydrological drought requires the conversion of rainfall into runoff, which can be done with the help of a hydrological model; the SPEI, for instance, is a widely used hydrological drought index. Nevertheless, Van Loon and Van Lanen (2012) have explored in depth the definition of hydrological drought, starting from the time perspective of the phenomenon, and distinguishing several types in terms of the sequences rain to snow, wet to dry, cold snow and warm snow seasons and what they denominated as classical rain deficit. The use of a simple hydrological model and the establishment of some threshold values allow Van Loon and Van Lanen (2012) to determine the drought occurrence in several regions with distinct climate types. Drought severity is a function of the available water storage units, as Van Loon and Laaha (2015) explained in the review of an Australian dataset. Hobbins et al. (2016) have modified the SPEI index by representing the potential evapotranspiration and the atmospheric evaporative demand on a proper physical basis, rather than on the air temperature as a proxy of it. Their evaporative demand drought index (EDDI) is a useful indicator of drought extent, as was shown by McEvoy et al. (2016) in the conterminous US. The estimation of the agricultural drought index is somewhat similar to that of the hydrological drought one, with the additional complexity of crop behavior. Several models have been proposed for the agricultural drought index estimation. As Perrin et al. (2001) warned, and Orth et al. (2015) later confirmed, the models set up to describe soil water evolution for this purpose must be very simple and limited to soil water balance. Hunt et al. (2009), Khare et al. (2013) and Sohrabi et al. (2015) proposed reasonable soil water balance models, differing only in their characterizations of rainfall infiltration, in order to prevent the generation of excess rain, deep percolation and actual evapotranspiration rate.
The different drought indices represent distinct aspects of drought. Therefore, to gain a wider perspective, Kao and Govindaraju (2010) introduced the use of copulas in a new drought indicator denominated the joint deficit index (JDI), based on the SPI for both precipitation and streamflow. Hao and AghaKouchak (2013) formulated another copula, the multivariate standardized drought index (MSDI), consisting of the SPI and a standardized soil moisture index (SSI). This index was very useful for detecting the drought onset and duration. Alternatively, Zarch et al. (2015) used two separate indices to assess droughts, the SPI and the reconnaissance drought index (RDI). A different approach was suggested by Hao et al. (2017) with a categorical drought prediction model, the U.S. Drought Monitor (USDM), which proved to be highly adequate for early warning. Azmi et al. (2016) developed a data fusion-based drought index, grouping different indices with a clustering method.
The impact of drought on vegetation can be by means of several indices. Kogan (1995) proposed a vegetation condition index (VCI) based on the normalized difference vegetation index (NDVI), which is a good indicator of vegetation status, by combining the radiance of the visible and infrared wavelengths to assess the drought effects. Some other indices have been suggested, since NDVI is sometimes influenced by other environmental factors (Quiring and Ganesh, 2010). The normalized difference water index (NDWI) was introduced by Gao (1996), and, using radiances in a higher wavelength range than that of NDVI, it is less affected than the latter by atmospheric conditions; it is also more sensitive to drought than other indices (Gulágsi and Kovács, 2015). The Joint Research Centre of the European Comission uses the fraction of absorbed photosynthetically active radiation (fAPAR) generated from the signals acquired by the Project for On-Board Autonomy - Vegetation (PROBA-V) sensor.
The abovementioned methods can be used to evaluate the impact of drought on agricultural productivity in regions worldwide, as Sepulcre-Cantó et al. (2012) have shown for Europe. These authors proposed a combined drought indicator using SPI, fAPAR and soil moisture calculated from a regional hydrological model. For the management of local policy and mitigation actions, such as farm-scale insurance schemes, smaller spatial scales than those used by Sepulcre-Cantó et al. (2012) are required.
The main objective of this work is to assess agricultural drought by means of a combined drought indicator (CDI), based on SPI and anomalies in soil moisture and NDVI. This new CDI is thus related to crop damage data in rainfed wheat-producing regions in southern Spain at the agricultural province level, which corresponds to the most important item of available yield data. It is expected that this new CDI will be useful at the local policy level and for planning farm-scale insurance schemes.
2.1 Study area
This study was made in Andalusia, southern Spain, during the 10-year period between 2003 and 2013.
Andalusia has a Mediterranean climate with dry, hot summers (Köppen-Geiger climate Csa, Peel et al., 2007). Since the main source of water is rain caused by the western and southwestern winds carrying moist air from the Atlantic Ocean, the distribution of precipitation is conditioned by the orography of the region, with a main decreasing gradient from west to east.
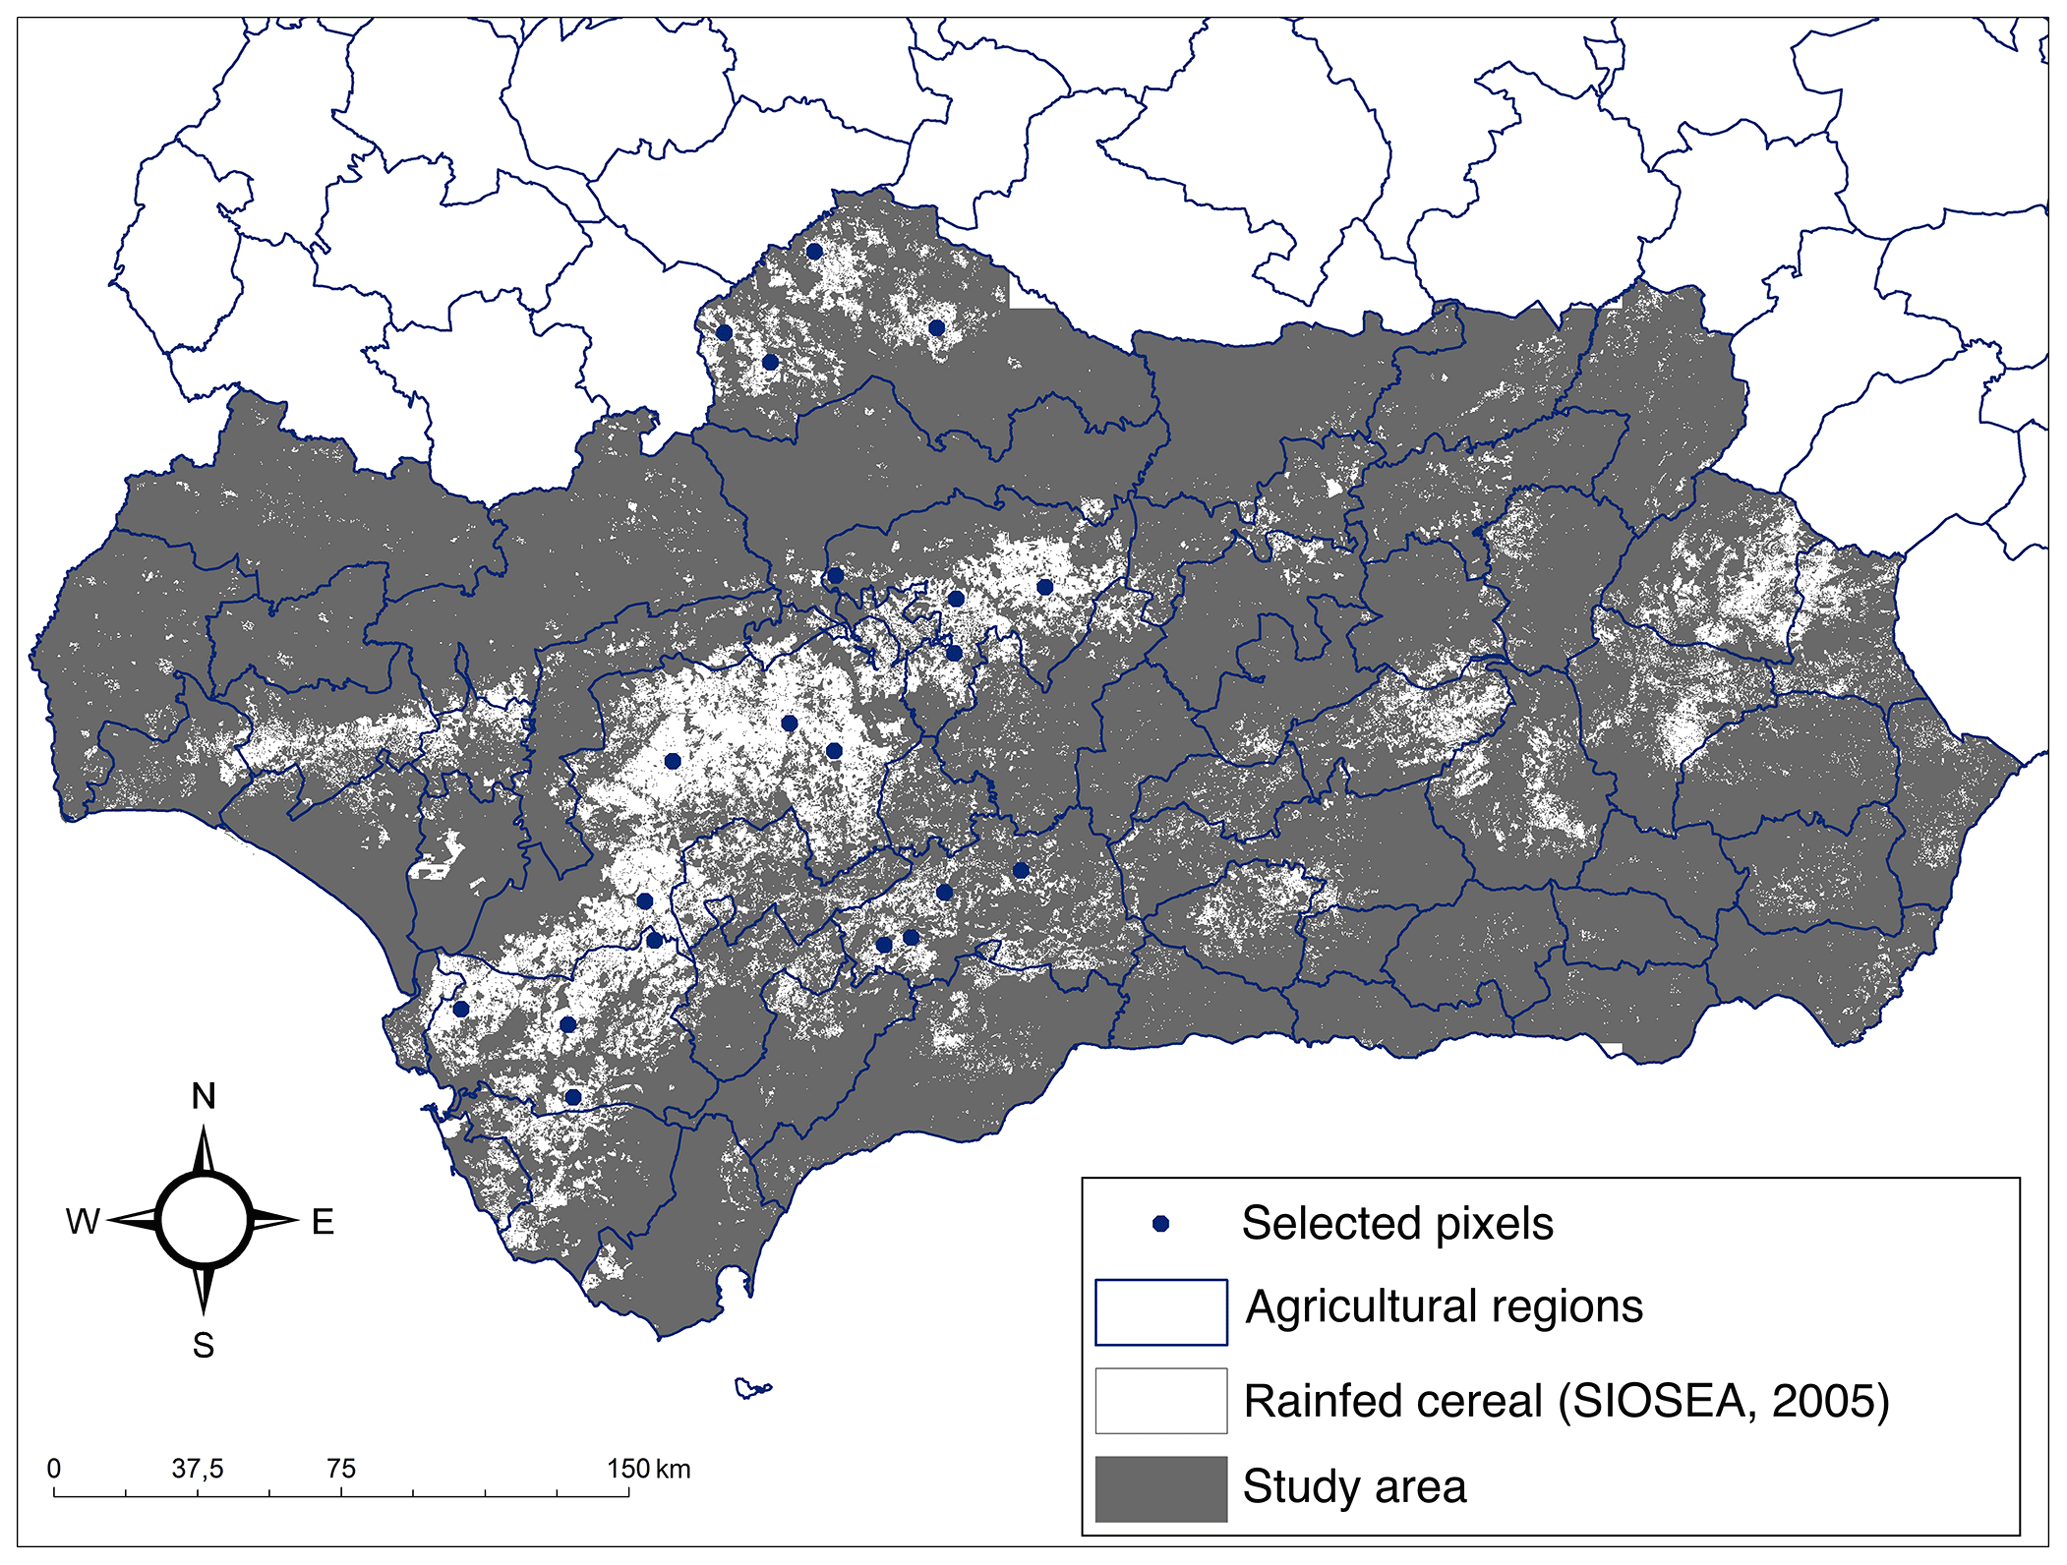
Figure 1Location of the study area (grey) and selected representative points (blue dots) within the areas cultivated with cereal (white).
The effect of drought on agricultural production was evaluated in five representative areas, in each of which, four representative locations were selected in a two-step procedure. First, the distribution of the land use class “non irrigated arable land” within the study area was analyzed, as shown in Fig. 1. This land use distribution is derived from the regional land use map (SIOSE: Soil Occupation Information System of Spain) applied to Andalusia, 2005, equivalent to the European CORINE database, on a scale of 1:10 000. This class occupies 20 %, 886 250 ha, of the total agricultural area occupied in Andalusia, 4 402 760 ha (Censo Agrario, 2009). Although the non-irrigated arable land class also includes other noncereal crops, in our study area wheat is by far the dominant crop. Five agricultural districts in Andalusia were selected where it is the leading crop: Campiña de Cádiz (Cádiz), Campiña Baja (Córdoba), Pedroches (Córdoba), Norte/Antequera (Málaga) and La Campiña (Sevilla). In each of these districts, four representative point locations were selected, yielding a total of 20 point locations. These point locations correspond to pixels that have a resolution of 250 m×250 m, equivalent to the resolution of the NDVI imagery (see Sect. 2.4). These pixels were carefully selected and subjected to a visual case-by-case analysis in order to exclude anomalies and ensure a homogeneous land use in the following remote sensing analysis. Each of the 20 point locations had to fulfill the following conditions that were checked manually using aerial orthophoto imagery from 2004 to 2013:
- i.
It contains homogeneous land use of rainfed wheat within each pixel (with no other land uses present in it);
- ii.
It lacks external landscape elements, such as ponds, roads, canals, houses or natural vegetation patches that could distort the NDVI signal;
- iii.
It has continuous wheat cultivation during the study period (no fallow period).
2.2 Standardized precipitation index (SPI)
The SPI expresses the deviation of rainfall from its long-term mean. SPI is calculated by fitting the precipitation data to a gamma distribution, after which it is transformed into a normal distribution. The SPI values can then be interpreted as representing the number of standard deviations by which the observed anomaly deviates from the long-term mean. SPI was calculated over 1-, 3- and 6-month periods, using precipitation series of between 42 and 69 years, namely SPI-1, SPI-3 and SPI-6.
SPI-1 is theoretically best related to meteorological drought, together with short-term soil moisture stress, especially in periods when crop growth is sensitive to them (Guttman, 1999). SPI-3 has been shown to reflect short to medium seasonal precipitation trends (Guttman, 1999). Bussay et al. (1999) and Szalai and Szinell (2000) evaluated the relationship between SPI and agricultural drought through soil moisture and found that SPI-2 and SPI-3 yielded the best results. Other authors (Ji and Peters, 2003; Rossi and Niemeyer, 2012) have reported a high correlation between SPI-3 and vegetation response and, therefore, deemed this index to be the best suited for evaluating agricultural drought. They deemed SPI-6 to be the best one for identifying longer-term or seasonal drought trends.
The program “SPI_SL_6.EXE”, developed by the National Drought Mitigation Center, University of Nebraska-Lincoln, was used to calculate SPI. Details of this method can be found in McKee et al. (1993) and Lloyd-Hughes and Saunders (2002). The same classification used by McKee et al. (1993) was used (Table 1), and a threshold value for defining a drought of SPI > −1.00 was employed following Cancelliere (2004).
Table 1Classification of droughts according to SPI and their probability of occurrence following McKee et al. (1993)
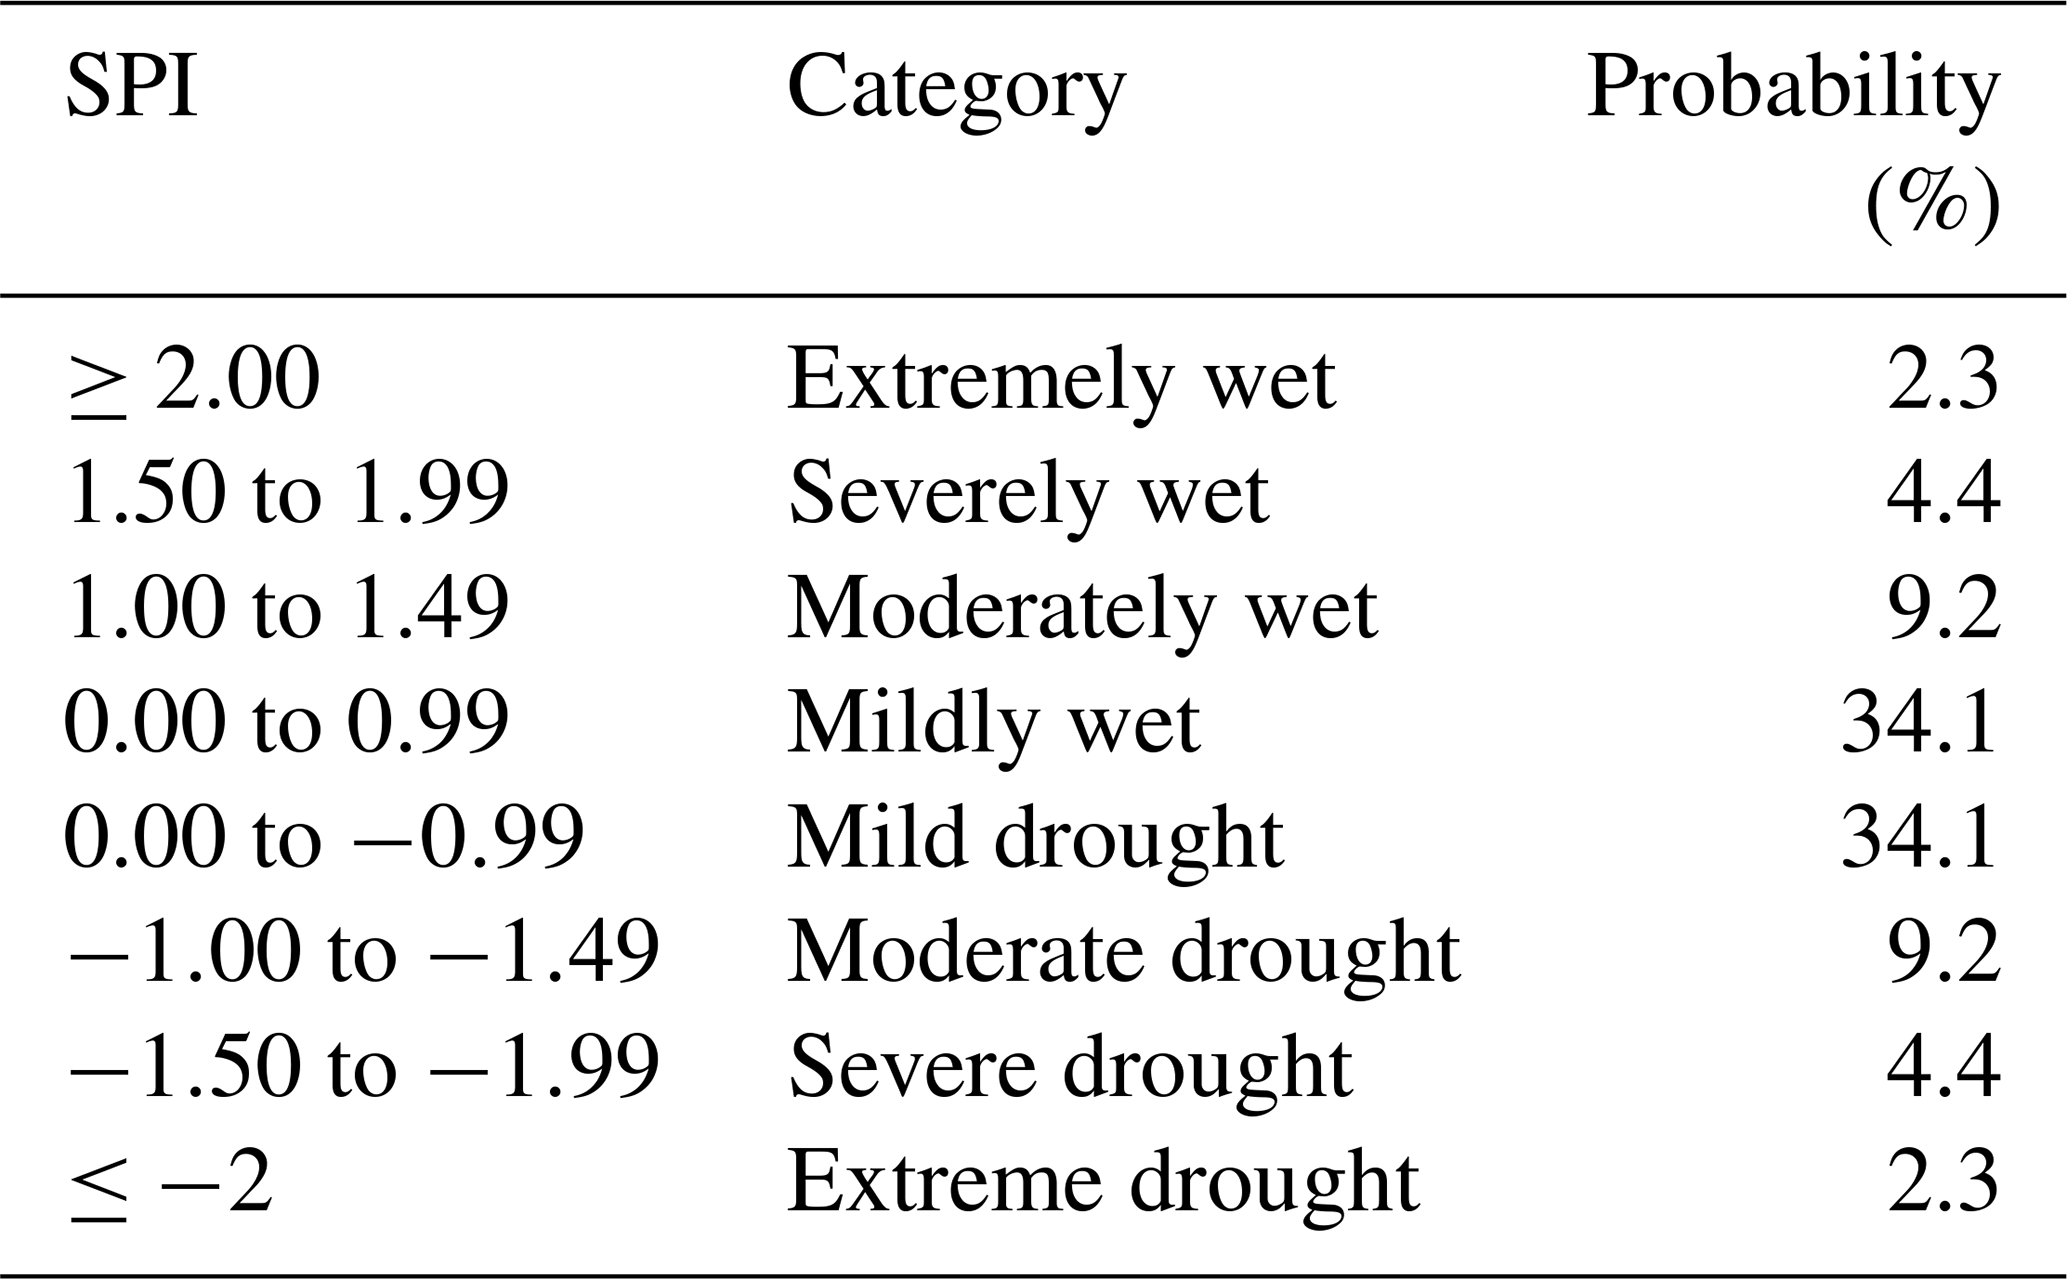
SPI values were calculated for each of the five agricultural regions selected: Campiña de Cádiz (Cádiz), Campiña Baja (Córdoba), Pedroches (Córdoba), Norte/Antequera (Málaga) and La Campiña (Sevilla). The climate series selected in each region was the one at their particular weather station that had the longest available series.
2.3 Soil moisture anomaly index (SMAI)
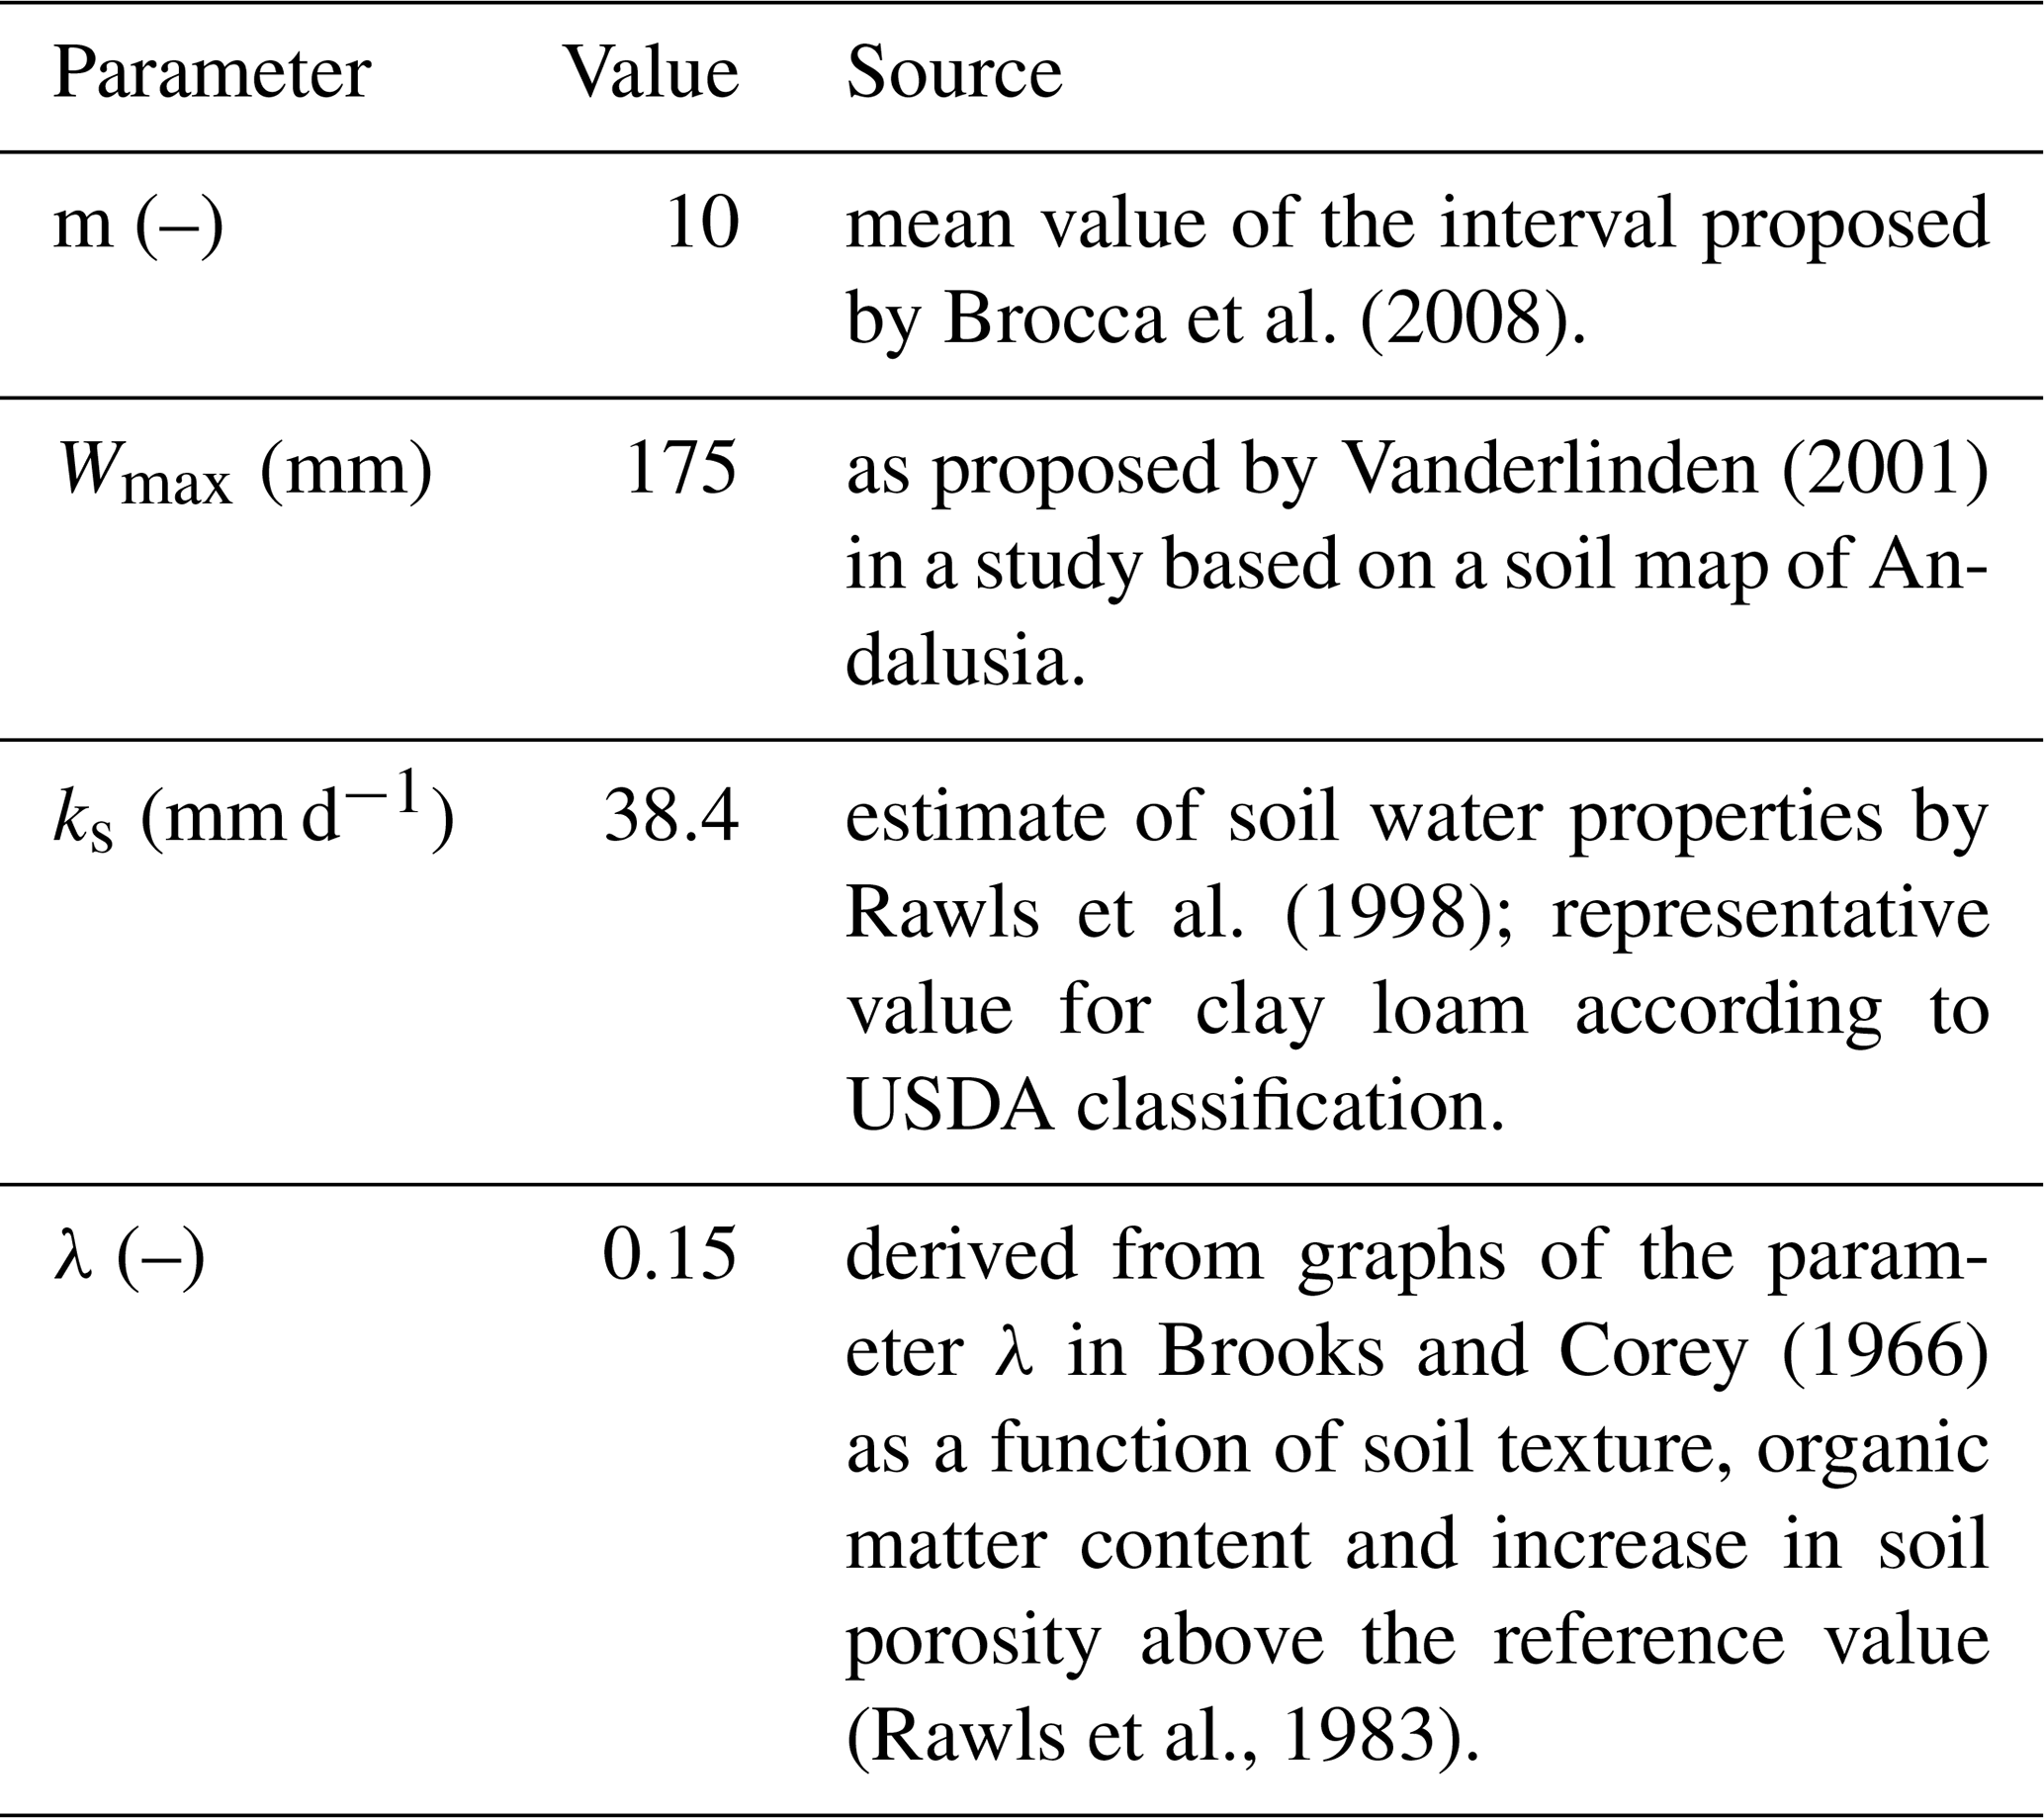
The deviation of the soil moisture from its long-term mean was expressed as a soil moisture anomaly index (SMAI). SMAI values were calculated for each of the five selected agricultural regions, similar to those of the SPI. To obtain this index, we first calculated soil moisture dynamics by means of the simple water balance model of Brocca et al. (2008). The long-term mean soil moisture was taken as the 10-year mean in the study period (2003–2013). In this water balance model, the water depth in the soil profile, W, evolves with time, t, following the contribution of the infiltration of the rain, f, and the extraction of the evapotranspiration, e, and of the deep percolation or of the surface and subsurface runoff, g. The balance was computed on the daily timescale following Eq. (1):
The infiltration depth is estimated from the rain depth, p, the wetness or relative soil water content, normalized by the maximum value, Wmax, and a parameter m, with the empirical approximation proposed by Georgakakos (1986), using Eq. (2):
The deep percolation or runoff loss is estimated by a simple potential function with the saturated hydraulic conductivity, ks, and λ, the pore size distribution index of Brooks and Corey (1966) using Eq. (3):
Finally, the daily evapotranspiration rate is estimated as the FAO Penman–Monteith (Allen et al., 1998) potential rate, e0, modified by the wetness, using Eq. (4):
The parameter values adopted here are shown in Table 2.
Table 2Parameters for the water balance model used in this study.
The soil moisture anomaly index (SMAI) is then given by Eq. (5):
where is the long-term average soil moisture and σW its standard deviation.
2.4 NDVI anomaly index (NDVIA)
Different agricultural drought studies have used satellite-based vegetation indices as their main advantage is their spatial and temporal resolution. NDVI values represent the plant chlorophyll content, which is why they are highly suitable for identification of agricultural drought. Limitations in its use are related to the fact that NDVI may reflect non-drought- related stress conditions, such as plant disease, and that soil properties can induce a bias in its response. Therefore, it is important to use NDVI-based drought evaluation in combination with other indices based on precipitation or soil water, as is the case here. NDVI anomalies express deviations in NDVI from its long-term mean, and these were evaluated on a monthly basis but only taken into account from November to April, which is the normal growing season for rainfed winter cereal in Andalusia. Only during this period can NDVI and its anomalies be expected to transmit information on rain-fed cereal growth. The long-term mean NDVI was taken as the 10-year mean in the study period (2003–2013).
Thanks to its spatial continuity, NDVI trends could be analyzed for 20 different points; i.e., four points or pixels were analyzed in each of the five agricultural regions selected. This analysis yielded a total of 20 spatially different NDVI anomaly indices. The NDVI anomaly index was calculated using Eq. (6):
where NDVIi, and σNDVI are, respectively, its value at a particular moment in time, its long-term mean value and its standard deviation. NDVI data were derived from Terra MODIS (moderate resolution imaging spectroradiometer) that collects imagery for each point on Earth every 1–2 d. Based on these data, a monthly average was calculated and used for NDVIi (Department of Agriculture, Fisheries and Environment, Government of Andalusia). For each of the five regions, the final NDVIA index was then calculated based on the average of the four points or pixels of that region.
2.5 Combined drought indicator (CDI)
The main idea behind the combined drought indicator (CDI) for identifying agricultural drought is an idealized cause–effect relation between water deficit and yield. There are different phases in this relationship: a precipitation deficit (phase 1) leads initially to soil water deficit (phase 2), which, if prolonged over time, will result in crop water stress and be reflected in the NDVI observed (phase 3), which finally generates a reduction in cereal yields (phase 4).
In its simplest form, this CDI would allow us to identify which cause–effect relationship phase the agricultural system has reached in the event of a drought. This indicator would then allow the establishment of a series of drought warnings, depending on that phase. The CDI should be seen as a first step towards designing that warning system.
This study proposes a CDI that combines three indices:
-
SPI-3 to identify the first level of precipitation deficit (phase 1)
-
SMAI to identify anomalies in the soil moisture (phase 2)
-
NDVI anomalies to characterize the subsequent effect of soil water stress on crops (phase 3).
The warning levels suggested for the CDI proposed are given in Table 3. They aim and are expected to help policy makers to prepare and take action in the case of droughts.
Table 3Classification of the combined drought indicator (CDI).
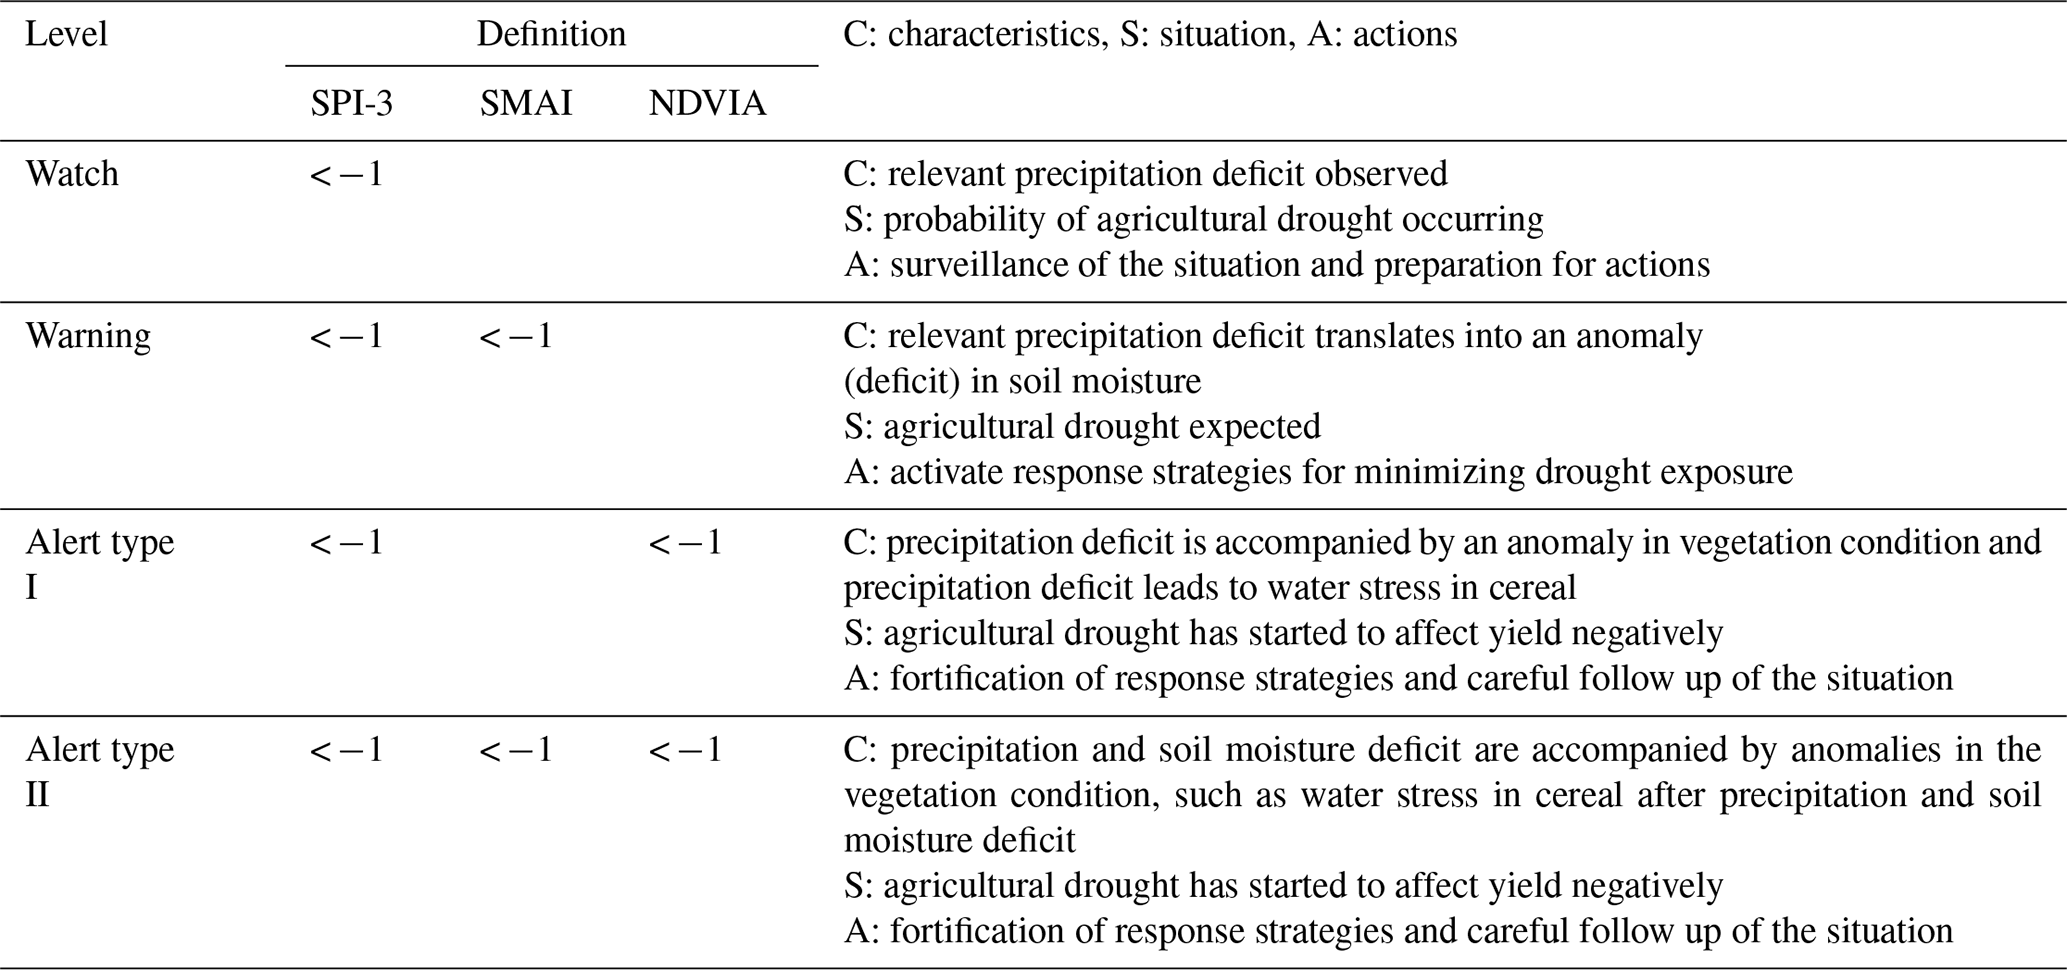
The CDI uses three different levels; the first two, watch and warning, indicate that a drought could be imminent. The highest level of the CDI is “alert”. The two types of alert include those cases in which a meteorological drought results in a rapid yield decrease. The type I alert can occur even without a previous anomaly in soil moisture values, which could be related to intense droughts occurring during sensitive phenological phases of the crop. Therefore, a type I alert depends on only two indicators, SPI-3 and NDVI. The type II alert is based on all three indicators composing the CDI (SPI-3, SMAI and NDVI) so that these give firmer evidence for the existence of an agricultural drought.
2.6 Insurance data
The insurance area data and those of areas affected by drought per agricultural season for rainfed cereal were given by Agroseguro, the Spanish agricultural insurance provider. These data were disaggregated for each area of the five under study and each agricultural season, from 2002–2003 to 2011–2012. Note that data for the last year of the study, 2012–2013, were not provided. Crop intensity damage is expressed as the percentage of surface area that was filed for damage with respect to the total insured area and is available on an agricultural region scale. Crop damage of close to 100 % indicates important losses during that year.
3.1 SPI
The SPI values calculated over a 3-month period (SPI-3) reflected short–medium term moisture conditions and provided an estimate of the seasonal precipitation that was useful for agricultural purposes. In our study area, defined in Sect. 2.1, SPI-3 values at the end of April revealed the precipitation trends during the plant reproduction stage and the grain development. SPI-3 at the end of December showed moisture conditions at the start of the growing season.
Figure 2 gives the trends in SPI-3 for all five selected agricultural regions. The trends are similar in all regions, with SPI-3 values moving periodically around the long-term mean or 0 value. In the driest years, one can observe the highest negative peaks. For example, during the agricultural year 2004–2005, which was very dry, negative values of up to −2.50 can be observed for Campiña de Cádiz, indicating the drought severity. Another dry year was 2011–2012, when values of up to −2.12 could be observed during the month of February in La Campiña. So, clearly, the two main dry periods were correctly identified by the trends in SPI. However, this drought indicator also defined other different periods that were not markedly dry as being critical. In 2008–2009 all the regions are distinguished for being critical SPI levels, albeit for short periods of time and mainly towards the summer or end of the agricultural year. Even in 2012–2013 critical drought periods were flagged in four out of five regions.
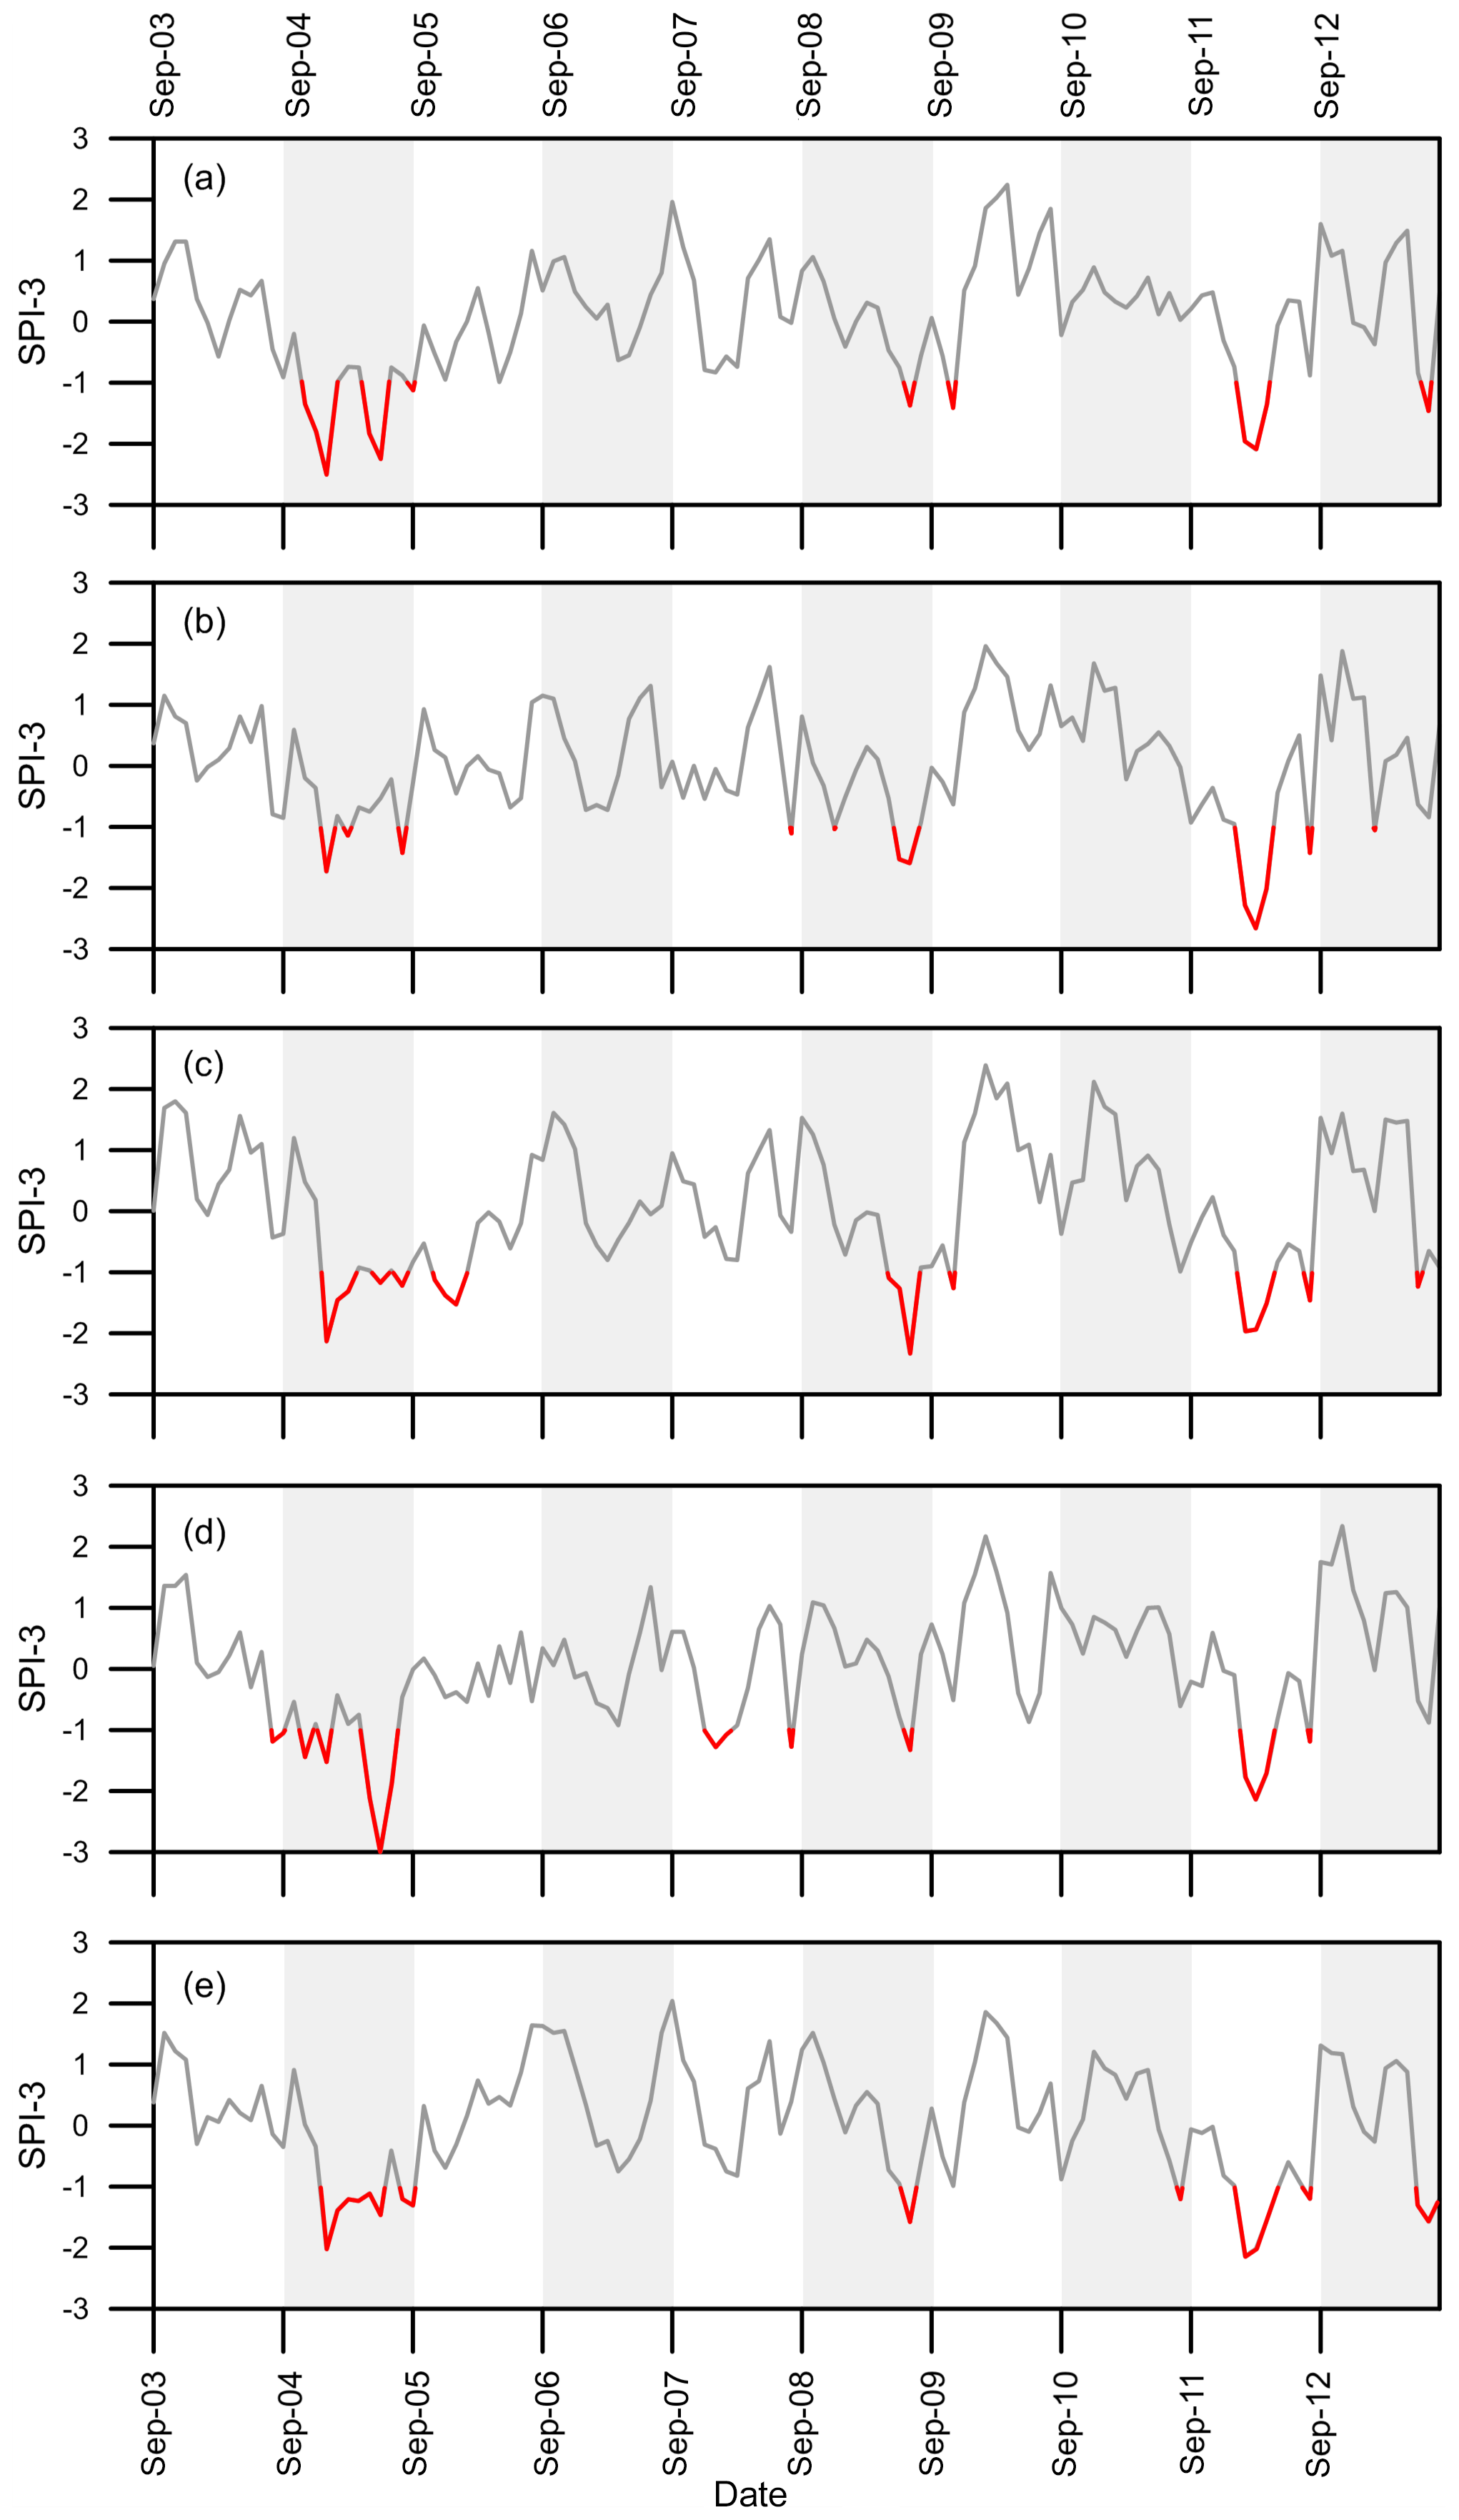
Figure 2Variation of the standardized precipitation index over 3 months (SPI-3) during the period studied (2003–2013) in the five selected agricultural regions: (a) Campiña de Cádiz, (b) Campiña Baja, (c) Pedroches, (d) Norte/Antequera and (e) La Campiña. Red lines indicate values below the defined threshold of −1.
3.2 SMAI
Figure 3 shows the variation in the SMAI over the period studied and for each of the five agricultural regions. The two main dry periods of 2004–2005 and 2011–2012 are not consistently apparent. Generally, only two regions at that time dipped below the −1 mark and are indicated in red: (a) Campiña de Cádiz and (d) Norte/Antequera for 2004–2005 and (a) Campiña de Cádiz and (b) Campiña Baja for 2011–2012. The year 2007–2008 seems to be marked by drier soil water contents compared to the long-term mean, as critical levels are reached for four out of the five agricultural regions.
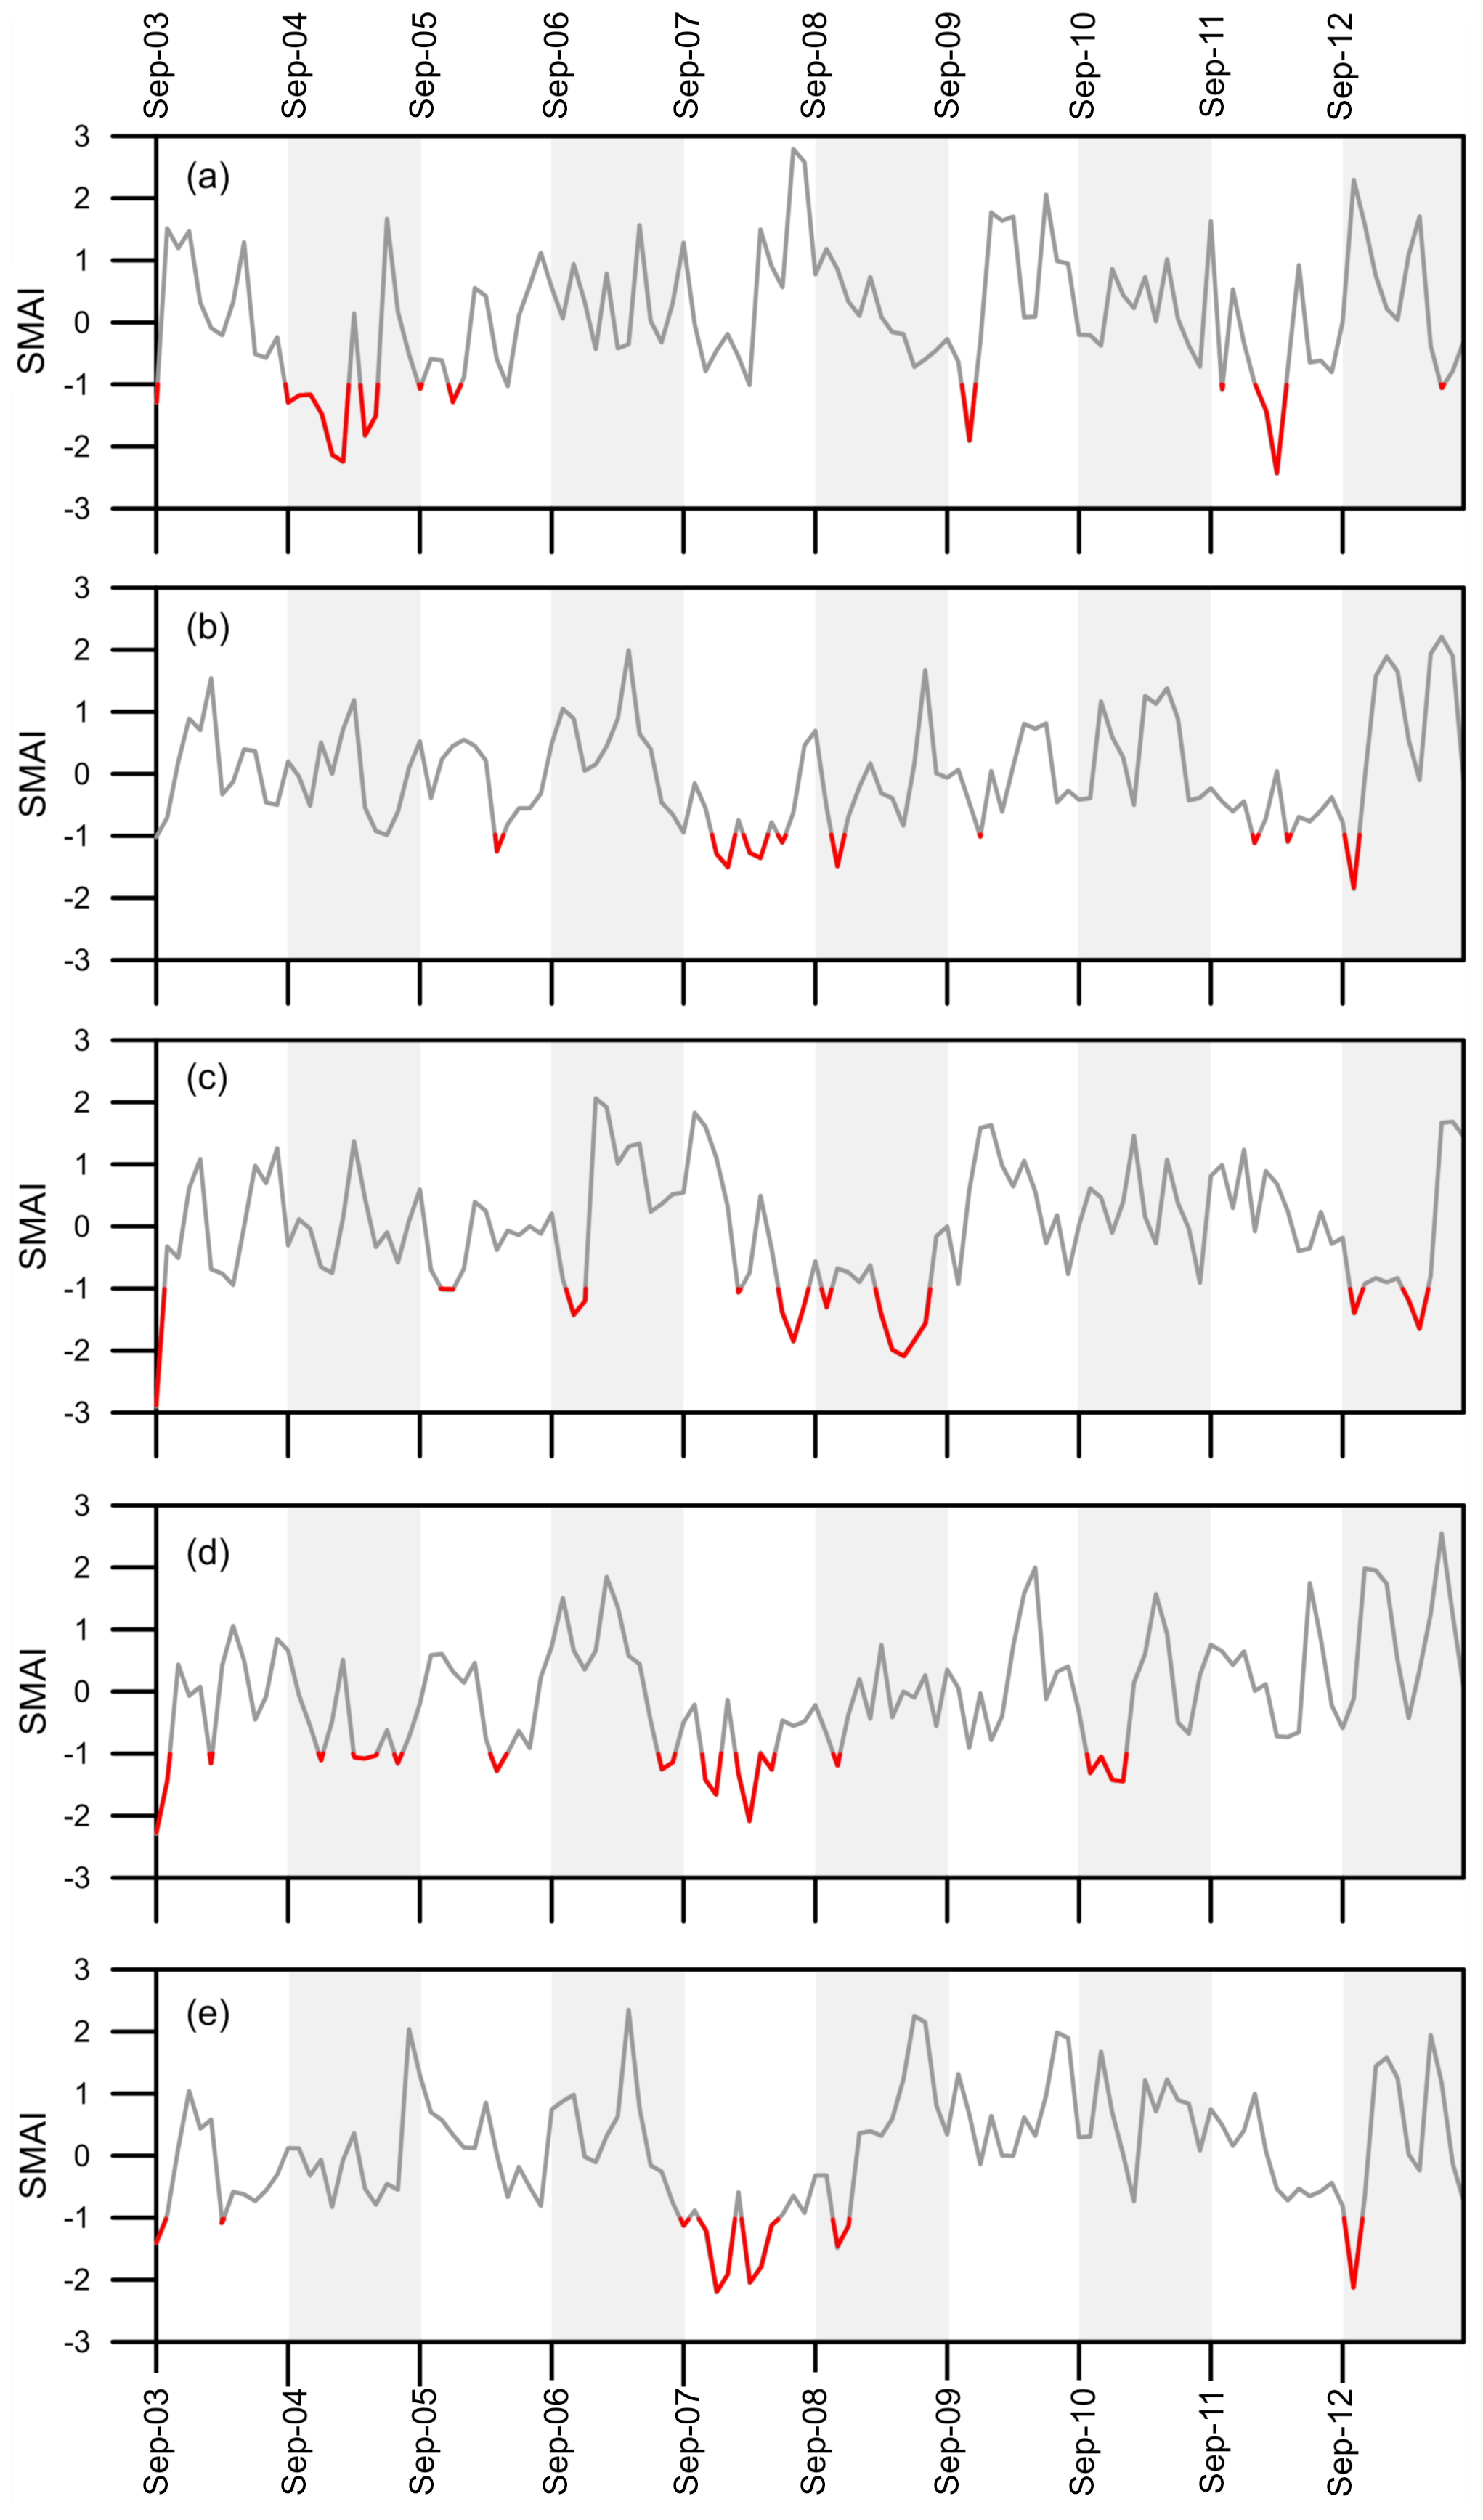
Figure 3Variation of the soil moisture anomaly index (SMAI) during the period studied (2003–2013) in the five selected agricultural regions: (a) Campiña de Cádiz, (b) Campiña Baja, (c) Pedroches, (d) Norte/Antequera and (e) La Campiña. Red lines indicate values below the defined threshold of −1.
3.3 NDVIA
Figure 4 shows a map indicating the spatial and temporal variability in NDVI values over Andalusia for the year 2004. Figure 4a indicates NDVI in April, right in the growing season, while Fig. 4b shows the same area after the cereal has been harvested. The color red indicates low values of NDVI, while green represents maxima of between 0.96 in April and 0.92 in June. When comparing the distribution of the main cereal-growing regions in the area in Fig. 1, these areas present the most important variation between the two images, with high values in April and low red ones in June.
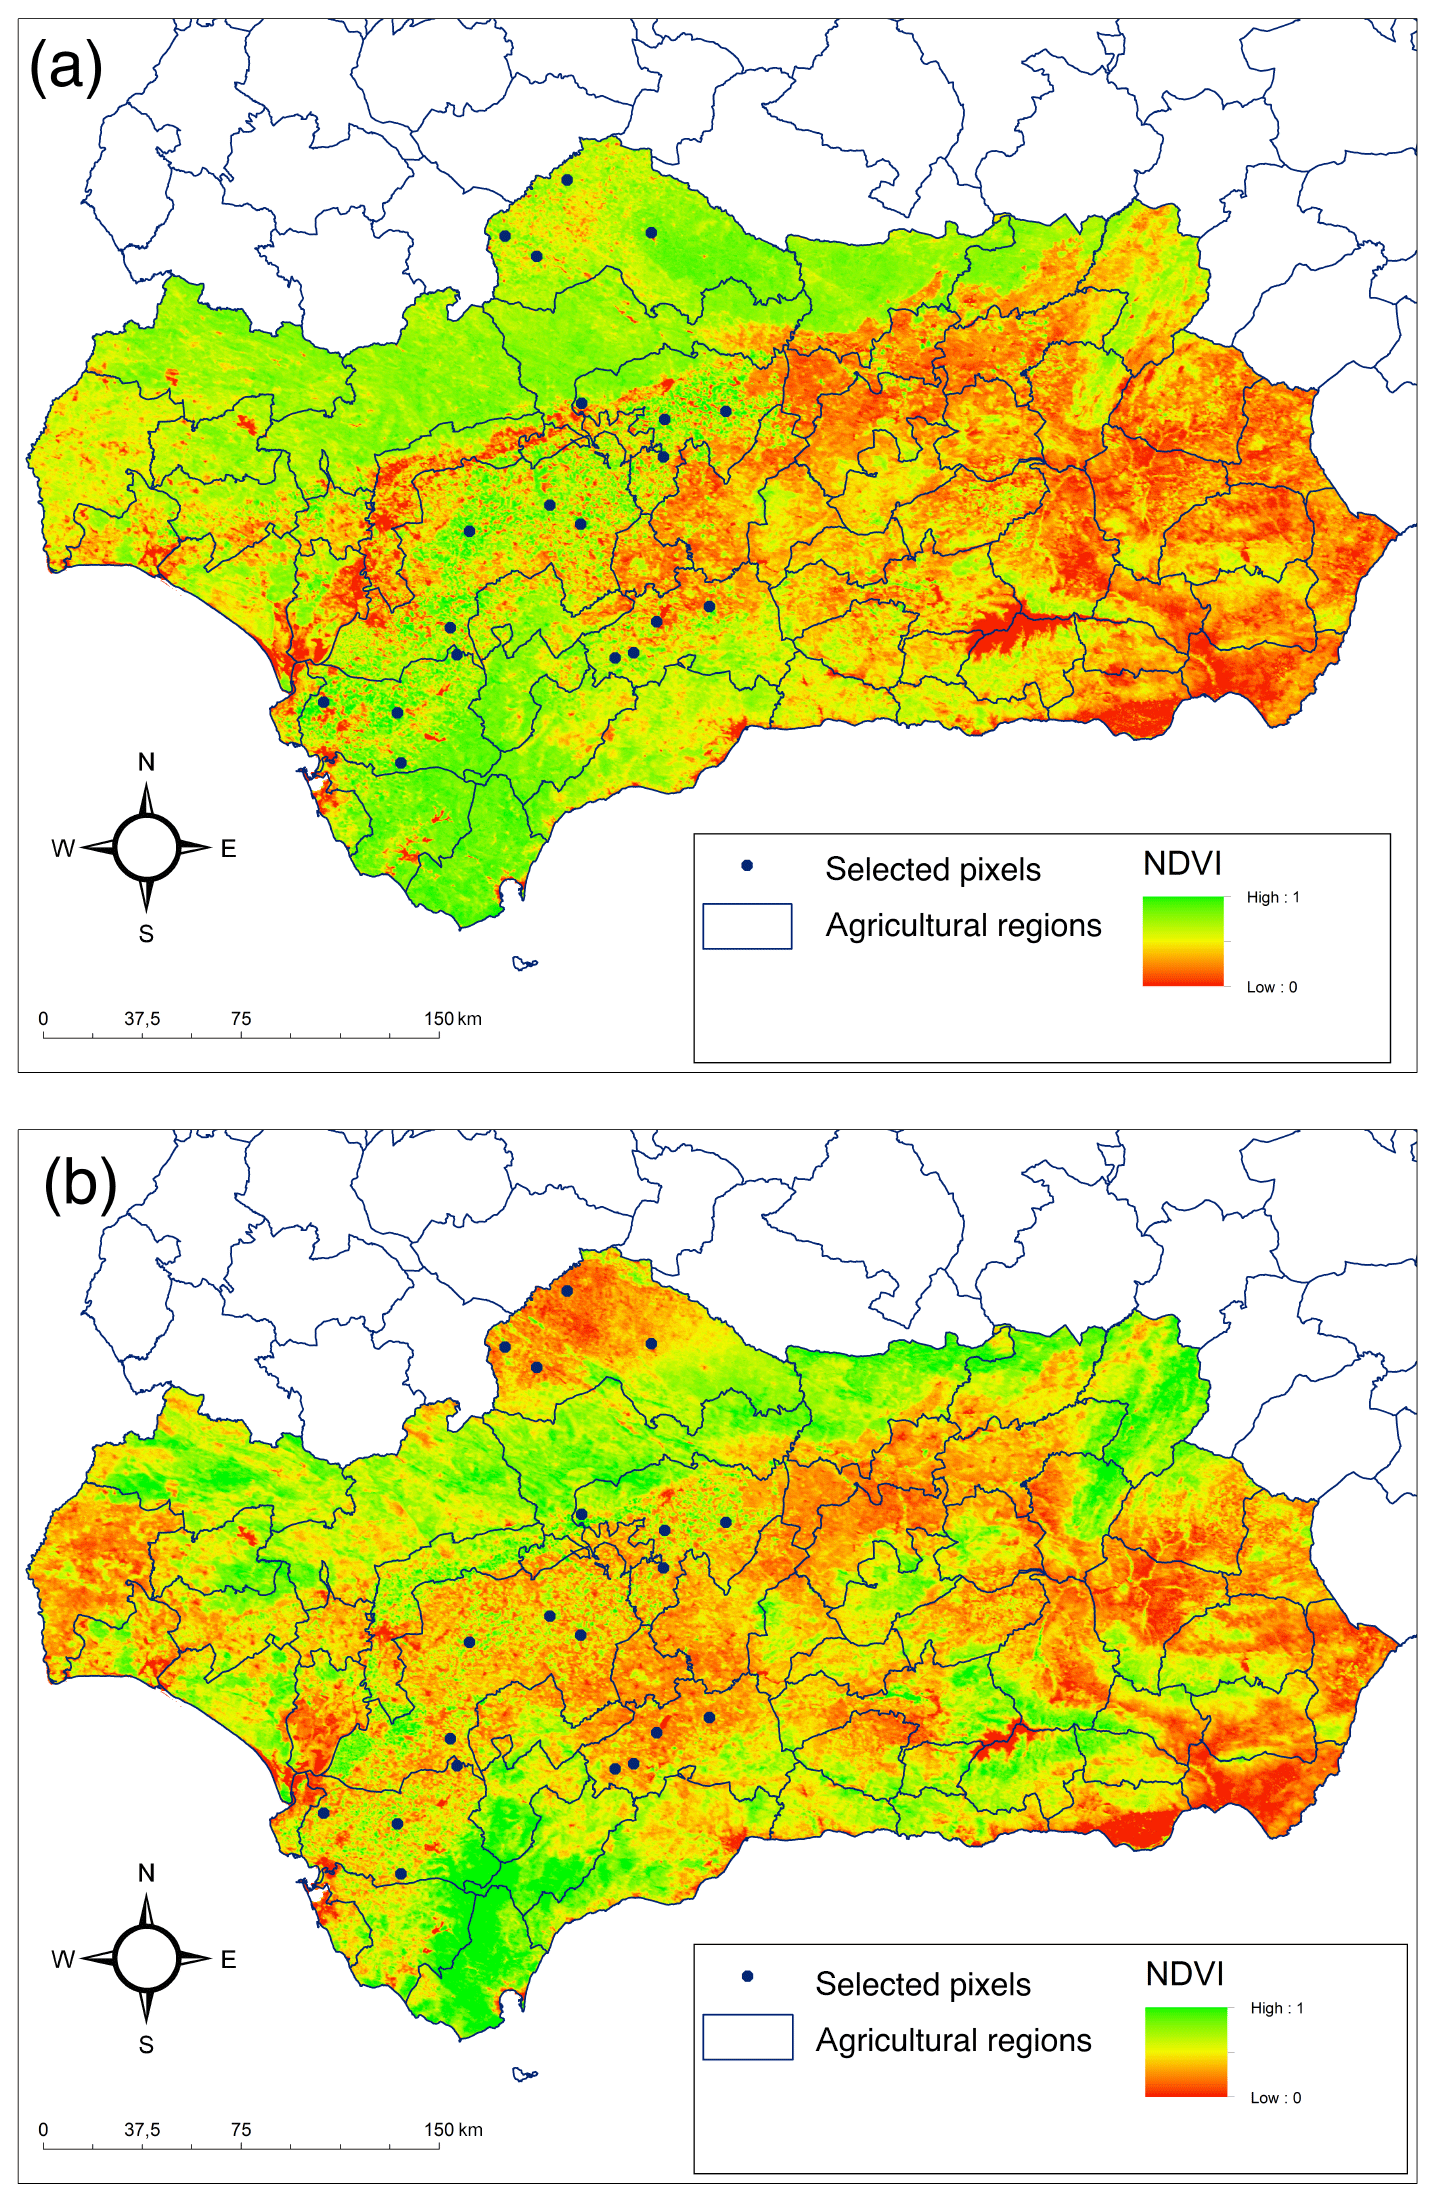
Figure 4NDVI values all over Andalusia in (a) April 2004 and (b) June 2004. Important changes from green to red are observed in the main grain-growing areas, while areas with natural forests and shrubs remain green. Blue dots show the four representative pixels that were selected within each of the five agricultural regions studied.
Figure 5 shows the monthly variation in the NDVI anomaly for the four selected pixels within the Campiña agricultural region. The pixels in the other four agricultural regions are not shown, but their trend is similar. There is, of course, an important spatial variability within the area, such that some differences appear between the four study locations. This can be attributed to different planting dates, crop varieties or soil properties between the locations. Over the study period, however, the same general temporal trends appear. Important negative deviations from the mean indicate periods of high plant stress. Values of NDVI anomaly below −1 are marked in red. Its evolution is similar to that of SPI-3 and SMAI (Figs. 2 and 3), although there is clearly a time lag effect. Plant stress generally only occurs after precipitation and a deficit in soil moisture. Also, the temporal pattern is more erratic than in the case of SPI-3 and SMAI. However, the previously mentioned 2004–2005 and 2011–2012 droughts can be identified as being the negative peaks in Fig. 4. During other years, isolated red deviations appear, but these are not generalized among all four sites. The only exception is 2008–2009, when a generalized NDVI anomaly appears in all of them, but it occurs early during the first months of the growing season, so perhaps it can be attributed to a late seeding that year.
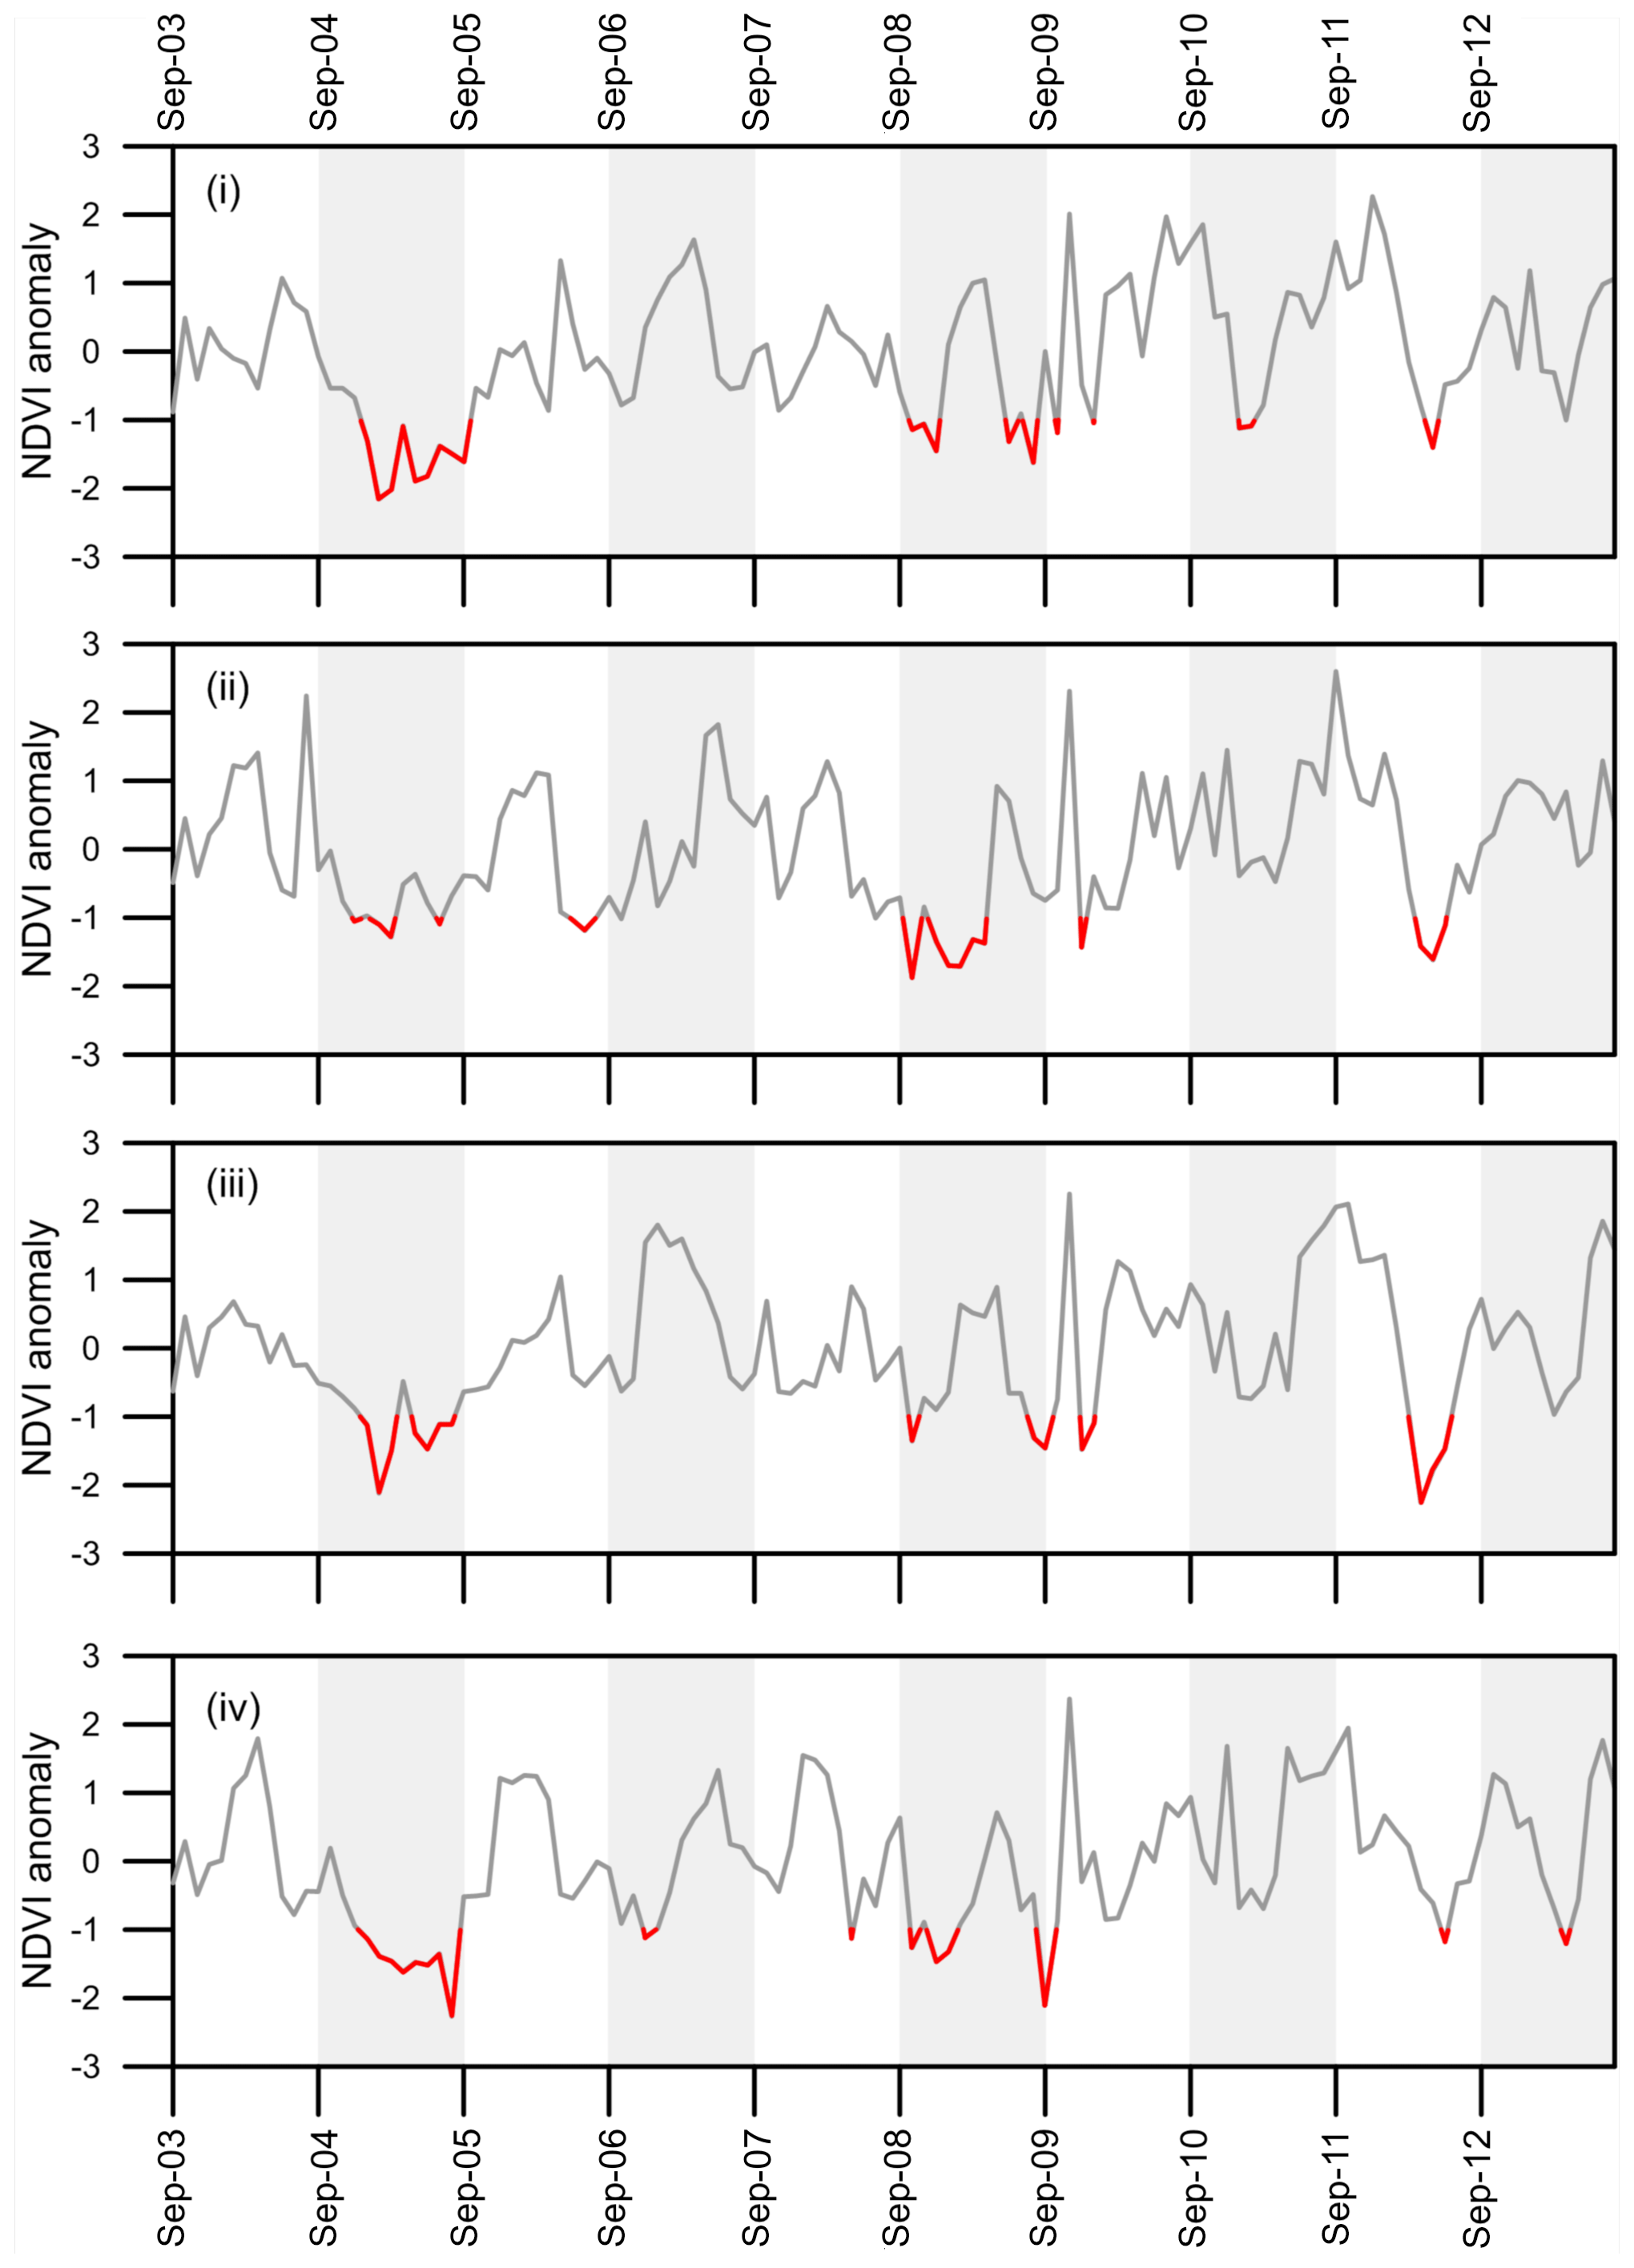
Figure 5Variation of the monthly NDVI anomaly for the four selected locations within the region “La Campiña” over the study period. Red lines indicate values below the defined threshold of −1.
3.4 CDI
Figure 6 shows the monthly evolution of CDI between 2003 and 2013 and compares its levels against crop damage data derived from agricultural insurance information. This occurs twice during the studied period on a regionalized scale, indicating the effects of a drought. The first time is during the agricultural year 2004–2005, with losses of between 73 % and 99 % in the five agricultural regions studied. Also, for the years 2011–2012, there was considerable crop damage of between 71 % and 92 %. A third season, 2009–2010, had medium to high losses, of between 44 % and 89 %. However, crop damage during this period is, rather, due to the effects of excessive precipitation, leading to water stagnation and erosion damage. This can be seen when comparing the annual precipitation values. For example, in the Córdoba agricultural region, with a mean long-term precipitation of 600 mm, the values for 2004–2005, 2009–2010 and 2011–2012 are, respectively, 423, 1179 and 433 mm.
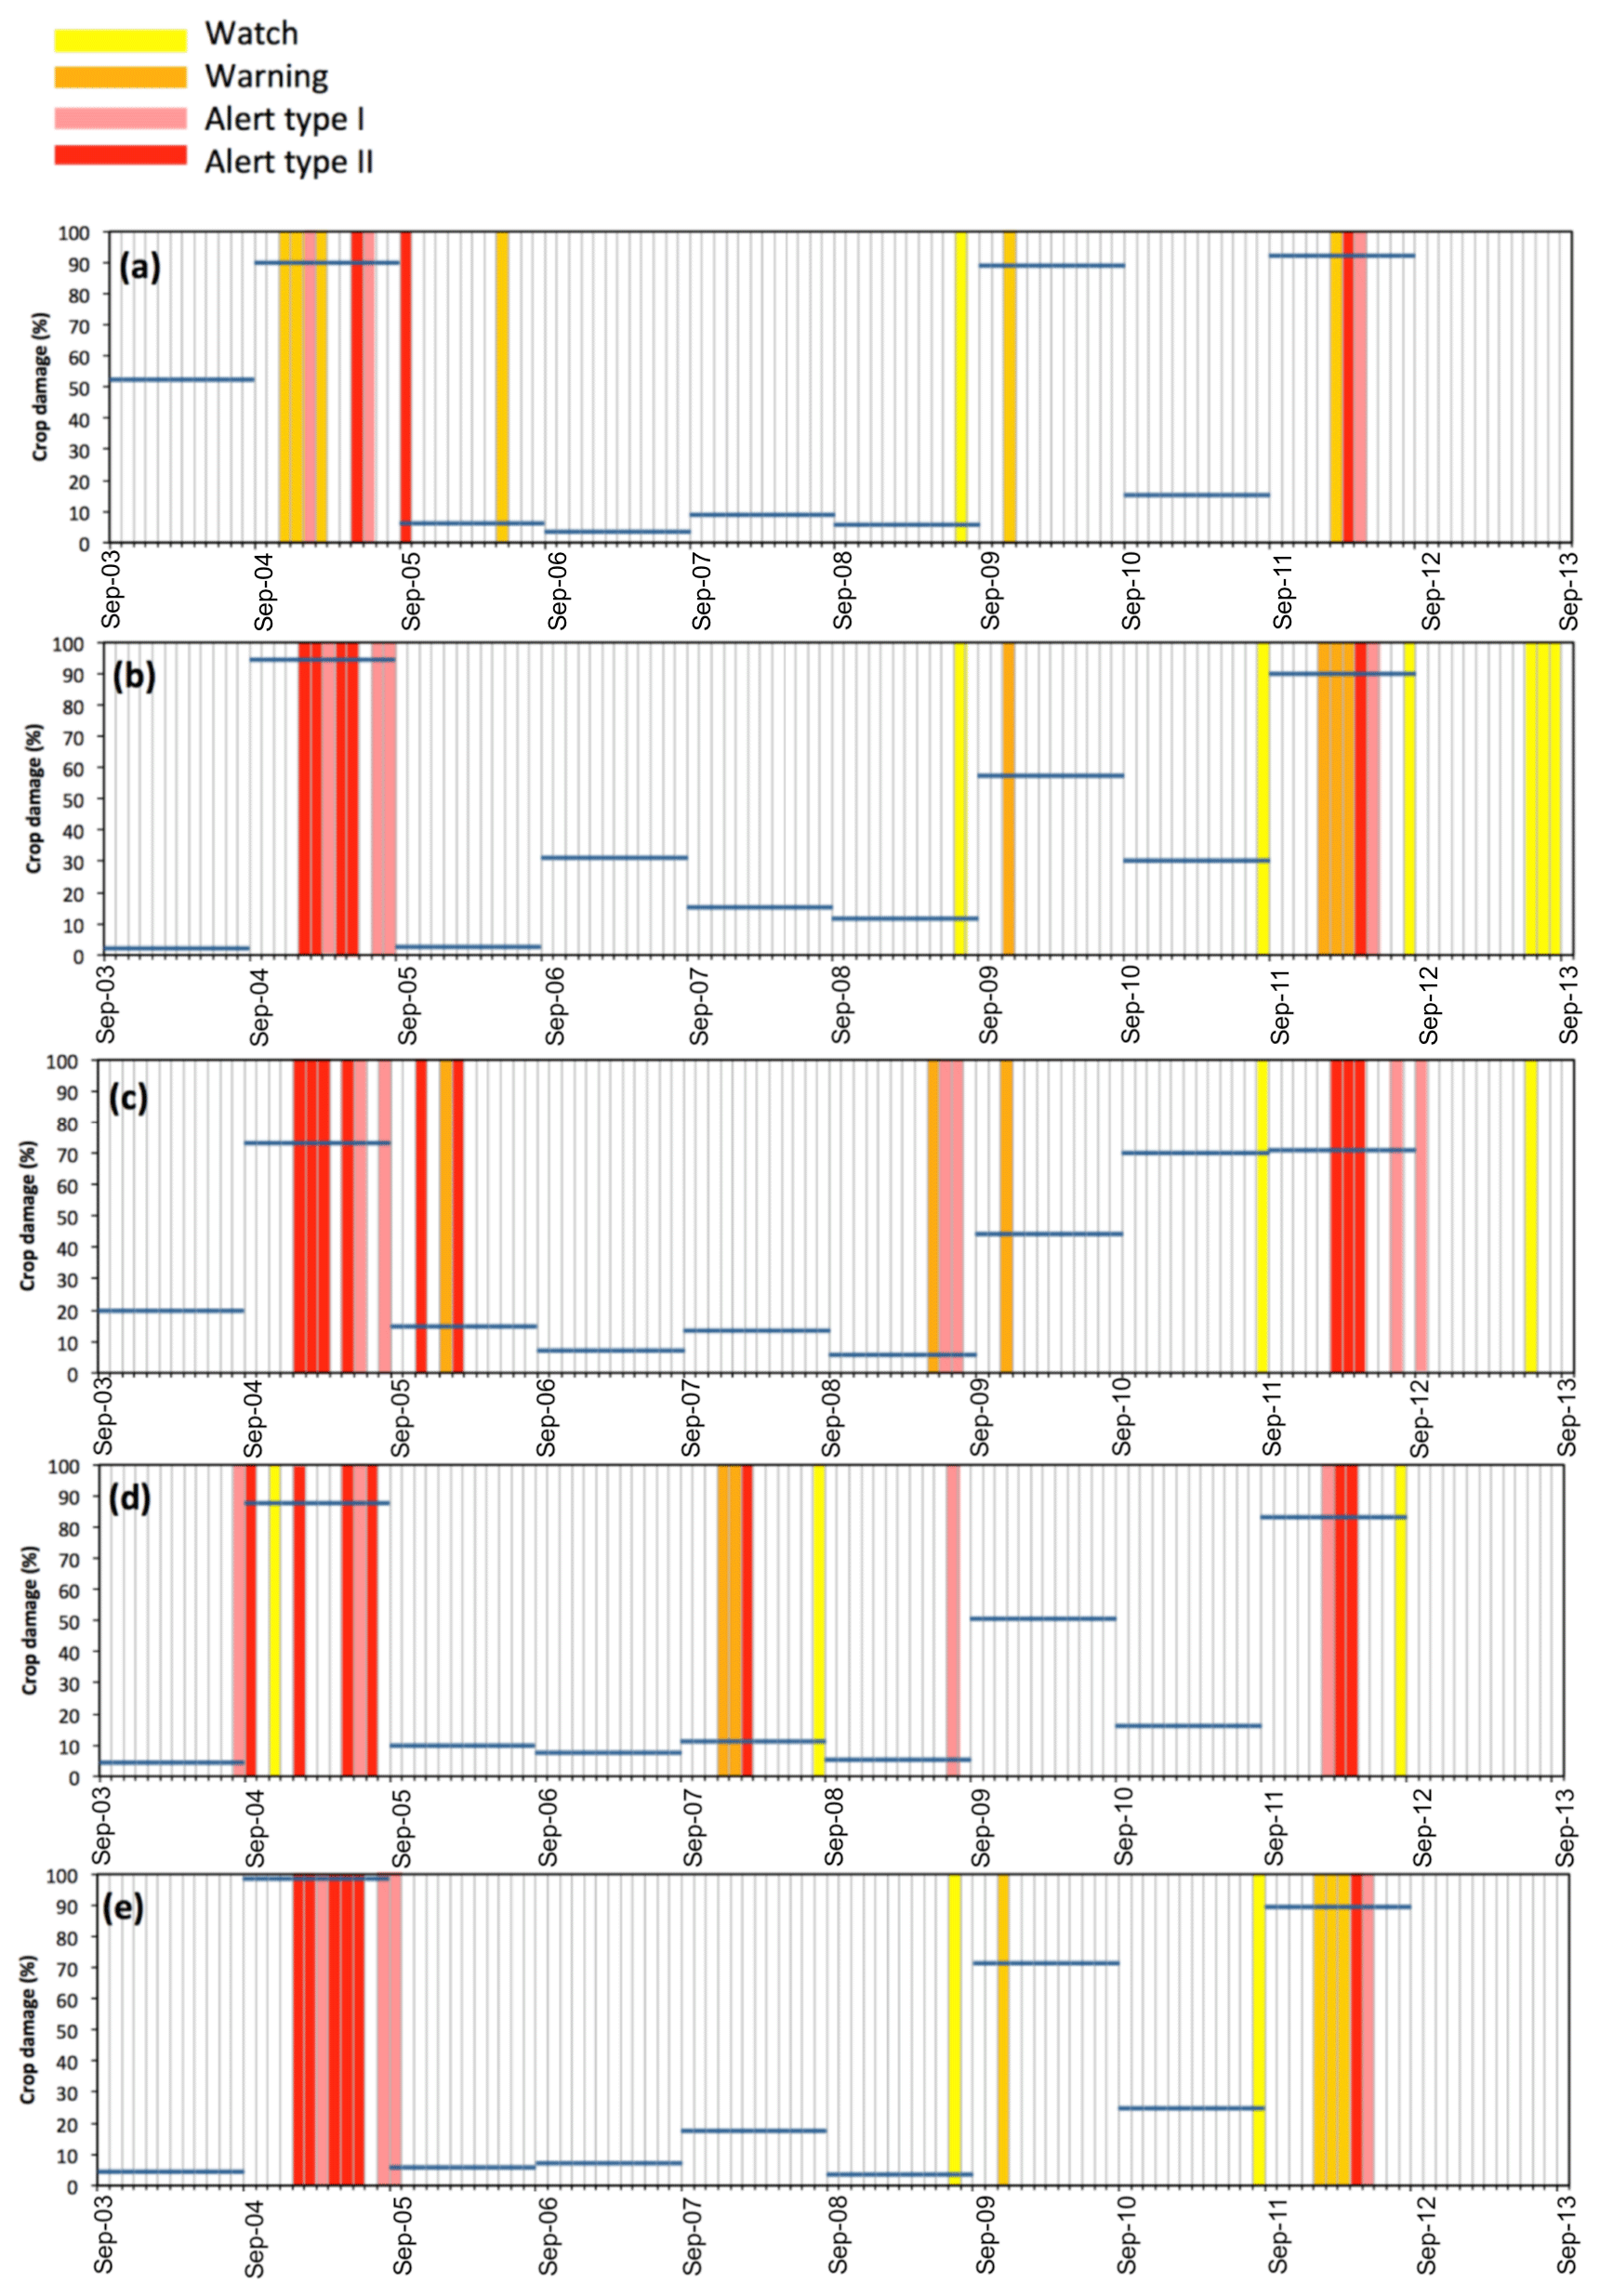
Figure 6Evolution of the combined drought indicator (CDI) from 2003–2013 and comparison with agricultural crop damage intensity (blue lines) for the five agricultural regions studied: (a) Campiña de Cádiz,(b) Campiña Baja, (c) Pedroches, (d) Norte/Antequera and (e) la Campiña.
The CDI accurately captured these two important drought periods. For the first area, Campiña de Cádiz (Fig. 6a), a series of drought warning levels were issued early in the agricultural year 2004–2005, followed by a type I alert in January. There was another type I and II alert in May–June. In other words, since the seeding and during the first months of crop growth, there was a continued series of drought warnings or alerts. In that particular year, 90 % of the insured area was reported as being damaged. In 2005–2006, the CDI registered another warning indication, but it did not lead to any damage to the crop. In September 2005 there was a type II alert, but that month is outside the cereal growth period and when the crop was seeded two months later, the situation had gone back to normal. In May 2006 another warning was issued due to a precipitation and a soil moisture deficit. However, the crop was already at the moment in its cycle when it was close to harvesting and it was therefore not affected so much. In 2009–2010, characterized by considerable crop damage, 89 % of the total insured area, there was only one alert, in November. As mentioned before, crop damage during that season was probably due to precipitation excess rather than drought. For the dry period of 2011–2012, the CDI accurately indicated that critical situation with a warning, followed by type I and II alerts in the period of February–April.
For the Campiña Baja region (Fig. 6b) the dry period of 2004–2005 was characterized by a continuous series of type I and II alerts from January to June, with two more alerts during the summer, outside the cereal growing period. In this region, the insured area damaged that year was also very extensive (95 %). In 2008–2009 a warning was issued that did not cause any yield losses, as only 15 % of the insured area was damaged. This can be explained by the fact that this situation did not occur at a time when the crop was sensitive. In another dry year, 2011–2012, a series of warnings were issued, from January to March, followed by, respectively, type II and I alerts in April and May. These all occurred at times when the crop was highly sensitive, so that it was seriously damaged in 90 % of the area.
In the Pedroches region (Fig. 6c), the two main dry periods were well predicted. The year 2004–2005 was distinguished by a series of type II alerts in January, February, March and May and a type I alert in June. This sequence of critical CDI levels was reflected in an insured crop area with 73 % of damage. In 2005–2006, although there were two types of stress situations, warnings and type II alerts from November to February, the damage rate was not a high one, only 15 % of the insured area. It is difficult to understand the underlying reasons for the good performance of the crop that year. For example, during the years 2008–2009, the incidents were clearly late in the year (May to July), a period when grain growth is not sensitive. The second dry period of 2011–2012 is marked by a number of type II alerts issued from February to April, at a time when the cereal is highly vulnerable. This is reflected in a 71 % damaged insured area.
In the Comarca Norte/Antequera region (Fig. 6d), the dry period of 2004–2005 was determined by several incidents early on, with a watch issued in November and a type II alert in January, the latter being the period of cereal nascence and other sensitive growth stages. That year, the damaged insured area was 88 %. In 2007–2008 there were two warnings and a type II alert, from December to February, but these did not lead to crop damage, as the damaged insured area was only 11 %. Again, the reason could be found in those droughts occurring during a period when the cereal was not too sensitive. During the second main dry period of 2011–2012, a number of type I and II alerts were issued between February and April. These corresponded to highly sensitive moments of the crop cycle, and damaged insured areas were consequently high that year, amounting to 83 %.
The last region, La Campiña (Fig. 6e), showed a similar trend, with 2004–2005 being identified as having an extremely high damaged insured area of 99 %. The CDI worked well in predicting this, as there were multiple and continued alerts; i.e., from January to June there was a continued type II alert, except in March when it was a type I alert. In 2009–2010 there was a watch in November, and the damaged area was 72 %. However, as mentioned before, the absence of any further drought watches during that year and the high total annual rainfall indicate that the damage was likely to have been caused by excess precipitation. In the second main dry period of 2011–2012, the situation was worse, with a number of warnings from January to March, a type II alert in April and again a type I alert in May. That year the damaged insured area was high, up to 90 %.
The results led to the conclusion that the performance of the newly proposed CDI is adequate (Fig. 6). The periods of high crop damage – between 70 and 95 % – in the two important dry periods of 2004–2005 and 2011–2012 were accompanied by watches, warnings and type I or II alerts of CDI in the five agricultural regions studied. This combined indicator has several advantages over using a single one, as is evidenced by the trends in precipitation, soil moisture and vegetation alone. Soil moisture, for example, did not include the two main dry periods, 2004–2005 and 2011–2012, in all of the areas. The soil moisture anomaly index only indicated drought in two out of five regions for each of these dry periods, and this could probably be improved by measurements of in situ soil moisture. Krueger et al. (2017), for example, showed how in situ soil moisture measurements explained wildfire incidence much better than the widely used Keetch–Byram drought index (KBDI). Like our SMAI, the KBDI is a drought index calculated on a daily scale, but it only considers daily temperature and precipitation in calculating soil moisture. Whereas our SMAI uses a more advanced soil water balance algorithm (using variable infiltration rates and refining the estimation of the actual evapotranspiration rate from the potential rate computed by the FAO-Penman Monteith equation), and it is clear that future studies should focus on site-specific calibrations of soil moisture dynamics against field data or by observations from remote sensing. Martínez-Fernández et al. (2015) successfully applied in situ soil moisture measurements to predict agricultural droughts in northern Spain. Other studies, like that of Kędzior and Zawadzki (2017), have used SMOS-derived soil moisture anomalies. They concluded that these were suitable for calculating agricultural drought risk in the Vistula river catchment. Another possibility for improving drought prediction based on soil moisture is to combine different models. Cammalleri et al. (2016) used joint means from three different models, LISFLOOD, CLM and TESSEL, and were able to increase the correlation with observations and reduce the number of false drought alarms.
In any case, our results corroborate previous studies using combined indicators that also concluded that they yielded good results for agricultural drought prediction. Sepulcre-Canto et al. (2012), for example, use a similar CDI, based on SPI, soil moisture and photosynthetically active radiation (fAPAR). They evaluate this indicator on the continental scale and assess its performance against annual cereal yield at the regional level. They conclude that their indicator is successful in predicting drought periods and lower yields. While our indicator is similar in conception, there are notable differences with the CDI proposed in this study, firstly in the way soil moisture anomalies are calculated and secondly by using NDVI instead of fAPAR. Gouveia et al. (2009), comparing a soil water index against NDVI response in Portugal, found a good correlation between NDVI and soil water content under different land use conditions. They concluded that NDVI values of arable land were more sensitive to drought compared to forests, which suggests that NDVI is particularly well suited in this study of cereal growing areas.
Future studies could focus on improving this combined indicator, for example by using other probability density functions rather than the gamma function used for calculating the SPI. Sienz et al. (2012) obtained a better fit to precipitation data of several world regions with the Weibull rather than with the gamma probability distribution function. Carrão et al. (2016) selected an empirical standardized soil moisture index, which was highly correlated (r2=0.82) with their maize–soybean and wheat yields in three study sites in Argentina.
This study has presented a new combined drought index (CDI) for the assessment of agricultural drought. This CDI uses a combination of anomalies in precipitation (SPI-3), soil moisture and NDVI. The alert results are classified in four levels ranging from watch, warning to alert (type I and II). The CDI dynamics have been assessed for a 10-year period between 2003 and 2013, characterized by two important drought periods (2004–2005 and 2011–2012), in the five main rainfed cereal-growing regions of SW Spain. Comparison with yield data shows that both dry periods, characterized by a high crop damage extent of between 70 % and 95 %, were correctly identified by different critical CDI levels in all five study regions. This demonstrates the potential of this CDI. Further research should focus on a better representation of soil moisture data, either by improving data input from in situ measurements or by remote sensing, or by using model ensembles. Also, phenological information could be used to improve the performance of this indicator.
Data are freely available upon request by contacting the corresponding author by email.
JVG and AT conceptualized the research goals. MdPJD collected the remote sensing data and performed the data analysis. MdPJD developed the paper with contributions from all coauthors.
The authors declare that they have no conflict of interest.
This article is part of the special issue “Remote sensing, modelling-based hazard and risk assessment, and management of agro-forested ecosystems”. It is not associated with a conference.
María del Pilar Jiménez-Donaire was supported by a CEIGRAM fellowship. The insurance data were kindly supplied by Agroseguro. Ana Tarquis is grateful to the Community of Madrid (Spain) and Structural Funds 2014-2020 (ERDF and ESF) for the financial support (project AGRISOST-CM S2018/BAA-4330 and EU project 821964, BEACON).
This research has been supported by the European Commission, Horizon 2020 Framework Programme (BEACON (grant no. 821964)) and the Ministerio de Ciencia e Innovación (grant no. AGRISOST-CM S2018/BAA-4330).
This paper was edited by Jonathan Rizzi and reviewed by three anonymous referees.
Allen, R. G., Pereira, L .S., Raes, D., and Smith, M.: Crop evapotranspiration: guidelines for computing crop water requirements, FAO irrigation and drainage paper. Food and Agriculture Organization of the United Nations, Rome, Italy, 1998.
Andreadis, K. M., Clark, E. A., Wood, A. W., Hamlet, A. F., and Lettenmaier, D. P.: Twentieth-Century Drought in the Conterminous United States, J. Hydrometeorol., 6, 985–1001, https://doi.org/10.1175/JHM450.1, 2005.
Azmi, M., Rüdiger, C., and Walker, J. P.: A data fusion-based drought index, Water Resour. Res., 52, 2222–2239, https://doi.org/10.1002/2015WR017834, 2016.
Brocca, L., Melone, F., and Moramarco, T.: On the estimation of antecedent wetness conditions in rainfall–runoff modelling, Hydrol. Process., 22, 629–642, 2008.
Brooks, R. H. and Corey, A. T.: Properties of Porous Media Affecting Fluid Flow, J. Irrig. Drain. E.-ASCE, 92, 61–90, 1966.
Bussay, A., Szinell, C., and Szentimery, T.: Investigation and Measurements of Droughts in Hungary, Hungarian Meteorological Service, New York, 1999.
Cammalleri, C., Micale, F., and Vogt, J.: A novel soil moisture-based drought severity index (DSI) combining water deficit magnitude and frequency, Hydrol. Proc., 30, 289–301, https://doi.org/10.1002/hyp.10578, 2016.
Cancelliere, A.: Drought length properties for periodic-stochastic hydrologic data, Water Resour. Res., 40, W02503, https://doi.org/10.1029/2002WR001750, 2004.
Carrão, H., Russo, S., Sepulcre-Canto, G., and Barbosa, P.: An empirical standardized soil moisture index for agricultural drought assessment from remotely sensed data, Int. J. Appl. Earth Obs., 48, 74–84, 2016.
Censo Agrario: National Institute for Statistics, available at: https://www.ine.es/dyngs/INEbase/es (last acess: 15 March 2019), 2009.
Cook, E. R., Seager, R., Kushnir, Y., et al.: Old World megadroughts and pluvials during the Common Era, Sci. Adv., 1, e1500561, https://doi.org/10.1126/sciadv.1500561, 2015.
Cook, B. I., Anchukaitis, K. J., Touchan, R., Meko, D. M., and Cook, E. R.: Spatiotemporal drought variability in the Mediterranean over the last 900 years, J. Geophys. Res.-Atmos., 121, 2060–2074, https://doi.org/10.1002/2015JD023929, 2016.
Dalezios, N., Loukas, A., Vasiliades, L., and Liakopoulos, E.: Severity-duration-frequency analysis of droughts and wet periods in Greece, Hydrolog. Sci. J., 45, 751–769, https://doi.org/10.1080/02626660009492375, 2000.
Gao, B.: NDWI – A Normalized Difference Water Index for RemoteSensing of Vegetation Liquid Water From Space, Remote Sens. Environ., 58, 257–266, 1996.
Georgakakos, K. P.: A generalized stochastic hydrometeorological model for flood and flash-flood forecasting. 1: Formulation, Water Resour. Res., 22, 2083–2095, 1986.
Gouveia, C., Trigo, R. M., and DaCamara, C. C.: Drought and vegetation stress monitoring in Portugal using satellite data, Nat. Hazards Earth Syst. Sci., 9, 185–195, https://doi.org/10.5194/nhess-9-185-2009, 2009.
Gulácsi, A. and Kovács, F.: Drought monitoring with spectral indices calculated from MODIS satellite images in Hungary, J. Environ. Geogr., 8, 11–20, 2015.
Guttman, N. B.: Accepting the Standardized Precipitation Index: a calculation algorithm, J. Am. Water Resour. As., 34, 113–121, 1999.
Hao, Z. and AghaKouchak, A.: Multivariate Standardized Drought Index: A parametric multi-index model, Adv. Water Resour., 57, 12–18, 2013.
Hao, Z., Yuan, X., Xia, Y., Hao, F., and Singh, V. P.: An overview of drought monitoring and prediction systems at regional and global scales, B. Am. Meteorol. Soc., 98, 1879–1896, 2017.
Herrera-Estrada, J. E., Satoh, Y., and Sheffield, J.: Spatiotemporal dynamics of global drought, Geophys. Res. Lett., 44, 2254–2263, https://doi.org/10.1002/2016GL071768, 2017.
Hobbins, M. T., Wood, A., McEvoy, D. J., Huntington, J. L., Morton, C., Anderson, M., and Hain, C.: The evaporative demand drought index. Part I: linking drought evolution to variations in evaporative demand, J. Hydrometeorol., 17, 1745–1761, 2016.
Hunt, E. D., Hubbard, K. G., Wilhite, D. A., Arkebauer, T. J., and Dutcher, A. L.: The development and evaluation of a soil moisture index, Int. J. Climatol., 29, 747–759, 2009.
Ji, L. and Peters, A. J.: Assessing vegetation response to drought in the northern Great Plains using vegetation and drought indices, Remote Sens. Environ., 87, 85–98, https://doi.org/10.1016/S0034-4257(03)00174-3, 2003.
Kao, S.-C. and Govindaraju, R. S.: A copula-based joint deficit index for droughts, J. Hydrol., 380, 121–134, https://doi.org/10.1016/j.jhydrol.2009.10.029, 2010.
Kędzior, M. and Zawadzki, J.: SMOS data as a source of the agricultural drought information: Case study of the Vistula catchment, Poland, Geoderma, 306, 167–182, https://doi.org/10.1016/j.geoderma.2017.07.018, 2017.
Keyantash, J. A. and Dracup, J. A.: The quantification of drought indices, B. Am. Meteorol. Soc., 83, 1167–1180, 2002.
Khare, Y. P., Martinez, C. J., and Muñoz-Carpena, R.: Parameter variability and drought models; a study using the agricultural reference index for drought (ARID), Agron. J., 105, 1417–1432, 2013.
Kogan, F. N.: Droughts of the Late 1980s in the United States as Derived from NOAA Polar-Orbiting Satellite Data, B. Am. Meteorol. Soc., 76, 655–668, 1995.
Krueger, E. S., Ochsner, T. E., Quiring, S. M., Engle, D. M., Carlson, J. D., Twidwell, D., and Fuhlendorf, S. D.: Measured Soil Moisture is a Better Predictor of Large Growing-Season Wildfires than the Keetch–Byram Drought Index, Soil Sci. Soc. Am. J., 81, 490–502, https://doi.org/10.2136/sssaj2017.01.0003, 2017.
Lloyd-Hughes, B. and Saunders, M. A.: A drought climatology for Europe, Int. J. Climatol., 22, 1571–1592, 2002.
Martínez-Fernández, J., González-Zamora, A., Sánchez, N., and Gumuzzio, A.: A soil water based index as a suitable agricultural drought indicator, J. Hydrol., 522, 265–273, https://doi.org/10.1016/j.jhydrol.2014.12.051, 2015.
McEvoy, D. J., Huntington, J. L., Hobbins, M. T., Wood, A., Morton, C., Anderson, M., and Hain, C.: The evaporative demand drought index. Part II:CONUS-wide assessment against common drought indicators, J. Hydrometeorol., 17, 1763–1779, 2016.
McKee, T. B., Doesken, N. J., and Kleist, J.: The relationship of drought frequency and duration to time scales, in: Proceedings of the 8th Conference on Applied Climatology, American Meteorological Society Boston, MA, 179–183, 1993.
Orth, R., Staudinger, M., Seneviratne, S. I., Seibert, J., and Zappa, M.: Does model performance improve with complexity? A case study with three hydrological models, J. Hydrol., 523, 147–159, 2015.
Peel, M. C., Finlayson, B. L., and McMahon, T. A.: Updated world map of the Köppen-Geiger climate classification, Hydrol. Earth Syst. Sci., 11, 1633–1644, https://doi.org/10.5194/hess-11-1633-2007, 2007.
Perrin, C., Michel, C., and Andréassian, V.: Does a large number of parameters enhance model performance? Comparative assessment of common catchment model structures on 429 catchments, J. Hydrol., 242, 275–301, https://doi.org/10.1016/S0022-1694(00)00393-0, 2001.
Quiring, S. M. and Ganesh, S.: Evaluating the utility of the Vegetation Condition Index (VCI) for monitoring meteorological drought in Texas, Agr. Forest Meteorol., 150, 330–339, 2010.
Rawls, W. J., Brakensiek, D. L., and Soni, B.: Agricultural Management Effects on Soil Water Processes Part I: Soil Water Retention and Green and Ampt Infiltration Parameters, T. ASAE, 26, 1747–1752, 1983.
Rawls, W. J., Gimenez, D., and Grossman, R.: Use of soil texture, bulk density, and slope of the water retention curve to predict saturated hydraulic conductivity, T. ASAE, 41, 983–988, 1998.
Rossi, S. and Niemeyer, S.: Drought Monitoring with estimates of the Fraction of Absorbed Photosynthetically-active Radiation (fAPAR) derived from MERIS, in: Remote Sensing for Drought: Innovative Monitoring Approaches, edited by: Wardlow, B. D., Anderson, M. C., and Verdin, J. P., CRC Press Boca Raton, FL, USA, 95–120, 2012.
Sepulcre-Canto, G., Horion, S., Singleton, A., Carrao, H., and Vogt, J.: Development of a Combined Drought Indicator to detect agricultural drought in Europe, Nat. Hazards Earth Syst. Sci., 12, 3519–3531, https://doi.org/10.5194/nhess-12-3519-2012, 2012.
Sienz, F., Bothe, O., and Fraedrich, K.: Monitoring and quantifying future climate projections of dryness and wetness extremes: SPI bias, Hydrol. Earth Syst. Sci., 16, 2143–2157, https://doi.org/10.5194/hess-16-2143-2012, 2012.
Sohrabi, M. M., Ryu, J. H., Abatzoglou, J., and Tracy, J.: Development of soil moisture drought index to characterize droughts, J. Hydrol. Eng., 20, 04015025, https://doi.org/10.1061/(ASCE)HE.1943-5584.0001213, 2015.
Stagge, J. H., Kingston, D. G., Tallaksen, L. M., and Hannah, D. M.: Observed drought indices show increased divergence across Europe, Sci. Rep.-UK, 7, 14045, https://doi.org/10.1038/s41598-017-14283-2, 2017.
Szalai, S. and Szinell, C.: Comparison of two drought indices for drought monitoring in Hungary – a case study, in: Drought and Drought Mitigation in Europe, edited by: Somma, F. and Vogt, J. V., Springer, Berlin, 161–166, 2000.
Tannehill, I. R.: Drought: its causes and effects, Princeton Univ. Press, Princeton, N.J., 1947.
Ting, M., Seager, R., Li, C., Liu, H., and Henderson, N.: Mechanism of Future Spring Drying in the Southwestern United States in CMIP5 Models, J. Climate, 31, 4265–4279, https://doi.org/10.1175/JCLI-D-17-0574.1, 2018.
Vanderlinden, K.: Análisis de procesos hidrológicos a diferentes escalas espacio-temporales, PhD Diss., University of Córdoba, Dept. of Agronomy, Córdoba, Spain, 2001 (in Spanish).
Van Loon, A. F. and Van Lanen, H. A. J.: A process-based typology of hydrological drought, Hydrol. Earth Syst. Sci., 16, 1915–1946, https://doi.org/10.5194/hess-16-1915-2012, 2012.
Van Loon, A. F. and Laaha, G.: Hydrological drought severity explained by climate and catchment characteristics, J. Hydrol., 526, 3–14, 2015.
Wang, L. and Yuan, X.: Two types of flash drought and their connections with seasonal drought, Adv. Atmos. Sci., 35, 1478–1490, 2018.
Wilhite, D. A. and Glantz, M. H. Understanding the drought phenomenon: the role of definitions, Water Int., 10, 111–120, 1985.
Wilhite, D. A., Hayes, M. J., Kinutson, C., and Smith, K. H.: Planning for drought: moving from crisis to risk management, J. Am. Water Resour. As., 36, 697–710, 2000.
Yang, T., Ding, J., Liu, D., Wang, X., and Wang, T.: Combined use of multiple drought indices for global assessment of dry gets drier and wet gets wetter paradigm, J. Climate, 32, 737–748, 2019.
Zarch, M. A. A., Sivakumar, B., and Sharma, A.: Droughts in a warming climate: A global assessment of Standardized precipitation index (SPI) and Reconnaisance drought index (RDI), J. Hydrol., 526, 183–195, 2015.