the Creative Commons Attribution 4.0 License.
the Creative Commons Attribution 4.0 License.
 | 31 Jul 2020
A generic physical vulnerability model for floods: review and concept for data-scarce regions
Mark Bawa Malgwi
Sven Fuchs
Margreth Keiler
The use of different methods for physical flood vulnerability assessment has evolved over time, from traditional single-parameter stage–damage curves to multi-parameter approaches such as multivariate or indicator-based models. However, despite the extensive implementation of these models in flood risk assessment globally, a considerable gap remains in their applicability to data-scarce regions. Considering that these regions are mostly areas with a limited capacity to cope with disasters, there is an essential need for assessing the physical vulnerability of the built environment and contributing to an improvement of flood risk reduction. To close this gap, we propose linking approaches with reduced data requirements, such as vulnerability indicators (integrating major damage drivers) and damage grades (integrating frequently observed damage patterns). First, we present a review of current studies of physical vulnerability indicators and flood damage models comprised of stage–damage curves and the multivariate methods that have been applied to predict damage grades. Second, we propose a new conceptual framework for assessing the physical vulnerability of buildings exposed to flood hazards that has been specifically tailored for use in data-scarce regions. This framework is operationalized in three steps: (i) developing a vulnerability index, (ii) identifying regional damage grades, and (iii) linking resulting index classes with damage patterns, utilizing a synthetic “what-if” analysis. The new framework is a first step for enhancing flood damage prediction to support risk reduction in data-scarce regions. It addresses selected gaps in the literature by extending the application of the vulnerability index for damage grade prediction through the use of a synthetic multi-parameter approach. The framework can be adapted to different data-scarce regions and allows for integrating possible modifications to damage drivers and damage grades.


The magnitude and frequency of floods and their impact on elements at risk have increased globally (Quevauviller, 2014). Risks associated with floods are especially high for communities with a limited capacity to resist their impacts. Communities with a low resistance to impacts of hazards are often referred to as vulnerable. Although the definition of vulnerability varies in different fields of study, efforts to understand and reduce vulnerability are regarded as important steps for disaster risk reduction (UNISDR, 2015). UNISDR (2009) defined vulnerability as the conditions that make communities susceptible to the impact of hazards. These conditions may be linked to limited access to resources, missing risk transfer mechanisms, and/or poor housing quality if elements at risk are considered. Focusing on the latter, poor housing conditions have been shown to be a key factor if different regions exposed to the same hazard level are compared (Papathoma et al., 2003; Keiler et al., 2006). Although the vulnerability of a community has social, economic, physical, environmental, institutional, and cultural dimensions (Birkmann et al., 2013), these dimensions are all interconnected (Mazzorana et al., 2014). Fuchs (2009) and Papathoma-Köhle et al. (2011) identified physical vulnerability as a primer for other vulnerability dimensions. WHO (2009) also highlighted that there is a strong connection between physical vulnerability and other vulnerability dimensions, pointing out that the disruption of physical elements directly affects social and economic activities within a society. Physical vulnerability assessment supports evaluation of economic losses (Blanco-Vogt and Schanze, 2014), analysis of physical resilience (Papathoma-Köhle et al., 2011), cost–benefit analysis (Holub and Fuchs, 2008), risk assessment for future system scenarios (Mazzorana et al., 2012), and decision-making by stakeholders responsible for hazard protection through, e.g. resource allocation (Fuchs, 2009).
Common approaches used for assessing physical vulnerability to flood hazards include stage–damage curves (vulnerability curves), vulnerability matrices, vulnerability indicators (Papathoma-Köhle et al., 2017), and, more recently, multivariate methods. Stage–damage curves show the relationship between flood depths and the degree of impact (e.g. damage grades, relative or absolute monetary loss). These curves are developed using empirical data or expert knowledge (Merz et al., 2010). The empirical method requires data on flood depths and related building damage patterns or monetary losses after a flood event (Totschnig and Fuchs, 2013). These data allow for searching for suitable curves to correlate flood depths to damage or losses. Synthetic methods are based on a “what-if” analysis derived from expert knowledge to determine expected damage for selected intervals of flood depths (Naumann et al., 2009; Merz et al., 2010; Romali et al., 2015). Multivariate methods statistically deduce relationships between empirical building damage or loss data and multiple damage-influencing parameters.
Generally, both stage–damage curves and multivariate methods are used to predict flood damage. This ability to predict damage is increasingly seen as an important step towards disaster risk reduction (Merz et al., 2010). Stage–damage curves and multivariate methods used for damage prediction are commonly referred to as flood damage models. Most flood damage models are based on empirical damage or monetary loss data (see reviews by Merz et al., 2010; Jongman et al., 2012; Hammond and Chen, 2015; Gerl et al., 2016). However, due to the scarcity of such data in data-scarce regions, limitations exist in developing these models, and this consequently hinders efforts to reduce disaster risk (Niang et al., 2015). More recently, Englhardt et al. (2019) reemphasized data scarcity as the limiting factor for physical vulnerability assessment in developing countries. A few flood damage models have been developed using a synthetic and expert-based what-if analysis (e.g. Penning-Rowsell et al., 2005; Neubert et al., 2008; Naumann et al., 2009) that aim to reduce the dependency on empirical damage and loss data. However, synthetic approaches often use flood depth as the only damage-influencing parameter, leading to increased uncertainty in damage prediction (Pistrika et al., 2014; Schröter et al., 2014).
Flood damage models have been applied to predict damage grades (e.g. Maiwald and Schwarz, 2015; Ettinger et al., 2016) or the monetary value of such damage (e.g. Thieken et al., 2008; Merz et al., 2013; Fuchs et al., 2019b). Damage grades are more suitable for data-scarce regions, as they represent qualitative descriptions of frequently observed damage patterns within a region (for floods: moisture defects, cracks on supporting walls). As they are not dependent on information about monetary loss (e.g. insurance data), damage grades provide a good basis for damage estimation and enhance the comparability of flood impacts between different flood events, regions, and buildings types (Blong, 2003a). Besides, since damage grades are comparable for similar building types (Maiwald and Schwarz, 2015), they improve the transferability of flood damage models (Wagenaar et al., 2017).
Another approach increasingly used to assess physical vulnerability is based on vulnerability indicators (Barroca et al., 2006; Barnett et al., 2008; Papathoma-Köhle et al., 2017). Several studies have re-emphasized the importance of identifying and understanding vulnerability indicators as a fundamental step in disaster risk reduction (e.g. UNISDR, 2015; Zimmermann and Keiler, 2015; Klein et al., 2019). Vulnerability indicators are based on aggregated variables to communicate the state of a system (e.g. the resistance of a building) and to provide insights in the level to which this system will be impacted by a certain hazard level (Birkmann, 2006). Since the vulnerability indicator approach has a low requirement for empirical damage or loss data, the method has gained increasing popularity in data-scarce regions. In addition, vulnerability indicators supplement the use of stage–damage curves in a way that the overall picture of flood vulnerability becomes clearer. This clarity is achieved by an integration of multiple drivers of vulnerability providing a more holistic perspective of vulnerability-contributing factors.
Papathoma-Köhle et al. (2017) recommended a combination of physical vulnerability assessment methods to take advantage of their individual strengths while minimizing their weaknesses. A combination of methods here refers to the integration of approaches (or techniques) from two different physical vulnerability assessment methods into one method (or model). Such a combination of methods that utilize expert-based approaches in place of data-driven methods might provide a desirable compromise for data-scarce regions. For example, Godfrey et al. (2015), using Romania as a case study, combined an approach based on vulnerability indicators and an approach based on stage–damage curves to develop an expert-based model for data-scarce regions. However, wider applications of the method have shown to be restricted to regions where stage–damage curves for specific building types already exist. In addition, because of a limited sample size used to test the method, results may be biased (Godfrey et al., 2015).
Only little is known at this point about the flood vulnerability and damage mechanisms of buildings that are exposed in developing countries, such as in Africa. Adelekan et al. (2015) identified population and assets in African cities as being among the most vulnerable globally. Consequently, with climate change, the number of extreme events and catastrophic impacts in these regions is expected to increase (Mirza, 2003). In Africa in particular, the need to develop a systematic approach for evaluating preconditions of buildings and their impact by flood hazards has been stressed by stakeholders and researchers (Komolafe et al., 2015). Although sandcrete block and clay buildings are the most predominant building types in many African countries (Gasparini, 2013), flood damage models remain underdeveloped for such building types (Komolafe et al., 2015). Commonly, exposure and vulnerability are mainly assessed in a regional context based on very coarse data and aggregated land use classes, resulting in considerable uncertainties, especially in a rural context (de Moel et al., 2015). Thus, along with recent studies addressing flood exposure and vulnerability in data-scarce areas, there is a strong need to refine approaches for vulnerability and risk assessments in such regions.
Approaches using damage grades and/or vulnerability indicators are in general more suitable for data-scarce areas; however, so far there is a gap in systematically linking them. This paper aims to develop a conceptual framework for assessing the vulnerability of the built environment to floods in data-scarce areas. To do this, we first provide a review of physical vulnerability indicators for flood hazards, as well as an overview of flood damage models. Second, we develop a conceptual framework that links physical vulnerability indicators and flood damage grades by utilizing local expert knowledge.
This paper is structured as follows: Sect. 2 provides an overview of available information on vulnerability indicators, including indicator selection, aggregation, and weighting, and unveils challenges and gaps of using this method. In Sect. 3, a brief review of flood damage models is presented with a particular focus on the use of damage grades and associated challenges. While Sect. 4 addresses the need for linking vulnerability indicators and damage grades, Sect. 5 introduces the conceptual framework for such linkages, as well as the steps for operationalizing the framework. Concluding remarks are presented in Sect. 6.
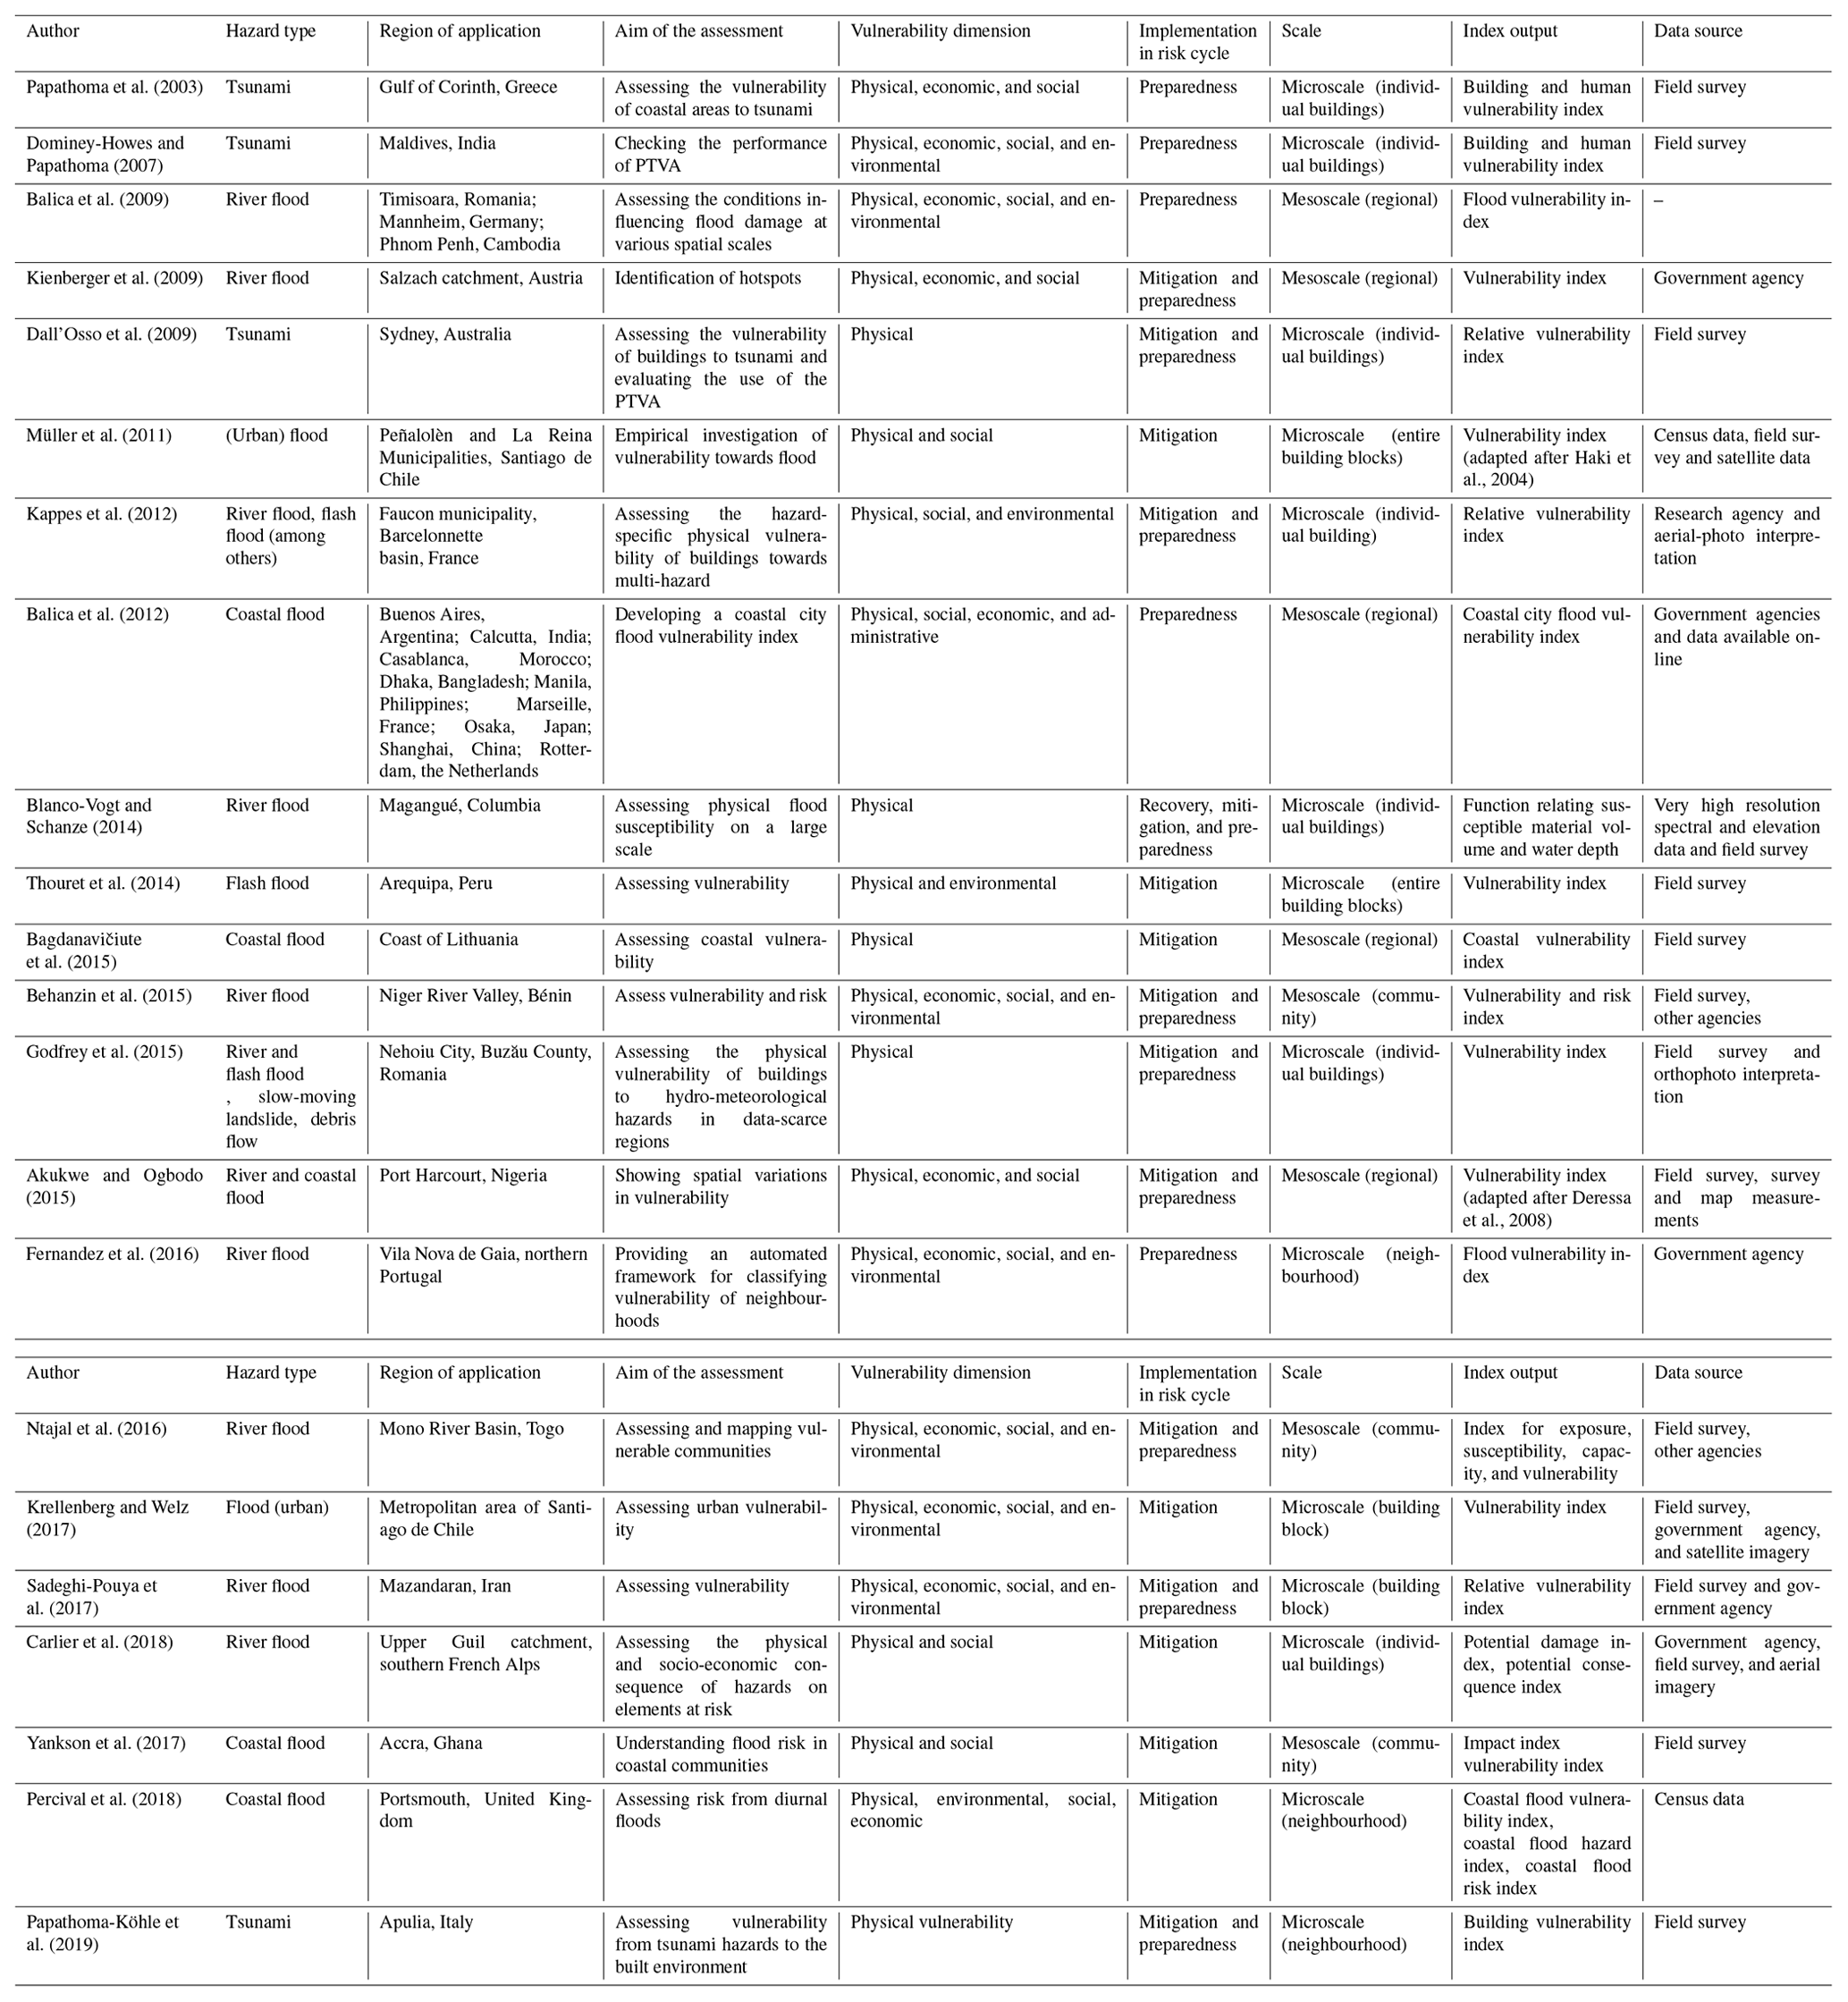
In this section, we present an overview of different studies using indicators to assess the vulnerability of buildings to flood hazards (for details, see Table A1 in the Appendix).
2.1 Background
A vulnerability index is obtained by selecting, weighting, and aggregating vulnerability indicators. Generally, a vulnerability indicator is a parameter (or variable) that can influence and(or) communicate the degree of damage (or loss) of a system (e.g. a building). The indicator approach aims to simplify a concept through the use of an index (Heink and Kowarik, 2010; Hinkel, 2011). Before establishing an index, a framework should be developed to address how major components of the indicator fit together (Birkmann, 2006; JRC and OECD, 2008). Moreover, the framework of such an index should allow adaption to possible future system changes such that it can be used to analyse potential disaster risk. Such adaptation may include possible changes in selected indicators or indicator weights. The framework includes a variety of elements (we refer to these as indicator elements), which helps to clearly outline the extent of applicability and validity of the derived index. Basic elements defining the framework of a vulnerability index include the aim, the vulnerability dimension, the spatial scale, and the region of application (see Table A1).
A first step in developing a framework for indicators is to define the aim, including the different vulnerability dimensions to be assessed, so that the indicators and the final derived index fit into the overall risk assessment framework. Although some studies focus on one specific dimension of vulnerability (e.g. Dall'Osso et al., 2009), other studies examine multiple dimensions of vulnerability (e.g. Kienberger et al., 2009). The interaction between different vulnerability dimensions generates challenges for assessing vulnerability, as well as the use of a high number of indicators in multidimensional studies (Cutter and Finch, 2008). Birkmann (2006) noted that choosing a multidimensional study design is only worth the effort if data are available in a certain quality and quantity, which in turn have to meet the scale requirements of the study (Birkmann, 2007; Aubrecht et al., 2013; Fuchs et al., 2013; Kundzewicz et al., 2019). Consequently, the spatial scale for applying a vulnerability indicator approach varies depending on the availability of data (de Ruiter et al., 2017) and the aim of the assessment. Spatial scales for assessing vulnerability can be on micro, meso or macro level. Microscale assessment is usually challenging in terms of data collection (Günther, 2006), in particular in developing countries with missing metadata on land use, exposure, and population. Microscale assessments can provide an overview of vulnerability (hotspot assessment) over a larger area; hence, decision-makers can use them in allocating resources for emergency responses or risk mitigation. Other indicators operate on a larger scale, i.e. mesoscale (regional to national) and macroscale (international). Moreover, as vulnerability indicators are adaptive to a regional context, a set of indicators selected for a particular region may not necessarily be transferable to another region (Papathoma-Köhle et al., 2017, 2019).
2.2 Application of physical vulnerability indicators
Commonly applied steps, corresponding outputs, and methods for constructing a physical vulnerability index are presented in Fig. 1. Different methods used in deriving the index include deductive (based on theories and/or basic assumptions), inductive (based on empirical data), and normative (based on value judgement) approaches. In physical vulnerability assessments for flood hazards using vulnerability indicators, the deductive approach is the most commonly applied method, relying on expert judgement and information provided in the relevant scientific literature without any further empirical data. It is also common to use a combination of inductive and deductive approaches either during the indicator selection or during indicator weighting and aggregation. Table 1 shows different studies that derived a physical vulnerability index to assess flood hazards and the various methods employed. Since our attention is on data-scare regions, further discussions in this section will be focused on the deductive and normative approaches, since they do not rely on empirical data.
Table 1Applications of physical vulnerability indicators, including methods used for variable selection, weighting, and aggregation, and parameters needed for assessing physical (building) vulnerability. AHP stands for analytical hierarchy process, and PCA stands for principal component analysis.
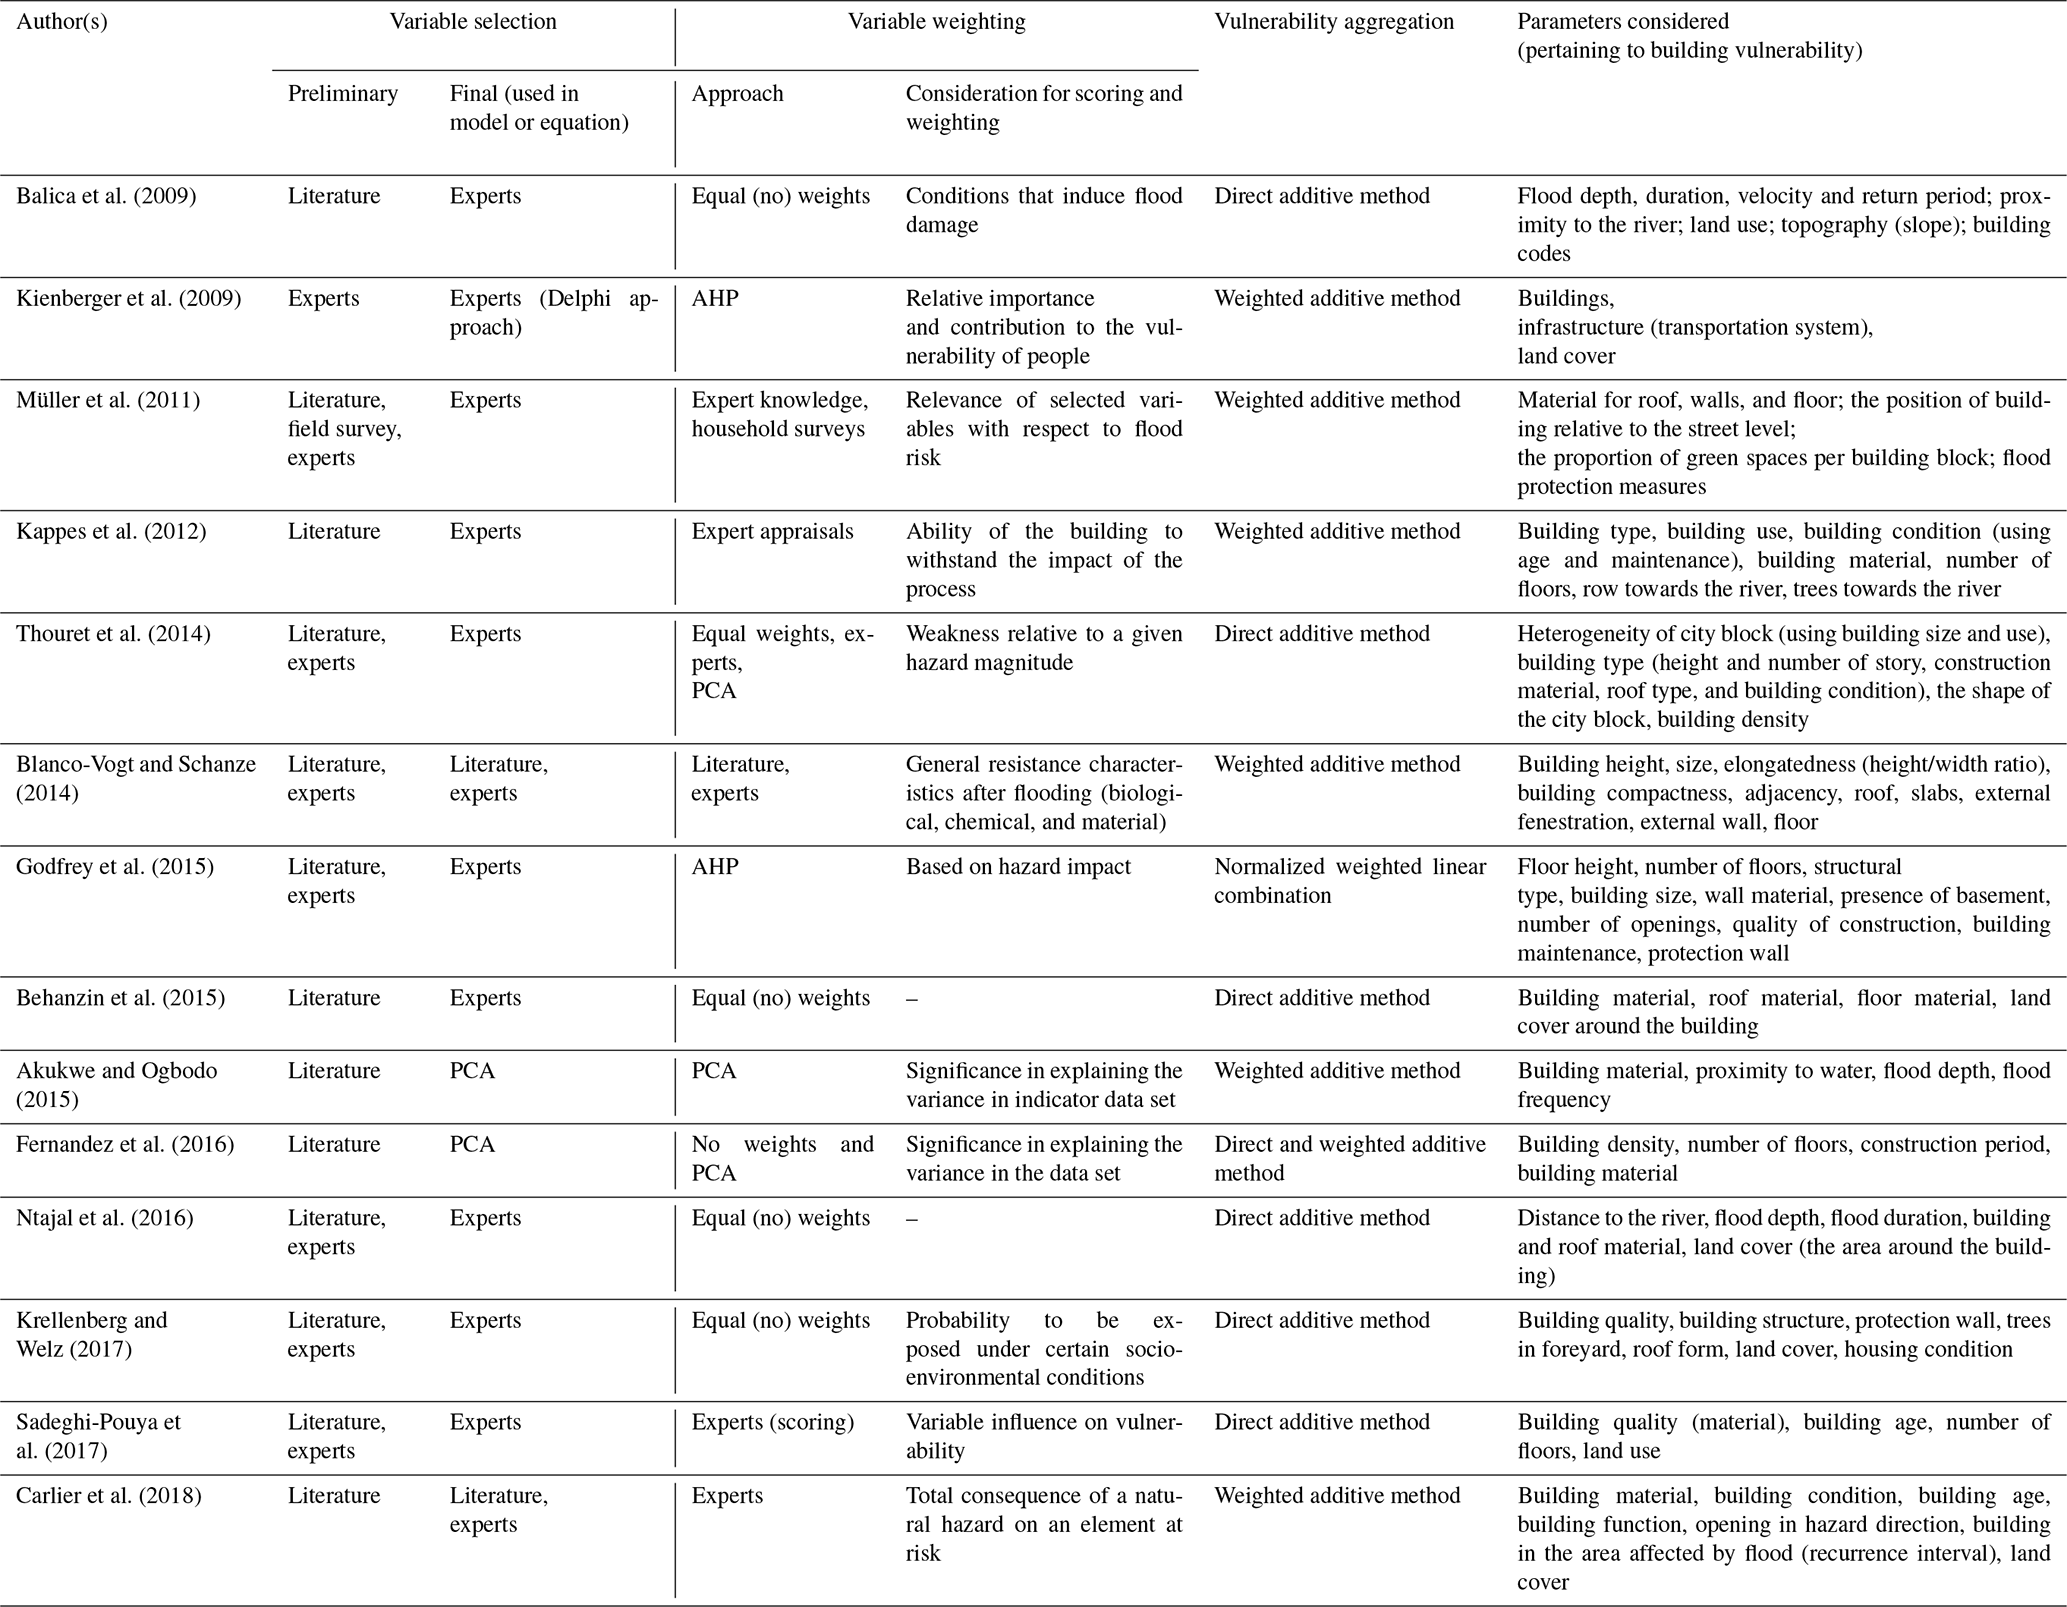
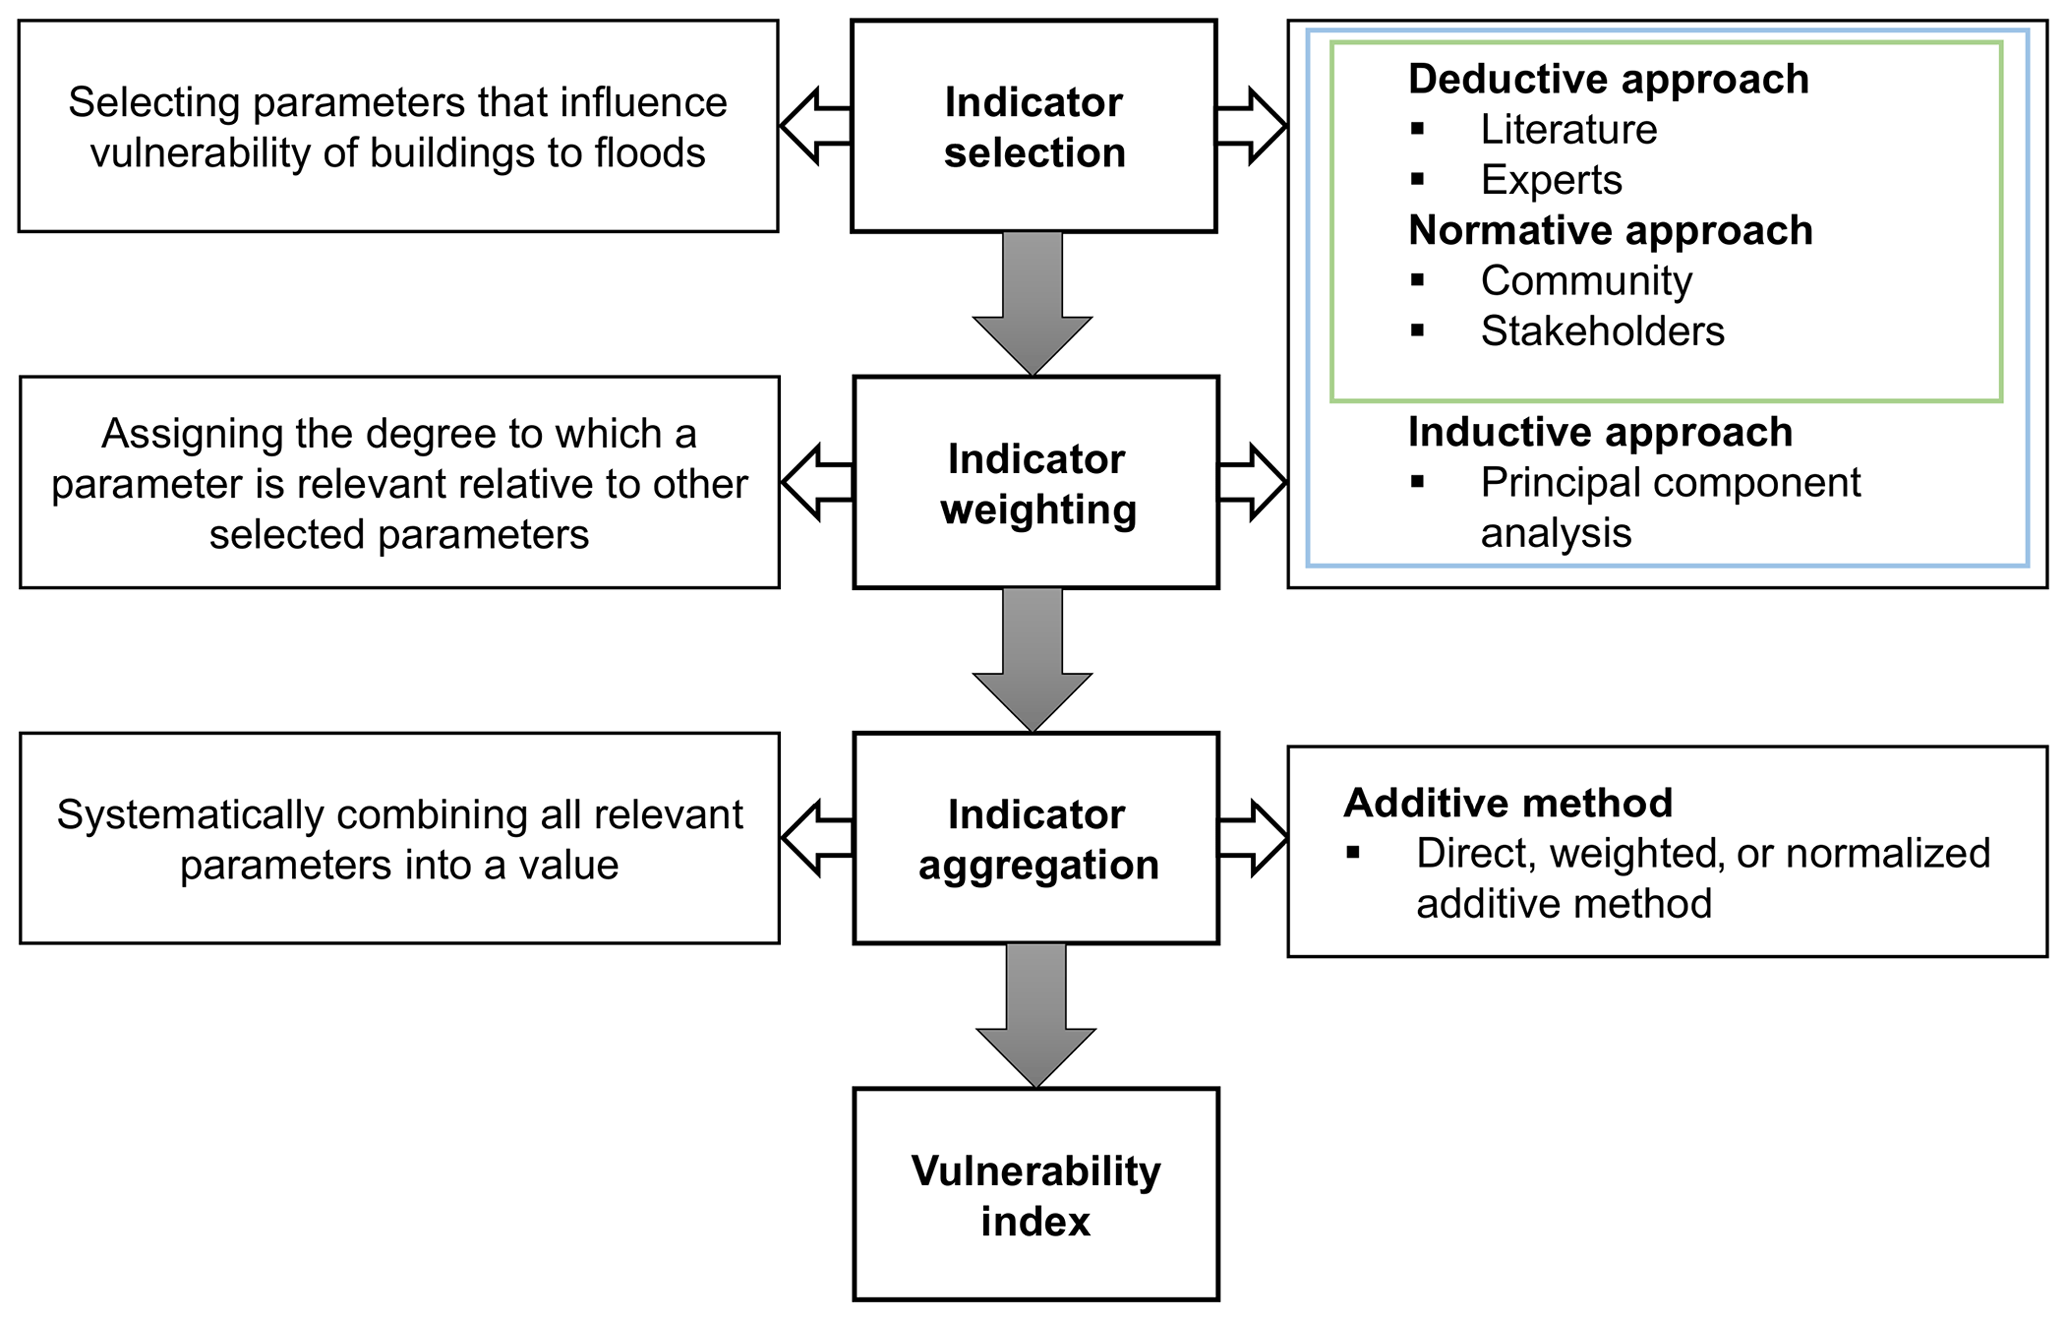
Figure 1Steps and commonly applied methods for developing a physical flood vulnerability index. Steps include the indicator selection, the indicator weighting, and the indicator aggregation. The green box applies to initial indicator selection, and the blue box applies to final indicator selection.
2.2.1 Indicator selection
Before a variable is qualified as an indicator, certain criteria have to be met to allow for consistency and methodical soundness. Important criteria for selecting a variable as an indicator include measurability, relevance, analytical and statistical soundness, etc. (see Birkmann, 2006, and JRC and OECD, 2008, for a complete list of criteria for indicator selection). The selection of vulnerability indicators can be categorized into two steps (cf. Table 1). In a preliminary step, an initial selection of a range of identified variables is carried out. This serves to identify all possible parameters that influence vulnerability within a region. As shown in Fig. 1, the preliminary selection is commonly carried out either using a deductive or normative approach. In the final step, the number of variables to be used for weighting or aggregation is reduced. The final selection can be based on data availability, statistical analysis, expert opinion, or other evaluation procedures. For example, Kienberger et al. (2009) reported a spatial vulnerability assessment tool using the indicator approach. In their study, expert knowledge was used for the preliminary selection of indicators. Thereafter, based on structured rounds of questionnaire evaluation, a final selection was made based on a Delphi approach. The Delphi approach utilizes several indicator suggestions from different experts and combines the suggestions after a consensus is reached through several rounds of questionnaire exchange. During the Delphi process, preselected indicators that are identified to be less relevant are removed in order to arrive at a set of more effective indicators.
2.2.2 Indicator weighting
After the selection of indicators, weights are assigned to allocate the extent to which each indicator is relevant with respect to the targeted vulnerability assessment. Prior to assigning weights to different indicators, a scoring is assigned for subcategories of indicators, for example, “building type” as an indicator can have “reinforced concrete”, “masonry” and “wooden” buildings as subcategories: we refer to these subcategories as sub-indicators. The scoring of these sub-indicators, which is a form of internal weighting, results in information of the vulnerability of the individual indicator. Both the scoring of sub-indicators and the weighting of indicators can be carried out using (i) deductive and (ii) normative approaches. Other approaches for weighting vulnerability indicators are the inductive methods based on empirical data (e.g. principal component analysis, PCA), which are excluded due to the data requirements in data-scarce regions. More details of the PCA are given in JRC and OECD (2008).
The deductive approach is based on research-based knowledge and conclusions of previous studies. The weighting is based on deduction or inference from frameworks, a set of concepts, or theories on vulnerability (Hinkel, 2011). Commonly applied deductive weighting includes direct expert weights, expert weights in combination with literature analysis and the application of an analytical hierarchy process (AHP) from expert knowledge.
Direct expert weights refer to weights assigned to indicators using the knowledge of experts either through questionnaires or interviews. A scheme of standardized weights (e.g. from 0 to 10) is provided for the weighting in order to maintain a comparable scale of weights from different experts. Some vulnerability studies therefore used weights from the literature in combination with expert knowledge to formulate new indicator weights. However, this is only possible if (i) the vulnerability of the region of interest has been previously studied or (ii) the region of interest is comparable (in building and hazard characteristics) to a previously studied region. Another commonly applied weighting method for physical vulnerability assessments is based on the analytical hierarchy process (AHP), a multi-criteria decision tool utilizing a pairwise comparison system (Saaty, 1980). The AHP assigns weights between pairs of indicators instead of evaluating each indicator relative to all other indicators. The pairwise comparison evaluates which indicator in every pair is more important than the other using a scale of 1 (equal importance) to 9 (extreme importance) (Chen et al., 2012). The decision on which indicator is more important can be evaluated from analysing data or expert knowledge. To ensure minimal subjectivity in a pairwise comparison, the consistency ratio (CR) is computed. The CR checks if the subjectivity of pairwise comparisons are within an allowable limit. If the condition of the CR is not fulfilled, a repetition of the process has to be carried out (Golz, 2016). Depending on the total number of indicators, the AHP can be computationally demanding.
Another form of weighting that is not very common in physical vulnerability assessments is the normative approach. Using the normative approach, weights can be assigned based on value judgement (Hinkel, 2011). The normative approach is based on the priorities of individuals. A common application of the normative approach is the equal-weighting approach. Meaning, based on value judgement, all parameters influencing vulnerability are taken to be equally important (Frazier et al., 2014). Adopting an equal-weights approach is sometimes required in cases where no consensus is reached on a suitable weighting alternative. In studies where multiple dimensions of vulnerability are considered, the equal-weights approach will favour dimensions with a higher number of indicators if an unequal number of indicators are used. However, such irregularities can be corrected by a systematic normalization. Furthermore, Chen et al. (2012) noted that the equal-weighting approach cannot properly handle indicators that are highly correlated because these are double-counted. Another implication of the approach, particularly at the aggregation step, was noted by Hinkel (2011): equal weighting means all indicators are ideal replacements of each other, and low values in one indicator can be compensated by high values in another indicator. Another example of the use of value judgement for weighting indicators was demonstrated by Müller et al. (2011), who focused on weighting preferences of homeowners.
2.2.3 Indicator aggregation
Indicator aggregation refers to a systematic combination (or joining) of indicator weights to create a single value. This value is usually referred to as an index. The index carries information on the extent to which an element can be impacted by a hazard relative to other elements, given the combined influence of selected indicators.Physical vulnerability assessment incorporates different types of indicators with non-uniform units, such as building material (no unit) and distance to the hazard source (metres). Therefore, before aggregating indicators, it is necessary to find a systematic and consistent means of representing the (sub-)indicators while retaining their theoretical range. Achieving a rather objective representation of different indicators is carried out by scaling. Asadzadeh et al. (2017) noted that the scaling of indicators is sensitive to the normalization and aggregation method; hence, it is important to adopt a scaling that fits the data and the overall vulnerability framework. In a physical vulnerability assessment, it is common to adopt the ordinal scale to represent both qualitative or quantitative (sub-)indicators. On the ordinal scale, indicators are represented using an increasing or decreasing categorical order. The order selected is mostly subjective depending on the indicator framework and data property (JRC and OECD, 2008). A good example of the use of the ordinal scale was demonstrated by Dall'Osso et al. (2009), where five categories were used to transform all (sub-)indicators into an ordinal scale.
Generally, several methods for indicator aggregation exist; however, a commonly applied method for physical vulnerability assessment is the additive method (see Table 1). This method is based on a summation of the product of the weights and scores (or the scaled value) of all selected indicators. The summation can be made directly on scores of the indicators (direct additive method) or after multiplying weights and the scores of the indicators (weighted additive method). The result of the indicator aggregation is influenced by the applied aggregation technique as some approaches allow counterbalancing indicators with low values (compensation). In the additive method, a constant level of compensation for indicators with lower values is allowed (JRC and OECD, 2008).
The last step in aggregating indicators is a normalization that ensures that the output from indicator aggregation lies within defined intervals. These intervals should be suitable to communicate the extent to which an element at risk is vulnerable relative to others. JRC and OECD (2008) pointed out that the choice of a normalization approach should be related to data properties and underlying theoretical frameworks. Although there are several normalization techniques, most studies in physical flood vulnerability assessment apply the minimum–maximum normalization. In the minimum–maximum normalization, index outputs are bound within a fixed range, commonly between 0 (not vulnerable) and 1 (highly vulnerable). The minimum–maximum normalization can increase the range of small-interval indicators or reduce the range of large-interval indicators. Hence, all indicators are allowed a proportionate effect on the aggregated index. Detailed descriptions of different normalization methods can be found in JRC and OECD (2008).
2.3 Challenges and gaps in physical vulnerability indicators and indices
Despite the current success in the development of physical vulnerability indicators, a few challenges persist. We identify these challenges for physical vulnerability indicators by focusing on the potential for developing indicator approaches in data-scarce regions and in order to foster adaptability, transferability, and harmonization of indicators across spatial and temporal scales.
Firstly, for the effective operationalization of an index in the vulnerability concept, there is a need for proper management of the underlying data. In many studies, data transformation methods (e.g. missing data, scaling and normalization) are either not mentioned or only briefly highlighted. Such data operations influence the index or model output considerably, as has already been demonstrated by several studies (e.g. UNDP, 1992; Tate, 2012; Mosimann et al., 2018; Chow et al., 2019), and thus data operations should be carried out using appropriate methods that fit the data type and indicator framework. During the indicator development, the following few points have to be clarified: (i) the relationship between indicators, (ii) scaling and normalization needed, (iii) necessary range of variables, and (iv) data quality and quantity.
Secondly, it is important to understand the sensitivity of the vulnerability index depending on the use of deductive, inductive, and normative approaches. So far, no detailed sensitivity analysis has been carried out focusing on physical vulnerability indicators, except for Fernandez et al. (2016), who have taken the first steps by analysing the sensitivity to different aggregation methods. JRC and OECD (2008), Tate (2012), and Papathoma-Köhle et al. (2019) have stressed the need for such internal validation to assess the robustness of indices and evaluate the influence of each approach on the index stability. Such analysis can convey information on the suitability of different approaches for specific datasets, and hence provide useful guidance for further indicator development.
Furthermore, after developing the vulnerability index, it is important to assess how well the index performs by using hazard impact metrics such as building damage or monetary loss data. However, in physical vulnerability assessment, index performance evaluations have only rarely been carried out (Eriksen and Kelly, 2007; Müller et al., 2011). A performance test will allow robust evaluation of underlying indicator frameworks and basic assumptions (Eddy et al., 2012) and will also identify the suitability of selected indicators with respect to the indicator aim (Birkmann, 2006). Few studies, however, provide a qualitative description (e.g. level of agreement), as is the case for performance analysis using a comparison of the deduced index and observed damage data (e.g. Godfrey et al., 2015; Sadeghi-Pouya et al., 2017) or based on visualizations of the spatial agreement using GIS maps by comparing hotspots and observed damage (e.g. Fernandez et al., 2016). In general, a lack of a performance test might be due to (i) the scarcity of empirical data and (ii) the lack of a systematic linkage between the vulnerability index and building damage or monetary loss.
Furthermore, vulnerability indices have been identified to lack a stand-alone meaning outside a relative comparison of building vulnerability (Tarbotton et al., 2012; Dall'Osso and Dominey-Howes, 2013). This is a major limitation given the quality of information contained in the vulnerability index. Further investigation on the additional applicability of the vulnerability index should be carried out. Papathoma-Köhle et al. (2017) recently recommended a combination of methods to fully explore the potential in individual vulnerability assessment methods. Such a combination is particularly encouraged for data-scarce regions.
Flood damage models show the relationship between the extent of building damage and damage-influencing (or vulnerability-influencing) factors. First, we focus on an analysis of background information of flood damage models and the application and used methods. Second, we will identify the challenges and current gaps in the context of data-scarce regions.
3.1 Background
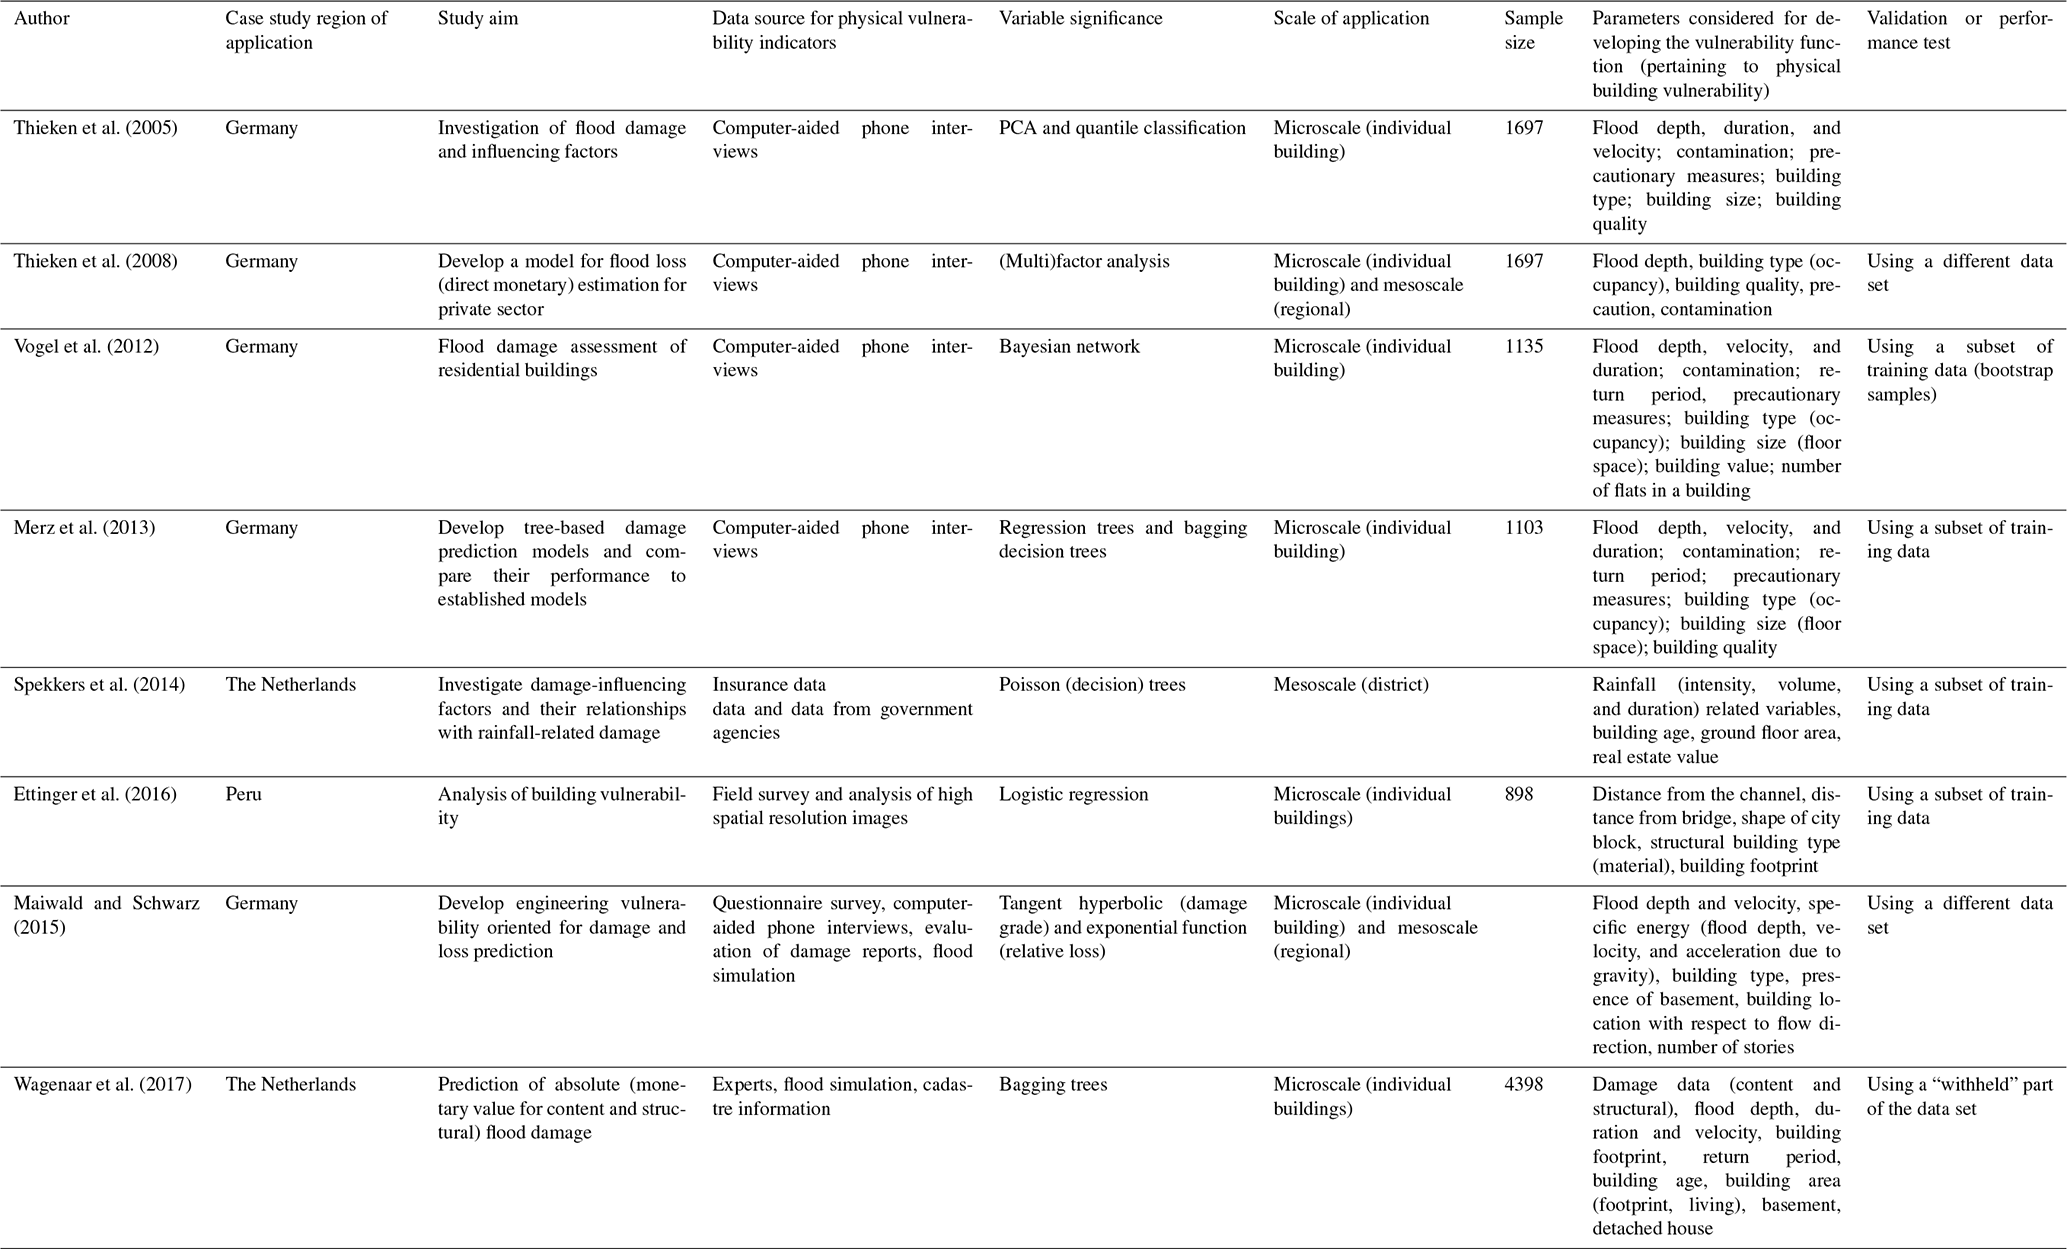
Flood damage models provide the basis for decision-making through multiple applications, such as cost-benefit analyses of mitigation measures (Thieken et al., 2005; Schröter et al., 2014), economic impact assessments (Jongman et al., 2012), planning and implementation of individual mitigation measures (Walliman et al., 2011), and flood risk mapping (Meyer et al., 2012). In general, developing flood damage models require clear communication of model parameters, e.g. if the model is based on an individual damage parameter (stage–damage curves) or if the model is comprised of multiple damage-influencing parameters (multivariate methods). Further important information includes data source and sample size, method of analysis to extract the significance of variables, the scale of application, damage-influencing parameters, and status of the validation or performance test. The different choice of parameters and methods considered within the flood damage models already sets the conditions regarding the model transferability and guide further model development. In Table 2, we highlight these parameters for several studies.
Table 2Applications of flood damage models, indicating the data source, the approach for evaluating variable significance, the scale of application, the parameters needed for developing the vulnerability function, and, where appropriate, the validation or performance test (PCA stands for principal component analysis).
Stage–damage curves are continuous curves relating to the magnitude of a hazard process (x axis) to the damage state of a building (y axis), usually expressed as the degree of loss (Fuchs et al., 2019a). Individual buildings are represented as points in the x–y-axis system and then the function that ensures the best fit may be chosen (Totschnig et al., 2011). Empirically developed stage–damage curves are widely used for assessing flood hazard risk where the number of affected buildings is large enough to deduce a reliable curve (Fuchs et al., 2019a). The shape of the empirically derived stage–damage function depends on the population and spread of data related to buildings within the inundation area under consideration, as well as the type of function chosen. Synthetic stage–damage curves are based on expert knowledge to describe a relationship between flood damage with flood depth for a specific building or land use type. Synthetic curves can be developed independently (e.g. Penning-Rowsell et al., 2005; Neubert et al., 2008; Naumann et al., 2009) or supported by empirical data (e.g. NRE, 2000). For data-scarce regions, utilizing the synthetic (what-if) analysis can serve as an important first step for establishing flood damage models. More details on the synthetic what-if analysis are given by Penning-Rowsell et al. (2005), Neubert et al. (2008), and Naumann et al. (2009).
Multivariate methods utilize empirical data to relate multiple damage-influencing variables and building damage by applying a variety of statistical methods (see Table 2). Such empirical data can be collected from insurance companies (e.g. Chow et al., 2019), through field surveys (e.g. Ettinger et al., 2016), or via telephone interviews (Thieken et al., 2005; Schwarz and Maiwald, 2008; Maiwald and Schwarz, 2015). As demonstrated by Cervone et al. (2016), empirical data can also be collected using social media accounts. Multivariate models may become more common in the near future since they offer a more comprehensive approach compared to the stage–damage curves. Schröter et al. (2014) evaluated the applicability of flood damage models and showed that models that consider a higher number of damage-influencing variables demonstrated superiority in predictive power both spatially (transfer to other regions) and temporally (different flood events). The multivariate method has been shown to better explain the variability in damage data (Merz et al., 2004) and reduce uncertainty in flood damage prediction (Schröter et al. 2014).
3.2 Application of flood damage models
The applications of both stage–damage curves and multivariate methods vary depending on the user requirements. These user requirements may range from estimating damage grades (e.g. Ettinger et al., 2016), estimating absolute or relative monetary loss (e.g. Thieken et al., 2008), or both (e.g. Maiwald and Schwarz, 2015). In particular, the use of damage grades is especially encouraged for data-scarce regions since it relies only on observable damage patterns within a region and expert knowledge. In addition, damage grades are easily understandable by experts and non-experts, making them easy communication tools (Attems et al., 2020a). One of the most prominent damage grades is the European Macroseismic Scale EMS-98 for earthquakes (Grünthal, 1998), which was later used as a basis to develop damage grades for flood hazards by Schwarz and Maiwald (2007).
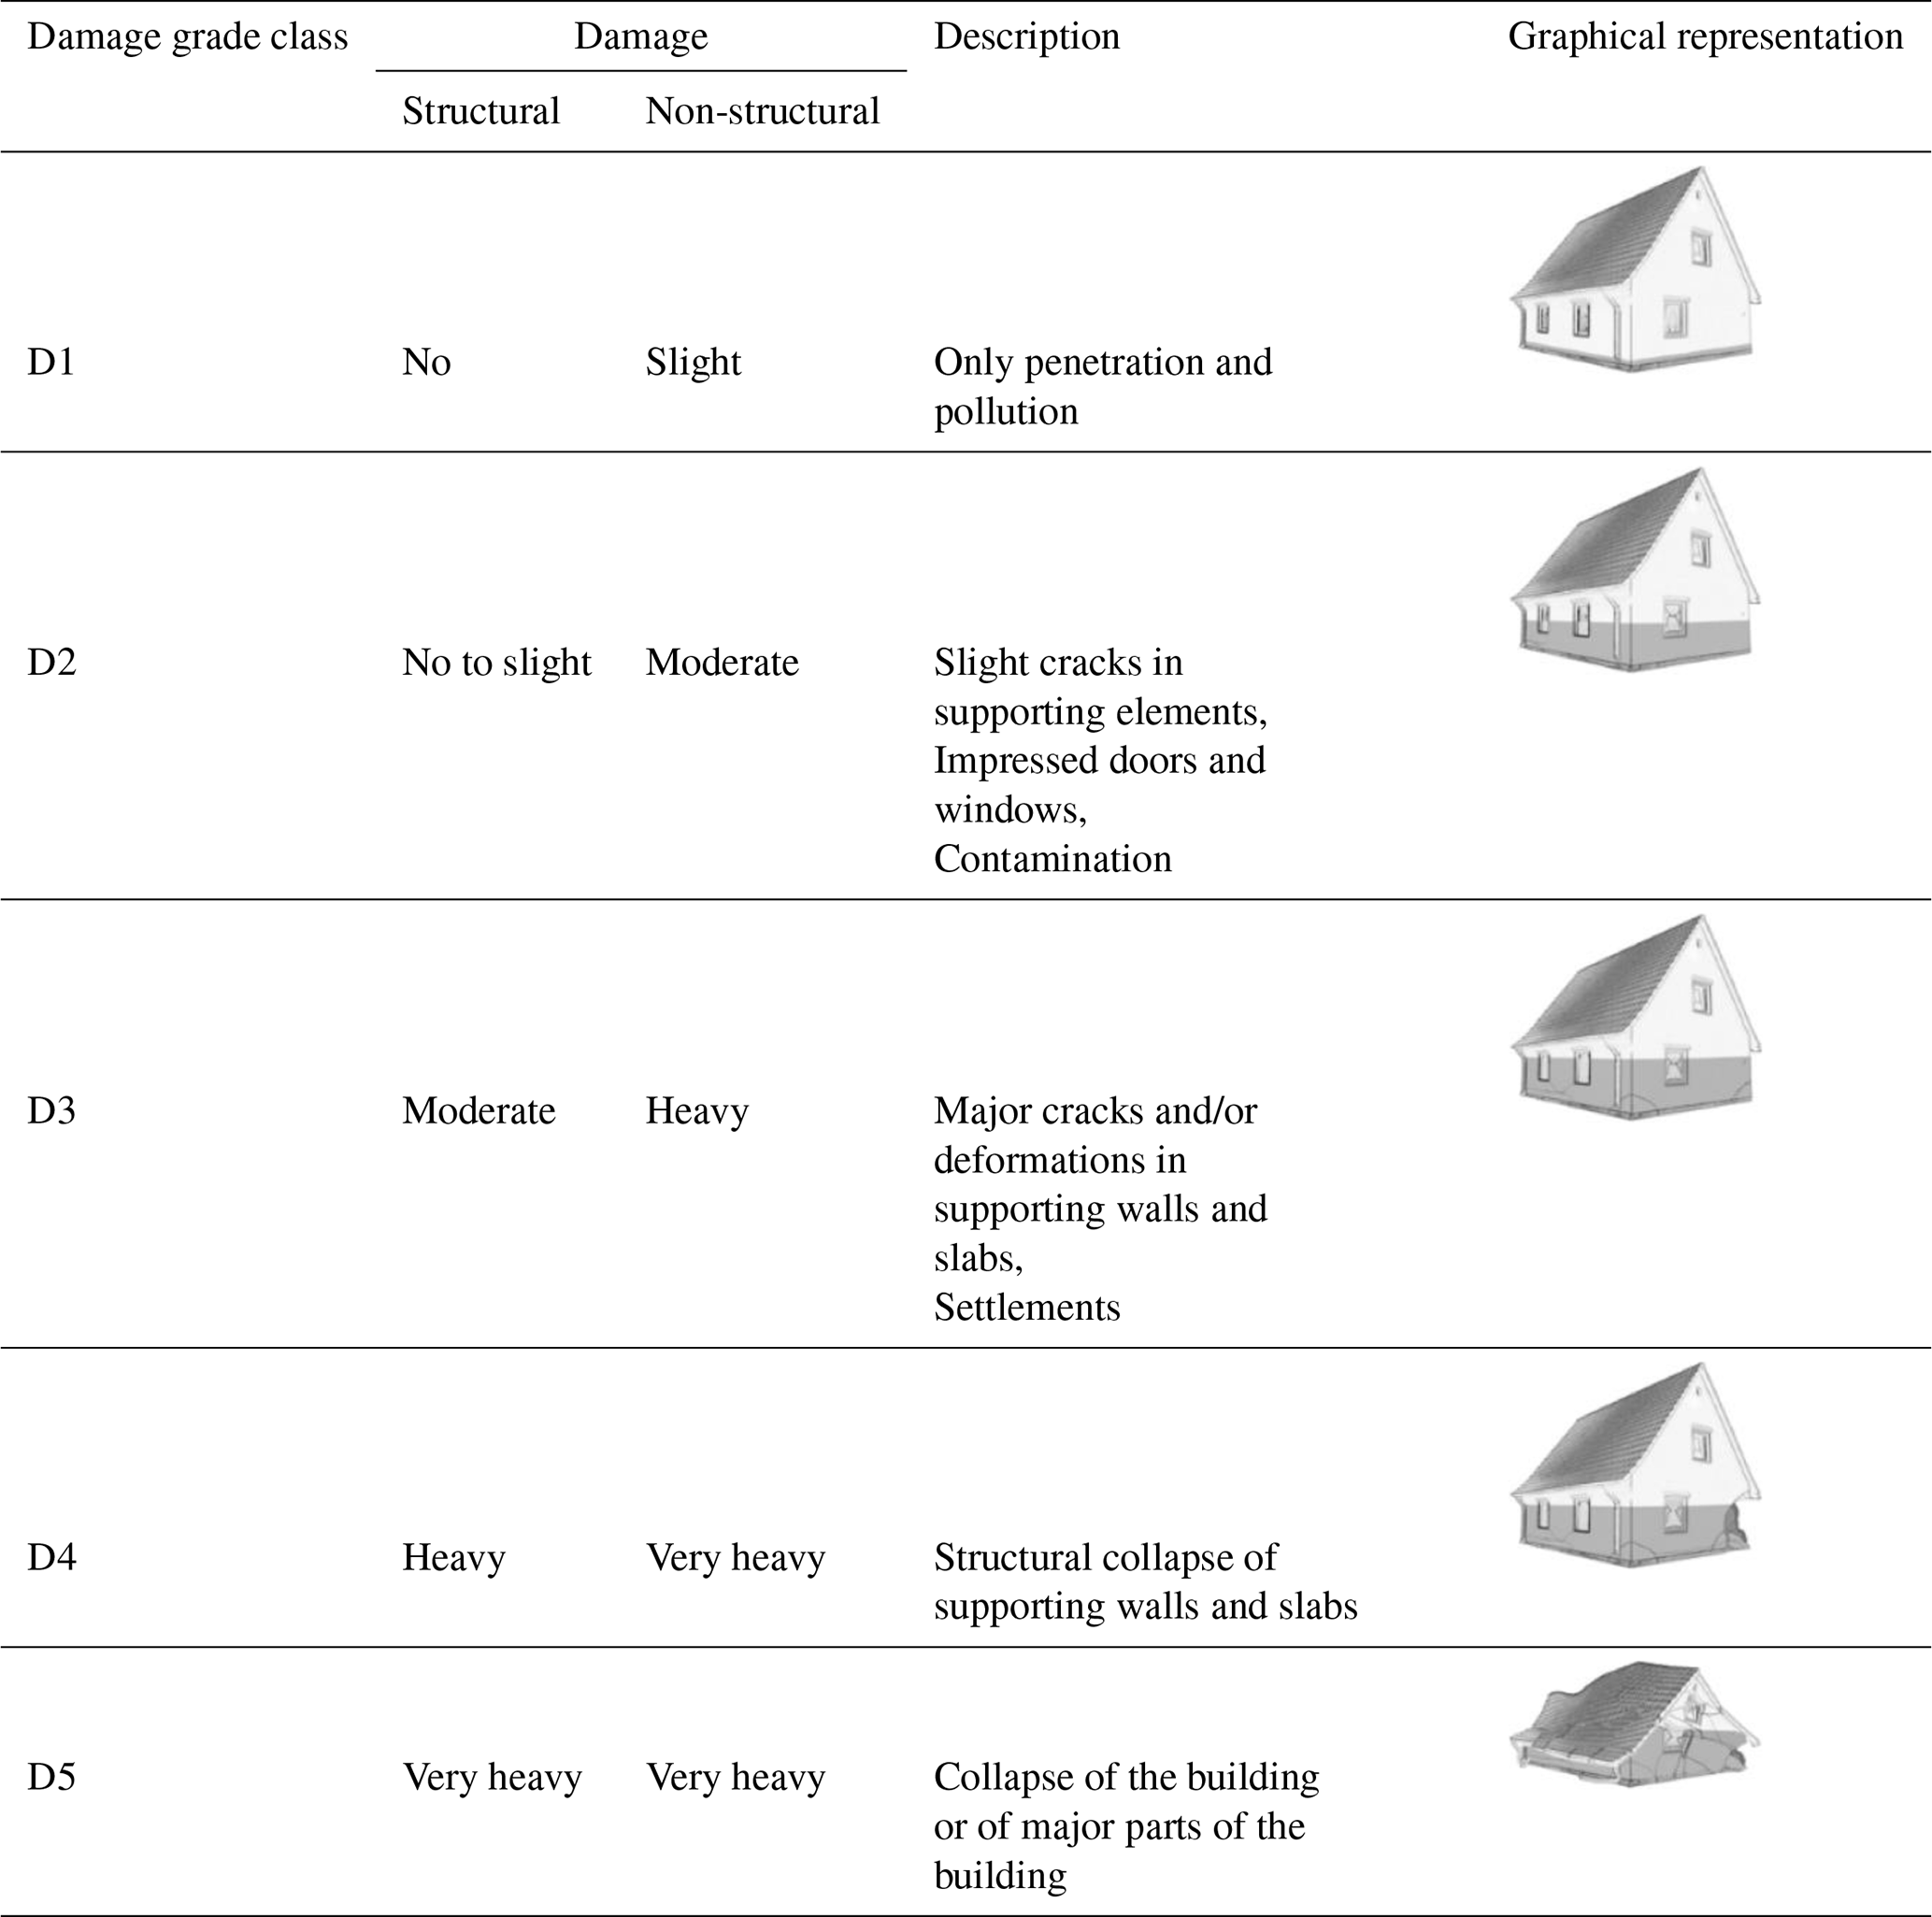
Developing a damage grade requires data (or knowledge) of regional building damage patterns resulting from flood impact. Damage patterns, which are repeatedly observed within a region, can be categorized into damage grades (Schwarz and Maiwald, 2007). Grünthal et al. (1998) and Maiwald and Schwarz (2015) noted that damage grades should not only consider the physical effects of damage but also the number of buildings that show such effects. Hence, in developing damage grades, the focus should be given to both physical damage features and their corresponding proportion. Damage grades express frequently observed damage patterns as categories on an ordinal scale, whereby numbers are assigned to each damage pattern with higher numbers depicting a higher degree of damage (see Table 3). Damage grades vary from non-structural to structural damage. Non-structural damage refers to damage that does not immediately affect the structural integrity of a building. Examples of non-structural damage by floods include moisture defects or light cracks on building finishes. Structural damage mostly occurs on load-bearing elements of the building, for example, cracks in or collapses of walls, beams, and columns (Milanesi et al., 2018).
Table 3Damage grades developed by Schwarz and Maiwald (2007) showing structural and non-structural damage to buildings. For each damage grade class, a description and a graphical representation are shown. The grey colour in the graphical representation indicates flood depth.
Generally, there is a wide range of damage patterns available to describe how buildings respond to flood impact. However, including all of these patterns will lead to unnecessarily complex flood damage models. Nonetheless, damage grades should be detailed enough to capture predominantly observed patterns of damage within a region. In such a way, damage grades serve as a compromise between comprehensiveness and simplicity (Blong 2003b). Grünthal (1993) recommended guidelines for good practice in developing damage grades, including (i) checking a wide range of information sources and considering their value, (ii) focusing more on repetitive damage than on extreme damage patterns, and (iii) additionally considering undamaged buildings. As an additional recommendation, Blong (2003b) suggested that damage models should be flexible enough to allow integration of new damage patterns over time. An example of such flexibility is demonstrated in Maiwald and Schwarz (2015, 2019) when expanding an originally five-category damage grade scheme to a six-category scheme. Damage grades are not affected by temporal changes (increase or decrease) in market value or wages, which can affect relative and absolute losses (Blong, 2003a). Due to this robustness to changes, they are easily transferable to regions with comparable building and hazard characteristics. This transferability is particularly important for data-scarce regions, where resources are limited for comprehensive data collection campaigns. Other characteristics of damage grades include simplicity, clarity, reliability, robustness, and spatial suitability (Blong, 2003b).
3.3 Challenges and gaps in flood damage models
Predicting damage grades using commonly applied stage–damage curves and multivariate methods has some weaknesses. These weaknesses are either manifest in both data-rich and data-scarce regions or specific to the latter. For example, despite the wide usage of stage–damage curves, several studies have highlighted inherent uncertainties particularly regarding damage predictions since they consider flood depth as the only damage-influencing parameter (e.g. Merz et al., 2004, 2013; Vogel et al., 2012; Pistrika et al., 2014; Schröter et al., 2014; Wagenaar et al., 2017; Sturm et al., 2018b, a; Fuchs et al., 2019b). These studies have demonstrated that flood damage is not only influenced by water depth but also by other hazard parameters (e.g. velocity and duration) and building characteristics (e.g. construction type, quality, and material). For instance, Merz et al. (2004) demonstrated the poor explanatory power of flood depth in explaining the variance in a data set. Although applying multivariate methods reduced uncertainties associated with models based on a single damage-influencing parameter, in data-scarce regions a disadvantage of the multivariate method is the lack of empirical data for developing and validating such models.
Several other challenges exist in data-scarce regions, which further limits the development of flood damage models. Merz et al. (2010) noted that selecting a method depends on data availability and knowledge of damage mechanisms. The absence of insurance against damage from natural hazards and effective government compensation schemes, typical for many data-scarce regions, contributes to a lack of data to support physical flood vulnerability assessment. For example, Komolafe et al. (2015) reported that no research institute or agency has a central database to document flood damage in many African countries, such as Nigeria. They further pointed out that such scarcity of damage data might be related to the fact that the practice of flood insurance is uncommon and government compensation after flood disasters is flawed. As such, people immediately repair their buildings after a flood event. Additionally, regulatory policies on building standards are less well implemented in many areas. Similar observations were made by Englhardt et al. (2019) in Ethiopia, pointing out a considerable difference in building quality and value, especially in rural areas. Also, in Nigeria, FGN (2013) reported that over 60 % of households acquire their houses through private resources and initiatives; thus, only a few use the services of formal institutions. This often leads to substantial differences in the quality of buildings, consequently increasing the challenges in developing building-type vulnerability assessment schemes. In addition, such differences in building quality further limit the application of flood damage models that use relative or absolute monetary losses due to a high range of replacement costs and property values.
A combination of damage grades (representing repeatedly observed damage patterns) with vulnerability indicators (capturing important damage-influencing variables within a region) using an expert-based what-if approach offers a convenient and comprehensive method for assessing flood damage. This allows us to tailor flood damage models to the specific needs of data-scarce regions and simultaneously to take advantage of the strengths of the methods while limiting their individual weaknesses.
Several weaknesses highlighted in Sects. 2.3 and 3.3 have limited the assessment of physical vulnerability. However, specific aspects of these approaches can be utilized for data-scarce regions. Although the vulnerability index has been identified as lacking a stand-alone meaning, its combination with damage grades will extend its applicability for damage grade prediction. Besides, the use of damage grades will help us to evaluate the performance of vulnerability indices. Current flood damage models were identified to be either data-intensive (multivariate methods) or to not consider other damage-influencing variables (stage–damage curves). However, an integration of damage grades with vulnerability indicators can provide a suitable model to overcome these challenges. This integration can be fostered through utilizing the expert-based synthetic what-if analysis, which has been applied for developing synthetic stage–damage curves.
To demonstrate the added value of this linkage, we use a combination of (i) observed flood damage data, (ii) a hypothetical physical vulnerability index for two regions A and B, and (iii) two flood damage models developed for predicting damage grades. The observed damage data (see Fig. 2) was documented from a field survey conducted after the 2017 flood event in Suleja and Tafa, Nigeria. The flood event was caused by prolonged rainfall for about 12 h between 8 and 9 July 2017. The flood event resulted in the loss of lives and damaged hundreds of buildings and a large amount of infrastructure (Adeleye et al., 2019). A field study was conducted in March 2018 in order to document damage to the built environment and to interview affected homeowners. From the documented cases, we use three buildings to illustrate the potential weakness that may occur from only using a vulnerability index approach and the added value of the suggested linkage with damage grades.
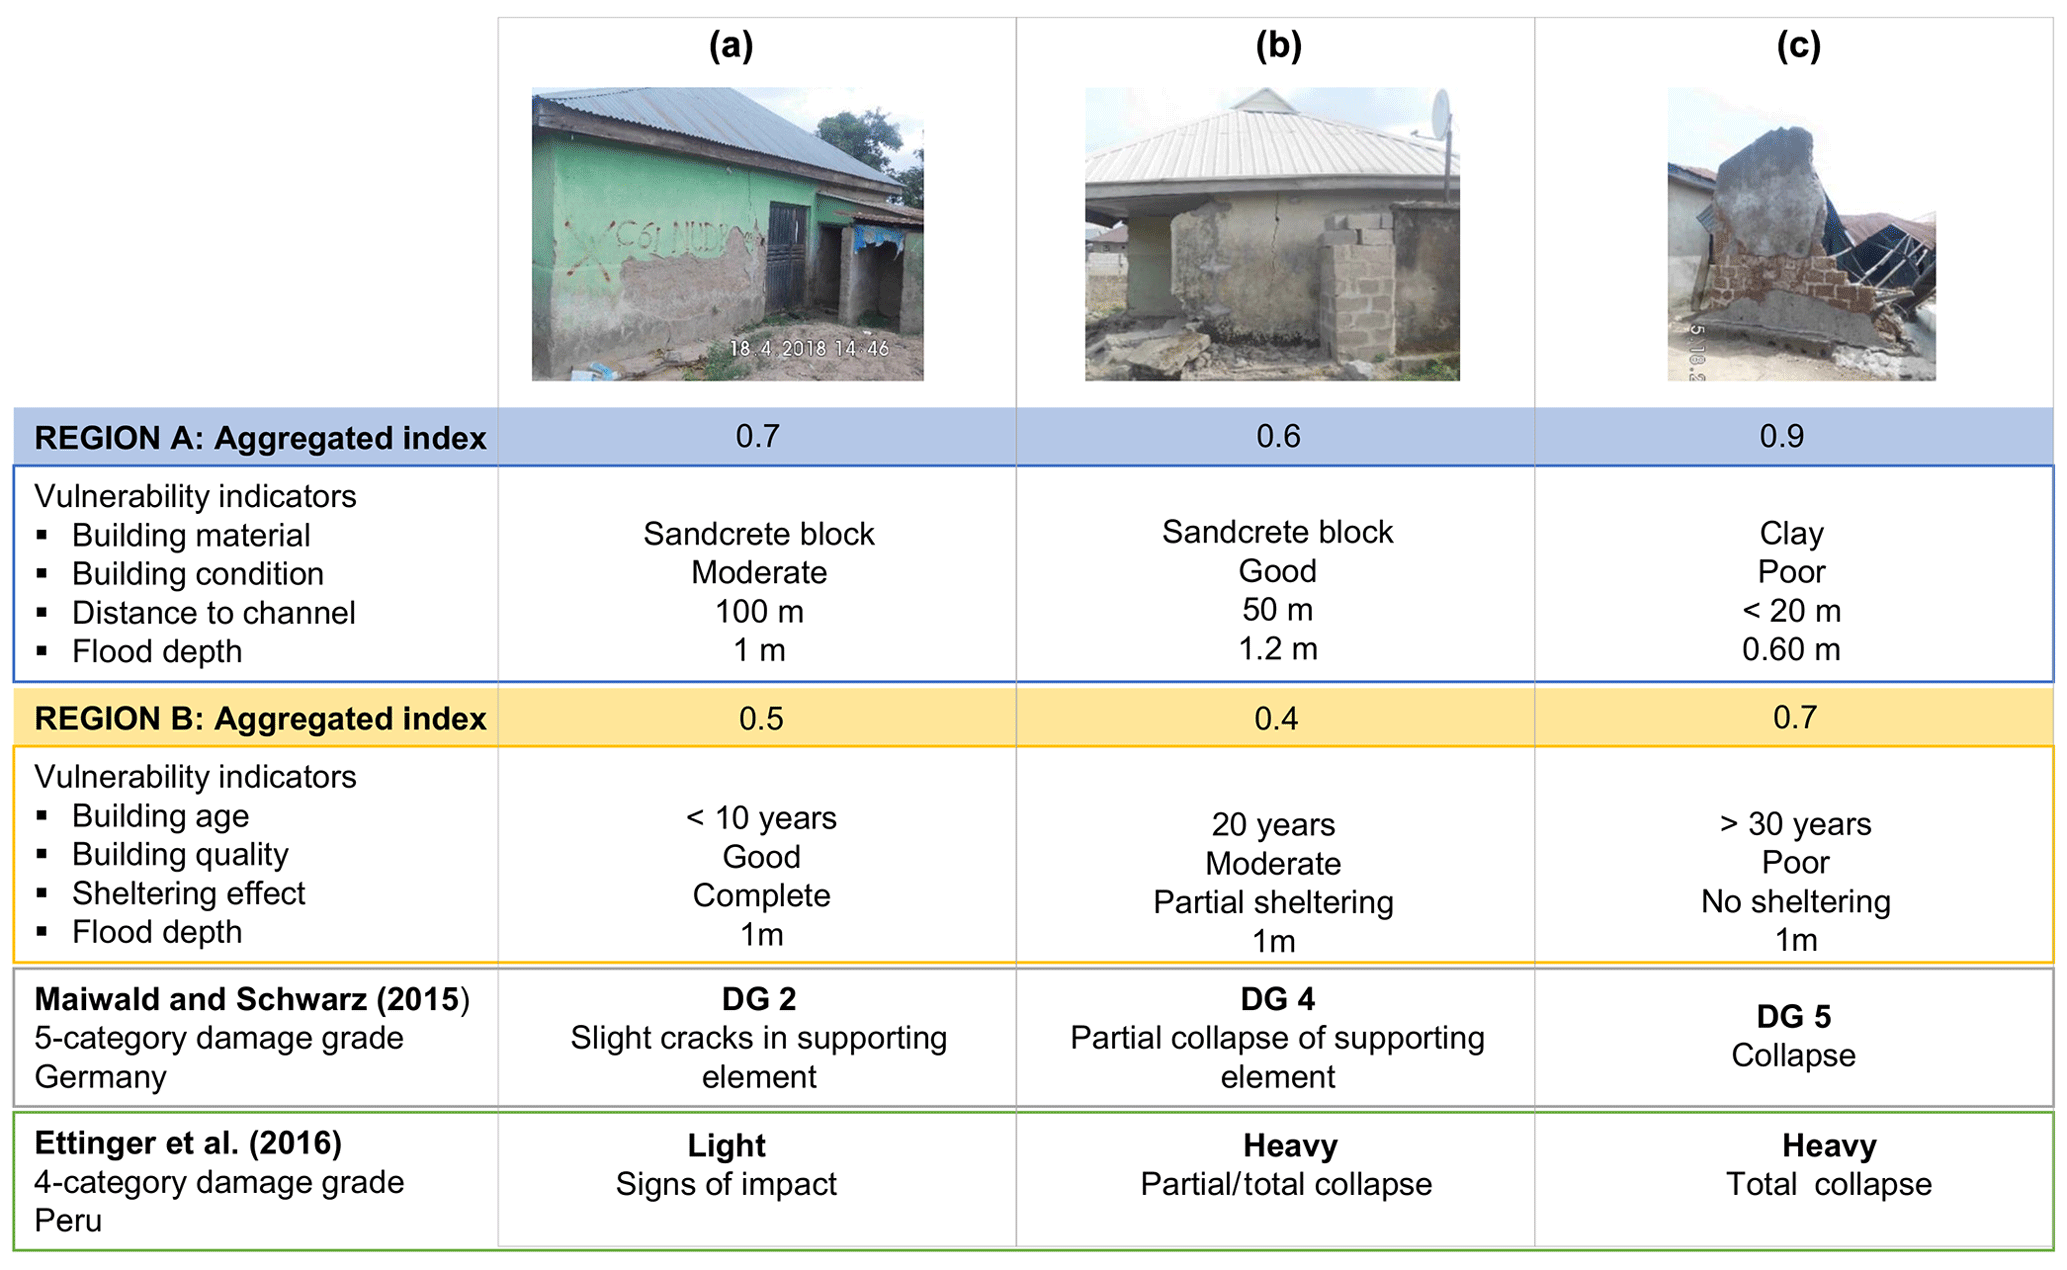
Figure 2Illustration of the need for linking vulnerability index and damage grades using real damage cases (a, b, and c) documented after a 2017 flood in Suleja and Tafa, Nigeria; hypothetical vulnerability indicators and regions (A and B); and damage grades developed from studies by Maiwald and Schwarz (2015) and Ettinger et al. (2016).
The three buildings shown in Fig. 2 are constructed from sandcrete block (Fig. 2, buildings a, b) and clay bricks (Fig. 2, building c). The buildings have different damage patterns, ranging from moisture defects on walls resulting in peeling-off of plaster material and slight cracks (e.g. building a), partial collapse of supporting walls (e.g. building b), and complete collapse (e.g. building c). A hypothetical physical vulnerability index is considered for the two regions A and B (see Fig. 2). In the two regions, hypothetical vulnerability indicators were assigned as the main damage-influencing parameters. Indicators for region A included building material, building condition, distance to channel, and flood depth. Indicators for region B included building age, building quality, sheltering effect, and flood depth. Vulnerability indices for regions A and B both express relative vulnerability from 0 (low vulnerability) to 1 (high vulnerability). Hypothetical vulnerability indices, after aggregating identified indicators, are given in Fig. 2. We further consider two damage grades presented by Maiwald and Schwarz (2015) for Germany and by Ettinger et al. (2016) for Peru. We use identified damage patterns on the buildings from the field study to assign a damage grade to each building.
From Fig. 2, we see that although we can use the developed index to identify which building is highly or moderately vulnerable within a region, we cannot compare the indices between different regions because they contain aggregated information from different parameters. However, in the case of damage grades, although they were developed in two different regions, qualitative descriptions of these grades can be used to assign damage grade classes for the identified damage patterns in buildings a, b, and c (Fig. 2).
A combination of physical vulnerability indicators and damage grades using the synthetic approach has a number of advantages for data-scarce areas.
- i.
Employing the synthetic what-if analysis to link damage grades and damage drivers allows us to overcome high empirical data requirements of the multivariate method. Consequently, the linkage will capture multiple damage-influencing variables. Also, using the damage grades will allow us to carry out performance checks on the effectiveness and robustness of selected vulnerability indicators.
- ii.
The linkage will enable us to compare consequences of flood hazards across spatial and temporal scales in data-scarce regions. Spatial comparability can be achieved through the identification of similar damage characteristics (Fig. 2) between regions with similar building types and hazard characteristics. Temporal comparability can be achieved by relating the severity of observed damage grades between different flood events since damage grades are not readily affected by market values or wages. In addition, using similar hazard scenarios, damage can be estimated and compared between regions while still considering individual damage drivers (Fig. 2).
- iii.
Since damage grades are physically observable features, the linkage will foster the provision of an easy communication tool for stakeholders and community residents about the consequences of hazards.
In this section, we present a new conceptual framework that aims to link physical vulnerability indicators and damage grades in order to make use of their individual strengths for data-scarce regions. We first provide background information on terminologies used within the framework and second present step-by-step details on how to operationalize the framework.

Figure 3The proposed conceptual framework, linking vulnerability indicators to damage grades so that vulnerability to the built environment can be better assessed in data-scarce regions. The framework consists of three consecutive steps (phases) from the vulnerability index development (assuming different building characteristics but similar hazard magnitudes) to the damage grades (assuming different building characteristics and changing hazard magnitudes) and finally an expert-based “what-if”-evaluation, leading to functions linking damage grades from phase II to building impact indices (BIIs) from phase I for each BRI class.
5.1 Background for operationalizing the new framework
Vulnerability indicators are used to capture damage-influencing variables, which include characteristics of flood hazard, the built environment, and its surroundings. Damage grades represent the physical consequences of hazard impacts on a building that depends on both hazard and building characteristics. Figure 3 shows the conceptual framework and the proposed approach for linking physical vulnerability indicators and damage grades, the terminology is given below.
-
Vulnerability. The degree to which an exposed building will experience damage from flood hazards under certain conditions of exposure, susceptibility, and resilience or local protection (adapted from Balica et al., 2009).
-
Impact (action) and resistance parameters. The framework considers two major damage-influencing parameters: action (impact) and resistance parameters. The action and resistance parameters have been identified by Thieken et al. (2005) and Schwarz and Maiwald (2007) as the primary classes of damage drivers. Impact (or action) parameters relate to the flood parameters comprising of hazard frequencies and magnitudes (Thieken et al., 2005). Resistance parameters are related to the predisposition of the building to suffer damage, either permanently (e.g. building material) or temporarily (e.g. measures for flood preparedness) (Thieken et al., 2005). In the framework, resistance parameters comprise elements of the building and its surroundings, which are divided into susceptibility, exposure, and local protection parameters.
-
Exposure. Refers to the extent to which a building is spatially or temporarily affected by a flood event (adapted from Birkmann et al., 2013). Exposure parameters include features of the natural and built environment that either increase or decrease the impact of floods on buildings, such as topography and distance to the flood source.
-
Susceptibility. Refers to the disposition of a building to be damaged by a flood event (adapted from Birkmann et al., 2013). Susceptibility parameters relate specifically to the structural characteristics of the building at risk, neglecting any effects of local protection measures that may provide flood protection.
-
Local protection. Refers to deliberate or non-deliberate measures that are put in place and can reduce the impact of floods on a building. These measures can be directly included in the building structure, e.g. elevation of the entrance door, or measures located in the immediate surrounding of a building. While many local structural protection measures may not be primarily constructed as a protection mechanism against floods, they reduce the impact of floods on a building (Holub and Fuchs, 2008; Attems et al., 2020b). In the context of this framework, a fencing wall will be an example of a local protection measure.
5.2 Operationalizing the framework
In order to operationalize the new framework, three phases are proposed: (i) developing a vulnerability index, (ii) developing a damage grade classification, and (iii) linking the vulnerability index to the damage grade classification.
5.2.1 Phase 1: developing a vulnerability index
We develop a vulnerability index aimed at systematically integrating damage-influencing parameters. These parameters represent vulnerability indicators or damage drivers adapted for a selected region. As a result, we structure indicators into impact and resistance parameters as shown in Fig. 3 (phase I). In order to allow an evaluation of how different components contribute to damage, we categorize resistance parameters into separate components, exposure, susceptibility, and local protection. Application of the method is aimed at the microscale level, however, it can be applied at meso- or macroscale if data are available. Generally, the selection, weighting, and aggregation of indicators are similar to the procedure discussed in Sect. 2.2. Since our focus is on data-scarce regions, we focus the framework on expert-based approaches.
Indicators are mainly selected using expert surveys. Where possible, experts should include individuals from different disciplines in order to have a wide-ranging assessment. Expert surveys are carried out by conducting standardized interviews using questionnaires. The main focus of the questionnaire is on asking each expert to identify parameters representing damage drivers within a region. A set of indicators can be identified and included in the questionnaire, with the support of a literature review. Experts can then either select from the suggested indicators or propose new ones. All variables suggested by experts at this step serve as preselected indicators.
Indicator (or parameter) weighting is carried out using an expert-based approach. Here, experts are asked to weight how each preselected variable influences damage. The weighting is carried out using a scale of influence table based on Saaty (1980), as shown in Table 4. Because the table by Saaty (1980) was originally used for making a pairwise comparison between two parameters, it was slightly modified so as to be used in weighting preselected parameters with respect to how they influence flood damage. The scale (Table 4) will help to bring consistency and comparability in weighting when using the framework. Using Table 4, experts can assign a certain influence (e.g. slight, strong) for each preselected indicator. For each parameter, a mean value of the assigned weights from all experts is calculated and checked based on Table 4. The mean value here represents the central value used to communicate how all the experts evaluate a parameter based on its influence on damage within a region. The mean weights for each parameter are used for the final selection of indicators. For example, a mean weight of 2 from Table 4 will infer that, on average, experts consider the parameter to have only a slight effect on damage. A decision has to be made on a threshold (e.g. 1, 2, or 3 from Table 4) for parameter inclusion for the final selection. The threshold will depend, however, on the specific need (e.g. level of accuracy) or aim (e.g. identifying major damage-influencing parameters) of the study. Only parameters included in the final selection will be used in the indicator aggregation step. Next, using mean values for each indicator that has passed the final selection, the AHP is implemented to determine indicator weights (see Sect. 2). For detailed information on the procedure for implementing the AHP, we refer the reader to JRC and OECD (2008) and Saaty (1980).
Table 4Table of influence for indicator weighting, ranging from slight influence of an indicator (1) to extreme influence (9) (modified from Saaty, 1980).

A normalized weighted additive method is used for aggregating indicators. As shown in Fig. 3 (phase 1), selected parameters for exposure are aggregated to derive a building exposure index (BEI). The BEI is a measure of the extent to which a building is likely to be damaged as a result of (i) the spatial location relative to the flood source and (ii) surrounding buildings. Indicators for susceptibility and local protection are aggregated to derive a building predisposition index (BPI). The BPI provides a measure of the extent to which a building is likely to be damaged based on the building characteristics and available protection measures. Both the BEI and BPI are aggregated to derive a building resistance index (BRI). The BRI measures expected resistance a building can offer at a specific degree of impact, given its predisposition and exposure. Hence, given the same degree of hazard impact, a building with a high BRI (high resistance) is expected to experience less damage compared to a building with a low BRI (low resistance). As pointed out earlier, a building-type vulnerability classification can be challenging in data-scarce areas. Therefore, we propose the use of the BRI to classify buildings into different resistance classes (e.g. low, moderate, and high). Such classifications of buildings into vulnerability categories have been shown to facilitate a better understanding of the distribution of damage data (Schwarz and Maiwald, 2008). Elements within the same vulnerability class are expected to experience similar damage when impacted by the same degree of hazard.
The last step in phase 1 is to utilize the additive model to aggregate flood hazard parameters (e.g. depth, duration) in order to derive a building impact index (BII). The BII is used to express the combined effect of hazard parameters on a building structure. The BII is computed using interview data collected after a flood event (Malgwi et al., 2020).
5.2.2 Phase 2: developing the damage grades
We adopt a slightly modified procedure outlined in Naumann et al. (2009) for developing damage grades. Figure 3 (phase II) shows the systematic steps for developing the damage grades using an expert-based approach. The main aim of this step is to identify commonly observed damage patterns within a region and categorize them into classes. As such, basic outputs of this phase are classes of different damage patterns ordered into damage grades.
Sourcing for damage patterns within a region is carried out by analysing observed damage data or by structured interviews with experts or community residents. Such structured interviews are undertaken using questionnaires in flood-prone communities. Community residents or experts are asked which damage patterns are observed after flood events. They are also asked about how frequently these observed patterns occur after floods. In addition, questions about which damage types are usually repaired (or replaced) after flood events can be asked. From such information, the original damage can be deduced. Other sources of information are literature reviews, reviews of damage reports, news, and social media (videos and images). Such a wide range of information sources is particularly encouraged by Grünthal (1993) in order to have a comprehensive damage grade classification. Attention should also be given to the proportion of buildings observed to exhibit each damage grade (Grünthal, 1993). The damage grades should not focus on isolated (uncommon) damage patterns, instead more attention should be given to frequently observed patterns.
We present an overview of a synthetic method for developing a damage grade as described by Naumann et al. (2009). The necessary steps are as follows.
- i.
Identification of building types and building representatives. A first step for developing a flood damage model is to assess building types within a region and select building representatives (Walliman et al., 2011; Maiwald and Schwarz, 2015). The assessment of building types can be carried out based on field surveys, expert surveys or remote sensing. Where a large-scale building assessment is required, a method conceptualized by Blanco-Vogt and Schanze (2014) for semi-automatic extraction and classification of buildings can be applied. The representatives should include building types (material, form of construction and quality) that are predominant within a region. Additionally, Naumann et al. (2009) noted other attributes used for classifying buildings, these include the period of construction and the original use, the characteristic formation of buildings, and spatial patterns and geometry. In the framework, we use the BRI for classifying buildings into different categories since it ideally captures parameters that influence damage. A suitable classification for the BRI is a generic categorization into “low BRI”, “moderate BRI”, and “high BRI” classes (Fig. 3, phase II). The class represents buildings that will offer a low (low BRI), medium (moderate BRI), and good (high BRI) resistance if we consider the same impact magnitude. Such a generic building classification, which is not building-type based, is especially suitable in areas with a high variability in building quality. From each BRI class, a representative building is selected. Suitably, these representatives can be selected from different building types and should communicate the typical characteristics of buildings in the BRI class.
- ii.
Identification and grading of regional damage patterns. Flood damage to buildings can be generally categorized into three major parts, these include water penetration damage (moisture), chemical damage (pollution and contamination), and structural damage (Schwarz and Maiwald, 2007; Walliman et al., 2011). These three general damage categories can serve as a basis for developing further damage classification in regions where such damage assessment was not previously carried out. For each BRI representative, different patterns of damage are identified. Patterns that are repeatedly observed are indications of a damage grade category (Maiwald and Schwarz, 2015). Where the damage patterns for different representatives are the same, a single damage grade scheme can be adopted. However, where the damage patterns are substantially different, the damage grade is adapted for each BRI representative. This step ensures that predominant building and damage types are considered.
In the next step, identified damage patterns are assigned to a scale representing the degree of damage severity. A commonly applied scale for damage grades is the ordinal scale (e.g. Table 3). The ordinal scale provides suitable classes for damage grades since the intervals between different categories are not consistent. For example, in Table 3, the difference in severity between damage grades 1 and 2 is not the same as between 2 and 3. Minimum damage (usually water contact with external walls or water penetration) and maximum damage (complete collapse or washing away of a building) have to be decided. Additionally, a decision has to be made on how many damage grades to consider. As pointed out earlier, a balance has to be set between comprehensiveness and simplicity. Where difficulties exist in deciding which damage grade is of higher or lower severity, local technicians or other persons with building construction expertise can be asked to estimate the repair cost for each damage grade. In this case, a high repair cost will infer a higher damage grade.
5.2.3 Phase 3: expert “what-if” analysis
With a focus on data-scarce regions, we present steps to link damage-influencing variables (from phase 1) and predominant damage patterns (from phase 2). Expert knowledge is utilized to predict damage grade(s) for each representative building type (BRI class) using synthetic flood depths. The synthetic flood depths will represent scenario-based flood depths that are typical for a region. Intervals for synthetic flood depths are integrated using the BII (Fig. 3).
In the what-if analysis, expert knowledge of regional flood damage mechanisms is crucial. Based on a given flood depth, experts propose a probable damage grade for a specific building type. Estimating a single damage grade for a given water depth can result in uncertainties. Therefore, we propose the use of three probable damage states to capture the range of possible damage. Figure 3 (phase III) shows an idealized curve depicting the relationship between damage grades, BII, and BRI. The methodical steps for linking damage grades with the BRI and BII were adopted from and modified following Naumann et al. (2009) and Maiwald and Schwarz (2015). Steps for the linkage include the following processes.
- i.
To develop suitable intervals for the BII, such as flood depths in steps of 0.5 or 1 m intervals.
- ii.
For each defined interval of BII, local experts estimate the expected damage for each BRI class. Experts should provide three possible damage grades for each BII interval. The possible damage grades should include (i) most probable damage grades, (ii) lower probable damage grades, and (iii) higher probable damage grades. As an example, if a representative building type (e.g. one-story sandcrete block building) is selected from the BRI category “low resistance”, experts will estimate for each BII interval (e.g. 1 m water depth) the damage to be expected. Such damage estimates can be (i) most probable: slight cracks on supporting walls; (ii) lower probable damage: only water penetration; and (iii) higher probable damage: heavy cracks on supporting walls.
- iii.
For each BRI class, a suitable curve is used to join most probable, lower probable, and higher probable damage for all BII values, as exemplified in Fig. 3 (phase III).
With increasing magnitudes and frequencies of floods, assessing the physical vulnerability of exposed communities is crucial for reducing risk (UNISDR, 2015). The success of risk reduction methods is even more critical for data-scarce areas, which are mostly developing countries with limited capacity to cope with flood risk (UNDRR, 2019). Mitigating flood risks on the built environment requires knowledge of flood characteristics, building typology, and damage mechanisms so that viable predictions can be carried out for damage grades and monetary loss. Physical vulnerability assessment includes the identification of major damage drivers and the evaluation of possible damage to exposed buildings. For data-scarce regions, such a vulnerability assessment, which can be adapted to regional building types, may serve as a first step in overall risk reduction.
Taking up this challenge, we presented reviews and concepts for assessing the physical vulnerability of buildings exposed to flood hazards. Furthermore, we proposed linking approaches with reduced data requirements. Two approaches were considered: (i) the vulnerability indicator method, which is used for identifying regional damage drivers, and (ii) the damage grades approach, used for classifying commonly observed damage patterns.
The review provides a state of the art in physical vulnerability assessment, particularly in expert-based methods, and can serve as a useful information source for further studies with only a limited quantity of empirical data available. We identified the following specific challenges for a further development of these approaches in data-scarce regions: applying vulnerability indicators and indices needs (i) proper data management according to the chosen indicator framework, (ii) a general improvement of sensitivity analysis with respect to vulnerability indices to foster insights for further indicator development, and (iii) an application of performance tests of vulnerability indices and the linkage between the index and the underlying building damage. The application of flood damage models is strongly limited by the lack of data for the validation of stage–damage curves and thus reducing the high uncertainty of this approach in general. Furthermore, basic information on building types or building quality and damage due to floods is not systematically documented and therefore limits the development of flood damage models. Based on the identified challenges and limitations of different vulnerability methods, the proposed conceptual framework further suggests linking the vulnerability indicator method to the damage grades method using an expert-based approach. Combining these methods has been identified as a useful way to enhance the utility and robustness of individual physical vulnerability assessment methods while limiting their weaknesses. The combination of different vulnerability assessment methods was suggested by different scholars (e.g. Papathoma-Köhle et al. 2017) but extended application is still outstanding.
The proposed framework focuses on enhancing regional adaptability of physical vulnerability assessment methods and fostering model transfer between different data-scarce regions. Three phases are required to operationalize the framework, (i) developing a vulnerability index, (ii) identifying predominant damage grades or patterns, and (iii) carrying out a what-if analysis to link identified flood characteristics to damage grades for each category of building resistance.
In developing the vulnerability index, we considered hazard parameters (BII) and variables relating to the characteristics of a building and its surroundings (BRI). The BRI aggregates information on exposure, susceptibility, and local protection of a building, and hence connects the resistance of a building relative to other buildings assuming the same hazard magnitude. The proposed classification of the BRI is not based on building types (e.g. Maiwald and Schwarz, 2015) but is instead a classification based on aggregated information on exposure, susceptibility, and local protection, such as property-level adaptation measures (Attems et al., 2020b). We recommend such a generic classification of building types (e.g. low, moderate, high resistance) especially in regions with high variation in building quality (Englhardt et al., 2019). Systematic documentation of regional building damage patterns is required for the framework so that frequently observed damage patterns (e.g. moisture defects, cracks on supporting elements, partial collapse, complete collapse) can be integrated into a damage grade classification. As the framework is not case study sensitive, damage categories from other studies can provide a useful basis for categorizing damage grades. Furthermore, expert-based what-if analysis is used to assign identified damage grades to each interval of the BII. Where empirical data are available, even in limited quantity, they should be used to support the what-if analysis. In particular, the potential of citizen-based data sources, such as information taken from interviews or social media, offers a good opportunity for damage data collection (e.g. using Twitter Cervone et al., 2016 or Facebook Sy et al., 2020). The framework is fully expert-based and flexible, allowing vulnerability indicators and damage grades to be updated when new post-flood data become available. Consequently, curves generated between BII, BRI, and damage grades can be continuously updated over time. In this way, the new framework allows temporal changes in damage drivers to be integrated. We further recommend the application of the new framework to evaluate and compare model performance with a data-driven multivariate model. Such an analysis will communicate the success of the framework and also allow for further improvement. Based on the modular structure of the framework, it has the potential to be adapted for different environments, hazard types, and vulnerability types.
Table A1Overview of common elements for framing the vulnerability indicator approach for flood hazards, indicating the hazard type and vulnerability dimensions, the implementation in the risk cycle, the scale, the index output, and the data source (PTVA is the Papathoma-Koehle vulnerability assessment model).
No datasets were used in this article.
MBM designed the study with the support of MK. MBM was responsible for data collection, analysis, and literature review; MK and SF supported with the literature review and analysis. All authors were jointly involved in manuscript preparation and editing.
Margreth Keiler and Sven Fuchs are members of the Editorial Board of Natural Hazards and Earth System Sciences.
This study is carried out within the framework of a PhD scholarship funded by the Swiss Government Excellence Scholarships for Foreign Scholars (ESKAS). Thanks to Candace Chow for useful inputs in formulating Fig. 2. We would like to thank the two anonymous referees for their insightful comments on an earlier version of the paper.
This research has been supported by the Swiss government excellence scholarship (grant no. 2017.1027).
This paper was edited by Animesh Gain and reviewed by two anonymous referees.
Adelekan, I., Johnson, C., Manda, M., Matyas, D., Mberu, B., Parnell, S., Pelling, M., Satterthwaite, D., and Vivekananda, J.: Disaster risk and its reduction: an agenda for urban Africa, Int. Dev. Plan. Rev., 37, 33–43, https://doi.org/10.3828/idpr.2015.4, 2015.
Adeleye, B., Popoola, A., Sanni, L., Zitta, N., and Ayangbile, O.: Poor development control as flood vulnerability factor in Suleja, Nigeria, T. Reg. Plan., 74, 23–35, https://doi.org/10.18820/2415-0495/trp74i1.3, 2019.
Akukwe, T. I. and Ogbodo, C.: Spatial analysis of vulnerability to flooding in Port Harcourt metropolis, Nigeria, SAGE Open, 5, https://doi.org/10.1177/2158244015575558, 2015.
Asadzadeh, A., Kötter, T., Salehi, P., and Birkmann, J.: Operationalizing a concept: The systematic review of composite indicator building for measuring community disaster resilience, Int. J. Disast. Risk Re., 25, 147–162, https://doi.org/10.1016/j.ijdrr.2017.09.015, 2017.
Attems, M.-S., Schlögl, M., Thaler, T., Rauter, M., and Fuchs, S.: Risk communication and adaptive behaviour in flood-prone areas of Austria: A Q-methodology study on opinions of affected homeowners, PLoS one, 15, e0233551, https://doi.org/10.1371/journal.pone.0233551, 2020a.
Attems, M.-S., Thaler, T., Genovese, E., and Fuchs, S.: Implementation of property level flood risk adaptation (PLFRA) measures: choices and decisions, WIREs Water, 7, e1404, https://doi.org/10.1002/wat2.1404, 2020b.
Aubrecht, C., Fuchs, S., and Neuhold, C.: Spatio-temporal aspects and dimensions in integrated disaster risk management, Nat. Hazards, 68, 1205–1216, 2013.
Bagdanavičiute, I., Kelpšaite, L., and Soomere, T.: Multi-criteria evaluation approach to coastal vulnerability index development in micro-tidal low-lying areas, Ocean Coast. Manage., 104, 124–135, https://doi.org/10.1016/j.ocecoaman.2014.12.011, 2015.
Balica, S. F., Douben, N., and Wright, N. G.: Flood vulnerability indices at varying spatial scales, Water Sci. Technol., 60, 2571–2580, https://doi.org/10.2166/wst.2009.183, 2009.
Balica, S. F., Wright, N. G., and van der Meulen, F.: A flood vulnerability index for coastal cities and its use in assessing climate change impacts, Nat. Hazards, 64, 73–105, https://doi.org/10.1007/s11069-012-0234-1, 2012.
Barnett, J., Lambert, S., and Fry, I.: The hazards of indicators: insights from the environmental vulnerability index, Ann. Assoc. Am. Geogr., 98, 102–119, https://doi.org/10.1080/00045600701734315, 2008.
Barroca, B., Bernardara, P., Mouchel, J. M., and Hubert, G.: Indicators for identification of urban flooding vulnerability, Nat. Hazards Earth Syst. Sci., 6, 553–561, https://doi.org/10.5194/nhess-6-553-2006, 2006.
Behanzin, I. D., Thiel, M., Szarzynski, J., and Boko, M.: GIS-based mapping of flood vulnerability and risk in the Bénin Niger River Valley, Int. J. Geomatics Geosci., 6, 1653–1669, 2015.
Birkmann, J.: Measuring vulnerability to promote disaster-resilient societies: Conceptual frameworks and definitions, edited by Birkmann, J., Measuring vulnerability to natural Hazards, United Nationas University Press, Tokyo, 9–54, 2006.
Birkmann, J.: Risk and vulnerability indicators at different scales:. Applicability, usefulness and policy implications, Environ. Hazards, 7, 20–31, https://doi.org/10.1016/j.envhaz.2007.04.002, 2007.
Birkmann, J., Cardona, O. D., Carreño, M. L., Barbat, A. H., Pelling, M., Schneiderbauer, S., Kienberger, S., Keiler, M., Alexander, D., and Zeil, P.: Framing vulnerability, risk and societal responses: the MOVE framework, Nat. Hazards, 67, 193–211, https://doi.org/10.1007/s11069-013-0558-5, 2013.
Blanco-Vogt, A. and Schanze, J.: Assessment of the physical flood susceptibility of buildings on a large scale – conceptual and methodological frameworks, Nat. Hazards Earth Syst. Sci., 14, 2105–2117, https://doi.org/10.5194/nhess-14-2105-2014, 2014.
Blong, R.: A new damage index, Nat. Hazards, 30, 1–23, https://doi.org/10.1023/A:1025018822429, 2003a.
Blong, R.: A review of damage intensity scales, Nat. Hazards, 29, 57–76, https://doi.org/10.1023/A:1022960414329, 2003b.
Carlier, B., Puissant, A., Dujarric, C., and Arnaud-Fassetta, G.: Upgrading of an index-oriented methodology for consequence analysis of natural hazards: application to the Upper Guil catchment (southern French Alps), Nat. Hazards Earth Syst. Sci., 18, 2221–2239, https://doi.org/10.5194/nhess-18-2221-2018, 2018.
Cervone, G., Sava, E., Huang, Q., Schnebele, E., Harrison, J., Cervone, G., Sava, E., Huang, Q., Schnebele, E., and Harrison, J.: Using Twitter for tasking remote-sensing data collection and damage assessment?: 2013 Boulder flood case study, Int. J. Remote Sens., 37, 100–124, https://doi.org/10.1080/01431161.2015.1117684, 2016.
Chen, N., Hu, C., Chen, Y., Wang, C., and Gong, J.: Using SensorML to construct a geoprocessing e-Science workflow model under a sensor web environment, Comput. Geosci., 47, 119–129, https://doi.org/10.1016/j.cageo.2011.11.027, 2012.
Chow, C., Andrášik, R., Fischer, B., and Keiler, M.: Application of statistical techniques to proportional loss data: Evaluating the predictive accuracy of physical vulnerability to hazardous hydro- meteorological events, J. Environ. Manage., 246, 85–100, https://doi.org/10.1016/j.jenvman.2019.05.084, 2019.
Cutter, S. L. and Finch, C.: Temporal and spatial changes in social vulnerability to natural hazards, P. Natl. Acad. Sci. USA, 105, 2301–2306, https://doi.org/10.1073/pnas.0710375105, 2008.
Dall'Osso, F. and Dominey-Howes, D.: Coastal vulnerability to multiple inundation sources: COVERMAR project, Literature review report, Sydney, University of New-South Wales and Sydney Coastal Councils Group, 2013.
Dall'Osso, F., Gonella, M., Gabbianelli, G., Withycombe, G., and Dominey-Howes, D.: A revised (PTVA) model for assessing the vulnerability of buildings to tsunami damage, Nat. Hazards Earth Syst. Sci., 9, 1557–1565, https://doi.org/10.5194/nhess-9-1557-2009, 2009.
de Moel, H., Jongman, B., Kreibich, H., Merz, B., Penning-Rowsell, E., and Ward, P. J.: Flood risk assessments at different spatial scales, Mitig. Adapt. Strat. Gl., 20, 865–890, https://doi.org/10.1007/s1102, 2015.
de Ruiter, M. C., Ward, P. J., Daniell, J. E., and Aerts, J. C. J. H.: Review Article: A comparison of flood and earthquake vulnerability assessment indicators, Nat. Hazards Earth Syst. Sci., 17, 1231–1251, https://doi.org/10.5194/nhess-17-1231-2017, 2017.
Deressa, T. T., Hassan, R. M., Ringler, C., Alemu, T., and Yesuf, M.: Analysis of the determinants of farmers’ choice of adapta- tion methods and perceptions of climate change in the Nile Basin of Ethiopia [in Amharic] (No. 15 (9) AMH), International Food Policy Research Institute (IFPRI), Dell'Acqua, 2008.
Dominey-Howes, D. and Papathoma, M.: Validating a tsunami vulnerability assessment model (the PTVA Model) using field data from the 2004 Indian Ocean tsunami, Nat. Hazards, 40, 113–136, https://doi.org/10.1007/s11069-006-0007-9, 2007.
Eddy, D. M., Hollingworth, W., Caro, J. J., Tsevat, J., McDonald, K. M., and Wong, J. B.: Model transparency and validation: a report of the ISPOR-SMDM Modeling Good Research Practices Task Force-7, Med. Decis. Mak., 32, 733–743, https://doi.org/10.1177/0272989X12454579, 2012.
Englhardt, J., de Moel, H., Huyck, C. K., de Ruiter, M. C., Aerts, J. C. J. H., and Ward, P. J.: Enhancement of large-scale flood risk assessments using building-material-based vulnerability curves for an object-based approach in urban and rural areas, Nat. Hazards Earth Syst. Sci., 19, 1703–1722, https://doi.org/10.5194/nhess-19-1703-2019, 2019.
Eriksen, S. H. and Kelly, P. M.: Developing credible vulnerability indicators for climate adaptation policy assessment, Mitig. Adapt. Strat. Gl., 12, 495–524, https://doi.org/10.1007/s11027-006-3460-6, 2007.
Ettinger, S., Mounaud, L., Magill, C., Yao-Lafourcade, A. F., Thouret, J. C., Manville, V., Negulescu, C., Zuccaro, G., De Gregorio, D., Nardone, S., Uchuchoque, J. A. L., Arguedas, A., Macedo, L., and Manrique Llerena, N.: Building vulnerability to hydro-geomorphic hazards: Estimating damage probability from qualitative vulnerability assessment using logistic regression, J. Hydrol., 541, 563–581, https://doi.org/10.1016/j.jhydrol.2015.04.017, 2016.
Fernandez, P., Mourato, S., Moreira, M., and Pereira, L.: A new approach for computing a flood vulnerability index using cluster analysis, Phys. Chem. Earth, 94, 47–55, https://doi.org/10.1016/j.pce.2016.04.003, 2016.
FGN (Federal Government of Nigeria): Nigeria: Post-disaster needs assessment – 2012 floods, available at: https://www.gfdrr.org/sites/gfdrr/files/NIGERIA_PDNA_PRINT_05_29_2013_WEB.pdf (last access: 1 January 2019), 2013.
Frazier, T. G., Thompson, C. M., and Dezzani, R. J.: A framework for the development of the SERV model: A Spatially Explicit Resilience-Vulnerability model, Appl. Geogr., 51, 158–172, https://doi.org/10.1016/j.apgeog.2014.04.004, 2014.
Fuchs, S.: Susceptibility versus resilience to mountain hazards in Austria – paradigms of vulnerability revisited, Nat. Hazards Earth Syst. Sci., 9, 337–352, https://doi.org/10.5194/nhess-9-337-2009, 2009.
Fuchs, S., Keiler, M., Sokratov, S., and Shnyparkov, A.: Spatiotemporal dynamics: the need for an innovative approach in mountain hazard risk management, Nat. Hazards, 68, 1217–1241, https://doi.org/10.1007/s11069-012-0508-7, 2013.
Fuchs, S., Keiler, M., Ortlepp, R., Schinke, R., and Papathoma-Köhle, M.: Recent advances in vulnerability assessment for the built environment exposed to torrential hazards: challenges and the way forward, J. Hydrol., 575, 587–595, https://doi.org/10.1016/j.jhydrol.2019.05.067, 2019a.
Fuchs, S., Heiser, M., Schlögl, M., Zischg, A., Papathoma-Köhle, M., and Keiler, M.: Short communication: A model to predict flood loss in mountain areas, Environ. Modell. Softw., 117, 176–180, https://doi.org/10.1016/j.envsoft.2019.03.026, 2019b.
Gasparini, P.: Analysis and monitoring of environmental risk: CLUVA Final Report, available at: http://cordis.europa.eu/docs/results/265137/final1-cluva-final-publishable-summary-report.pdf (last access: 1 April 2020), 2013.
Gerl, T., Kreibich, H., Franco, G., Marechal, D., and Schröter, K.: A review of flood loss models as basis for harmonization and benchmarking, PLoS One, 11, 1–22, https://doi.org/10.1371/journal.pone.0159791, 2016.
Godfrey, A., Ciurean, R. L., van Westen, C. J., Kingma, N. C., and Glade, T.: Assessing vulnerability of buildings to hydro-meteorological hazards using an expert based approach – An application in Nehoiu Valley, Romania, Int. J. Disaster Risk Re., 13, 229–241, https://doi.org/10.1016/j.ijdrr.2015.06.001, 2015.
Golz, S.: Resilience in the built environment: How to evaluate the impacts of flood resilient building technologies?, E3S Web Conf., 7, 13001, https://doi.org/10.1051/e3sconf/20160713001, 2016.
Grünthal, G.: European Macroseismic Scale 1992 (up-dated MSK-scale), edited by Grünthal G, Cahiers du Centre Europèen de Gèodynamique et de Seismologie, Conseil de l'Europe, Conseil de l'Europe, 1993.
Grünthal, G.: European Macroseismic Scale 1998, edited by Grünthal G, Cahiers du Centre Europèen de Gèodynamique et de Seismologie, Conseil de l'Europe, Conseil del'Europe, 1998.
Günther, D.: Indicator sets for assessments, available at: http://www.ivm.vu.nl/en/Images/AT10_tcm234-161582.pdf (last access: 1 January 2019), 2006.
Haki, Z., Akyuerek, Z., and Duezguen, S.: Assessment of social vulnerability using Geographic Information Systems: Pendik, Istanbul case study, in: 7th AGILE conference on geographic information science, Heraklion, 2004.
Hammond, M. J. and Chen, A. S.: Urban flood impact assessment: A state-of-the-art review, Urban Water J., 12, 14–29, https://doi.org/10.1080/1573062X.2013.857421, 2015.
Heink, U. and Kowarik, I.: What are indicators? On the definition of indicators in ecology and environmental planning, Ecol. Indic., 10, 584–593, https://doi.org/10.1016/j.ecolind.2009.09.009, 2010.
Hinkel, J.: “Indicators of vulnerability and adaptive capacity”: towards a clarification of the science-policy interface, Global Environ. Chang., 21, 198–208, https://doi.org/10.1016/j.gloenvcha.2010.08.002, 2011.
Holub, M. and Fuchs, S.: Benefits of local structural protection to mitigate torrent-related hazards, WIT Trans. Inf. Commun. Technol., 39, 401–411, https://doi.org/10.2495/RISK080391, 2008.
Jongman, B., Kreibich, H., Apel, H., Barredo, J. I., Bates, P. D., Feyen, L., Gericke, A., Neal, J., Aerts, J. C. J. H., and Ward, P. J.: Comparative flood damage model assessment: towards a European approach, Nat. Hazards Earth Syst. Sci., 12, 3733–3752, https://doi.org/10.5194/nhess-12-3733-2012, 2012.
JRC and OECD (Joint Research Centre and Organisation for Economic Co-operation and Development): Handbook on constructing composite indicators: Methodology and user guide, Paris, OECD, 2008.
Kappes, M. S., Papathoma-Köhle, M., and Keiler, M.: Assessing physical vulnerability for multi-hazards using an indicator-based methodology, Appl. Geogr., 32, 577–590, https://doi.org/10.1016/j.apgeog.2011.07.002, 2012.
Keiler, M., Sailer, R., Jörg, P., Weber, C., Fuchs, S., Zischg, A., and Sauermoser, S.: Avalanche risk assessment – a multi-temporal approach, results from Galtür, Austria, Nat. Hazards Earth Syst. Sci., 6, 637–651, https://doi.org/10.5194/nhess-6-637-2006, 2006.
Kienberger, S., Lang, S., and Zeil, P.: Spatial vulnerability units – expert-based spatial modelling of socio-economic vulnerability in the Salzach catchment, Austria, Nat. Hazards Earth Syst. Sci., 9, 767–778, https://doi.org/10.5194/nhess-9-767-2009, 2009.
Klein, J. A., Tucker, C. M., Nolin, A. W., Hopping, K. A., Reid, R. S., Steger, C., Grêt-Regamey, A., Lavorel, S., Müller, B., Yeh, E. T., Boone, R. B., Bourgeron, P., Butsic, V., Castellanos, E., Chen, X., Dong, S. K., Greenwood, G., Keiler, M., Marchant, R., Seidl, R., Spies, T., Thorn, J., Yager, K., and the Mountain Sentinels Network: Catalyzing transformations to sustainability in the world's mountains, Earth's Futur., 7, 547–557, https://doi.org/10.1029/2018ef001024, 2019.
Komolafe, A. A., Adegboyega, S. A. A., and Akinluyi, F. O.: A review of flood risk analysis in Nigeria, Am. J. Environ. Sci., 11, 157–166, https://doi.org/10.3844/ajessp.2015.157.166, 2015.
Krellenberg, K. and Welz, J.: Assessing urban vulnerability in the context of flood and heat hazard: Pathways and challenges for indicator-based analysis, Soc. Indic. Res., 132, 709–731, https://doi.org/10.1007/s11205-016-1324-3, 2017.
Kundzewicz, Z. W., Su, B., Wang, Y., Wang, G., Wang, G., Huang, J., and Jiang, T.: Flood risk in a range of spatial perspectives – from global to local scales, Nat. Hazards Earth Syst. Sci., 19, 1319–1328, https://doi.org/10.5194/nhess-19-1319-2019, 2019.
Maiwald, H. and Schwarz, J.: Damage and loss prognosis tools correlating flood action and building's resistance-type parameters, Int. J. Saf. Secur. Eng., 5, 222–250, https://doi.org/10.2495/SAFE-V5-N3-222-250, 2015.
Maiwald, H. and Schwarz, J.: Vereinheitlichte Schadensbeschreibung und Risikobewertung von Bauwerken unter extremen Naturgefahren, Mauerwerk, 23, 95–111, https://doi.org/10.1002/dama.201910014, 2019.
Malgwi, M. B., Ramirez, J. A., Zischg, A., Zimmermann, M., Schürmann, S., and Keiler, M.: Flood reconstruction using field interview data and hydrodynamic modelling: A method for data scarce regions, Int. J. Disaster Risk Sci., submitted, 2020.
Mazzorana, B., Levaggi, L., Keiler, M., and Fuchs, S.: Towards dynamics in flood risk assessment, Nat. Hazards Earth Syst. Sci., 12, 3571–3587, https://doi.org/10.5194/nhess-12-3571-2012, 2012.
Mazzorana, B., Simoni, S., Scherer, C., Gems, B., Fuchs, S., and Keiler, M.: A physical approach on flood risk vulnerability of buildings, Hydrol. Earth Syst. Sci., 18, 3817–3836, https://doi.org/10.5194/hess-18-3817-2014, 2014.
Merz, B., Kreibich, H., Thieken, A., and Schmidtke, R.: Estimation uncertainty of direct monetary flood damage to buildings, Nat. Hazards Earth Syst. Sci., 4, 153–163, https://doi.org/10.5194/nhess-4-153-2004, 2004.
Merz, B., Kreibich, H., Schwarze, R., and Thieken, A.: Review article “Assessment of economic flood damage”, Nat. Hazards Earth Syst. Sci., 10, 1697–1724, https://doi.org/10.5194/nhess-10-1697-2010, 2010.
Merz, B., Kreibich, H., and Lall, U.: Multi-variate flood damage assessment: a tree-based data-mining approach, Nat. Hazards Earth Syst. Sci., 13, 53–64, https://doi.org/10.5194/nhess-13-53-2013, 2013.
Meyer, V., Kuhlicke, C., Luther, J., Fuchs, S., Priest, S., Dorner, W., Serrhini, K., Pardoe, J., McCarthy, S., Seidel, J., Palka, G., Unnerstall, H., Viavattene, C., and Scheuer, S.: Recommendations for the user-specific enhancement of flood maps, Nat. Hazards Earth Syst. Sci., 12, 1701–1716, https://doi.org/10.5194/nhess-12-1701-2012, 2012.
Milanesi, L., Pilotti, M., Belleri, A., Marini, A., and Fuchs, S.: Vulnerability to flash floods: a simplified structural model for masonry buildings, Water Resour. Res., 54, 7177–7197, https://doi.org/10.1029/2018WR022577, 2018.
Mirza, M. M. Q.: Climate change and extreme weather events: can developing countries adapt?, Clim. Policy, 3, 233–248, https://doi.org/10.1016/S1469-3062(03)00052-4, 2003.
Mosimann, M., Frossard, L., Keiler, M., Weingartner, R., and Zischg, A.: A robust and transferable model for the prediction of flood losses on household contents, Water, 10, 1596, https://doi.org/10.3390/w10111596, 2018.
Müller, A., Reiter, J., and Weiland, U.: Assessment of urban vulnerability towards floods using an indicator-based approach – a case study for Santiago de Chile, Nat. Hazards Earth Syst. Sci., 11, 2107–2123, https://doi.org/10.5194/nhess-11-2107-2011, 2011.
Naumann, T., Nikolowski, J., and Sebastian, G.: Synthetic depth-damage functions – A detailed tool for analysing flood resilience of building types, edited by: Pasche, E., Evelpidou, N., Zevenbergen, C., Ashley, R., and Garvin, S., Road map towards a flood resilient urban environment, Institut für Wasserbau der TU Hamburg-Harburg, Hamburg, 2009.
Neubert, M., Naumann, T., and Deilmann, C.: Synthetic water level building damage relationships for GIS-supported flood vulnerability modeling of residential properties, edited by Samuels, P., Huntington, S., Allsop, W., and Harrop, J., Flood risk management. Research and practice, London, Taylor & Francis, 1717–1724, https://doi.org/10.1201/9780203883020.ch203, 2008.
Niang, I., Ruppel, O. C., Abdrabo, M. A., Essel, A., Lennard, C., Padgham, J., and Urquhart, P.: Africa, in Climate Change 2014: Impacts, Adaptation and Vulnerability: Part B: Regional Aspects: Working Group II Contribution to the Fifth Assessment Report of the Intergovernmental Panel on Climate Change, edited by: Barros, V. R., Field, C. B., Dokken, D. J., Mastrandrea, M. D., and Mach, K. J., Cambridge University Press, Cambridge University Press, Cambridge, United Kingdom and New York, NY, USA, 1199–1266, 2015.
NRE (Department of Natural Resources and Environment): Rapid appraisal method (RAM) for floodplain management, Department of Natural Resources and Environment, Victoria, 2000.
Ntajal, J., Lamptey, B. L., and MianikpoSogbedji, J.: Flood vulnerability mapping in the lower mono river basin in Togo, West Africa, Int. J. Sci. Eng. Res., 7, 1553–1562, 2016.
Papathoma-Köhle, M., Kappes, M., Keiler, M., and Glade, T.: Physical vulnerability assessment for alpine hazards: State of the art and future needs, Nat. Hazards, 58, 645–680, https://doi.org/10.1007/s11069-010-9632-4, 2011.
Papathoma-Köhle, M., Gems, B., Sturm, M., and Fuchs, S.: Matrices, curves and indicators: A review of approaches to assess physical vulnerability to debris flows, Earth-Sci. Rev., 171, 272–288, https://doi.org/10.1016/j.earscirev.2017.06.007, 2017.
Papathoma-Köhle, M., Cristofari, G., Wenk, M., and Fuchs, S.: The importance of indicator weights for vulnerability indices and implications for decision making in disaster management, Int. J. Disaster Risk Re., 36, 101103, https://doi.org/10.1016/j.ijdrr.2019.101103, 2019.
Papathoma, M., Dominey-Howes, D., Zong, Y., and Smith, D.: Assessing tsunami vulnerability, an example from Herakleio, Crete, Nat. Hazards Earth Syst. Sci., 3, 377–389, https://doi.org/10.5194/nhess-3-377-2003, 2003.
Penning-Rowsell, E., Johnson, C., Tunstall, S., Tapsell, S., Morris, J., Chatterton, J., and Green, C.: The benefits of flood and coastal risk management: a manual of assessment techniques, Middlesex University Press, Middlesex, 2005.
Percival, S., Gaterell, M., and Teeuw, R.: Urban neighbourhood flood vulnerability and risk assessments at different diurnal levels, J. Flood Risk Manage., 12, 1–14, https://doi.org/10.1111/jfr3.12466, 2018.
Pistrika, A., Tsakiris, G., and Nalbantis, I.: Flood depth-damage functions for built environment, Environ. Process., 1, 553–572, https://doi.org/10.1007/s40710-014-0038-2, 2014.
Quevauviller, P.: Science and Policy Interfacing. In Hydrometeorological Hazards, edited by: Quevauviller, P., https://doi.org/10.1002/9781118629567.ch1d, 2014.
Romali, N. S., Sulaiman, M. A. K., Yusop, Z., and Ismail, Z.: Flood damage assessment: A review of flood stage–damage function curve, edited by: Abu Bakar, S., Tahir, W., Wahid, M., Mohd Nasir, S., and Hassan, R., ISFRAM 2014, Singapore, Springer, 147–159, 2015.
Saaty, T. L.: The Analytical Hierarchy Process, McGraw-Hill, New York, 1980.
Sadeghi-Pouya, A., Nouri, J., Mansouri, N., and Kia-Lashaki, A.: An indexing approach to assess flood vulnerability in the western coastal cities of Mazandaran, Iran, Int. J. Disaster Risk Re., 22, 304–316, https://doi.org/10.1016/j.ijdrr.2017.02.013, 2017.
Schröter, K., Kreibich, H., Vogel, K., Riggelsen, C., Scherbaum, F., and Merz, B.: How useful are complex flood damage models?, Water Resour. Res., 50, 3378–3395, https://doi.org/10.1002/2013WR014396, 2014.
Schwarz, J. and Maiwald, H.: Prognose der Bauwerksschädigung unter Hochwassereinwirkung, Bautechnik, 84, 450–464, https://doi.org/10.1002/bate.200710039, 2007.
Schwarz, J. and Maiwald, H.: Damage and loss prediction model based on the vulnerability of building types, 4th International Symposium on Flood Defence: Managing Flood Risk, Reliability and Vulnerability, Toronto, Ontario, Canada, 6–8 May 2008, 74-1–74-9, https://doi.org/10.13140/2.1.1358.3043, 2008.
Spekkers, M. H., Kok, M., Clemens, F. H. L. R., and ten Veldhuis, J. A. E.: Decision-tree analysis of factors influencing rainfall-related building structure and content damage, Nat. Hazards Earth Syst. Sci., 14, 2531–2547, https://doi.org/10.5194/nhess-14-2531-2014, 2014.
Sturm, M., Gems, B., Keller, F., Mazzorana, B., Fuchs, S., Papathoma-Köhle, M., and Aufleger, M.: Experimental analyses of impact forces on buildings exposed to fluvial hazards, J. Hydrol., 565, 1–13, https://doi.org/10.1016/j.jhydrol.2018.07.070, 2018a.
Sturm, M., Gems, B., Keller, F., Mazzorana, B., Fuchs, S., Papathoma-Köhle, M., and Aufleger, M.: Understanding impact dynamics on buildings caused by fluviatile sediment transport, Geomorphology, 321, 45–59, https://doi.org/10.1016/j.geomorph.2018.08.016, 2018b.
Sy, B., Frischknecht, C., Dao, H., Consuegra, D., and Giuliani, G.: Reconstituting past flood events: the contribution of citizen science, Hydrol. Earth Syst. Sci., 24, 61–74, https://doi.org/10.5194/hess-24-61-2020, 2020.
Tarbotton, C., Dominey-Howes, D., Goff, J. R., Papathoma-Köhle, M., Dall'Osso, F., and Turner, I. L.: GIS-based techniques for assessing the vulnerability of buildings to tsunami: current approaches and future steps, Geol. Soc. London, Spec. Publ., 361, 115–125, https://doi.org/10.1144/SP361.10, 2012.
Tate, E.: Social vulnerability indices: A comparative assessment using uncertainty and sensitivity analysis, Nat. Hazards, 63, 325–347, https://doi.org/10.1007/s11069-012-0152-2, 2012.
Thieken, A. H., Müller, M., Kreibich, H., and Merz, B.: Flood damage and influencing factors: New insights from the August 2002 flood in Germany, Water Resour. Res., 41, 1–16, https://doi.org/10.1029/2005WR004177, 2005.
Thieken, A. H., Olschewski, A., Kreibich, H., Kobsch, S., and Merz, B.: Development and evaluation of FLEMOps - A new Flood Loss Estimation MOdel for the private sector, WIT Trans. Ecol. Envir., 118, 315–324, https://doi.org/10.2495/FRIAR080301, 2008.
Thouret, J. C., Ettinger, S., Guitton, M., Santoni, O., Magill, C., Martelli, K., Zuccaro, G., Revilla, V., Charca, J. A., and Arguedas, A.: Assessing physical vulnerability in large cities exposed to flash floods and debris flows: the case of Arequipa (Peru), Nat. Hazards, 73, 1771–1815, https://doi.org/10.1007/s11069-014-1172-x, 2014.
Totschnig, R. and Fuchs, S.: Mountain torrents: quantifying vulnerability and assessing uncertainties, Eng. Geol., 155, 31–44, https://doi.org/10.1016/j.enggeo.2012.12.019, 2013.
Totschnig, R., Sedlacek, W., and Fuchs, S.: A quantitative vulnerability function for fluvial sediment transport, Nat. Hazards, 58, 681–703, https://doi.org/10.1007/s11069-010-9623-5, 2011.
UNDP (United Nations Development Programme): Human Development Report, reviewed by: Todaro, M. P, in: Population and Development Review, Popul. Counc., 18, 359–363, https://doi.org/10.2307/1973685, 1992.
UNDRR (United Nations Office for Disaster Risk Reduction): Global Assessment Report on Disaster Risk Reduction 2019, Geneva, Switzerland, available at: https://gar.undrr.org/ (last access: 29 March 2020), 2019.
UNISDR (United Nations International Strategy for Disaster Reduction): Terminology on disaster risk reduction, United Nations International Strategy for Disaster Reduction Geneva, Geneva, Switzerland, available at: https://www.undrr.org/publication/2009-unisdr-terminology-disaster-risk-reduction (last access: 15 March 2020), 2009.
UNISDR (United Nations International Strategy for Disaster Reduction): Sendai framework for disaster risk reduction 2015–2030, available at: https://www.undrr.org/publication/sendai-framework-disaster-risk-reduction-2015-2030 (last access: 26 February 2020), 2015.
Vogel, K., Riggelsen, C., Merz, B., Kreibich, H., and Scherbaum, F.: Flood damage and influencing factors: a Bayesian network perspective, in: Proceedings of the 6th European workshop on Probabilistic Graphical Models (PGM 2012), Granada, Spain, edited by: Cano, A., Gómez-Olmedo, M. G., and Nielsen, T. D., 19–21 September 2012, 314–354, 2012.
Wagenaar, D., de Jong, J., and Bouwer, L. M.: Multi-variable flood damage modelling with limited data using supervised learning approaches, Nat. Hazards Earth Syst. Sci., 17, 1683–1696, https://doi.org/10.5194/nhess-17-1683-2017, 2017.
Walliman, N., Ogden, R., Baiche, B., Tagg, A., and Escarameia, M.: Development of a tool to estimate individual building vulnerability to floods, WIT Trans. Ecol. Envir., 155, 1005–1016, https://doi.org/10.2495/SC120842, 2011.
WHO (World Health Orgaonization): WHO Guidelines for indoor air quality: dampness and mould, Copenhagen, Denmark, available at: https://www.who.int/airpollution/guidelines/dampness-mould/en/ (last access: 26 February 2020), 2009.
Yankson, P. W. K., Owusu, A. B., Owusu, G., Boakye-Danquah, J., and Tetteh, J. D.: Assessment of coastal communities' vulnerability to floods using indicator-based approach: a case study of Greater Accra Metropolitan Area, Ghana, Nat. Hazards, 89, 661–689, https://doi.org/10.1007/s11069-017-3006-0, 2017.
Zimmermann, M. and Keiler, M.: International frameworks for disaster risk reduction: Useful guidance for sustainable mountain development?, Mt. Res. Dev., 35, 195–202, https://doi.org/10.1659/MRD-JOURNAL-D-15-00006.1, 2015.
- Abstract
- Introduction
- Review of indicators for physical vulnerability to floods
- Review of flood damage models
- The need for linking indicators and damage grades
- Conceptual framework
- Concluding remarks
- Appendix A
- Data availability
- Author contributions
- Competing interests
- Acknowledgements
- Financial support
- Review statement
- References