the Creative Commons Attribution 4.0 License.
the Creative Commons Attribution 4.0 License.
 | 15 Jul 2020
Extreme storm tides in the German Bight (North Sea) and their potential for amplification
Iris Grabemann
Tabea Brodhagen
Elisabeth Rudolph
Storm tides are a major hazard for the German North Sea coasts. For coastal protection and economic activities, planning information on the probability and magnitude of extreme storm tides and their possible future changes is important. This study focuses on the most extreme events and examines whether they could have become more severe under slightly different conditions while still remaining within physical plausibility.
In the face of a limited number of observational data on very severe events, an extensive set of model data is used to extract most extreme storm tide events for locations in the German Bight, in particular Borkum and the Ems estuary. The data set includes water levels and respective atmospheric conditions from a hindcast and future climate realizations without sea level rise describing today's and possible future conditions.
A number of very severe events with water levels exceeding those measured near Borkum since 1906 are identified in the data set. A possible further amplification of the highest events is investigated by simulating these events for the North Sea with different phase lags between the astronomical tide given at the open model boundaries and the wind forcing. It is found that superposition of spring tide conditions, different timing of the astronomical high water and atmospheric conditions during the highest storm event would cause an enhancement of the highest water level up to about 50 cm.
The water levels of the two highest events from the data set are used to analyse the effects in the Ems estuary using a high-resolution model of the German Bight. Additionally, the influences of an extreme river runoff and of sea level rise are studied. The extreme river runoff of 1200 m3 s−1 increases the highest water levels by several decimetres in the narrow upstream part of the Ems estuary. This effect diminishes downstream. The sea level rise increases the water level in the downstream part of the Ems estuary by the amount applied at the model boundary to the North Sea. In the upstream part, its influence on the water level decreases.
This study may serve as a first step towards an impact assessment for severe storm tides and towards implications for coastal zone management in times of climate change.
- Article
(4328 KB) - Full-text XML
- BibTeX
- EndNote


The North Sea (Fig. 1), lying at temperate latitudes (51 to 62∘ N), is exposed to the impact of storms mainly occurring from September to April. Storm tides accompanied by severe winds represent a major natural hazard for low-lying coastal areas.

Figure 1Model domains for the North Sea and German Bight models with distributions of water depths and enlargements of the German Bight and the Ems estuary, respectively. The black line in the enlargement of the Ems estuary denotes the longitudinal profile for which the highest high waters were extracted.
In modern times, two major storm tide disasters that caused large damage at the North Sea coasts occurred in the years 1953 and 1962. Since then coastal defences have been significantly improved along the German coastline. For example, the main dikes were reinforced, secondary dikes were introduced and storm surge barriers were constructed to protect coasts of adjoined rivers. Mainly due to these measures more recent storms, e.g. in 1976 or 2013, caused no severe damage although water levels higher than those of 1962 have been observed at various coastal sections (e.g. NLWKNa, 2010; NLWKNb, 2007). Nevertheless, risk of flooding is still present and may increase due to the effects of expected climate change. Thus, the rise in the mean sea level may lead not only to an increase in the height of the storm tides and longer duration of water levels exceeding certain thresholds (e.g. Idier et al., 2019, and references therein) but also to shorter arrival times of the storm tide at the coast and in the estuaries (e.g. Arns et al., 2015a). These effects, among others, may aggravate risks related to storm tides and may have consequences not only for coastal protection, e.g. for the dike heights or the warning times, but also for such issues as the drainage of low-lying coastal areas.
Coastal protection and adaptation measures are usually a long-term effort. Information about the probabilities of very severe storm tides and their possible changes in the future is needed for planning and design of coastal defences and protection, for risk assessment, and for the assessment of whether or not planned adaptation measures are adequate or robust for a given location. This information is usually assessed and provided in the form of high percentiles or return values obtained from frequency distribution estimates. There is a spectrum of methods used to construct such estimates (e.g. Debernard and Røed, 2008; Arns et al., 2015b; Santamaria-Aguilar et al., 2017 for dynamical modelling approach, Wahl et al., 2011, for stochastic modelling approach or Dangendorf et al., 2013, for processing of tide gauge observations). In the present study we are interested in the spatial and temporal evolution of particular very severe storm tide events in coastal areas and estuaries and, thus, diverge from the statistical approach. So far, more detailed information on and assessment of particular events that are extremely severe and rare are uncommon. Potential sources of such events comprise historical data as well as modelled data for the past, present and future.
The present study aims to identify and assess individual extreme events that are highly unlikely but that are still physically possible and plausible and may have extreme consequences. To identify extreme storm tide events, we initially search through an extensive set of modelled met-ocean data, which increases the chances of detecting the unprecedented events compared to usage of only historical data. Further, we explore the potential of such events to become even more severe under physically plausible assumptions.
There are several key processes determining water level increase during a storm, and their modification may lead to an enhancement of identified extreme events. Among others, variations in the atmospheric conditions leading to changes in storm track and/or intensity over the sea may entail alterations in the storm tides near the coast. In particular, in the project MUSE, Jensen et al. (2006) took a dynamic ensemble approach. They analysed the extent to which amplification of observed storm tides could be caused by various atmospheric developments of observed storms. The atmospheric variations in this case were represented by different timings of initial conditions used for the atmospheric forecast and corresponding ensemble simulations. Another study held within the project XtremRisK (Gönnert et al., 2013; Oumeraci et al., 2015) developed a more combinatorial approach, merging estimates of various storm tide components such as surge, external surge, tides and their non-linear interactions derived from observation. Both studies were mainly focused on the Elbe estuary and resulted in constructing and investigating events exceeding the observed ones.
Without changing the atmospheric forcing, possible amplifications can occur due to different configurations of existing atmospheric situations and astronomical tide. In particular, altered timing of atmospheric storm relative to the tidal phase may lead to variations in maximum water level. In addition to semidiurnal tidal variations, the longer fluctuations in the tidal components can be considered, reflecting the situation where a particular atmospheric storm may coincide with a spring tide instead of a neap tide. In the present study, we pursue this strategy to investigate the potential for very severe storm tides to be amplified.
Whereas Jensen et al. (2006) looked at particular observed storms and the amplification of their peak water levels, the current study deals with a large set of met-ocean hindcast and climate realizations to detect extraordinary storm events, focusing on both storm tide height and duration. The climate realizations used, comprising CMIP3 and CMIP5 scenarios, reflect only the changes in the atmospheric conditions and do not include mean sea level rise and local bathymetric changes. A variety of future climate realizations underlines large uncertainties regarding possible future changes in the storm climate for the region of interest (e.g. Feser et al., 2015; Ganske et al., 2016). We assume that extremes from the climate realizations used also represent plausible events for the present climate conditions as storm statistics in these simulations show no or minor significant changes until 2100 in combination with very strong inter-decadal variability for wind speed and surge levels (e.g. Gaslikova et al., 2013).
From this met-ocean data set, the most extreme storm tide events were selected for three parts of the German Bight – the East Frisian and North Frisian coasts and Elbe mouth (Fig. 1). A set of dynamical large-scale water level simulations was produced to examine whether the identified storm tides could have become more extreme under different constellations of peak winds and tides. Here, a regional hydrodynamic model in a 2D mode, which covers the North Sea and parts of the north-east Atlantic to ensure the incorporation of external surges, was used.
To investigate local effects of such extremely severe events near the coast and specifically in the estuaries, the Ems estuary was chosen for further experiments and analyses. The estuary represents one of the main German estuaries. In addition to dikes along the North Sea coast and the whole estuary, the upper Ems estuary is protected by a storm surge barrier. Operating the barrier influences the water levels both upstream and downstream of the barrier (Rego et al., 2011; BAW, 2007). Such effects under extreme storm tide conditions are of additional interest. The town Emden, as an example of a typical harbour town with importance for marine trade, was chosen as a focus point within the estuary. To adequately transfer the acquired extreme storm tides to the coasts and assess their impact within an estuary, a more detailed hydrodynamic model for the German Bight including the German estuaries has been used (Fig. 1). Additional factors, which may lead to the amplification of water levels at the coast and which are more relevant at local scales and in shallow water (because of the effects of varying river discharge and possible future sea level rise), were considered and incorporated in the sensitivity study here.
2.1 Hydrographic properties
The south-eastern and north-western coasts of the German Bight (Fig. 1) are mainly endangered by storm winds from westerly to northwesterly and from southwesterly to westerly directions, respectively. The tidal wave propagates anticlockwise from the East Frisian to the North Frisian coast. Due to the funnel-shaped German Bight, the mean tidal range increases from about 2.4 m near Borkum near the outer border of the Ems estuary to about 3 m in the outer Elbe estuary and decreases to about 2.6 m near Amrum (e.g. DGJa, 2014). In outer parts of the estuaries of the Ems, Weser and Elbe the mean tidal range can exceed 3 m (e.g. Niemeyer and Kaiser, 1999). Thus, a specific storm in the southern North Sea has different influences on the water levels at the different coastal strips and in the estuaries.
The Ems estuary is situated in the German Bight at the border between the Netherlands and Germany (Fig. 1). Coming from the wide mouth of the estuary near the island of Borkum, it narrows towards Knock but widens again into the Dollart bay south of Emden. Upstream of the Dollart the narrow and shallower part of the Ems estuary begins. The influence of the tide can be observed up to Herbrum. At the mouth of the Ems near Borkum the tide is characterized by a mean tidal high water (MHW) of NHN + 1.15 m and mean tidal low water (MLW) of NHN − 1.31 m (DGJa, 2014; NHN – Normalhöhennull – presents the standard elevation zero of the German reference height system). In the centre of the estuary at Emden the mean tidal range increases to 3.28 m with MHW = NHN + 1.48 m and MLW = NHN − 1.80 m (DGJb, 2018). The mean freshwater discharge into the Ems estuary is 80 m3 s−1; the highest discharge that has been observed is 1200 m3 s−1 (February 1946; DGJb, 2018). Large freshwater discharges occur frequently in the months from January to April (Krebs and Weilbeer, 2008).
2.2 North Sea model for the large-scale simulations
All water level simulations for the North Sea were performed with the hydrodynamic model TRIM-NP. The model TRIM-NP (tidal, residual, intertidal mudflat – nested and parallelized; Kapitza and Eppel, 2000; Pätsch et al., 2017) is based on the model TRIM developed by Casulli and Cattani (1994) and was used in 2D mode. The model domain covers the North Sea and adjacent parts of the north-east Atlantic (Fig. 1) to allow for the generation of realistic external surges. The model solves the Reynolds-averaged Navier–Stokes equations on a regular Arakawa C grid with Cartesian coordinates and is used in the present study with a resolution of 12.8 km ×12.8 km without further nesting. The model time step was 4 min, and the output was stored every 20 min. Drying and wetting of near-shore points is enabled. The water level simulations were driven by the 10 m height wind speed and direction and mean sea level pressure fields from the atmospheric data mentioned above and by astronomical tides from the FES atlas (Lyard et al., 2006) at the lateral open boundaries. The wind influence is parameterized using an approach from Smith and Banke (1975). While this approach is based on wind speed measurements between 3 and 21 m s−1, which are exceeded during storm surges, previous studies have shown that this approach is suitable for the North Sea and applicable for storm surges (Jensen et al., 2006). The model has been validated against tide gauge observations at the German coasts. For a detailed description of the original water level simulations and model performance see Gaslikova et al. (2013) and Weisse et al. (2014).
2.3 German Bight model for the fine-grid simulations
For the high-resolution modelling of the German Bight and the attached estuaries of the rivers Ems, Weser and Elbe (Fig. 1), the hydrodynamic numerical model UnTRIM2 (Casulli, 2008) is used.
UnTRIM2 is a 3D finite-difference–finite-volume numerical model. It solves the shallow water equations and the transport equation of salt on an unstructured orthogonal grid (Casulli and Walters, 2000). The use of the subgrid technology described by Casulli (2008) allows for discretizing the model bathymetry with a much finer resolution than the computational grid. In areas like the German Wadden Sea with its large tidal flats, this allows for the describing of dry and wet areas in greater detail as well as better representation of the water volume. Thus, the bathymetry can be captured in detail while the computations can still be performed on a relatively coarse grid. As a result, large time steps can be used and the computational costs are kept low. The algorithm also guarantees conservation of mass and water depths greater than zero regardless of time step size and is unconditionally stable.
The German Bight model is forced by wind, river runoff, salinity and water level. For these simulations, the same wind fields as for the North Sea model are used. In UnTRIM2, the wind parameterization is similar to that in TRIM-NP. River runoff is applied at the upstream end of the estuaries. For the Ems, a constant runoff of 80 m3 s−1 (average for 1942–2015; DGJb, 2018) is applied. Water level and salinity are applied at the open boundary towards the North Sea (Fig. 1). Water levels were derived from the North Sea simulations with TRIM-NP. A constant salinity of 33 psu is used, which is a common value for that region of the North Sea (BSH, 2016).
The storm surge barrier (Fig. 1) is included in the subgrid topography of the model and can be operated at run-time. Based on the balance between coastal protection and nature conservation, the barrier should protect the estuary against storm tides higher than NHN + 3.70 m. The barrier is closed when water levels at the barrier exceed NHN + 3.50 m, and it is reopened when water levels upstream and downstream of the barrier are equal. In order to ensure the protective function of the storm surge barrier in the case of a sea level rise of 100 cm, the height of the gates is increased from 7 m (two gates) and 8 m (five gates) in nature (NLWKNb, 2007) to 9 m in the model.
2.4 Data set
A set of numerical simulations for which atmospheric as well as marine data are available is required for the detection and ranking of extreme storm tides and subsequent modifications. Furthermore, a desired homogeneity and comparability of resulting water level fields suggests that the local water level data should be simulated with the same hydrodynamic model for the North Sea. However, the global and regional atmospheric conditions may and should vary in their origins to ensure a diversity of possible storm and storm tide events. Thus, the set of underlying atmospheric conditions comprises a multi-decadal hindcast (Geyer, 2014) for the period 1948–2016 based on downscaled NCEP–NCAR global reanalysis (Kalnay et al., 1996) and six downscaled climate change realizations. In detail, the global climate realizations include four CMIP3 members for the SRES A1B and B1 scenarios (e.g. Nakicenovic and Swart, 2000; Houghton et al., 2001) covering the period 2001–2100 and corresponding present-day conditions for 1960–2000. Other realizations include two CMIP5 members for the AR5 RCP8.5 scenario (e.g. Stocker et al., 2013; Taylor et al., 2010) for the periods 2006–2100 or 2071–2100 and corresponding present-day conditions for 1971–2005 or 1971–2000. The climate simulations were obtained with different global models (ECHAM5-MPIOM, e.g. Röckner et al., 2003, and Marsland et al., 2003; EC-EARTH as part of EURO-CORDEX, e.g. Hazeleger et al., 2010; and CMCC, Scoccimarro et al., 2011) using different initial conditions. The global atmospheric realizations from these simulations as well as the hindcast were downscaled with different regional circulation models (different versions of CCLM, e.g. Rockel et al., 2008, and Hollweg et al., 2008, and RCA4, e.g. Samuelsson et al., 2011), providing regional atmospheric climate realizations for the north-east Atlantic. These regional atmospheric data from the hindcast and climate projections were used to force the hydrodynamic model TRIM-NP (North Sea model) and to obtain water levels in the North Sea and the north-east Atlantic (e.g. Gaslikova et al., 2013; Weisse et al., 2014, 2015). The resulting set of water level data is used for further analysis in this study and is referred to as the “data set” further on. For the entire data and model flow see also Fig. 2.

Figure 2Scheme of the chain of models and simulations for the selected events and their amplification.
The climate realizations do not include any rise in mean sea level. Water level changes are due to changes in the atmospheric forcing only. Furthermore, possible changes in bathymetry over the course of time are neglected in the hindcast as well as in the climate realizations.
2.5 Selection of events and amplification experiments
Different classifications of storm tides exist using e.g. water levels above a reference height or the probability of water levels. Here, the classification of the Bundesamt für Seeschifffahrt und Hydrographie (Federal Maritime and Hydrographic Agency; see Müller-Navarra et al., 2003) is used: a storm tide is an event with water levels exceeding the mean tidal high water by at least 1.5 m; a severe and a very severe storm tide denote events exceeding MHW by 2.5 and 3.5 m, respectively.
The analysis of extreme storm tides is mainly focused on the East Frisian coast, in particular on Borkum and the Ems estuary. However, the impact of storms in the North Sea varies along the coasts depending on the wind direction and the resulting wind set-up. Therefore, from the data set, time series of water levels were extracted for a location seaward of the island of Borkum (in the following labelled as “Borkum”) and two other locations in the German Bight (Fig. 1): one location in the outer Elbe estuary (labelled as “Elbe mouth”) and one location seaward of the North Frisian island of Amrum (labelled as “Amrum”).
Figure 2 describes the workflow for the simulation of the original water levels included in the data set and for the construction of the amplified water levels. A potential amplification due to tidal variations is tested for selected events at Borkum, whereas Elbe mouth and Amrum are used to compare the effects at Borkum with those at other coasts of the German Bight. The methodology used to investigate the potential amplification of the selected storm tide events comprises four steps.
In step 1, extreme storm events are selected from the corresponding time series using three criteria:
-
height of water levels,
-
duration of water levels continuously exceeding NHN + 1.15 m (MHW at Borkum, DGJa, 2014),
-
series of storm tides with high water levels exceeding MHW + 1.5 m within 1 week.
Water levels are considered with respect to NHN. The storm tide events for Borkum are ranked with respect to their water levels and their durations. For the further analysis of a possible amplification, the event with the highest high water was defined as “EH”. The event with the maximum duration was defined as “EL”. The strongest event chain from the selected events was defined as “EC”, where “strongest” describes the combination of the maximum number of storm tides within a week and the maximum intensity. The intensity is given by the area between the water level curve and a threshold.
In step 2, possible amplification of the selected extreme events due to different combinations of wind field and astronomical tide was tested. Maximum water levels may be increased by variations in relative propagation and arrival time of tidal high water and atmospheric storm. They may also become higher if the specific storm occurs around spring tides rather than around neap tides.
Thus, ensembles of large-scale North Sea water level simulations for each selected event were generated. For ensemble one, the astronomical tide given at the open model boundaries was shifted hourly within ±6 h around the wind speed maximum near Borkum. For ensemble two, the highest astronomical spring tide found in the tidal simulations for the period 1948–2100 was used instead of the original tide and the astronomical tides were again shifted hourly. For each member of ensemble one and two, water level time series were extracted for the three locations. The time series were analysed, and members were selected focusing on the strongest amplification for Borkum. Comparing the time series for the three locations, it is estimated how the amplification for Borkum affected the water levels at Elbe mouth and Amrum.
Respective data from the ensemble members with the highest amplified water levels near Borkum (in the following identified by “_a”) for each event were used for further fine-grid simulations of the German Bight and the Ems estuary in steps 3 and 4.
In step 3, high-resolution water level simulations for the German Bight and the attached estuaries for the ensemble member with the highest amplified water levels near Borkum for the selected events derived from step 2 were performed.
In step 4, the events from step 3 were further amplified by applying an increased river runoff to examine the impact of runoff variations and a sea level rise to place the results in the context of future climate change. For these amplification simulations the highest observed river runoff for the Ems of 1200 m3 s−1 (1946; DGJb, 2018) was assumed. This extreme river runoff was measured in February 1946, i.e. in a season when storm tides are probable. Furthermore, simulations with two sea level rise scenarios of 50 and of 100 cm were investigated. These values cover the likely range of median values for the global sea level rise as well as the bandwidth of the local sea level rise for the North Sea until 2100 as reported by Stocker et al. (2013). The sea level rise was applied at the open boundary of the German Bight model by shifting the boundary values for water level by the selected amount of sea level rise.
In order to investigate the impact of the storm surge barrier in the Ems on water levels, the storm tides were simulated with an open and with an operated barrier in steps 3 and 4.
3.1 Extreme storm tides at the coasts of the German Bight
3.1.1 Selected extreme storm tides for Borkum
Following the procedure described in the previous section, events were selected for Borkum and ranked with respect to their water levels and their durations. In Fig. 3, time series for the five highest storm tides extracted from the data set are compared with the highest observed storm tides for Borkum, showing that the data set includes storm tides higher than observed during the past 110 years. The events observed in 2006 and 2013 denote the second- and third-highest storm tides (DGJa, 2014) measured at the tide gauge since the beginning of the 20th century. The highest observed storm tide of 4.06 m occurred in 1906 (NLWKNa, 2010). The five simulated events are about 40 to 65 cm higher than the event observed in 1906.
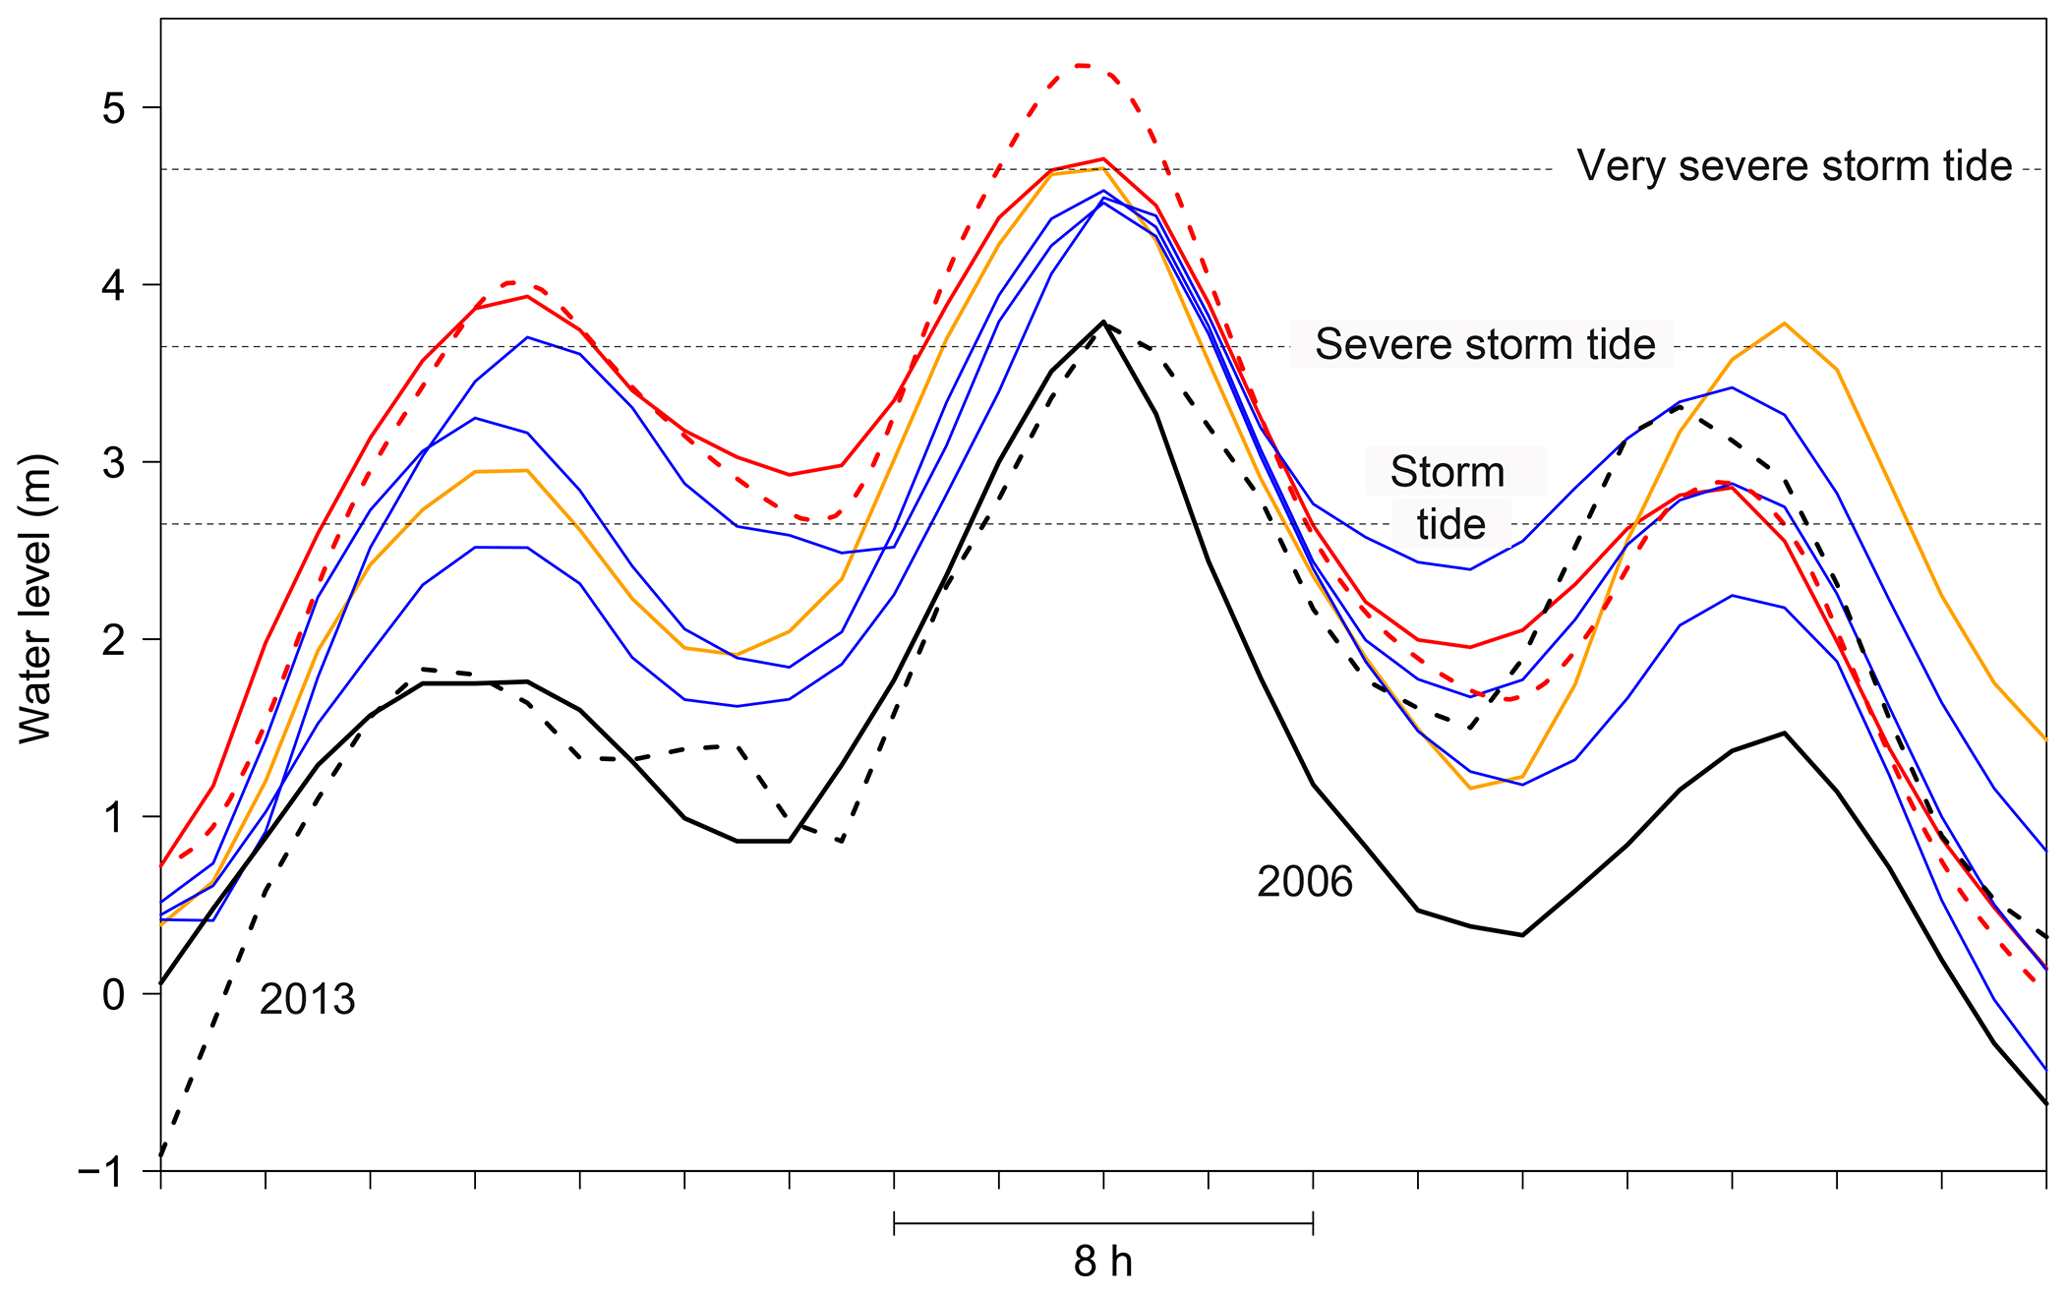
Figure 3Time series of water levels over 36 h for Borkum. The two black curves display observations (data source: German Federal Waterways and Shipping Administration – WSV – communicated by the German Federal Institute of Hydrology – BfG), and the coloured curves represent the five highest simulated storm tides (nearest seaward grid point to Borkum) from the data set. The red and the orange curves denote the two highest events (EH and EL) used for amplification tests; the dashed red curve displays the amplified event EH_a (see Sect. 3.1.2).
The highest event (EH; Fig. 4a and red curve in Fig. 3) with a maximum high water of 4.73 m describes a very severe storm tide and was found in one of the B1 climate realizations (February 2030; for a detailed description of the realizations see Gaslikova et al., 2013). This event also has a comparably long-lasting time period with water levels higher than the long-term MHW of 1.15 m (DGJa, 2014).
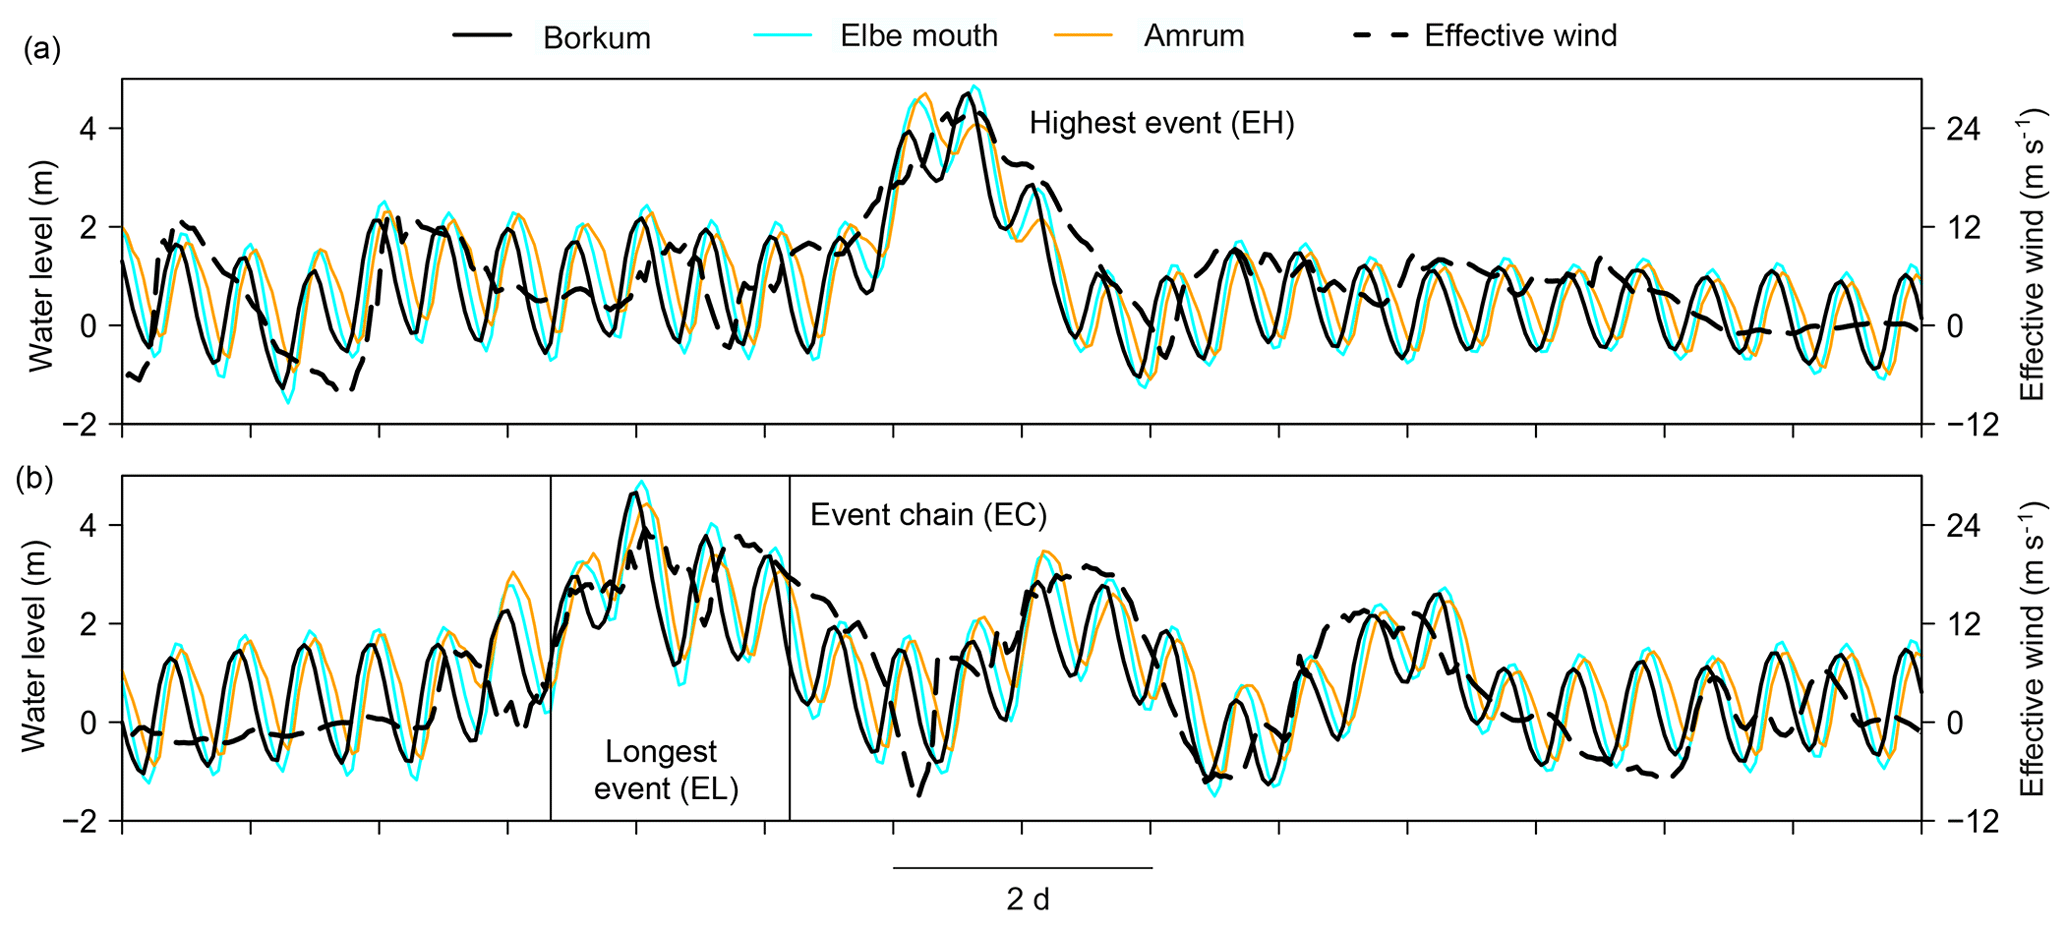
Figure 4Time series of simulated water levels for three locations along the German Bight coast together with effective wind velocities for Borkum (dashed black line) for the highest event (EH; a) and the event chain (EC; b) over 14 d. The first event in the event chain represents the longest event (EL).
The chosen chain of storm tides (EC; Fig. 4b) was found in one of the A1B climate realizations (November 2030). The longest event (EL) with water levels exceeding MHW for 45 h is included as the first event in the chain of storms. Furthermore, the highest high water of 4.66 m in EL just reaches the water level for a very severe storm tide and presents the second-highest event extracted from the data set (orange curve in Fig. 3). EL–EC includes in total seven storm high waters within 8 d.
The effective wind is used here as a relevant representative of the local wind activity. It is the projection of the horizontal wind vector on that direction which is most effective in producing surges at the coast (see e.g. Ganske et al., 2018). During EH and EL–EC the single events follow the effective wind variations shown exemplarily for Borkum (dashed black curves in Fig. 4). According to the classification of general weather situations causing severe storm surges along the German coasts (e.g. Kruhl, 1978), the storm tracks causing events EH and EL (not shown here) belong to the “North-West Type” (for areas of tracks of the different categories see Fig. 3 in Gerber et al., 2016).
3.1.2 Amplification analysis for selected extreme storm tides for Borkum
In the original EH, the maximum high water coincides with the maximum of the effective wind and the maximum surge occurs about 4 h before the astronomical high water. Figure 5 displays the original EH and the ensemble member with the highest high water obtained from the experiments with hourly shifting of wind and astronomical tide against each other. In this case, a 5 h shifting leads to the highest water levels. EH consists of two high waters (peak 1 and peak 2) classified as at least severe storm tides. After the amplification the higher peak 2 becomes smaller, whereas the lower peak 1 originally reaching 3.93 m now comes up to 4.88 m. Due to the diurnal inequality, peak 1 of the corresponding astronomical tide is about 20 cm higher than peak 2. Due to the 5 h shifting, peak 1 of the tide coincides with stronger wind velocities, whereas peak 2 coincides with weaker wind velocities. Thus, by only shifting the astronomical tide against the wind field, an amplification of the maximum high water in EH of 15 cm (from original 4.73 to 4.88 m) is obtained.
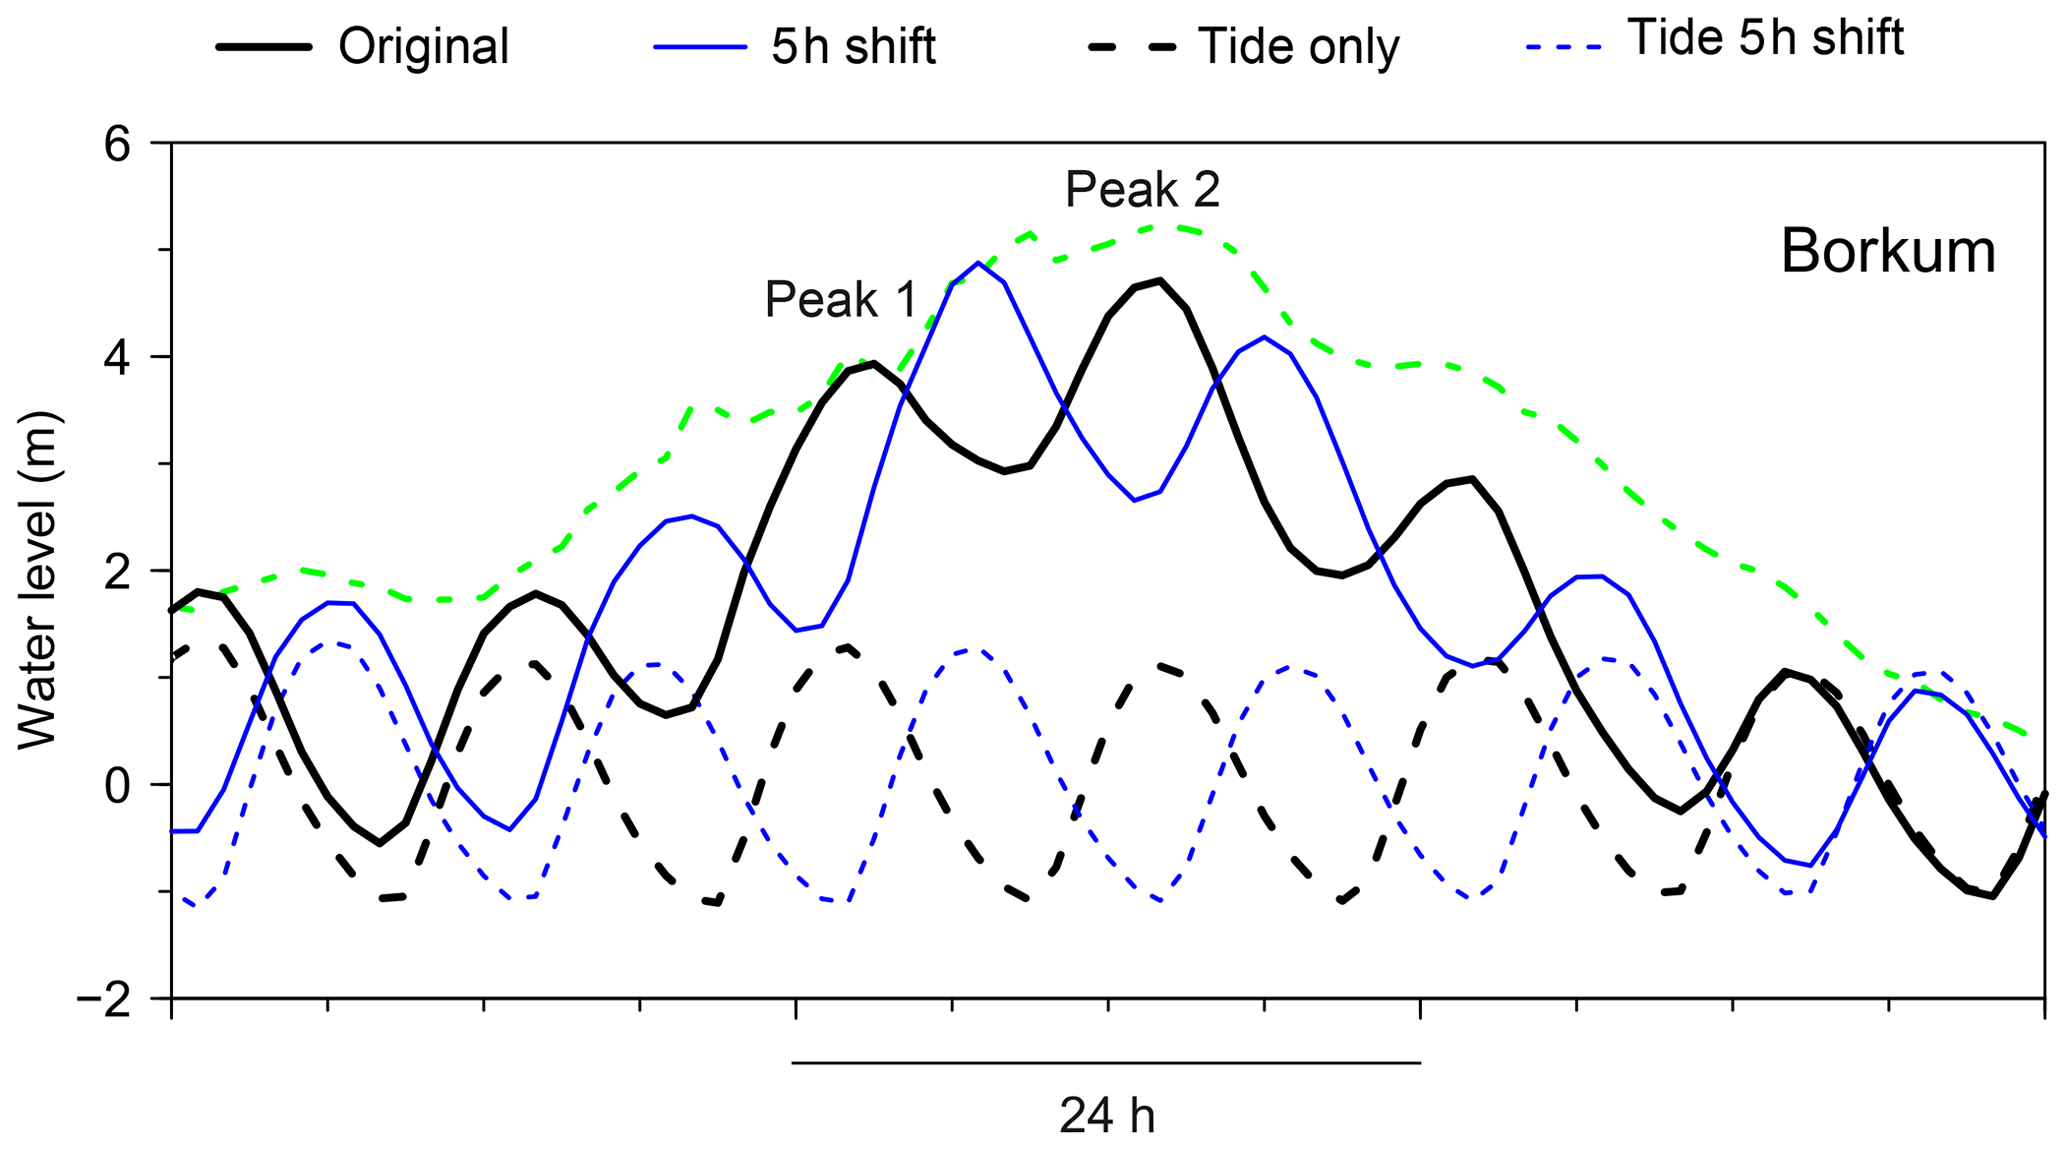
Figure 5Highest event (EH): time series of the original (solid black line) and amplified water levels (solid blue line) for Borkum together with tide-only time series (dashed black and blue lines); the amplification is due to 5-hourly shifting of the tide. The dashed green curve represents the effective wind (scaled from −10 to 30 m s−1).
Figure 6 shows the ensemble member with the highest high water from the simulation experiments with replacement of the original astronomical tide by the largest spring tide together with hourly shifting between astronomical tide and wind field. The high water of the replaced astronomical spring tide is about 40 cm higher than the astronomical high water of peak 2 in EH. This amplification procedure results in a high water of 5.23 m, presenting an amplification of 50 cm.

Figure 6Highest event (EH): time series of the original (black lines) and amplified water levels due to 5-hourly shifting of the tide (blue lines) and due to replacement of the original tide by the highest spring tide together with shifting of the tide (red lines) for three locations along the German Bight coast. The olive curves show water levels with the strongest amplification for Elbe mouth and Amrum.
For the original EH, the time period with water levels greater than MHW is about 33 h, corresponding to approximately three tidal cycles. Due to the amplification procedures, this time period varies by up to ±1 h with the exception of two ensemble members, for which it is prolonged by up to about four tidal cycles. For these two members, which show no amplification concerning the highest high water, the low water before peak 1 and the low water after peak 2 do not fall below MHW. For all other members, either the low water before peak 1 or the low water after peak 2 falls below MHW.
In the case of the longest event EL (included in EC, Fig. 4), both amplification procedures – shifting of the astronomical tide against the wind and replacement of the original astronomical tide with the highest spring tide together with shifting – result in an increase in the highest high water by only a few centimetres. In the original EL the highest high water already coincides with an astronomical spring tide about 7 cm lower than the highest one. Thus, both applied procedures lead to relative changes in the three highest water level peaks but not to a substantial absolute increase in the maximum water level during EL. Furthermore, the length of EL shows nearly no changes. Possible amplification was also tested for the entire EC including EL. The storm tides following EL experience an increase in some single high waters of up to 20 to 30 cm together with a decrease in other high waters for some ensemble members. Thus, there was no general amplification regarding the intensity (see Sect. 2.5) of EL–EC. Therefore, the amplification procedures for EL–EC were discarded.
For the subsequent fine-grid simulations and further analysis of effects in the Ems estuary, the water levels of the original EL–EC are used, whereas for EH the amplified water levels due to the spring tide replacement together with tide shifting are used, in the following mentioned as EH_a (Fig. 6, red curve).
3.1.3 Comparison of amplified extreme storm tides at different coastal strips
EH and EL–EC (Fig. 4) are analysed for Borkum for possible amplification. Although these highest events are selected and ranked for Borkum, they cause severe storms at the other coasts of the German Bight represented here by Elbe mouth and Amrum. In particular, EH and EL–EC give the second- and third-highest events at Elbe mouth and the third- and fourth-highest events at Amrum in the data set. From Fig. 4 it can be seen that the specific ranking of the single high waters during each event differs between the locations, but the duration of the events is comparable. The high water occurs about 1.3 and 2 h later at Elbe mouth and Amrum, respectively, compared to Borkum.
The effects of the amplification procedures adjusted for Borkum are exemplarily compared to those at Elbe mouth and Amrum for EH (Fig. 6). In general, the water level changes caused by the amplification procedures for Borkum are similar at the other two locations. In the case of the 5 h shift of the astronomical tide, peak 1 increases for Elbe mouth and Amrum as well. In the case of the replacement of the original astronomical tide with the spring tide and hourly shifting, peak 1 shows no or only small changes whereas peak 2 increases. Nevertheless, for the locations Elbe mouth and Amrum the relative impact of the two procedures differs from that for Borkum. At Elbe mouth both procedures cause similar maximum high waters of 5.35 m (+49 cm) and 5.23 m (+37 cm), respectively, during the event, whereas at Amrum the 5 h shifting results in the highest high water of 5.25 m (+56 cm) as there the original peak 1 is higher than peak 2.
The particular amplification mechanisms were adjusted to maximize water levels at Borkum. Thus, other time lags might lead to higher water levels at Elbe mouth and Amrum. This is demonstrated by the olive curves in Fig. 6 which show the highest amplified water levels for these two locations for different ensemble members. For Amrum, the blue and olive curves reach the same highest high waters, but for the olive curve the amplification is based on peak 2. For Elbe mouth the olive curve shows an amplification of 72 cm. The olive curves of both Elbe mouth and Amrum correspond to the same ensemble member, which incorporates both the largest spring tide and a phase shift of the tide.
Similar to Borkum, Elbe mouth and Amrum show some changes in the duration of water levels above MHW. For Elbe mouth, this time period is reduced by about one tidal cycle for a few members mainly with a replaced spring tide. For Amrum, this time period is prolonged by up to about one tidal cycle for a few ensemble members.
3.2 Extreme storm tides in the Ems estuary
3.2.1 Impact of river runoff (Q) and sea level rise (SLR) on water levels at Emden
Based on the fine-grid simulations of the German Bight, the impact of additional amplifications on the selected extreme events EH_a and EL–EC is investigated for the Ems estuary. Here, additional amplification refers to a sea level rise (SLR) and to an increase in river runoff (Q) of the Ems.
Time series of the water levels at Emden in the Ems estuary are shown in Fig. 7 for EH_a and in Fig. 8 for EL–EC with an operated storm surge barrier for a simulation without additional amplification and for simulations with increased Q and applied SLR. EH_a reaches peak water levels of 6.61 m at Emden without additional amplification, which is 5.13 m higher than the long-term mean tidal high water level MHW of 1.48 m (DGJb, 2018) and leads to the classification of EH_a as a very severe storm tide which is in agreement with its classification at Borkum. EL–EC reaches peak water levels of 5.96 m at Emden, which also classifies the event as a very severe storm tide. Both events reach water levels that exceed the highest observed water level of 5.17 m at Emden (1906; DGJb, 2018).
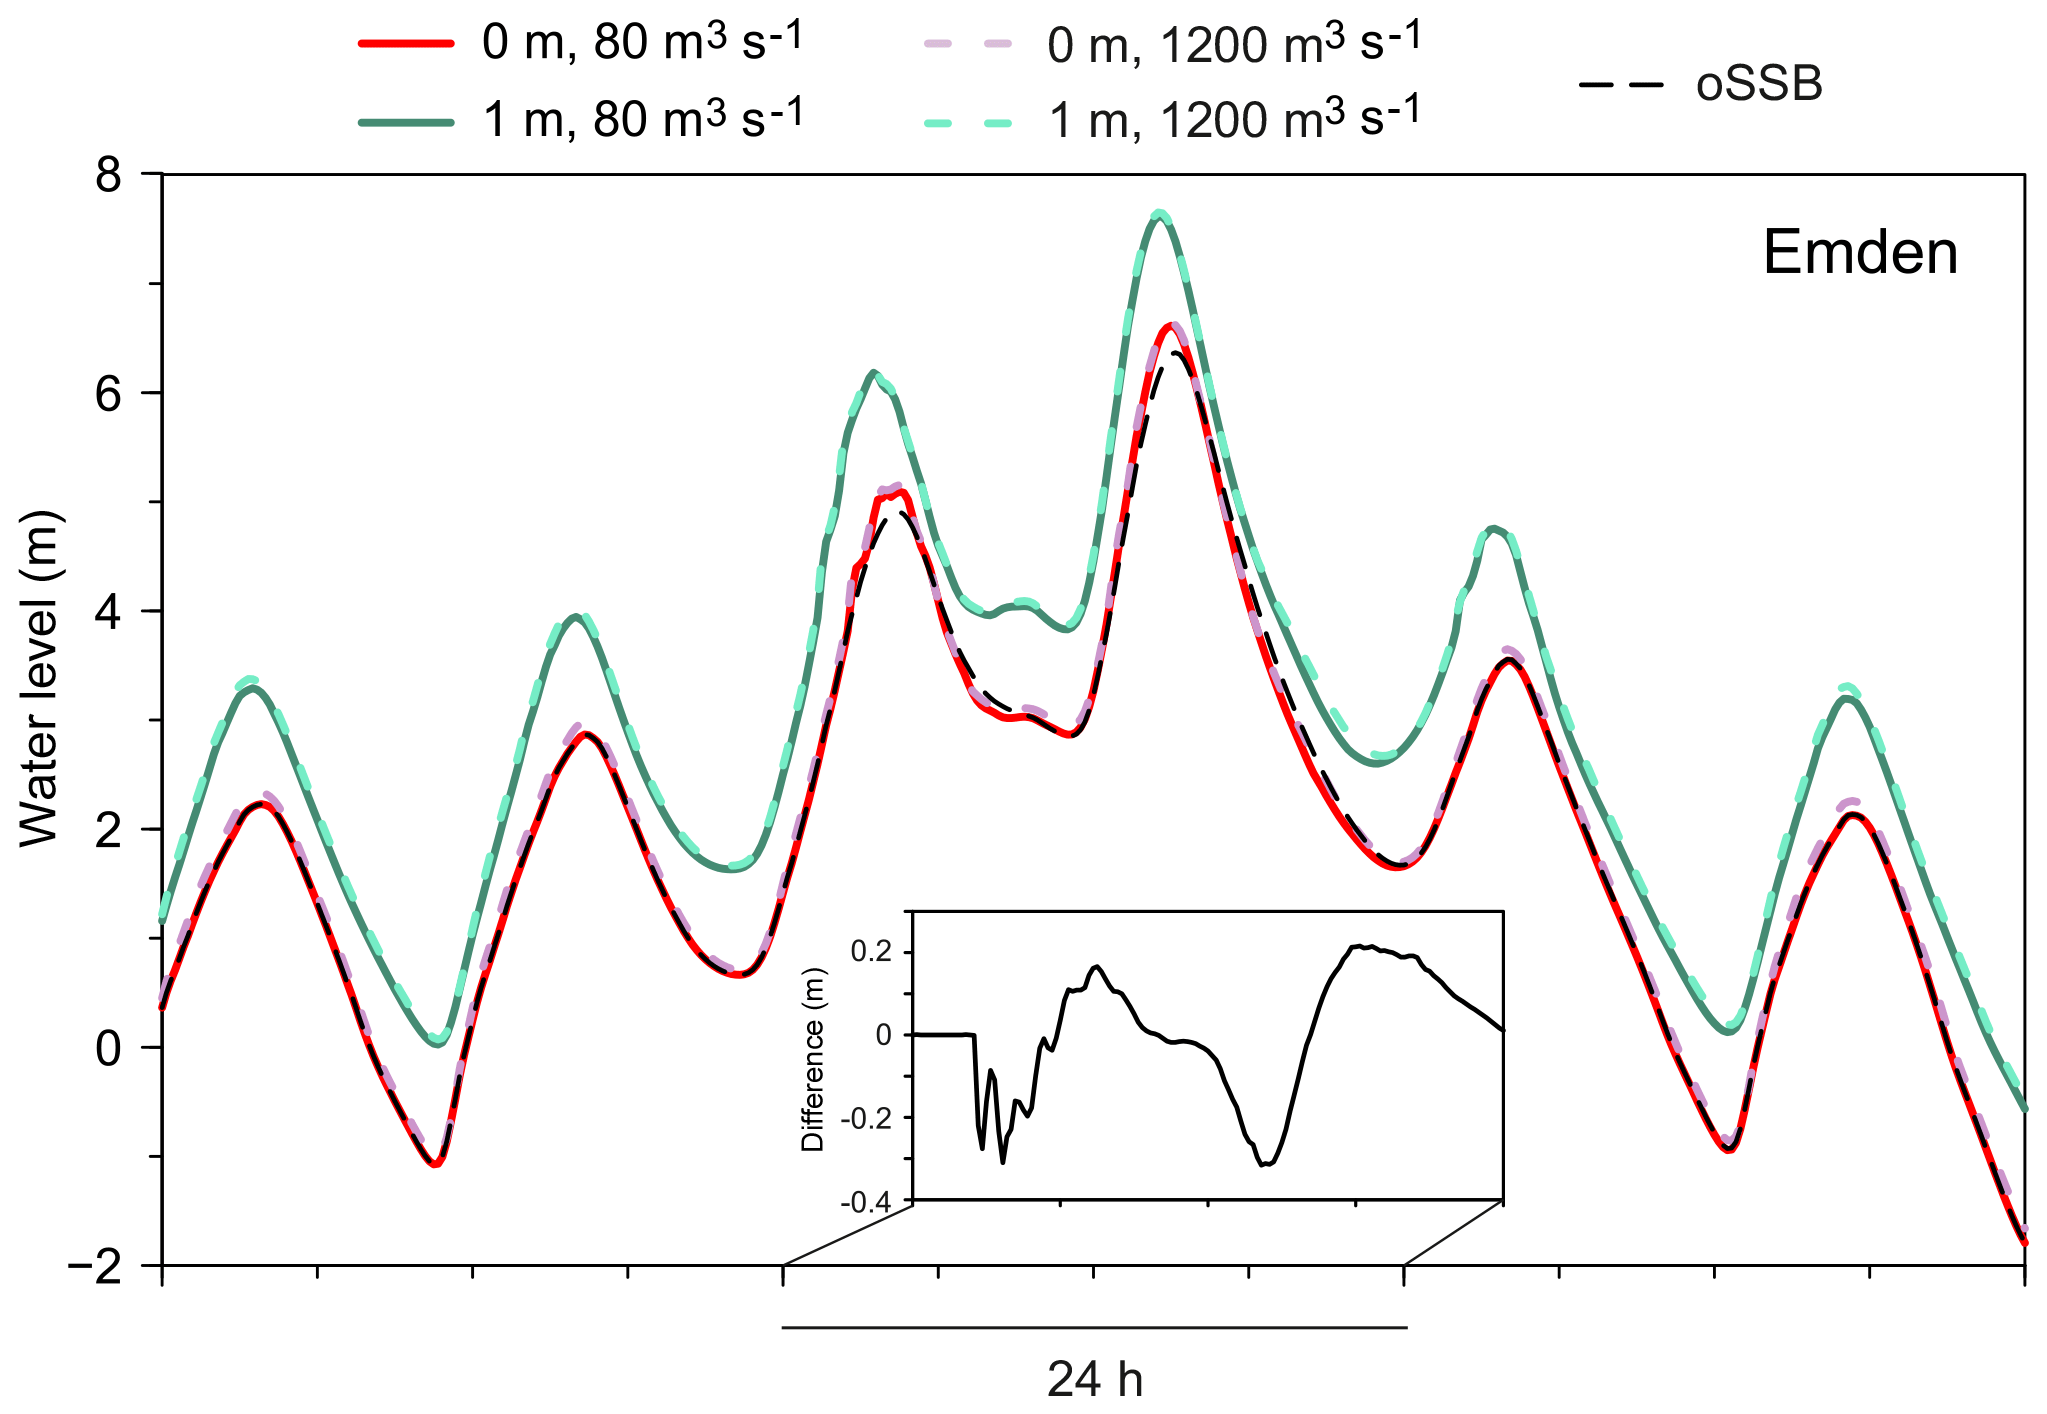
Figure 7Highest event (EH_a): time series of the amplified water levels for the location Emden in the Ems estuary. The two solid and two dashed coloured curves display the water levels for Q equals 80 and 1200 m3 s−1 and a SLR of 0 and 1 m, respectively, and an operated storm surge barrier. As the impact of Q on the water levels at Emden is small, the dashed coloured curves nearly match the corresponding solid coloured curves. The dashed black curve shows water levels for an open storm surge barrier (oSSB), for Q=80 m3 s−1 and no SLR. The inset shows the differences between the water levels for an operated (red curve in the main panel) and open (dashed black curve in the main panel) storm surge barrier over 24 h.
Changing the river runoff from 80 to 1200 m3 s−1 increases the tidal high and low waters at Emden by only a few centimetres (see Figs. 7 and 8, red and dashed lilac lines). This effect is even weaker for the storm tides (see events with open storm surge barrier in Table 1). In the wide and deep estuarine part near Emden the tidal volume strongly exceeds the river runoff so that the impact of river runoff on water levels is small. As the tidal volume is increased during the storm tide, the impact of river runoff is even smaller during this period.
Table 1Highest water levels and their occurrence times at Emden are given for simulations with varying river runoff Q, sea level rise SLR and modes of operation for the storm surge barrier. The occurrence time of the highest water level is given relative to the Ems kilometre 107 (Hubertgat).
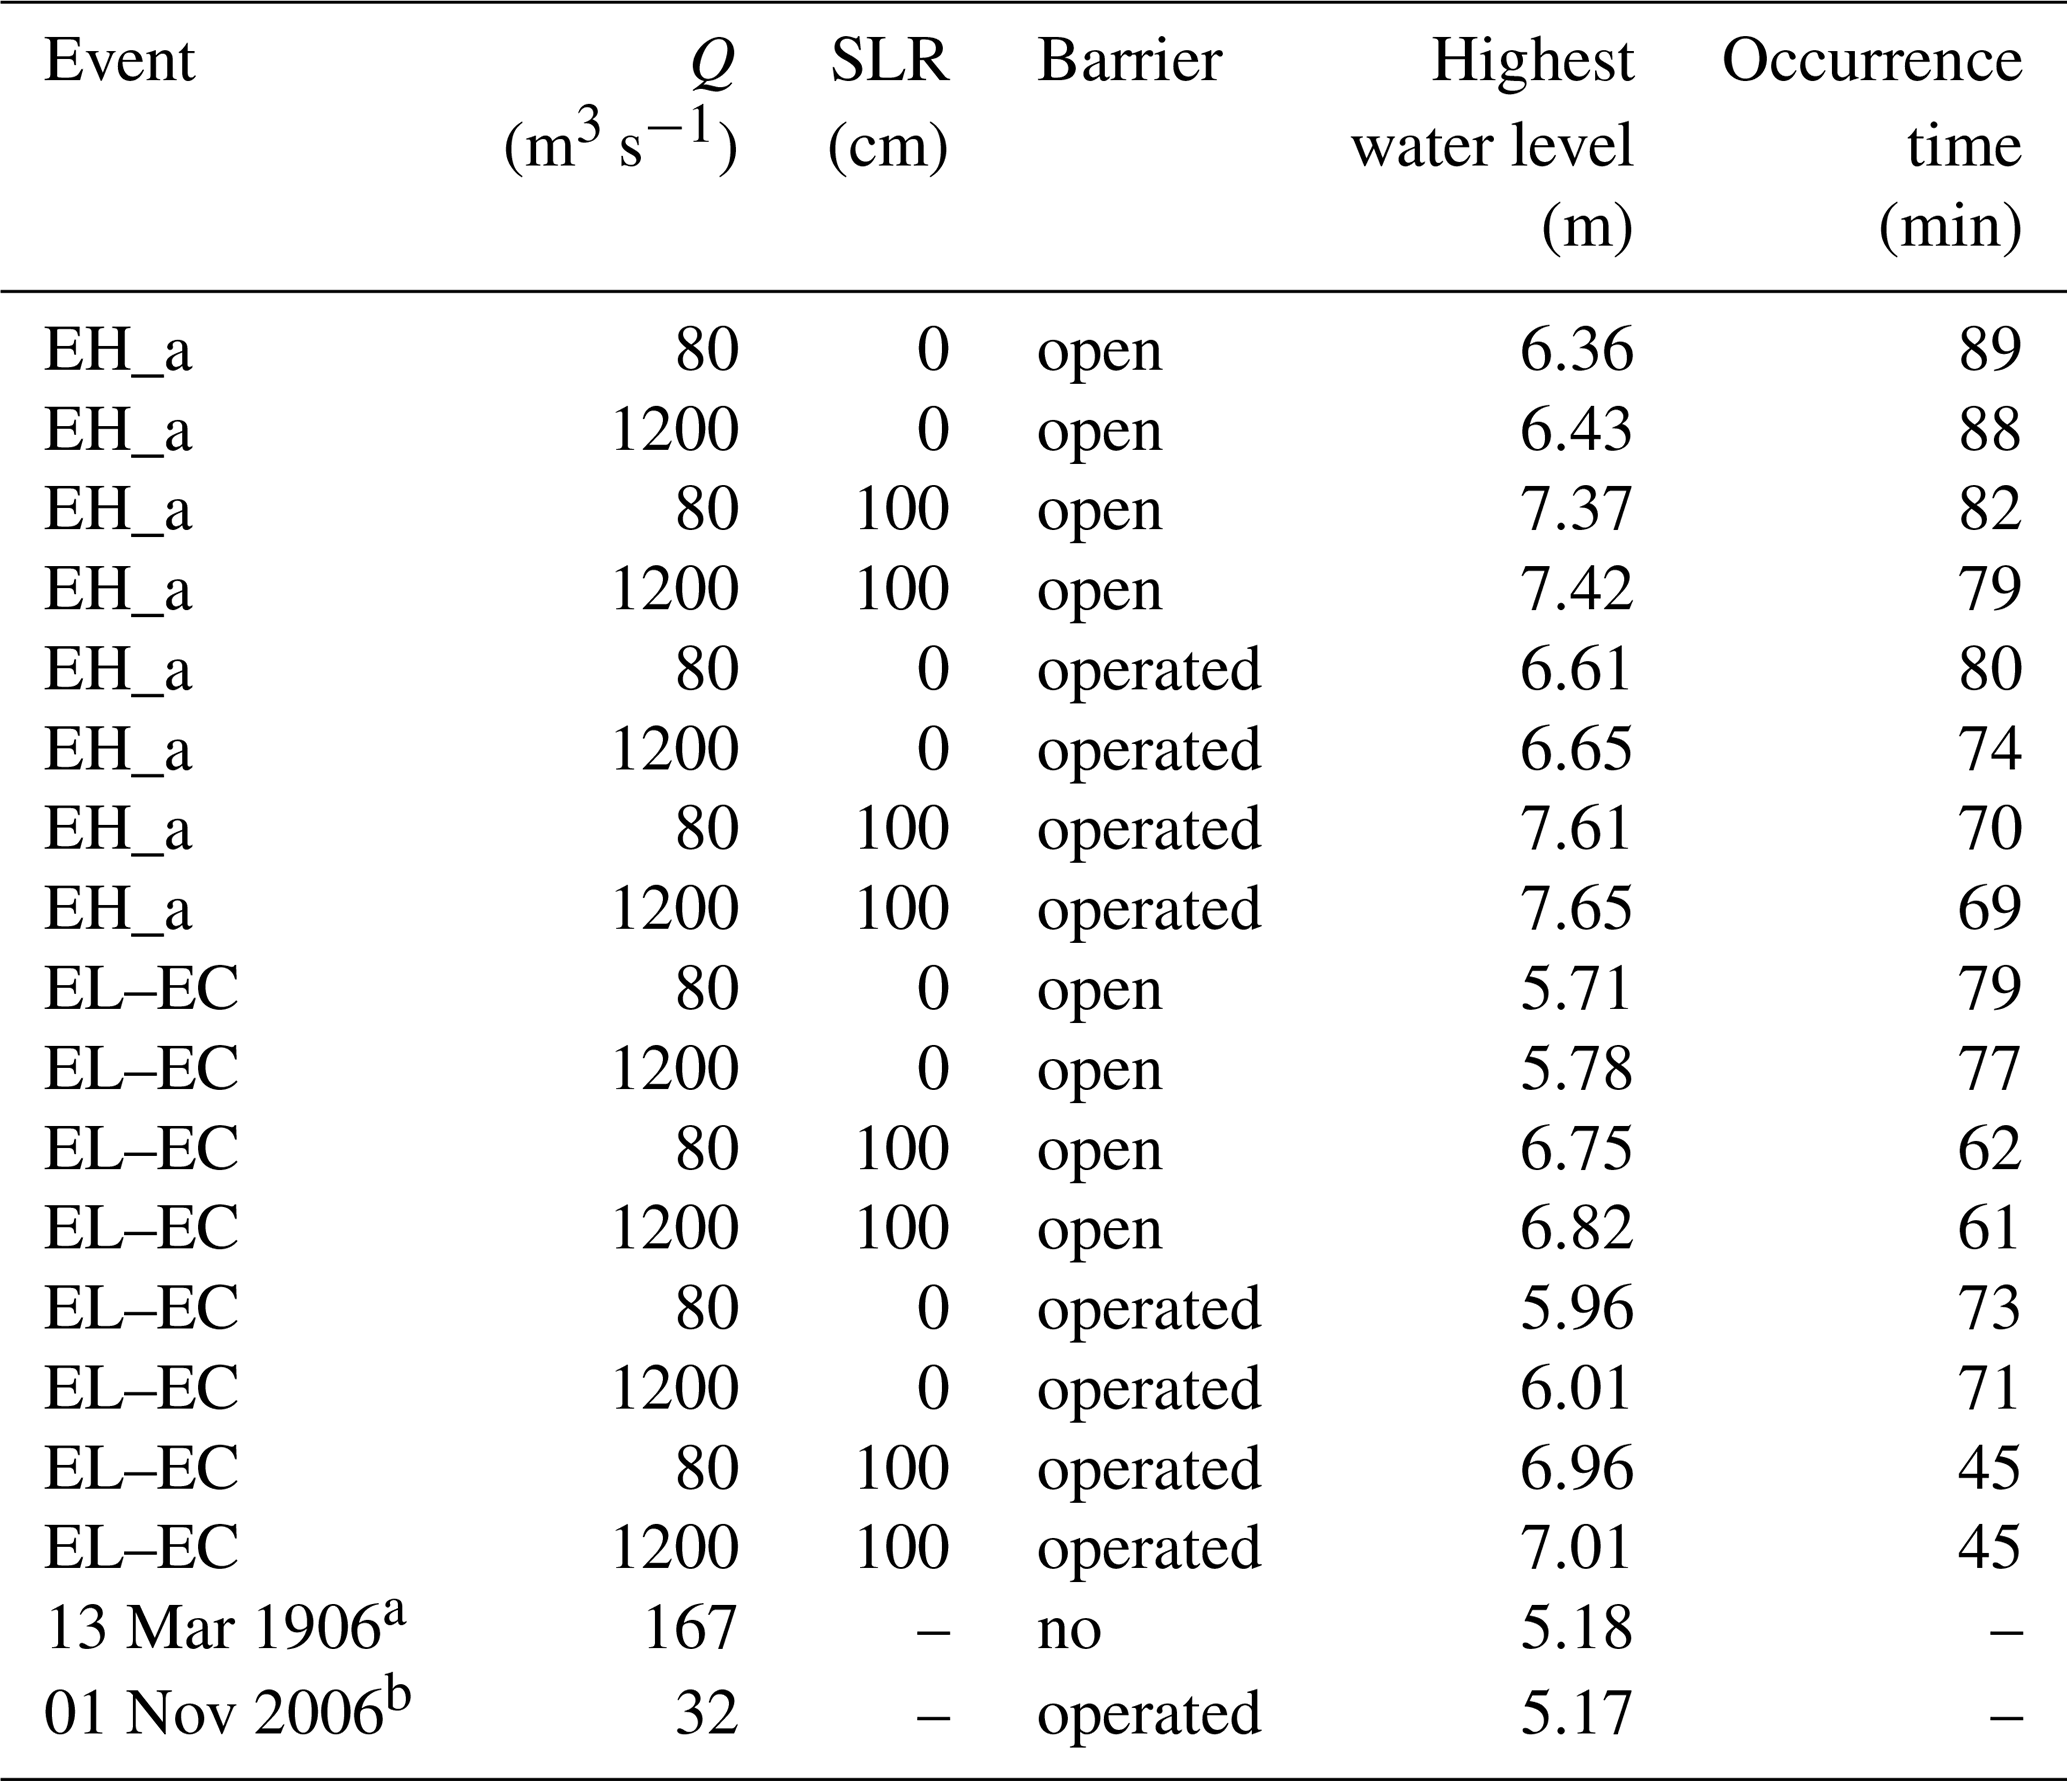
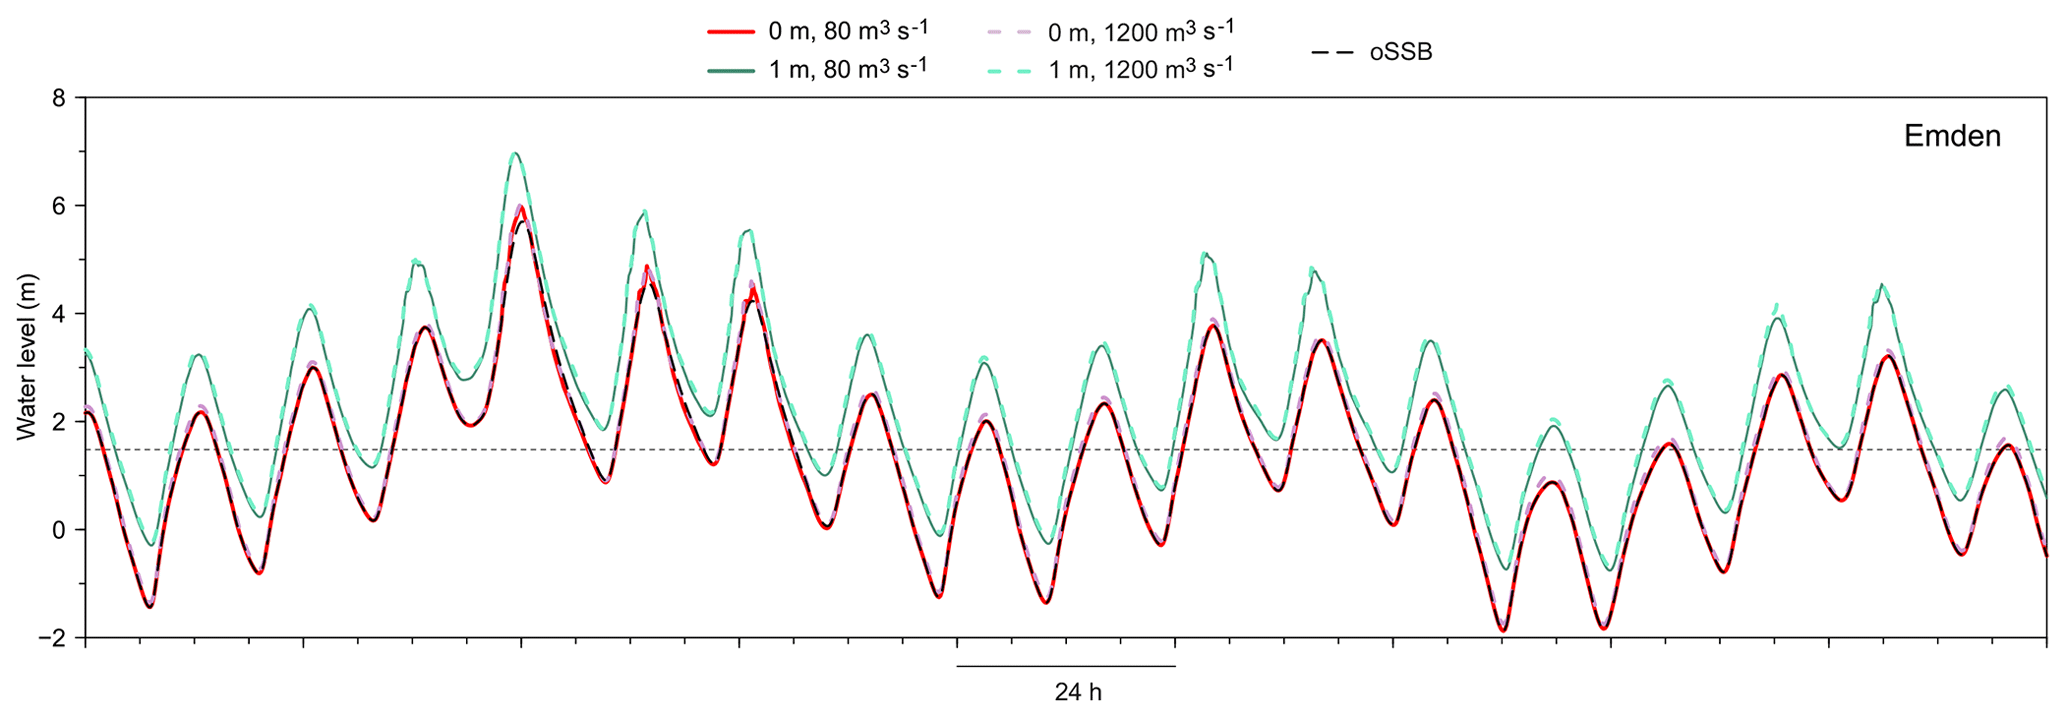
Figure 8Longest event and event chain (EL–EC): times series of the amplified water levels as in Fig. 7. The dashed horizontal line represents MHW.
At Emden, applying a SLR to the events leads to an increase in tidal high water, tidal low water and the highest water level during the storm tide in the range of the applied SLR (Figs. 7 and 8 and Table 1). This behaviour can be seen in both EH_a and EL–EC. The observed influence of river runoff and sea level rise agrees with the behaviour analysed in a sensitivity study by Rudolph (2014).
Increasing the river runoff results in nearly no change at Emden in the occurrence time of the highest water during the storm tide (see events with open storm surge barrier in Table 1). The increased water depth caused by a sea level rise increases the propagation velocity of the tidal wave entering the Ems estuary, which causes the tidal high water to occur earlier by 10 to 20 min at Emden (Table 1) for the events investigated.
For EH_a the time period with water levels greater than MHW is about 33 h, similar to the time period at Borkum. Due to an increase in runoff to 1200 m3 s−1 or to a sea level rise of 0.5 m this time period shows only small changes of less than an hour. But for a sea level rise of 1 m this time period is prolonged by one tidal cycle up to about 45 h (Fig. 7). For EL the time period with water levels continuously higher than MHW is about two tidal cycles. This differs from the conditions at Borkum where four consecutive tidal cycles are continuously above MHW. In the Ems estuary the tidal range is greater than at Borkum with lower low waters and higher high waters. Thus, the time periods around the two low waters following the highest high water are below MHW for about 2 to 3 h. In the case of a sea level rise of 1 m EL is prolonged by two tidal cycles as the mentioned two low waters become higher than MHW (Fig. 8).
3.2.2 Impact of Q and SLR on the highest water levels along the Ems estuary
To investigate the influence of Q and SLR along the Ems estuary, the highest water levels during EH_a and EL at each location along the longitudinal profile are analysed for simulations with an open storm surge barrier. Closing the barrier separates the estuary into two parts and alters the effects of Q and SLR.
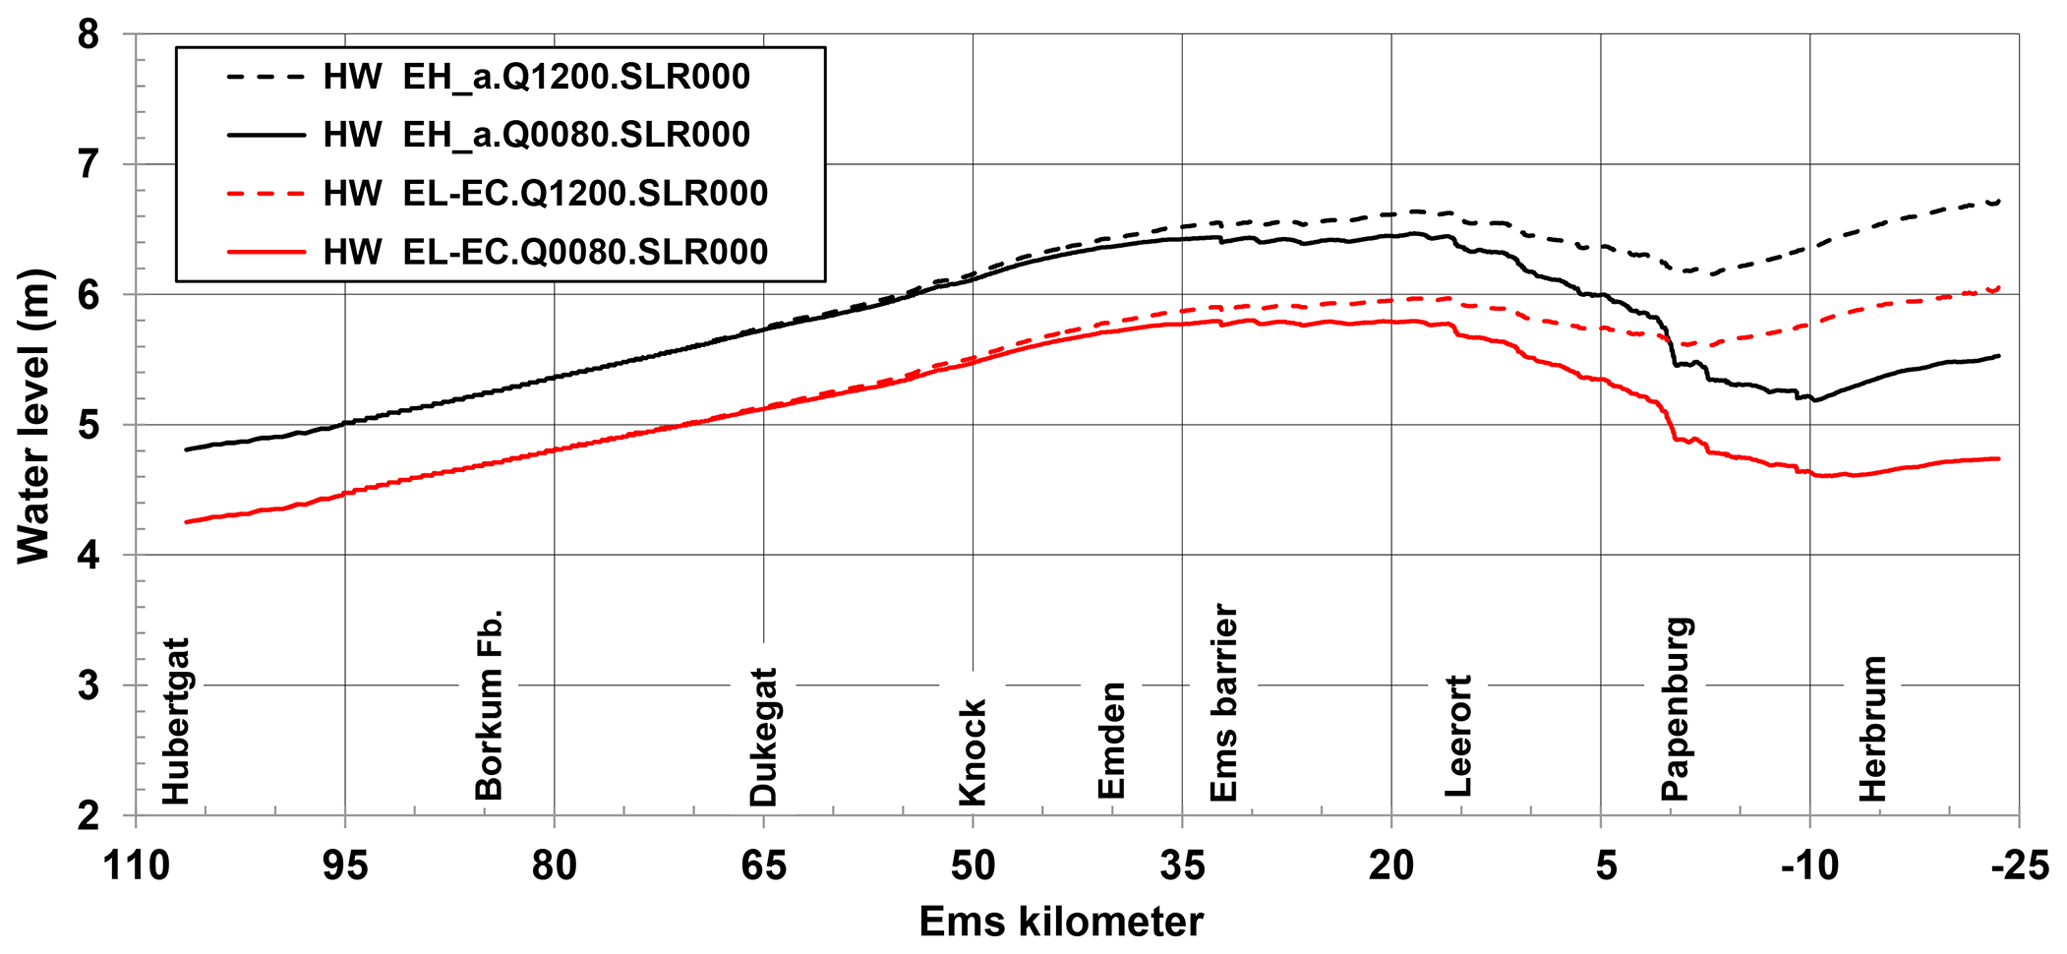
Figure 9Highest water levels along a longitudinal profile in the Ems estuary during EH_a (black lines) and EL–EC (red lines) for Q=80 m3 s−1 (solid lines) and Q=1200 m3 s−1 (dashed lines) for an open storm surge barrier without SLR.
Figure 9 shows the impact of an increase in Q from 80 to 1200 m3 s−1 on the highest water levels for both EH_a (black lines) and EL–EC (red lines). For both events, the increased river runoff raises the highest water levels by several decimetres in the narrow and shallow upper part of the Ems estuary upstream of the Dollart. The influence of Q on the highest water levels decreases towards Dukegat where the Ems becomes deeper and wider and disappears towards the mouth of the estuary. As mentioned before, Emden is located in an area of the Ems estuary where the influence of the river runoff on the highest water levels is in the range of some centimetres (see also Figs. 7 and 8 and Table 1).
Upstream of Papenburg the influence of the bathymetry on the highest water levels during storm surges can be observed clearly marked by a sudden decrease in the highest water levels in the case of low discharge. In the area of Papenburg the estuary is very narrow and the dike line is close to the estuary, whereas the upper part of the estuary is characterized by wide foreshore areas that are flooded only during events of high discharge or storm tides. In addition, the depth of the estuary decreases significantly upstream of Papenburg. This part of the Ems estuary is not used as a waterway for seagoing ships.
The described bottleneck close to Papenburg prevents the water during a storm tide to enter the upstream area undisturbed, which results in lower water levels in this area. For events with high river runoff the wide foreshore areas upstream of Papenburg can already be flooded before the storm tide depending on the amount of runoff and the height of the tide before the storm tide.
Applying a SLR of 50 or 100 cm while the river runoff remains unchanged at 80 m3 s−1 leads to a longitudinally varying increase in the highest water levels along the whole estuary for both EH_a and EL–EC (Fig. 10a). The difference in maximum water levels between a simulation with SLR and a simulation without SLR (Fig. 10b) shows for both EH_a and EL–EC that the maximum water levels downstream of Leerort are increased by the amount of the applied SLR with small deviations in the range of a few centimetres. The impact of the SLR on maximum water levels decreases between Leerort and Papenburg. The rate of decrease depends on the magnitude of the applied SLR. For a SLR of 0.5 m and 1 m maximum water levels drop by about 20 %. Upstream of Papenburg, the impact of the SLR changes depending on the event (Fig. 10).
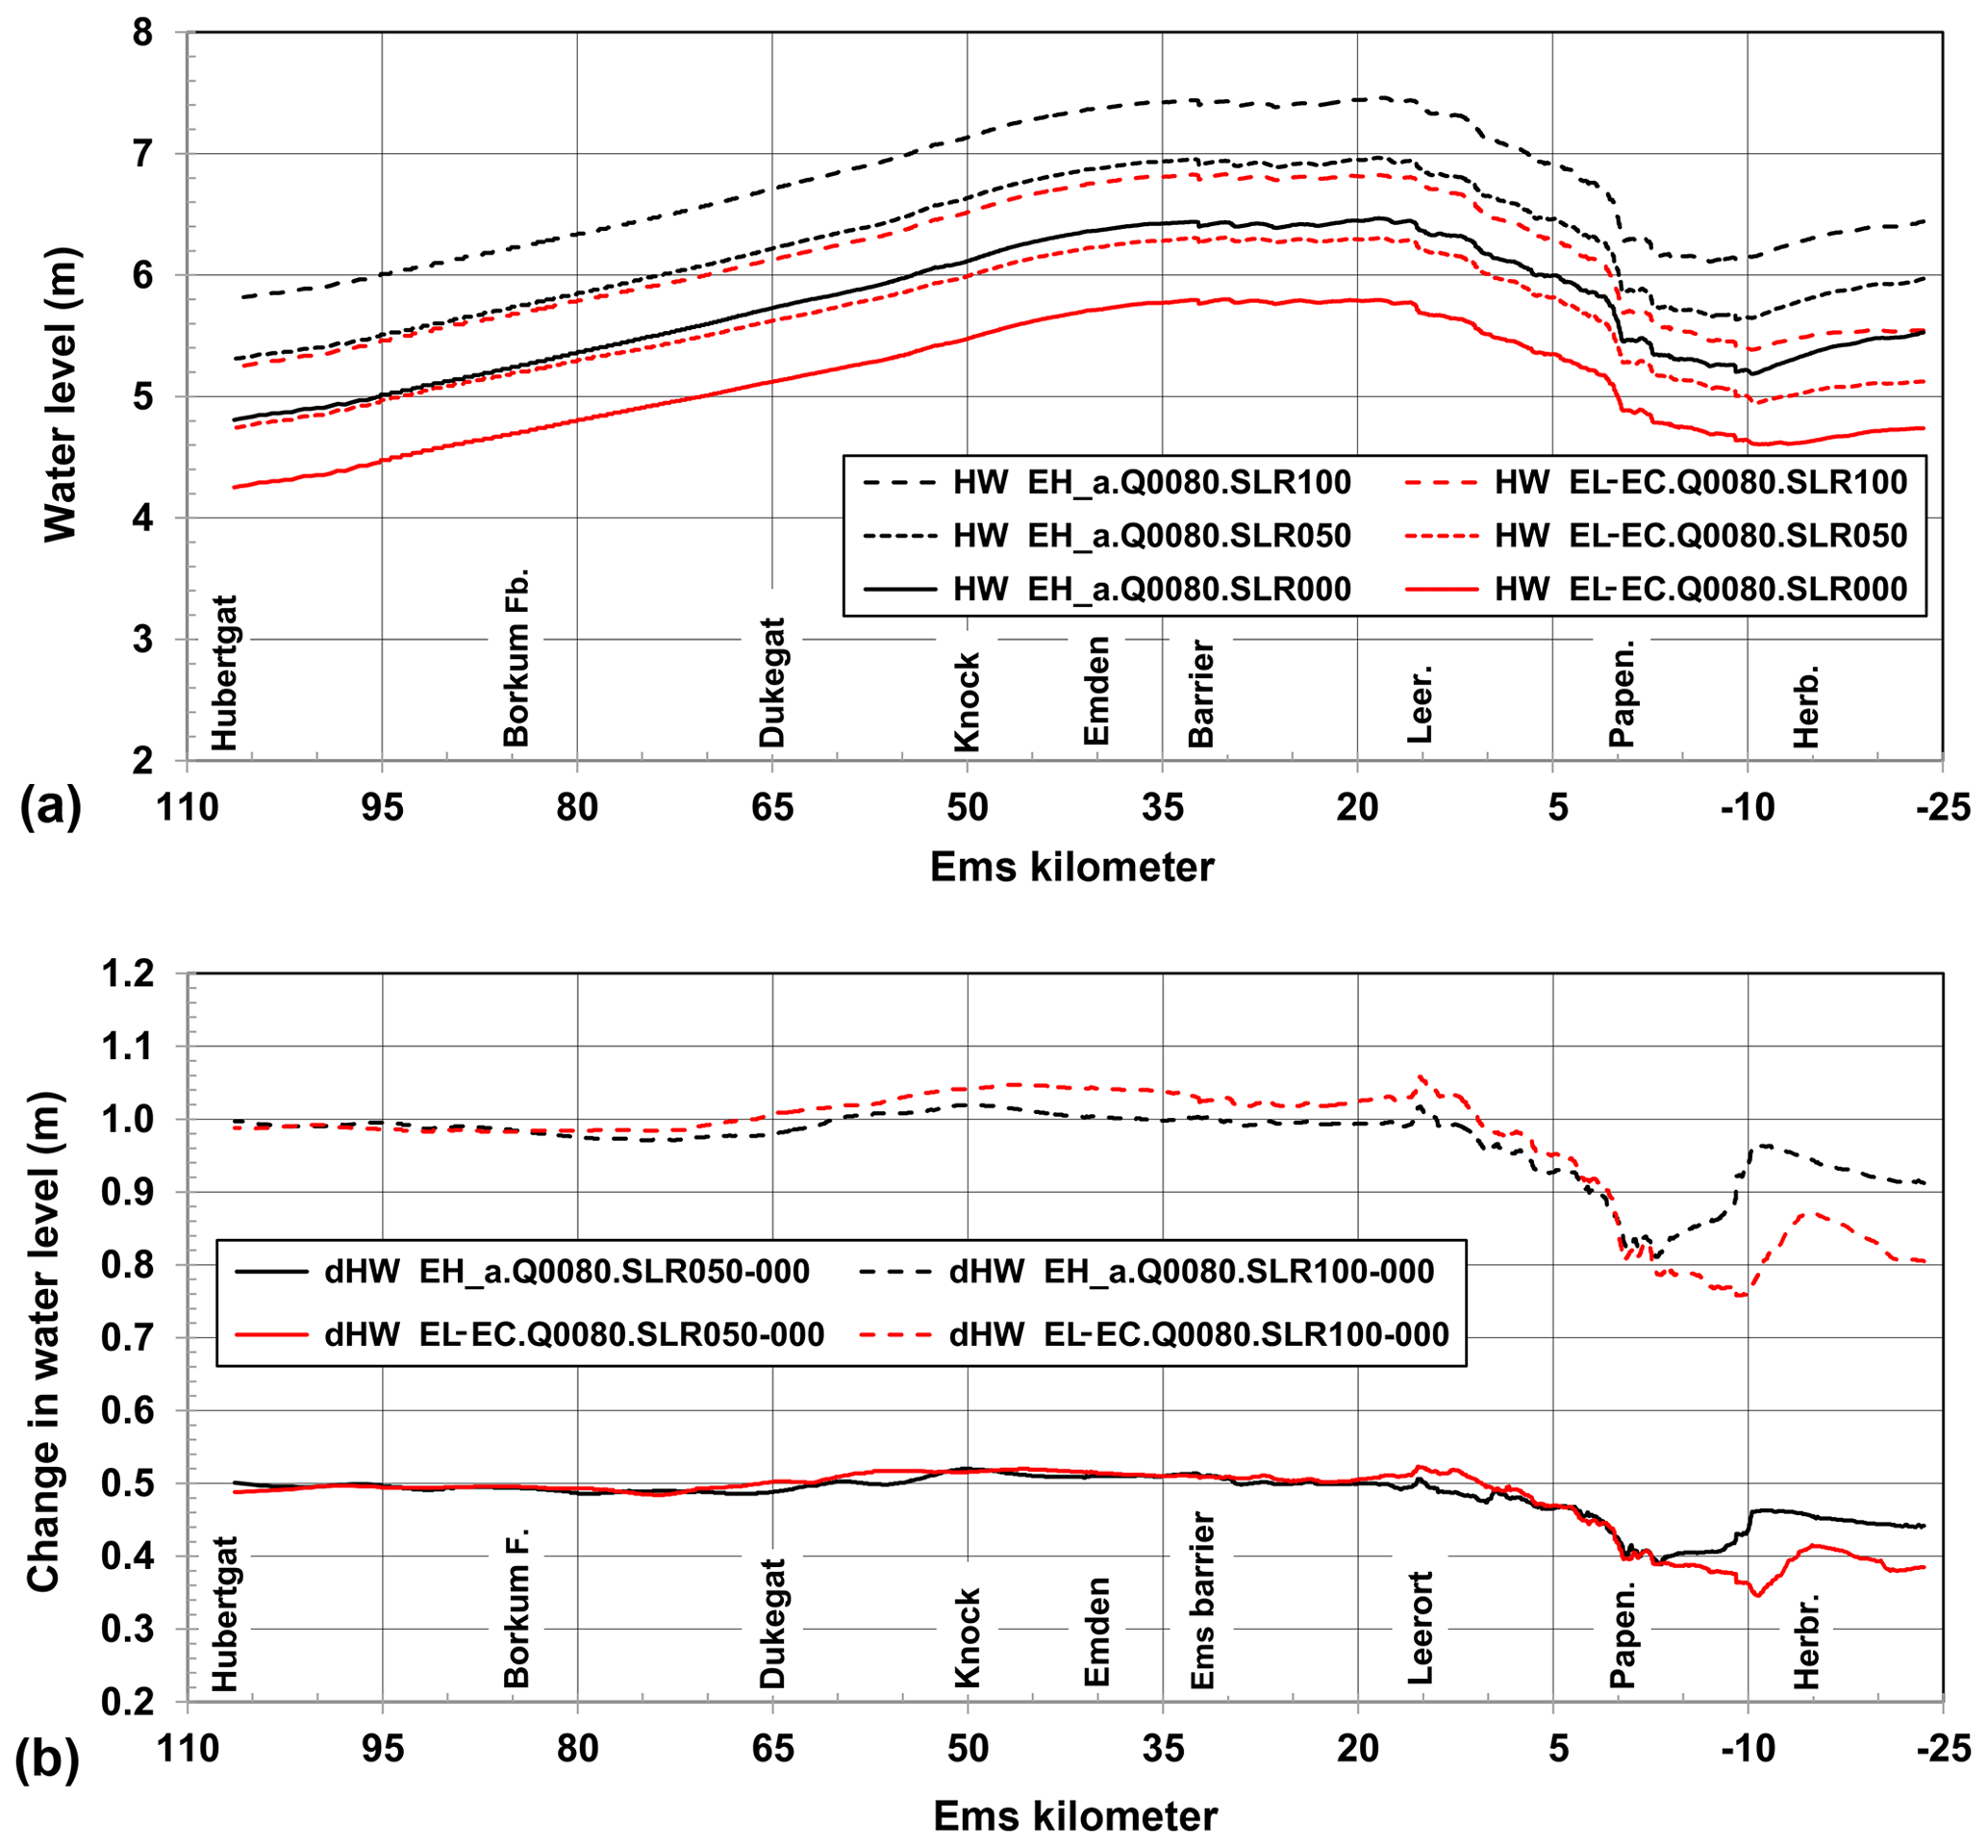
Figure 10(a) Highest water levels along a longitudinal profile in the Ems estuary during EH_a (black lines) and EL (red lines) for SLR =0 cm (solid lines), SLR =50 cm (dotted lines) and SLR =100 cm (dashed lines) for an open storm surge barrier and Q=80 m3 s−1. (b) Differences in the highest water levels between simulations with and without SLR along the Ems estuary during EH_a (black lines) and EL (red lines) for Q=80 m3 s−1 (dashed lines for SLR =100 cm, solid lines for SLR =50 cm). The storm surge barrier is open.
During storm tides not only are questions concerning coastal protection important but also the draining of the protected areas must be ensured. In the lowlands close to the mouth of the Ems, draining of urban (e.g. Emden) and agricultural areas (e.g. Knock) is of major interest. The aim of the sewer at Knock is to drain the low-lying hinterland (with a ground level of about NHN + 0 m) and keep the inland water level at Knock lower than NHN − 1.40 m (KLEVER, 2018). At Knock the mean low water MLW is NHN − 1.58 m so that draining without pumping is only possible for a short time even during mean tides. Caused by long-lasting high water levels during storm tides, draining is even more restricted.
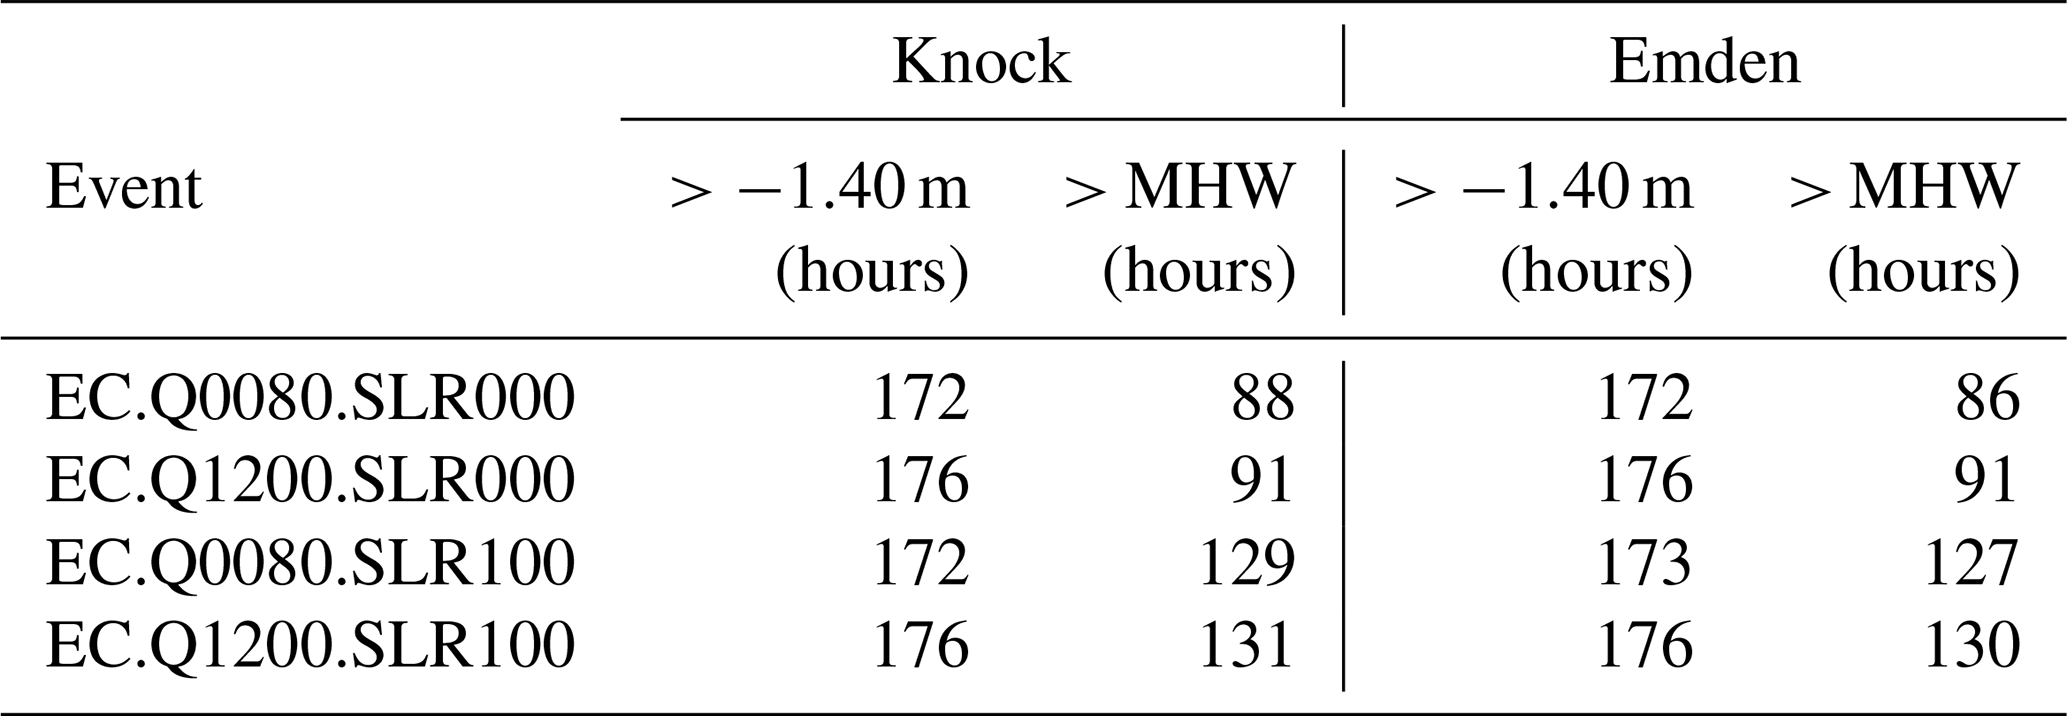
For the chain of storm tides EC (Fig. 8) even without amplification pumping is needed nearly during the whole period of 176 h (Table 2). The water must be pumped against a water level in the Ems higher than MHW for about 90 h. This period will increase by about 40 h in the case of a sea level rise of 100 cm.
Table 2Duration of water levels higher than a selected threshold (here NHN − 1.40 m) and MHW (at Knock MHW = NHN + 1.39 m; at Emden MHW =1.48 m) for EC with varying river runoff Q, sea level rise SLR and an operated storm surge barrier. The period investigated covers 176 h.
3.2.3 Influence of the storm surge barrier in the Ems estuary
For the investigation of the impact of SLR and runoff along the Ems estuary as shown above, the storm surge barrier in the Ems is considered to be open. When operated, the storm surge barrier in the Ems has a significant influence on the highest water levels both upstream and downstream (Fig. 11). The barrier is closed at a defined water level of NHN + 3.50 m and reopened when the water levels on both sides of the barrier are equal.
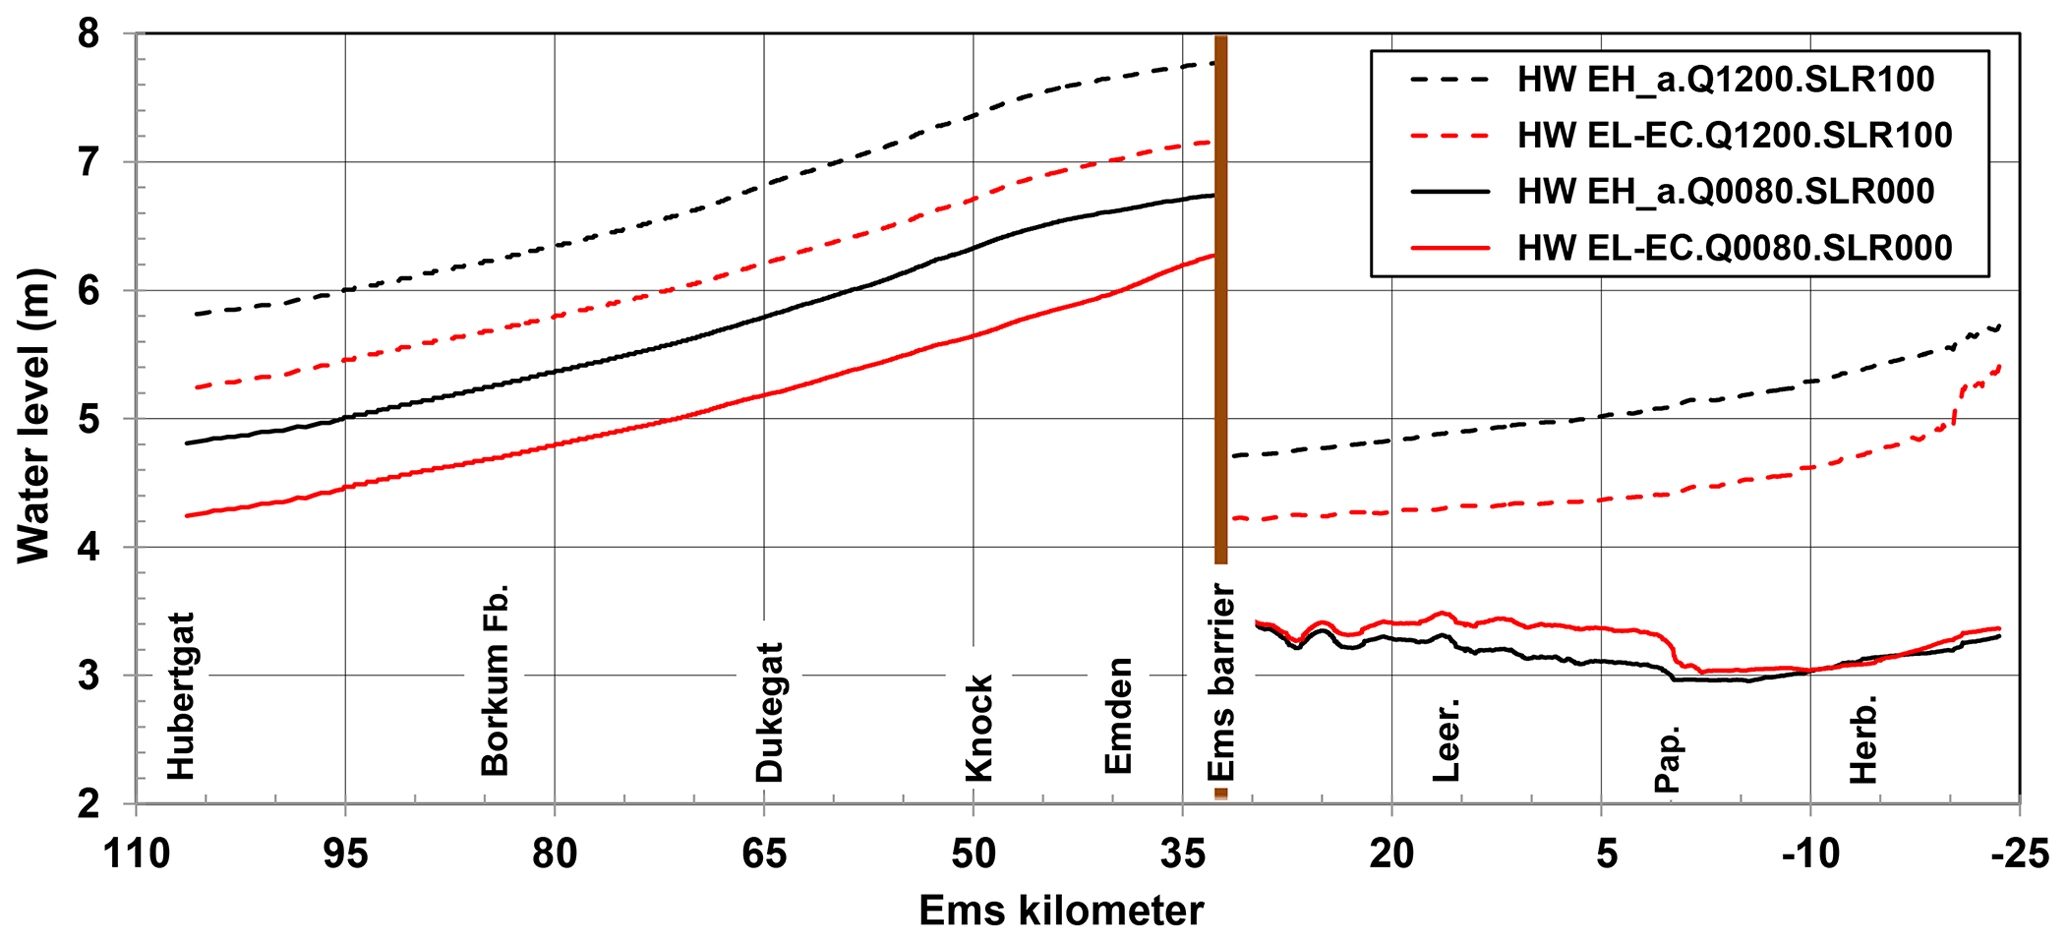
Figure 11Highest water levels along a longitudinal profile in the Ems estuary for an operated storm surge barrier without further amplification (Q=80 m3 s−1, SLR =0 cm; solid lines) and a simulation with amplified conditions (Q=1200 m3 s−1, SLR =100 cm; dashed lines) for EH_a (black lines) and EL (red lines).
In the protected area upstream of the barrier the water levels are no longer influenced by the storm tide coming from the North Sea. Only the amount of river runoff that flows into the protected area in the period the barrier is closed contributes to the highest water level.
Downstream of the barrier, highest water levels increase compared to a simulation with an open barrier (black curves in Figs. 9 and 11; see also time series at Emden in Figs. 7 and 8, red and dashed black curves). This is due to two main reasons. Firstly, the sudden stopping of the impulse of the tidal wave at closure leads to a positive surge downstream of the barrier and a negative surge upstream of the barrier. The positive surge induces a self-oscillation in the Dollart basin in which the period of oscillation depends on the geometry and the actual water depth of the Dollart basin. The created surge will be weaker when current velocities are lower and can be avoided when closing the barrier at slack water time.
This effect can be observed e.g. in Fig. 7 looking at the water level of EH_a (red line) and in the inset of Fig. 7 showing the difference between the water levels for an operated and open storm surge barrier. The storm surge barrier is closed at a defined water level (NHN + 3.50 m) and not at a defined time in the tidal phase. For the first storm tide the storm surge barrier is closed during the flood current. The induced surge and the subsequent oscillation cause an unsteady rise in the water level. For the second storm tide the water level of 3.50 m is reached during slack water time. As the storm surge barrier is closed during a period of nearly no current velocity, no surge is induced and a steady rise in the water level is observed. This behaviour was investigated in detail in BAW (2007).
The second process increasing the highest water levels is the shortening of the estuary that takes place when the barrier is closed. This reduces the stretch where dissipation of the tidal wave can occur and leads to the reflection of a more energetic wave and results in an increase in the highest water levels. This behaviour has been investigated in other studies and is also described in BAW (2007). The size of the increase in the highest water levels has been studied in e.g. Rego et al. (2011).
Summarizing, a closed storm surge barrier will always lead to increased highest water levels downstream of the barrier but the magnitude of the increase depends on the current velocity conditions present at closure. In the case of the analysed events, at Emden this increase ranges between 19 and 25 cm (Table 1). In general, the highest water levels are reached close to the storm surge barrier and they decrease towards the river mouth. Closing the barrier keeps the storm tide out of the area upstream. Only the river runoff fills the protected area during the period when the barrier is closed. Consequently, closing the barrier during a storm tide leads to significantly lower highest water levels upstream of the barrier (Fig. 11).
Applying a SLR and an increased Q to events with an operated storm surge barrier leads to increased highest water levels downstream of the barrier due to the SLR and increased highest water levels upstream of the barrier due to the runoff coming from upstream (Fig. 11). This holds true for all events and respective simulations. Figure 11 demonstrates how the water level upstream depends on the length of the period with a closed barrier. For a SLR of 1 m and a runoff of 1200 m3 s−1, the water levels during EH_a are considerably higher than those for EL although for the reference cases (no SLR, mean runoff) the water levels are similar. For EH_a the barrier has to be closed for the first storm tide (Fig. 7) and can only be reopened after the second storm tide due to the considerably elevated water levels around low tide. This leads to a continuous closure period of 17 h. For EL the water levels allow the closing and opening of the barrier for each storm tide separately (Fig. 8) leading to a closure period of 7 h 5 min. Combining these different closure periods with the extreme runoff results in lower water levels for EL than for EH_a upstream of the barrier. In the case of mean runoff and no sea level rise the length of the closure period does not influence the highest water level during the storm tide upstream of the barrier. It shows that the protected area upstream of the barrier is big enough to store even the extreme discharge of 1200 m3 s−1 for all closure periods investigated. For all events and amplifications the highest water levels upstream of the operated barrier remain lower than those reached in the case of the open barrier (Figs. 10 and 11).
The highest water levels at Emden for the simulations without further amplification and an operated storm surge barrier are 6.61 m for EH_a and 5.96 m for EL–EC (Table 1). Applying amplified conditions (Q=1200 m3 s−1 and SLR =1 m) leads to an increase in the highest water levels to 7.65 m for EH_a and 7.01 m for EL–EC (Figs. 7 and 8). The highest measured water level at Emden is 5.17 m (DGJb, 2018). Thus, the extreme events EH_a and EL–EC identified and elaborated in this study exceed this water level even without the application of further amplification by river runoff and sea level rise.
This study aims to find extreme storm tides in the North Sea and Ems estuary that are physically possible but have not been observed yet. Numerical simulation data for the North Sea from both hindcast and climate realizations have been searched to detect extreme storm tides, i.e. storms causing very high water levels (EH), water levels that exceed mean tidal high water for a longer duration (EL) or multiple storm tides that occur within 1 week (EC). These events originate from the first half of the emission scenario period of two different climate realizations. Gaslikova et al. (2013) showed that the annual maximum water levels of these climate realizations displayed strong multi-decadal variability but no significant long-term trends from 1961 to 2100. Thus, the highest water levels found, exceeding the water levels measured since the beginning of the 20th century at Borkum (Fig. 3), could already be possible under present-day conditions as no sea level rise is included in the original climate realizations.
Using numerical simulations for the North Sea, the selected events were amplified by shifting the astronomical tide against the wind field for the optimization of their interaction and by inserting the highest spring tide from the data set. By these amplification procedures based only on the co-timing of the atmospheric storm and the tidal phase, the water level at Borkum is increased by about 50 cm and a maximum water level of 5.23 m is reached for EH_a, thus exceeding the highest measured event in 1906 by more than 1 m (see dashed red line in Fig. 3). Moreover, the enhancement mechanisms proposed in this study except sea level rise are realistic under the present-day conditions and thus a storm tide like the amplified EH_a could occur nowadays.
Using a high-resolution model for the German Bight and the Ems estuary, the extreme events EH_a and EL–EC were further studied in the context of an extreme river runoff of 1200 m3 s−1 and increased mean sea level by 0.5 and 1 m. The river runoff has the largest impact on the highest water levels upstream of Herbrum in the narrow part of the Ems where it leads to an increase of about 1 m. The impact decreases downstream as the Ems becomes wider and deeper and disappears completely downstream of Dukegat. The amplified conditions due to sea level rise increase the water levels in the estuary from the mouth up to the area of Papenburg by approximately the applied amount of sea level rise. Upstream of Papenburg, the river runoff dominates and the influence of sea level rise on the highest water levels decreases. Both the sea level rise and the increase in river runoff lead to an increase in water levels and to a longer duration of higher water levels along the Ems estuary. In addition, a sea level rise results in an earlier occurrence of the highest water level during a storm surge in the central part of the estuary on the order of 10 to 20 min (Table 1).
Against the background of climate change and the need to develop future coastal protection strategies, it is important to know not only the possible height of an extreme event but also its duration. Moreover, EC shows that several high storm tides within a week could be possible. The low-lying land protected by dikes in this area is drained both using the gradient in the water level towards the Ems and with pumps. A prolongation of the duration of higher water levels in the Ems will hinder the natural drainage. The infrastructure in terms of more powerful pumps must be improved because the water has to be pumped for a longer period against higher water levels in the Ems estuary.
In the Ems estuary at Emden, the highest water level for EH_a is 6.61 m with an operated storm surge barrier and without further amplification. In the case of a runoff of 1200 m3 s−1 and a sea level rise of 1 m, it reaches 7.65 m. These water levels exceed the highest water level observed in the event in 1906 by about 1.4 and 2.4 m, respectively. Nevertheless, the simulated highest water levels (Table 1) do not reach today's dike height at Emden of NHN + 7.60 m except for in two cases which include a future sea level rise of 1 m. The upper part of the Ems estuary is protected by the storm surge barrier even against extreme events with amplified discharge or sea level rise.
The amplified water levels obtained for EH_a of 5.23 m at Borkum and of 6.61 m at Emden are on a similar order of magnitude as the maximum water levels of 4.99 and 6.09 m, respectively, reported by Jensen et al. (2006; see therein Table 10 for an ensemble member of 1976) as an estimate of an extreme event with a low probability of occurrence. There, the investigation was focused on the Elbe estuary. Possibly, ensemble members other than those reported might result in higher water levels for Borkum and Emden. Still the comparability of extreme water levels estimated by different procedures and based on different original data sets supports the plausibility of the results. Moreover, there is a potential for further amplified realistic storm tide events to emerge when both methods, namely variations in atmospheric conditions as performed by Jensen et al. (2006) and interplay with different tidal phases as performed in the present study, are combined.
Depending on track, intensity and velocity, each storm affects the German coastal stripes differently. For the East Frisian coast, storm winds from northern directions lead to higher storm tides, whereas for the North Frisian coast, storm winds from western directions have more impact. Thus, the ranking of extreme storm tide events elaborated in this study differs in detail for the different coastal stripes of the German Bight. As this work focuses on the East Frisian coast with the Ems estuary, the amplification procedures were adjusted specifically for Borkum. However, the methods for the identification and amplification of storm tides used here can be transferred to other coasts and estuaries.
So far, a fixed bathymetry has been assumed for all simulations. However, the heterogeneous bathymetry of the German Bight, in particular the Wadden Sea and the estuaries, has been subject to changes due to natural processes and anthropogenic influences which will proceed in the future. Consideration of changing bathymetry would give an insight into the effect of morphodynamic states on extreme storm tides. Due to the lack of regular information about past and possible future regional and local changes, this remains an important and extensive topic for further investigation.
In the present study the effects of a coincidence of a severe storm tide and extreme runoff were assessed to give an upper limit of water levels. So far, an independent probability of occurrence of extremes has been assumed. Consideration of joint probabilities or consideration of them as a compound event might narrow down the range of possible water level extremes.
Events like EC with a series of storm tides within a week might require special arrangements for the management of their impact. Not only must the drainage of the hinterland be sufficient, but also the workforce to watch and operate coastal protection measures must be available in adequate numbers. The drainage situation may become worse in the case of the coincidence of a storm event with heavy rain. The results of this study may contribute to the development of a flexible “adaptation pathway” to adapt to the impacts of climate change in coastal areas considering the interests of e.g. coastal protection, draining of the hinterland, navigation in the Ems waterway and nature protection.
The data used in this paper are available from the authors upon request.
The simulations for the North Sea (1) and the Ems estuary (2) were performed and analysed by IG and LG (1) and TB and ER (2), respectively. All authors contributed to the preparation of the manuscript.
The authors declare that they have no conflict of interest.
The observational data for Borkum were kindly provided by the German Federal Waterways and Shipping Administration (WSV) and communicated by the German Federal Institute of Hydrology (BfG).
We thank Andreas Sterl and the two anonymous referees for their valuable and constructive comments.
This investigation was supported in the context of the joint project EXTREMENESS (Extreme North Sea Storm Surges and Their Consequences) funded by the German Federal Ministry of Education and Research (BMBF; Förderkennzeichen 03F0758).
This research was supported by the German Federal Ministry of Education and Research (BMBF; Förderkennzeichen 03F0758).
This paper was edited by Animesh Gain and reviewed by Andreas Sterl and two anonymous referees.
Arns, A., Wahl, T., Dangendorf, S., and Jensen, J.: The impact of sea level rise on storm surge water levels in the northern part of the German Bight, Coast. Eng. J., 96, 118–131, https://doi.org/10.1016/j.coastaleng.2014.12.002, 2015a. a
Arns, A., Wahl, T., Haigh, I., and Jensen, J.: Determining return water levels at ungauged coastal sites: a case study for northern Germany, Ocean Dynam., 65, 539–554, https://doi.org/10.1007/s10236-015-0814-1, 2015b. a
BAW: Endbericht zur Durchführung einer wasserbaulichen Systemanalyse der Sturmflut 5. Allerheiligenflut vom 1.11.2006, Bericht BAW A3955 03 10161, 2007. a, b, c
BSH, Nordseezustand 2008–2011, Berichte des BSH, Nr. 54, Bundesamt für Seeschifffahrt und Hydrographie, Hamburg und Rostock, 311 pp., 2016. a
Casulli, V.: A high-resolution wetting and drying algorithm for free-surface hydrodynamics, Int. J. Numer. Meth. Fl., 60, 391–408, 2008. a, b
Casulli, V. and Cattani, E.: Stability, accuracy and efficiency of a semi-implicit method for three-dimensional shallow water flow, Comput. Math. Appl., 27, 99–112, 1994. a
Casulli, V. and Walters, R.: An unstructured grid, three-dimensional model based on the shallow water equations, Int. J. Numer. Meth. Fl., 32, 331–348, 2000. a
Dangendorf, S., Mudersbach, C., Jensen, J., Ganske, A., and Heinrich, H.: Seasonal to decadal forcing of high water levels percentiles in the German Bight throughout the last century, Ocean Dynam., 63, 533–548, https://doi.org/10.1007/s10236-013-0614-4, 2013. a
Debernard, J. and Røed, L.: Future wind, wave and storm surge climate in the Northern Seas: a revisit, Tellus A, 60, 427–438, https://doi.org/10.1111/j.1600-0870.2008.00312.x, 2008. a
DGJa: Deutsches Gewässerkundliches Jahrbuch, Küstengebiet der Nordsee 2013, Landesamt für Landwirtschaft, Umwelt und ländliche Räume Schleswig-Holstein, Flintbek, Germany, available at: http://www.dgj.de (last access: 3 July 2020), 2014. a, b, c, d, e
DGJb: Deutsches Gewässerkundliches Jahrbuch, Weser- und Emsgebiet 2015, Niedersächsischer Landesbetrieb für Wasserwirtschaft, Küsten- und Naturschutz, Norden, Germany, available at: http://www.dgj.de (last access: 3 July 2020), 2018. a, b, c, d, e, f, g, h
Feser, F., Barcikowska, M., Krueger, O., Schenk, F., Weisse, R., and Xia, L.: Storminess over the North Atlantic and northwestern Europe – a review, Q. J. Roy. Meteor. Soc., 141, 350–382, https://doi.org/10.1002/qj.2364, 2015. a
Ganske, A., Tinz, B., Rosenhagen, G., and Heinrich, H.: Interannual and multidecadal changes of wind speed and directions over the North Sea from climate model results, Meteorol. Z., 25, 463–478, https://doi.org/10.1127/metz/2016/0673, 2016. a
Ganske, A., Fery, N., Gaslikova, L., Grabemann, I., Weisse, R., and Tinz, B.: Identification of extreme storm surges with high-impact potential along the German North Sea coastline, Ocean Dynam., 68, 1371–1382, https://doi.org/10.1007/s10236-018-1190-4, 2018. a
Gaslikova, L., Grabemann, I., and Groll, N.: Changes in North Sea storm surge conditions for four transient future climate realizations, Nat. Hazards, 66, 1501–1518, https://doi.org/10.1007/s11069-012-0279-1, 2013. a, b, c, d, e
Gerber, M., Ganske, A., Müller-Navarra, S., and Rosenhagen, G.: Categorisation of meteorological conditions for storm tide episodes in the German Bight, Meteorol. Zeit., 25, 447–462, https://doi.org/10.1127/metz/2016/0660, 2016. a
Geyer, B.: High-resolution atmospheric reconstruction for Europe 1948–2012: coastDat2, Earth Syst. Sci. Data, 6, 147–164, https://doi.org/10.5194/essd-6-147-2014, 2014. a
Gönnert, G., Müller, M., and Gerkensmeier, B.: Development of extreme storm surge events – results from the XtremRisk project, edited by: Klijn, F. and Schweckendiek, T., Comprehensive flood risk management, 2013. a
Hazeleger, W., Severijns, C., Semmler, T., Ştefănescu, S., Yang, S., Wang, X., Wyser, K., Dutra, E., Baldasano, J. M., Bintanja, R., Bougeault, P., Caballero, R., Ekman, A. M. L., Christensen, J. H., van den Hurk, B., Jimenez, P., Jones, C., Kållberg, P., Koenigk, T., McGrath, R., Miranda, P., van Noije, T., Palmer, T., Parodi, J. A., Schmith, T., Selten, F., Storelvmo, T., Sterl, A., Tapamo, H., Vancoppenolle, M., Viterbo, P., and Willén, U.: EC-Earth: a seamless earth-system prediction approach in action, B. Am. Meteorol. Soc., 91, 1357–1363, https://doi.org/10.1175/2010BAMS2877.1, 2010. a
Hollweg, H., Böhm, U., Fast, I., Hennemuth, B., Keuler, K., Keup-Thiel, E., Lautenschlager, M., Legutke, S., Radtke, K., Rockel, B., Schubert, M., Will, A., Woldt, M., and Wunram, C.: Ensemble simulations over Europe with the regional climate model CLM forced with IPCC AR4 global scenarios, Technical report 3, Support for Climate- and Earth System Research at the Max Planck Institute for Meteorology, ISSN 1619-2257, 2008. a
Houghton, J., Ding, Y., Griggs, D. J., Noguer, M., van der Linden, P. J., Dai, X., Maskell, K., and Johnson, C. A. (Eds.): Climate Change 2001: The Scientific Basis. Contribution of Working Group I to the Third Assessment Report of the Intergovernmental Panel on Climate Change, Cambridge University Press, United Kingdom and New York, 2001. a
Idier, D., Bertin, X., Thompson, P., and Pickering, M.: Interactions Between Mean Sea Level, Tide, Surge, Waves and Flooding: Mechanisms and Contributions to Sea Level Variations at the Coast, Surv. Geophys., 40, 1603–1630, https://doi.org/10.1007/s10712-019-09549-5, 2019. a
Jensen, J., Mudersbach, C., Müller-Navarra, S. H., Bork, I., Koziar, C., and Renner, V.: Modellgestützte Untersuchungen zu Sturmfluten mit sehr geringen Eintrittswahrscheinlichkeiten an der deutschen Nordseeküste, Die Küste, 71, 123–167, 2006. a, b, c, d
Kalnay, E., Kanamitsu, M., Kistler, R., Collins, W., Deaven, D., Gandin, L., Iredell, M., Saha, S., White, G., Woollen, J., Zhu, Y., Chelliah, M., Ebisuzaki, W., Higgins, W., Janowiak, J., Mo, K., Ropelewski, C., Wang, J., Leetmaa, A., Reynolds, R., Jenne, R., and Joseph, D.: The NCEP/NCAR reanalysis project, B. Am. Meteorol. Soc., 77, 437–471, 1996. a
Kapitza, H. and Eppel, D. P.: Simulating morphodynamical processes on a parallel system, in: Estuarine and Coastal Modeling, edited by: Spaulding, M. L. and Butler, H. L., American Society of Civil Engineers, 1182–1191, 2000. a
KLEVER: Zukunft der Binnenentwässerung: Strategische Ausrichtung in Zeiten des Wandels, KLEVER – Klimaoptimiertes Entwässerungsmanagement im Verbandgebiet Emden, Brochure of results, available at: https://uol.de/klever/ergebnisbroschuere (last access: 3 July 2020), 2018. a
Krebs, M. and Weilbeer, H.: Ems-Dollart estuary, Die Küste, 74, 252–262, 2008. a
Kruhl, H.: Sturmflutwetterlagen, Promet, 8, 6–8, 1978. a
Lyard, F., Lefevre, F., Letellier, T., and Francis, O.: Modelling the global ocean tides: modern insights from FES2004, Ocean Dynam., 56, 394–415, 2006. a
Marsland, S., Haak, H., Jungclaus, J. H., Latif, M., and Röske, F.: The Max-Planck-Institute global ocean/sea ice model with orthogonal curvilinear coordinates, Ocean Model., 5, 91–127, 2003. a
Müller-Navarra, S., Lange, W., Dick, S., and Soetje, K.: Über die Verfahren der Wasserstandsvorhersage: Hydrodynamisch-numerische Modelle der Nord und Ostsee und empirisch-statistisches Verfahren für die Deutsche Bucht, Promet, 29, 117–124, 2003. a
Nakicenovic, N. and Swart, R. (Eds.): Special Report of the Intergovernmental Panel on Climate Change on Emission Scenarios, Cambridge University Press, United Kingdom, available at: https://www.ipcc.ch/report/emissions-scenarios (last access: 3 July 2020), 2000. a
Niemeyer, H. and Kaiser, R.: Mittlere Tidewasserstände, in Umweltatlas Wattenmeer, Band 2, Ulmer, Stuttgart, 1999. a
NLWKNa: Generalplan Küstenschutz Niedersachsen – Ostfriesische Inseln, Niedersächsischer Landesbetrieb für Wasserwirtschaft, Küsten- und Naturschutz, Germany, available at: https://www.nlwkn.niedersachsen.de/download/59866/Generalplan_Kuestenschutz_Inseln.pdf (last access: 3 July 2020), 2010. a, b
NLWKNb: Generalplan Küstenschutz Niedersachsen/Bremen – Festland, Niedersächsischer Landesbetrieb für Wasserwirtschaft, Küsten- und Naturschutz, Germany, available at: https://www.nlwkn.niedersachsen.de/download/22925/Generalplan_Kuestenschutz.pdf (last access: 3 July 2020), 2007. a, b
Oumeraci, H., Kortenhaus, A., Burzel, A., Naulin, M., Dassanayake, D. R., Jensen, J., Wahl, T., Mudersbach, C., Gönnert, G., Gerkensmeier, B., Fröhle, P., and Ujeyl, G.: XtremRisK – Integrated Flood Risk Analysis for Extreme Storm Surges at Open Coasts and in Estuaries: Methodology, Key Results and Lessons Learned, Coast. Eng. J., 57, 1540001-1–1540001-23, https://doi.org/10.1142/S057856341540001X, 2015. a
Pätsch, J., Burchard, H., Dieterich, C., Gräwe, U., Gröger, M., Mathis, M., Kapitza, H., Bersch, M., Moll, A., Pohlmann, T., Su, J., Ho-Hagemann, H., Schulz, A., Elizalde, A., and Eden, C.: An evaluation of the North Sea circulation in global and regional models relevant for ecosystem simulations, Ocean Model., 116, 70–95, https://doi.org/10.1016/j.ocemod.2017.06.005, 2017. a
Rego, J., Dillingh, D., Verlaan, M., Plieger, R., and Groeneweg, J.: Quantifying the seaward effect of closing a major surge barrier during storms, J. Coastal Res., 64, 1901–1905, 2011. a, b
Rockel, B., Will, A., and Hense, A. (Eds.): Special issue Regional climate modeling with COSMO-CLM (CCLM), Meteorol. Z., 17, 181 pp., 2008. a
Röckner, E., Bäuml, G., Bonaventura, L., Brokopf, R., Esch, M., Giorgetta, M., Hagemann, S., Kirchner, I., Kornblueh, L., Manzini, E., Rhodin, A., Schlese, U., Schulzweida, U., and Tompkins, A.: The atmospheric general circulation model ECHAM5. PART I: model description, MPI – rep 349, Max Planck Institute for Meteorology, 2003. a
Rudolph, E.: Storm surge studies in the estuaries Elbe, Jade-Weser and Ems, Die Küste, 81, 291–300, 2014. a
Samuelsson, P., Jones, C., Willen, U., Ullerstig, A., Gollvik, S., Hansson, U., Jansson, C., Kjellström, E., Nikulin, G., and Wyser, K.: The Rossby-Center-Climate Model RCA3: model description and performance, Tellus A, 63, 4–23, https://doi.org/10.1111/j.1600-0870.2010.00478.x, 2011. a
Santamaria-Aguilar, S., Arns, A., and Vafeidis, A.: Sea-level rise impacts on the temporal and spatial variability of extreme water levels: A case study for St. Peter-Ording, Germany, J. Geophys. Res.-Oceans, 122, 2742–2759, https://doi.org/10.1002/2016JC012579, 2017. a
Scoccimarro, E., Gualdi, S., Bellucci, A., Sanna, A., Fogli, R., Manzini, E., Vichi, M., Oddo, P., and Navarra, A.: Effects of tropical cyclones on ocean heat transport in a high-resolution coupled general circulation model, J. Climate, 24, 4368–4384, https://doi.org/10.1175/2011JCLI4104.1, 2011. a
Smith, S. and Banke, E.: Variation of the sea surface drag coefficient with wind speed, Q. J. Roy. Meteor. Soc., 101, 665–673, 1975. a
Stocker, T., Qin, D., Plattner, G.-K., Tignor, M., Allen, S., Boschung, J., Nauels, A., Xia, Y., Bex, B., Midgley, P. (Eds.): Climate Change 2013: the physical science basis, Contribution of working group I to the fifth assessment report of the intergovernmental panel on climate change, Cambridge University Press, Cambridge, United Kingdom and New York, 2013. a, b
Taylor, K., Stouffer, R. J., and Meehl, G. A.: An overview of CMIP5 and the experiment design, B. Am. Meteorol. Soc., 93, 485–498, https://doi.org/10.1175/BAMS-D-11-00094.1, 2010. a
Wahl, T., Mudersbach, C., and Jensen, J.: Assessing the hydrodynamic boundary conditions for risk analyses in coastal areas: a stochastic storm surge model, Nat. Hazards Earth Syst. Sci., 11, 2925–2939, https://doi.org/10.5194/nhess-11-2925-2011, 2011. a
Weisse, R., Gaslikova, L., Geyer, B., Groll, N., and Meyer, E.: coastDat – Model Data for Science and Industry, Die Küste, 81, 5–18, 2014. a, b
Weisse, R., Bisling, P., Geyer, B., Gaslikova, L., Hortamani, M., Groll, N., Matthias, V., Maneke, M., Meinke, I., Meyer, E., Schwichtenberg, F., Stempinski, F., Wiese, F., and Wöckner-Kluwe, K.: Climate services for marine applications in Europe, Earth Perspectives, 2, 3, https://doi.org/10.1186/s40322-015-0029-0, 2015. a