the Creative Commons Attribution 4.0 License.
the Creative Commons Attribution 4.0 License.
 | 12 Jun 2020
A volcanic-hazard demonstration exercise to assess and mitigate the impacts of volcanic ash clouds on civil and military aviation
Marcus Hirtl
Delia Arnold
Rocio Baro
Hugues Brenot
Mauro Coltelli
Kurt Eschbacher
Helmut Hard-Stremayer
Florian Lipok
Christian Maurer
Dieter Meinhard
Lucia Mona
Marie D. Mulder
Nikolaos Papagiannopoulos
Michael Pernsteiner
Matthieu Plu
Lennart Robertson
Carl-Herbert Rokitansky
Barbara Scherllin-Pirscher
Klaus Sievers
Mikhail Sofiev
Wim Som de Cerff
Martin Steinheimer
Martin Stuefer
Nicolas Theys
Andreas Uppstu
Saskia Wagenaar
Roland Winkler
Gerhard Wotawa
Fritz Zobl
Raimund Zopp
Volcanic eruptions comprise an important airborne hazard for aviation. Although significant events are rare, e.g. compared to the threat of thunderstorms, they have a very high impact. The current state of tools and abilities to mitigate aviation hazards associated with an assumed volcanic cloud was tested within an international demonstration exercise. Experts in the field assembled at the Schwarzenberg barracks in Salzburg, Austria, in order to simulate the sequence of procedures for the volcanic case scenario of an artificial eruption of the Etna volcano in Italy. The scope of the exercise ranged from the detection (based on artificial observations) of the assumed event to the issuance of early warnings. Volcanic-emission-concentration charts were generated applying modern ensemble techniques. The exercise products provided an important basis for decision-making for aviation traffic management during a volcanic-eruption crisis. By integrating the available wealth of data, observations and modelling results directly into widely used flight-planning software, it was demonstrated that route optimization measures could be implemented effectively. With timely and rather precise warnings available, the new tools and processes tested during the exercise demonstrated vividly that a vast majority of flights could be conducted despite a volcanic plume being widely dispersed within a high-traffic airspace over Europe. The resulting number of flight cancellations was minimal.
- Article
(7275 KB) - Full-text XML
- BibTeX
- EndNote


Aviation is nowadays one of the most critical means of transport, and even short interruptions in flight schedules can result in major economic loses. Volcanic eruptions can have a significant impact on aviation (e.g. Bolić and Sivčev, 2011; Guffanti et al., 2010a; Albersheim and Guffanti, 2009; Brechan, 2010) not only in the vicinity of an erupting volcano but also far from the volcano. Fine ash especially, typically defined as ash particles with diameters below 63 µm, can be transported over very long distances (Durant et al., 2012; Prata et al., 2007).
Volcanic ash, particularly fine ash, may represent a significant danger to aviation, as volcanic ash particles can cause the deterioration of forward-facing surfaces and metal components. Although ash would not destroy the engine, high concentrations of volcanic ash particles are a problem as they melt due to having a lower melting temperature than the temperature within the engine and stick to turbine surfaces that can lead to a blocking of the aerodynamic throat area (Clarkson et al., 2016). Aircraft engines may sustain sudden power loss (Bolić and Sivčev, 2011) or even complete engine failure (ICAO, 2007). Volcanic ash generally may cause a variety of additional damage inside and outside an aircraft. The silicate particles of an ash cloud scratch cockpit screens or grind down various parts of the aircraft, such as the leading edge of the wings or tail parts, instantly impacting aerodynamics in flight. In addition, the pitot tubes, which are essential for speed and altitude measurement, can be clogged. Volcanic ash may cause blockages of the air filters and contamination of the inside cabin air.
The first incident concerning engine flameout due to high-level (i.e. at cruise altitudes) volcanic ash clouds happened on 24 June 1982. A Boeing 747-200 of British Airways lost power of all four engines when the aircraft entered at 11 000 m an ash-contaminated airspace due to the eruption of volcano Mount Galunggung, Indonesia (Johnson and Casdevall, 1994). During the ensuing 16 min, the aircraft descended without power from 11 000 to 3600 m; at the last minute, the pilots were able to restart three of the four engines (ICAO, 2007) and therefore regained control without the cost of human lives.
Other incidents include a KLM Boeing 747, on 15 December 1989, which was powerless for more than 4 min as the plane flew into a dense ash-contaminated airspace 170 km north of Anchorage, Alaska (Przedpelski and Casadevall, 1994). The ash cloud originated from Mount Redoubt, at a distance of 240 km from the aircraft. Notably, both incidents occurred during the night, the volcanic plumes were invisible and no warnings were available to the pilots during these days. A more recent incident happened during July and August of 2008; the Kasatochi (Guffanti et al., 2010b) volcano in Alaska's Aleutian Islands chain erupted, causing widespread impacts on aviation operations. The volcanic ash and gas were ejected up to the stratosphere and dispersed into major North American jet airways.
The first events especially, with an impact on aviation, were the starting point of the development of guidelines, legislation and specific products for aviation. In 1991, the International Civil Aviation Organization (ICAO) and the World Meteorological Organization (WMO) decided to set up volcanic ash advisory centres (VAACs) to monitor and forecast the dispersion of fine ash in the atmosphere. In Europe, the London VAAC (UK Met Office) and the Toulouse VAAC (Météo-France) take on this responsibility to operate a 24/7 service. There are many contributors to the overall volcanic risk mitigation system such as air navigation service providers (ANSPs), including the Aeronautical Information Service and air traffic flow management (AFTM) units, and meteorological service providers including meteorological watch offices (MWOs) and volcano observatories. Original equipment manufacturers (OEMs) are required to establish acceptable susceptibility standards of engine features to the effects of volcanic clouds. These should include a combination of experience, studies and analysis and/or testing of parts, sub-assemblies or engines. Specific aircraft and engine type certificates, supplemental type certificates (STCs) and parts manufacturer approvals (PMAs) have been developed to consider the possibility of volcanic-particle exposure. Their cooperation in supplying governments, operators and civil aviation authorities (CAAs) with the information necessary to support the preflight, in-flight and postflight decision-making process is essential for continuous safe operations.
The eruption of the Eyjafjallajökull volcano in Iceland in April and May 2010 caused a major crisis situation especially for aviation. The crisis happened despite some decades of experience and new technologies available to detect volcanic ash clouds in real time. Satellite remote sensing networks were available (although with, for example, lower quality and resolution than nowadays), and advanced communication channels existed in 2010. Nevertheless, major interruptions and a significant collapse of the air traffic system over Europe could not be prevented for days (Bolić and Sivčev, 2011). The Eyjafjallajökull 2010 crisis (e.g. Stohl et al., 2011; Bolić and Sivčev, 2012; Gudmundsson et al., 2012) highlighted the societal demand for unaffected mobility, as well as aviation vulnerability to natural hazards. An estimated 7 million passengers were left stranded, with the effects of the closing of airports extending to trade, business and general production. Although there were no casualties, the economic impact was enormous (IATA, 2010), especially during the first days after the eruption, from 15 until 22 April 2010, when 104 000 flights were cancelled (Alexander, 2013), which comprised 48 % of the expected traffic during those days.
Since the Eyjafjallajökull outbreak in 2010 in Iceland and the resulting closing of wide areas of the European airspace for days, changes have been made to the standards and recommended practices of aviation in the case of volcanic eruptions. Until this event, the maxim was “avoid visible ash” as an answer to the flights of two Boeing 747s into ash clouds in the 1980s (Johnson and Casadevall, 1994), which triggered the establishment of the International Airways Volcano Watch (IAVW) and respective ICAO procedures and guidelines. This rule is still valid for the conduct of flights today. Within this context, the Volcanic Ash Contingency Plan (VACP, Edition 2.0.0 – July, 2016) grants airspace users the power to make the decision of whether to fly or not based on their safety risk assessment accepted by the Civil Aviation Authority of the state of registration. This includes the decision about operation in airspace where volcanic ash is present or forecast. Consequently, most countries in Europe do not close their airspace as a default procedure in the event of a volcanic eruption.
As a consequence of the Eyjafjallajökull eruption, London and Toulouse VAACs provide volcanic ash concentration charts to support the VACP. These charts predict the location of a quantitative mass of ash per unit volume and are provided for three contamination levels:
-
low-contamination volcanic ash mass concentration less than or equal to 2 mg m−3
-
medium-contamination volcanic ash mass concentration greater than 2 mg m−3 and less than 4 mg m−3
-
high-contamination volcanic ash mass concentration greater than or equal to 4 mg m−3.
The Eyjafjallajökull eruption showed that there is still a significant gap in the Europe-wide availability of real-time hazard mitigation data and tools. The 2010 event revealed a significant lack of volcanic monitoring information for airborne hazards, and informative and crucial data describing “what, where and how much” were missing. Within the framework of the Horizon 2020 research project EUNADICS-AV (European Natural Disaster Coordination and Information System for Aviation, 2016–2019) funded by the European Commission, a network of experts was established, with the aim of providing the relevant data (observations and models) during situations when aviation is affected by airborne hazards (e.g. volcanic ash and SO2, desert dust, wildfires, and nuclear accidents). To enable all stakeholders in aviation to obtain fast, coherent and consistent information, all data are collected and visualized on a dedicated platform (see Sect. 3.1.2). In order to implement efficient data and information exchange, interfaces between various data sources from observational networks, dispersion-modelling applications and flight-planning software were developed. This included the linking of dispersion models with flight trajectory models that consider cost-based rerouting of flights (with respect to fuel and maintenance costs; see Sect. 5.3).
All developments were tested and evaluated at an international demonstration exercise conducted at the barracks of the Austrian Armed Forces (AAF) in Salzburg in March 2019. The goal of the demonstration exercise was to simulate the different phases of the event, expert contributions and decision procedures during a volcanic eruption and a nuclear crisis. This paper focuses on the volcanic scenario.
The following sections describe the motivation and organization of the exercise, the assumed scenario of the eruptive event, available data and tools, results, and conclusions derived by the participating collaborators. The case scenario starts with the early detection of the fictitious eruption of the Etna volcano, Italy, and subsequent early warnings were developed. There were observations from different sources available (e.g. satellite, lidar, in situ), which were used to analyse the hazard situation. The observational data were combined with state-of-the art simulation models to determine the source terms of the harmful substances and to further refine the analysis. These results were then fed into flight trajectory and air traffic simulation models.
In the field of dispersion modelling and the related impacts (e.g. on aviation), different exercises have been conducted in the past, and some of them, e.g. the VOLCEX (VOLcanic ash Contingency EXercise; Sivcev, 2011; Dopagne, 2011) are repeated on a regular basis to test how procedures perform in real-time situations. The exercises are a means to test communication networks and data exchange capabilities between the involved centres and groups. Important goals of such exercises are also to check the distribution of responsibilities and to review how seamless and coordinated the completion of the necessary tasks is.
For volcanic ash, the annual European VOLCEX is the most important exercise with respect to volcanic ash and the impacts on aviation. VOLCEX involves the participation of VAACs, different airlines and ANSPs, as well as different regulators and other crisis coordination cells. The objective of the exercise is to provide an opportunity for each individual state to test the effectiveness of their national crisis procedures and, for all the participants, to test the effectiveness of their local volcanic ash contingency plans and procedures. It is designed to test the operational capabilities and speed of all players involved in the industry (e.g. airlines) that could be affected by a volcanic eruption in European airspace. During the exercise, the crisis coordination between the various stakeholders via the European Aviation Crisis Coordination Cell (EACCC) and the Aircraft Operator Crisis Coordination Cell (AOCCC) is evaluated.
The EUNADICS-AV demonstration exercise was unique with respect to the abovementioned activities. The exercise not only comprised all the items and timescales for a potential event relevant to aviation but also looked at it from a research-oriented perspective. Innovative procedures, data and products were tested in a simulated environment. Such a complete and comprehensive exercise demonstrated the applicability and feasibility of these innovative solutions into the aviation sector, produced by the research and operational capabilities of the EUNADICS-AV partnership. The exercise also demonstrated vast opportunities to support and complement the VAAC activities in the future e.g. by providing relevant observations, early warnings, source terms and analysis fields via a dedicated platform. This paper continues with describing the several activities during the exercise with a focus on the volcanic test case and the lessons learnt from this multidisciplinary exercise.
3.1 General approach
The exercise took place at the military facilities at the Schwarzenberg barracks from 3 to 8 March 2019. The floor plan and location of the different exercise cells (Fig. 1) show the organizational aspects of the exercise and how the interaction among cells was facilitated. Each cell was in charge of one of the predefined actions within a crisis situation (see Table 1 for details).
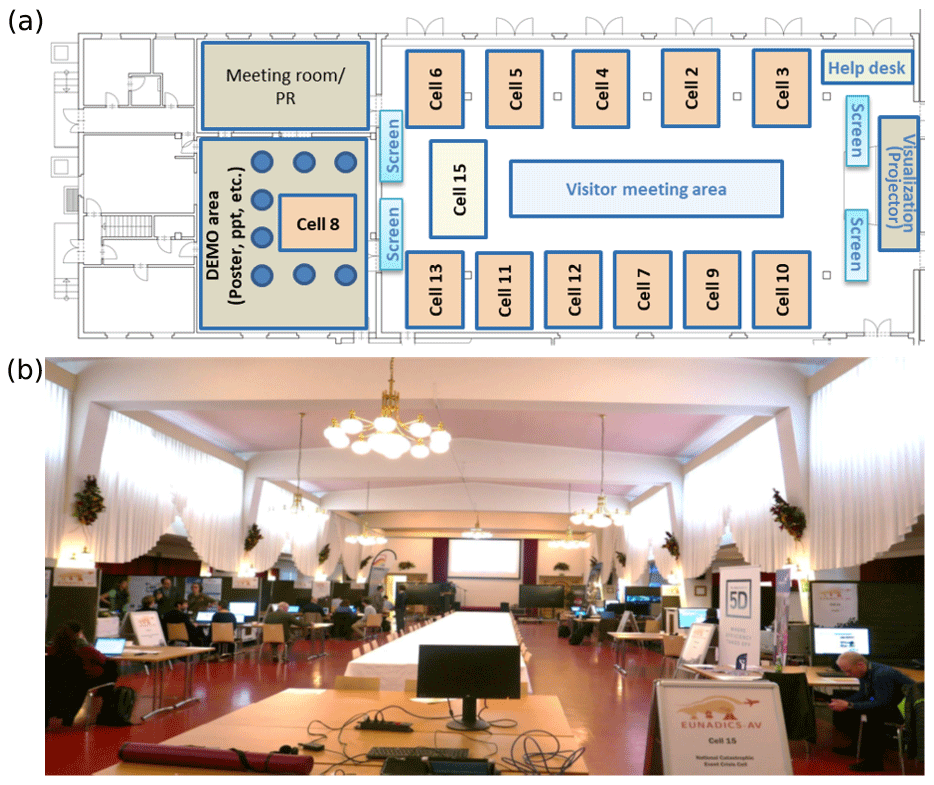
Figure 1(a) Floor plan of different cells at Schwarzenberg barracks (Salzburg, Austria). (b) Picture of the main hall of the demonstration exercise premises.
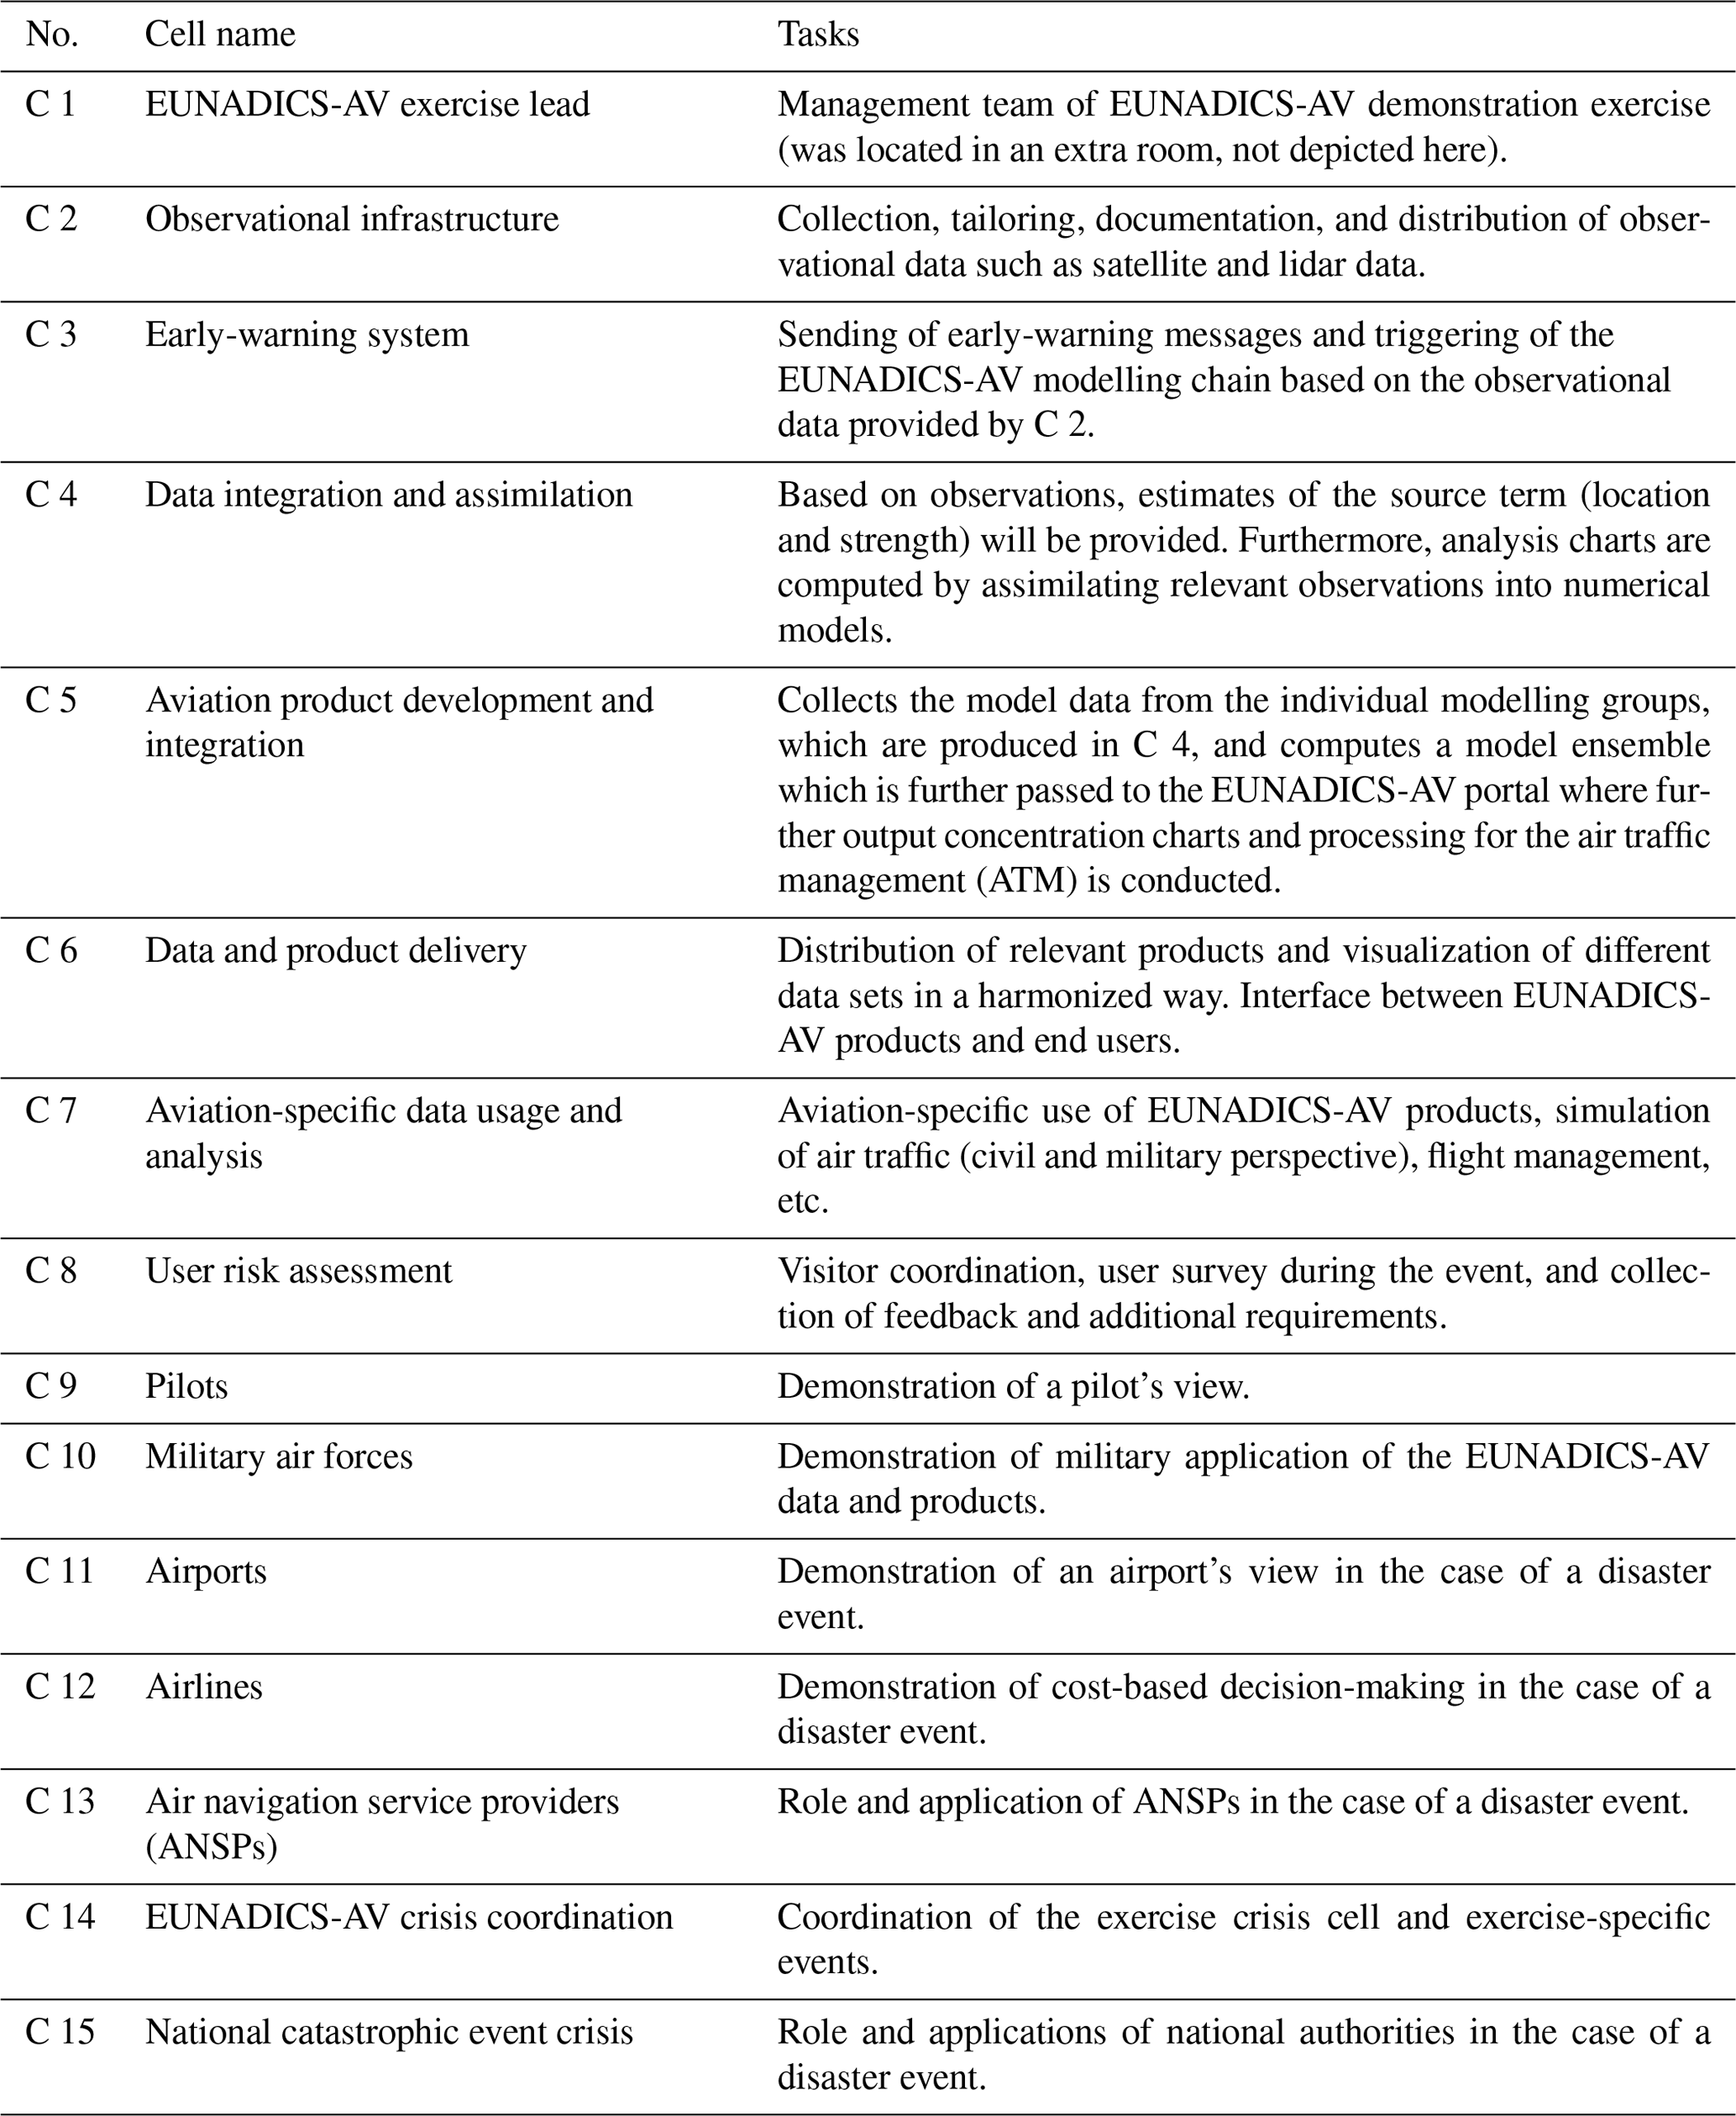
Table 1EUNADICS-AV demonstration exercise cells and related tasks.
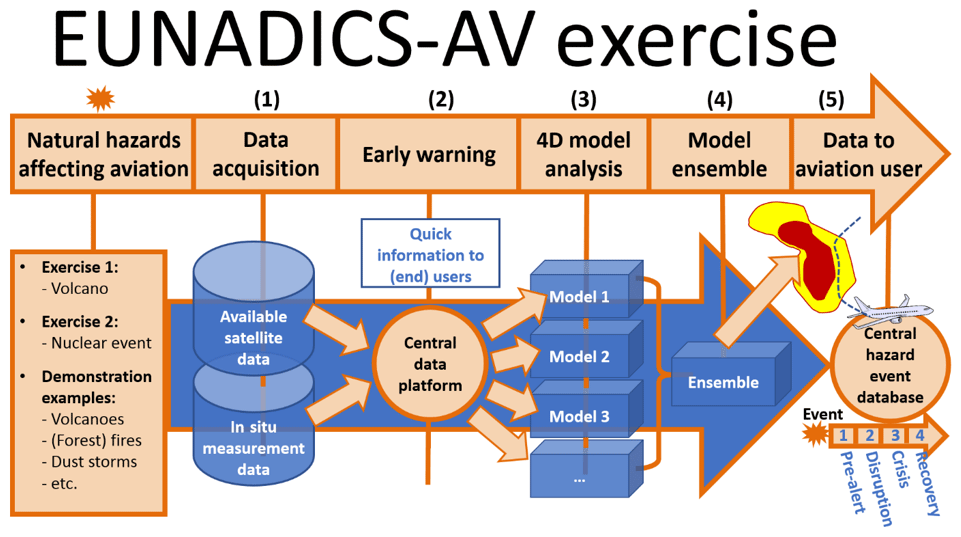
Starting from (1) the detection (based on artificial observations) of the hazardous event and (2) the declaration of early warnings, (3) observations from different sources (e.g. satellite, lidar, in situ) were used to analyse the situation and were furthermore combined with the model to determine the source terms and to refine the analysis (4). These results were then used to (5) cost-efficiently reroute aeroplanes. Every step of the whole procedure was executed with a demonstration of which data would be used in a real event and how the procedures and dependencies would take place (Fig. 3).
During the demonstration exercise, the cells presented the relevant data and impact on aviation during four phases of the event defined as follows:
-
Pre-alert. A notification of an event is received, which may lead to a possible major disruption of ATM (air traffic management), requiring activation of an operational reaction chain.
-
Disruption. Major disruption impacts ATM operations and may escalate to a crisis.
-
Crisis. State of inability to provide an air navigation service at the required level is reached, resulting in a major loss of capacity, a major imbalance between capacity and demand, or a major failure in the information flow following an unusual and unforeseen situation.
-
Recovery. The operation goes back to normal, and an evaluation of the impact is finalized.
Each cell was equipped with technical support, e.g. computers and monitors, to demonstrate its role in the operational sequence of procedures and actions. The main results could be projected from each cell to various big screens in the hall (see Fig. 2).
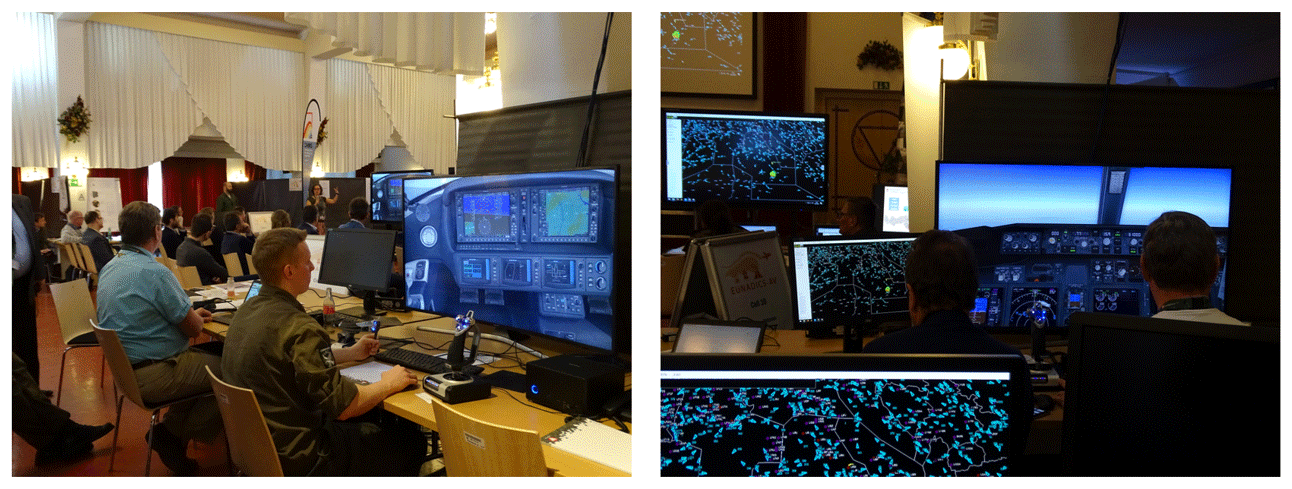
Figure 2Selected photos from the demonstration exercise at the Schwarzenberg barracks in Salzburg. The flight simulator was operated by both military and civil pilots.
Based on the observations and modelling data provided (see Sect. 4) by the “scientific cells” (cell 2 to 6), the impact on aviation was simulated and depicted by the “aviation and stakeholder cells” (cell 7 to 15). These data allowed the ANSPs to release special aviation advisories (e.g. Significant Meteorological Information – SIGMET). Further impacts were due to rerouting and cancellation of flights by flight trajectory modellers (see Sect. 5.3) as well as respective procedures invoked on the military side and by participating airports and ministries. For the evaluation of the impacts on the air traffic, the air traffic was simulated by using the NAVSIM/USBGSim (Rokitansky, 2009) simulator. A newly developed cost model was used in the framework of an airline network balance tool (FLIGHTKEYS 5D) to cost-efficiently reroute flights affected by the disaster event (see Sect. 5.3). Cell-specific EUNADICS-AV developments and impacts on ATM were shown for both the civil and the military roles within each ATM phase.
The most important tasks in the preparation phase of the demonstration exercise were to establish working practices and interfaces between the broader natural-hazard science communities on one side and the more application-oriented aviation community on the other side. The latter was mostly represented by flight trajectory modellers and military aviation experts. The emphasis at the EUNADICS-AV exercise was more on the scientific part and not on regular procedures, which are tested, for example, during VOLCEX, where the crisis coordination between the various stakeholders is tested and evaluated. The intense preparatory work ahead of the demonstration exercise managed to bridge existing gaps. Experts such as natural-hazard scientists, flight managers and pilots collaborated in an unprecedented fashion. This effectively was the spirit of the EUNADICS-AV project put into practice.
3.1.1 The volcanic-eruption scenario
The exercise scenario was designed assuming a fictitious eruption of the Etna volcano in Sicily, Italy. The aim was to simulate the onset of the eruption during an episode with large-scale weather patterns that led to a transport of ash from Sicily towards central Europe over a couple of days, with a widespread ash cloud with concentration levels above the relevant thresholds (e.g. above 2 mg m−3 at any vertical sub-column; see also Sect. 1). A period lasting 1 week during April 2018 was chosen. The fictitious Etna eruption started on 18 April 2018, at 12:00 UTC with a plume height of 12 km above the vent and a constant ash emission of 198 t s−1. The eruption was assumed to last until 20 April 00:00 UTC. The plume height and emission rate were further assumed to be 10 km and 116 t s−1 until 22 April 00:00 UTC. The following days until 25 April were considered the recovery phase, when no relevant ash source was present over Europe anymore (see also Sect. 4.3).
A fictitious event was chosen because there was no real eruption in the past that fulfilled the requirements which were defined for the exercise, i.e. that the volcanic ash cloud spread over Europe with certain threshold exceedances of volcanic ash concentrations over selected regions (e.g. over Austria where ANSPs have to deliver specific products).
3.1.2 Data sharing and visualization
All data sets (artificial observations and model data; see Sect. 4) used for the demonstration exercise were accessible and visualized. The information flow is depicted in Fig. 4. The various data products (satellite and ground-based observations, modelling data) that were requested by the wide range of users had many different data sources, data types and formats, projections, sampling time intervals, and coverage.
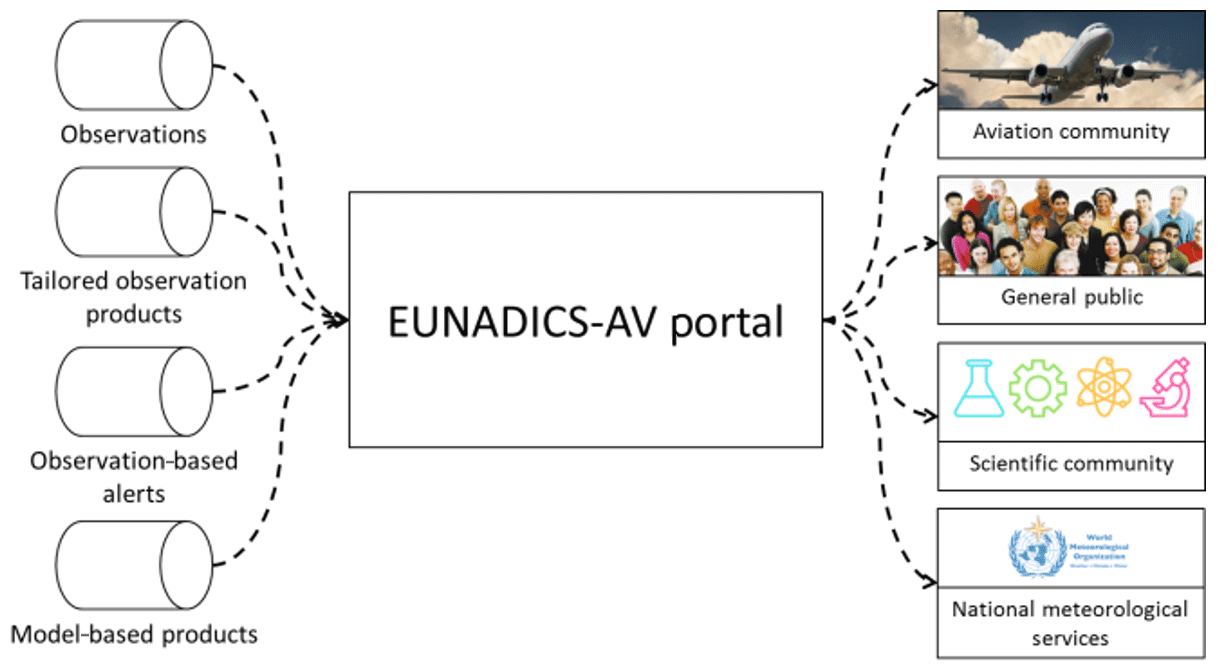
The EUNADICS-AV project made use of existing data channels and protocols to provide a harmonized and easily accessible portal (see Fig. 5 for example) for all the different types of information, including observations or modelling results. The portal allowed the participants of the exercise to explore the event and the products available anytime during each of the four phases with a graphical user interface.
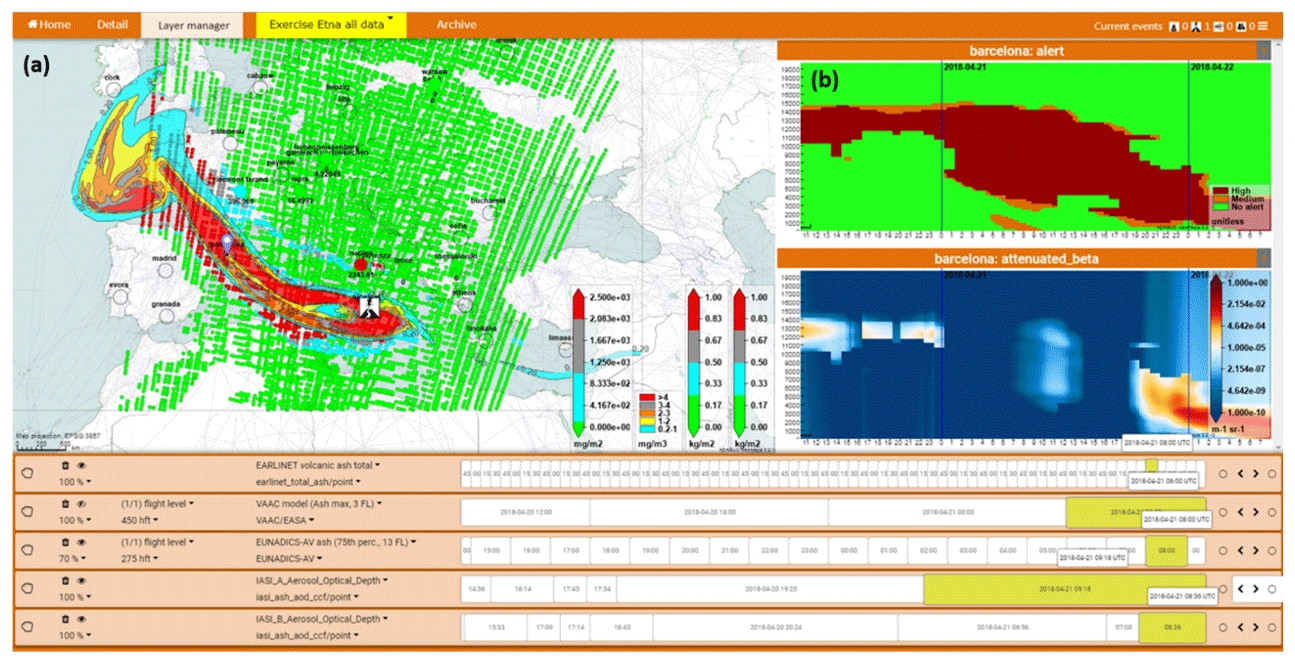
Figure 5Exemplified visualization of the EUNADICS-AV portal showing the model ensemble (a) and the vertical ash distribution (b) at an ACTRIS EARLINET station (Barcelona) on 21 April 2018.
4.1 Artificial observations
As the considered Etna scenario was artificial, the observational data sets were generated based on model simulations. The task of creating the artificial observations is split into two steps: (i) simulate the evolution of the artificial volcanic plume and (ii) simulate the fingerprint of this plume for different types of observation devices. An artificial eruption scenario was chosen, because in the recent past there was no real eruption of Etna that would have resulted in long-range transports of ash over central Europe with concentration values over certain thresholds.
4.1.1 Simulations of the artificial plume evolution
Having the parameters of the artificial eruption decided, the SILAM (System for Integrated modeLling of Atmospheric coMposition) modelling system of the FMI (http://silam.fmi.fi, last access: 10 June 2020; Sofiev et al., 2015) was run over the European domain, simulating the dispersion of the emitted masses in the atmosphere (see example in Fig. 6a).
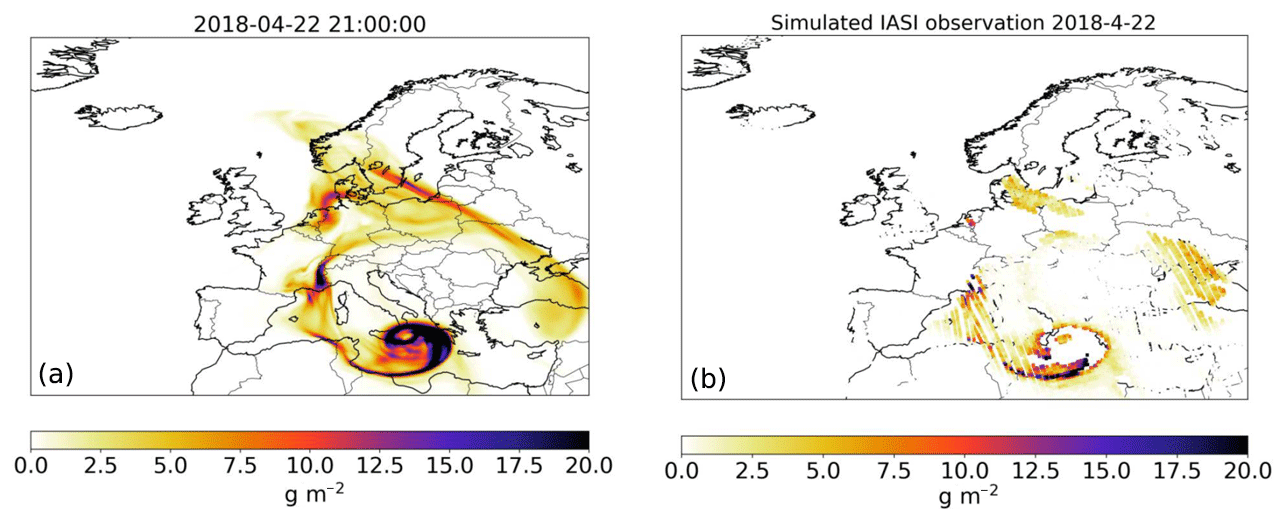
Figure 6(a) Simulated observations based on actual IASI pixels; no retrievals if cloud cover fraction >0.25 in the model pixel. (b) Simulated aerosol optical depth (AOD) >8. The values are perturbed with a spatially correlated error (the spatial correlation is based on a similar error covariance to that of the simulated MODIS AOD) – the error of each data point is set to 0.25 times the simulated value plus 0.05 g m−2.
The main challenge at this stage was to not only simulate the main dispersion but also account for incompleteness of our knowledge of the atmosphere, e.g. its dynamics during these days and actual wind direction and speed. To account for this uncertainty, the SILAM model was not run with meteorological data from the operational weather models but rather from the reanalysis data set ERA5 (Hersbach and Dee, 2016) of the European Centre for Medium-Range Weather Forecasts (ECMWF). ERA5 was produced by assimilating a vast number of historical observations into a numerical model and provides therefore high-quality meteorological data on a global scale; the final data set will extend back to 1950. Compared to the operational weather predictions, the reanalysis has noticeably more extensive assimilation capabilities (see summary for the previous version of the ECMWF reanalysis ERA-Interim in Dee et al., 2011) and thus can be considered as a more accurate representation of the actual meteorological conditions than the operational forecasts are. All other simulations with SILAM and other models used only operational forecasts for the corresponding period.
4.1.2 Generation of artificial observations from SILAM simulations
The output of the plume dispersion simulations consisted of the 4D distribution of the ash concentrations. To obtain the artificial observations, we applied the corresponding observation operators, which observed the concentration distribution as if the corresponding device were observing it. For instance, for the in situ sampling observations, the concentrations near the surface were extracted at the locations of the stations. For EARLINET (European Aerosol Research Lidar Network; Pappalardo et al., 2014; http://www.earlinet.org, last access: 10 June 2020) lidar, the vertical profiles of concentrations over the lidar locations were convoluted with their sensitivity. For satellites, the averaging kernels of the instruments were convoluted with the vertical profiles of concentrations along the satellite trajectory. We also took into account the actual weather impact and instrument specifics; as shown in the example in Fig. 6b, IASI (Infrared Atmospheric Sounding Interferometer; see e.g. Karagulian et al., 2010) instrument cannot observe in cloudy conditions and cannot retrieve very thick ash layers. At the final stage, the artificial plume retrievals were summed up with the actual satellite data for the corresponding orbits.
4.2 The early-warning system (EWS)
The purpose of the EWS is to provide near-real-time (NRT) observational data in the case of the detection of an airborne hazard. Subsequently, it provides centralized information for NRT monitoring to contribute to the improvement of the analysis and forecasts of volcanic ash plumes.
Observational data (satellite, ground-based and airborne remote sensing, and in situ) play a significant role in determining the 4D distribution of the ash cloud. For the demonstration exercise, several ground- and space-based observations (synthetic) were chosen to facilitate the detection of the event (see Sect. 4.2.1 to 4.2.3) and to assess the current extent and location of the dispersed ash cloud.
During the event, alerts created from these synthetic observations were delivered to the different cells to trigger their respective actions. As in a quasi-operative mode, with NRT products derived from the available monitoring networks, appropriate information from notifications of the hazardous event was provided.
4.2.1 Volcano observatory, Sicily
The Etna Volcano Observatory of the Italian National Institute of Geophysics and Volcanology (INGV) produced five VONA (Volcano Observatory Notice for Aviation) messages for the artificial Etna case. The first VONA message was YELLOW, indicating that the volcano showed signs of elevated unrest above its background level (06:00 UTC on 18 April 2018). Then, 10 min after the start of the Etna eruption (at 12:00 UTC on 18 April 2018), a RED message informed participants that lava fountaining had started from the central crater summit vent, with large ash emissions occurring up to 12 000 m above the vent height and the ash plume moving towards the north. At 00:10 UTC on 20 April 2018, a second RED message was provided. This message confirmed the ongoing eruption, with lower plume heights of up to 10 000 m above the vent height. Just after 00:00 UTC on 23 April 2018, an ORANGE message indicated the end of lava fountaining and ash emissions. Next, a GREEN message followed, with the announcement that the volcanic activity had ceased (volcano reverts to its normal or non-eruptive state) and that no ash cloud was being produced anymore.
4.2.2 Synthetic ACTRIS EARLINET data
The European Aerosol Research Lidar Network (EARLINET; Pappalardo et al., 2014; http://www.earlinet.org), established in 2000, provides aerosol profiling data on a continental scale. EARLINET is part of the Aerosols, Clouds and Trace Gases Research Infrastructure (ACTRIS; http://www.actris.eu, last access: 10 June 2020).
Within the EUNADICS-AV project, an EWS was designed that relies explicitly on EARLINET aerosol observations. This product is based on the possibilities offered by the EARLINET Single Calculus Chain (SCC; D'Amico et al., 2015) for the NRT data processing and the generation of tailored products network-wide. The calibrated high-resolution lidar data serve as the basis for the alert delivery (Baars et al., 2017). This EWS provides only qualitative and not quantitative information; thus the EARLINET EWS represents a warning system rather than a tool for decision makers. The demonstration exercise was the first occasion for which the EARLINET EWS was tested.
The EARLINET products for the demonstration exercise consisted of snapshots of the lidar signals and of the EWS plot. Figure 7 shows an example of the particle backscatter coefficient (with the cloud fraction removed and not removed) for the EARLINET station in Barcelona. Special attention should be given to the particle backscatter coefficient values reported in the figures as the values are unrealistically high and most likely would attenuate the lidar laser beam.
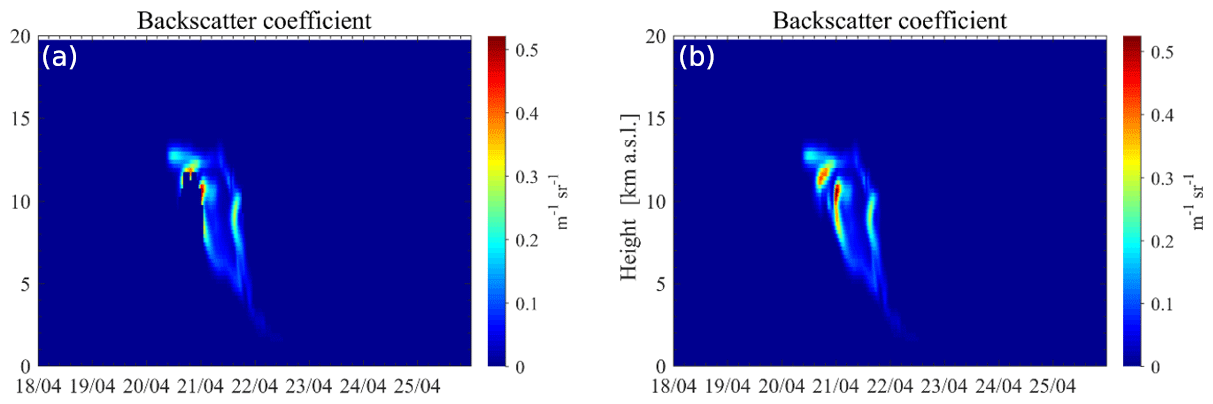
Figure 7Particle backscatter coefficient time–height evolution when the cloud fraction is removed (a) and not removed (b) for the Barcelona EARLINET station and for the whole exercise period.
The simulated data refer only to volcanic ash, and the depolarization information was not incorporated into the alert delivery method. Figure 8 presents an example of the attenuated backscatter coefficient and the corresponding alert for aviation for the EARLINET Leipzig station. The ash layer first appears at around 13 km on 22 April 05:00 UTC, with high values reaching the ground the next day. The ash cloud is not visible anymore over the Leipzig EARLINET site on 24 April.
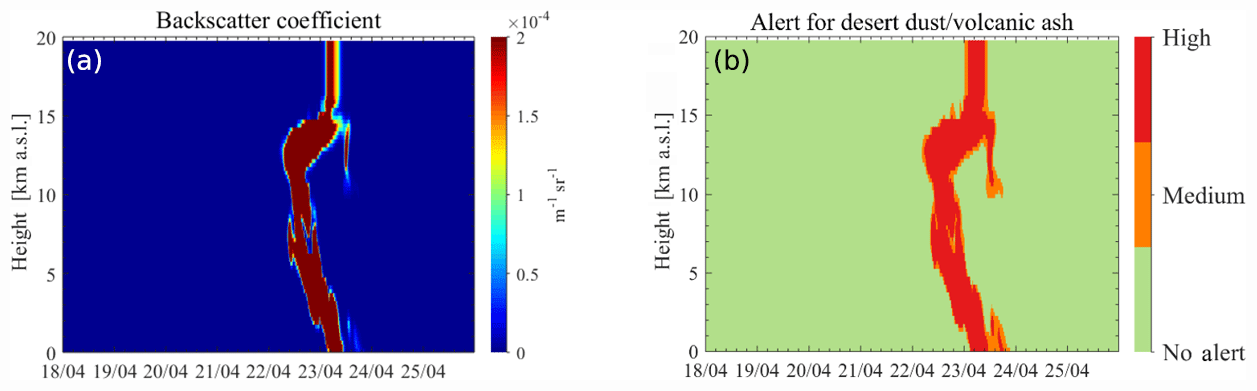
Figure 8The attenuated backscatter coefficient (a) and the alert for aviation (b) for the Leipzig EARLINET station.
4.2.3 Synthetic satellite data simulated for IASI and MODIS
Satellite observations from two types of sensors (IASI and the Moderate Resolution Imaging Spectroradiometer, MODIS) were considered for generating alert products for the exercise. Clerbaux et al. (2009) and Levy and Hsu (2015) gave descriptions of the IASI and MODIS instruments respectively. Synthetic ash products from two IASI sensors (on board MetOp-A and MetOp-B; Clarisse et al., 2010) and aerosol optical depth (AOD) from two MODIS sensors (on board Aqua and Terra) were used.
After the detection of the aerosol or ash cloud at the Nicolosi and Catania EARLINET stations, the first selective detection of ash from satellite was created for IASI-A (Fig. 9, left; few ash pixels at 20:10 UTC on 18 April 2018. A first partial detection was created at 08:28 UTC on 19 April 2018, followed by a global detection of the ash plume by IASI-B (Fig. 9, right) at 09:27 UTC on 19 April 2018. Following each of these synthetic detections a warning was issued with a time delay of about 1.5 h.
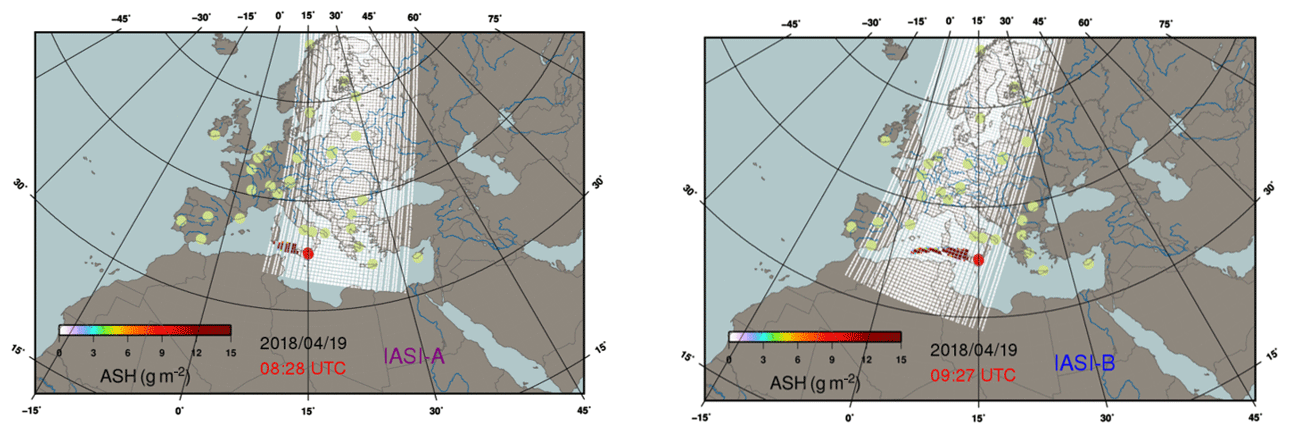
Figure 9Warnings of ash plume by IASI-A (at 08:28 UTC) and IASI-B (at 09:27 UTC) on 19 April 2018.
Synthetic observations of the ash plume (AOD anomalies) were created for the MODIS instruments aboard the Terra and Aqua satellites a in similar fashion to IASI-A and IASI-B. The MODIS detections were selected with respective daily timestamps of 10:19 and 11:58 UTC. Warnings were delivered to the aviation and military cells to support their decisions, actions and tasks. The warnings were also used to provide simulation start times for the dispersion models, improving the capability for achieving advanced analysis and forecasts of Etna's ash cloud.
4.3 Model ensemble
The following models provided the concentration distribution for the whole period using the predefined source term: MATCH (Multi-scale Atmospheric Transport and Chemistry; Robertson et al., 1999), MOCAGE (Modèle de Chimie Atmosphérique de Grande Echelle; Guth et al., 2016), SILAM (Sofiev et al., 2015), FLEXPART (FLEXible PARTicle dispersion model; Stohl et al., 2005) and WRF-Chem (Weather Research and Forecasting (WRF) model coupled with Chemistry; Grell et al., 2005; Stuefer et al., 2013). Although the EUNADICS-AV partnership used a reduced number of models, this approach accounts for an ensemble of multiple models. The 4D-model values were interpolated to a common grid, which allowed for the calculation of a mini ensemble and percentiles indicating the model uncertainty for the considered time step and location. For the demonstration exercise, the 75th percentile ash concentration level was used, which corresponds to ash concentrations below 75 % of the modelled outputs. Using this approach was a slightly conservative compromise as the median (50th percentile) is the most probable scenario. Using the 75th percentile means that the regions that lie above a certain threshold are larger than for the median.
Figure 10 shows the dispersion of the volcanic ash cloud over several days at a selected layer (FL275). Note that the model data were produced in advance of the demonstration exercise. The modelled results were used as a baseline for the aviation-related tasks. The modelled data were interpolated to 13 flight levels, visualized on the EUNADICS-AV portal and also imported into other applications like flight-planning software and Visual Weather (https://www.iblsoft.com/products/visualweather/, last access: 10 June 2020).
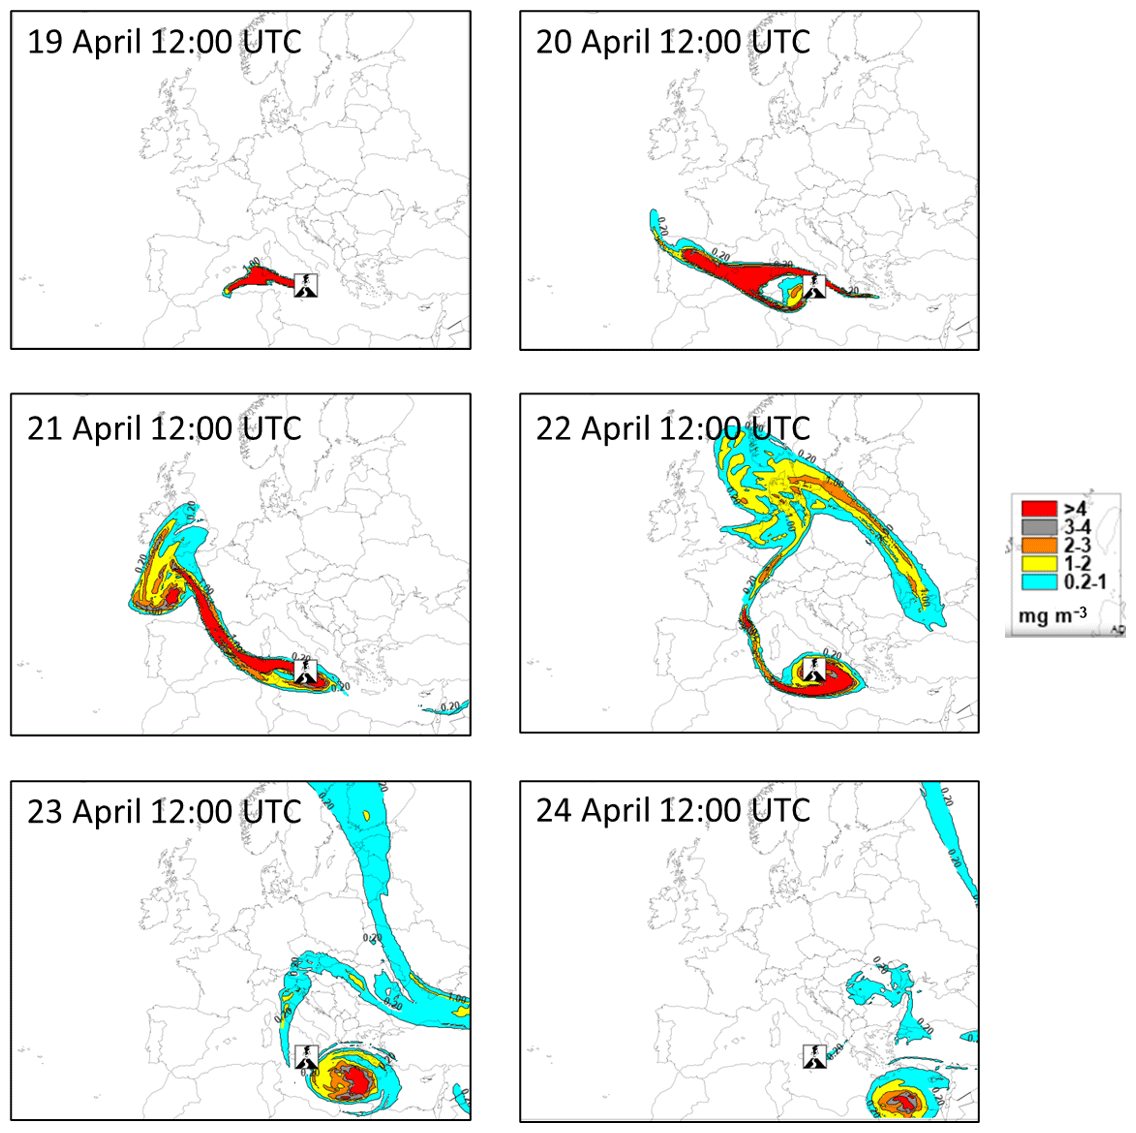
Figure 10Model ensemble (75th percentile) for the 6 consecutive days after the artificial Etna eruption in April 2018. The data are depicted at FL275.
5.1 Air navigation service provider
At this demonstration exercise, the tasks designated to ANSPs during such a crisis situation were executed by Austro Control (ACG). ACG provided specially tailored warnings and/or products for different aviation stakeholders in order to warn of the presence of the volcanic ash cloud. During the course of the demonstration exercise, the data sets described in the previous sections were fed into the visualization software that is also used for daily operations. Subsequently, products were generated for the local situation in Austria in order to give the exercise participants an impression of available aviation products for the case of a volcanic ash eruption. The presented products included internationally prescribed and harmonized weather warnings or prediction products, as well as country-specific products for Austria. In addition, a pilot briefing was conducted including specific information on the volcanic ash event for a potentially affected flight.
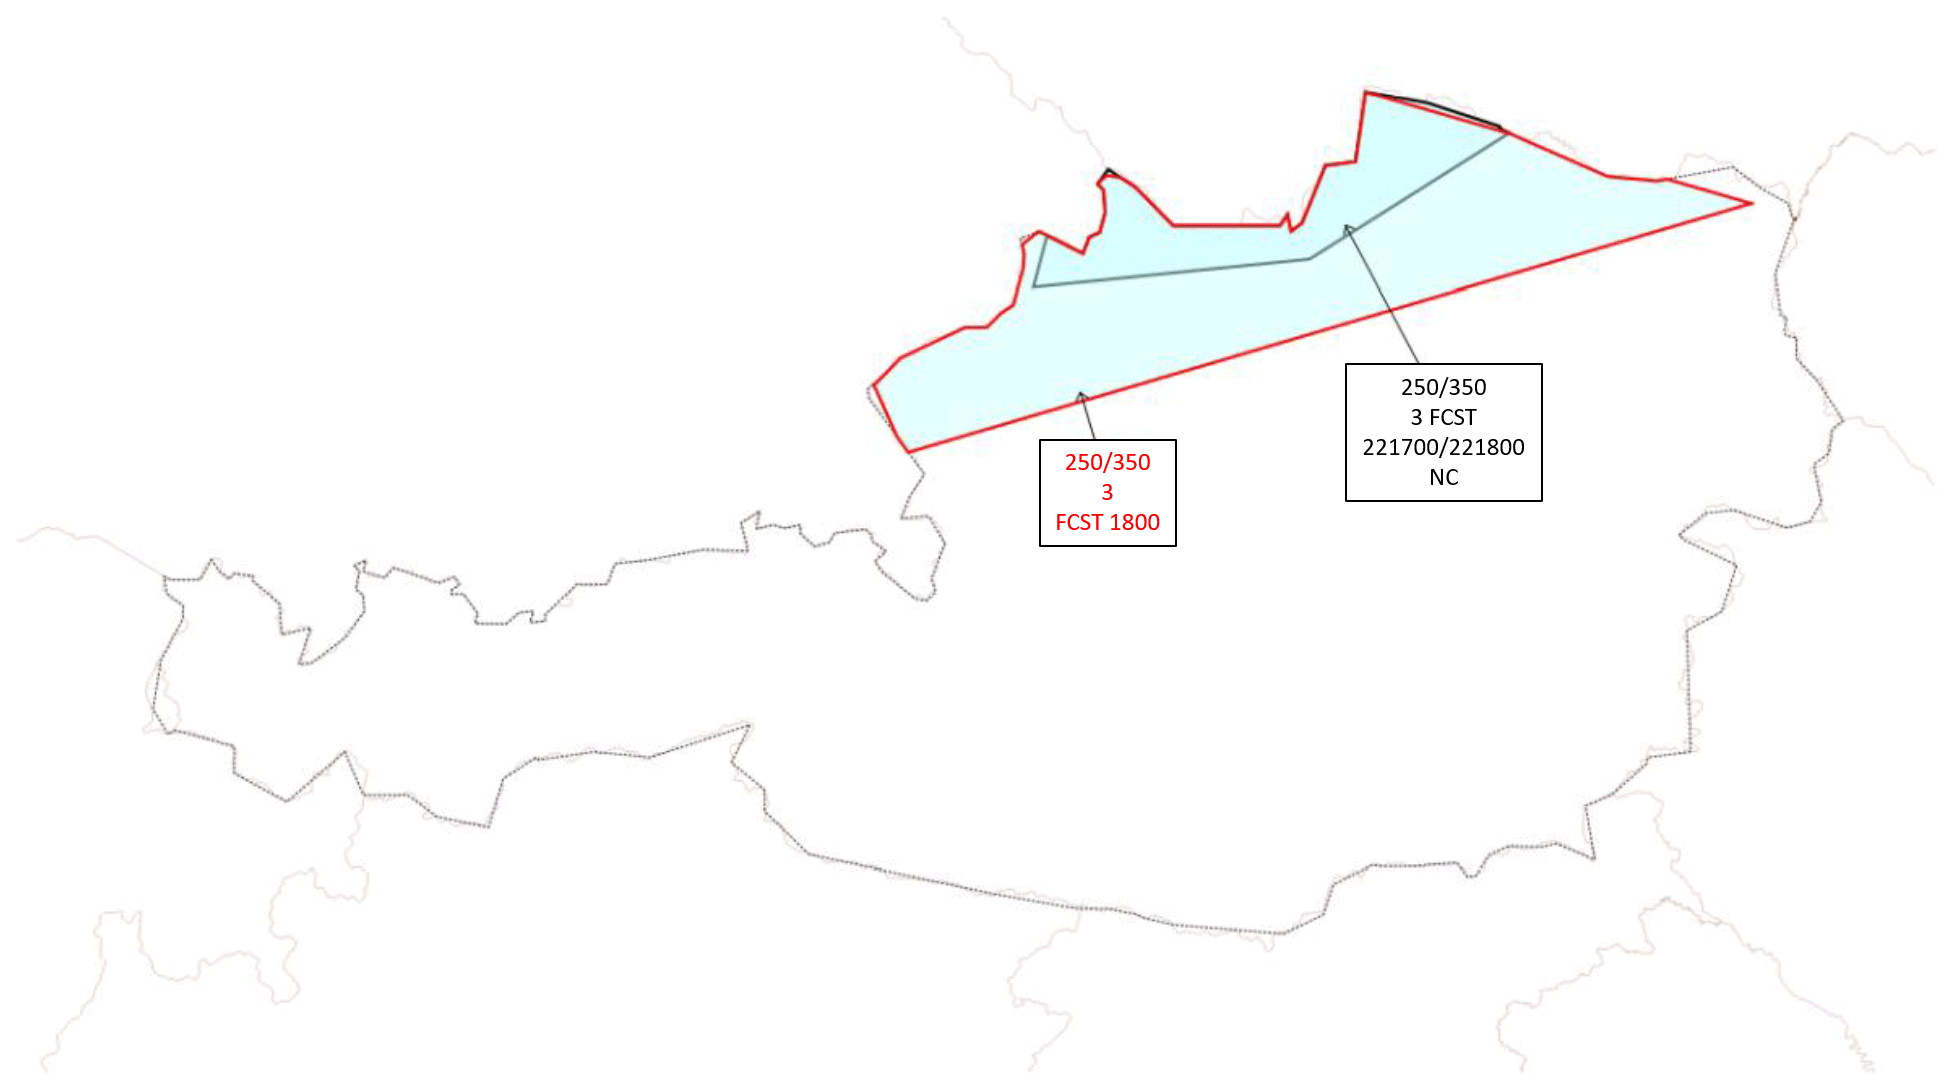
Figure 11Location of the two polygons for which the SIGMETs (ACG) were issued.
The following internationally harmonized products (selected examples) were prepared (according to an ACG internal guideline):
-
Volcanic ash SIGMET (Significant Meteorological Information). A SIGMET advisory is a warning message of the occurrence or expected occurrence of specified weather phenomena occurring en route, which may affect the safety of aircraft operations (ICAO, 2018a). MWO Vienna issued a volcanic ash SIGMET for 22 April 2018 at 16:00 UTC. It states that a volcanic ash cloud originated from Mount Etna; the cloud is predicted to be between FL250 and FL350 at 17:00 UTC in the Austrian airspace within the polygon of which the longitude and latitude coordinates are given (grey line in Fig. 11). Around 18:00 UTC, the ash cloud spreads to the south-east and a second polygon is provided (in red in Fig. 11). These polygons were generated from the 75th percentile of the ensemble model output (see Sect. 4.3).
-
Volcanic ash NOTAM (Notice to Airmen). A NOTAM is a notice containing information concerning the establishment, condition or change in any aeronautical facility, service, procedure or hazard, the timely knowledge of which is essential to personnel concerned with flight operations (ICAO, 2018b). The NOTAM, issued for 22 April at 17:58 UTC by MWO or the NOTAM office Vienna, is valid from 18:00 to 21:00 UTC. The predicted volcanic ash of Mount Etna has a high concentration (above 4 mg m−3) in the Austrian airspace within the defined polygon.
-
Special Air Reports (special AIREPs). An AIREP is a report of the actual weather conditions as encountered by an aircraft in flight. If pilots observe certain weather phenomena, such as moderate or strong turbulence, icing, or the sighting of volcanic ash, a so-called special AIREP is issued by the corresponding MWO (International Civil Aviation Organization, 2001). MWO Rome (represented by ACG) issued this special AIREP for 18 April at 13:34 UTC. The message contains a pilot report of a volcanic ash sighting at 38.5833∘ N, 15.3167∘ E (approximately 60 NM (111.12 km) north of Mount Etna) at FL340.
In addition, non-harmonized meteorological products specific to Austria were prepared. In the event of volcanic ash occurring in the Austrian airspace or the directly adjacent airspace, these products were
-
a low-level significant weather chart (Fig. 12), displaying significant weather phenomena below FL250, for the entire Alpine region as well as the adjacent regions;
-
a Significant Weather Bulletin, an ACG internal weather forecast product for air traffic controllers, which is a 6 h forecast for weather phenomena that can be significant for traffic en route and can lead to disruption of the air traffic.

Figure 12Low-level significant weather chart for 23 April 14:00 UTC. The predicted volcanic ash is represented by the brown dash-dot-dotted line over the Adriatic Sea, parts of Italy and Slovenia, south-eastern Switzerland, and the southern half of Austria and Hungary and extends from the surface to over FL250.
5.2 Austrian Armed Forces (AAF)
As volcanic ash clouds are very rare events, the respective procedures on the military side are not trained frequently. The EUNADICS-AV demonstration exercise was a good opportunity for the Austrian Air Force to test the following tasks:
-
prove the AAF concept for volcanic incidents in a European civil-military context
-
represent possible information needs of European air forces
-
demonstrate that each air force will have its own national specific tasks (e.g. Austria has to ensure neutrality and sovereignty 24/7)
-
explain military activities that might occur during real volcanic ash events
-
present the AAF air sampling capability in the European civil–military context and highlight its value for European forecast and dispersion modellers.
To fulfil above-mentioned tasks, the AAF participated with the following key personnel of the Austrian Air Operations Centre (AOC): the Chief of Current Operations; the Airspace Manager; a chemical, biological, radiological and nuclear (CBRN) specialist; two military meteorologists; and a military programmer.
The AAF performed an internal reprocessing of the real air operation scenario, from the informal meeting of justice and home affairs ministers, 2018, in Salzburg, under the influence of volcanic ash clouds with relevant ash concentrations in Europe and over Austria. The AAF demonstrated how airspace blocking in the southern part of Europe might influence military overflights through Austrian airspace.
5.3 Rerouting of flights
One of the exercise objectives was to demonstrate how efficiently automated future airline operations in a disaster scenario could function. Impacts on ATM were shown for both the civil and the military sectors within each phase of the exercise. For evaluating the impacts on the air traffic, the air traffic was simulated by using the NAVSIM/USBGSim simulator.
NAVSIM/USBGSim is an ATM ATC (Air traffic control) CNS (Communication, navigation and surveillance) MET (meteorology) simulation framework developed and continuously enhanced by the Aerospace Research Group of the University of Salzburg, in close cooperation with mobile communications R&D (Rokitansky et al., 2007a, b, 2018a, b). NAVSIM/USBGSim has been used to simulate European and worldwide air traffic based on specific reference days in the past (around 36 000 flights within 24 h for Europe and 110 000 flights worldwide). It can be used as a real-time and fast-time simulator.
A total of around 243 000 flights between 18 and 25 April 2018 were analysed and simulated for the demonstration exercise using postflight input data from the EUROCONTROL Network Manager (NM), which means around 30 400 flights per 24 h. In principle, all scheduled airline, charter and cargo flights, as well as short-term business, general aviation and military flights, which entered a controlled airspace within the ECAC1 area were taken into account. The detailed flight route of each of these “real” flights was used as basis for further comparison with the volcanic ash scenario assumed and modelled for the EUNADICS-AV exercise. A total number of around 98 000 flights were identified for potential conflicts with ash clouds. For each of these intersecting flights suitable deviation routes – if required – were calculated by the EUNADICS-AV participant FLIGHTKEYS and further simulated and visualized using the NAVSIM/USBGSim tool of the University of Salzburg. Selected flights were simulated in real time using the Laminar Research flight simulator (X-Plane 11, 2019) and were visualized online with the NAVSIM/USBGSim. Furthermore, voice communications concerning visually observed volcanic ash were exchanged in real time between involved “humans in the loop”, i.e. a pilot and an air traffic controller for selected flights.
A newly developed cost model was used in the framework of an airline network balance tool (FLIGHTKEYS 5D, https://www.airlinesoftware.net/product/1422/flightkeys-5d, last access: 10 June 2020) to cost-efficiently reroute flights affected by the disaster event. A realistic damage cost model has been developed with the advice of the aircraft engine manufacturer Rolls-Royce, and the FLIGHTKEYS trajectory optimizer was modified to integrate the cost model and 5D2 ash data. ATM flow restrictions and mandatory routes were disabled to reduce complexity and to allow more efficient reroutings. Since the vast majority of flights was unaffected and could be assumed to proceed according to their originally filed routings, network disturbance was assumed to be manageable at a level that would be similar to a large convective weather situation. Furthermore, the assumption was made that a future Europe-wide ATM system would be capable of accommodating the rerouting requests in an efficient way for the case where practically all airspace users would utilize the advanced trajectory planning capability and all have safety risk assessments that allow flight through or over ash clouds.
The domino effect of delayed or cancelled flights on connecting flights was not simulated in the exercise. A guess about the impact of that effect would be that it would lead to a doubling of the predicted flight cancellation rate.
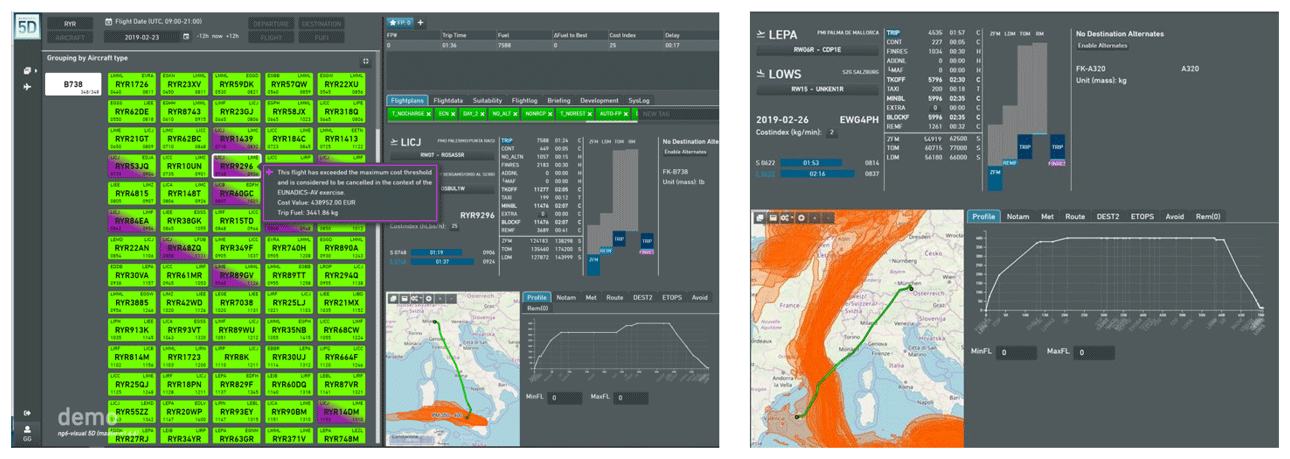
Figure 13FLIGHTKEYS system during the EUNADICS-AV exercise. Left: overview of all monitored flights. Right: status (location, height, planned route) of an individual flight.
The FLIGHTKEYS system during the EUNADICS-AV exercise is shown in Fig. 13. High-resolution volcanic ash data for the entire scenario period (18 to 25 April 2019) were imported as 75th percentile polygons (83 000 polygons) with a temporal resolution of 1 h. Polygons were imported for the following intervals: <1, 1≤2, 2≤3, 3≤4 and ≥4 mg m−3. A large-scale, flight-by-flight optimization was performed on the entire set of 98 000 flights, re-optimizing them vertically and laterally, considering the following factors:
-
upper-air wind and temperature (GRIB data at a 6 h time resolution, 1.25∘ laterally and 2000 ft (600 m) vertically)
-
high-resolution ash model data (see above)
-
detailed aircraft performance (not the BADA model but OEM-provided flight-planning data)
-
cost of reduced engine lifetime due to ash damage
-
cost of increase in future fuel consumption due to ash damage and accumulation
-
effect of air density on ash mass ratio
-
effect of fuel flow on ash accumulation in engines (high fuel flow = high airflow = more ash accumulation).
It was demonstrated that the flight trajectories successfully avoided the ash cloud (see examples in Figs. 14 and 15) in the most economical way by applying a newly developed algorithm that predicts future maintenance cost and fuel efficiency losses, even in complex ash cloud and airway situations (airways only provide a very limited set of possible flight paths).
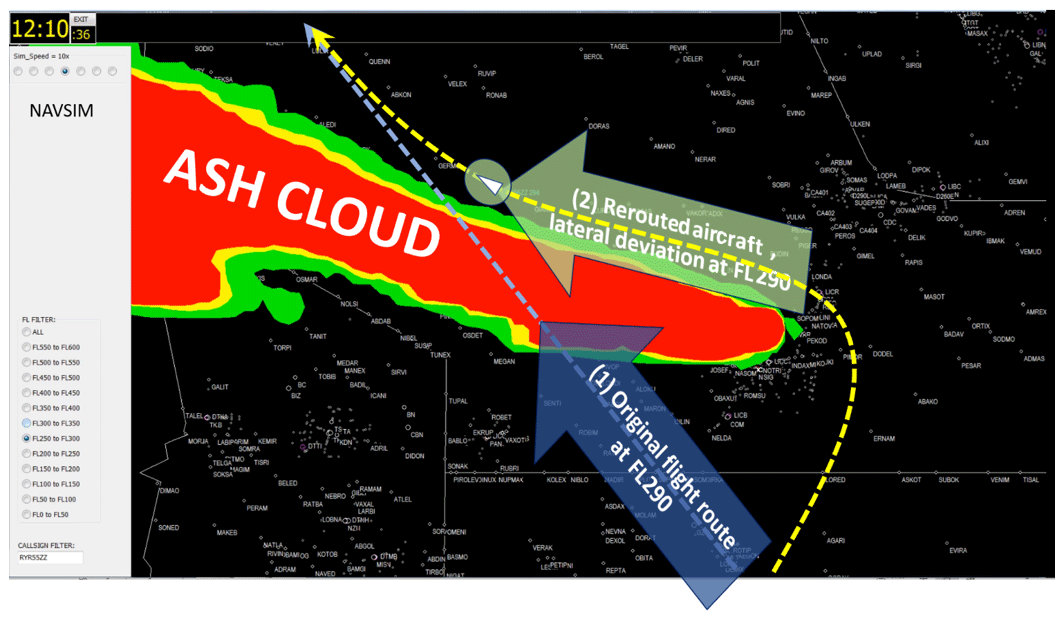
Figure 14Volcanic ash (red ≥4 mg m−3, yellow 2–4 mg m−3, green 0.2–2 mg m−3) reroute calculated by FLIGHTKEYS and simulated with NAVSIM/USBGSim (University of Salzburg), laterally and vertically avoiding ash concentration.

Figure 15Example of a rerouting of one flight calculated by FLIGHTKEYS and simulated with NAVSIM/USBGSim (University of Salzburg), laterally and vertically avoiding volcanic ash (red ≥4 mg m−3, yellow 2–4 mg m−3, green 0.2–2 mg m−3 at different flight levels), © Google Earth.
The algorithm is based on the assumption that airflow through the engine core is proportional to fuel flow and thus allows a direct correlation of ash accumulation to fuel flow. Rolls-Royce contributed first estimated ratios of ash mass accumulation to engine deterioration (e.g. exhaust gas temperature margin loss per kilogram of ash), thus allowing for the prediction of both engine efficiency and engine lifetime decreases and their cost equivalents. The direct relationship to fuel flow is extremely well suited to the already well-established cost optimization algorithm of the FLIGHTKEYS flight-planning system.
With full availability of free-route airspaces across the entire ECAC airspace, even better avoidance trajectories can be expected. Since maintenance cost rises sharply even at low ash concentrations, the ash cloud was often avoided entirely.
Analysis of the large-scale optimization run showed that 2 % of the considered flights had to be considered as “hard” cancellation candidates as a direct consequence of excessive ash concentrations along their routes, while 7 % of the analysed flights required 4D-tailored trajectories. As mentioned above, an estimate of cancellations due to aircraft or crew rotation aspects would probably lead to a doubling of that cancellation rate to 4 %, which is still very low. One important conclusion was that the majority of flights was practically unaffected.
During the EUNADICS-AV exercise, it was demonstrated that tailored and selected observations as well as dedicated model applications can successfully support aviation stakeholders in their decisions during an aviation crisis situation such as a dispersing volcanic ash cloud. A key objective of the exercise was to include a cost–benefit approach within the decision-making process.
One major result has been a presentation of the benefit of using a single harmonized portal for the comprehensive visualization of data and products. Such a platform enables crucial timesaving during a crisis, when decisions must be made fast and efficiently. Once the data are visualized and processed, the possibility of using them integrated into flight-modelling software enables a more effective decision-making process with the rerouting carried out in an automatic or quasi-automatic approach. For our particular case, despite the relevant event simulated and its proximity to the highly busy airspace, the exercise resulted in the surprising and useful result that by integrating ash contamination effects into cost-based trajectory optimization algorithms, most of the flights were almost unaffected. The estimated impact was therefore much lower than initially expected. For volcanic events, a cost–benefit approach was adopted, whereby only flights above a certain threshold would be cancelled. The cost-benefit calculations revealed only for a small number of cases that cancellation was an economically better option than the execution of the flight. The cancellation threshold was set at the additional cost exceeding 200 % of all other considered operating costs (fuel, time, overflight charges).
In the end, every airspace closure or even rerouting of planes can immediately increase the costs for airlines, which will lead to a certain risk acceptance, at least through regions which lie in an area with the ash concentration above the threshold. During the exercise we have shown for a volcanic ash scenario that cost and disruption can be eliminated to a great extent by combining dispersion models with flight-planning software to apply cost-based trajectory optimizations developed within the EUNADICS-AV project.
It can be disputed how big such positive effects would be in the current, fragmented and over-regulated European airspace, but this only underlines how important future progress in the automation and unification of ATM systems and processes will be to allow more flexibility in airspace disruption scenarios like the ones simulated in the exercise
Such conclusions would not have been possible to make if the working practices and interfaces between the broader natural-hazard science communities on one side and the more application-oriented aviation community on the other side, mostly represented in the project by flight trajectory modellers and military aviation practitioners, had not been established. The intense preparatory work ahead of the exercise managed to bridge existing gaps and bring together experts that had not cooperated that closely before. This exercise, and the EUNADICS-AV project as a whole, has provided the very first steps towards integrating an impact-oriented perspective.
| AAF | Austrian Armed Forces |
| ACG | Austro Control |
| ACTRIS | Aerosols, Clouds and Trace Gases Research Infrastructure |
| AFTM | Air traffic flow management |
| ANSP | Air navigation service provider |
| AOC | Air Operations Centre |
| AOCCC | Aircraft Operator Crisis Coordination Cell |
| AOD | Aerosol optical depth |
| ATC | Air traffic control |
| ATM | Air traffic management |
| BADA | Base of Aircraft Data |
| CAAs | Civil aviation authorities |
| CBRN | Chemical, biological, radiological and nuclear |
| CNS | Communication, navigation and surveillance |
| EACCC | European Aviation Crisis Coordination Cell |
| EARLINET | European Aerosol Research Lidar Network |
| ECAC | European Civil Aviation Conference |
| ECMWF | European Centre for Medium-Range Weather Forecasts |
| ERA5 | ECMWF reanalysis |
| EUNADICS-AV | European Natural Disaster Coordination and Information System for Aviation |
| EUROCONTROL | European Organisation for the Safety of Air Navigation |
| EWS | Early-warning system |
| FL | Flight Level |
| FLEXPART | FLEXible PARTicle dispersion model |
| FMI | Finnish Meteorological Institute |
| GRIB | GRIdded Binary |
| IASI | Infrared Atmospheric Sounding Interferometer |
| IAVW | International Airways Volcano Watch |
| ICAO | International Civil Aviation Organization |
| INGV | Italian National Institute of Geophysics and Volcanology |
| Lidar | Light detection and ranging |
| MATCH | Multi-scale Atmospheric Transport and Chemistry |
| MetOp | Meteorological operational satellite |
| MOCAGE | Modèle de Chimie Atmosphérique de Grande Echelle |
| MODIS | Moderate Resolution Imaging Spectroradiometer |
| MWO | Meteorological watch office |
| NAVSIM/USBGSim | Navigation simulator (University of Salzburg) |
| NM | Network Manager |
| NOTAM | Notice to Airmen |
| NRT | Near real time |
| OEM | Original equipment manufacturer |
| PMA | Parts manufacturer approval |
| SCC | Single Calculus Chain |
| SIGMET | Significant Meteorological Information |
| SILAM | System for Integrated modeLling of Atmospheric coMposition |
| Special AIREP | Special Air Report |
| STC | Supplemental type certificate |
| VAACs | Volcanic ash advisory centres |
| VACP | Volcanic Ash Contingency Plan |
| VOLCEX | VOLcanic ash Contingency EXercise |
| VONA | Volcano Observatory Notice for Aviation |
| WMO | World Meteorological Organization |
| WRF-Chem | Weather Research and Forecasting (WRF) model coupled with Chemistry |
Data are available at the exercise data portal http://data.eunadics.eu/#/archive (Som de Cerff and Wagenaar, 2020) or upon request from the corresponding author (marcus.hirtl@zamg.ac.at).
MH conceptualized and prepared the paper with contributions from all co-authors. MH, DA, RB, CM, MDM, MPl, LR, BSP, MSo and AU conducted the model simulations by applying different models and developed the ensemble. AU produced the artificial observations used for the exercise with contributions from the modelling groups and the aviation group. NT and HB (satellite) developed and described the early-warning system together with LM and NP (lidar) and MC (observatory). HHS and MPe prepared the contributions from the Austrian Armed Forces, and MSte and RW prepared the contributions from the Austro Control perspective. GW, MStu, DM and FL collected stakeholder feedback, which was integrated into this paper. CHR, KS, KE, FZ and RZ conducted the air traffic simulations and the corresponding rerouting of aircraft due to the ash cloud. WSdC and SW developed the data portal and contributed to the corresponding sections in this paper.
The authors declare that they have no conflict of interest.
This article is part of the special issue “Analysis and prediction of natural airborne aviation hazards”. It is not associated with a conference.
This work has been conducted within the framework of the EUNADICS-AV project, which has received funding from the European Union's Horizon 2020 research programme for societal challenges – Smart, Green and Integrated Transport under grant agreement no. 723986. We thank the Austrian military for hosting the exercise and providing technical equipment together with the University of Salzburg.
This research has been supported by the European Union's Horizon 2020 research programme for societal challenges – Smart, Green and Integrated Transport (grant no. 723986).
This paper was edited by Matthias Themessl and reviewed by Tatjana Bolic and Andreas Vogel.
Albersheim, S. and Guffanti, M.: The United States national volcanic ash operations plan for aviation, Nat. Hazards, 51, 275–285, 2009.
Alexander, D.: Volcanic ash in the atmosphere and risks for civil aviation: a study in European crisis management, Int. J. Disast. Risk Sc., 4, 9–19, 2013.
Baars, H., Seifert, P., Engelmann, R., and Wandinger, U.: Target categorization of aerosol and clouds by continuous multiwavelength-polarization lidar measurements, Atmos. Meas. Tech., 10, 3175–3201, https://doi.org/10.5194/amt-10-3175-2017, 2017.
Bolić, T. and Sivčev, Ž.: Eruption of Eyjafjallajökull in Iceland: Experience of European air traffic management, Transport. Res. Rec., 2214, 136–143, 2011.
Bolić, T. and Sivčev, Z.: Air Traffic Management in Volcanic Ash Events in Europe: a Year After Eyjafjallajökull Eruption, No. 12-3009, Transportation Research Board 91st Annual Meeting, 22–26 January 2012, Washington, D.C., USA, available at: https://trid.trb.org/view/1130074 (last access: 12 June 2020), 2012.
Brechan, I.: Air travel disruption after the volcano eruption in Iceland: consequences for Norwegian travellers and businesses in Norway. Institute of transport economics, Oslo, Norway, report 1120/2010, 2010.
Clarisse, L., Prata, F., Lacour, J.-L., Hurtmans, D., Clerbaux, C., and Coheur, P.-F.: A correlation method for volcanic ash detection using hyperspectral infrared measurements, Geophys. Res. Lett., 37, L19806, https://doi.org/10.1029/2010GL044828, 2010.
Clarkson, R. J., Majewicz, E. J. E., and Mack, P.: A re-evaluation of the 2010 quantitative understanding of the effects volcanic ash has on gas turbine engines, P. I. Mech. Eng. G-J. Aer., 230, 2274–2291, https://doi.org/10.1177/0954410015623372, 2016.
Clerbaux, C., Boynard, A., Clarisse, L., George, M., Hadji-Lazaro, J., Herbin, H., Hurtmans, D., Pommier, M., Razavi, A., Turquety, S., Wespes, C., and Coheur, P.-F.: Monitoring of atmospheric composition using the thermal infrared IASI/MetOp sounder, Atmos. Chem. Phys., 9, 6041–6054, https://doi.org/10.5194/acp-9-6041-2009, 2009.
D'Amico, G., Amodeo, A., Baars, H., Binietoglou, I., Freudenthaler, V., Mattis, I., Wandinger, U., and Pappalardo, G.: EARLINET Single Calculus Chain – overview on methodology and strategy, Atmos. Meas. Tech., 8, 4891–4916, https://doi.org/10.5194/amt-8-4891-2015, 2015.
Dee, D. P., Uppala, S. M., Simmons, A. J., Berrisford, P., Poli, P., Kobayashi, S., Andrae, U., Balmaseda, M. A., Balsamo, G., Bauer, P., Bechtold, P., Beljaars, A. C. M., van de Berg, L., Bidlot, J., Bormann, N., Delsol, C., Dragani, R., Fuentes, M., Geer, A. J., Haimberger, L., Healy, S. B., Hersbach, H., Hólm, E. V., Isaksen, L., Kållberg, P., Köhler, M., Matricardi, M., McNally, A. P., Monge-Sanz, B. M., Morcrette, J.-J., Park, B.-K., Peubey, C., de Rosnay, P., Tavolato, C., Thépaut, J.-N., and Vitart, F.: The ERA-Interim reanalysis: configuration and performance of the data assimilation system, Q. J. Roy. Meteor. Soc., 137, 553–597, https://doi.org/10.1002/qj.828, 2011.
Dopagne, J.: The European air traffic management response to volcanic ash crises: towards institutionalised aviation crisis management, Journal of Business Continuity & Emergency Planning, 5, 103–117, 2011.
Durant, A. J., Villarosa, G., Rose, W. I., Delmelle, P., Prata, A. J., and Viramonte, J. G.: Long-range volcanic ash transport and fallout during the 2008 eruption of Chaitén volcano, Chile, Phys. Chem. Earth A/B/C, 45, 50–64, 2012.
Grell, G. A., Peckham, S. E., Schmitz, R., McKeen, S. A., Frost, G., Skamarock, W. C., and Eder, B.: Fully coupled online chemistry with in the WRF model, Atmos. Environ., 39, 6957–6975, 2005.
Gudmundsson, M. T., Thordarson, T., Höskuldsson, Á., Larsen, G., Björnsson, H., Prata, F. J., Oddsson, B., Magnússon, E., Högnadóttir, T., Petersen, G. N., and Hayward, C. L.: Ash generation and distribution from the April–May 2010 eruption of Eyjafjallajökull, Iceland, Sci. Rep., 2, 1–12, 2012.
Guffanti, M., Casadevall, T. J., and Budding, K. E.: Encounters of aircraft with volcanic ash clouds: a compilation of known incidents, 1953–2009, US Department of Interior, US Geological Survey, US Department of Interior, US Geological Survey, Reston, Virginia, USA, 2010a.
Guffanti, M., Schneider, D. J., Wallace, K. L., Hall, T., Bensimon, D. R., and Salinas, L. J.: Aviation response to a widely dispersed volcanic ash and gas cloud from the August 2008 eruption of Kasatochi, Alaska, USA, J. Geophys. Res.-Atmos., 115, D00L19, https://doi.org/10.1029/2010JD013868, 2010b.
Guth, J., Josse, B., Marécal, V., Joly, M., and Hamer, P.: First implementation of secondary inorganic aerosols in the MOCAGE version R2.15.0 chemistry transport model, Geosci. Model Dev., 9, 137–160, https://doi.org/10.5194/gmd-9-137-2016, 2016.
Hersbach, H. and Dee, D.: ERA5 reanalysis is in production, ECMWF Newsletter No. 147, 7, ECMWF publications, available at: https://www.ecmwf.int/en/publications/search?solrsort=ds_biblio_date desc&f[0]=sm_biblio_type:Newsletter (last access: 12 June 2020), 2016.
IATA: IATA Economic Briefing: The Impact of Eyjafjallajokull'S Volcanic Ash Plume, available at: https://www.iata.org/en/iata-repository/publications/economic-reports/impact-of-ash-plume/ (last access: 12 June 2020), 2010.
ICAO: Manual on Volcanic Ash, Radioactive Material and Toxic Chemical Clouds, Doc 9691 AN/954, 2nd edn., available at: https://skybrary.aero/bookshelf/books/2997.pdf (last access: 12 June 2020), 2007.
ICAO: International Standards and Recommended Practices – Annex 3 to the Convention on International Civil Aviation; Meteorological Service for International Air Navigation, 20th edn., available at: http://store.icao.int/products/annex-3-meteorological-service-for-international-air-navigation (last access: 12 June 2020), 2018a.
ICAO: International Standards and Recommended Practices – Annex 11 to the Convention on International Civil Aviation, Air Traffic Services, 15th edn., available at: https://store.icao.int/products/annex-11-air-traffic-services (last access: 12 June 2020), 2018b.
International Civil Aviation Organization: Manual on volcanic ash, radioactive material, and toxic chemical clouds. International Civil Aviation Organization, available at: https://skybrary.aero/bookshelf/books/2997.pdf (last access: 10 June 2020), 2001.
Johnson, R. W. and Casadevall, T. J.: Aviation safety and volcanic ash clouds in the Indonesia–Australia region, First international symposium on volcanic ash and aviation safety, 8–12 July 1991, Seattle, Washington, USA, 191–197, 1994.
Karagulian, F., Clarisse, L., Clerbaux, C., Prata, A. J., Hurtmans, D., and Coheur, P. F.: Detection of volcanic SO2, ash, and H2SO4 using the Infrared Atmospheric Sounding Interferometer (IASI), J. Geophys. Res., 115, D00L02, https://doi.org/10.1029/2009JD012786, 2010.
Levy, R. and Hsu, C.: MODIS atmosphere L2 aerosol product. NASA MODIS Adaptive Processing System, available at: https://modis-images.gsfc.nasa.gov/MOD04_L2/doi.html (last access: 12 June 2020), 2015.
Pappalardo, G., Amodeo, A., Apituley, A., Comeron, A., Freudenthaler, V., Linné, H., Ansmann, A., Bösenberg, J., D'Amico, G., Mattis, I., Mona, L., Wandinger, U., Amiridis, V., Alados-Arboledas, L., Nicolae, D., and Wiegner, M.: EARLINET: towards an advanced sustainable European aerosol lidar network, Atmos. Meas. Tech., 7, 2389–2409, https://doi.org/10.5194/amt-7-2389-2014, 2014.
Prata, A. J., Carn, S. A., Stohl, A., and Kerkmann, J.: Long range transport and fate of a stratospheric volcanic cloud from Soufrière Hills volcano, Montserrat, Atmos. Chem. Phys., 7, 5093–5103, https://doi.org/10.5194/acp-7-5093-2007, 2007.
Przedpelski, Z. J. and Casadevall, T. J.: Impact of volcanic ash from 15 December 1989 Redoubt volcano eruption on GE CF6-80C2 turbofan engines, in Volcanic ash and aviation safety: Proc. of the First International Symposium on Volcanic Ash and Aviation Safety, 8–12 July 1991, Seattle, Washington, USA, 129–135, 1994.
Robertson, L., Langner, J., and Engardt, M.: An Eulerian limited-area atmospheric transport model, J. Appl. Meteorol., 38, 190–210, 1999.
Rokitansky, C.: NAVSIM: Detailgenaue Simulation des heutigen/zukünftigen Flugverkehrs (Europa/weltweit) zur Bewertung von SESAR Konzepten und Wetterszenarien, Presentation, Stuttgart, Germany, 2009.
Rokitansky, C. H., Ehammer, M., and Gräupl, T.: Newsky – Novel Simulation Concepts for Future Air Traffic, in: Proc. 1st CEAS European Air and Space Conference, 10–13 September 2007, Berlin, Germany, 611–618, 2007a.
Rokitansky, C. H., Ehammer, M., and Gräupl, T.: NEWSKY – Building a Simulation Environment for an Integrated Aeronautical Network Architecture, in: Proc. 26th DASC, 21–25 October 2007, Dallas, TX, USA, 4.B.4-1–4.B.4-11, 2007b.
Rokitansky, C.-H., Eschbacher, K., Zobl, F., Kallus, W., and Schmidt, R.: Intelligent Airport Operations and Advanced Arrival Management Algorithms & Decision Support Tools, Aviation Psychology in Austria 2018, ISBN 9783990302224, available at: https://content-select.com/de/portal/media/view/53833ba8-c658-421f-8c5f-45a02efc1343 (last access: 12 June 2020), 2018a.
Rokitansky, C. H., Eschbacher, K., Mayr, M., and Zobl, F.: Advances in ATM simulation by using global flight simulation framework NAVSIM, in: Proc. SESAR INNOVATION DAYS, 3–7 December 2018, Salzburg, Austria, 49–50, 2018b.
Sivcev, Z.: ICAO volcanic ash exercise VOLCEX 11/01 and EVITA, in: EASA Volcanic Ash Operations Workshop, 20 January 2011, Cologne, Germany, 2011.
Sofiev, M., Vira, J., Kouznetsov, R., Prank, M., Soares, J., and Genikhovich, E.: Construction of the SILAM Eulerian atmospheric dispersion model based on the advection algorithm of Michael Galperin, Geosci. Model Dev., 8, 3497–3522, https://doi.org/10.5194/gmd-8-3497-2015, 2015.
Som de Cerff, W. and Wagenaar, S.: Event Archive: Etna eruption exercise (from 18 April 2018 to 24 April 2018), available at: http://data.eunadics.eu/#/archive, last access: 10 June 2020.
Stohl, A., Forster, C., Frank, A., Seibert, P., and Wotawa, G.: Technical note: The Lagrangian particle dispersion model FLEXPART version 6.2, Atmos. Chem. Phys., 5, 2461–2474, https://doi.org/10.5194/acp-5-2461-2005, 2005.
Stohl, A., Prata, A. J., Eckhardt, S., Clarisse, L., Durant, A., Henne, S., Kristiansen, N. I., Minikin, A., Schumann, U., Seibert, P., Stebel, K., Thomas, H. E., Thorsteinsson, T., Tørseth, K., and Weinzierl, B.: Determination of time- and height-resolved volcanic ash emissions and their use for quantitative ash dispersion modeling: the 2010 Eyjafjallajökull eruption, Atmos. Chem. Phys., 11, 4333–4351, https://doi.org/10.5194/acp-11-4333-2011, 2011.
Stuefer, M., Freitas, S. R., Grell, G., Webley, P., Peckham, S., McKeen, S. A., and Egan, S. D.: Inclusion of ash and SO2 emissions from volcanic eruptions in WRF-Chem: development and some applications, Geosci. Model Dev., 6, 457–468, https://doi.org/10.5194/gmd-6-457-2013, 2013.
X-Plane 11: Flight simulator, available at: https://www.x-plane.com/, last access: 15 May 2019.
The European Civil Aviation Conference (ECAC) currently includes 44 member states (refer to https://www.ecac-ceac.org/member-states, last access: 10 June 2020).
In addition to the 4D space covered by traditional flight-planning solutions, 5D extends the calculation space into a fifth dimension. Uncertainties in surface weather, traffic and cost prediction are modelled into statistical functions based on a continuous analysis of actual flight data. For upper-air weather, multicasting weather products are introduced to compare multiple scenarios and automatically apply suitable strategies, e.g. adaptive fuel reserves, and delay cost reduction (for more information see https://www.flightkeys.com/, last access: 10 June 2020).
- Abstract
- Introduction
- International exercises
- Overview of the EUNADICS-AV demonstration exercise set-up
- Data sets used for the demonstration exercise
- The impact of the ash cloud on aviation for the Etna eruption scenario
- Conclusion
- Appendix A: Glossary
- Data availability
- Author contributions
- Competing interests
- Special issue statement
- Acknowledgements
- Financial support
- Review statement
- References