the Creative Commons Attribution 4.0 License.
the Creative Commons Attribution 4.0 License.
 | 05 Jun 2020
Review article: The spatial dimension in the assessment of urban socio-economic vulnerability related to geohazards
Diana Contreras
Alondra Chamorro
Sean Wilkinson
Society and economy are only two of the dimensions of vulnerability. This paper aims to elucidate the state of the art of data sources, spatial variables, indicators, methods, indexes and tools for the spatial assessment of socio-economic vulnerability (SEV) related to geohazards. This review was first conducted in December 2018 and re-run in March 2020 for the period between 2010 and 2020. The gross number of articles reviewed was 27, from which we identified 18 relevant references using a revised search query and six relevant references identified using the initial query, giving a total sample of 24 references. The most common source of data remains population censuses. The most recurrent spatial variable used for the assessment of SEV is households without basic services, while critical facilities are the most frequent spatial category. Traditional methods have been combined with more innovative and complex methods to select and weight spatial indicators and develop indices. The Social Vulnerability Index (SoVI®) remains the benchmark for the assessment of SEV and a reference for its spatial assessment. Geographic information systems (GIS) is the most common tool for conducting a spatial assessment of SEV regarding geohazards. For future spatial assessments of SEV regarding geohazards, we recommend considering 3-D spatial indexes at the microscale at the urban level and involving the community in the assessments.


Vulnerability is defined by the United Nations (UN) as “the conditions determined by physical, social, economic and environmental factors or processes that increase the susceptibility of an individual, a community, assets or systems to the impact of hazards” (UN, 2016). In the past, vulnerability was considered a composite factor that has only two dimensions: exposure to risk and susceptibility (Béné, 2009; Chambers, 1989). More recently, Birkmann et al. (2013) considered three factors: exposure, susceptibility, and fragility and lack of resilience. The degree of vulnerability of a specific community is a human value judgement that strongly influences management decisions (McLaughlin et al., 2002). In addition, the concept of social vulnerability (SV) to environmental hazards involves demographic and socio-economic factors that affect community resilience (Zebardast, 2013), and this is considered a hot topic in current disaster research (Shen et al., 2018). The social and economic dimensions are only two dimensions of vulnerability to multiple stressors and shocks. These shocks include disasters due to the fragility and susceptibility of human well-being damaged by disruption to individuals (physical and mental health) and collective social systems (e.g. education, services, health) and their characteristics (e.g. age, ethnicity, disabilities) (Birkmann et al., 2013). Social vulnerability refers to the inability of people, organizations and societies to cope with negative impacts from different stressors to which they are exposed (Eidsvig et al., 2014; Kuhlicke et al., 2011; Myers et al., 2008; Qasim et al., 2018). Typically, this inability results from pre-existing conditions that reduce a society's ability to prepare and recover from disasters (Alcorn et al., 2013; Cutter and Finch, 2008; Eidsvig et al., 2014; Zebardast, 2013; Zhou et al., 2014). Social vulnerability additionally identifies sensitive populations that are less prepared to respond, cope with and recover from a disaster (Zebardast, 2013), such as low-income populations, women, pregnant women, children under 5 years of age, elderly above 65 years of age (Bereitschaft, 2017a; Zhou et al., 2014), and physically and/or mentally challenged individuals (Contreras and Kienberger, 2012). Other vulnerable population groups are people with linguistic, cultural and spatial barriers (Eidsvig et al., 2014), such as migrants (Yuan et al., 2019a), rural population, people without post-secondary education (Bereitschaft, 2017a; Cutter et al., 2003; Eidsvig et al., 2014), high-density population (Cutter et al., 2003; Eidsvig et al., 2014) and public transport captives (Bereitschaft, 2017a).
The concept of SV is complex and dynamic, changing over time and space and is therefore not easily captured by a single variable (Cutter and Finch, 2008; Zebardast, 2013). It represents the multidimensionality of disasters by focusing attention on the totality of relationships in a given social situation, which, in combination with environmental forces, such as geohazards, result in a disaster (Oliver-Smith, 2003). Social vulnerability attracts less attention from researchers because many challenges are implied in its quantification (Qasim et al., 2018). Power relationships that exclude certain individuals or groups from benefiting from disaster risk reduction (DRR) or post-disaster recovery efforts are examples of SV (Contreras et al., 2011). These power relationships manifest between individuals or socio-economic groups in the framework of institutions or culturally determined dialogues about stressors (Warmer et al., 2007).
The economic dimension of vulnerability is the predisposition for the loss of economic value from damage to physical assets (Birkmann et al., 2013) and/or business interruption (activities, services or delivery of products). The assessment of SV is orientated to cast light on the most susceptible groups of a population to impacts of a disaster in both the spatial and temporal dimensions (Zhou et al., 2014). Another important aspect to consider is the relationship between social and economic dimensions because, according to Noy (2009), no evidence exists of a correlation between consequences of disasters, such as the number of fatalities or affected population, and GDP growth. Nevertheless, the same author indicates that the degree of damage due to a disaster will negatively influence GDP growth. Thus, Noy (2015) proposes integrating the number of fatalities and injuries with financial damage due to a disaster using a model similar to the estimation of disability-adjusted life years (DALYs). His index accounts for the number of human years lost as a result of the damage. The spatial dimension of socio-economic vulnerability (SEV) recognizes that people and groups of similar characteristics tend to occupy the same or similar areas, while the temporal dimension of SEV makes reference to people's degree of vulnerability, which can change depending on age, life situation and season (Wisner and Uitto, 2009). To include urban vulnerability assessment into a spatial plan requires strategic, technical, substantial and procedural integration (Hizbaron et al., 2012). According to Ebert et al. (2009), a spatial indicator of SV is an SV indicator with a physical component. Housing structures and the built environment were previously included by Shuang-Ye et al. (2002) in a geographic information systems (GIS)-based study of SV. The link between transportation infrastructure and land use had been already studied by Clark et al. (1998). The physical conditions were considered indicative of the social ones by Rashed and Weeks (2003). Kienberger et al. (2009) proposed a methodology for the spatial quantification of vulnerability and the identification of vulnerability units built upon the “geon” concept, which is a framework for the clustering of homogeneous spatial information. Khazai et al. (2013) developed a sector-specific vulnerability index (IVI), which included transport dependency indicators made up by the spatial variables, such as freight transport volume on roads and freight transport volume on railways; this index also included the spatial variable of customer proximity as part of the indicator demand dependency.
In the context of disaster risk management and in the context of exposure and impact assessment, the accuracy and reliability of input data are two of the most important factors (Aubrecht et al., 2013). Data constraints play a key role in the results of the SEV assessment, with the number of variables changing the assessment and the inclusion of additional variables enhancing its precision and enabling the proper presentation of SV assessment (Gautam, 2017). Thus, the assessment of vulnerability must be based on indicators and proxy indexes (Qasim et al., 2018) that can guarantee objectivity and provide quantitative metrics to compare different places (Cerchiello et al., 2018). Indicators and indexes are defined as single qualitative or indirect quantitative measures of a characteristic (Chen, 2016) or a real phenomenon (Fekete, 2009) resulting from systematically observed facts (OECD, 2008). Indicators transform complex data into manageable units of information for performance, change and achievement assessment (Grace and Edwin, 2009). Indicators also summarize technical information into indexes, simplifying comprehension (Simpson and Katirai, 2006). The most important factor for indicator selection is the availability of data. A lack of data can lead to reliance on variables that may not be the most accurate indicators of vulnerability (Zhou et al., 2014). Vulnerability indicators are complex measures of a part of what constitutes a community. Scientific literature has identified groups of social and economic indicators, which when combined with physical and land data are useful for vulnerability assessments of communities (King, 2001). The use of these indicators has primarily been applied to the assessment of adaptive capacity and vulnerability (Chen, 2016).
Indexes are built up with these indicators and later mapped to display the different categories of vulnerability in each administrative zone, limiting the spatial dimension to this stage. The construction of an index implies selection of indicators, indicator normalization and weighting, and aggregation into an index (OECD, 2008) that must collectively represent aspects of a society's ability to prepare for, deal with and recover from a disaster (Eidsvig et al., 2014). The most sensitive step for constructing an index is the weighting of indicators. This can be undertaken either using participatory approaches, such as the analytic hierarchy process (AHP), the budget allocation process, statistical assessment like the principal component analysis (PCA), or factor analysis (FA) (Eidsvig et al., 2014; OECD, 2008). Weighting individual indicators is a major challenge for constructing a composite indicator for vulnerability (Adger et al., 2004; Zebardast, 2013). The objectives of indicator weighting are, first, to investigate any correlation among indicators to detect overlapping information and, second, to select a suitable weighting and aggregation approach for the final index calculation. Different weightings show varied spatial vulnerability patterns (Papathoma-Kohle et al., 2019); however, independent of the method applied, after comparing 106 studies for index construction with respect to risk assessment, Beccari (2016) found that the most common approach used (41.5 %) was the “equal weights” method. Eventually, the accuracy of SV assessment relies on the accuracy of input data (Yuan et al., 2019a) and not on the weighting method. After being weighted, indicators can be aggregated using additive, multiplicative, or decision rule models (Eidsvig et al., 2014). The method of aggregation is one of the most pressing problems in developing composite vulnerability indices (Rygel et al., 2006).
Composite indicators have been commonly employed by researchers, planners and disaster managers for vulnerability assessments (Yuan et al., 2019a). Cutter et al. (2003) have constructed an index of SV called SoVI® for environmental hazards in the USA using a FA approach computed in a summary score based on an additive model. In the framework of the Methods for the Improvement of Vulnerability Assessment in Europe (MOVE) project, variables were grouped into single and composite indicators (Vinchon et al., 2011). In the case study area of Salzburg (Austria), an expert-based approach was chosen, and several experts were asked to allocate weights according to the contribution of each variable to the vulnerability of floods (Contreras and Kienberger, 2011). Other composite indicators useful for the vulnerability assessment are the Prevalent Vulnerability Index (Cardona, 2005), Environmental Sustainability Index (Esty et al., 2005) and Human Development Index (UNDP, 2010). All of these indexes face challenges when assessing vulnerability indicators, such as ranking socio-economic data on an interval scale, dealing with temporal aspects (day–night changes), choosing the most suitable data resolution to avoid the “modifiable areas unit problem” (MAUP) (Openshaw, 1983), deciding how to allocate a meaningful value to socio-economic variables and how these aspects together affect the vulnerability assessment of each case study area (McLaughlin et al., 2002). The compilation of all of the SV indicators used through time was undertaken by Fatemi et al. (2017); however, they neither included the spatial dimension in their systematic review nor focused exclusively on geohazards as in this research.
Quantitative measures to develop indicators can be spatially explicit and based on spatial variables, such as location, area, range, distance, direction, spatial geometries and patterns (Unwin, 1996), spatial connectivity, mobility (Béné, 2009), isolation, diffusion, distribution, spatial association, spatial interaction, spatial evolution, spatial synthesis, and scale of the affected area and surroundings (Béné, 2009; Buzai and Villerías Alarcón, 2018; Contreras et al., 2013; Meentemeyer, 1989). The geographic patterns in vulnerability can increase due to spatial interactions, while additional patterns within these components may be related to the nature of vulnerability stemming from a specific hazard (Amram et al., 2011). The main aim of this research is to elucidate the state of the art of data sources, spatial variables, indicators, methods, indexes and tools for the assessment of the SEV related to geohazards in urban environments. Geohazards can be endogenic, such as earthquakes, tsunamis, and volcanic eruptions, and exogenic, such as landslides, soil erosion, and land degradation. We particularly focus on these phenomena for two reasons: first, geohazards are the natural phenomena that have produced the highest quantity of losses in recent years in urban environments (particularly earthquakes) and, second, because geohazards are the phenomena addressed by the institutions involved in the present research.
The Indian Ocean tsunami in 2004, as a result of its large impact area, reignited the research community's interest in spatial vulnerability analyses, illuminating the problems faced by low-income population after disasters (Fekete, 2012). This approach was aligned with the Hyogo Framework for Action (UNISDR, 2007) and confirmed by Gautam (2017), who notes that after 2005 a focus on construction and mapping of the SV index intensified. Thus, the use of geographic information systems (GIS) to collect and process data related to hazards and vulnerability was found very suitable (Fekete, 2012). Major earthquakes that occurred during the same period as this systematic review (2010–2020), e.g. Chile (2010), New Zealand (2010 and 2011), Nepal (2015), Mexico (2017), Albania (2019) and Croatia (2020), demonstrate the vulnerability of urban areas to seismic damage (Armaş et al., 2017).
This research reviews case study areas, data sources, spatial variables, indicators, methods, indexes and tools used in the spatial assessment of SEV vulnerability by different authors in the period between 2010 and 2020. This systematic review aims to evaluate the literature to identify patterns and trends, as well as research gaps, in order to recommend new research areas. This article aspires to guide scientists who want to perform any spatial assessment of SEV vulnerability. Socio-economic vulnerability is dynamic and changes across spatial and temporal scales, depending on demographic, geographic, economic and cultural factors. Hence, no one-size-fits-all approach exists to measure and reduce SV (Zhou et al., 2014). This paper is divided into six sections. The introduction is the first section and includes a literature review. The second section, on methods, elaborates on the criteria for selecting the articles that comprise the systematic review and the format of the presentation of results. The third section focuses on the results. The fourth section includes discussion of the results supported by literature, and the fifth section contains conclusions, with recommendations proposed in the sixth section.
A systematic review searches for, appraises and synthesizes research evidence (Grant and Booth, 2009). In the present research, the systematic review was conducted to elucidate the state of the art of data sources, spatial variables, indicators, methods, indexes and tools for the spatial assessment of the SEV related to geohazards, which we consider is covered in the period between 2010 and 2020. Thus, the main research question is as follows: what is the state of the art of the spatial assessment of SEV to geohazards in urban environments?
This review was conducted in December 2018 and re-run during the revision process in March 2020. For this research, Clarivate Analytics and Scopus (Elsevier) were the sources of selected literature given their functionalities for running the search query. We limited the query to articles published in academic journals because they typically are rigorous in the selection of their publications and therefore contain a complete and accurate description of methodologies and consistent results. The terms selected for the search query refer to vulnerability in the socio-economic dimension; the spatial variables listed by Meentemeyer (1989), Béné (2009), Contreras et al. (2013), and Buzai and Villerías Alarcón (2018); and the aforementioned endogenic and exogenic geohazards. Based on several screenings, to refine the search strategy, we opted to exclude terms that were not related to geohazards and were recurring in the titles, abstracts and keywords of the resulting references. The final set of terms included and excluded in the search query is listed in Table 1, and the scheme of the methodology applied is depicted in Fig. 1.
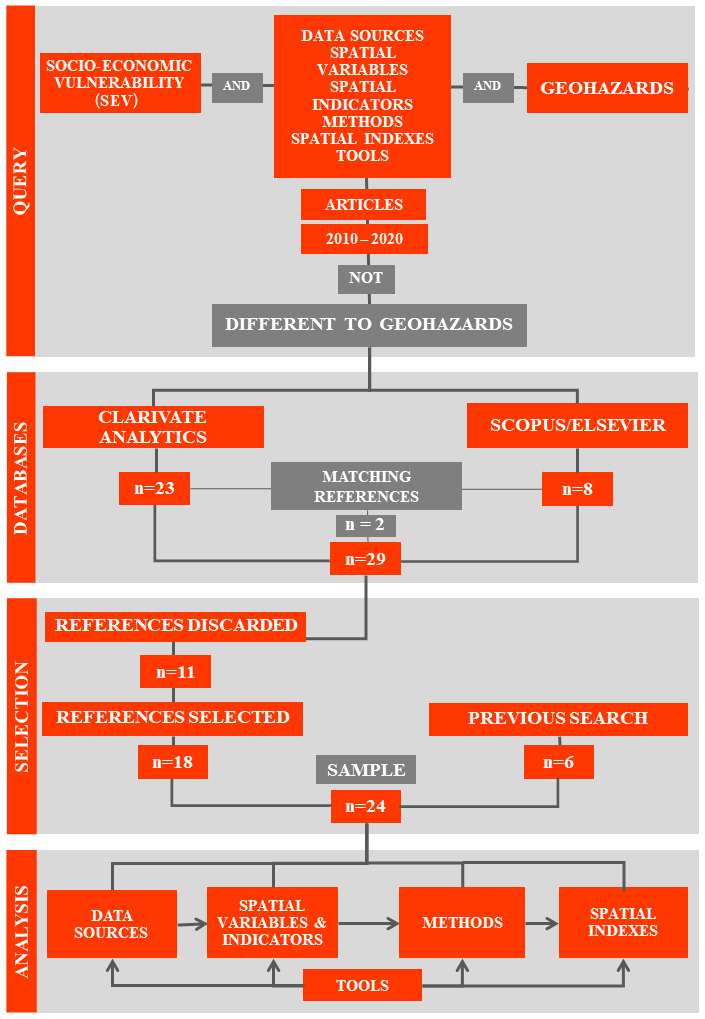
The findings will be presented in the results section in tables relating to selected references, data sources, spatial variables, indicators, methods, spatial indexes and tools. Table 2 is structured into five columns, namely author, year, research objective, geohazard addressed and country where the case study area of the paper is located. The authors are listed from the most recent reference to the oldest one. Tables 3–7 are mainly structured into two columns: the first column lists data sources, spatial variables, indicators, methods and indexes. The second column contains the authors and the year of the publication in which the mentioned topics are addressed. Moreover, the references in these tables are also listed in reverse chronological order. The second column in Table 3 includes, in some cases, specific details of the data source used by the authors. Table 8 includes three columns: method, software and authors.
The gross number of articles identified using the search query was 29, having two matching references in Clarivate Analytics and Scopus (Elsevier): Kurnianto et al. (2019) and Eidsvig et al. (2014). Thus, eventually, we identified 27 references. Despite the precise search query, 11 references were discarded due to reasons explained as follows. In chronological order, the first reference discarded was Papathoma-Kohle et al. (2019) because they use variables in the physical dimension, rather than socio-economic variables. Two references from Yuan et al. (2019a, b) were identified by the search query as using the same method for the spatial assessment of SEV; therefore, we decided to select only one of them. Zhang and Huang (2018) address the topic of SV but not its spatial assessment, while Shen et al. (2018) focused on calculating the impact of disasters, rather than estimating SEV. The paper written by Goncalves and Vizintim (2017) was written in Portuguese, in which none of the authors are proficient. Postiglione et al. (2016) promote a culture of seismic risk prevention, rather than estimating SEV due to earthquakes. Alcántara-Ayala and Oliver-Smith (2014) present the activities undertaken by the ICL Latin American network (ICL LAB) related to capacity building to reduce risk due to landslides, with no specific emphasis on SEV. Khazai et al. (2014), in their book chapter, concentrate on modelling shelter needs and health impacts caused by earthquakes. Vilches et al. (2014) evaluate the socio-environmental effects of the 27 February 2010 tsunami in Chile, considering the SEV among other aspects, but they do not make use of any spatial variable, indicator, or index, which is similar to the vulnerability assessment relating to a tsunami in the town of Tirua (Chile) undertaken by Jaque Castillo et al. (2013). Six references from the previous search query carried out in 2018 and not identified in the refined search query were included in the list given their relevance due to the geohazards and spatial variables, indicators, and indexes that they address. The 24 references reviewed are listed in Table 2.
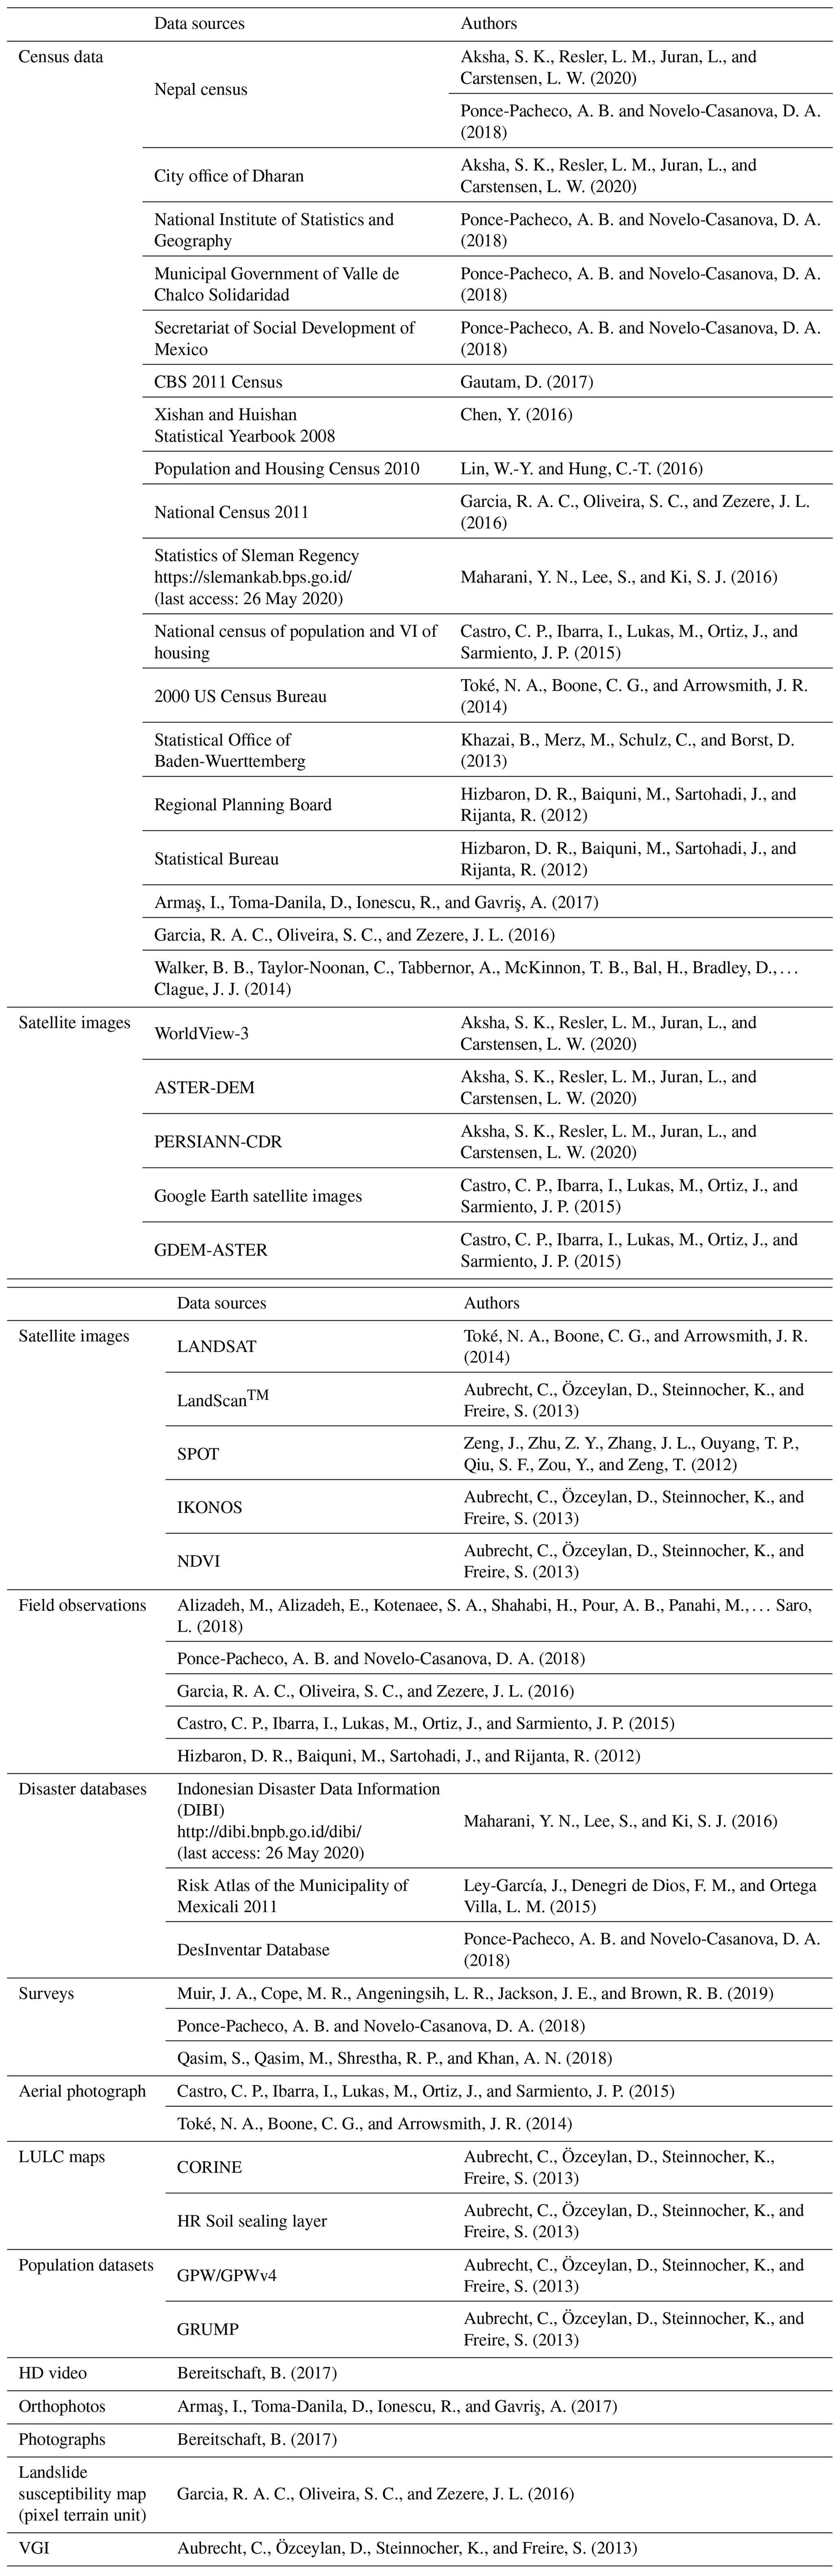
The most recurrent geohazards addressed among the selected papers are earthquakes, followed by landslides, volcanic eruptions, tsunamis and subsidence; detailed information about the number of literature references that tackle each hazard is depicted in Fig. 2. None of the references deal with soil erosion or land degradation. Case study areas selected from this set of papers are frequently located in Indonesia, China, Iran and the USA; detailed information about the number of literature references that have case study areas in these countries is shown Fig. 3. From the set of selected papers, the most common sources of data are population censuses, followed by satellite images, field observations, disaster databases, surveys, aerial photographs, and land use and land cover (LULC) maps. Other authors used high-definition (HD) videos, orthophotos, photographs, landslide susceptibility maps and volunteered geographic information (VGI). The complete set of data sources identified in this systematic review is listed in Table 3.
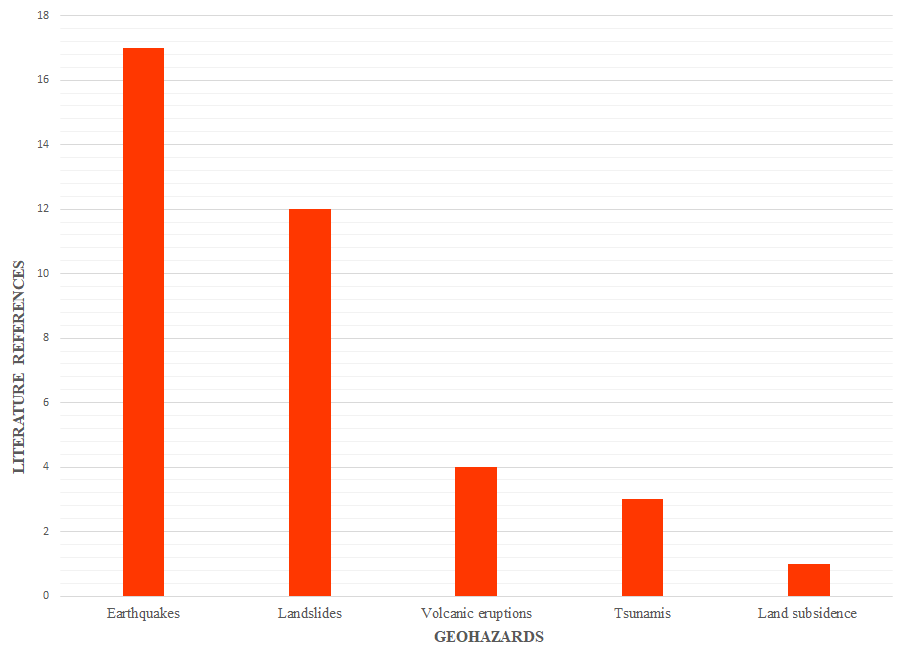
Figure 2Number of literature references in the systematic review that address each geohazard.
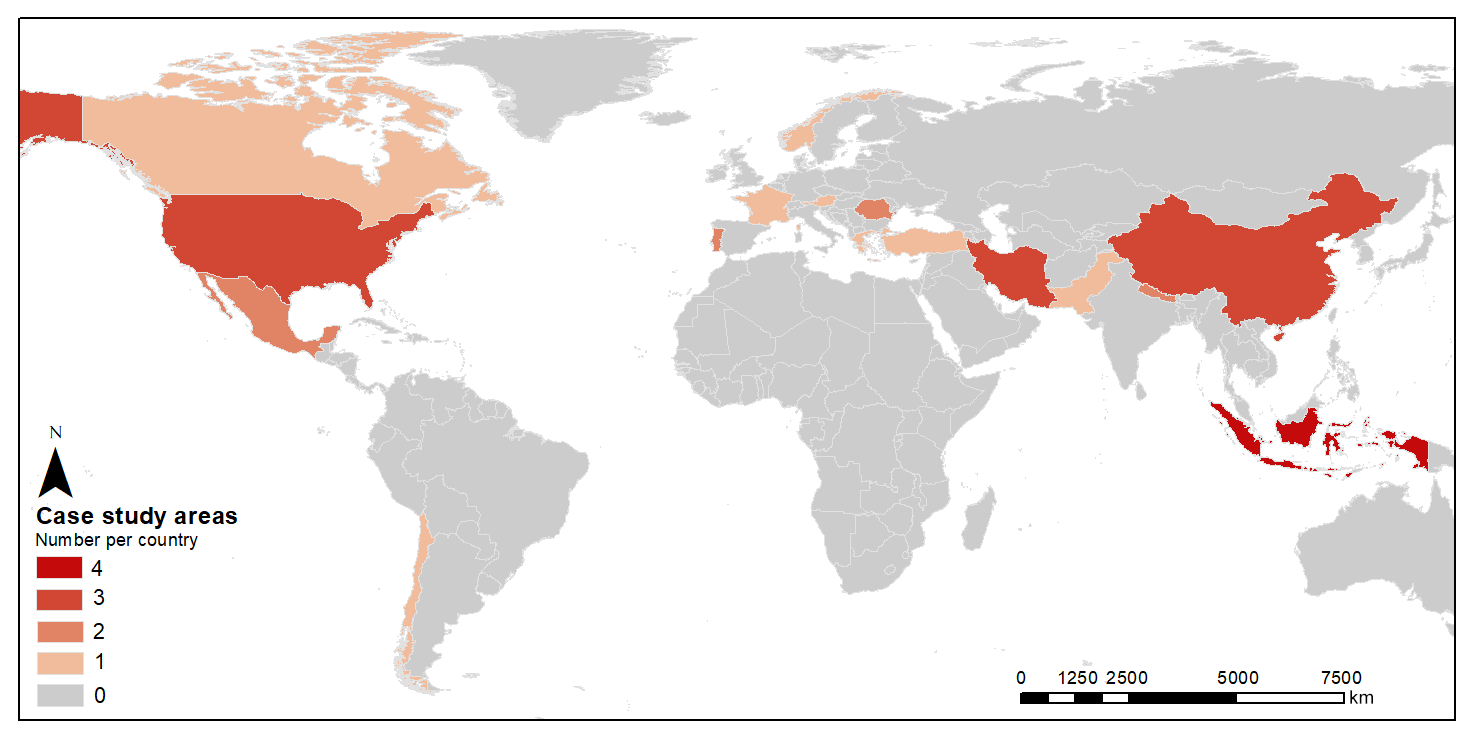
Figure 3Number of study areas per country addressed in the references identified through the systematic literature review.
Table 1Terms included and excluded to identify relevant literature references.

D: database. Q: query. * These terms can be replaced by similar terms with the same effect.
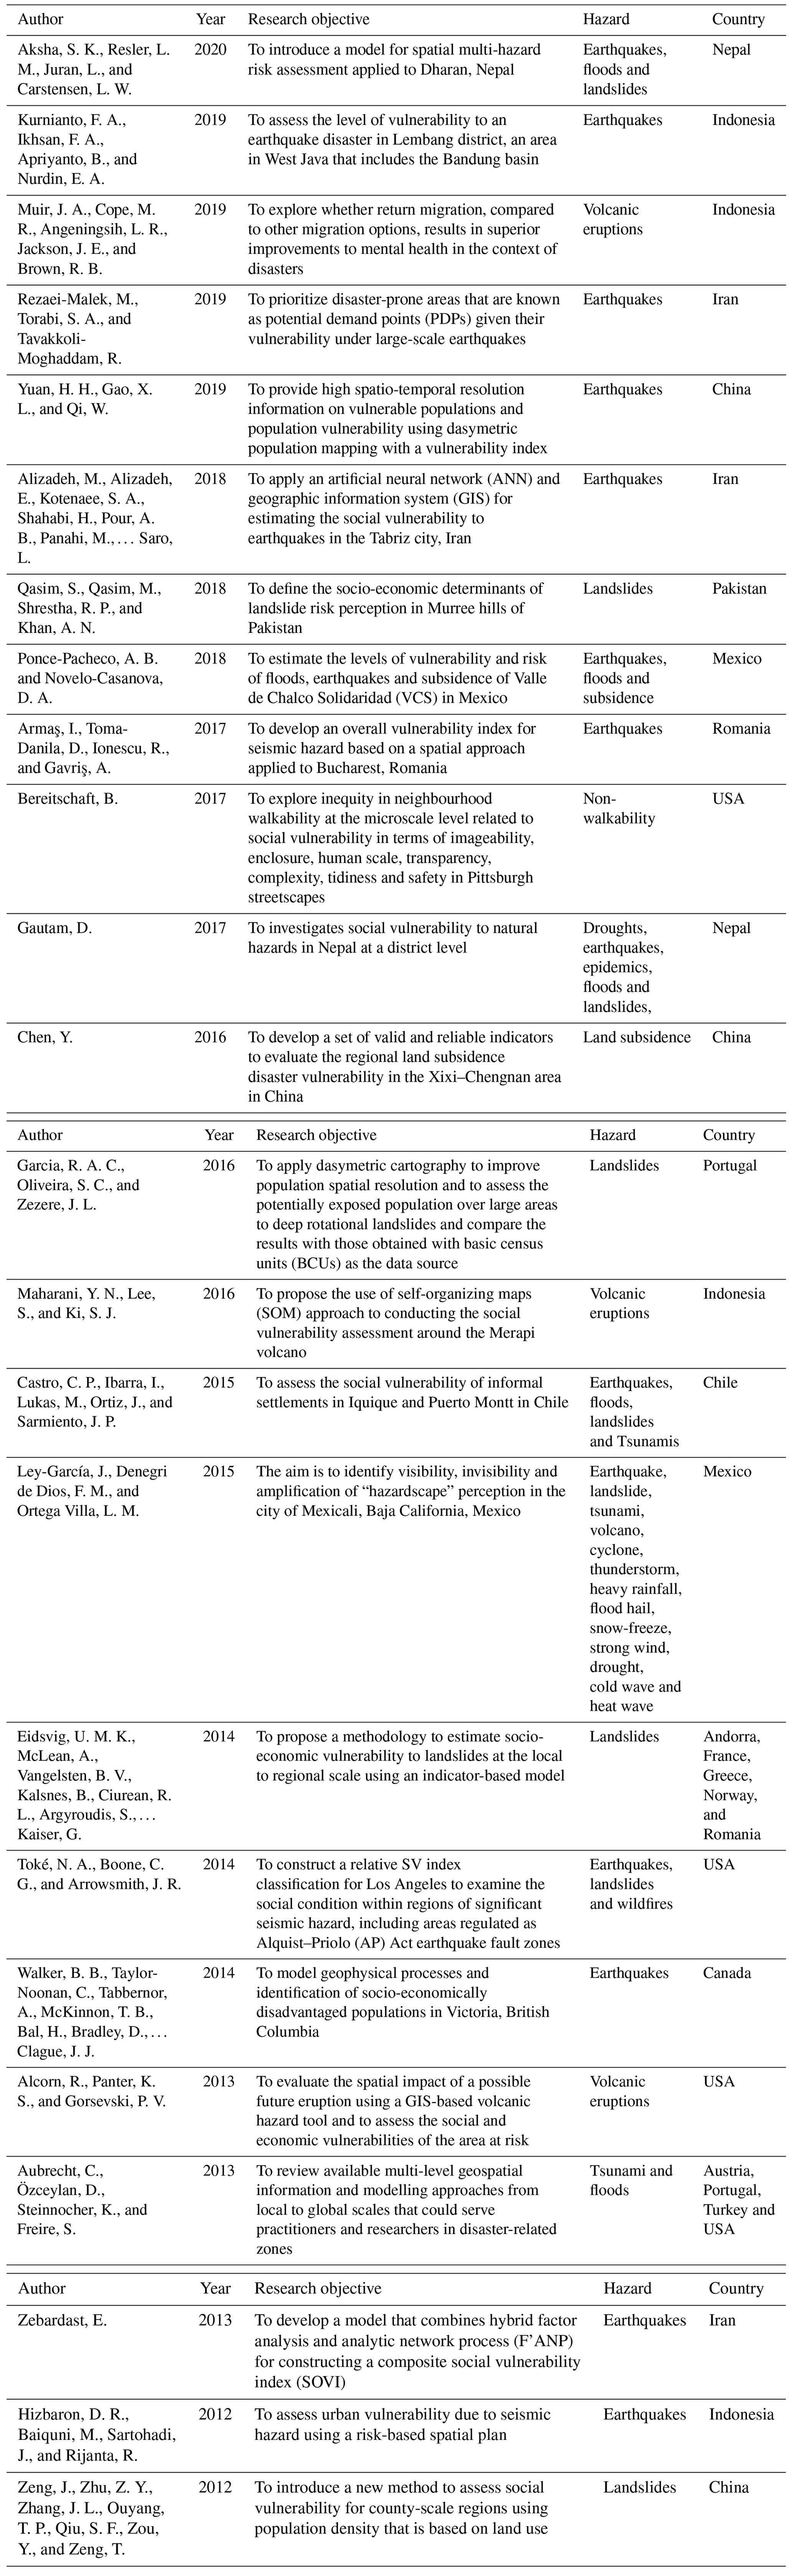
Table 3Data sources for the spatial assessment of socio-economic vulnerability assessments.
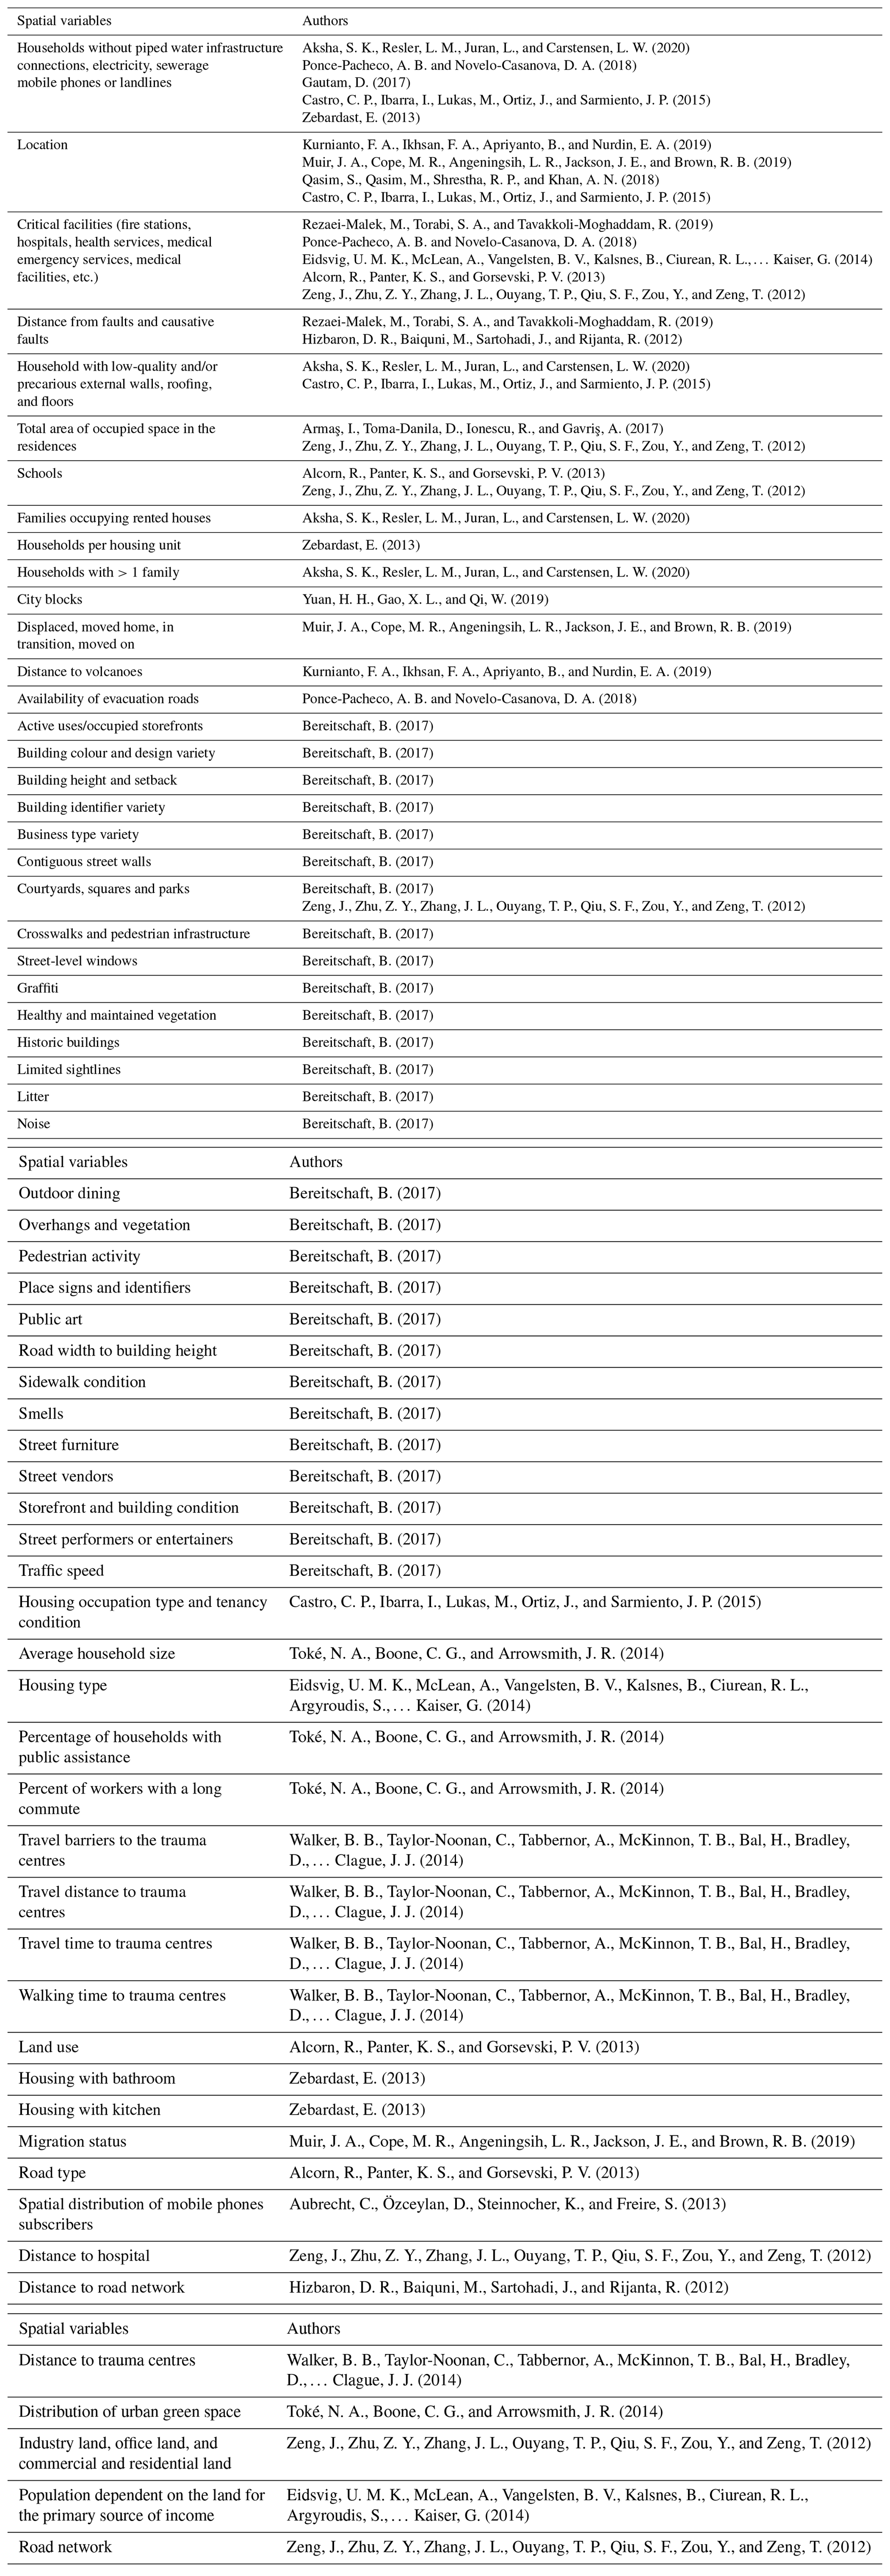
The most common spatial variables used for the spatial assessment of SEV between 2010 and 2020 are households without basic services (piped water connection, electricity, sewerage infrastructure, mobile phones, or landlines), location, critical facilities (fire stations and healthcare facilities), distance from faults and causative faults, precarious housing (low-quality and/or precarious external walls, roofing, and floors), the total area of occupied space in the residences, and the presence of schools. The complete set of spatial variables identified in this systematic review is listed in Table 4.
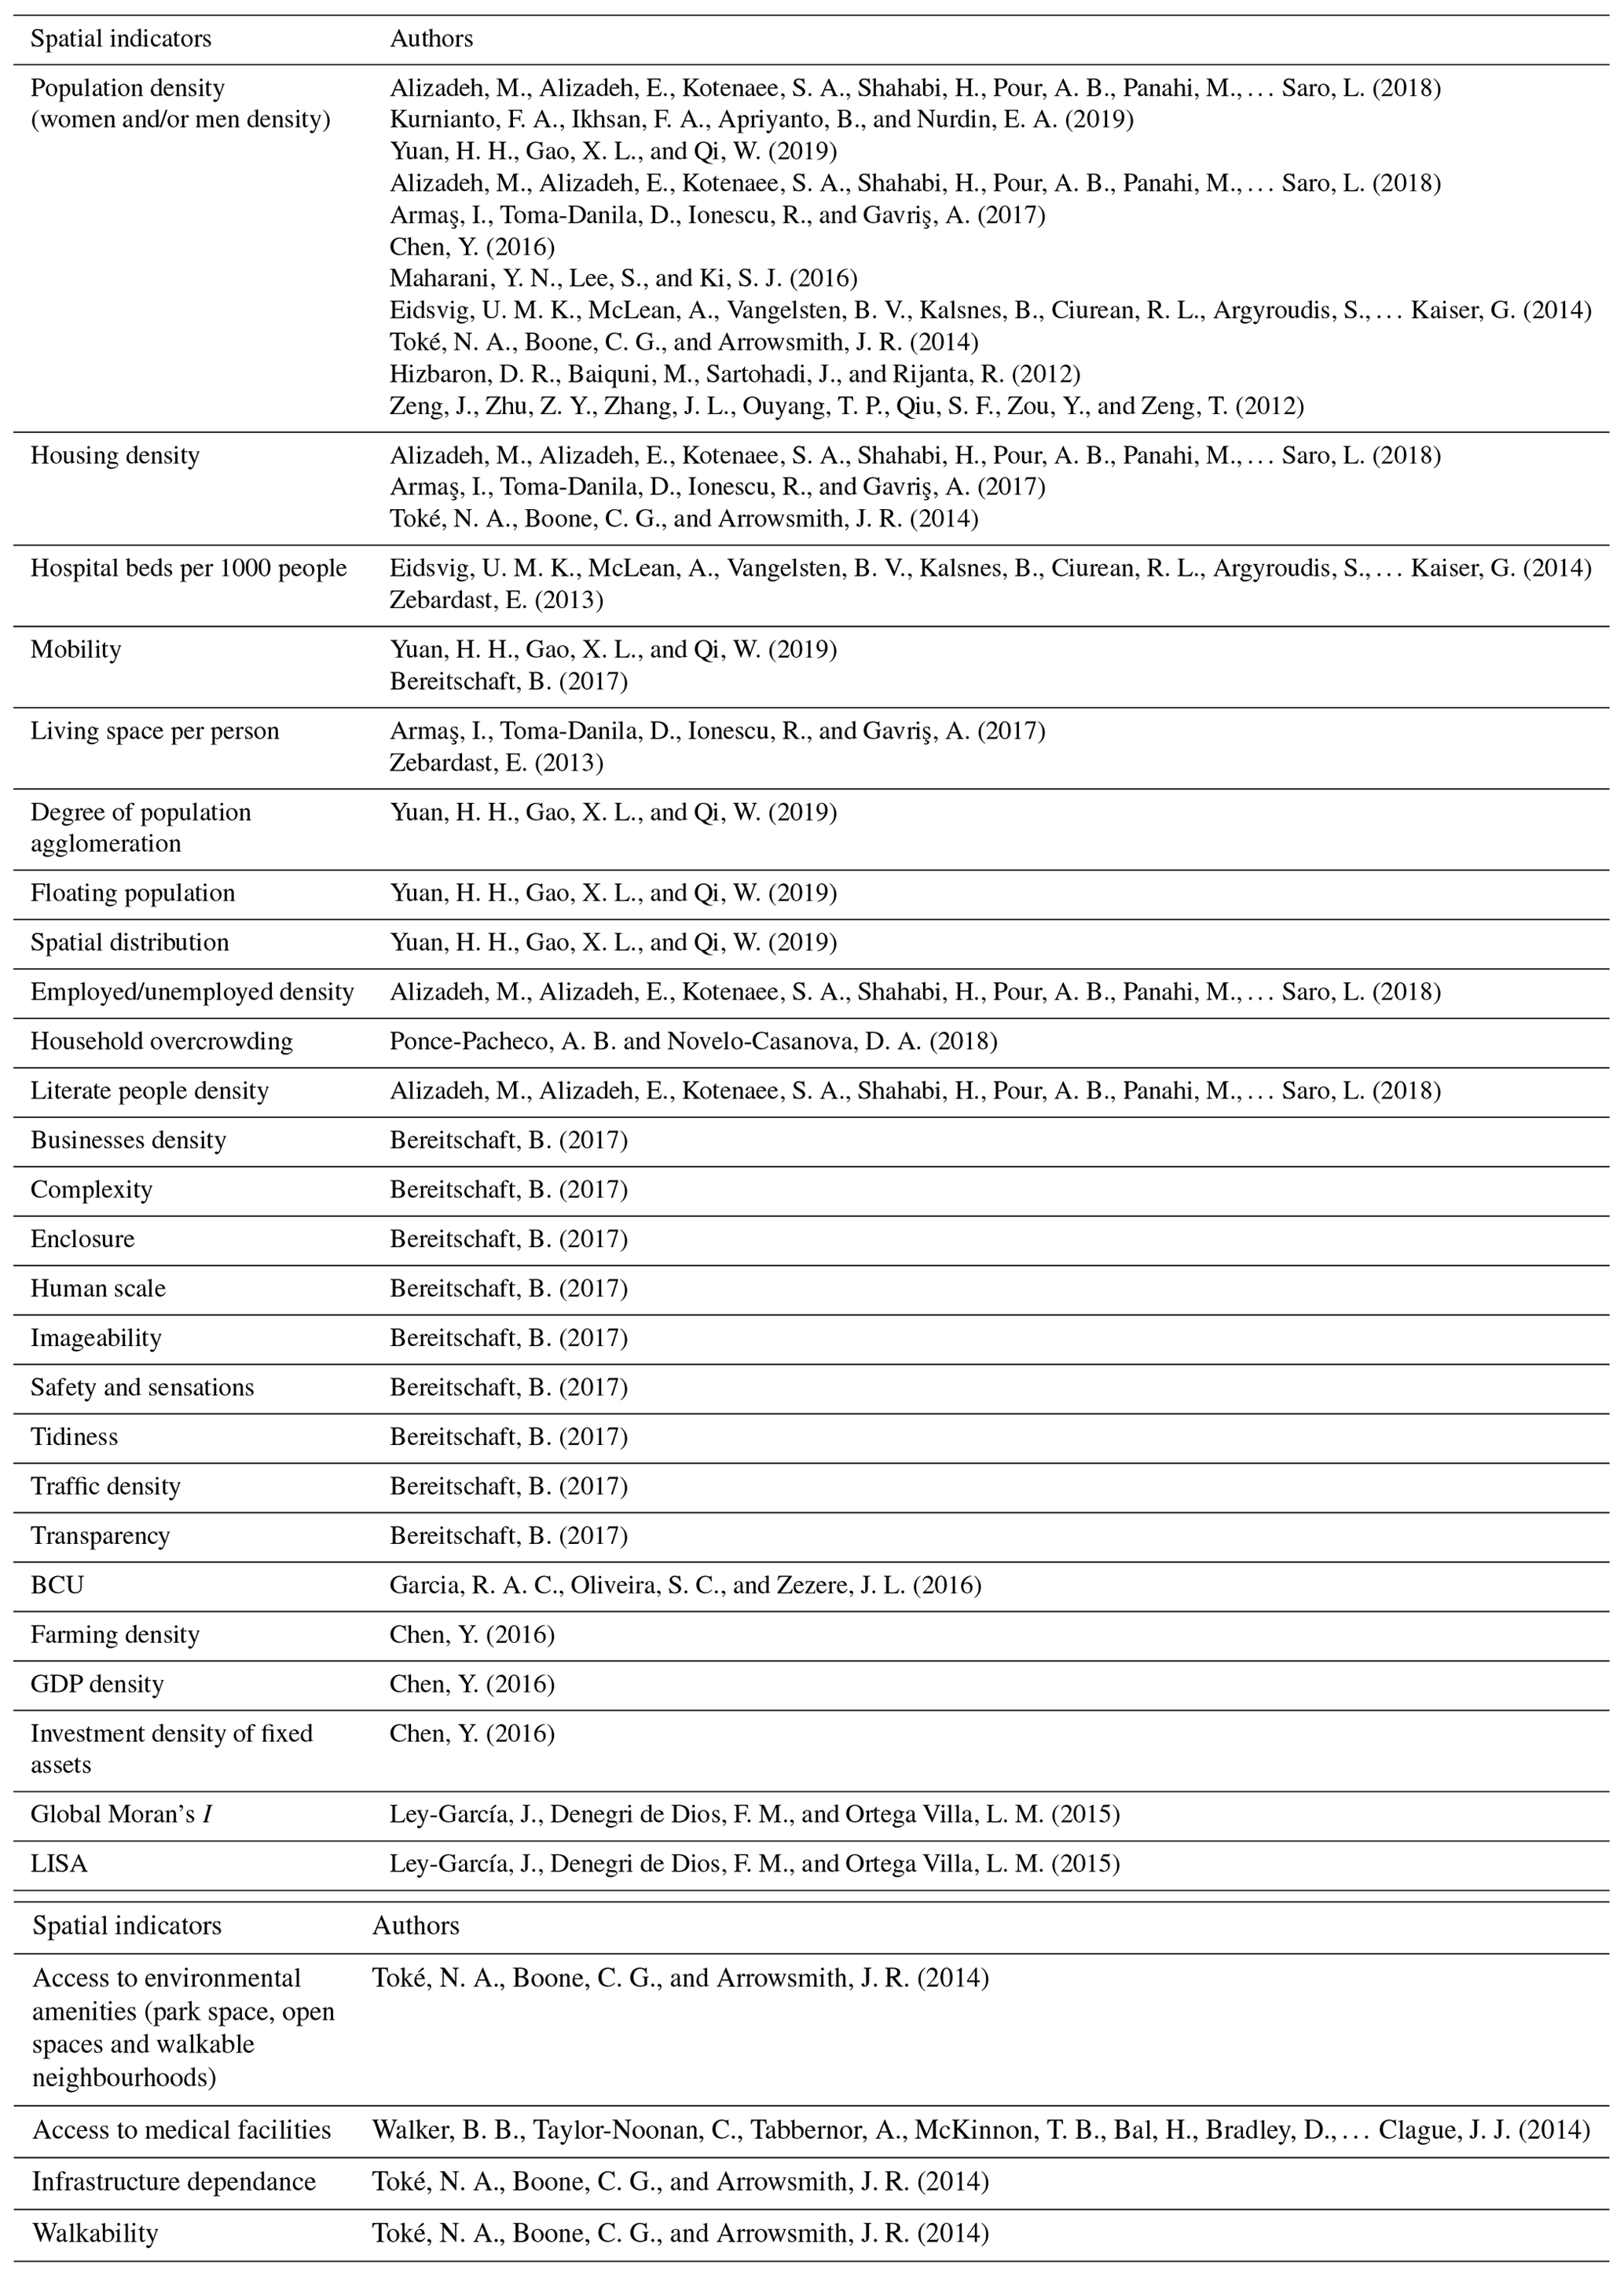
Population density, housing density, hospital beds per 1000 people and living space per person are the most frequent spatial indicators of SEV. Global Moran's I and local indicators of spatial association (LISA), which are traditional indicators in the spatial assessment, were also identified in this systematic research. We also found indicators, such the access to environmental amenities and medical facilities, mobility, employed vs. unemployed density, and density of literate people among others. The complete set of spatial indicators identified in this systematic review is listed in Table 5.
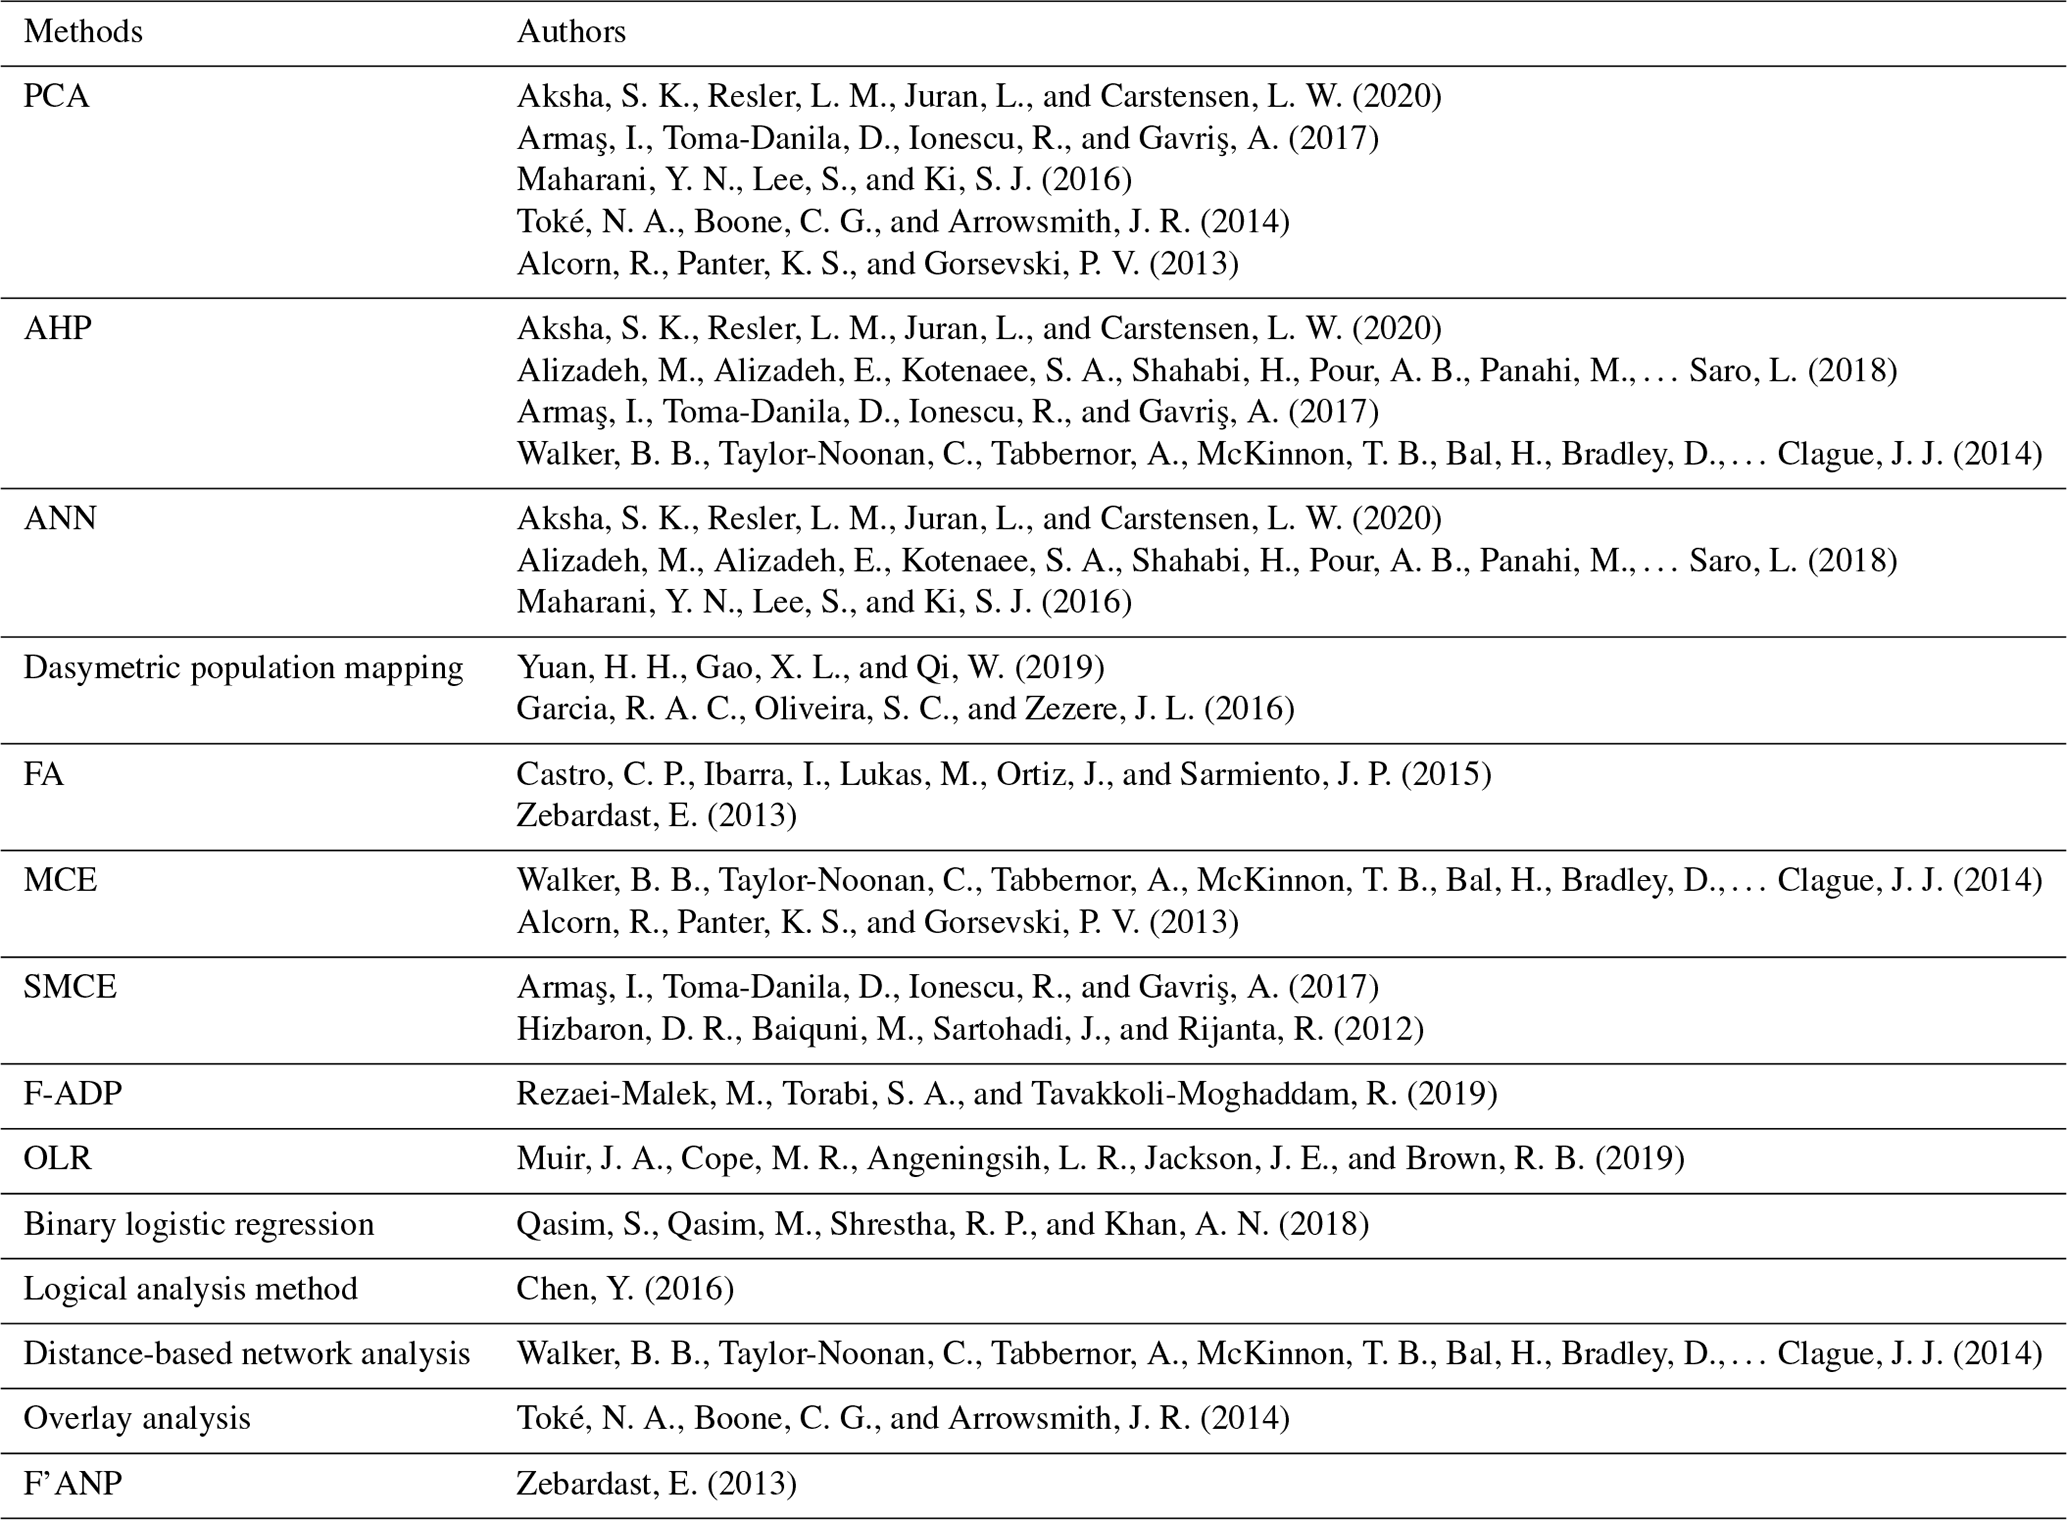
Results extracted from the literature indicate that the most common methods in the last 10 years for the reduction of variables was principal component analysis (PCA) and for indicators weighting this was done via an analytic hierarchy process (AHP). The use of artificial neural networks (ANNs) has been gaining ground in the last 10 years as a method for the spatial assessment of SEV. Other methods include dasymetric population mapping, FA, ordinal logistic regression (OLR), spatial multi-criteria evaluation (SMCE) and analytic network processes (ANP). We also found hybrid methods that combine FA and ANP (known as F'ANP) and others that combine fuzzy numbers with ANP, DEMATEL and PROMETHEE II (F-ADP). Other methods were simpler, such as an overlay analysis. The complete set of methods used by authors and identified in this systematic review is listed in Table 6.
Table 6Methods applied to the spatial assessment of socio-economic vulnerability.
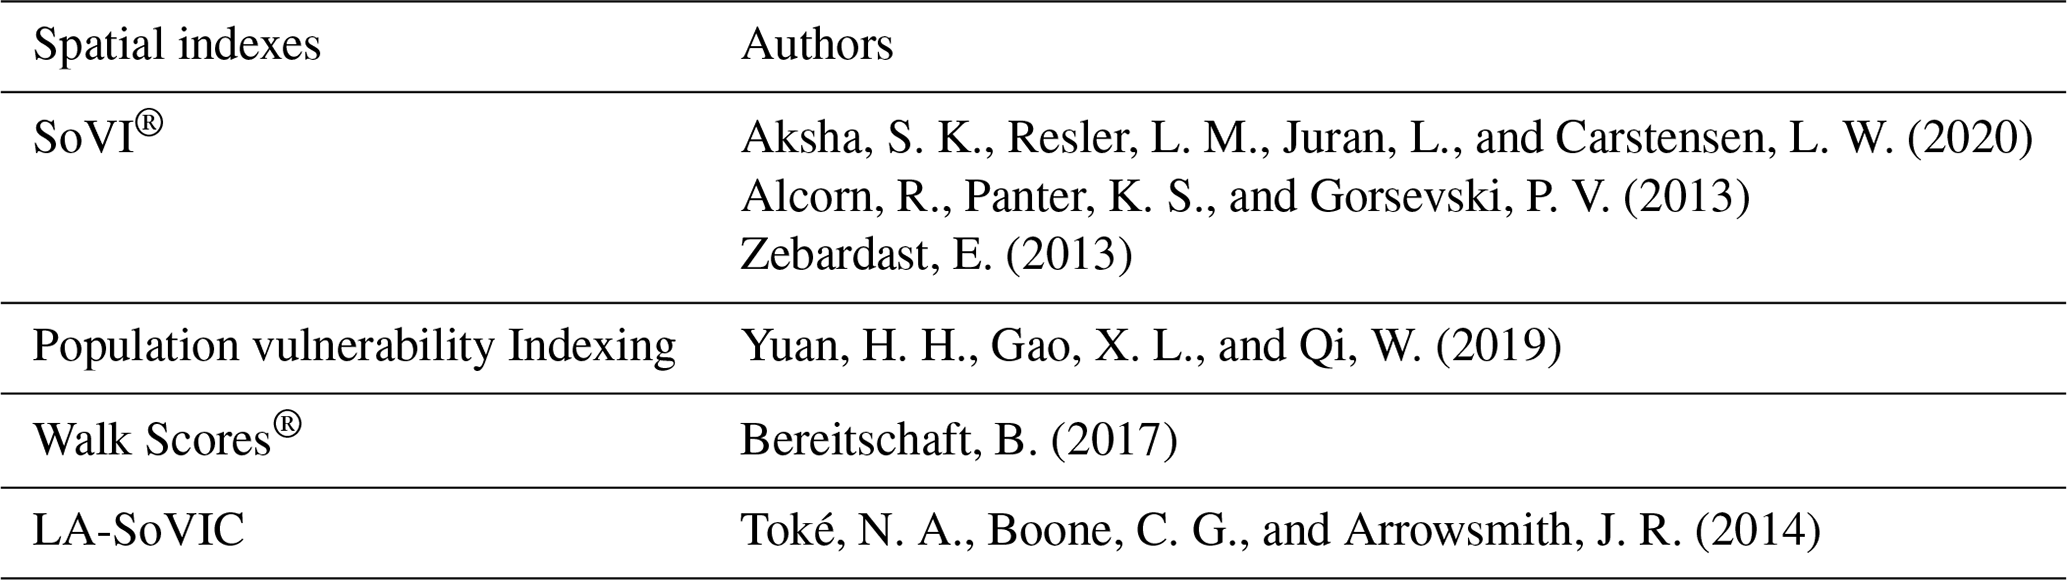
The Social Vulnerability Index (SoVI®) remains the benchmark for the assessment of SEV and a reference for its spatial assessment. Nevertheless, indices such as Walk Scores® (Bereitschaft, 2017a) offer a proxy for the spatial assessment of SEV on a microscale urban level (street level) in three dimensions (3-D). The complete set of spatial indexes used by authors and identified in this systematic review is listed in Table 7.
Table 7Spatial indexes for socio-economic vulnerability assessments.
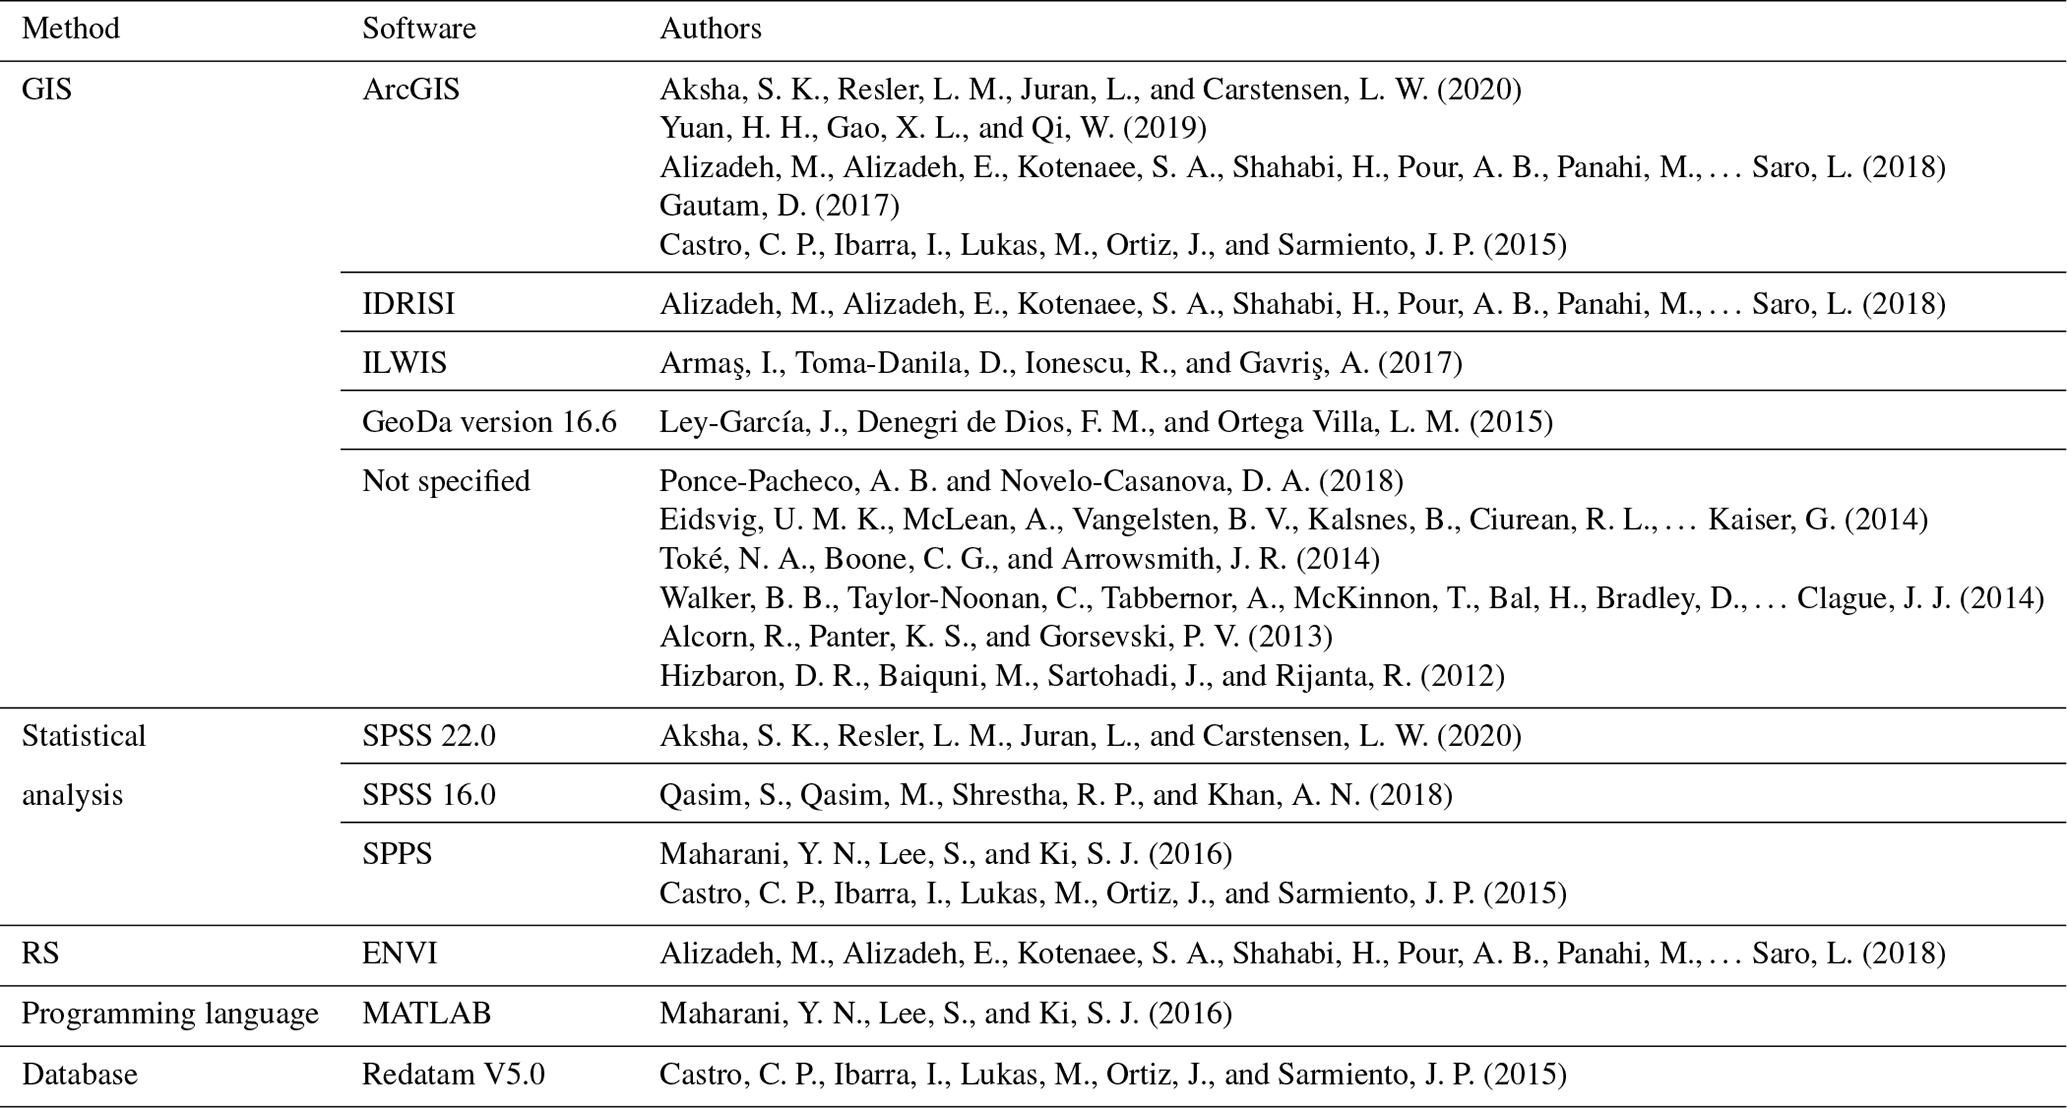
The tools to carry out the spatial assessment of SEV were selected according to the identified spatial variable and indicators; the method used; and the indexes used, adapted, or developed. The most frequent tool for the spatial assessment of SEV is GIS, followed by statistical analyses undertaken in the statistical package for the social sciences (SPSS), remote sensing (RS) using the environment for visualizing images (ENVI), and programming languages and interactive databases, such as the retrieval of data for small areas by microcomputer (REDATAM) (CELADE, 2015). The complete list of tools used by the authors selected is found in Table 8.
For the purpose of the systematic review, we found that the Clarivate Analytics database more accurately identified the references for this systematic review and that it is more user-friendly than other databases. The lack of articles that tackle exogenic geohazards can be explained by the fact that we excluded from the search query words such as “climate change” OR “ecological” OR “drought”, which are indirectly related to these phenomena. Nevertheless, considering that these geohazards usually take place in rural, rather than urban environments, they are not relevant for this research.
The literature references identified are based on a highly detailed search query to avoid bias. The query could be repeated any time and the results will be always the same, perhaps additional publications from 2020 could appear in the results. However, the total number of literature references reviewed was much higher than 24. Previously, based on a more general query not specifically focused on geohazards, we identified 235 literature references, from which we found 84 relevant references, 42 highly relevant references and finally 21 references that we selected to be reviewed at that moment. Eventually, given their relevance, we decided to keep six of these references identified previously using the first query. In the current version, we reviewed all 29 references, but eventually we selected 18 and discarded 11 for the reasons already explained in the results section. The case study areas of the selected papers confirm the findings from Shen et al. (2018) and also ours using the previous query, relating to the USA, China and Iran as major contributors to disaster research, together with Italy, Indonesia, Germany, Turkey, England, India and Spain in the topics of “prediction models”, “social vulnerability” and “landslide inventory maps”. Nevertheless, the references that use Indonesia as a case study area are focused on earthquakes and volcanic eruptions, not necessarily on the tsunami hazard, as was suggested by Shen et al. (2018). The reason to lead the research in those topics would be based on their degree of hazard considering that the USA, China and Indonesia are located along the Pacific Ring of Fire.
The research concentrated on the local level uses primary data collected via field observations, questionnaire surveys or focus groups with representative members of the community to assess vulnerability (Birkmann, 2006; Khazai et al., 2017; Sarkar and Vogt, 2015), while for global or regional scales, primary data are derived from satellite images, aerial photographs, LULC, landslide susceptibility maps, orthophotos, or VGI. Secondary data are obtained from population censuses, disaster databases and population datasets. For applications on the regional, national, international or worldwide scales, coarse-scale raster data on population patterns are appropriate, but for city or local scales, representation of higher spatial resolution is requested, such as fine-scale population grids that go to an individual building level (Aubrecht et al., 2013). Census data usually present national data at the municipal level. Census and land databases are highly demanded by planners and disaster managers. However, there are several problems associated with using large community databases, such as scale, data decay, relevance (King, 2001) and time constraints. Current data can easily change with the building of a new road or new houses (McLaughlin et al., 2002), and in the case of nomadic and/or geographically isolated groups these datasets are rarely available (Béné, 2009) but are necessary. Censuses are usually updated every 10 years on average, depending on the country, and some of the data could be altered by political biases. The surveys require significant resources, and the thematic scope is usually very narrow. These disadvantages can explain the strong demand for population data independent of administrative area, making it sometimes necessary to extract data from raster representations or using dasymetric mapping (Aubrecht et al., 2013; Garcia et al., 2016; Yuan et al., 2019a). Currently, data in 3-D can be also extracted from VGI, which is an alternative source of real-time information based on the concept of citizens as sensors (Cervone and Hultquist, 2018).
Satellite images are useful to collect data from global to local scales. Rapid mapping concepts are mainly applied in structural post-disaster damage assessment, relying on Earth observation data from different sensors, sometimes provided by the International Charter Space and Major Disasters (2020) (Aubrecht et al., 2013). Lidar data are a good option for the city scale. The use of satellite images as data sources in the spatial assessment of SEV has been increasing in the last 10 years, this can be attributed to the fact that they offer quick, updated and reliable data, making the satellite images currently the most effective source. One of the issues with using maps, air photos or orthophotos as a resource is that they are not frequently updated.
The spatial variables found through this systematic review are similar to the variables identified by Meentemeyer (1989), Béné, (2009) Contreras et al. (2013), and Buzai and Villerías Alarcón (2018). Based on the concept of spatial indicators of SV formulated by Ebert et al. (2009), we consider the lack of basic services as a spatial variable of SEV because all of these networks are distributed in a specific spatial area. The lack of life-supporting infrastructure and/or infrastructure necessary for the functioning of the society such as piped water, electricity networks, sewerage infrastructure, telecommunications and road networks hampers emergency management and therefore the recovery process (Eidsvig et al., 2014). Housing quality and tenancy conditions describe the vulnerability of the population to becoming homeless after a disaster (Toké et al., 2014). Housing type is an economic indicator of the economic status of individuals, communities and nations. Thus, a house with low-quality or precarious external walls located in a landslide-prone zone is usually associated with socially vulnerable communities having a negative influence on the quality of life. However, the typology of vulnerable houses depends also on the sort of landslide (Eidsvig et al., 2014). There are similar spatial variables used to produce an indicator of housing overcrowding (Ponce-Pacheco and Novelo-Casanova, 2018), such as households per housing unit (Zebardast, 2013) and households with >1 family (Aksha et al., 2020). We argue that besides spatial variables, we must also consider spatial categories in which critical and the other urban facilities must be included. These facilities are not only providers of services but are also sources of employment (Contreras et al., 2017); therefore, the presence or absence of urban facilities; access to them; and distance, travel time (Toké et al., 2014), and/or barriers (Walker et al., 2014) to reaching them highly influence the degree of spatial SEV of a community. Bereitschaft (2017a) proposes innovative spatial variables of SEV at a microscale urban level in 3-D, such as historic buildings, parks, place signs and identifiers, contiguous street walls, limited sightlines, street furniture, street vendors, street-level windows, actively used and occupied storefronts, pedestrian activity, business type variety, crosswalks and pedestrian infrastructure, sidewalk conditions, and storefront and building conditions. We also identify other spatial variables that are different to more traditional ones, such as distance from faults (Hizbaron et al., 2012; Rezaei-Malek et al., 2019) and volcanoes (Kurnianto et al., 2019), land use (Alcorn et al., 2013), city blocks (Yuan et al., 2019a), and displacement (Muir et al., 2019), among others.
Based on the evidence found by this research, we agree with Zeng et al. (2012) that the most frequent spatial indicator in the assessment of SEV related to geohazards is population density and that it has the highest sensitivity coefficient (Yuan et al., 2019a). According to Kurnianto et al. (2019), high population density is the factor that contributes most to the high SV and is usually linked to high population growth, which increases the SEV given the rise in the exposure of populations and businesses. The reason, according to Gu et al. (2018), is that population density reveals the human resources of a neighbourhood and the relief resources that could be required during a disaster. This is a key factor in large case study areas where different kinds of occupation can take place (urban, rural); therefore, important differences in population density are expected to be found. Disadvantaged population tends to live in denser neighbourhoods with more crowded parks and other recreational facilities (Sister et al., 2009; Toké et al., 2014; Wolch et al., 2005) and low levels of walkability (Bereitschaft, 2017a) that exacerbate the vulnerability making an evacuation difficult (Cutter et al., 2003) after an earthquake, tsunami, volcanic eruption or landslide. It is also more difficult in such areas to find spaces to install temporary shelters near their households or areas for providing care after an emergency (Cutter et al., 2003). The density of the built environment is especially important in the case of seismic events (Toké et al., 2014). Innovative spatial indicators such as employed density, unemployed density and the density of literate people were proposed by Alizadeh et al. (2018). The importance of such fine-scale data and temporal variations (daytime and night-time) for accurately estimating SV was highlighted by Yuan et al. (2019a), proposing the indicator: “floating population”. The consideration of the spatial and temporal dimension in the estimation of population exposure is a fundamental aspect of accurate catastrophe loss modelling, a key element for the integration of risk analysis and emergency management (Aubrecht et al., 2010) and therefore for the reduction of the SEV (Alizadeh et al., 2018). Chen (2016) proposes more spatial indicators in the economic rather than the social dimension. Ley-García et al. (2015), global Moran's I and LISA enable the identification of dependence between attributes and localizations. As a result, these indicators are useful to determine whether the spatial distribution of elements influences the behaviour of a particular variable. The summary measure of autocorrelation in the territory is undertaken with global Moran's I, while the autocorrelation of the spatial units included in the territory is measured using LISA. Cutter and Finch (2008) also previously utilized global Moran's I and LISA to identify local variability and cluster similarity of low and SV. Besides the SoVI® and FA, Zhou et al. (2014) utilize exploratory spatial data analysis (ESDA) to identify the spatio-temporal patterns of SV based on the constructed SoVI® for each county in China. These authors used global and local Moran's I or LISA as ESDA to determine the spatial autocorrelation among counties and identify the similarity and/or dissimilarity in the clustering of SV.
Accessibility as a spatial indicator is defined as the ability to contact and interact with places of economic or social opportunity (Deichmann, 1997). Goodall (1987) notes that accessibility is the ease of reaching a location from another location, and this concept is also related to opportunities for attention (Aubrecht et al., 2013). In the case of, for example, hospitals and/or trauma centres, accessibility is reduced by distance (Hizbaron et al., 2012; Zeng et al., 2012), increasing the SEV level of the communities located far from these healthcare facilities. Besides the common spatial variables, indicators and indexes in 2-D, there are also spatial indicators and indexes that include a 3-D component, such as imageability, enclosure, human scale, transparency, complexity, safety sensations and tidiness (Bereitschaft, 2017a), satisfaction with the neighbourhood (Barata et al., 2011), and residential condition (de la Torre and de Riccitelli, 2017) that could be applied to the spatial assessment of SEV. Authors such as Yuan et al. (2019a) and Muir et al. (2019) consider the spatial indicators of mobility and migration, respectively, in the framework of geohazards, migration being a topic mainly addressed by authors in the climate change community, e.g. Nakayama et al. (2019), Naugle et al. (2019), van der Geest et al. (2020), Ayeb-Karlsson et al. (2020) and others.
This systematic review identified the versatility of ANN, which can be either used to extract monthly rainfall data (Aksha et al., 2020), for deriving social vulnerability maps (SVMs) (Alizadeh et al., 2018) or to train the self-organized map (SOM) algorithm cluster method (Maharani et al., 2016). The use of dasymetric population mapping not limited to administrative boundaries, even going down to block level to increase the spatial resolution of the population exposure analysis (Garcia et al., 2016) and additionally by including the temporal dimension with its day–night variability, enables the improvement of the accuracy of the spatial assessments of SEV (Yuan et al., 2019a). Factor analysis is used by Castro et al. (2015) to establish the level of SEV and by Zebardast (2013) to extract primary dimensions and variables of SEV. Alcorn et al. (2013) applied MCE to assess economic vulnerability using four significant factors: population, infrastructure, land use and economic production. SMCE is applied by Armaş et al. (2017) to integrate social, education, housing and social dependence vulnerability dimensions and by Hizbaron et al. (2012) to develop deterministic SV scenarios. Zebardast (2013) enters the variables of SEV into a network model in an analytic network process (ANP) to rank the importance of each variable to complete the F'ANP method. This method is focused on developing a composite social vulnerability index (SOVI). Binary logistic regression was the statistical method applied by Qasim et al. (2018) to identify the determinants of landslide risk perception, location being one of them. Walker et al. (2014) present a multi-criteria evaluation (MCE) model that incorporates access to healthcare facilities using GIS to identify and rank residential areas in Victoria, British Columbia. The integration of the concept of uncertainty into ANP using fuzzy numbers (F-ANP) is combined by Rezaei-Malek et al. (2019) with fuzzy DEMATEL (F-DEMATEL) to deal with the interdependency among a set of criteria and fuzzy PROMETHEE II (F-PROMETHEE II) to control the criteria weights, the complete method is denominated fuzzy ANP DEMATEL PROMETHEE II (F-ADP). Ordinal logistic regression (OLR) is used by Muir et al. (2019) to predict the mental health conditions of people displaced by a series of volcanic eruptions in Merapi, Indonesia, according to their migration status (displaced, moved home, in transition and moved on), which implies a spatial component. Geological experience and a logical analysis method were used by Chen (2016) to select indicators. Toké et al. (2014) undertook an overlay analysis to identify the census block groups that intersect zones with an extreme ground shaking hazard.
Aksha et al. (2020) utilized the SoVI® to map the vulnerability levels in the study site with a multi-hazard map to produce a total risk map. Alcorn et al. (2013) used an improved version of the same index but specifically adapted it to the variability in SEV in the case study area that was focused on census-designated places (CDPs) on a small scale. The population vulnerability indexing developed by Yuan et al. (2019a) considered most of the indicators available in the literature already identified by the SoVI®, but they adapted their index to Chinese society, where, according to the authors, race and ethnicity are not relevant indicators and rural-to-urban migrants are floating population with unequal access to public services and therefore are a vulnerable population. Bereitschaft (2017a) explores the exiting inequities in the walkability of urban environments among neighbourhoods with low and high SEV using the Walk Scores®. This index could be used as a proxy spatial index of SEV in 3-D at a microscale urban level. The author found that neighbourhoods with high SV had fewer windows and less transparent storefronts, less continuous street walls, less well-maintained infrastructure, fewer businesses, and generally less complexity than in neighbourhoods with low SV. Toké et al. (2014) built upon the SoVI® to create their own SV indexes that incorporate the spatial dimension. According to the LA-SoVIC developed by Toké et al. (2014), SV is highly linked to the normalized difference vegetation index (NDVI) as a proxy for urban green space. Green areas are usually located in areas with lower SEV (Stow et al., 2007) and have also been recognized for their health benefits (Bedimo-Rung et al., 2005). Physical characteristics of green areas, such as attractive scenery, motivate people to stay and visit an area (Kurnianto et al., 2019), resulting in increased social control and reduced SEV.
It has been always difficult to quantify SV; hence, it is absent from post-disaster cost and loss estimation reports (Schmidtlein et al., 2008; Zhou et al., 2014). The use of spatial variables, indicators and indexes will bridge the gap of integrating physical vulnerability and SV to achieve a holistic risk assessment. Davidson (1997) provided the first attempt to create an integrated risk assessment framework. Later, Carreño et al. (2007) developed a risk index obtained by multiplying the physical risk index by an impact factor, which is, in fact, an aggravating coefficient consisting of socio-economic variables; nevertheless, in applying this method, the outcome will be similar to the assessment of physical vulnerability, without showing the contribution of SV to the assessment of integrated risk. Schmidtlein et al. (2011) tested the link between SV and earthquake losses. The authors found that physical parameters related to hazard, such as distance from the epicentre and peak ground acceleration, were more significant in predicting impacts than SV. Nevertheless, the same authors established that SV is a significant predictor of earthquake losses when accounting for wealth (dollar losses per average income as the dependent variable). The previous finding reveals that those areas with higher levels of SV experience a greater relative impact than areas with lower degrees of SV.
Geospatial information systems are broadly utilized by several authors to collect and process data and map the SEV. GIS has been enabling researchers to have either large study regions or equivalent datasets at much finer spatial resolution (Unwin, 1996), for example, a comprehensive overview of the use of accessibility indicators in GIS was already provided by Deichmann (1997). Each author uses different versions of ArcGIS, which is the most widespread software used in GIS. The IDRISI software is utilized by Alizadeh et al. (2018) to generate a social vulnerability map (SVM). Armaş et al. (2017) applied a pairwise comparative method in the AHP implemented in the SMCE module of the Integrated Land and Water Information System (IlWIS) software. GeoDa, an open-source software, focused on methods for spatial data has been used by authors who address the topic of spatial association (Gu et al., 2018; Ley-García et al., 2015). The aforementioned programme is an RS and GIS software, on which the robustness of the results from Armaş et al. (2017) was also tested, with a sensitivity analysis performed in the DEFINITE toolbox implemented in IlWIS. The MATLAB computation environment was used by Maharani et al. (2016) to develop the SOM toolbox. Sherly et al. (2015) also used MATLAB to perform multivariate data analyses, such as PCA and Data Envelopment Analysis (DEA). REDATAM used as a source of data by Castro et al. (2015), is an interactive hierarchical database that contains microdata and/or aggregate socio-economic information from any geographical division at a national level. This database combines data from the census, surveys and other sources, resulting in a very comprehensive and useful source of spatial and non-spatial variables for the SEV.
Based on the evidence, we can state that most of the spatial assessments of SEV in urban environments have been done for earthquakes and landslides and that Indonesia, China, Iran and the USA lead the research in the spatial assessment of SEV related to geohazards in urban environments. The scale of the spatial level of assessment – namely global, continental, subcontinental, national, regional, provincial, municipal or local – determines the type of data to be collected and the assessment approaches. Although there have been advances, census data continue to be the most frequent source of data for the SEV assessments; however, in the case of spatial assessment, satellite images are now the main data source, facilitating the inclusion of the spatial component in SEV assessments. The spatial assessment of SEV allows for visualizing and communicating social phenomena and components that influence the degree of vulnerability that are not visible with other methods. The lack of data availability hinders the understanding of the concept of vulnerability (Zhou et al., 2014) and that is why VGI is essential today to obtain updated information in real-time at the local scale when other data sources are not available.
Traditional spatial variables and indicators continue to be used by authors, but when combined with new variables, categories and indicators, including the temporal dimension (day–night), and assessing at the local level, they can increase the accuracy of spatial assessments of SEV and reduce uncertainty on their assessment. Each method for the spatial assessment of SV is selected according to the research aim, case study area, scale to cover, reliability of data sources, spatial variables and indicators available, geohazard to address, the scope of the research, and the level of funding. Methods such as ANN are gaining ground in the assessment of SEV. Other methods, such as dasymetric population mapping, enable more accurate SEV assessment. Factor analysis continues to be a useful tool to define the level of SEV based on primary dimensions and variables. The multi-criteria evaluation method offers a robust decision-making technique based on flexible choice and combination in criteria (Alcorn et al., 2013). SMCE incorporates the spatial component to the MCE to integrate spatial and non-spatial data to generate maps with multiple scenarios (Hizbaron et al., 2012). Classic methods such as FA are combined with more innovative ones such as ANP and fuzzy numbers to generate hybrid methods such as F'ANP. These new methods encourage the development of more complex hybrid methods such as F-ADP that increase the accuracy and reduce the uncertainty levels in the spatial SEV assessments. Ordinal logistic regression and binary logistic regression are useful methods to identify spatial variables as determinants of SEV. The spatial component can be also be added by simply overlapping the areas with high SEV with hazard zones using GIS. Most authors have built upon the SoVI® developed by Cutter et al. (2003) to quantify SEV or to create their own SEV indexes, demonstrating that it remains the benchmark for the assessment of SEV and a reference for its spatial assessment; however, there are new alternatives for the spatial assessment of SEV in 3-D at a microscale level, such as Walk Scores® (Bereitschaft, 2017a).
Geographic information systems, statistical analysis, RS, programming languages and interactive databases are the tools currently used by the scientists for the assessment of SEV vulnerability. The spatial assessment of SEV in the areas where it is requested must depend not only on the financial resources available to research but also on the availability of open-source software with the functionalities required of spatial statistics, such as QGIS, GeoDa or IlWIS. Authors combine traditional and new data sources, spatial variables and indicators, methods, indexes and tools including the temporal dimension, increasing the resolution to the local level with the aim to increase the accuracy and reduce the uncertainty of spatial assessments of SEV related to geohazards in urban environments.
The development of a global spatial index of SEV is an urgent task, with the aim of making informed decisions about priority of funding prevention and mitigation actions related to geohazards in urban environments. In the meantime, the priority for these types of assessments must be allocated to developing countries with high population density and the presence of geohazards such as Bangladesh, Haiti, Philippines, Puerto Rico, El Salvador and Pakistan. More spatial assessments of SEV due to volcanic eruptions and tsunamis in urban environments and due to soil erosion and land degradation in the rural zones are needed. Furthermore, the priority must be to allocate funding for countries with high SEV to enable them to update their census information, as this is the most frequent source of secondary data for any SEV assessment. It is also important to encourage the population to share information through social media (SM) about the vulnerable conditions in which they live, putting in practice the concept of citizen as a sensor (Cervone and Hultquist, 2018).
An assessment of SEV is a condition for the effective development of emergency management capabilities and to reduce the overall time for social recovery after an earthquake (Aubrecht et al., 2013; Garcia et al., 2016). Likewise, spatial assessments of SEV must be considered before taking resettlement decisions for not again creating spatial conditions that favour the SEV. Authors such as Turvey (2007), Walker et al. (2014), Zhou et al. (2014) and Gautam (2017) highlight the need for place-specific, sub-provincial-level, neighbourhood-scale, or local-level vulnerability indexes, due to geographic variations in population composition and social structures (Bell et al., 2007). The macro-scale socio-economic assessment identifies general patterns but fails to capture the detail of the heterogeneity at the microscale. Thus, assessment at the provincial, county or state level can result in lost information (Zhou et al., 2014) or requires tackling issues such as ecological fallacy or MAUP (McLaughlin et al., 2002; Openshaw, 1983; Pacione, 2005). In the spatial assessment of SEV, it is necessary to go beyond the administrative boundaries or cartographic variables, with methods such as the dasymetric population mapping (Garcia et al., 2016; Yuan et al., 2019a), square mesh (Renard, 2017), pockets (Lin and Hung, 2016) or geon (Kienberger et al., 2009). We found interesting spatial indicators of SEV, such as population density based on land use (Zeng et al., 2012), which we consider more accurate than population density estimated at an area unit. This indicator can better integrate the spatial dimension of the exposure and susceptibility of the population using RS in the assessment of the SEV of a case study area. To improve the accuracy and reduce the uncertainty in spatial assessments of SEV must always be the aim. The presence of urban facilities must be included in the assessment of SV. Walker et al. (2014) suggest developing a weighted “local resource” index for assessing systemic vulnerability since, for example, the absence of sports facilities is associated by Iguacel et al. (2018), Vandermeerschen et al. (2015), and Aguilar-Palacio et al. (2013) with high levels of SV. In the spatial assessment of SEV, it is also necessary to consider the influence of the spatial component represented by physical space in the degree of vulnerability of a specific area, such as the relationship between slums and a low degree of wellness and health (Buzai and Villerías Alarcón, 2018).
It is necessary to take advantage of the versatility of methods such as ANN based on machine learning to make progress in the spatial assessment of SEV and SMCE in order to map multiple scenarios to inform urban communities and to integrate them in the decision-making processes. Communities respond differently to vulnerability maps depending on the purpose behind the maps or the cultural background of the community. On the one hand, some communities reject being mapped as “victims”, but, on the other hand, some request being identified as highly vulnerable to gain access to funding opportunities for activities of risk management (Fekete, 2012). The Walk Score® index developed by Bereitschaft (2017a), although it was originally oriented to measure only neighbourhood walkability (Bereitschaft, 2017b), can be used a proxy index of spatial SEV in 3-D at a microscale urban level. The advantage over the SoVI® is that while the SoVI® can be spatialized, Walk Score® is a 3-D high-resolution spatial index per se. The use of the local scale for the assessment of SV will be more useful for the planning of resilient actions (Lee, 2014; Maharani et al., 2016) than it would be at a regional scale, which is more orientated to the collection of pathologies in the social dimension. It is necessary to more closely examine so-called “proxy indicators” to measure spatial SEV at local scales or intra-city levels (Gu et al., 2018). The right management of the spatial component by a community can reduce its economic vulnerability. Groß (2017) presented the case of ski lift entrepreneurs in Vorarlberg (Austria), who reduced the probability of business interruption by accelerating the uphill and downhill flows of people through manipulating snow and topography. Regarding tools, it is necessary to take full advantage of the functionalities of open-source software such as QGIS and ILWIS to make the spatial assessment of SEV to the reach of all the scientific communities around the world.
All relevant data are within the paper. The corresponding data to this literature review will be publicly available on the NHESS website, CIGIDEN website, the Philip Robinson Library at Newcastle University, the Learning from Earthquakes project website, Researchgate and Academia repositories from the authors.
DC contributed to the literature review, methodology, original draft preparation, major and minor revisions, and proofreading. AC contributed to the conceptualization, methodology, revisions, and proofreading. SW contributed to revisions and proofreading.
The authors declare that they have no conflict of interest.
The authors thank Carolina Martinez for the literature references suggested. We also appreciate the feedback received from Magdalena Vicuña, Cristina Vizconti, Luis Maldonado, Marta Contreras, Srirama Bhamidipati and Javier Hervás Ciudad during the writing process. We also would like to thank Sven Fuchs, the anonymous reviewer, and the editor Heidi Kreibich for their contributions to the improvement of this paper; Anne Bliss for her support with the English proofreading; and Janina Schulz for her support during the proofreading process.
This research has been supported by the Research Center for Integrated Disaster Risk Management (CIGIDEN) (grant no. ANID/FONDAP/15110017), the FONDECYT Project (grant no. 1181754/FONDECYT/ANID), and the Engineering and Physical Sciences Research Council (EPSRC) (grant no. EP/P025951/1).
This paper was edited by Heidi Kreibich and reviewed by Sven Fuchs and one anonymous referee.
Adger, W. N., Brooks, N., Bentham, G., Agnew, M., and Eriksen, S.: New indicators of vulnerability and adaptive capacity, Tyndall Centre for Climate Research Technical Report 7, Tyndall Centre for Climate Research, Tyndall, 2004.
Aguilar-Palacio, I., Gil-Lacruz, M., and Gil-Lacruz, A. I.: Salud, deporte y vulnerabilidad socioeconómica en una comunidad urbana, Atención Primaria, 45, 107–114, 2013.
Aksha, S. K., Resler, L. M., Juran, L., and Carstensen, L. W.: A geospatial analysis of multi-hazard risk in Dharan, Nepal, Geomat. Nat. Hazards Risk, 11, 88–111, 2020.
Alcántara-Ayala, I. and Oliver-Smith, A.: ICL Latin-American Network: on the road to landslide reduction capacity building, Landslides, 11, 315–318, 2014.
Alcorn, R., Panter, K. S., and Gorsevski, P. V.: A GIS-based volcanic hazard and risk assessment of eruptions sourced within Valles Caldera, New Mexico, J. Volcanol. Geot. Res., 267, 1–14, 2013.
Alizadeh, M., Alizadeh, E., Kotenaee, S. A., Shahabi, H., Pour, A. B., Panahi, M., Bin Ahmad, B., and Saro, L.: Social Vulnerability Assessment Using Artificial Neural Network (ANN) Model for Earthquake Hazard in Tabriz City, Iran, Sustainability, 10, 23, 2018.
Amram, O., Schuurman, N., and Hameed, S.: Mass casualty modelling: a spatial tool to support triage decision making, Int. J. Health Geogr., 10, 40, https://doi.org/10.1186/1476-072X-10-40, 2011.
Armaş, I., Toma-Danila, D., Ionescu, R., and Gavriş, A.: Vulnerability to Earthquake Hazard: Bucharest Case Study, Romania, Int. J. Disast. Risk Sci., 8, 182–195, 2017.
Aubrecht, C., Köstl, M., and Steinnocher, K.: Population exposure and impact assessment: benefits of modeling urban land use in very high spatial and thematic detail, in: Computational vision and medical image processing: recent trends, in: Computational methods in applied sciences, edited by: Tavares, J. M. R. S. and Natal Jorge, R. M., Springer, Berlin, 75–89, 2010.
Aubrecht, C., Özceylan, D., Steinnocher, K., and Freire, S.: Multi-level geospatial modeling of human exposure patterns and vulnerability indicators, Nat. Hazards, 68, 147–163, 2013.
Ayeb-Karlsson, S., Kniveton, D., and Cannon, T.: Trapped in the prison of the mind: Notions of climate-induced (im)mobility decision-making and wellbeing from an urban informal settlement in Bangladesh, Palgrave Commun., 6, 62, 2020.
Barata, R. B., Sampaio de Almeida Ribeiro, M. C., and Cassanti, A. C.: Social vulnerability and health status: a household survey in the central area of a Brazilian metropolis, Cadernos De Saude Publica, 27, S164–S175, 2011.
Beccari, B.: A Comparative Analysis of Disaster Risk, Vulnerability and Resilience Composite Indicators, PLOS Curr. Disast., 8, https://doi.org./10.1371/currents.dis.453df025e34b682e9737f95, 2016.
Bedimo-Rung, A. L., Mowen, A. J., and Cohen, D. A.: The significance of parks to physical activity and public health: A conceptual model, Am. J. Prevent. Med., 28, 159–168, 2005.
Bell, N., Schuurman, N., Oliver, L., and Hayes, M.: Towards the construction of place-specific measures of deprivation: a case study from the Vancouver metropolitan area, Can. Geogr., 51, 444–461, 2007.
Béné, C.: Are Fishers Poor or Vulnerable? Assessing Economic Vulnerability in Small-Scale Fishing Communities, J. Dev. Stud., 45, 911–933, 2009.
Bereitschaft, B.: Equity in Microscale Urban Design and Walkability: A Photographic Survey of Six Pittsburgh Streetscapes, Sustainability, 9, 1233, https://doi.org/10.3390/su9071233, 2017a.
Bereitschaft, B.: Equity in neighbourhood walkability? A comparative analysis of three large U.S. cities, Local Environ., 22, 859–879, 2017b.
Birkmann, J.: Indicators and criteria for measuring vulnerability: theoretical bases and requirements, in: Measuring Vulnerability to Natural Hazards. Towards Disaster Resilient Societies, edited by: Birkmann, J., United Nations University Press, Tokyo, 2006.
Birkmann, J., Cardona, O. D., Carreño, M. L., Barbat, A. H., Pelling, M., Schneiderbauer, S., Kienberger, S., Keiler, M., Alexander, D., Zeil, P., and Welle, T.: Framing vulnerability, risk and societal responses: the MOVE framework, Nat. Hazards, 67, 193–211, 2013.
Buzai, G., and Villerías Alarcón, I.: Análisis espacial cuantitativo de los determinantes sociales de la salud (DSS) en la cuenca del río Luján (provincia de Buenos Aires, Argentina), Estudios Socioterritoriales, 23, 155–169, 2018.
Cardona, O. D.: Indicators of Disaster Risk and Risk Management: Program for Latin America and the Caribbean: Summary Report, Inter-American Development Bank, Washington, D.C., USA, 2005.
Carreño, L., Cardona, O. D., and Barbat, A. H.: Urban Seismic Risk Evaluation: A Holistic Approach, Nat. Hazards, 40, 137–172, 2007.
Castro, C. P., Ibarra, I., Lukas, M., Ortiz, J., and Sarmiento, J. P.: Disaster risk construction in the progressive consolidation of informal settlements: Iquique and Puerto Montt (Chile) case studies, Int. J. Disast. Risk Reduct., 13, 109–127, 2015.
CELADE: REtrieval of DATa for small Areas by Microcomputer (Redatam), CEPAL, available at: https://www.cepal.org/cgi-bin/getProd.asp?xml=/redatam/noticias/paginas/9/7369/P7369.xml&xsl=/redatam/tpl-i/p18f.xsl&base=/redatam/tpl/top-bottom.xslt (last access: 27 May 2020), 2015.
Cerchiello, V., Ceresa, P., Monteiro, R., and Komendantova, N.: Assessment of social vulnerability to seismic hazard in Nablus, Palestine, Int. J. Disast. Risk Reduct., 28, 491–506, 2018.
Cervone, G. and Hultquist, C.: Citizen as indispensable sensors during disasters, in: Population-environment research network cybeseminar, people and pixels revisited: 20 years of progress and new tools for population-environment research, 20–27th February 2018, Webinar, 2018.
Chambers, R.: Vulnerability, coping and policy, IDS Bull., 20, 1–7, 1989.
Chen, Y.: Conceptual Framework for the Development of an Indicator System for the Assessment of Regional Land Subsidence Disaster Vulnerability, Sustainability, 8, 757, 2016.
Clark, G. E., Moser, S. C., Ratick, S. J., Dow, K., Meyer, W. B., Emani, S., Jin, W., Kasperson, J. X., Kasperson, R. E., and Schwarz, H. E.: Assessing the Vulnerability of Coastal Communities to Extreme Storms: The Case of Revere, MA, USA, Mitig. Adapt. Strat. Global Change, 3, 59–82, 1998.
Contreras, D. and Kienberger, S. (Eds.): Handbook of Vulnerability Assessment in Europe, European Commission DG Environment, Salzburg, Austria, 2011.
Contreras, D. and Kienberger, S.: GIS in the vulnerability assessment and recovery process in a community with elderly and disable people after a disaster, in: Rebuilding Sustainable Communities with vulnerable populations after the cameras have gone: a worlwide study, edited by: Awotona, A., Cambridge Scholar Publishing, Cambridge, UK, 2012.
Contreras, D., Thomas, B., Stefan, K., and Peter, Z.: Spatial Vulnerability Indicators: “Measuring” Recovery Processes after Earthquakes, in: The 8th International conference on Information systems for crisis response and management, Lisbon, Portugal, 2011.
Contreras, D., Blaschke, T., Kienberger, S., and Zeil, P.: Spatial connectivity as a recovery process indicator: The L'Aquila earthquake, Technol. Forecast. Social Change, 80, 1782–1803, 2013.
Contreras, D., Blaschke, T., and Hodgson, M. E.: Lack of spatial resilience in a recovery process: Case L'Aquila, Italy, Technol. Forecast. Social Change, 121, 76–88, 2017.
Cutter, S. L. and Finch, C.: Temporal and spatial changes in social vulnerability to natural hazards, P. Natl. Acad. Sci. USA, 105, 2301–2306, 2008.
Cutter, S. L., Boruff, B. J., and Shirley, W. L.: Social vulnerability to environmental hazards, Social Sci. Quart., 84, 242–261, 2003.
Davidson, R.: A multidisciplinary urban earthquake disaster risk index, Earthq. Spectra, 13, 211–223, 1997.
de la Torre, L. and de Riccitelli, M.: `NiNis': Youth in Argentina who Neither Work nor Study. A Social Integration Deficit, Revista Espanola De Investigaciones Sociologicas, 158, 97–115, https://doi.org/10.5477/cis/reis.158.97, 2017.
Deichmann, U.: Accessibility Indicators in GIS, United Nations Statistics Division, Department for Economic and Policy Analysis, New York, NY, USA, 1997.
Ebert, A., Kerle, N., and Stein, A.: Urban social vulnerability assessment with physical proxies and spatial metrics derived from air- and spaceborne imagery and GIS data, Nat. Hazards, 48, 275–294, 2009.
Eidsvig, U. M. K., McLean, A., Vangelsten, B. V., Kalsnes, B., Ciurean, R. L., Argyroudis, S., Winter, M. G., Mavrouli, O. C., Fotopoulou, S., Pitilakis, K., Baills, A., Malet, J. P., and Kaiser, G.: Assessment of socioeconomic vulnerability to landslides using an indicator-based approach: methodology and case studies, Bull. Eng. Geol. Environ., 73, 307–324, 2014.
Esty, D., Levy, M., Srebotnjak, T., and De Sherbin, A.: Environmental Sustainability Index, Yale Center for Environmental Law and Policy New Haven, CT, USA, 2005.
Fatemi, F., Ardalan, A., Aguirre, B., Mansouri, N., and Mohammadfam, I.: Social vulnerability indicators in disasters: Findings from a systematic review, Int. J. Disast. Risk Reduct., 22, 219–227, 2017.
Fekete, A.: Validation of a social vulnerability index in context to river-floods in Germany, Nat. Hazards Earth Syst. Sci., 9, 393–403, https://doi.org/10.5194/nhess-9-393-2009, 2009.
Fekete, A.: Spatial disaster vulnerability and risk assessments: challenges in their quality and acceptance, Nat. Hazards, 61, 1161–1178, 2012.
Garcia, R. A. C., Oliveira, S. C., and Zêzere, J. L.: Assessing population exposure for landslide risk analysis using dasymetric cartography, Nat. Hazards Earth Syst. Sci., 16, 2769–2782, https://doi.org/10.5194/nhess-16-2769-2016, 2016.
Gautam, D.: Assessment of social vulnerability to natural hazards in Nepal, Nat. Hazards Earth Syst. Sci., 17, 2313–2320, https://doi.org/10.5194/nhess-17-2313-2017, 2017.
Goncalves, M. and Vizintim, M. F. B.: Geographical features of the state of Parana in the face of natural disasters, Confins, 33, 25, 2017.
Goodall, B.: The Penguin dictionary of human geography, Penguin Books, Harmondsworth, Middlesex, England, New York, NY, USA, 1987.
Grace, K. L. L. and Edwin, H. W. C.: Indicators for evaluating environmental performance of the Hong Kong urban renewal projects, Facilities, 27, 515–530, 2009.
Grant, M. J. and Booth, A.: A typology of reviews: an analysis of 14 review types and associated methodologies, Health Inform. Librar. J., 26, 91–108, https://doi.org/10.1111/j.1471-1842.2009.00848.x, 2009.
Groß, R.: Uphill and Downhill Histories. How Winter Tourism Transformed Alpine Regions in Vorarlberg, Austria – 1930 to 1970, Zeitschrift für Tourismuswissenschaft, 1, 2017.
Gu, H., Du, S., Liao, B., Wen, J., Wang, C., Chen, R., and Chen, B.: A hierarchical pattern of urban social vulnerability in Shanghai, China and its implications for risk management, Sustain. Cities Soc., 41, 170–179, 2018.
Hizbaron, D. R., Baiquni, M., Sartohadi, J., and Rijanta, R.: Urban Vulnerability in Bantul District, Indonesia-Towards Safer and Sustainable Development, Sustainability, 4, 2022–2037, 2012.
Iguacel, I., Fernández-Alvira, J. M., Bammann, K., Chadjigeorgiou, C., De Henauw, S., Heidinger-Felső, R., Lissner, L., Michels, N., Page, A., Reisch, L. A., Russo, P., Sprengeler, O., Veidebaum, T., Börnhorst, C., and Moreno, L. A.: Social vulnerability as a predictor of physical activity and screen time in European children, Int. J. Publ. Health, 63, 283–295, 2018.
Jaque Castillo, E., Contreras, A., Ríos, R., and Quezada Flory, J.: Assessment of Tsunami vulnerability in Central Chile. Factor for the local management of risk, Revista Geografica Venezolana, 54, 47–65, 2013.
Khazai, B., Merz, M., Schulz, C., and Borst, D.: An integrated indicator framework for spatial assessment of industrial and social vulnerability to indirect disaster losses, Nat. Hazards, 67, 145–167, 2013.
Khazai, B., Daniell, J. E., Düzgün, Ş., Kunz-Plapp, T., and Wenzel, F.: Framework for systemic socio-economic vulnerability and loss assessment, in: Geotechnical, Geological and Earthquake Engineering, Springer, 2014.
Khazai, B., Anhorn, J., Burton, C. G., Valcarcel, J., and Contreras, D.: Resilience Performance Scorecard (RPS) – Summary, Global Earthquake Model (GEM) Foundation, Pavia, Italy, 2017.
Kienberger, S., Lang, S., and Zeil, P.: Spatial vulnerability units – expert-based spatial modelling of socio-economic vulnerability in the Salzach catchment, Austria, Nat. Hazards Earth Syst. Sci., 9, 767–778, https://doi.org/10.5194/nhess-9-767-2009, 2009.
King, D.: Uses and limitations of socioeconomic indicators of community vulnerability to natural hazards: Data and disasters in northern Australia, Nat. Hazards, 24, 147–156, 2001.
Kuhlicke, C., Scolobig, A., Tapsell, S., Steinführer, A., and De Marchi, B.: Contextualizing social vulnerability: findings from case studies across Europe, Nat. Hazards, 58, 789–810, 2011.
Kurnianto, F. A., Ikhsan, F. A., Apriyanto, B., and Nurdin, E. A.: Earthquake vulnerability disaster in the Lembang district of West Bandung Regency, Indonesia, Earthq. Sci., 32, 40–46, 2019.
Lee, Y.-J.: Social vulnerability indicators as a sustainable planning tool, Environ. Impact Assess. Rev., 44, 31–42, 2014.
Ley-García, J., Denegri de Dios, F. M., and Ortega Villa, L. M.: Spatial dimension of urban hazardscape perception: The case of Mexicali, Mexico, Int. J. Disast. Risk Reduct., 14, 487–495, 2015.
Lin, W.-Y. and Hung, C.-T.: Applying spatial clustering analysis to a township-level social vulnerability assessment in Taiwan, Geomat. Nat. Hazards Risk, 7, 1659–1676, 2016.
Maharani, Y. N., Lee, S., and Ki, S. J.: Social vulnerability at a local level around the Merapi volcano, Int. J. Disast. Risk Reduct., 20, 63–77, 2016.
McLaughlin, S., McKenna, J., and Cooper, J. A. G.: Socio-economic data in coastal vulnerability indices: constraints and opportunities, J. Coast. Res., 36, 487–497, 2002.
Meentemeyer, V.: Geographical perspectives of space, time, and scale, Landscape Ecol. 3, 163–173, 1989.
Muir, J. A., Cope, M. R., Angeningsih, L. R., Jackson, J. E., and Brown, R. B.: Migration and Mental Health in the Aftermath of Disaster: Evidence from Mt. Merapi, Indonesia, Int. J. Environ. Res. Publ. Health, 16, 19, 2019.
Myers, C. A., Slack, T., and Singelmann, J.: Social Vulnerability and Migration in the Wake of Disaster: The Case of Hurricanes Katrina and Rita, Populat. Environ., 29, 271–291, 2008.
Nakayama, M., Drinkall, S., and Sasaki, D.: Climate Change, Migration, and Vulnerability: Overview of the Special Issue, J. Disast. Res., 14, 1246–1253, 2019.
Naugle, A. B., Backus, G. A., Tidwell, V. C., Kistin-Keller, E., and Villa, D. L.: A Regional Model of Climate Change and Human Migration, Int. J. Syst. Dynam. Appl., 8, 1–22, 2019.
Noy, I.: The macroeconomic consequences of disasters, J. Dev. Econ., 88, 221–231, 2009.
Noy, I.: Comparing the direct human impact of natural disasters for two cases in 2011: The Christchurch earthquake and the Bangkok flood, Int. J. Disast. Risk Reduct., 13, 61–65, 2015.
OECD: Handbook on Constructing Composite Indicators: Methodology and User Guide, OECD Publishing, Paris, France, 2008.
Oliver-Smith, A.: Theorizing Vulnerability in a Globalized World: A political Ecological Perspective, in: Mapping Vulnerability: Disasters, Development and People, edited by: Bankoff, G., Frerks, G., and Hilhorst, T., Earthscan, London, 10–24, 2003.
Openshaw, S.: The Modifiable Areal Unit Problem, Geo Books, Norwich, 1983.
Pacione, M.: Urban geography: a global perspective, Routledge, London, 2005.
Papathoma-Kohle, M., Cristofari, G., Wenk, M., and Fuchs, S.: The importance of indicator weights for vulnerability indices and implications for decision making in disaster management, Int. J. Disast. Risk Reduct., 36, 101103, https://doi.org/10.1016/j.ijdrr.2019.101103, 2019.
Ponce-Pacheco, A. B. and Novelo-Casanova, D. A.: Vulnerability and risk in Valle de Chalco solidaridad, Estado de Mexico, Mexico. Case study: El Triunfo, Avandaro and San Isidro, Investigaciones Geograficas, Instituto de Geografía (UNAM), Mexico D.F., Mexico, https://doi.org/10.14350/rig.59675, 2018.
Postiglione, I., Masi, A., Mucciarelli, M., Lizza, C., Camassi, R., Bernabei, V., Piacentini, V., Chiauzzi, L., Brugagnoni, B., Cardoni, A., Calcara, A., Di Ludovico, M., Giannelli, M., Rita, R., La Pietra, M., Bernardini, F., Nostro, C., Pignone, M., and Peruzza, L.: The Italian communication campaign “I Do Not Take Risks – Earthquake”, Boll. Geofis. Teor. Appl., 57, 147–160, 2016.
Qasim, S., Qasim, M., Shrestha, R. P., and Khan, A. N.: Socio-economic determinants of landslide risk perception in Murree hills of Pakistan, AIMS Environ. Sci., 5, 305–314, 2018.
Rashed, T. and Weeks, J.: Assessing vulnerability to earthquake hazards through spatial multicriteria analysis of urban areas, Int. J. Geogr. Inform. Sci., 17, 547–576, 2003.
Renard, F.: Flood risk management centred on clusters of territorial vulnerability, Geomatics Nat. Hazards Risk, 8, 525–543, 2017.
Rezaei-Malek, M., Torabi, S. A., and Tavakkoli-Moghaddam, R.: Prioritizing disaster-prone areas for large-scale earthquakes' preparedness: Methodology and application, Socio-Econ. Plan. Sci., 67, 9–25, 2019.
Rygel, L., O'sullivan, D., and Yarnal, B.: A Method for Constructing a Social Vulnerability Index: An Application to Hurricane Storm Surges in a Developed Country, Mitig. Adapt. Strat. Global Change, 11, 741–764, 2006.
Sarkar, R. and Vogt, J.: Drinking water vulnerability in rural coastal areas of Bangladesh during and after natural extreme events, Int. J. Disast. Risk Reduct., 14, 411–423, 2015.
Schmidtlein, M. C., Deutsch, R. C., Piegorsch, W. W., and Cutter, S. L.: A Sensitivity Analysis of the Social Vulnerability Index, Risk Anal., 28, 1099–1114, 2008.
Schmidtlein, M. C., Shafer, J. M., Berry, M., and Cutter, S. L.: Modeled earthquake losses and social vulnerability in Charleston, South Carolina, Appl. Geogr., 31, 269–281, 2011.
Shen, S., Cheng, C. X., Yang, J., and Yang, S. L.: Visualized analysis of developing trends and hot topics in natural disaster research, PLoS One, 13, 1–15, 2018.
Sherly, M. A., Karmakar, S., Parthasarathy, D., Chan, T., and Rau, C.: Disaster Vulnerability Mapping for a Densely Populated Coastal Urban Area: An Application to Mumbai, India, Ann. Assoc. Am. Geogr., 105, 1198–1220, 2015.
Shuang-Ye, W., Brent, Y., and Ann, F.: Vulnerability of coastal communities to sea-level rise: a case study of Cape May County, New Jersey, USA, Clim. Res., 22, 255–270, 2002.
Simpson, D. and Katirai, M.: Indicator Issues and Proposed Framework for a Disaster Preparedness Index (DPI), University of Louisville, Louisville, KY, USA, 2006.
Sister, C., Wolch, J., and Wilson, J.: Got green? addressing environmental justice in park provision, GeoJournal, 75, 229–248, 2009.
Stow, D., Lopez, A., Lippitt, C., Hinton, S., and Weeks, J.: Object-based classification of residential land use within Accra, Ghana based on QuickBird satellite data, Int. J. Remote Sens., 28, 5167–5173, 2007.
Toké, N. A., Boone, C. G., and Arrowsmith, J. R.: Fault zone regulation, seismic hazard, and social vulnerability in Los Angeles, California: Hazard or urban amenity?, Earth's Future, 2, 440–457, 2014.
Turvey, R.: Vulnerability Assessment of Developing Countries: The Case of Small-island Developing States, Dev. Policy Rev., 25, 243–264, 2007.
UN: Report of the open-ended intergovernmental expert working group on indicators and terminology relating to disaster risk reduction, Preventionweb, UNDRR, Geneva, Switzerland, 2016.
UNDP: The Real Wealth of Nations: Pathways to Human Development, UNDP, New York, NY, USA, 2010.
UNISDR: Hyogo Framework for Action 2005–2015: Building the Resilience of Nations and Communities to Disasters, Geneva, Switzerland, 2007.
Unwin, D. J.: GIS, spatial analysis and spatial statistics, Prog. Human Geogr., 20, 540–551, 1996.
van der Geest, K., Burkett, M., Fitzpatrick, J., Stege, M., and Wheeler, B.: Climate change, ecosystem services and migration in the Marshall Islands: are they related?, Climatic Change, https://doi.org/10.1007/s10584-019-02648-7, in press, 2020.
Vandermeerschen, H., Vos, S., and Scheerder, J.: Who's joining the club? Participation of socially vulnerable children and adolescents in club-organised sports, Sport Educ. Soc., 20, 941–958, 2015.
Vilches, O. R., Carrillo, K. S., Reyes, C. M., and Castillo, E. J.: Post-catastrophe social-environmental effects in vulnerable coastal areas affected by the tsunami of 02/27/2010 in Chile, Interciencia, 39, 383–390, 2014.
Vinchon, C., Alexander, D., Barbat, A., Cardona, O., Carreño, M., Contreras, D., Decker, B., Eidsvig, U., Kienberger, S., Papathoma-köhle, M., Miniati, R., Pelling, M., Pratzler-Wanczura, S., Schneiderbauer, S., Ulbrich, T., Vidar, B., Welle, T., Angignard, M., Carvalho, S., Garcin, M., Marulanda, M.-C., Morabito, M., Pedoth, L., Pelling, M., Tedim, F., and Zehra, R.: Assessing vulnerability to natural hazards in Europe: From Principles to Practices. A manual on concept, methodology and tools, European Commission DG Environment, Orléans, France, 2011.
Walker, B. B., Taylor-Noonan, C., Tabbernor, A., McKinnon, T. B., Bal, H., Bradley, D., Schuurman, N., and Clague, J. J.: A multi-criteria evaluation model of earthquake vulnerability in Victoria, British Columbia, Nat. Hazards, 74, 1209–1222, 2014.
Warmer, K., Kuhlicke, C., d. Vries, D., Sakdapolrak, P., Wutich, A., Real, B., Briones, F., and Verjee, F.: Perspectives on Social Vulnerability, UNU-EHS, Bonn, Germany, 132 pp., 2007.
Wisner, B. and Uitto, J.: Life on the edge: urban social vulnerability and decentralized, citizen-based disaster risk reduction in four large cities of the Pacific Rim, in: Facing global environmental change, edited by: Brauch, H. G., Springer, Berlin, 215–231, 2009.
Wolch, J., Wilson, J. P., and Fehrenbach, J.: Parks and Park Funding in Los Angeles: An Equity-Mapping Analysis, Urban Geogr., 26, 4–35, 2005.
Yuan, H. H., Gao, X. L., and Qi, W.: Fine-Scale Spatiotemporal Analysis of Population Vulnerability to Earthquake Disasters: Theoretical Models and Application to Cities, Sustainability, 11, 19, 2019a.
Yuan, H. H., Gao, X. L., and Qi, W.: Modeling the fine-scale spatiotemporal pattern of earthquake casualties in cities: Application to Haidian District, Beijing, Int. J. Disast. Risk Reduct., 34, 412–422, 2019b.
Zebardast, E.: Constructing a social vulnerability index to earthquake hazards using a hybrid factor analysis and analytic network process (F'ANP) model, Nat. Hazards, 65, 1331–1359, 2013.
Zeng, J., Zhu, Z. Y., Zhang, J. L., Ouyang, T. P., Qiu, S. F., Zou, Y., and Zeng, T.: Social vulnerability assessment of natural hazards on county-scale using high spatial resolution satellite imagery: a case study in the Luogang district of Guangzhou, South China, Environ. Earth Sci., 65, 173–182, 2012.
Zhang, N. and Huang, H.: Assessment of world disaster severity processed by Gaussian blur based on large historical data: casualties as an evaluating indicator, Nat. Hazards, 92, 173–187, 2018.
Zhou, Y., Li, N., Wu, W., Wu, J., and Shi, P.: Local Spatial and Temporal Factors Influencing Population and Societal Vulnerability to Natural Disasters, Risk Anal., 34, 614–639, 2014.