the Creative Commons Attribution 4.0 License.
the Creative Commons Attribution 4.0 License.
 | 05 Jun 2020
Seismic hazard maps of Peshawar District for various return periods
Khalid Mahmood
Naveed Ahmad
Usman Khan
Qaiser Iqbal
Probabilistic seismic hazard analysis of Peshawar District has been performed for a grid size of 0.01∘. The seismic sources for the target location are defined as the area polygon with uniform seismicity. The earthquake catalogue was developed based on the earthquake data obtained from different worldwide seismological networks and historical records. The earthquake events obtained at different magnitude scales were converted into moment magnitude using indigenous catalogue-specific regression relationships. The homogenized catalogue was subdivided into shallow crustal and deep-subduction-zone earthquake events. The seismic source parameters were obtained using the bounded Gutenberg–Richter recurrence law. Seismic hazard maps were prepared for peak horizontal acceleration at bedrock level using different ground motion attenuation relationships. The study revealed the selection of an appropriate ground motion prediction equation is crucial for defining the seismic hazard of Peshawar District. The inclusion of deep subduction earthquakes does not add significantly to the seismic hazard for design base ground motions. The seismic hazard map developed for shallow crustal earthquakes, including also the epistemic uncertainty, was in close agreement with the map given in the Building Code of Pakistan Seismic Provisions (2007) for a return period of 475 years on bedrock. The seismic hazard maps for other return periods i.e., 50, 100, 250, 475 and 2500 years, are also presented.
- Article
(24785 KB) - Full-text XML
- BibTeX
- EndNote


Peshawar is the capital city of the Khyber Pakhtunkhwa province of Pakistan that has an important background in the history of the Indian subcontinent. The city provides key access to the Central Asian states through Afghanistan along the western borders of Pakistan. It is located at 710∘43.4′ N, 330∘93.7′ E, in the western Himalayan region.
Peshawar is characterized by high seismicity rates due to its proximity to the active plate boundary between the Indian and Eurasian plates, which are converging at the rate of 37–42 mm yr−1 (Chen et al., 2000). The Main Boundary Thrust (MBT) system, along which the devastating Kashmir earthquake occurred in 2005, is located in the northern parts of the country together with some other active regional fault systems, including the Main Mantle Thrust (MMT) and Main Karakorum Thrust (MKT). These faults, if reactivated, can act as a potential source of seismic hazard for the region including Peshawar (Waseem et al., 2013). This was confirmed also by the recent 2015 Hindu Kush earthquake that caused widespread damage in the province of Khyber Pakhtunkhwa (Ahmad, 2015), including in Peshawar, damaging a number of important structures in the historic city (Fig. 1).
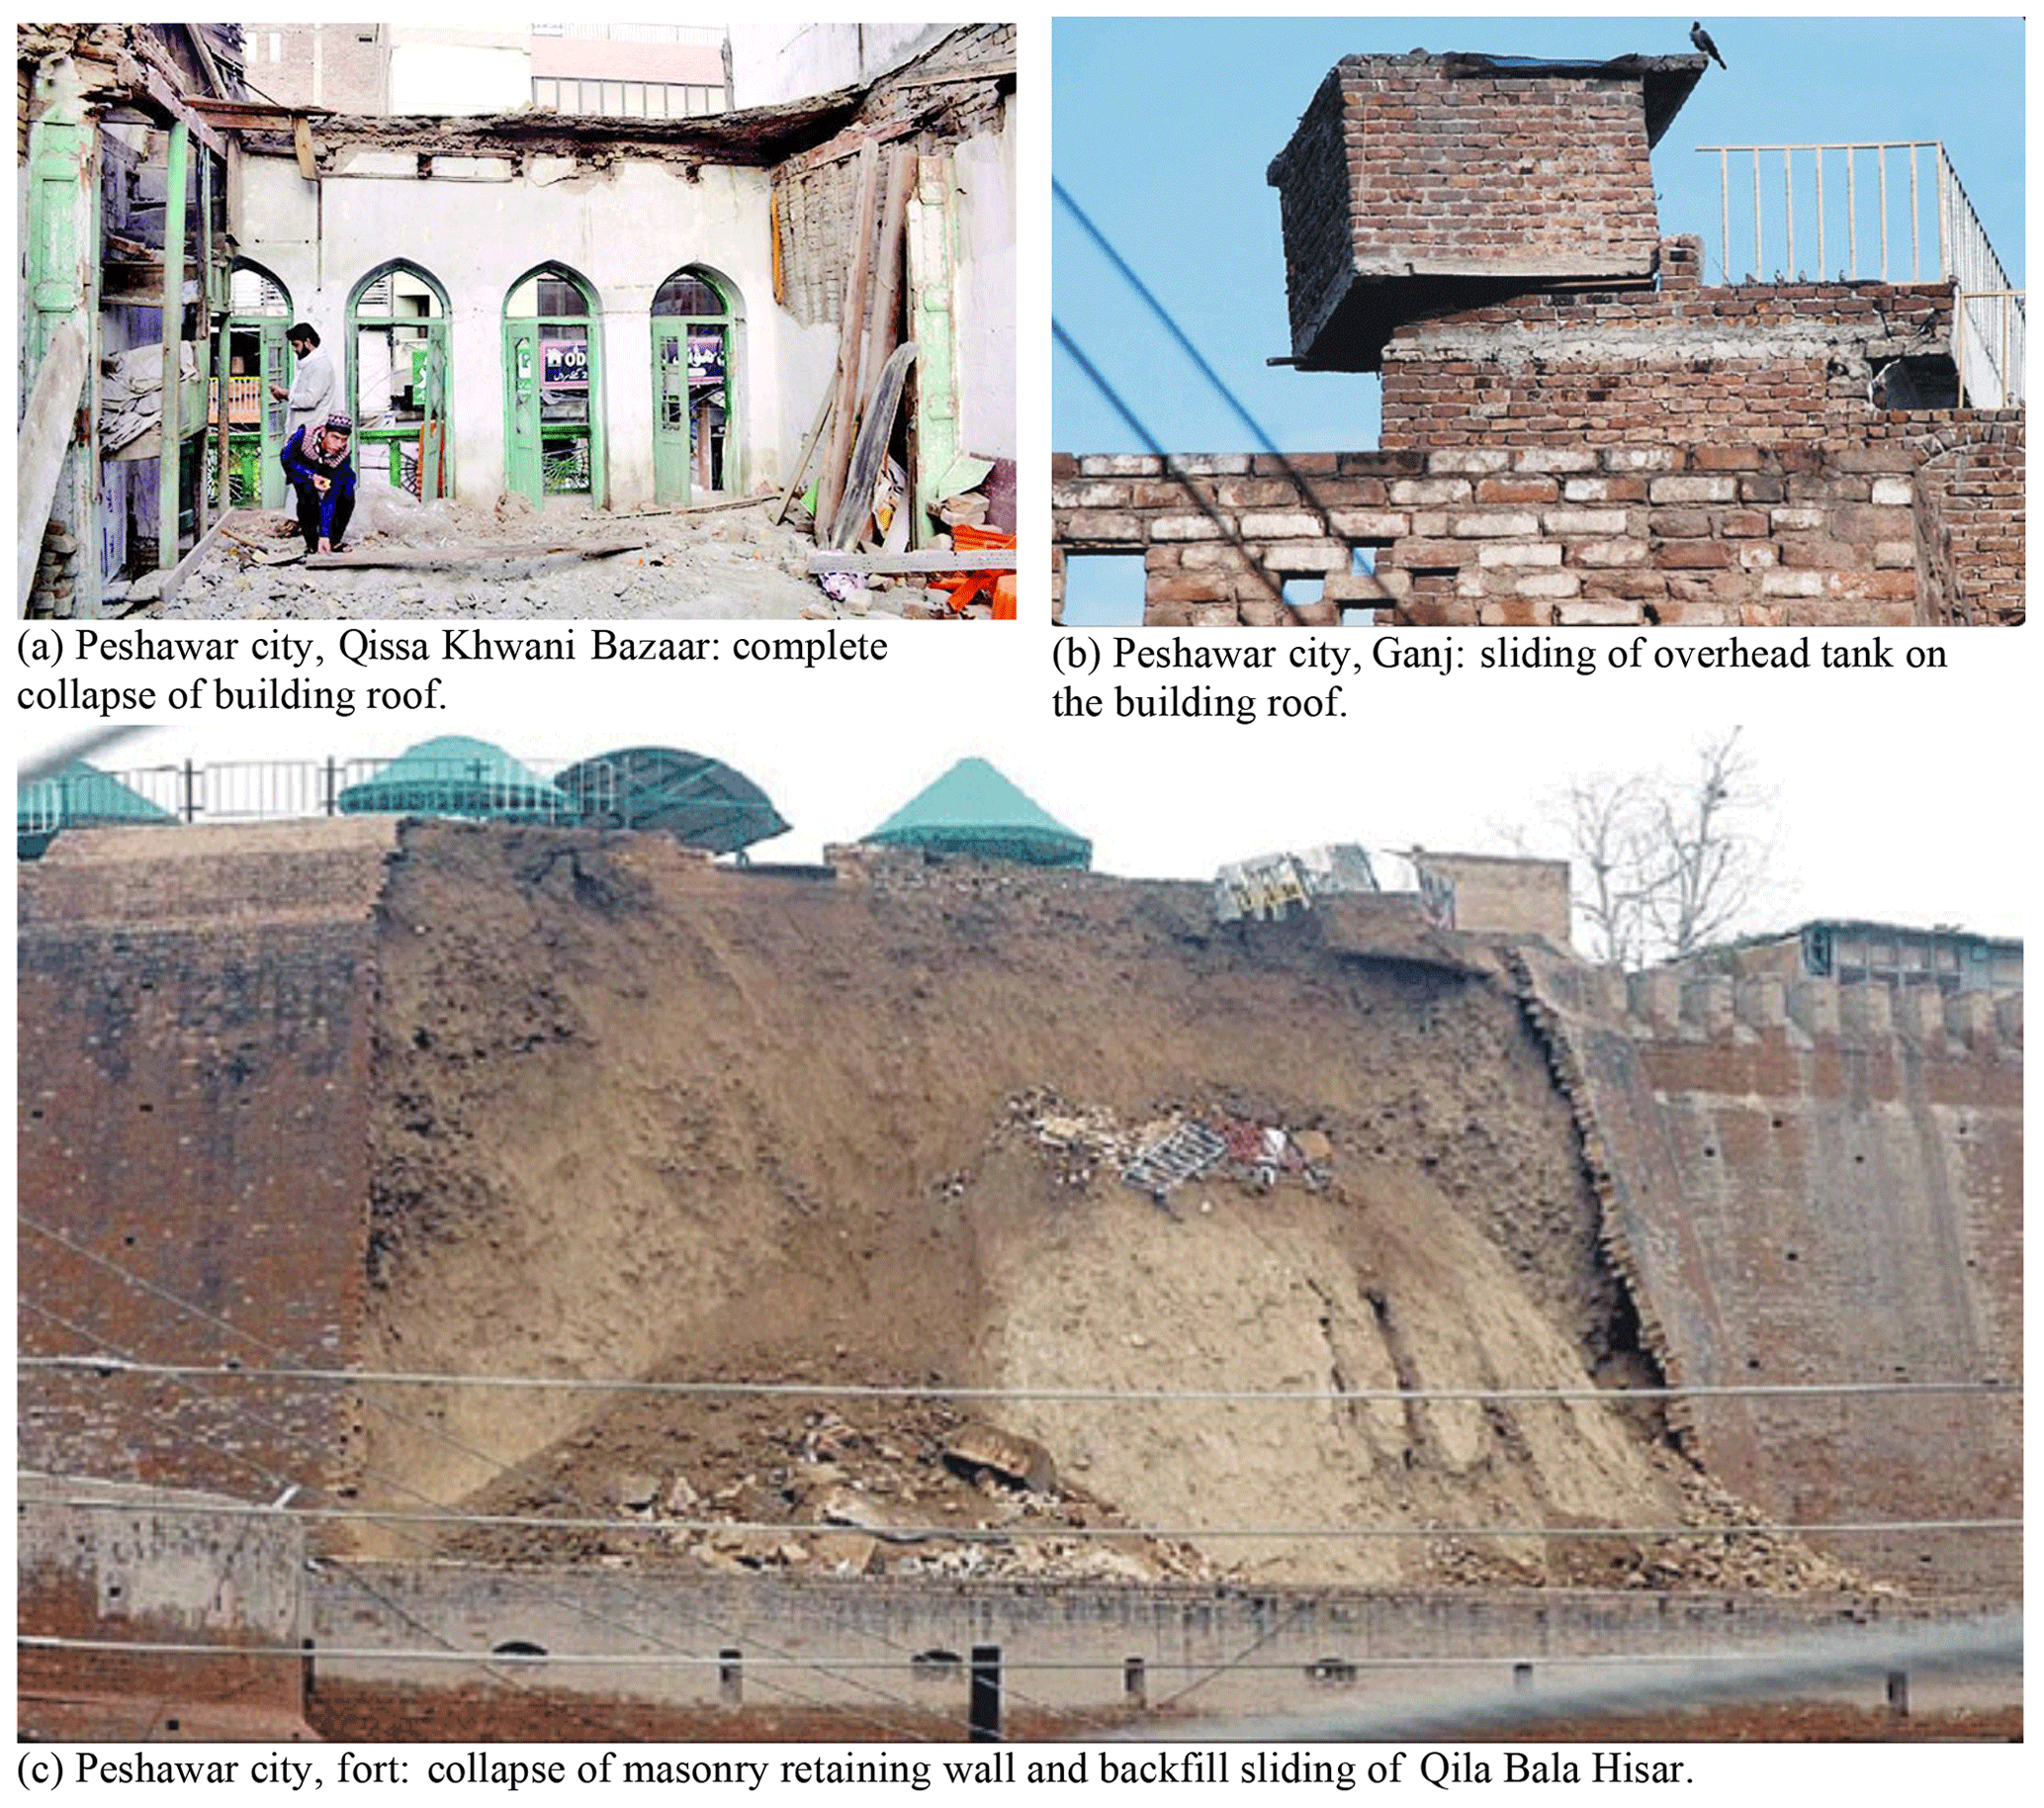
Figure 1Damage observed in Peshawar during the 2015 Hindu Kush earthquake.
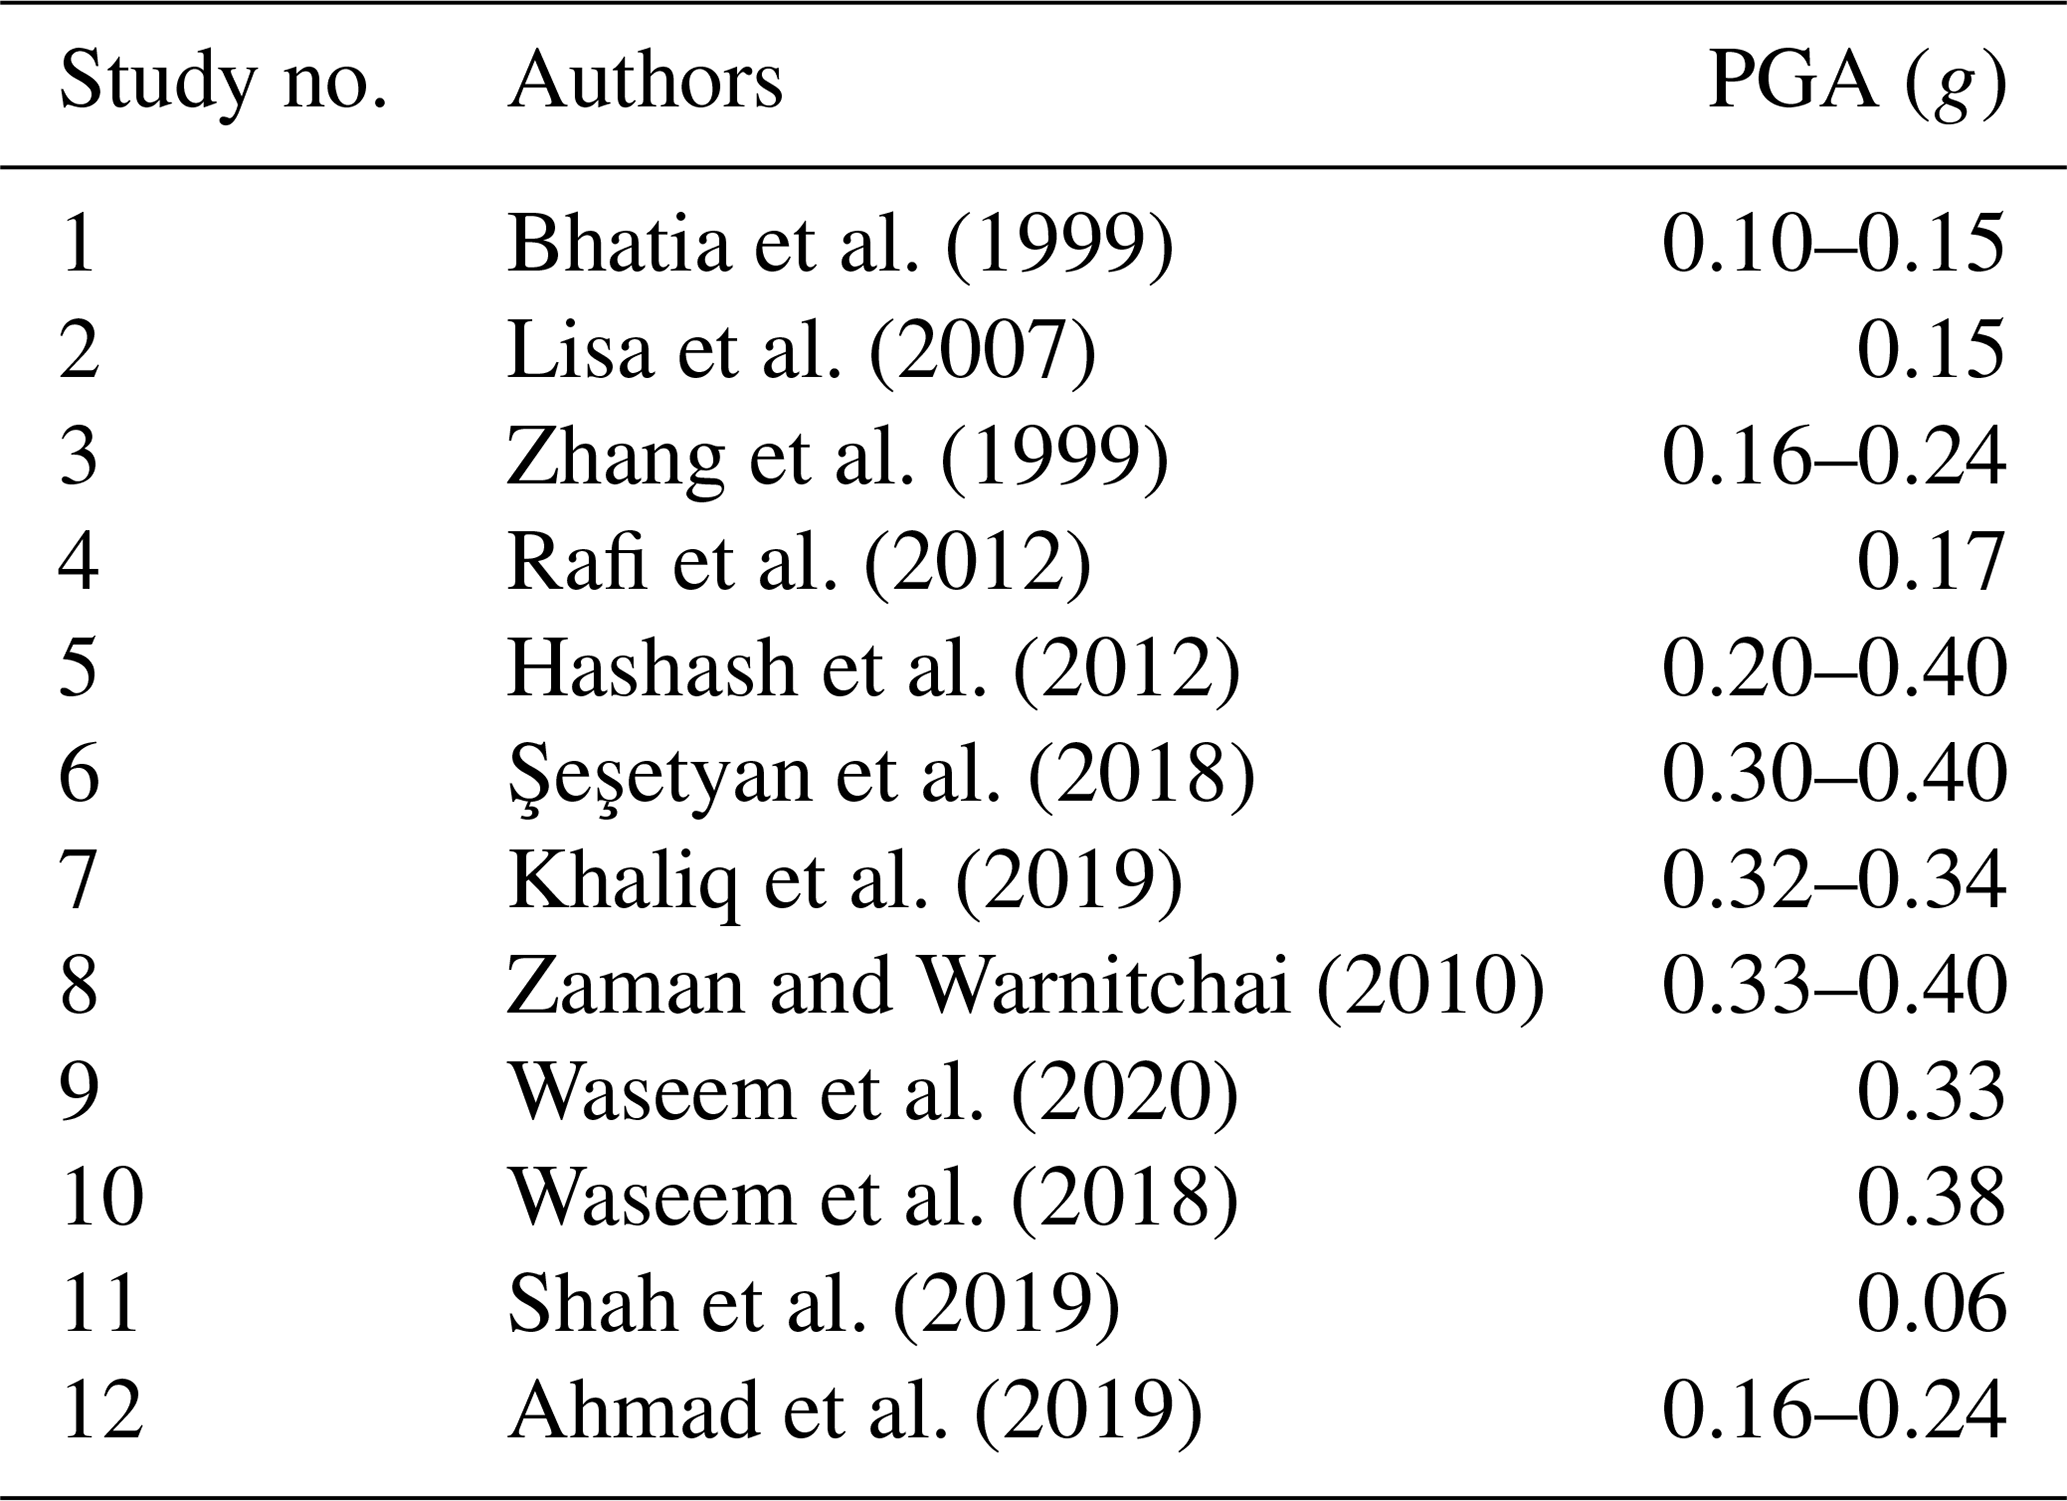
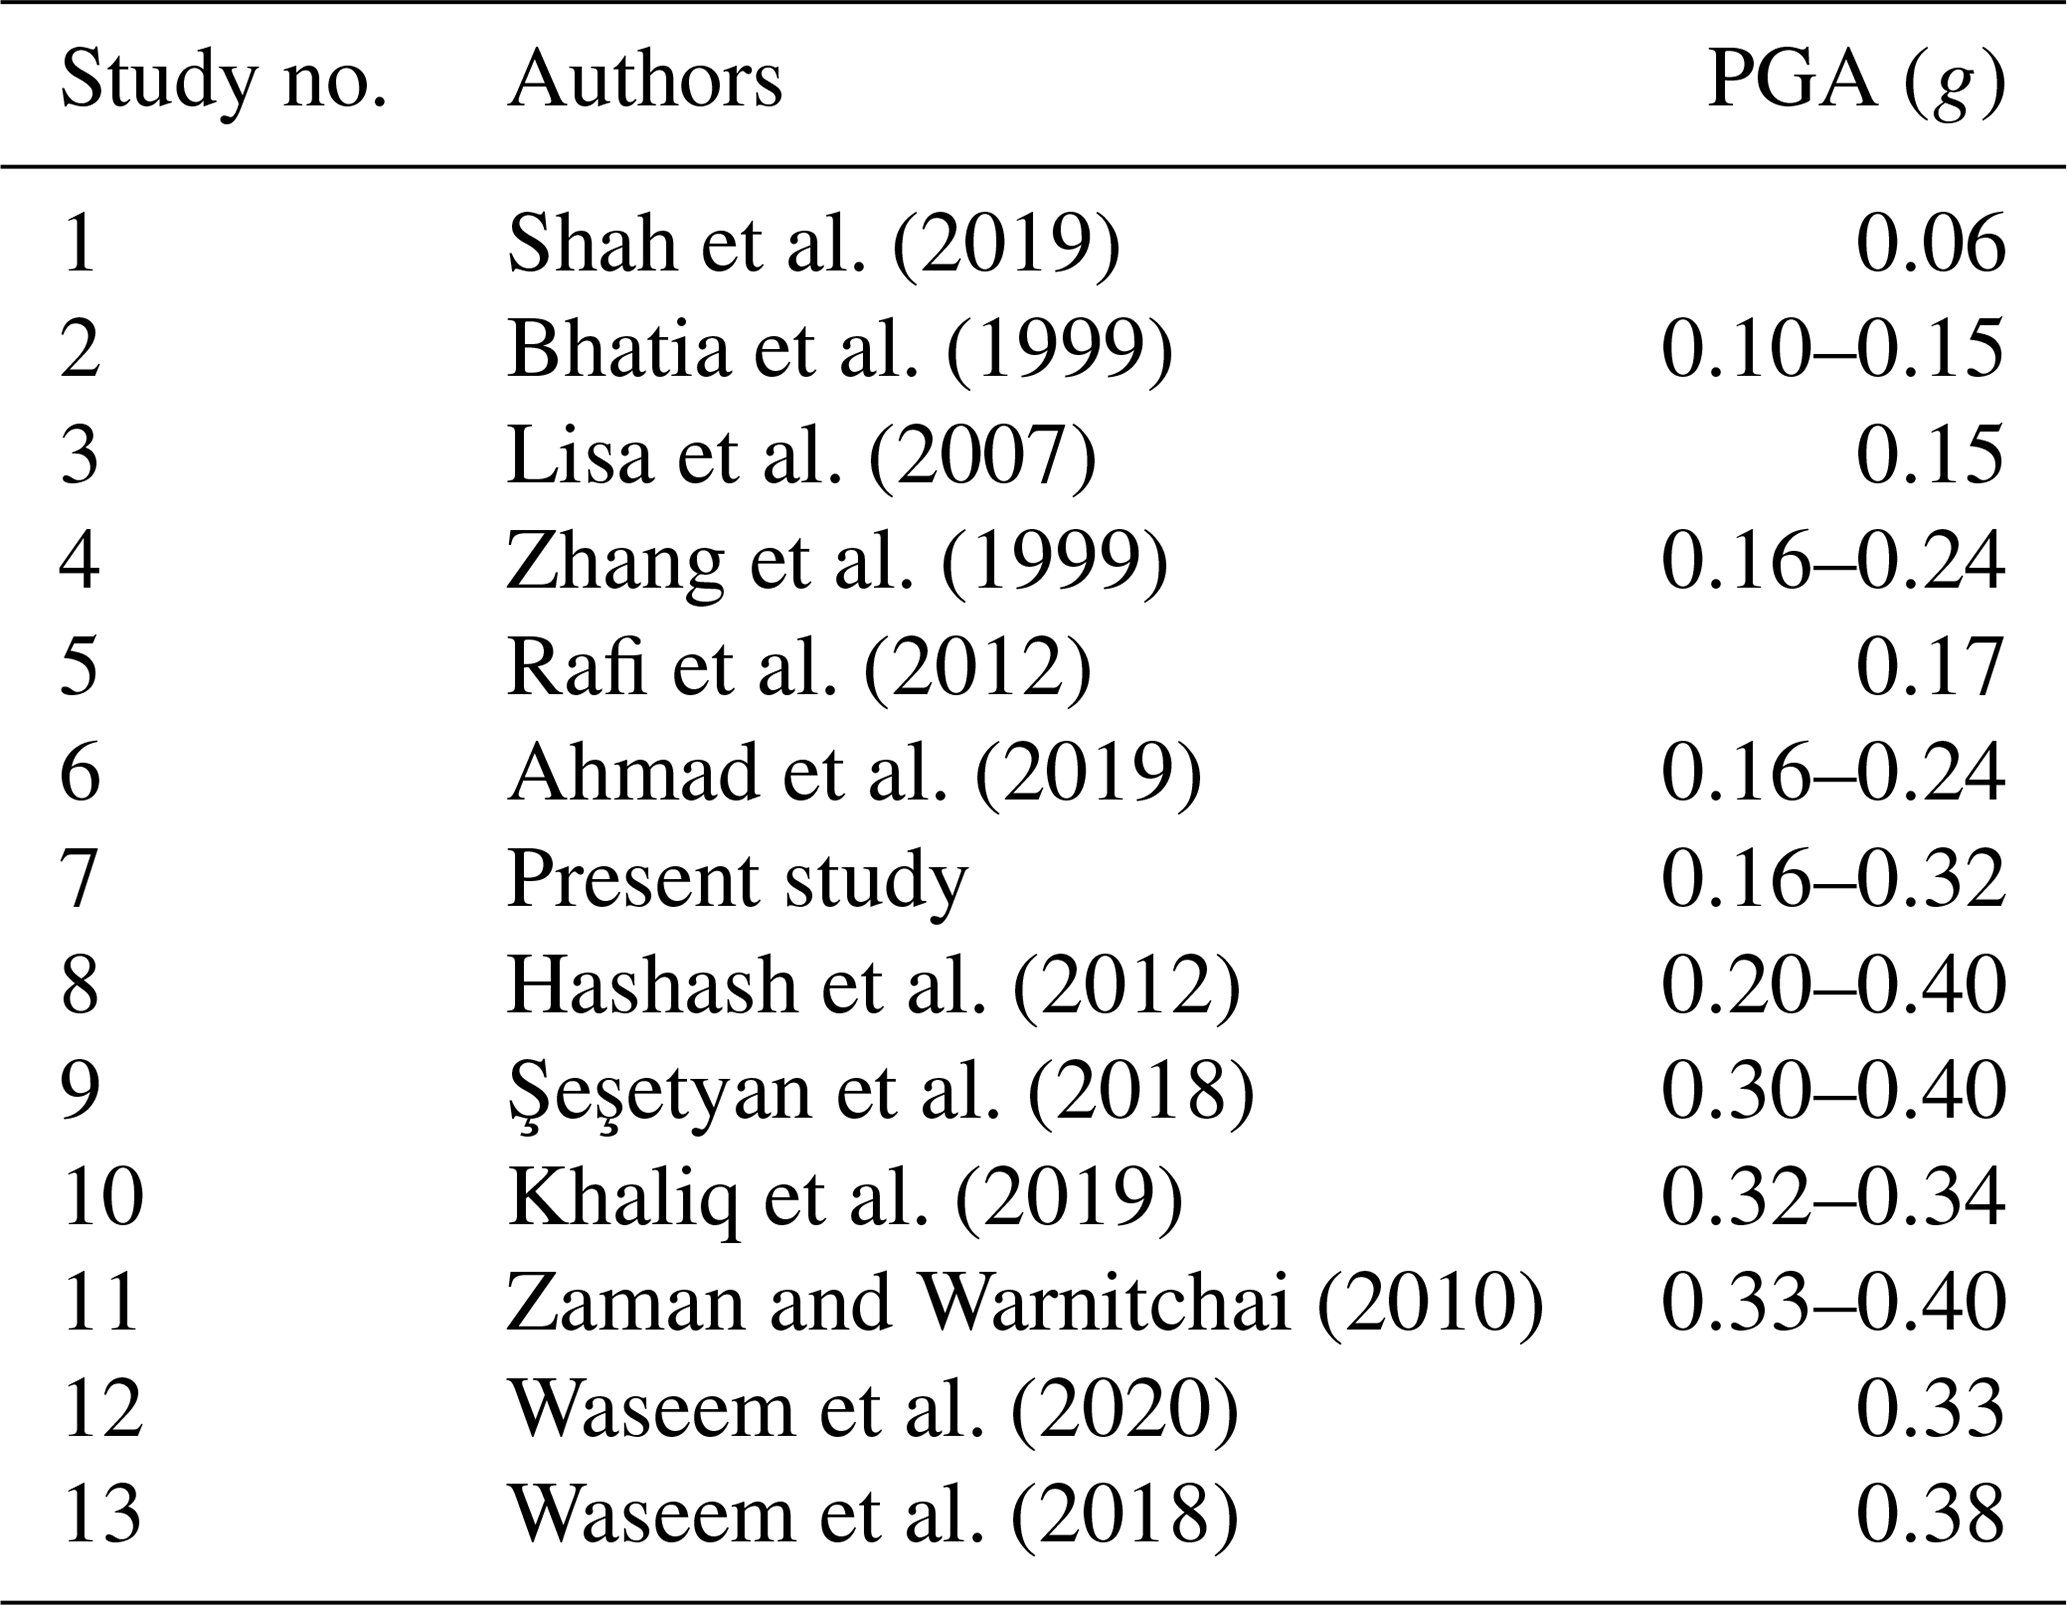
The Pakistan Building Code in 1986 placed Peshawar in Zone 2 which corresponds to intensity V–VI on the Modified Mercalli Intensity Scale. Lisa et al. (2007), based on the probabilistic seismic hazard analysis for the NW Himalayan thrust, recommended a value of 0.15 g for Peshawar. Hashash et al. (2012), using a discrete faults model for northern Pakistan, suggested a peak ground acceleration (PGA) value in the range of 0.20–0.4 g. Rafi et al. (2012), based on the probabilistic seismic hazard analysis and zonation for Pakistan and Azad Jammu and Kashmir, evaluated a value of 0.175 g for Peshawar. Several researchers either regionally or partially have studied the seismic hazard of Peshawar District (Table 1). The Geological Survey of Pakistan (Khan et al., 2006) seismic zoning map suggests a PGA value in the range of 0.03–0.1 g; Zaman and Warnitchai (2010) suggest a range of 0.33–0.40 g, while Zhang et al. (1999) suggest a range of 0.166–0.244 g. The Building Code of Pakistan Seismic Provisions (BCP, 2007), which is legally binding for the seismic design of structures in Pakistan, has placed Peshawar in Zone 2B. This zone has peak ground acceleration in the range of 0.16 to 0.24 g for a return period of 475 years. This has revealed that previous seismic hazard studies of Peshawar and northern Pakistan report widely conflicting results (Ahmad et al., 2019; Ambraseys et al., 2005; Khaliq et al., 2019; Şeşetyan et al., 2018; Waseem et al., 2018, 2020).
Table 1Seismic hazard of Peshawar reported by various researchers.
The present study aims to recalculate the seismic hazard of Peshawar, based on the up-to-date earthquake catalogue and ground motion prediction equations, and compare it with that recommended by BCP (2007). The PGA value at bedrock level was calculated using the classical probabilistic seismic hazard analysis procedure. The area sources as suggested by BCP (2007) were those for which the earthquake catalogue was obtained from worldwide seismogram networks and historical records. The modified Gutenberg–Richter empirical model was used to calculate the seismic zone parameters for both shallow crustal and deep-subduction-zone earthquakes. The seismic hazard in terms of PGA at bedrock was calculated and plotted with a GIS tool. Different ground motion attenuation relationships compatible with the geology and seismicity of the local environment were used to quantify the model in terms of variability in seismic hazard of Peshawar District. Furthermore, the logic tree approach was used to take into consideration the epistemic uncertainty. The GIS-based seismic hazard map developed for a return period of 475 years was compared with that given in BCP (2007). Seismic hazard maps were prepared for various other return periods, i.e., 50, 100, 250, 475 and 2500 years.
The uncertainties in the location, size and rate of recurrence of earthquakes along with the variation in the ground motion intensity and spatial variability can be well considered in the probabilistic seismic hazard analysis procedures (Ornthammarath et al., 2011; Çağnan and Akkar, 2018; Rowshandel, 2018). The probabilistic seismic hazard analysis (PSHA) provides a framework in which these uncertainties can be identified, quantified, and combined in a rational manner to provide a holistic view of the seismic hazard.
According to the modified Gutenberg–Richter law the earthquake exceedance rate λ(M) for an earthquake magnitude M can be defined using Eq. (1):
λ0 is the exceedance rate in the range of the lower limit M0 and upper limit Mu of magnitude; β is the earthquake source parameter. Considering an earthquake as a Poisson process, the probability density of the earthquake magnitude can be obtained using Eq. (2):
The strong ground motion parameters, i.e., acceleration, velocity and displacement, are characterized using attenuation relationships that shows the variation in strong-motion amplitude with source-to-site distance and depend on a number of source, path and site parameters (Douglas, 2019; Kramer, 1996; McGuire, 2004; Rupakhety and Sigbjörnsson, 2009). For example, the attenuation relationship for the peak horizontal acceleration has been developed by Campbell (1981) within 50 km of the fault rupture in magnitude 5.0 to 7.7 earthquakes. Campbell and Bozorgnia (1994) developed attenuation relationships using worldwide moment magnitude in the range of 4.7 to 8.1. This relationship is more specific and provides additional terms for source characterization. Toro et al. (1997) have developed an attenuation relation in terms of peak horizontal acceleration on the rock side for the continental portion of northern America. Among others, Boore and Atkinson (2008) and Akkar and Bommer (2010) have developed a site-specific attenuation relationship that can calculate peak acceleration in terms of earthquake magnitude, source-to-site distance, fault mechanism and site condition. The Boore and Atkinson (2008) model was developed based on the empirical regression of the PEER NGA strong-motion database, while that of Akkar and Bommer (2010) was developed for Europe, the Mediterranean and the Middle East region.
The mentioned attenuation relationships can be used for ground motion prediction of shallow crustal earthquakes. However, several researchers including Crouse et al. (1988), Crouse (1991), Molas and Yamazaki (1995), and Youngs et al. (1995) have pointed out different conditions of attenuation relationships for shallow and subduction zones. Lin and Lee (2008) and Kanno et al. (2006) have developed attenuation relationships for earthquake records of Taiwan and Japan, respectively. The study of Lin and Lee (2008) showed lower attenuation for subduction zones than for crustal shallow earthquakes. Therefore, the use of shallow-crustal-earthquake attenuation relationships may lead to underestimation of the seismic hazard for subduction earthquakes in probabilistic analysis.
In probabilistic seismic hazard analysis, the peak acceleration at a location is a function of magnitude and distance that is lognormally distributed with standard deviation. In the hazard analysis, the study area is first divided into seismic sources based on tectonics and geotechnical characteristics. The different seismic sources are assumed to occur independently, and the seismic events are considered to occur uniformly over the source. The acceleration exceedance rate vi(a) for the ith single seismic source is calculated using Eq. (3):
where M0 is the smallest and Mu is the largest magnitude of the seismic source, Pr(A>a|M, Rij) is the probability that acceleration A exceeds the value a at distance Rij for an earthquake of magnitude M. The acceleration exceedance v(a) due to all sources N is calculated through combining all sources, as given in Eq. (4):
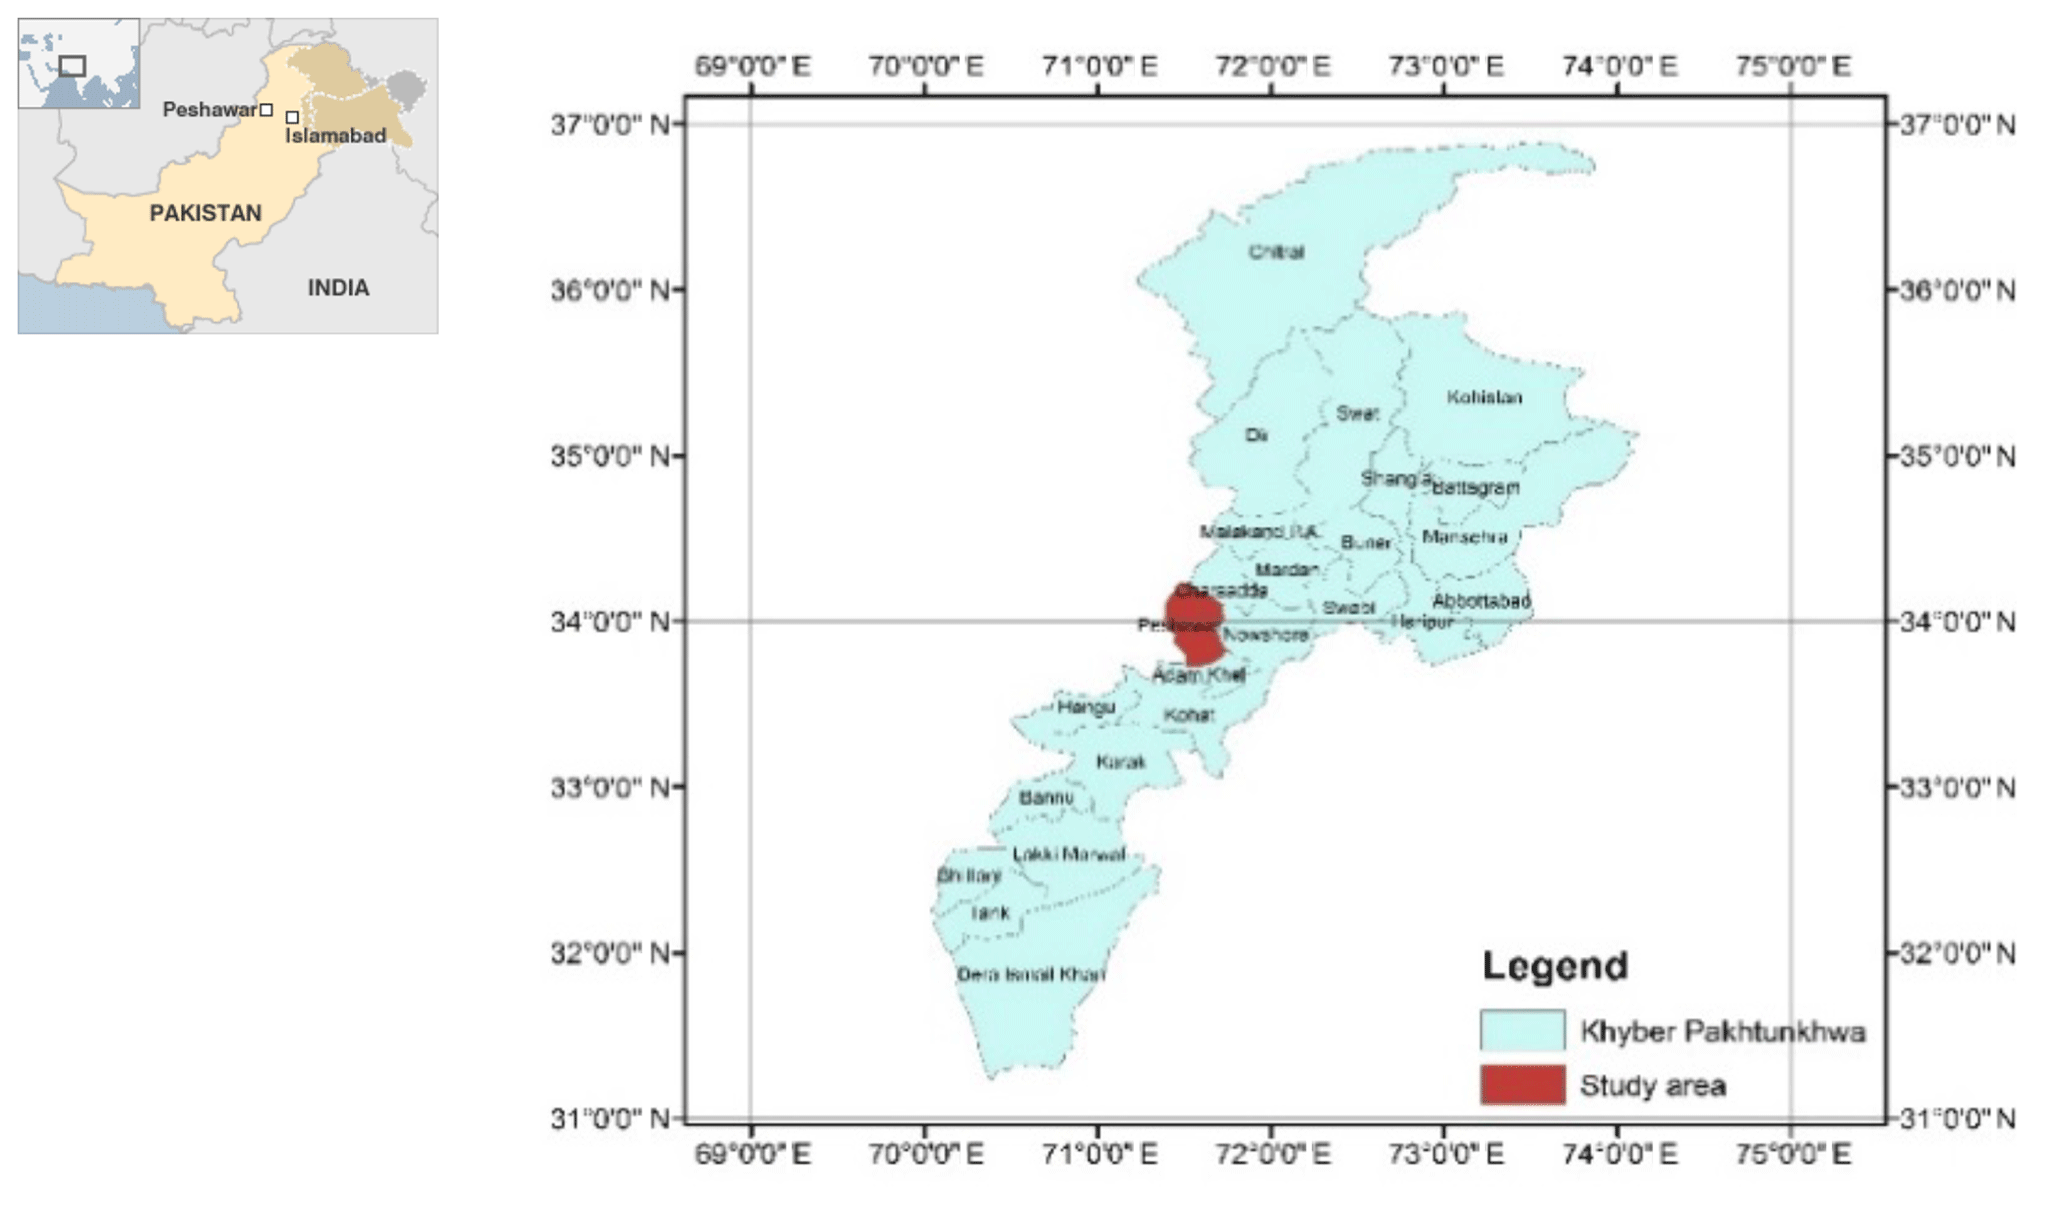
Figure 2Location of study area.
The collision of the Eurasian and Indian plate has resulted in the formation of an active Himalayan orogenic system that is further classified into the Tethyan Himalayas, Higher Himalayas, Sub-Himalayas and Lesser Himalayas (Gansser, 1964). The divisions are based on the tectonic blocks formed and separated by major fault boundaries.
The Microsoft Encarta reference library (Ali and Khan, 2004b) shows that the valley of Peshawar consists of the southern part of the Eurasian plate and northern part of the Indo-Australian plate. This part of the Himalayas is variably interpreted to be the Lesser Himalayas (Tahirkheli et al., 1982) and Tethyan Himalayas (DiPietro and Pogue, 2004). The seismic hazard study of Waseem et al. (2013) identified about 21 seismogenic faults around Peshawar. Most of these faults have a reverse fault mechanism and have a Joyner–Boore distance RJB in the range of 19–100 km. According to Ali and Khan (2004a), most of the significant earthquakes felt at Peshawar have their origin in the Hindu Kush region of Afghanistan and a few in northern areas of Pakistan.
The seismic hazard software CRISIS (2007) was used to calculate the peak acceleration at bedrock level for Peshawar District. Figure 2 shows the geographical location of Peshawar District within the geopolitical boundaries of the KP province of Pakistan. The hazard analysis requires seismic source geometry, the earthquake reoccurrence relationship and the selected ground motion attenuation relationship. In the present study the ground motion attenuation relationships of Boore and Atkinson (2008) and Akkar and Bommer (2010) were used for shallow crustal seismic earthquakes and those of Lin and Lee (2008) and Kanno et al. (2006) for deep-subduction-zone earthquakes. The earthquake events within a 50 km depth were considered shallow, while earthquake events occurring at depths larger than 50 km were considered deep earthquakes. The seismic hazard maps were prepared in a GIS environment based on a grid size of 0.01∘ for various return periods, i.e., 50, 100, 250, 475 and 2500 years.
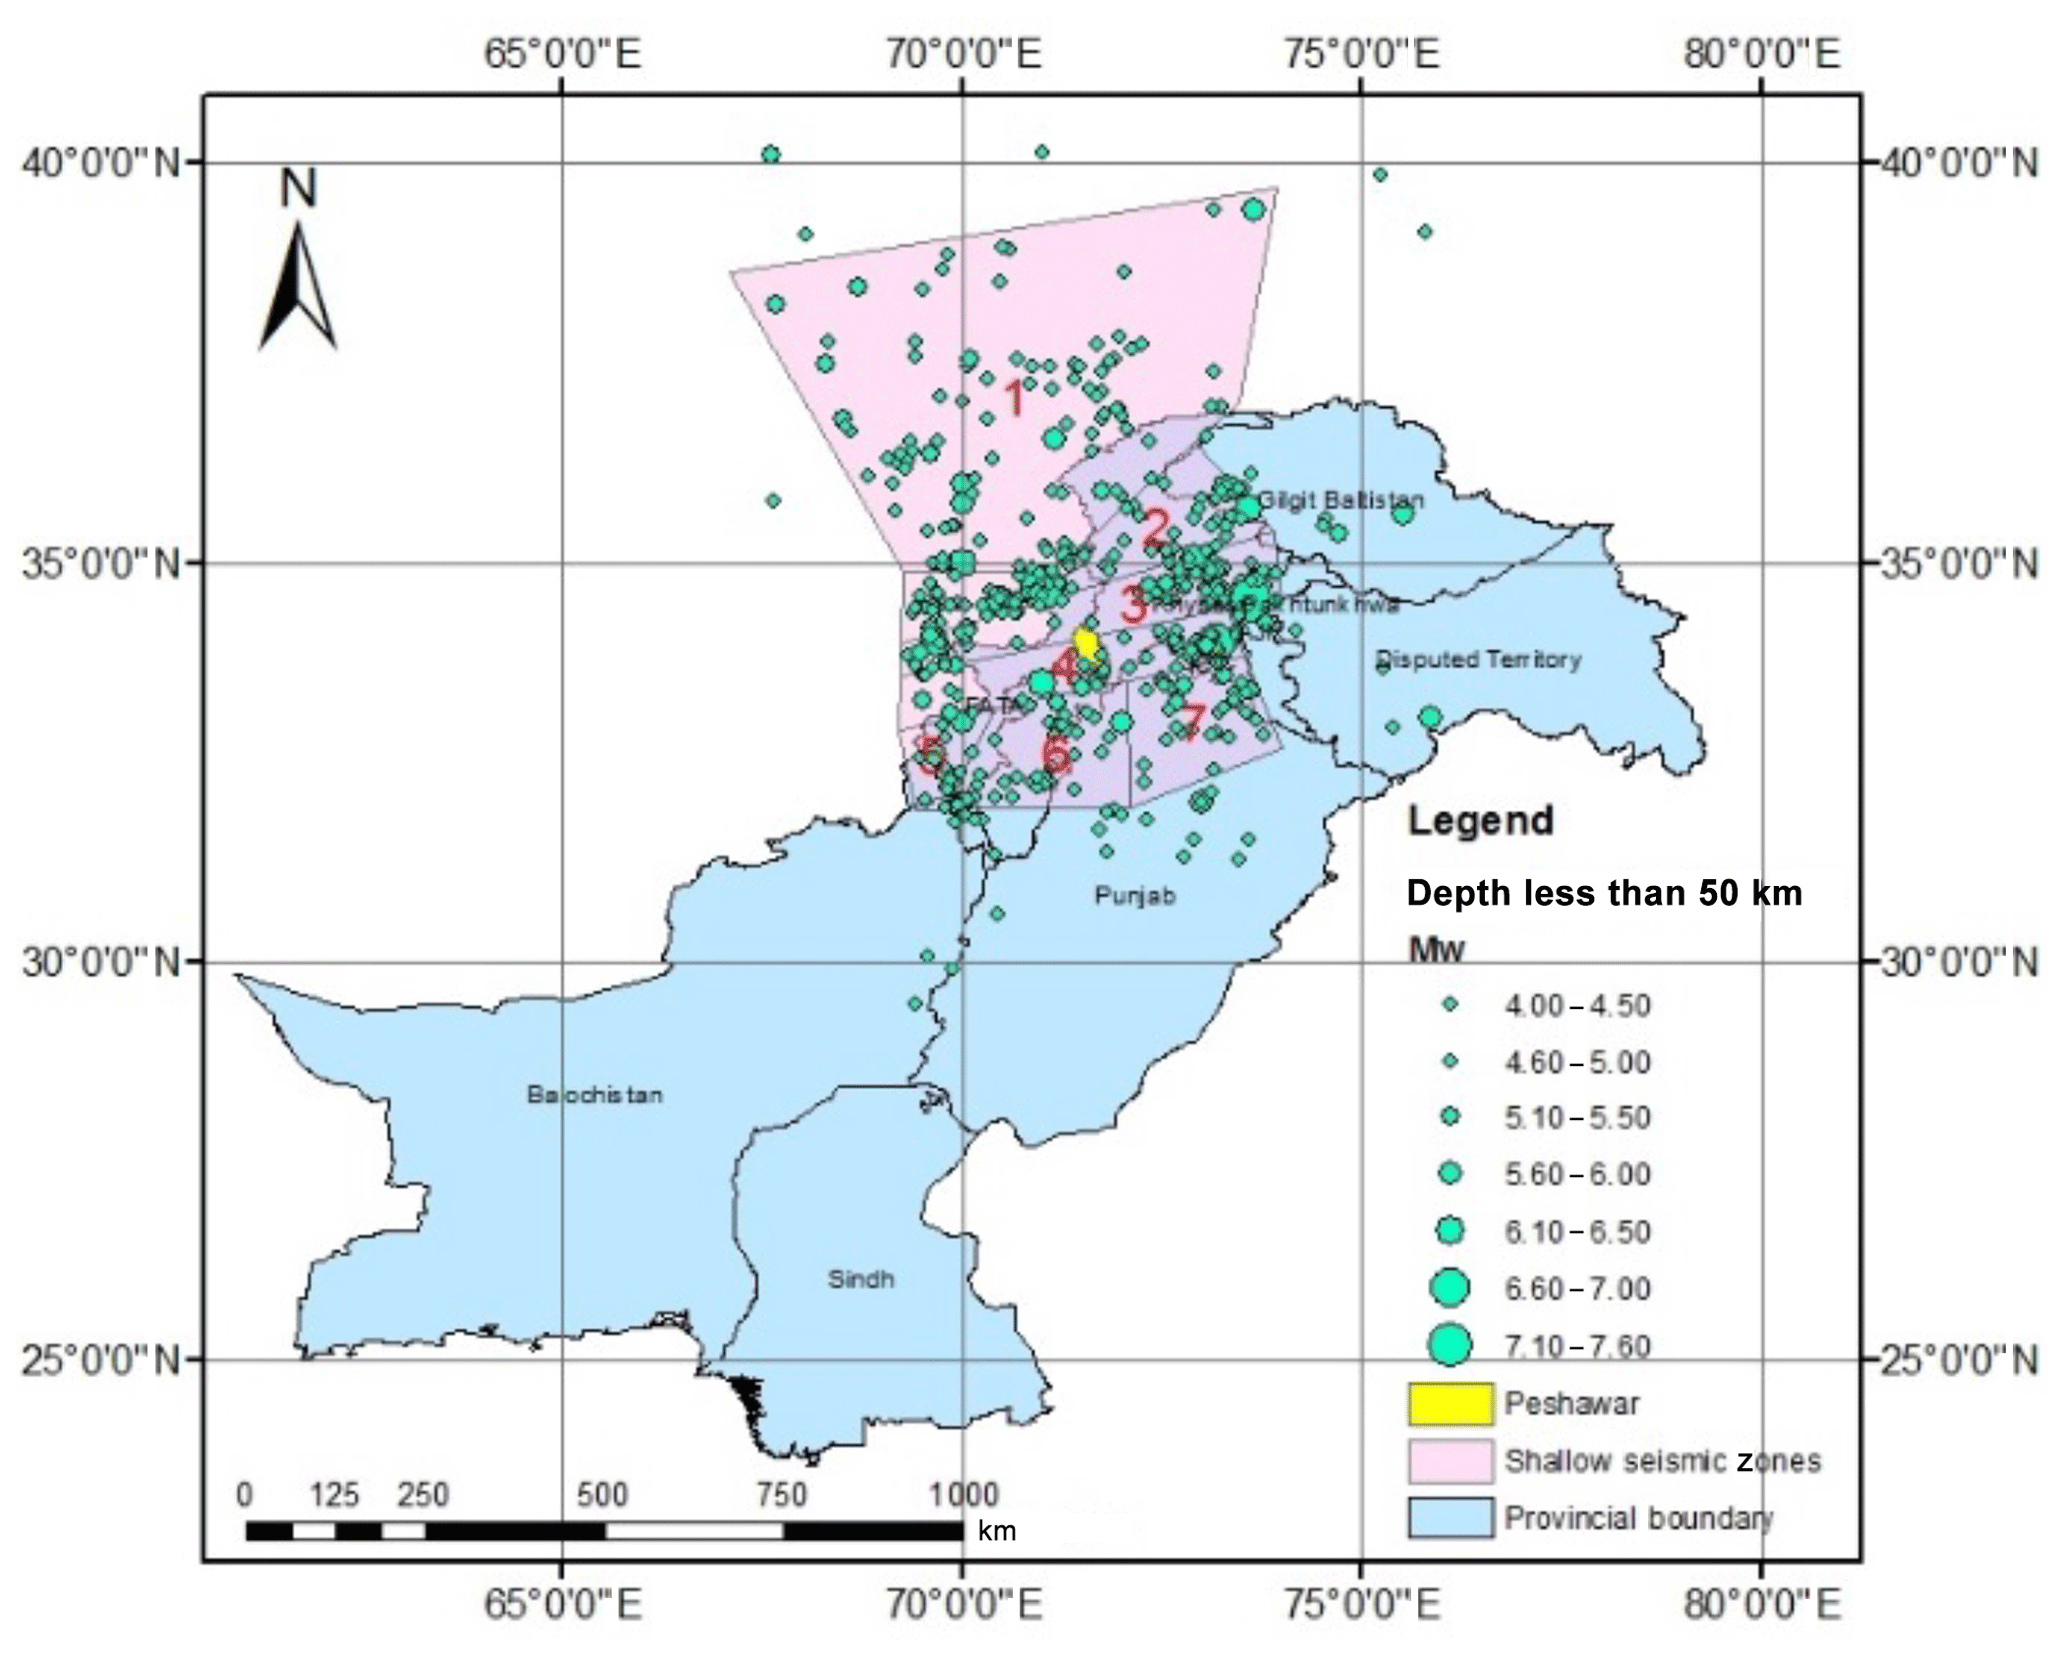
Figure 3Shallow seismic sources for Peshawar (BCP, 2007).
4.1 Seismic sources identification and characterization
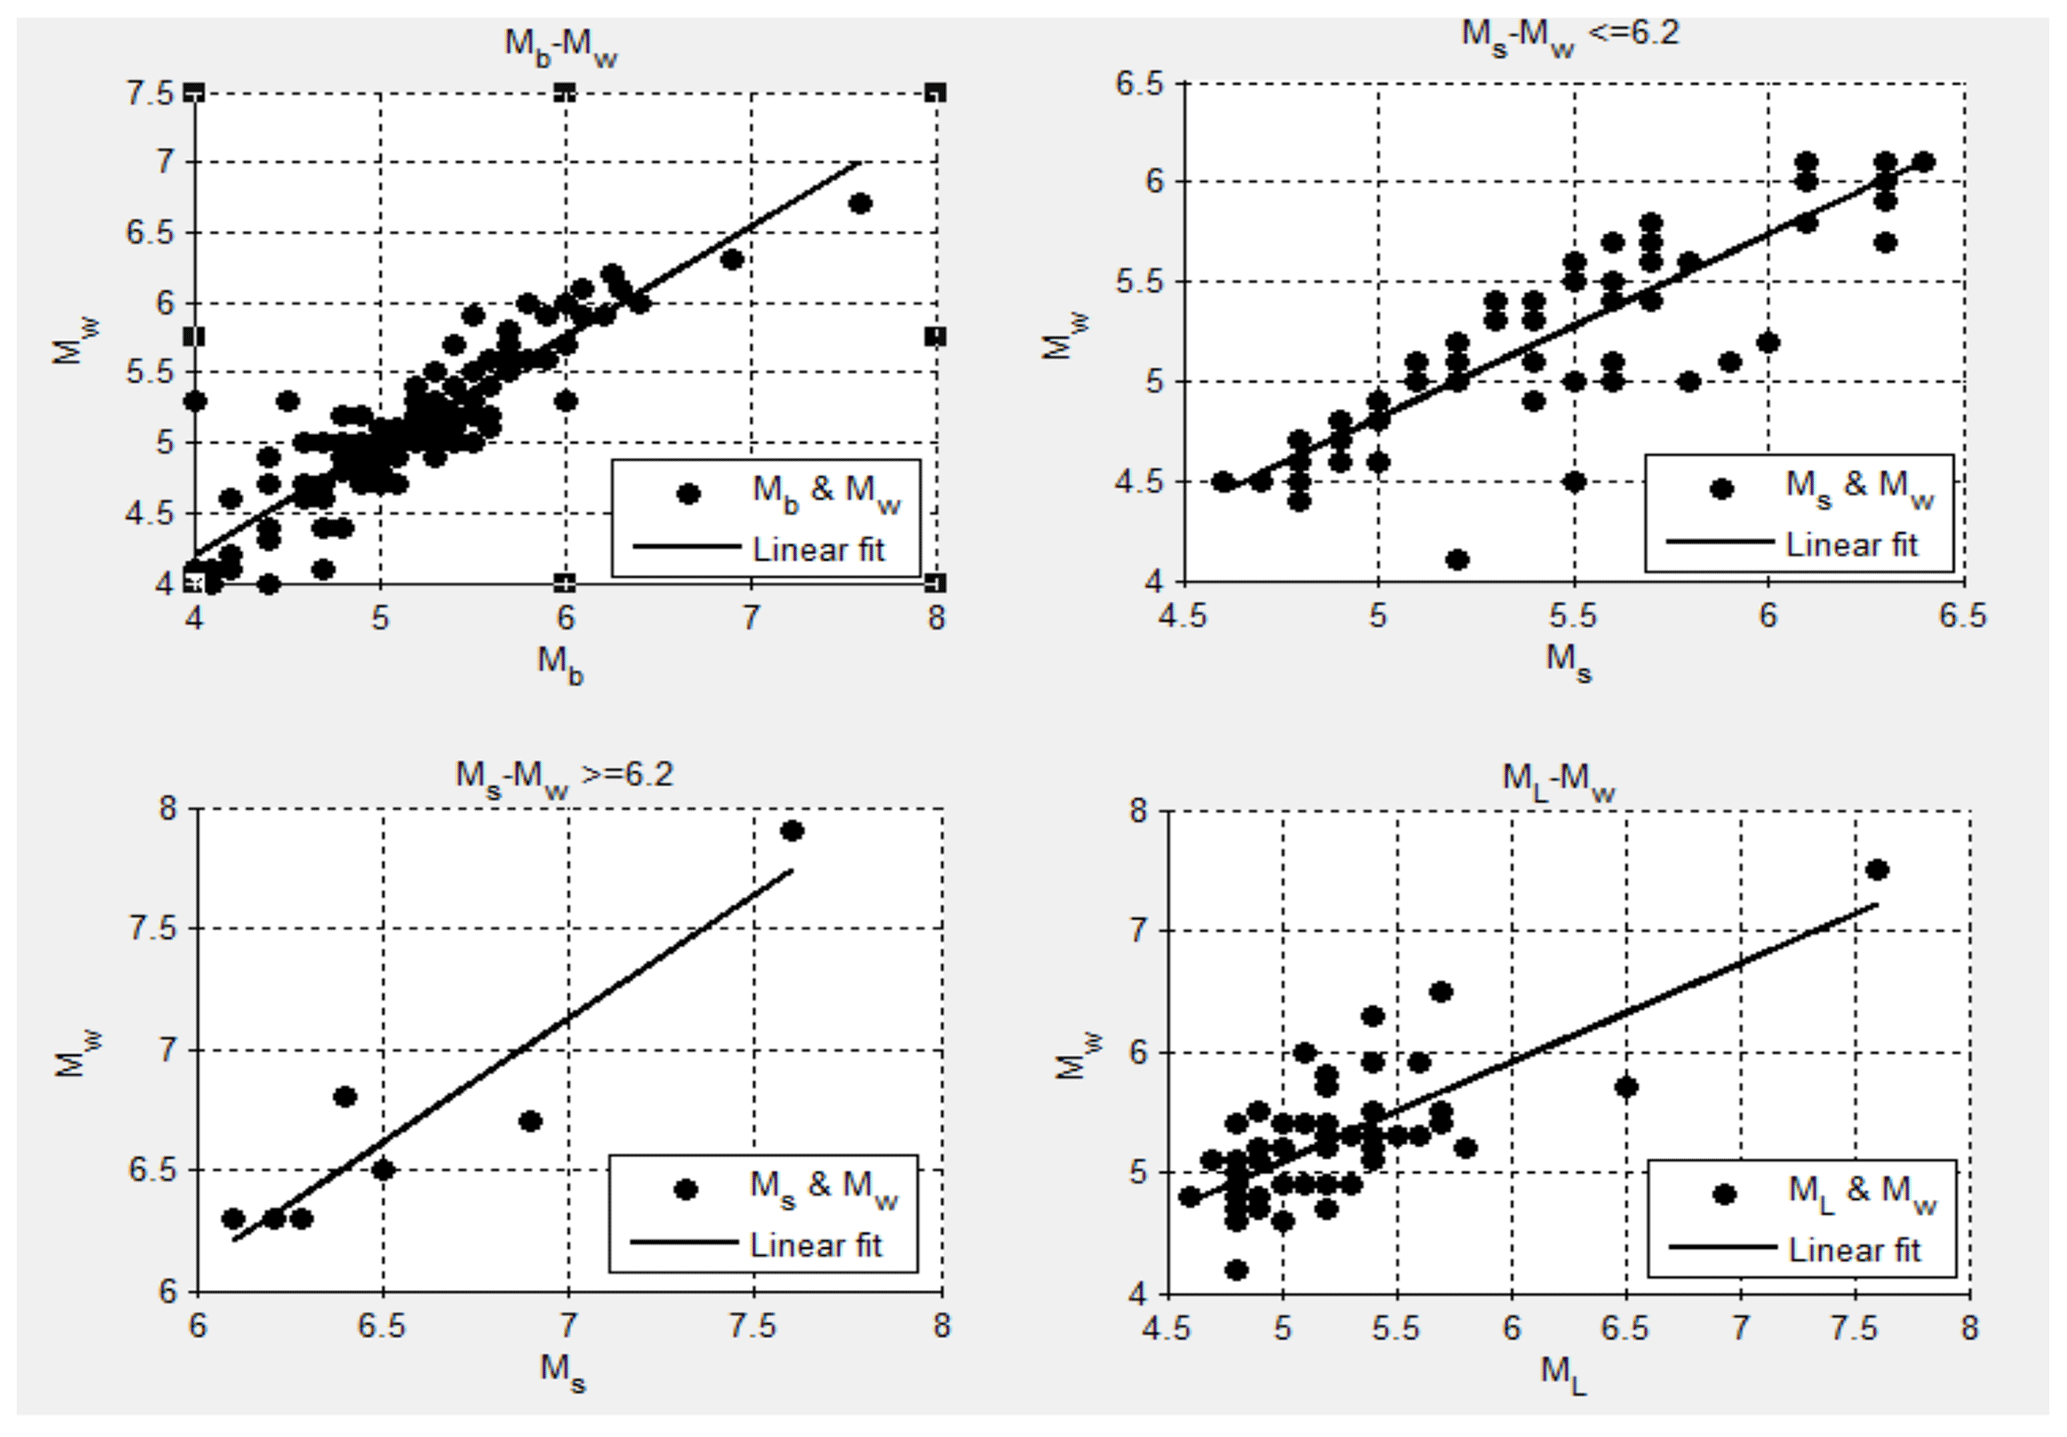
The Building Code of Pakistan (BCP, 2007) has defined the potential shallow seismic sources for Pakistan including northern areas. Those sources within 200 km of Peshawar were considered potential sources for earthquake activity impacting Peshawar (Fig. 3). The potential seismic sources (seven seismic sources in present study) for the Peshawar region in a rectangular shape with lat 31.888–36.006∘, long 69.562–73.620∘, as shown in Fig. 4, were considered for the compilation of the earthquake catalogue. The earthquake catalogue was obtained using worldwide seismogram network sources, i.e., the United States Geological Survey (USGS), National Geophysical Data Center (NGDC), Global Centroid Moment Tensor (GCMT) catalogue and International Seismological Centre (ISC), using the time span of 1500 till 2015 CE with a focal depth of up to 1000 m. The catalogue also included historical data from Ambrasey (2000) and Ambrasey and Douglas (2004). Khan et al. (2018) also reported an updated earthquake catalogue for Pakistan; however, the majority of their events relevant to Peshawar were already included in the catalogue of the present study for seismic sources characterization. These different networks already discussed give earthquake magnitude on different scales, e.g., moment magnitude, surface magnitude and low magnitude. According to Kanamori (1977) and Hanks and Kanamori (1979) the moment magnitude is the most accurate scale that does not saturate in higher-magnitude events. Therefore, all the magnitudes were converted into moment magnitude (Mw) using regression analysis. Figure 5 shows the empirical relationships established in the present study based on the catalogue obtained for earthquake magnitude conversion. These were used for the catalogue homogenization.
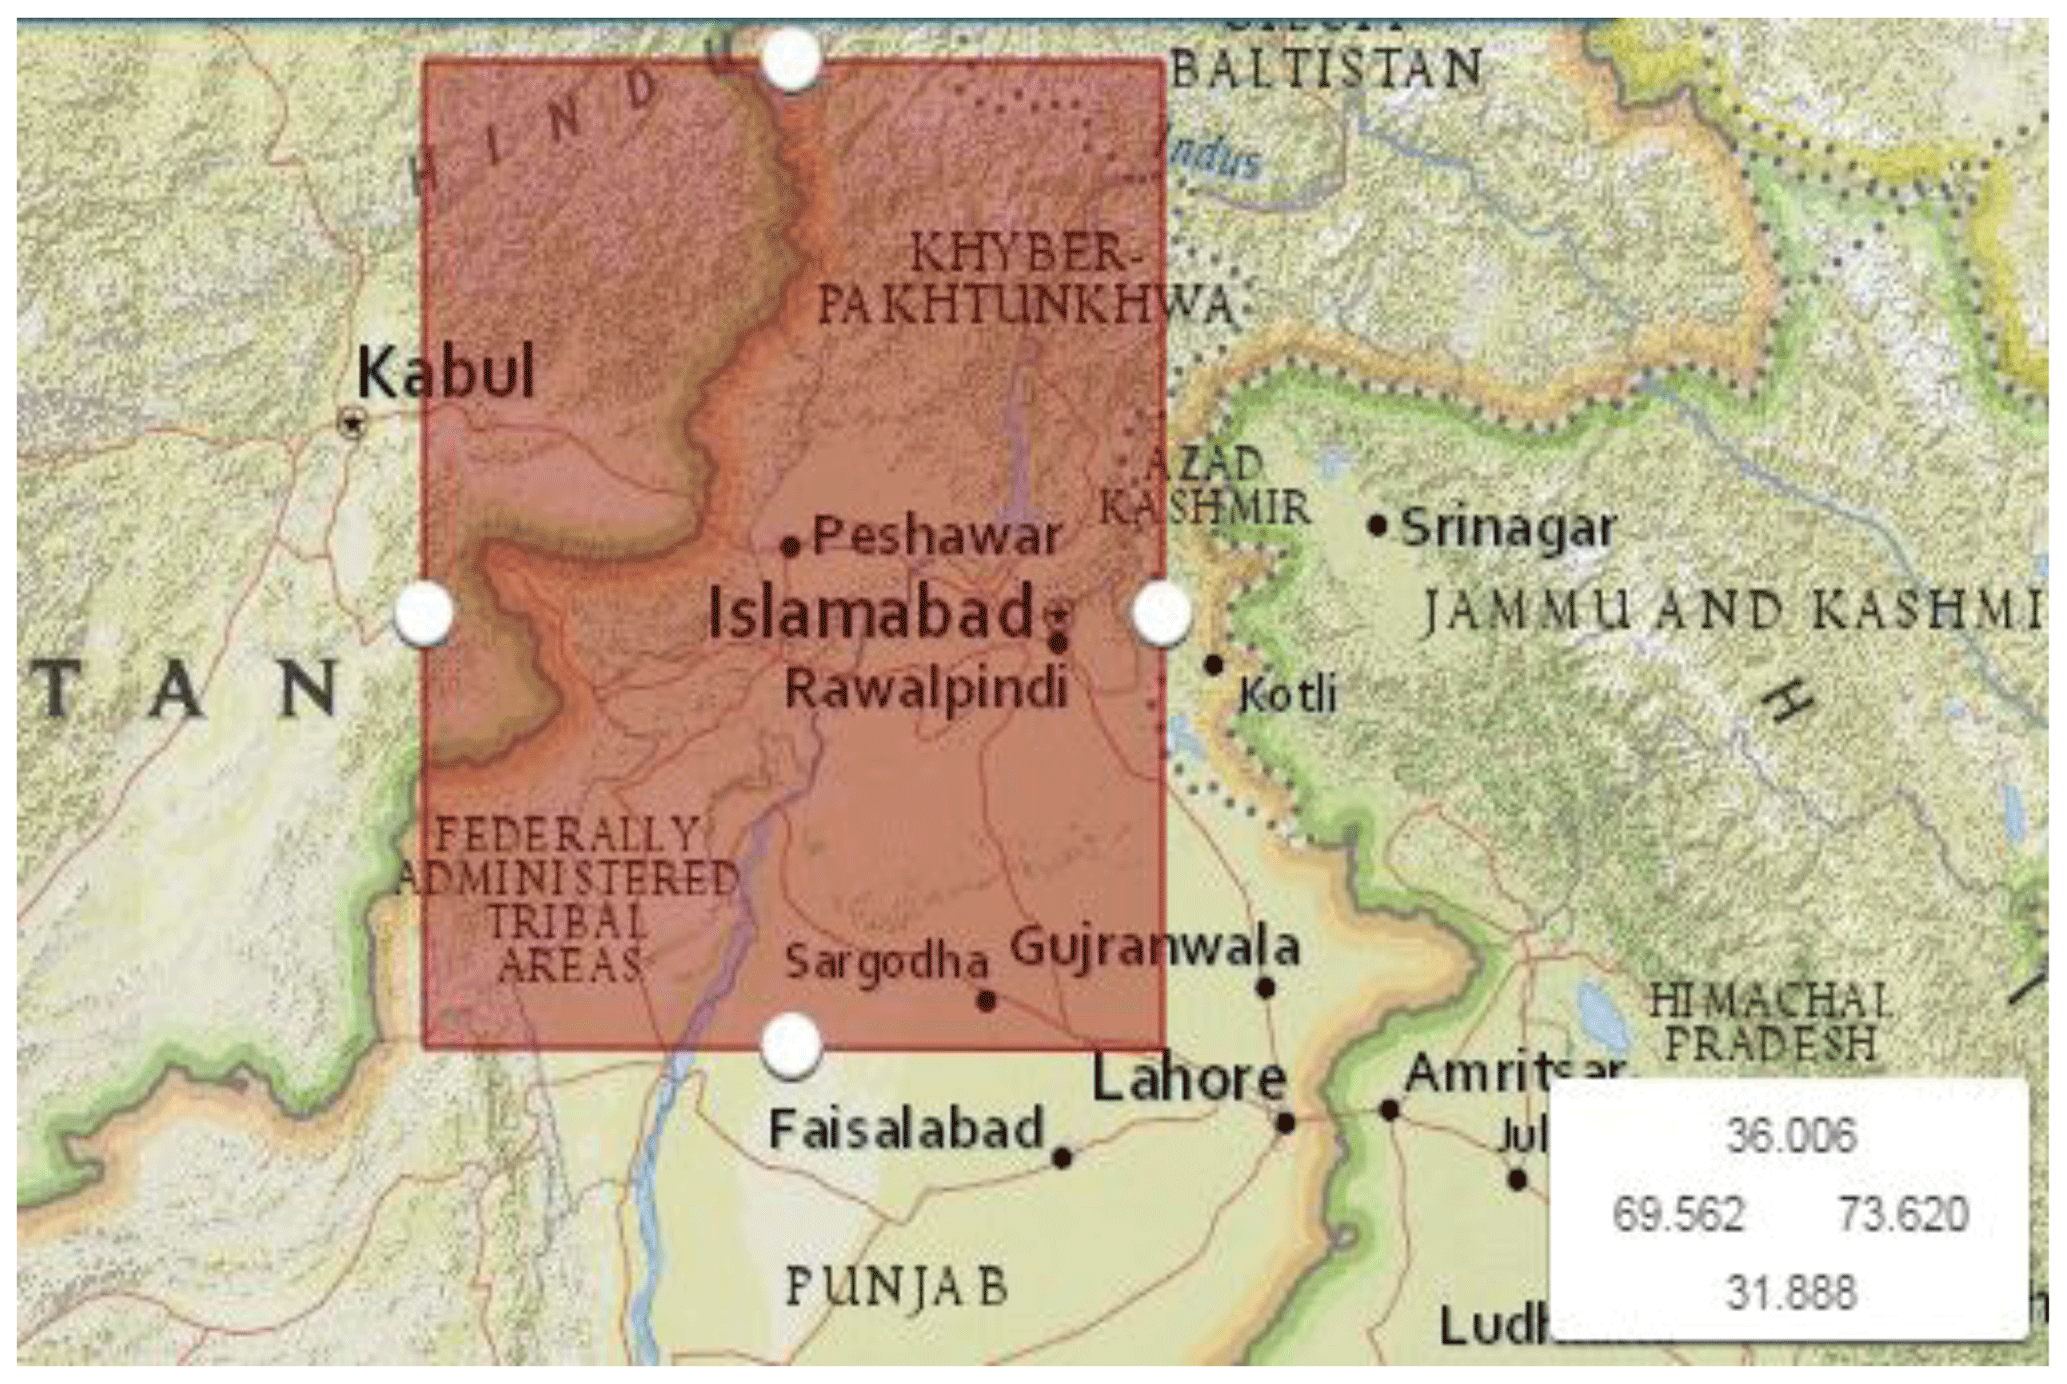
Figure 4Seismic source identification with defined latitude and longitude. © Google Maps.
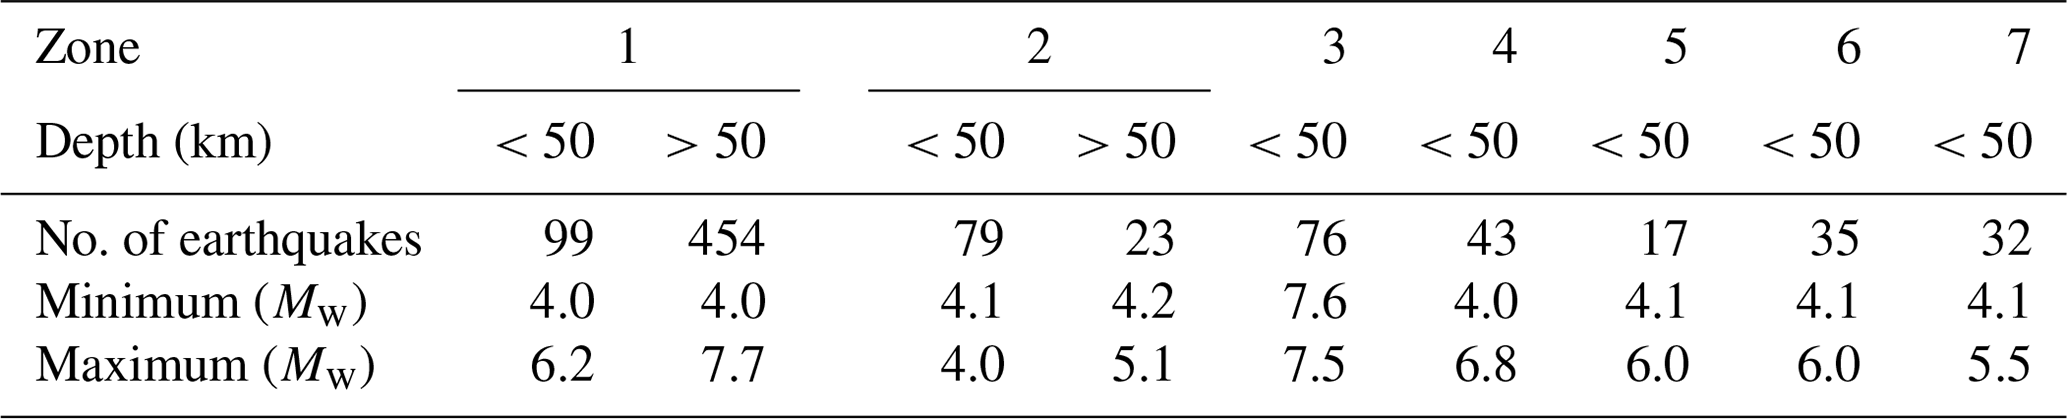
The homogenized catalogue was further subdivided into shallow (depth less than 50 km) and deep (depth more than 50 km) earthquake events. Figure 6 shows the shallow and deep earthquake records along with seismic zones as defined in BCP (2007). Furthermore, Table 2 reports the number of earthquakes in each seismic source along with the maximum and minimum magnitude of each source. Deep earthquakes were found primarily in seismic source 1 and seismic source 2 which included the Hindu Kush seismic region. The deep sources were selected in consultation with the National Centre of Excellence in Geology, Peshawar since deep sources had not been studied before for Peshawar.
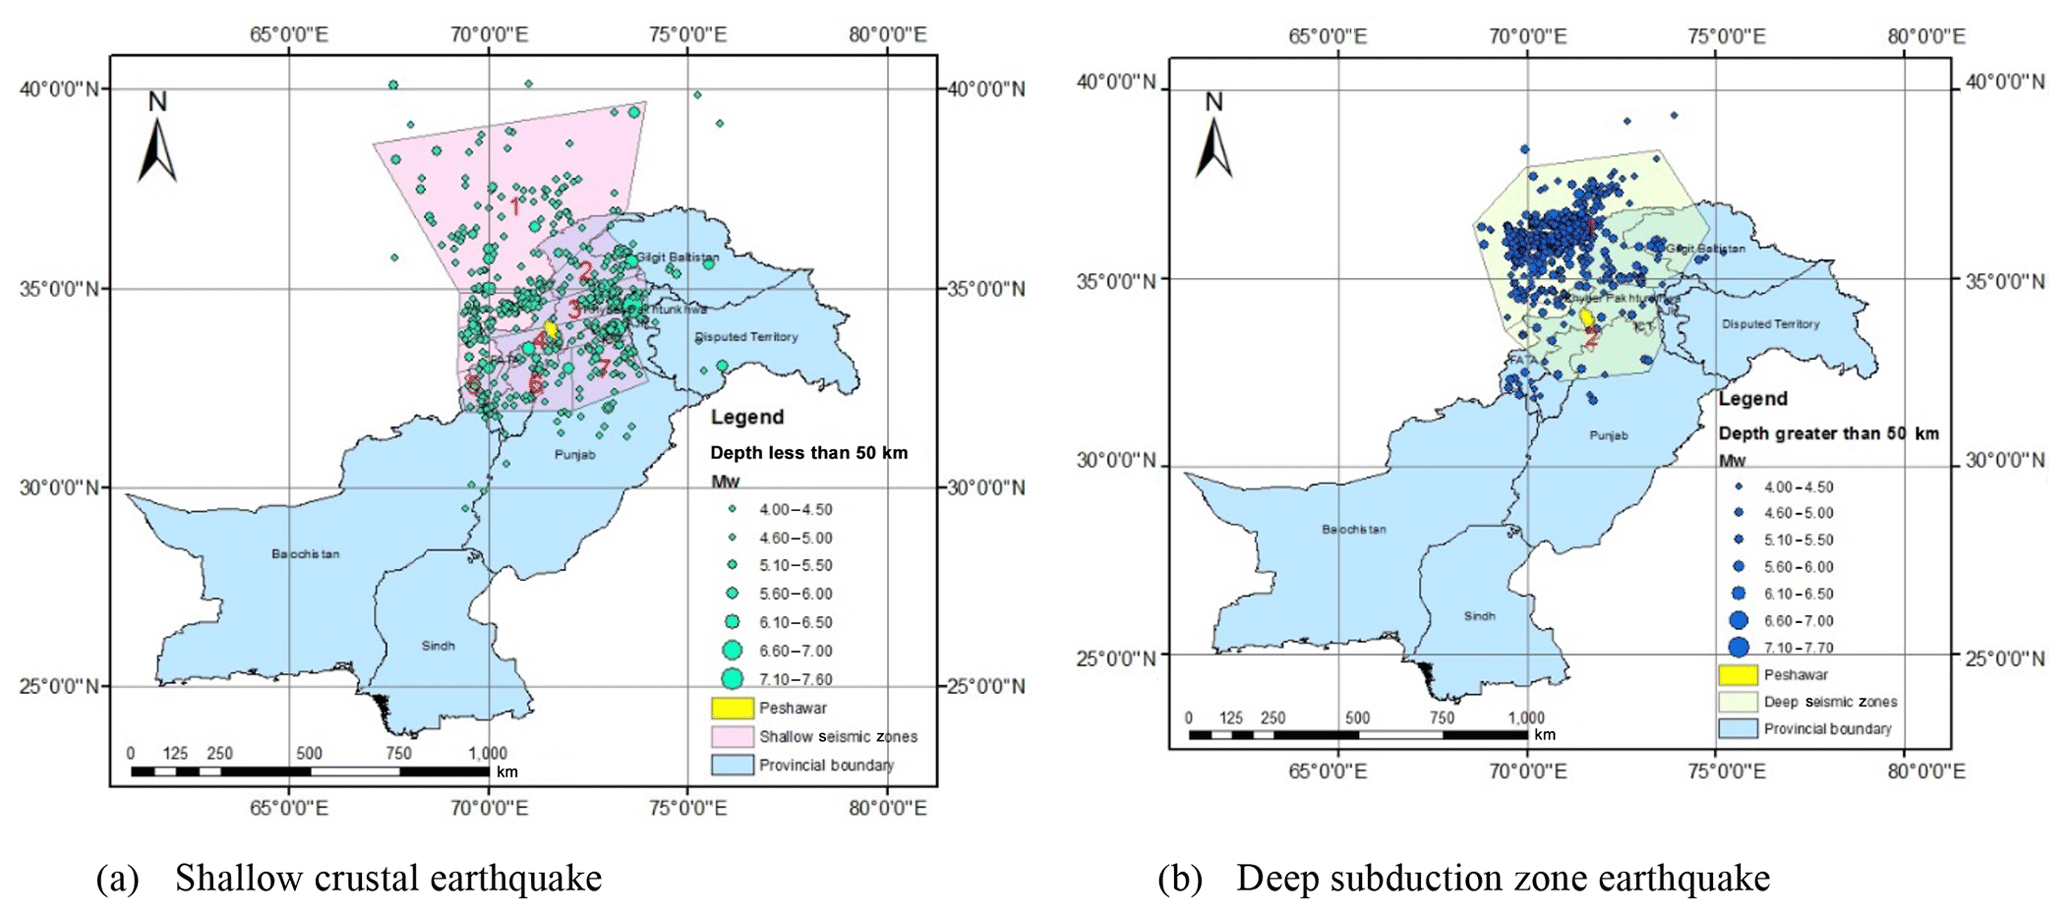
Figure 6Earthquake records from homogenized catalogue and with defined seismic sources.
Table 2No. of earthquakes and minimum and maximum magnitude in shallow and deep seismic source.
4.2 Processing of earthquake catalogue
4.2.1 Declustering
In seismic hazard analysis the probability of earthquake occurrence is considered to follow a Poisson process, which considers the independent events to occur randomly in time and space. Only the main shocks are considered for hazard analysis. This is to avoid overestimation of the seismic hazard. The dependent events (foreshocks and aftershocks) are temporally and spatially dependent on the main shocks. For this purpose declustering was performed to remove the dependent events for the catalogue. The Gardner and Kenopoff (1974) declustering algorithm method was used for removing foreshocks and aftershocks. This performs a windowing procedure in time and space on the event magnitude to identify the dependent events. To perform this analysis ZMAP coding developed by ETH Zurich (freely available) was used. The homogenized catalogue was converted into ZMAP-specified format to perform the routine analysis. A total of 926 independent events remained after declustering.
4.2.2 Completeness analysis
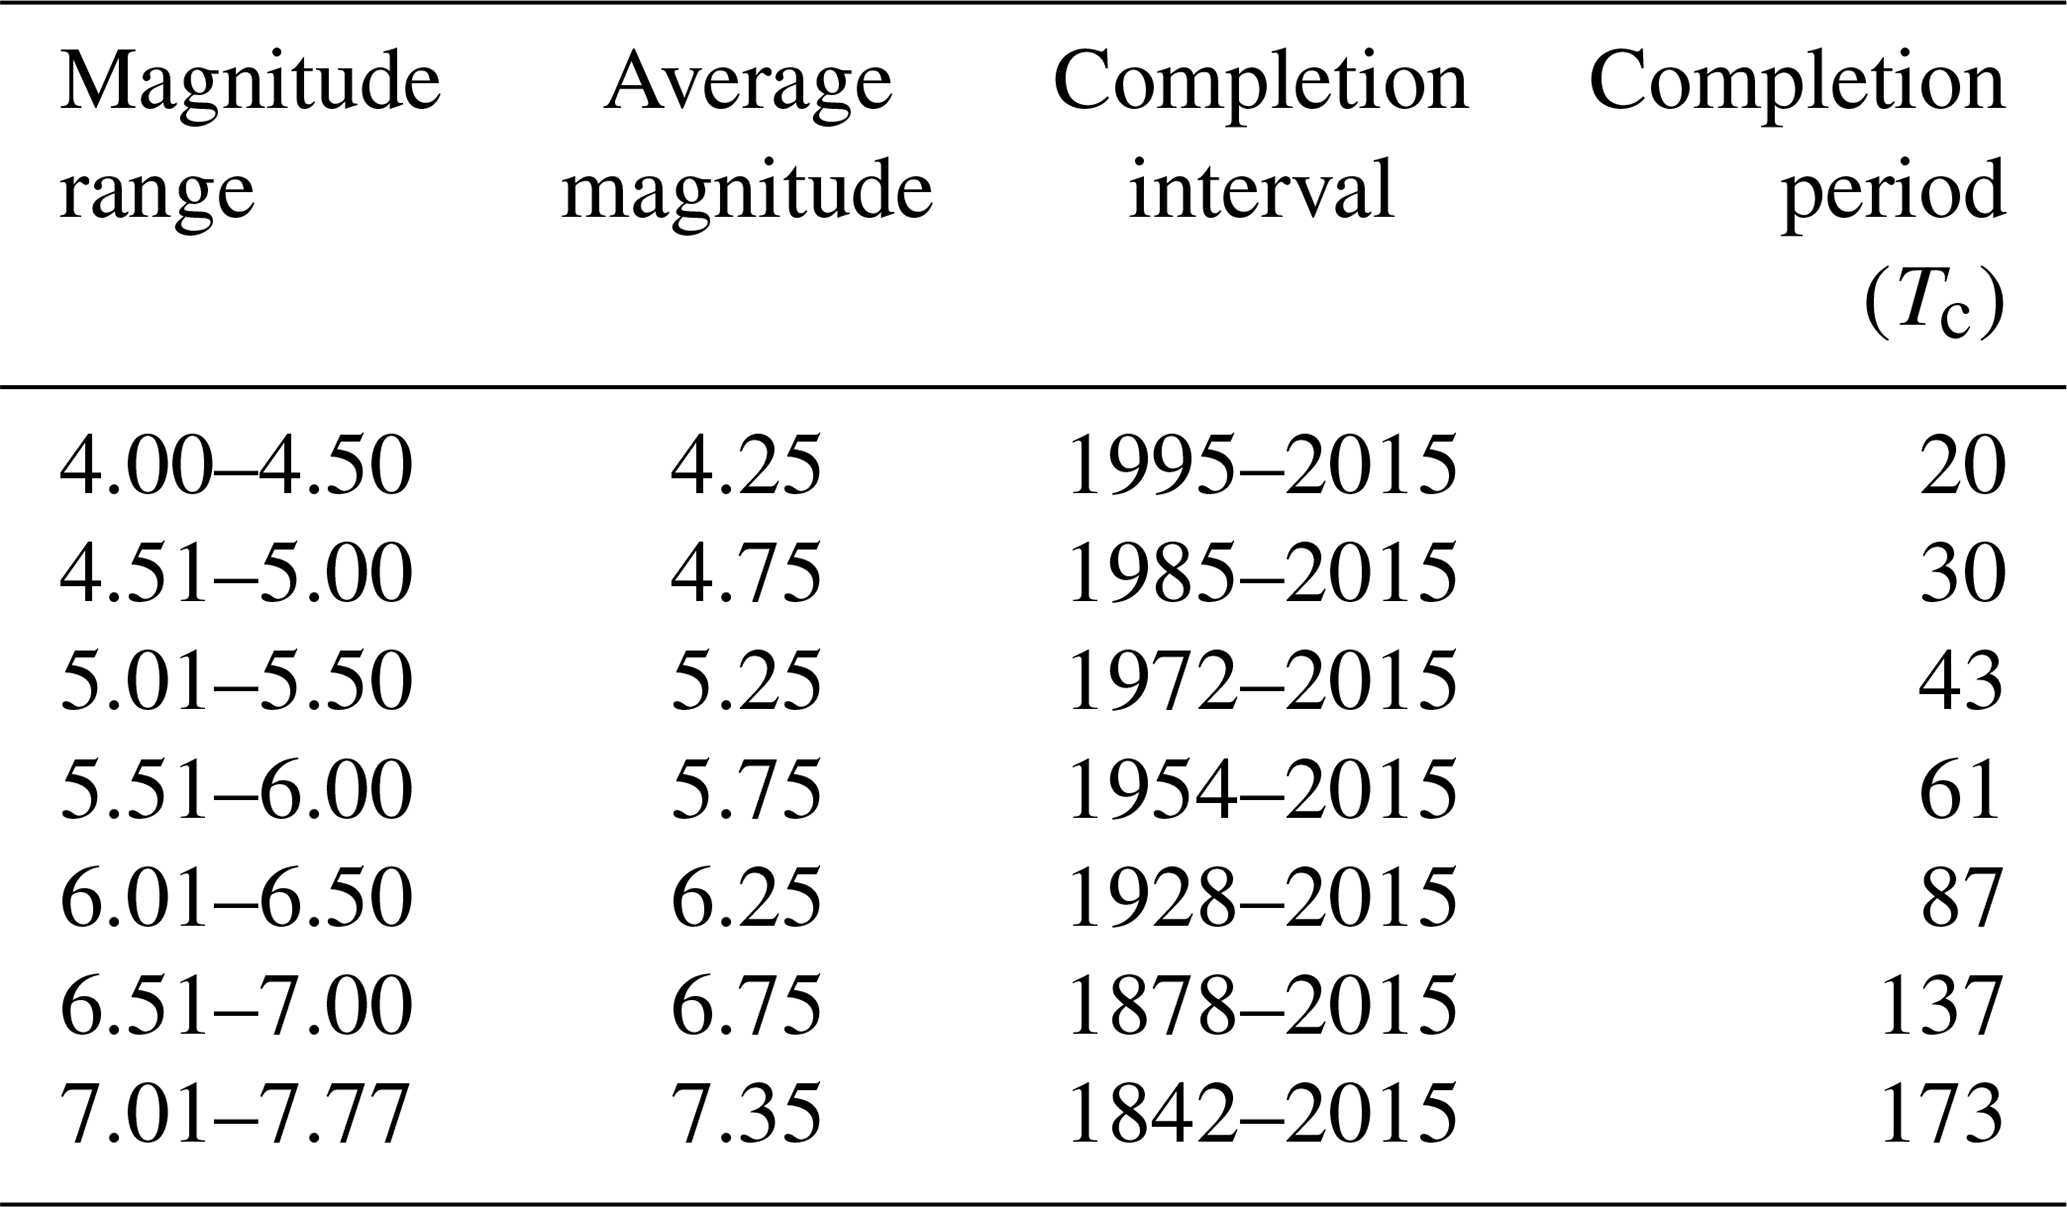
The catalogue also report events from very far in the past, which cannot be considered complete for all the magnitudes and the whole time span. The time window starts from the year 1500; however, since then the catalogue has not been updated on a regular basis. The instrumental observation of seismic data started after 1960, and it now observes and documents complete details of the earthquake events on a regular basis. Due to these reasons the specified time window (1500–2015) cannot be considered in obtaining the activity rate, as this would result in the underestimation of the activity rate. For this purpose completeness analysis was performed using the visual cumulative method (CUVI) proposed by Mulargia and Tinti (1985). It is a simple procedure based on the observation that earthquakes follow a stationary occurrence process. It is used to find the completion point (CP) after which the catalogue is considered to be complete (Tinti and Mulargia, 1985). The procedure is to divide the magnitudes from 4 to 8 into various bands with a 0.5 step size. The selected bands are 4.00 to 4.50, 4.51 to 5.00, 5.01 to 5.50, 5.51 to 6.00, 6.01 to 6.50, 6.51 to 7.00 and 7.01 to 7.7. In each band the cumulative number of total earthquakes is plotted against the year of earthquakes; the period of completeness (Tc) is considered to begin at the earliest time when the slope of the fitting curve can be well approximated by a straight line (Fig. 7). Table 3 reports the completeness points and time periods for each magnitude band.
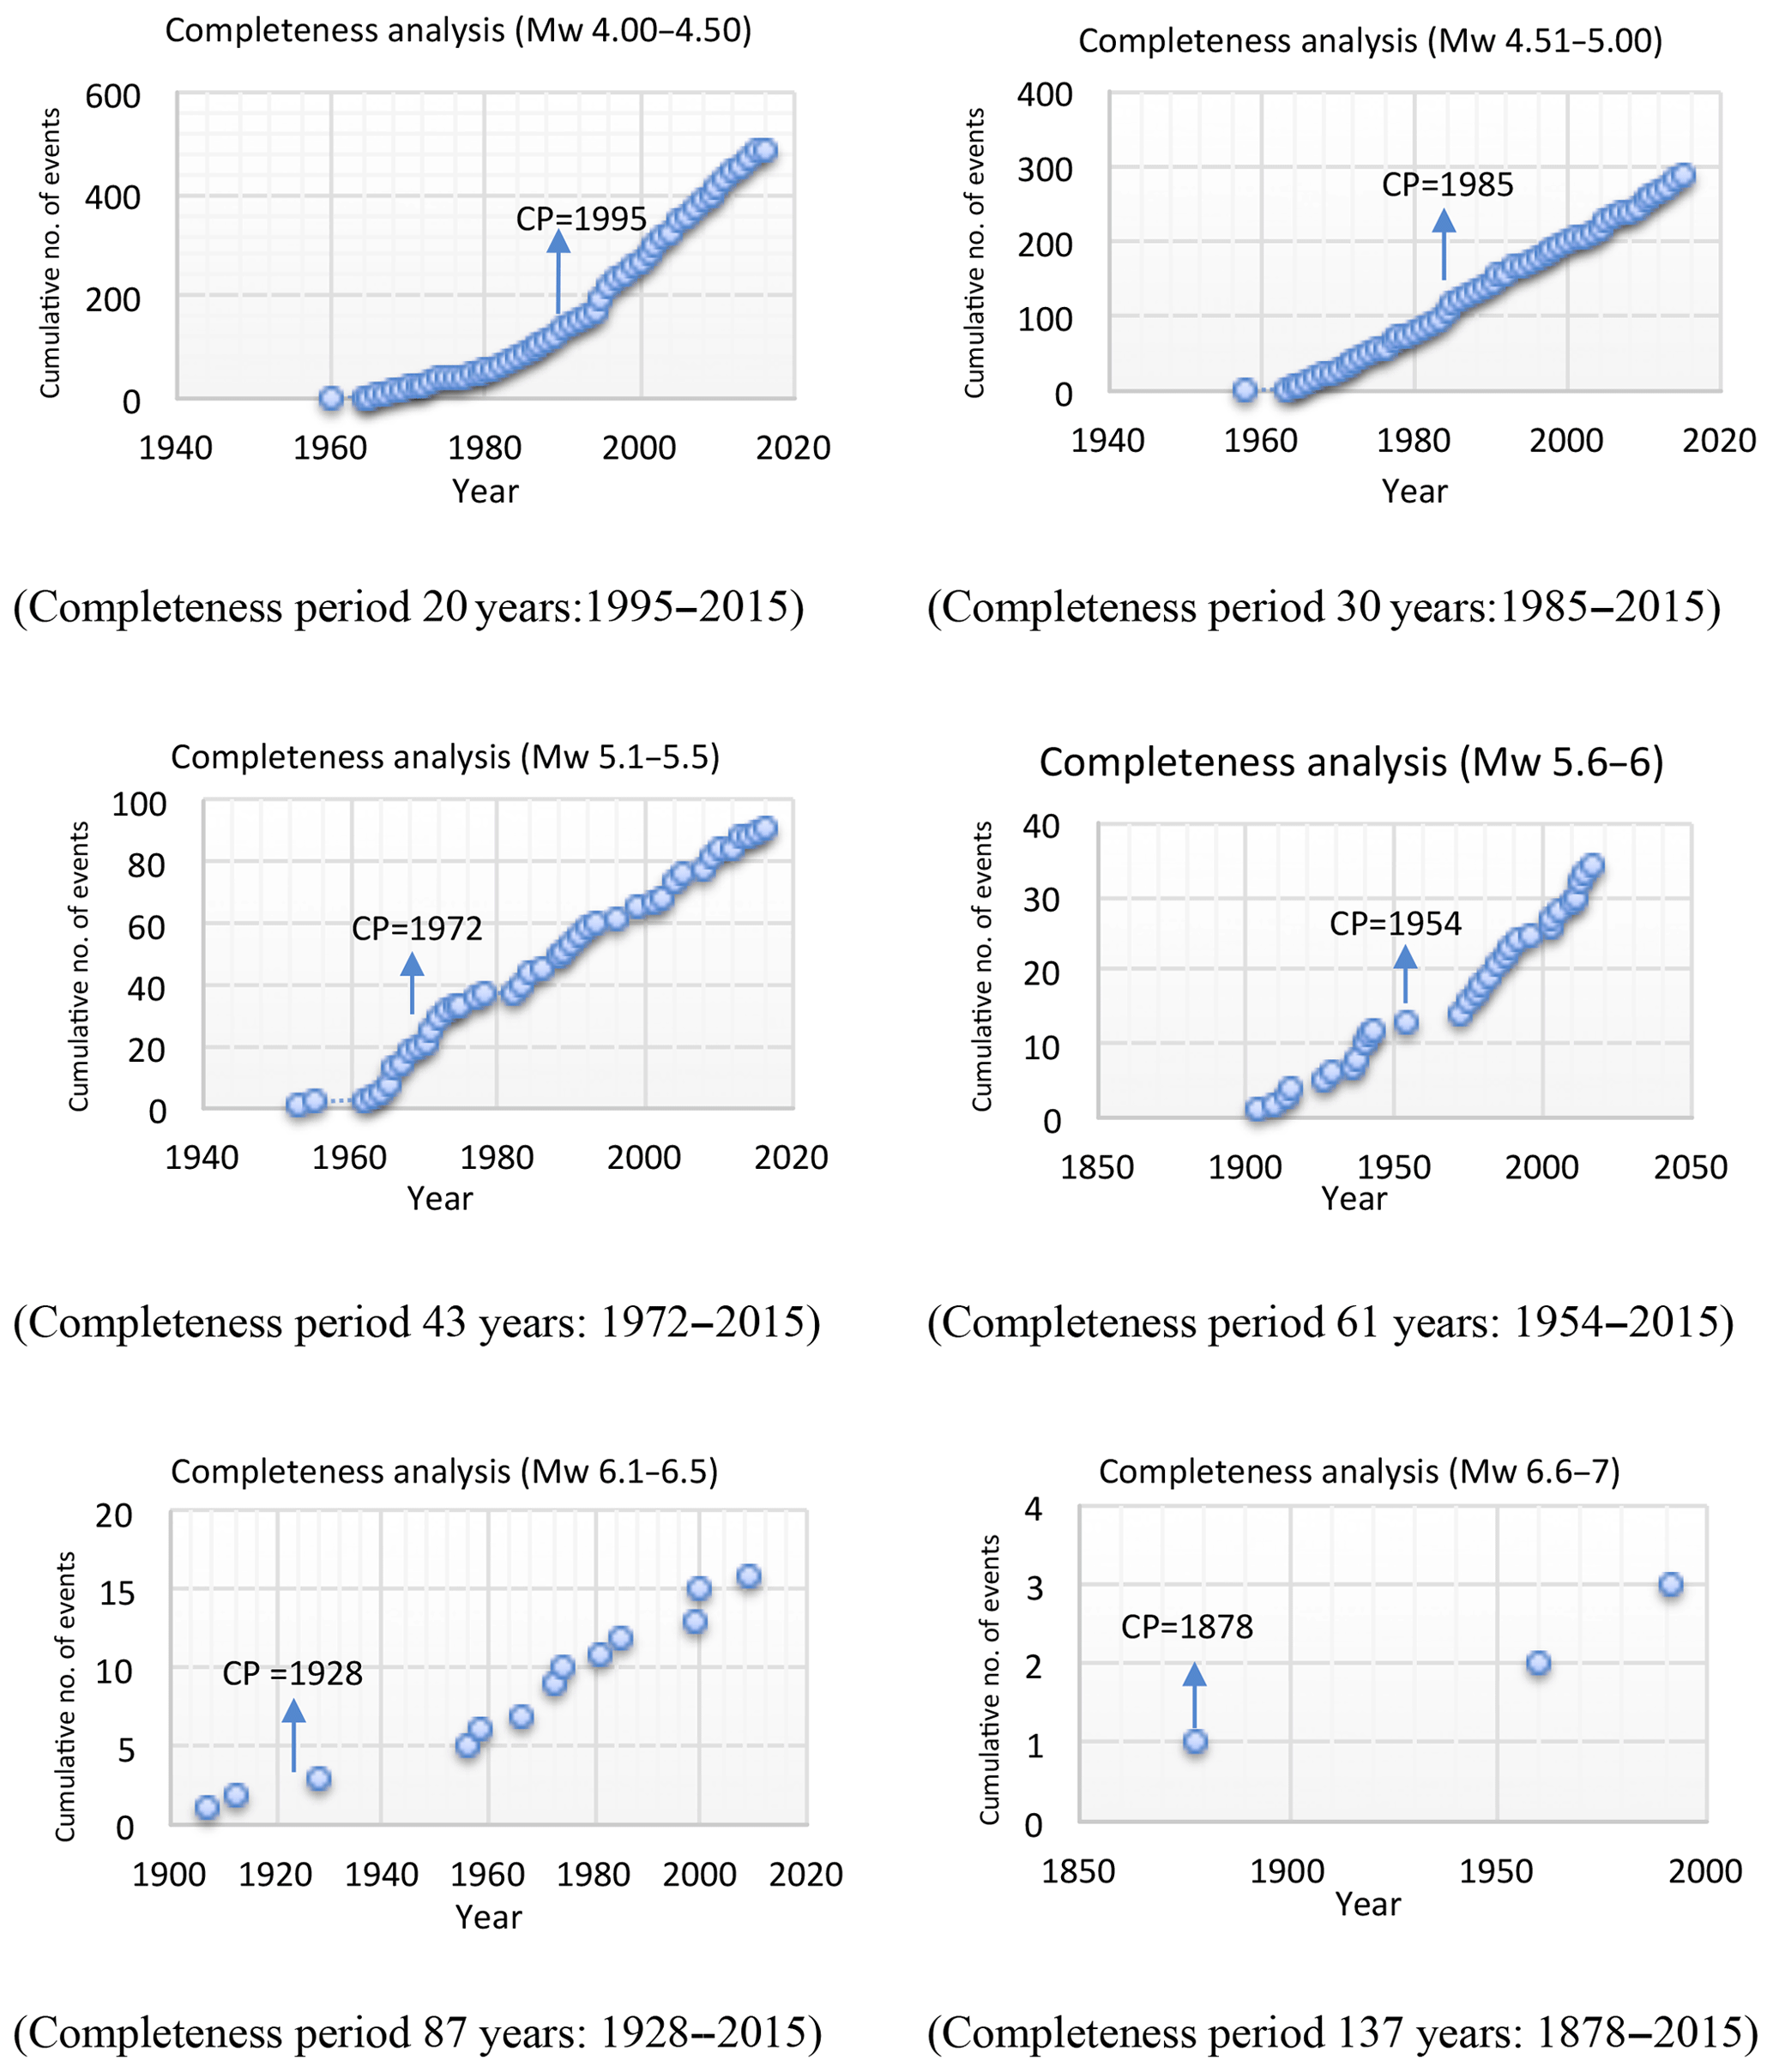
Table 3Completeness intervals and completion period of each magnitude band.
4.3 Seismic source parameters
The modified Gutenberg–Richter (G–R) reoccurrence law, as mentioned earlier, was used in the present seismic hazard analysis to characterize the G–R parameters. The seismic source parameters (i.e., η0, β) were calculated from setting a linear trend line to the graph between and Mw as shown in Fig. 8 for both shallow and deep earthquakes for all seismic zones. Table 4 reports the seismic sources' G–R parameters for all seismic sources for both shallow and deep earthquakes.
Table 4Seismic source parameters for shallow and deep sources.
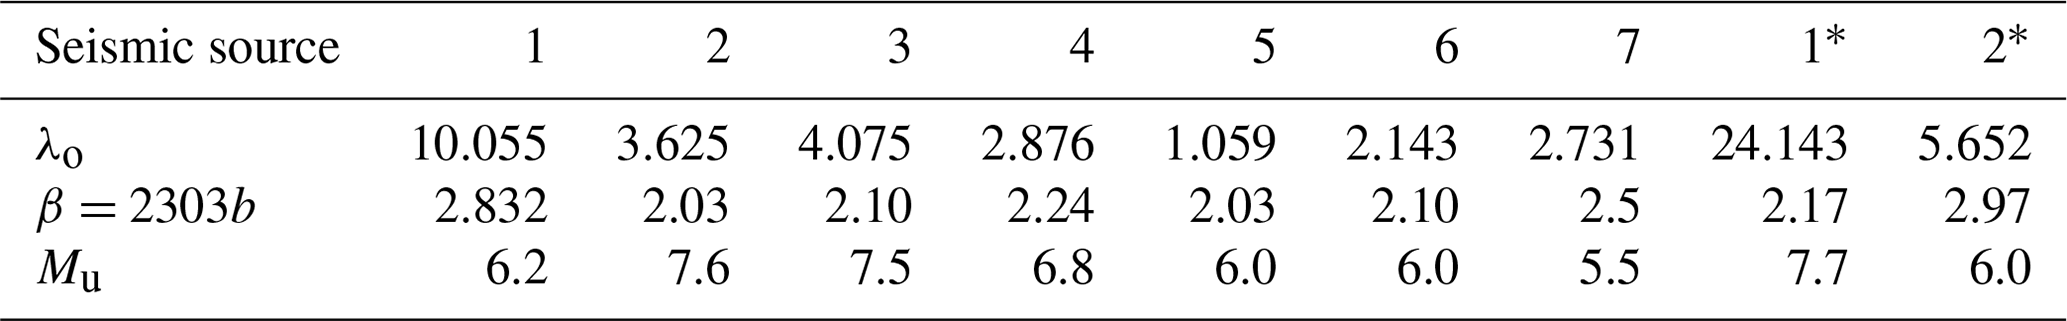
1–7 are shallow seismic sources and 1* and 2* are deep seismic sources.

4.4 Attenuation relationships and peak ground acceleration
The attenuation relationships for a site are developed using substantial dataset information (Cotton et al., 2006); however, this is not available for Pakistan because of the scarcity of available strong-motion data. The alternative to this is to use the already-available attenuation relationships of other regions which have similar tectonic and geological conditions to Pakistan. In the case of shallow earthquakes, the candidate attenuation relationships for north Pakistan should be the ones developed for the active tectonic crustal earthquake region. Thus, the ground motion attenuation relationships of Akkar and Bommer (2010) and Boore and Atkinson (2008) were used to calculate the PGA for shallow seismic sources. However, the ground motion attenuation relationships of Lin and Lee (2008) and Kanno et al. (2006) developed for subduction zones were used for deep seismic sources. The seismic hazard in terms of PGA was then calculated at the bedrock site for different return periods, such as 50, 100, 250, 475 and 2500 years, as the cumulative seismic hazard due to both shallow and deep seismic sources. The various ground motion prediction equations (GMPEs) were combined through a logic tree approach and assigning equal weightings to each GMPE. The ground motions calculated were plotted in a GIS environment to obtain the seismic hazard maps for these different ground motion attenuation relationships.
4.5 Seismic hazard maps
The seismic hazard levels (Table 5), based on peak acceleration, defined in BCP (2007) were considered as a basis for the zoning of the seismic hazard at bedrock level.
Table 5Seismic hazard levels used for seismic zoning, obtained from BCP (2007).

The seismic hazard maps for a return period of 475 years in the case of shallow crustal earthquakes on the one hand and deep earthquakes on the other for Peshawar District are reported in Figs. 9 and 10, respectively. Figure 9 shows that for a return period of 475 years, the predictive relationship of Akkar and Bommer (2010) overestimates the PGA value in comparison to that of Boore and Atkinson (2008), especially in the northern parts of the district. According to Arango et al. (2012), the distance scaling factor of the latter appears to be more adequate then the previous. Furthermore, Table 6 shows a slight comparison of both ground motion prediction equations that suggests that in terms of NR (number of records), Tmax (longest response period), Mw (moment magnitude) and [R] (distance range), the prediction equation of Boore and Atkinson (2008) is more appropriate and reliable than that of Akkar and Bommer (2010) for hazard assessment.
Table 6Comparison of predictive equations used for shallow crustal earthquake (after Arango et al., 2012).

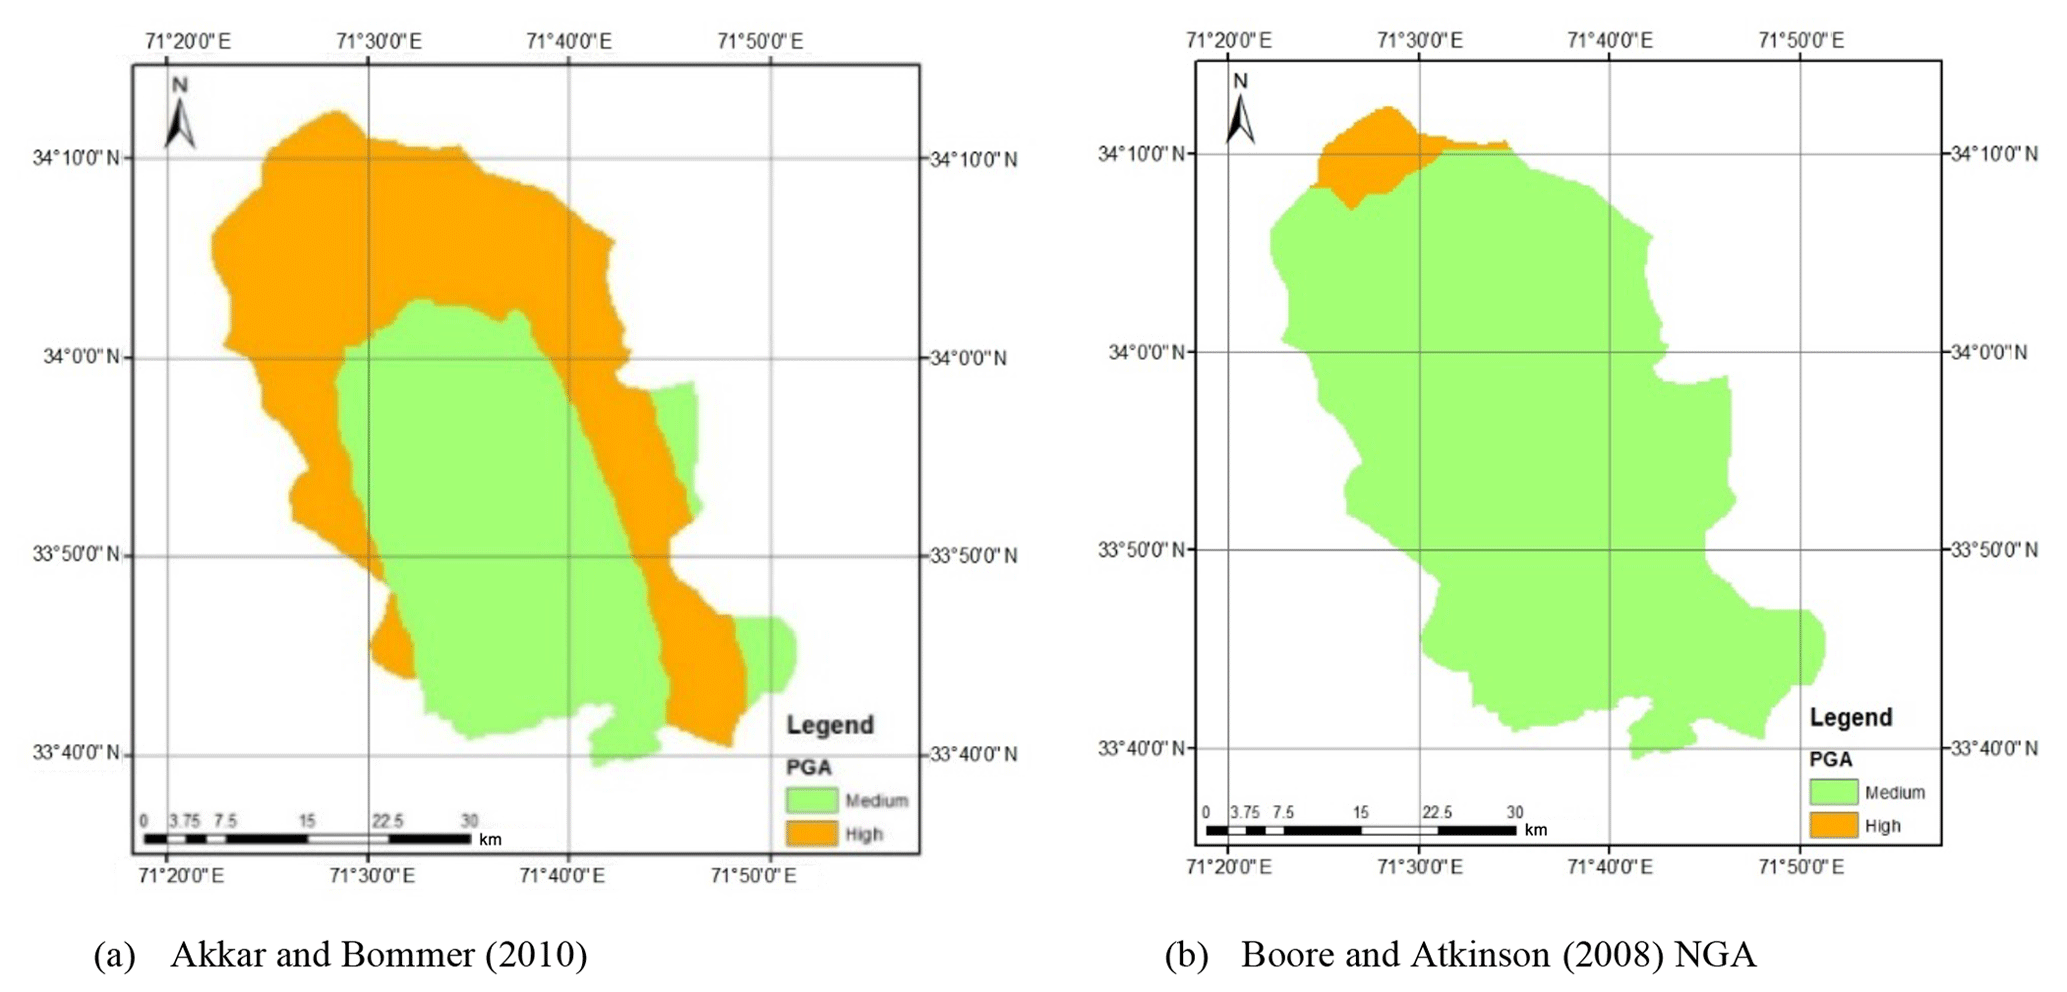
Figure 9Seismic hazard maps for shallow crustal earthquake using different attenuation equations.
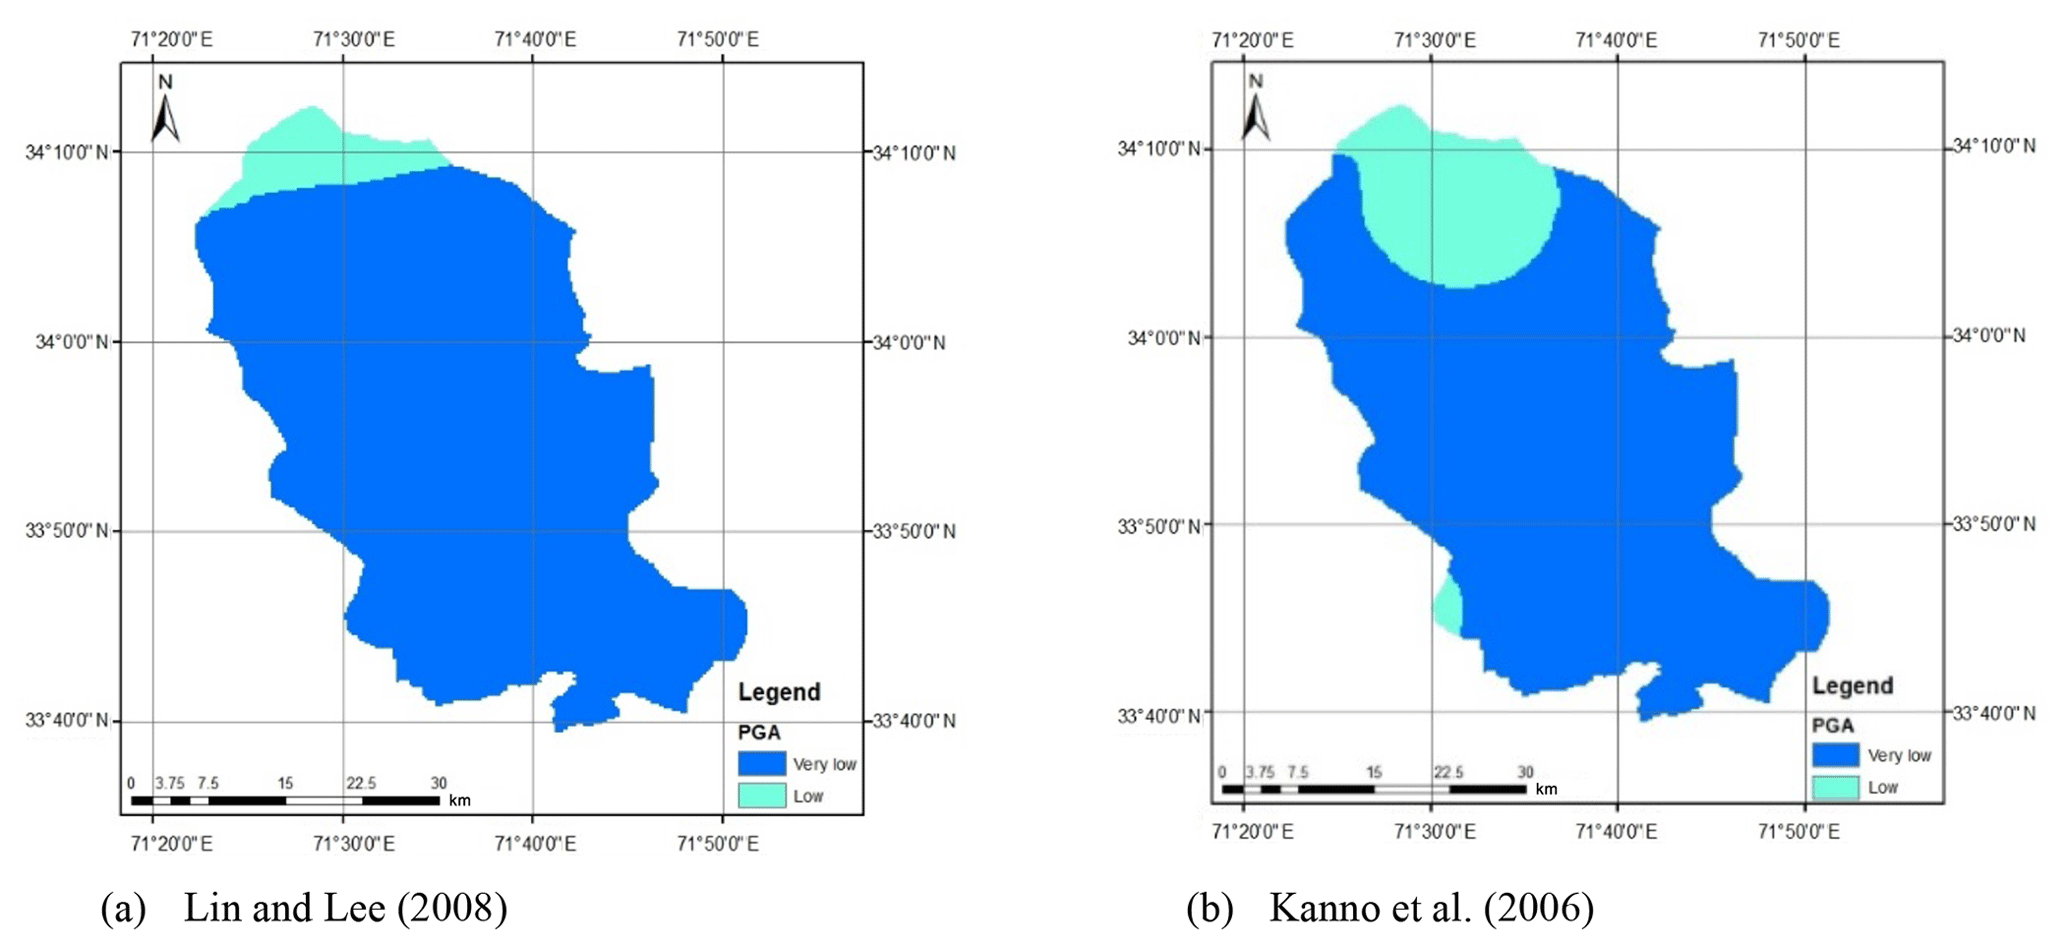
Figure 10Seismic hazard maps for deep subduction earthquake using different attenuation equations and for a return period of 475 years.
Figure 10 shows the seismic hazard maps for deep subduction earthquakes using the Lin and Lee (2008) and Kanno et al. (2006) attenuation equations for a return period of 475 years. According to Fig. 10 both the attenuation equations resulted in roughly similar seismic hazard for Peshawar District. Furthermore, it is also evidenced from Fig. 10 that the inclusion of deep subduction zones in the seismic hazard does not contribute significantly; i.e., it remains low (0.08–0.16 g) to very low (<0.08 g). The cumulative seismic hazard may slightly increase the ground motion level, especially in the northern parts.
In probabilistic seismic hazard analysis (PSHA), one of the major sources of uncertainty is the epistemic uncertainty arising from the selection of predictive relationships. Thus, the different ground motion attenuation relationships already discussed were further used to find out the epistemic uncertainty in the seismic hazard analysis. This was accomplished through the logic tree approach, assigning an equal weighting factor to each GMPE (Fig. 11); the seismic hazard was combined from all the GMPEs.
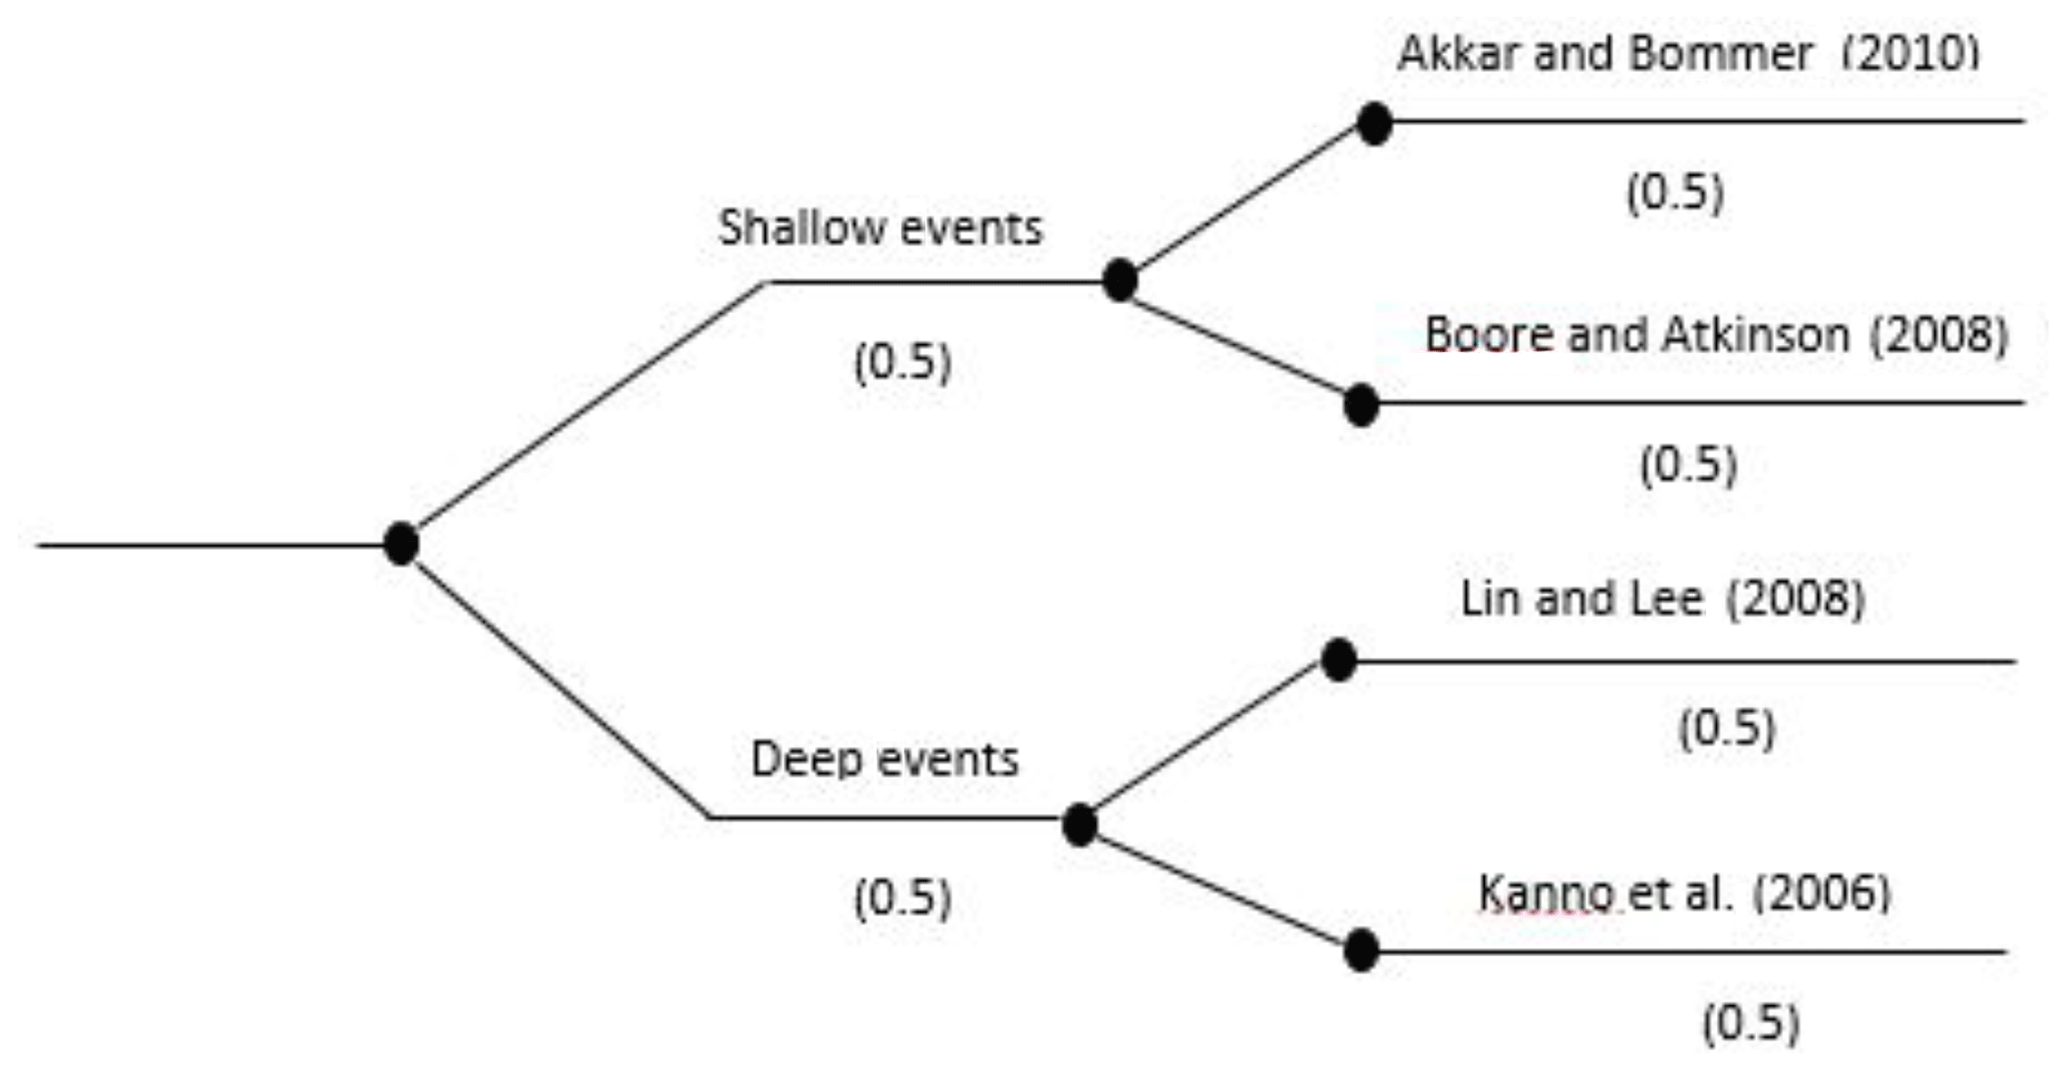
Figure 12 shows the seismic hazard maps for shallow and deep events after incorporating the epistemic uncertainty. As can be seen in Fig. 12a, the seismic hazard of Peshawar District becomes balanced when the average of the seismic hazard calculated using the Akkar and Bommer (2010) and Boore and Atkinson (2008) predictive equations was taken. The reason for this is the provision of equal weighting to both the predictive relationships in hazard analysis. The seismic hazard in the case of deep-subduction-zone earthquakes remains roughly the same after incorporating epistemic uncertainty (Fig. 12b). It can also be further concluded that the earthquakes produced by deep subduction zones are not significant in terms of seismic hazard and may be reasonably ignored. Thus, the shallow seismic sources are sufficient for the seismic hazard assessment of Peshawar. The calculated seismic hazard map after incorporating epistemic uncertainty is compared with the hazard map from BCP (2007). For the return period of 475 years, a close agreement between the two seismic hazard maps can be noticed (Fig. 13). After this check the seismic hazard maps for other return periods, i.e., 50, 100, 250, 475 and 2500 years, were prepared (Fig. 14), which may be used for seismic risk assessment. Hazard maps for various cases are reported in Fig. A1 through Fig. A8.
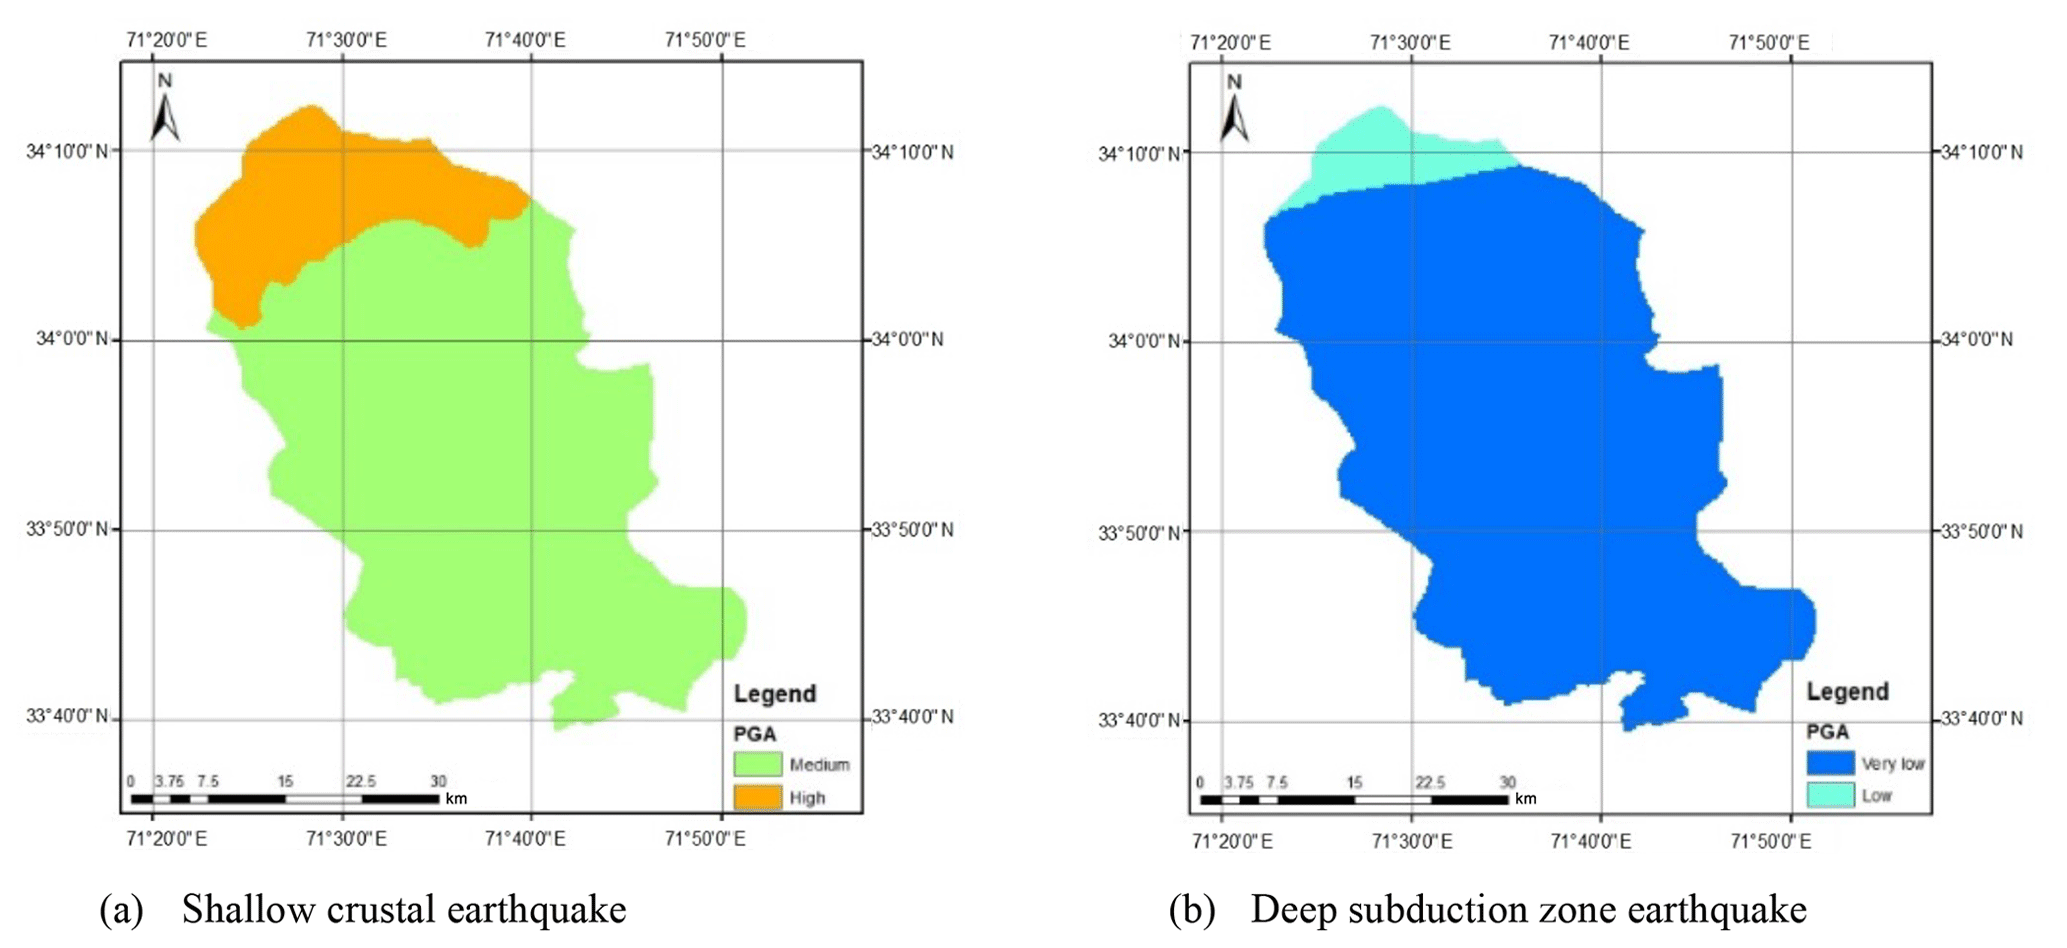
Figure 12Seismic hazard maps after incorporating epistemic uncertainty for 475-year return period.
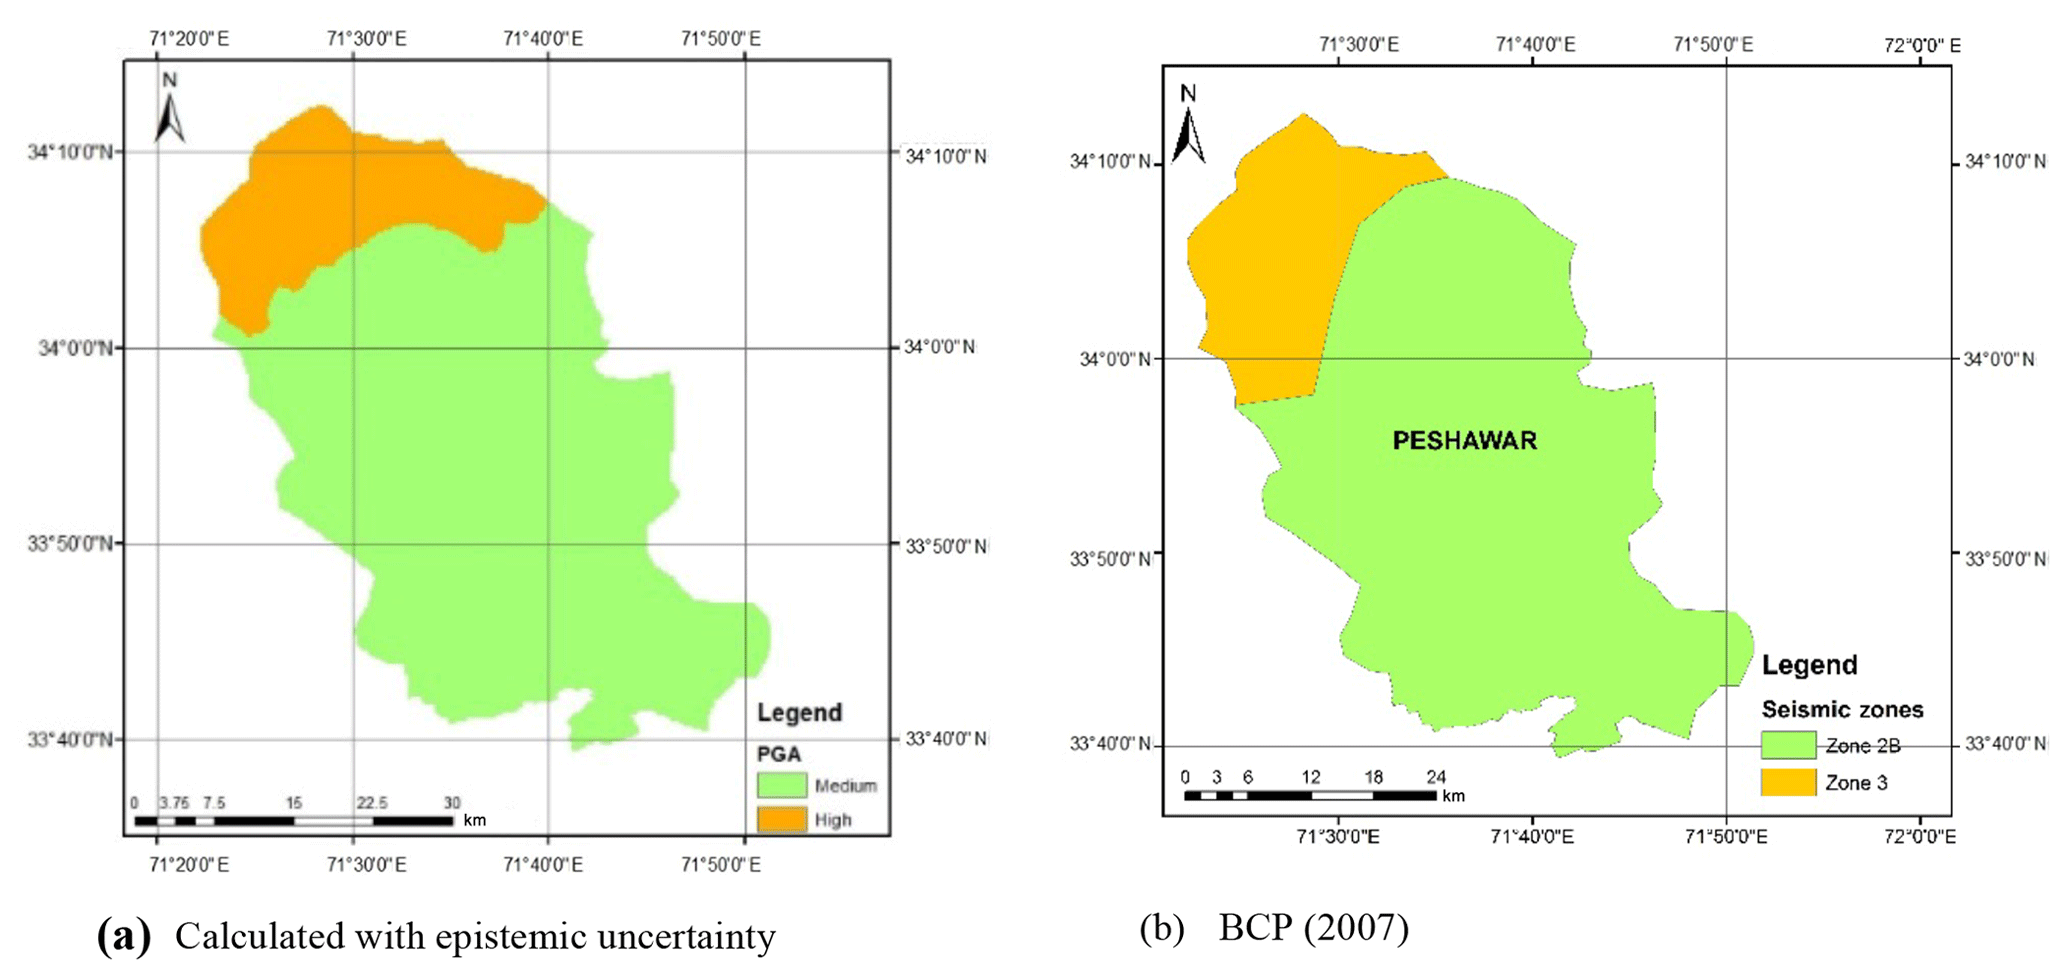
Figure 13Comparison of seismic hazard maps for a return period of 475 years.
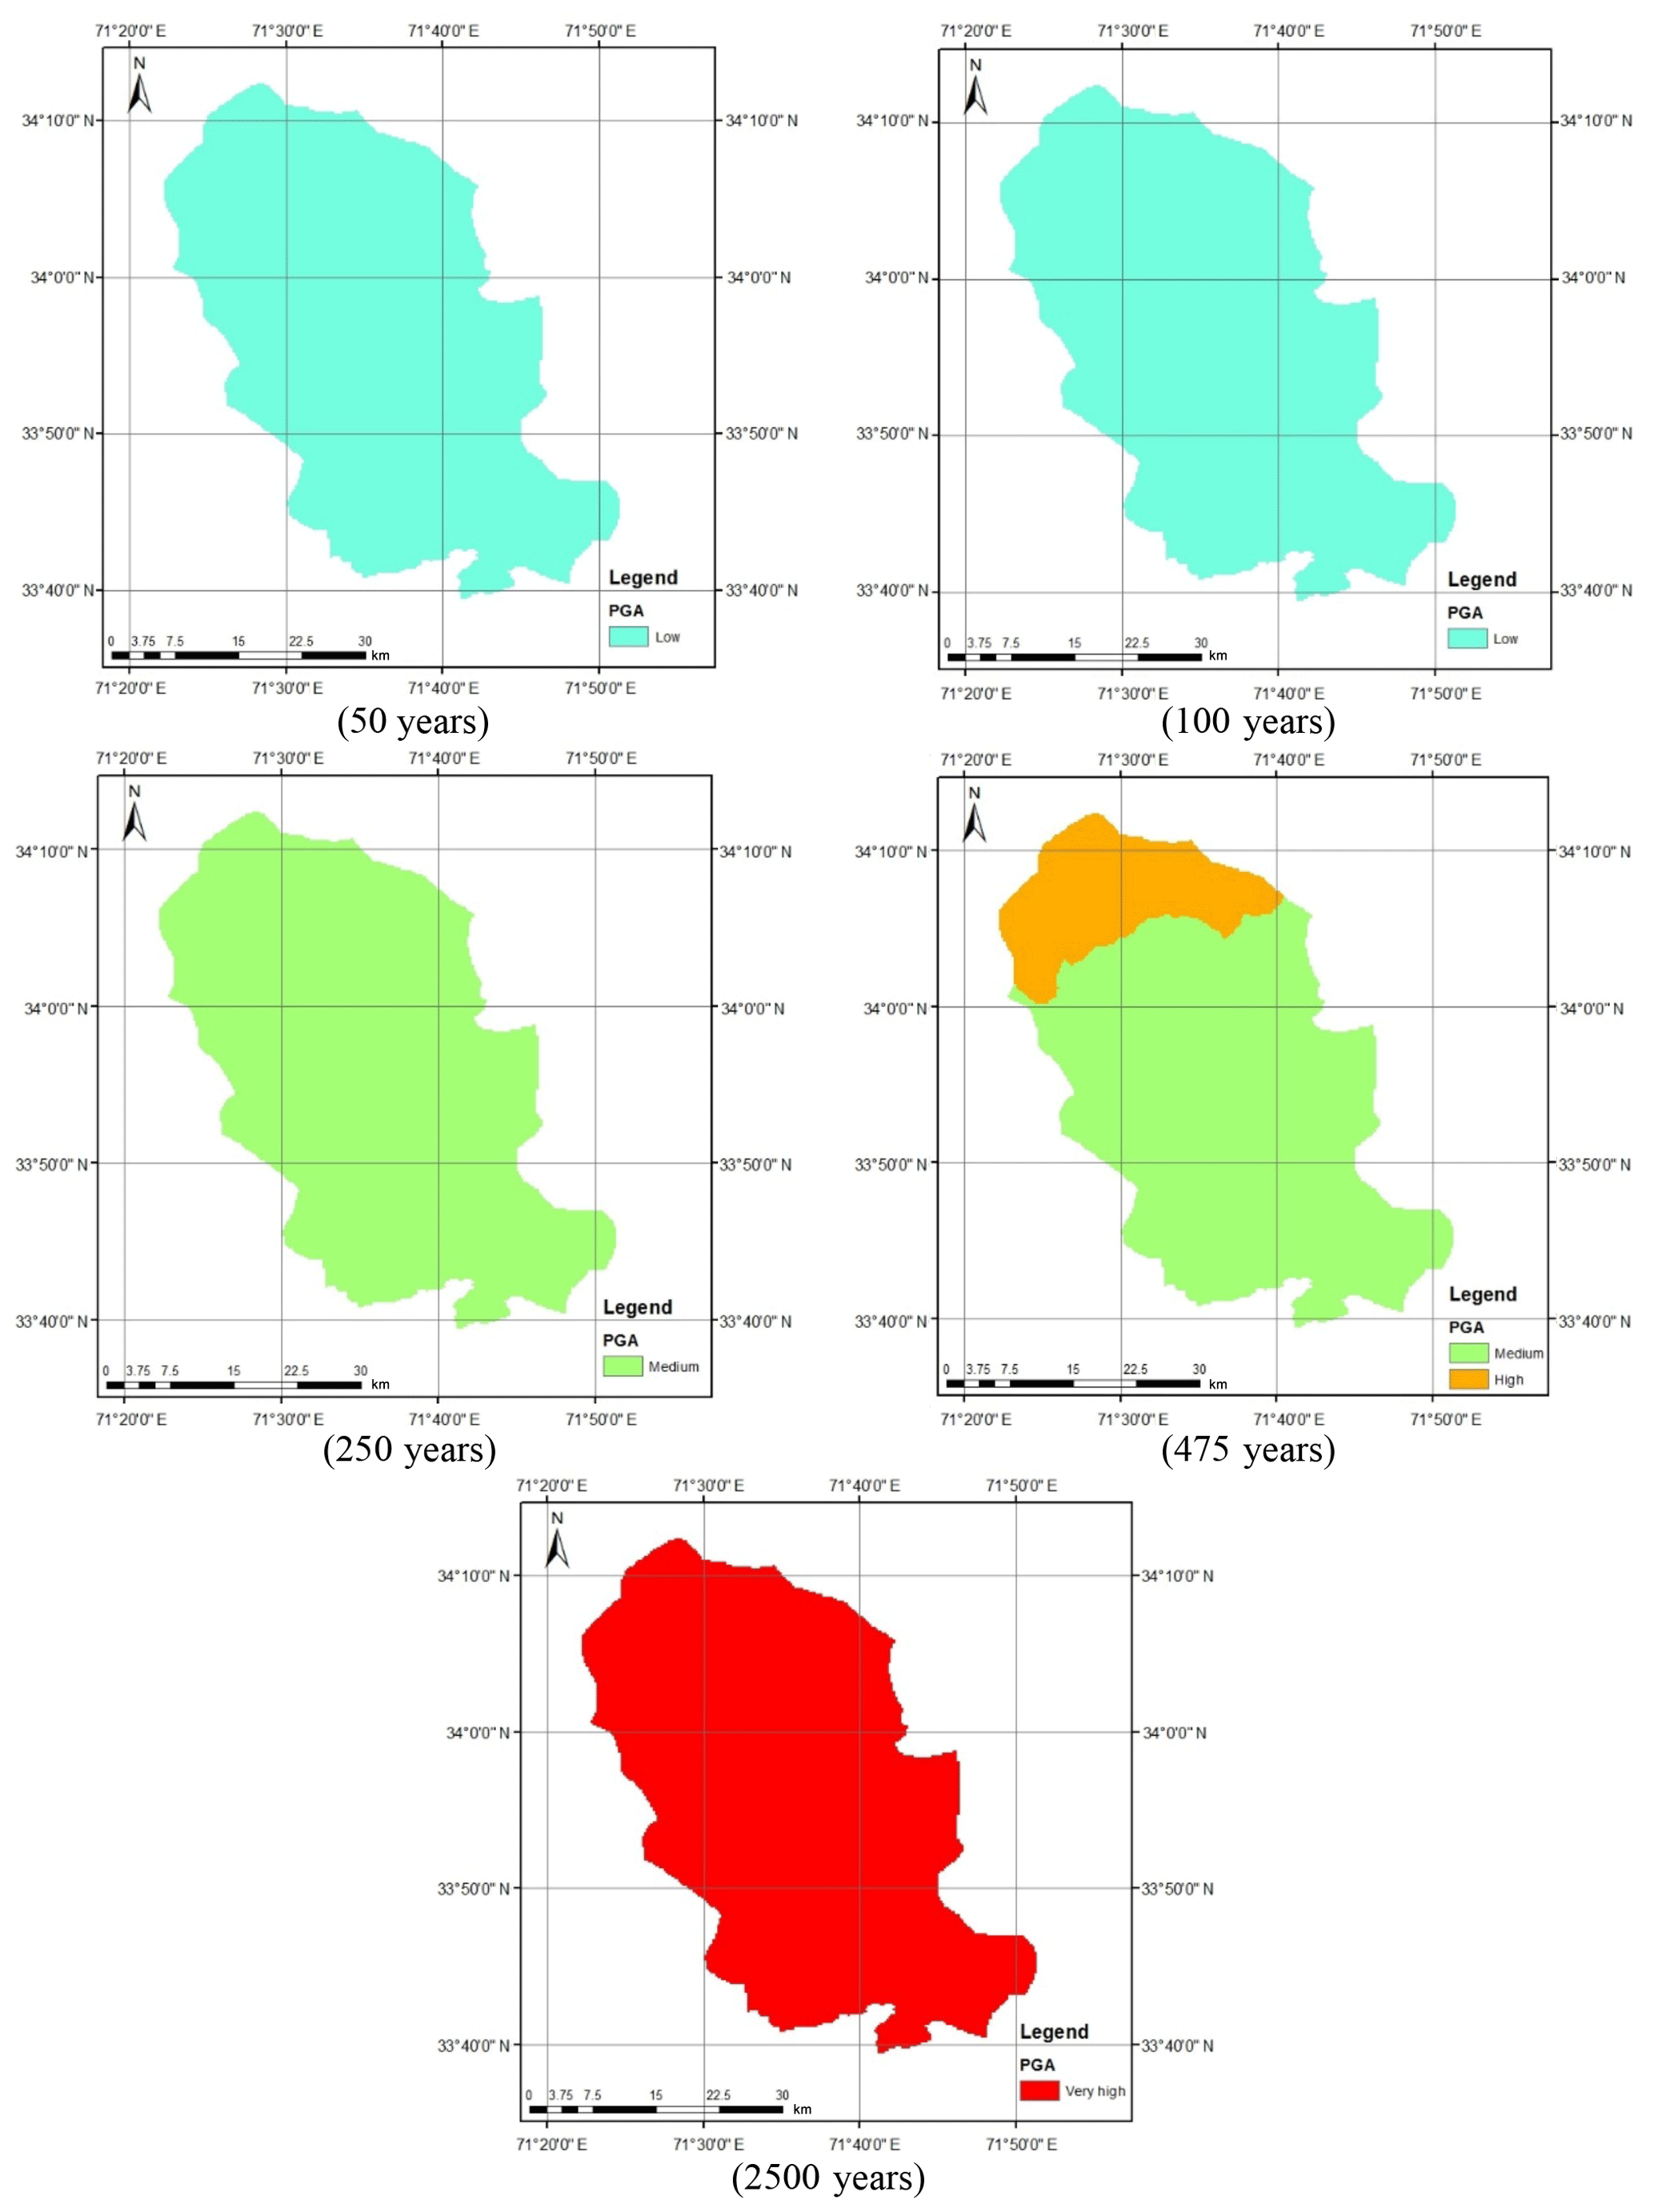
Figure 14Mean seismic hazard maps for various return periods, i.e., 50, 250, 475 and 2500 years, considering all GMPEs and both shallow and deep earthquake sources.
The following was concluded on the basis of a literature review of past seismic hazard studies of Peshawar and classical PSHA conducted for Peshawar in the present study:
-
The selection of an appropriate ground motion prediction equation is crucial in defining the seismic hazard of Peshawar District. In the case of shallow crustal earthquakes, the predictive relationship of Akkar and Bommer (2010) provides a higher estimate of the PGA value in comparison to that of Boore and Atkinson (2008). The distance-scaling factor of the latter appears to be the reason for this disparity between the two models.
-
The inclusion of deep subduction earthquakes does not add significantly to hazard and may be neglected in terms of seismic hazard. Therefore, only the shallow crustal earthquakes contribute to the seismic hazard of Peshawar District. However, recent earthquakes in Peshawar from deep sources have caused widespread destruction in various parts of the district. This raises concern for the existing GMPEs and the classical PSHA procedure to simulate such effects.
-
The epistemic uncertainty was used by providing equal weighting to the attenuation equation of Akkar and Bommer (2010) and Boore and Atkinson (2008). The mean seismic hazard map thus produced was balanced and was found to be in close agreement with the design base seismic hazard given in BCP (2007) for bedrock hazard. However, the BCP places Peshawar in Zone 2B, which is reasonable for most of the locations, but it underestimates ground motions especially in northern parts of the district.
-
The mean seismic hazard calculated for Peshawar was also compared with previous studies (Table 7). It can be observed that the seismic hazard obtained by independent researchers suggests an average PGA equal to about 0.24 g, which is in agreement with the PGA = 0.24 g given in BCP (2007) for Seismic Zone 2B (0.16 to 0.24 g) for bedrock. The present PSHA study performed using the most up-to-date earthquake catalogue, recent GMPEs and considering both the shallow and deep seismic sources confirmed the validity of seismic hazard given in BCP (2007). It is worth mentioning that the calculated mean hazard may be approximated as the 50th percentile seismic hazard. Table 7 reports that recent hazard studies considering the fault sources have resulted in larger estimate of seismic hazard that place Peshawar in Seismic Zone 3 and Zone 4; however, the idealization of seismic sources as discrete faults for Peshawar is not reliable due to the scarcity of detailed information regarding the fault sources in northern Pakistan. This higher seismic hazard is not justified by the earthquake history of Peshawar.
Table 7Placement of Peshawar based on the present study: classical PSHA with areal sources, considering both shallow and deep earthquakes. Listed in ascending order of peak ground acceleration.
It is worth mentioning that the focus of the present study was to provide the base maps for seismic hazard in Peshawar. Site-specific soil properties were not known; therefore, they were not addressed in the present study. Alternatively, the code suggests amplification factors for various soils from Type C to Type E as per NEHRP soil classification. This may be considered to amplify or deamplify the seismic hazard provided in the present study.
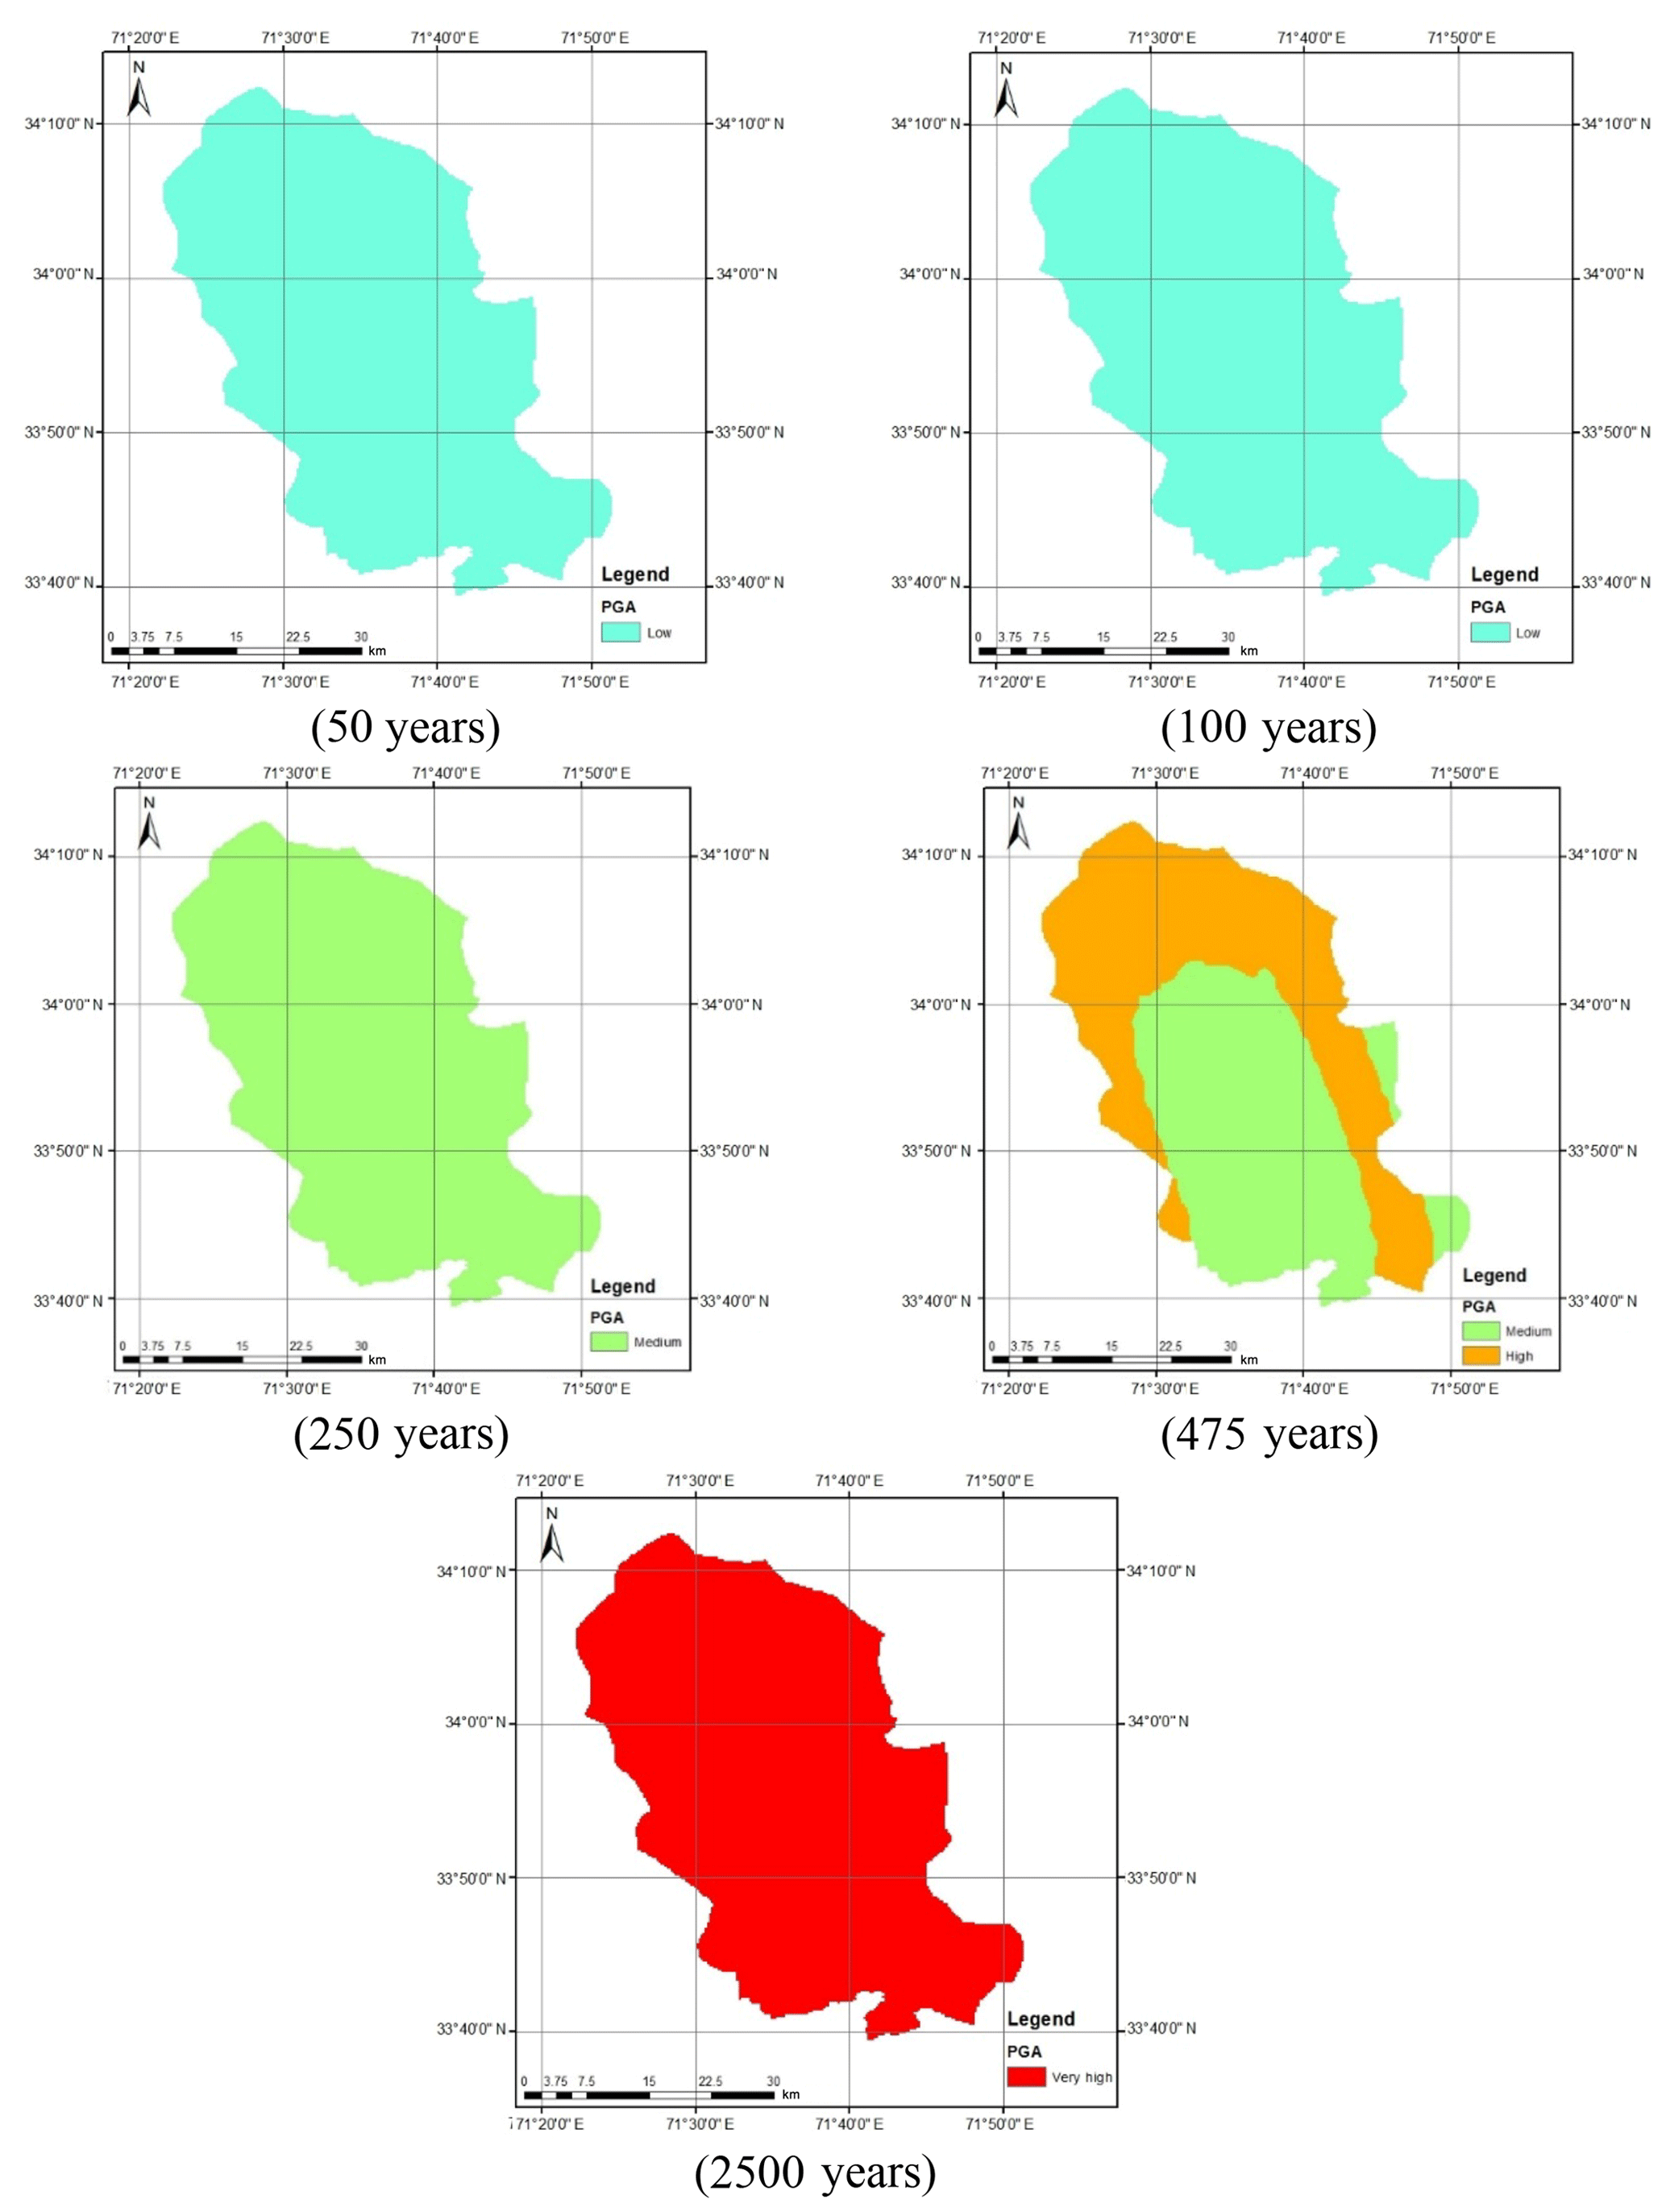
Figure A1Calculated seismic hazard maps using Akkar and Bommer (2010) GMPE for shallow earthquakes.
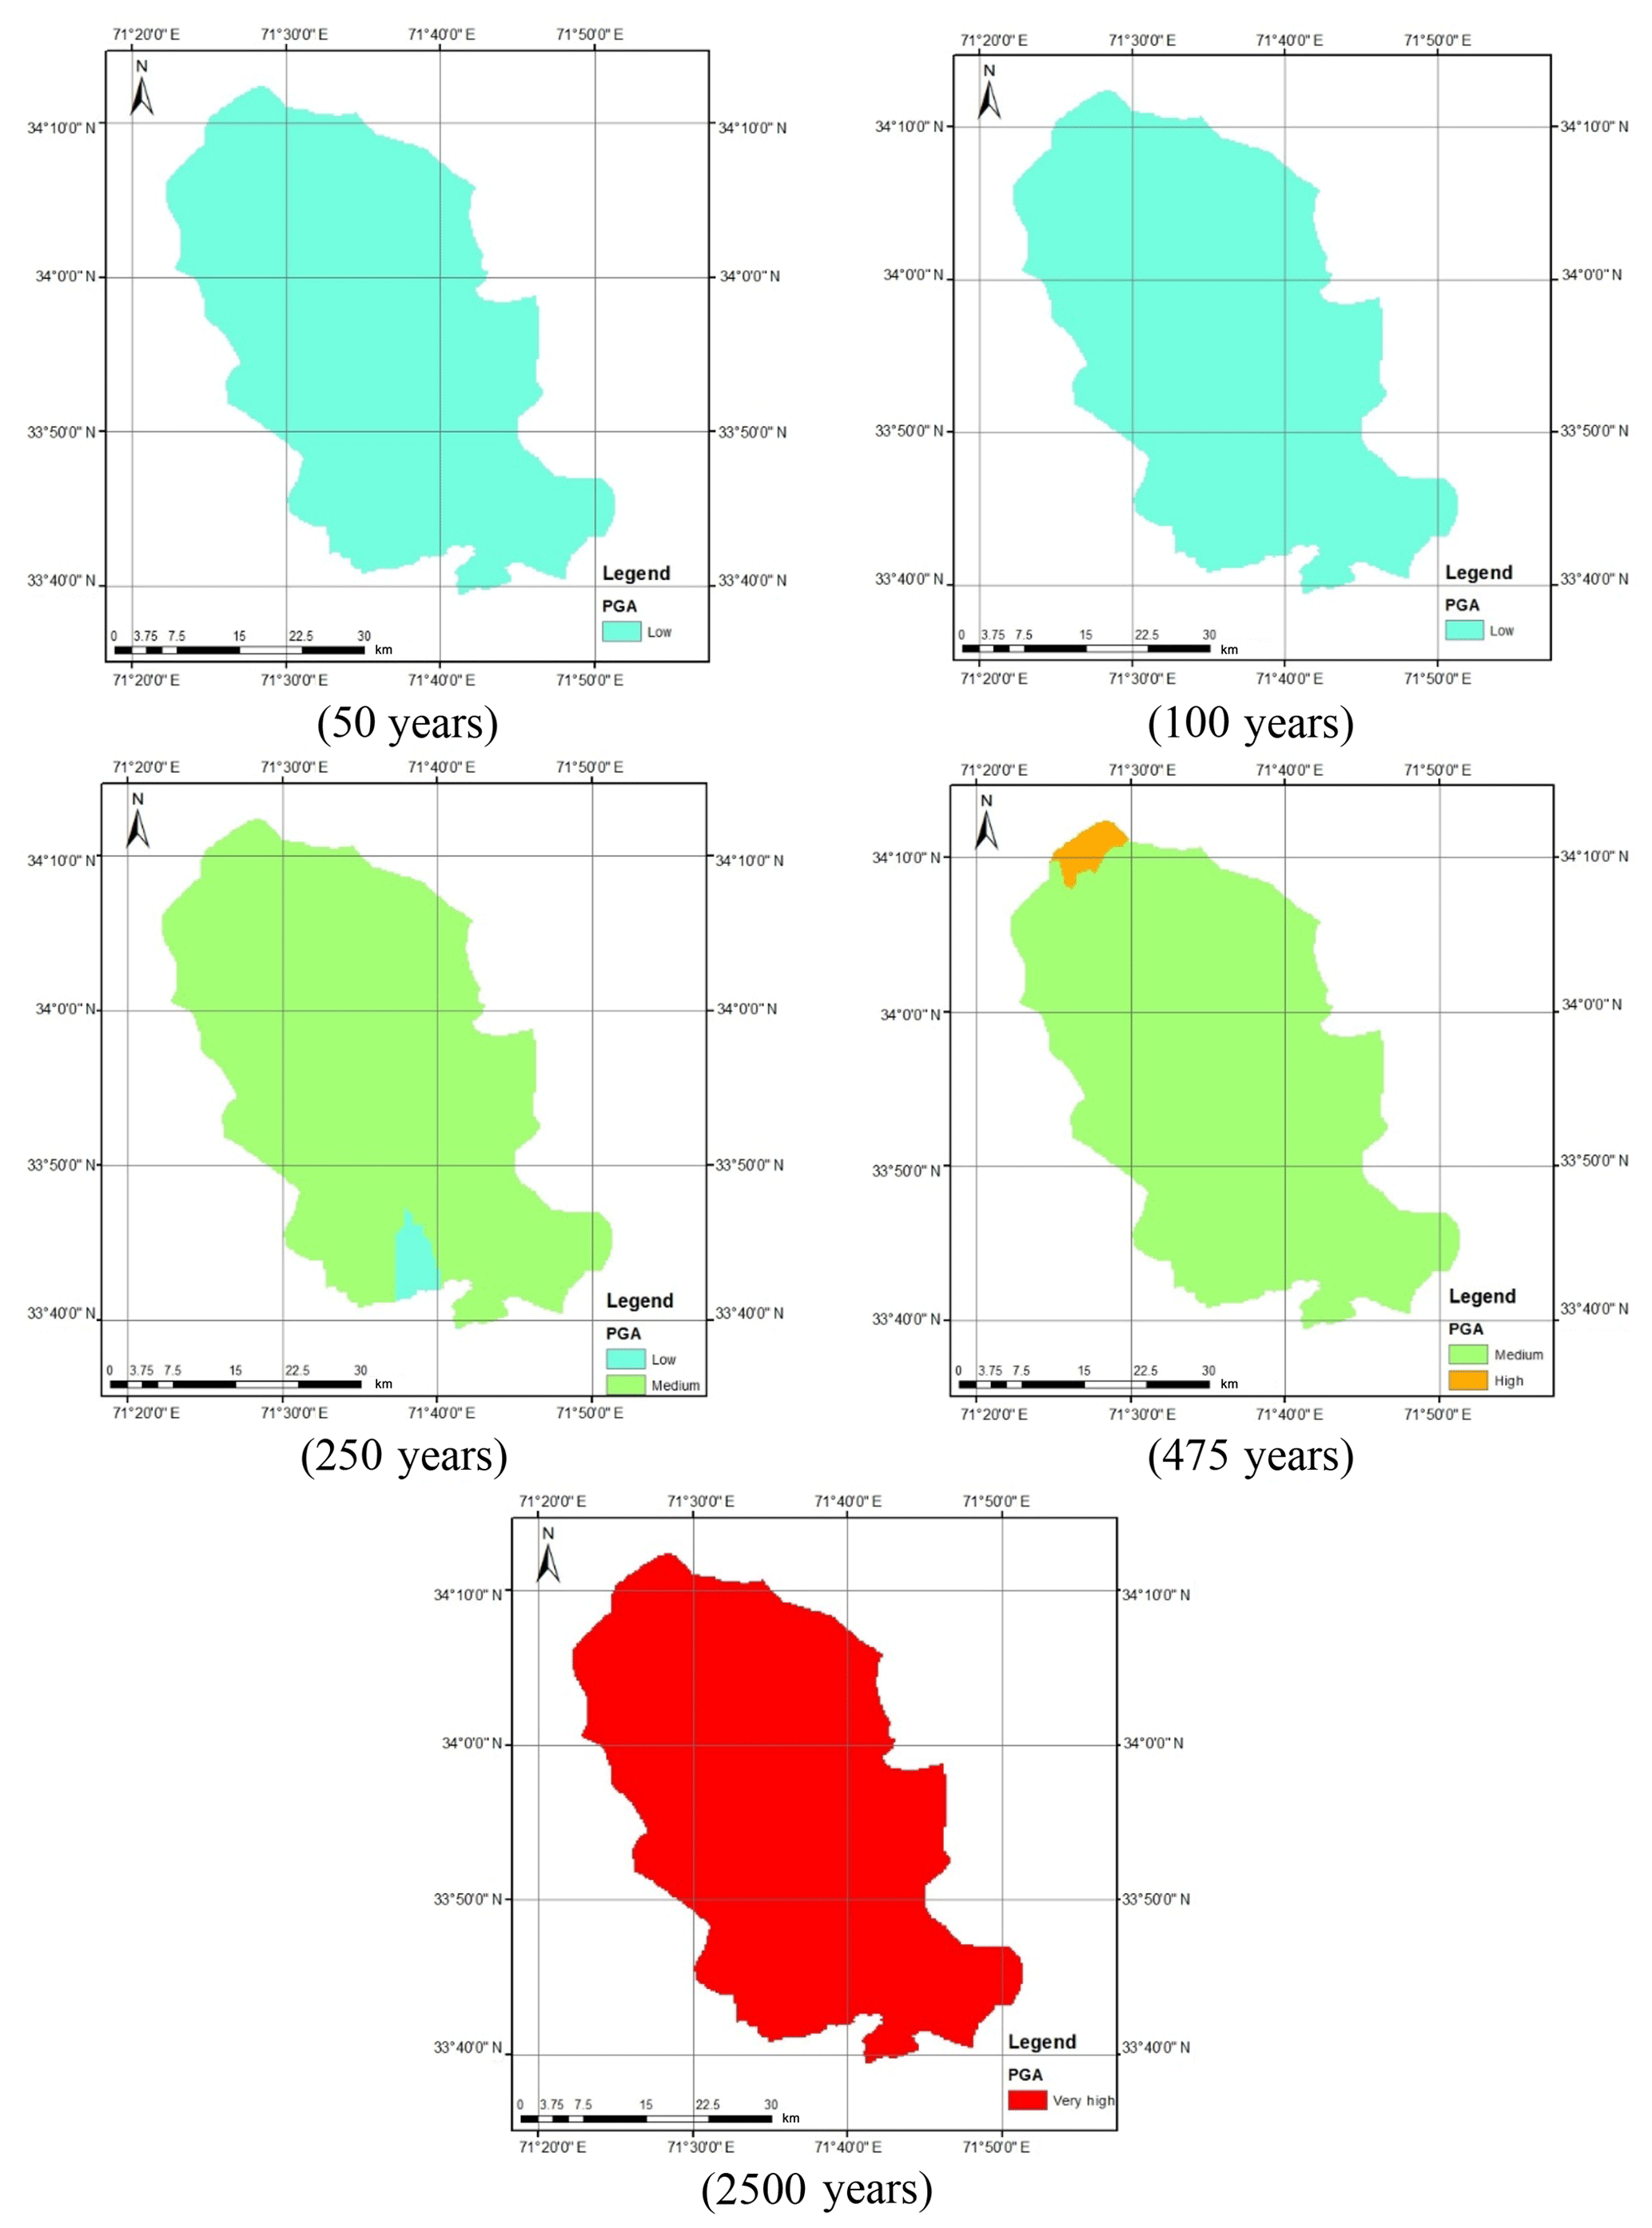
Figure A2Calculated seismic hazard map using Boore and Atkinson (2008) NGA GMPE for shallow earthquakes.
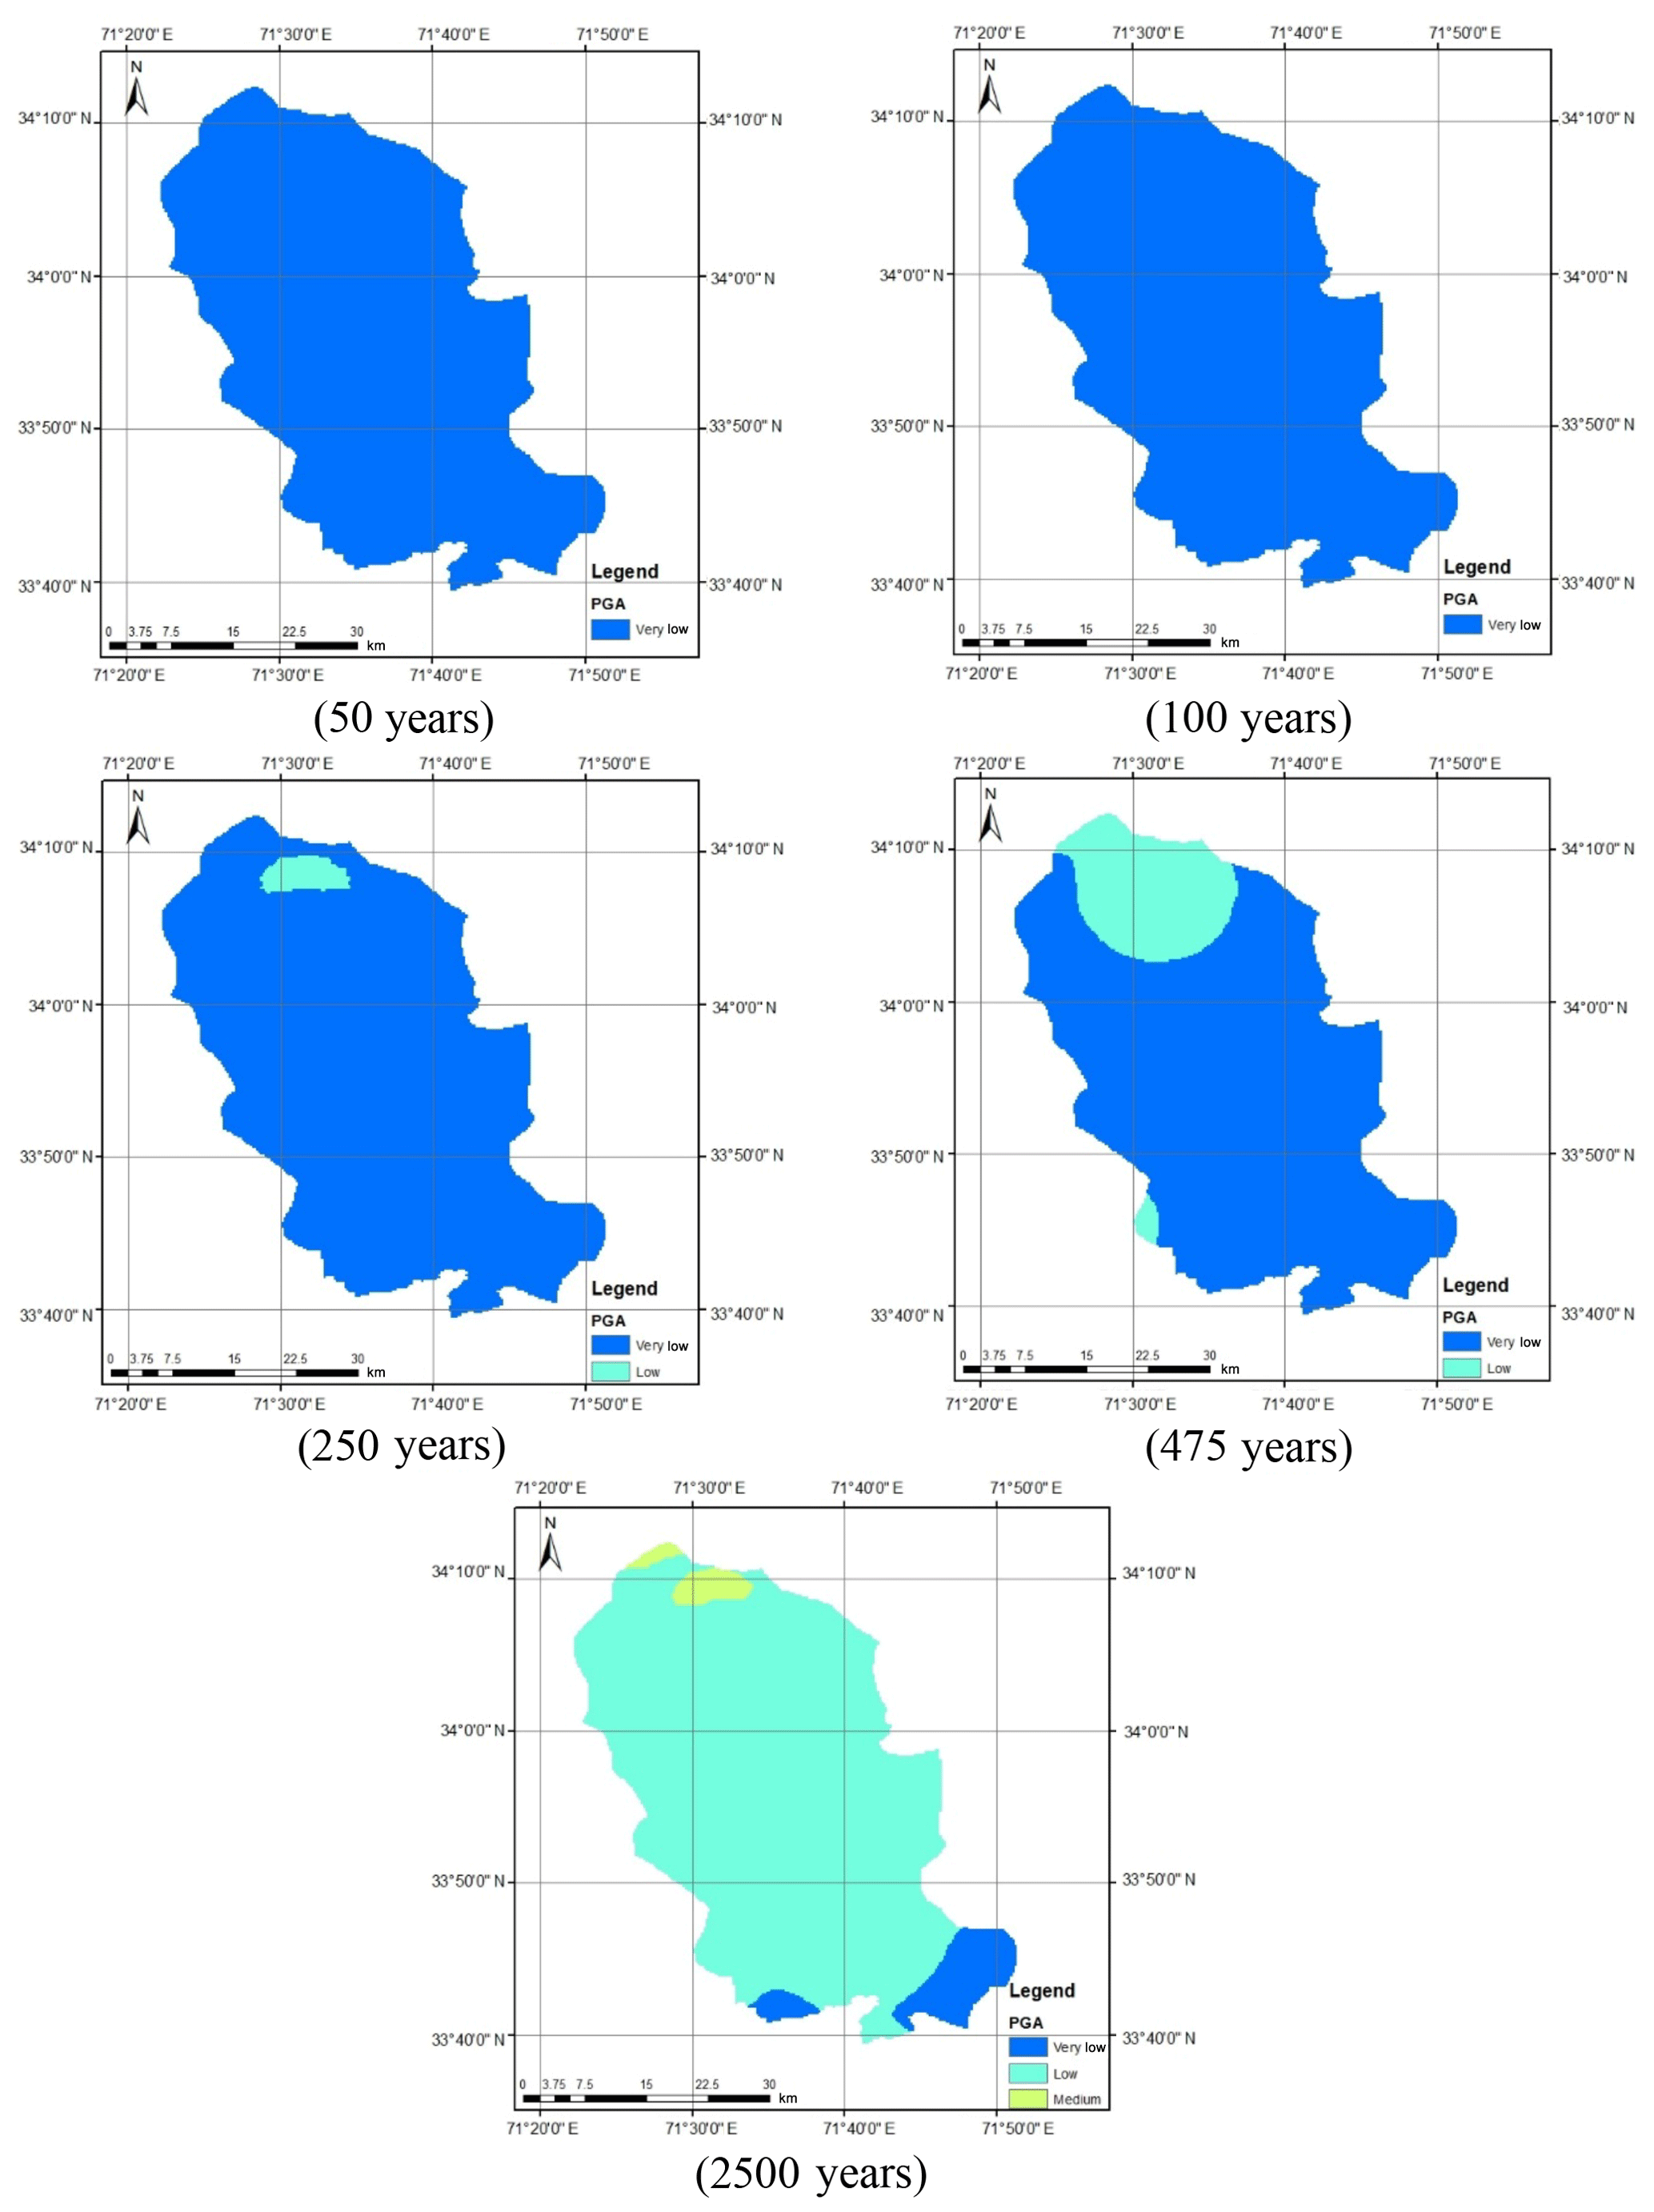
Figure A3Calculated seismic hazard map using Kanno et al. (2006) GMPE for deep earthquakes.
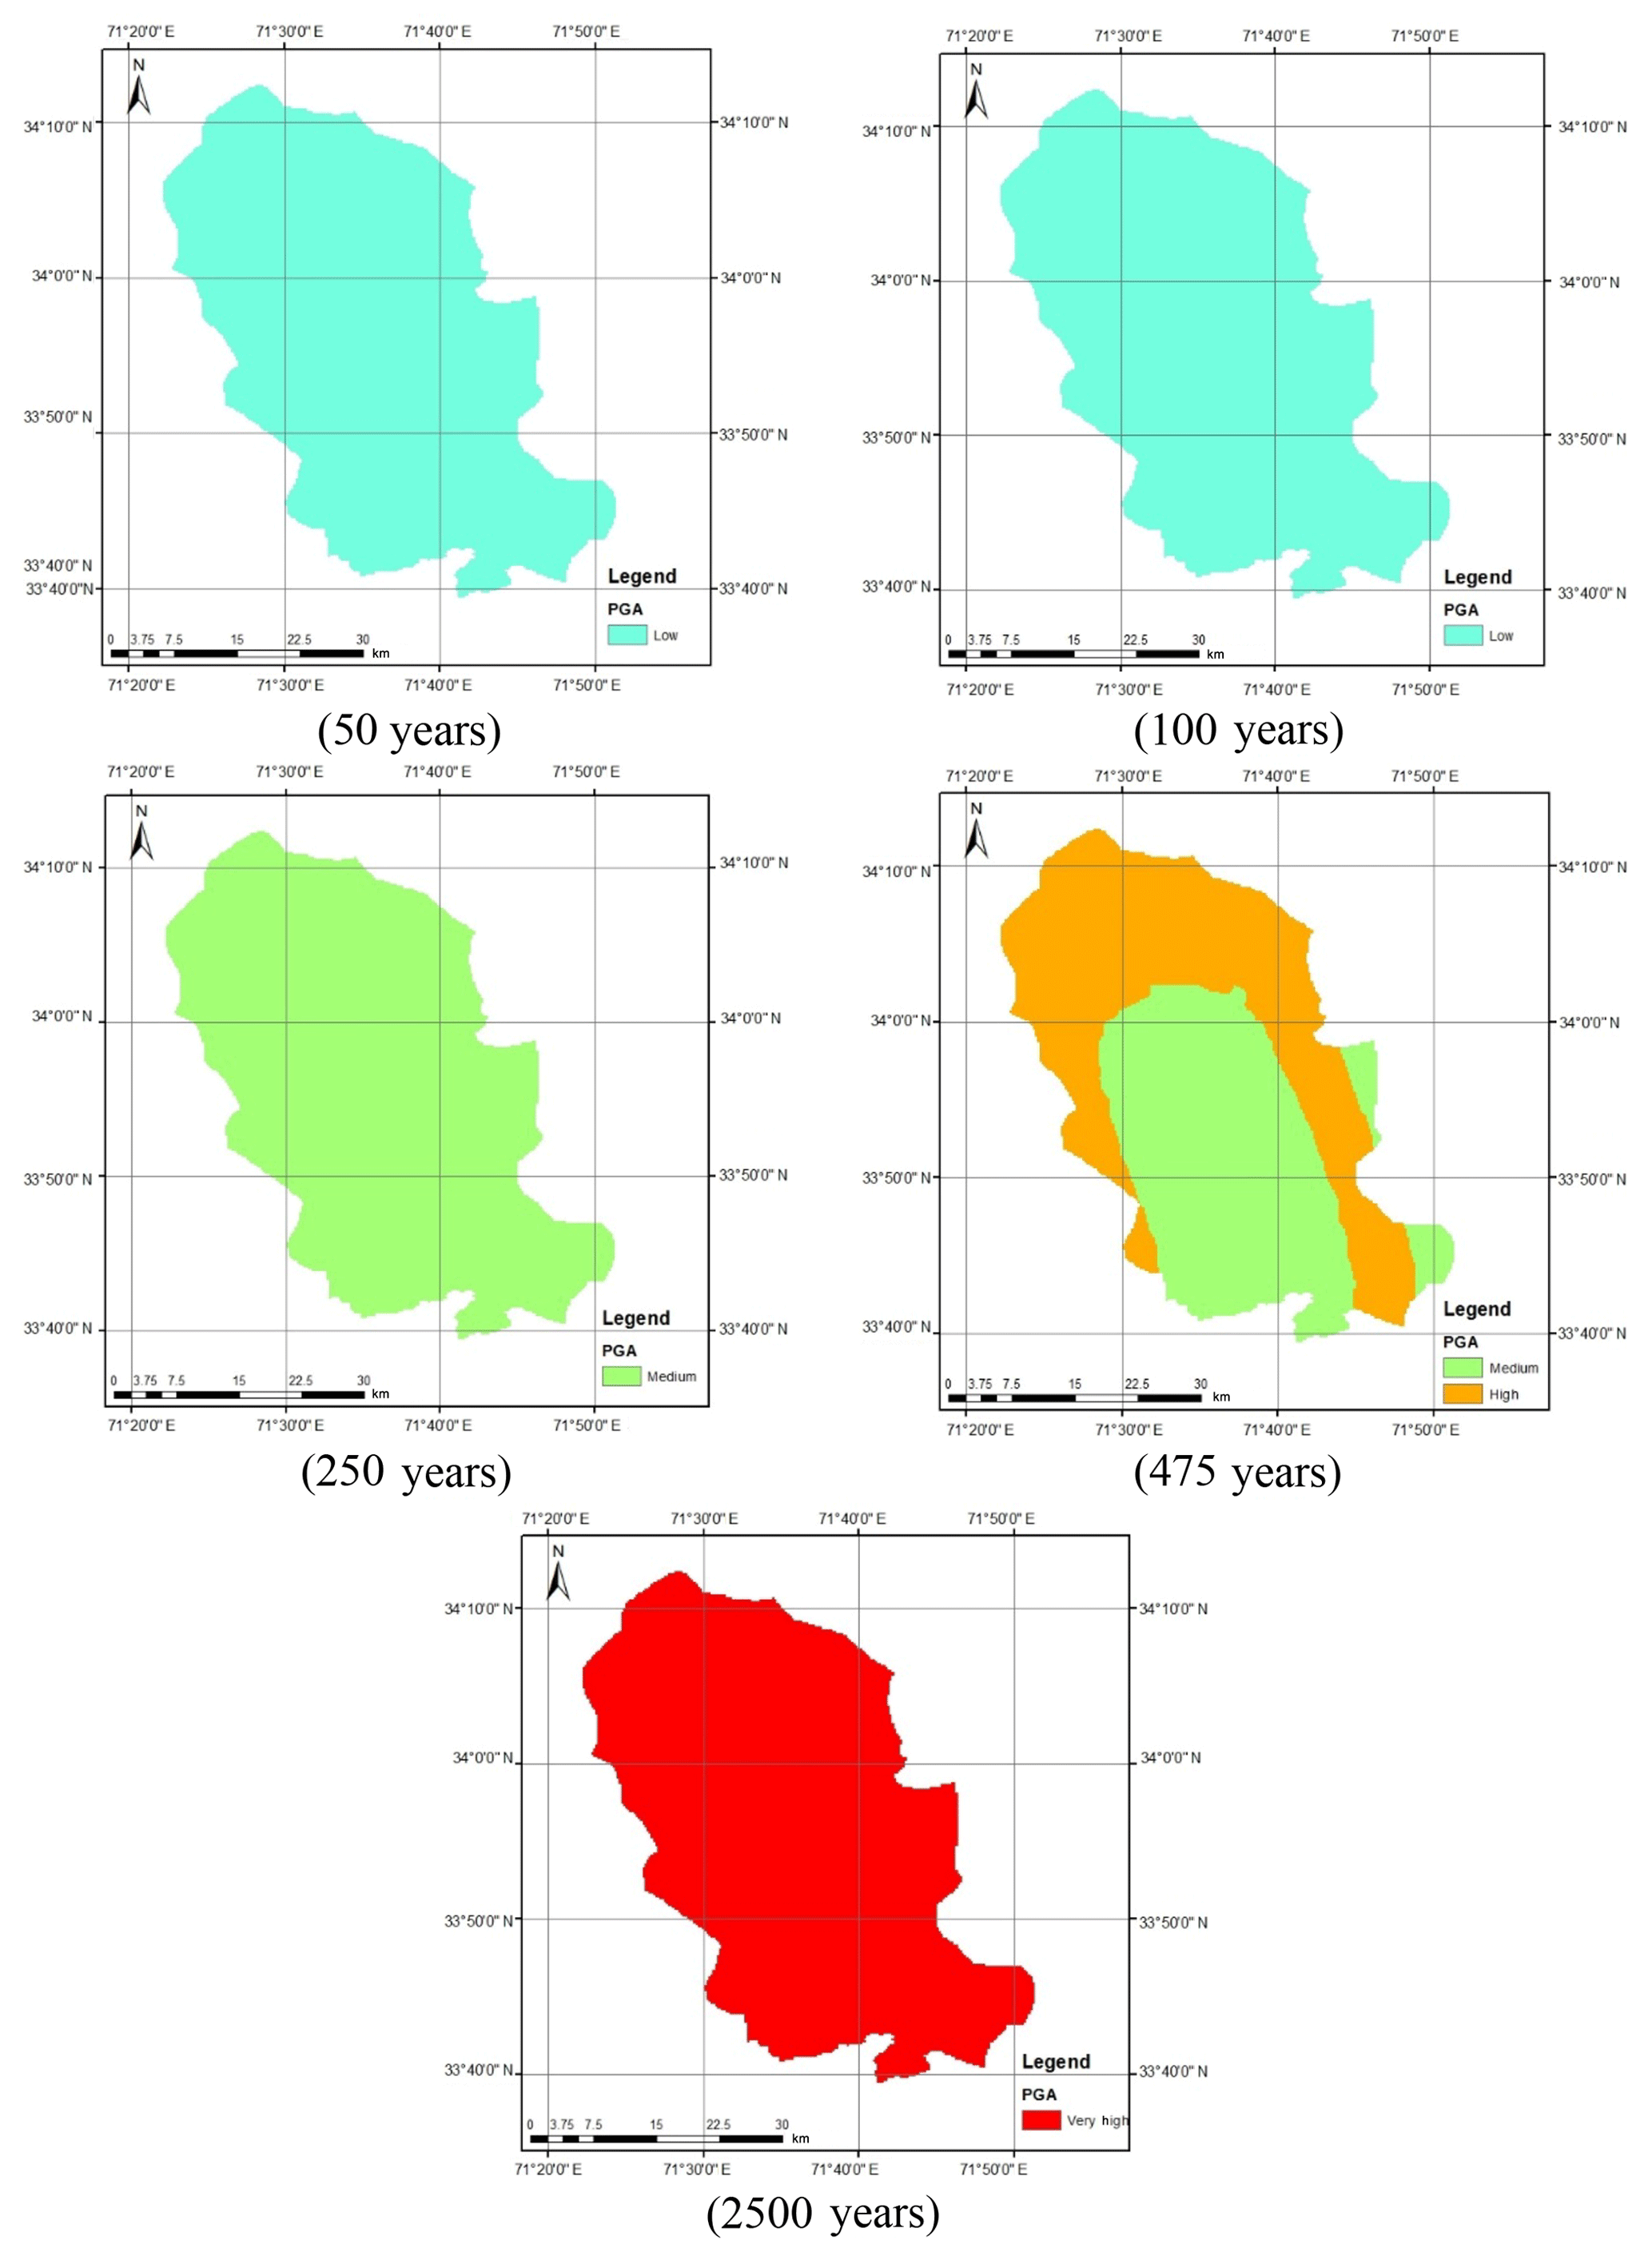
Figure A4Calculated seismic hazard map Lin and Lee (2008) GMPE for deep earthquakes.

Figure A5Calculated seismic hazard map considering Akkar and Bommer (2010) for shallow earthquakes and Kanno et al. (2006) for deep earthquakes.

Figure A6Calculated seismic hazard map considering Akkar and Bommer (2010) for shallow earthquakes and Lin and Lee (2008) for deep earthquakes.
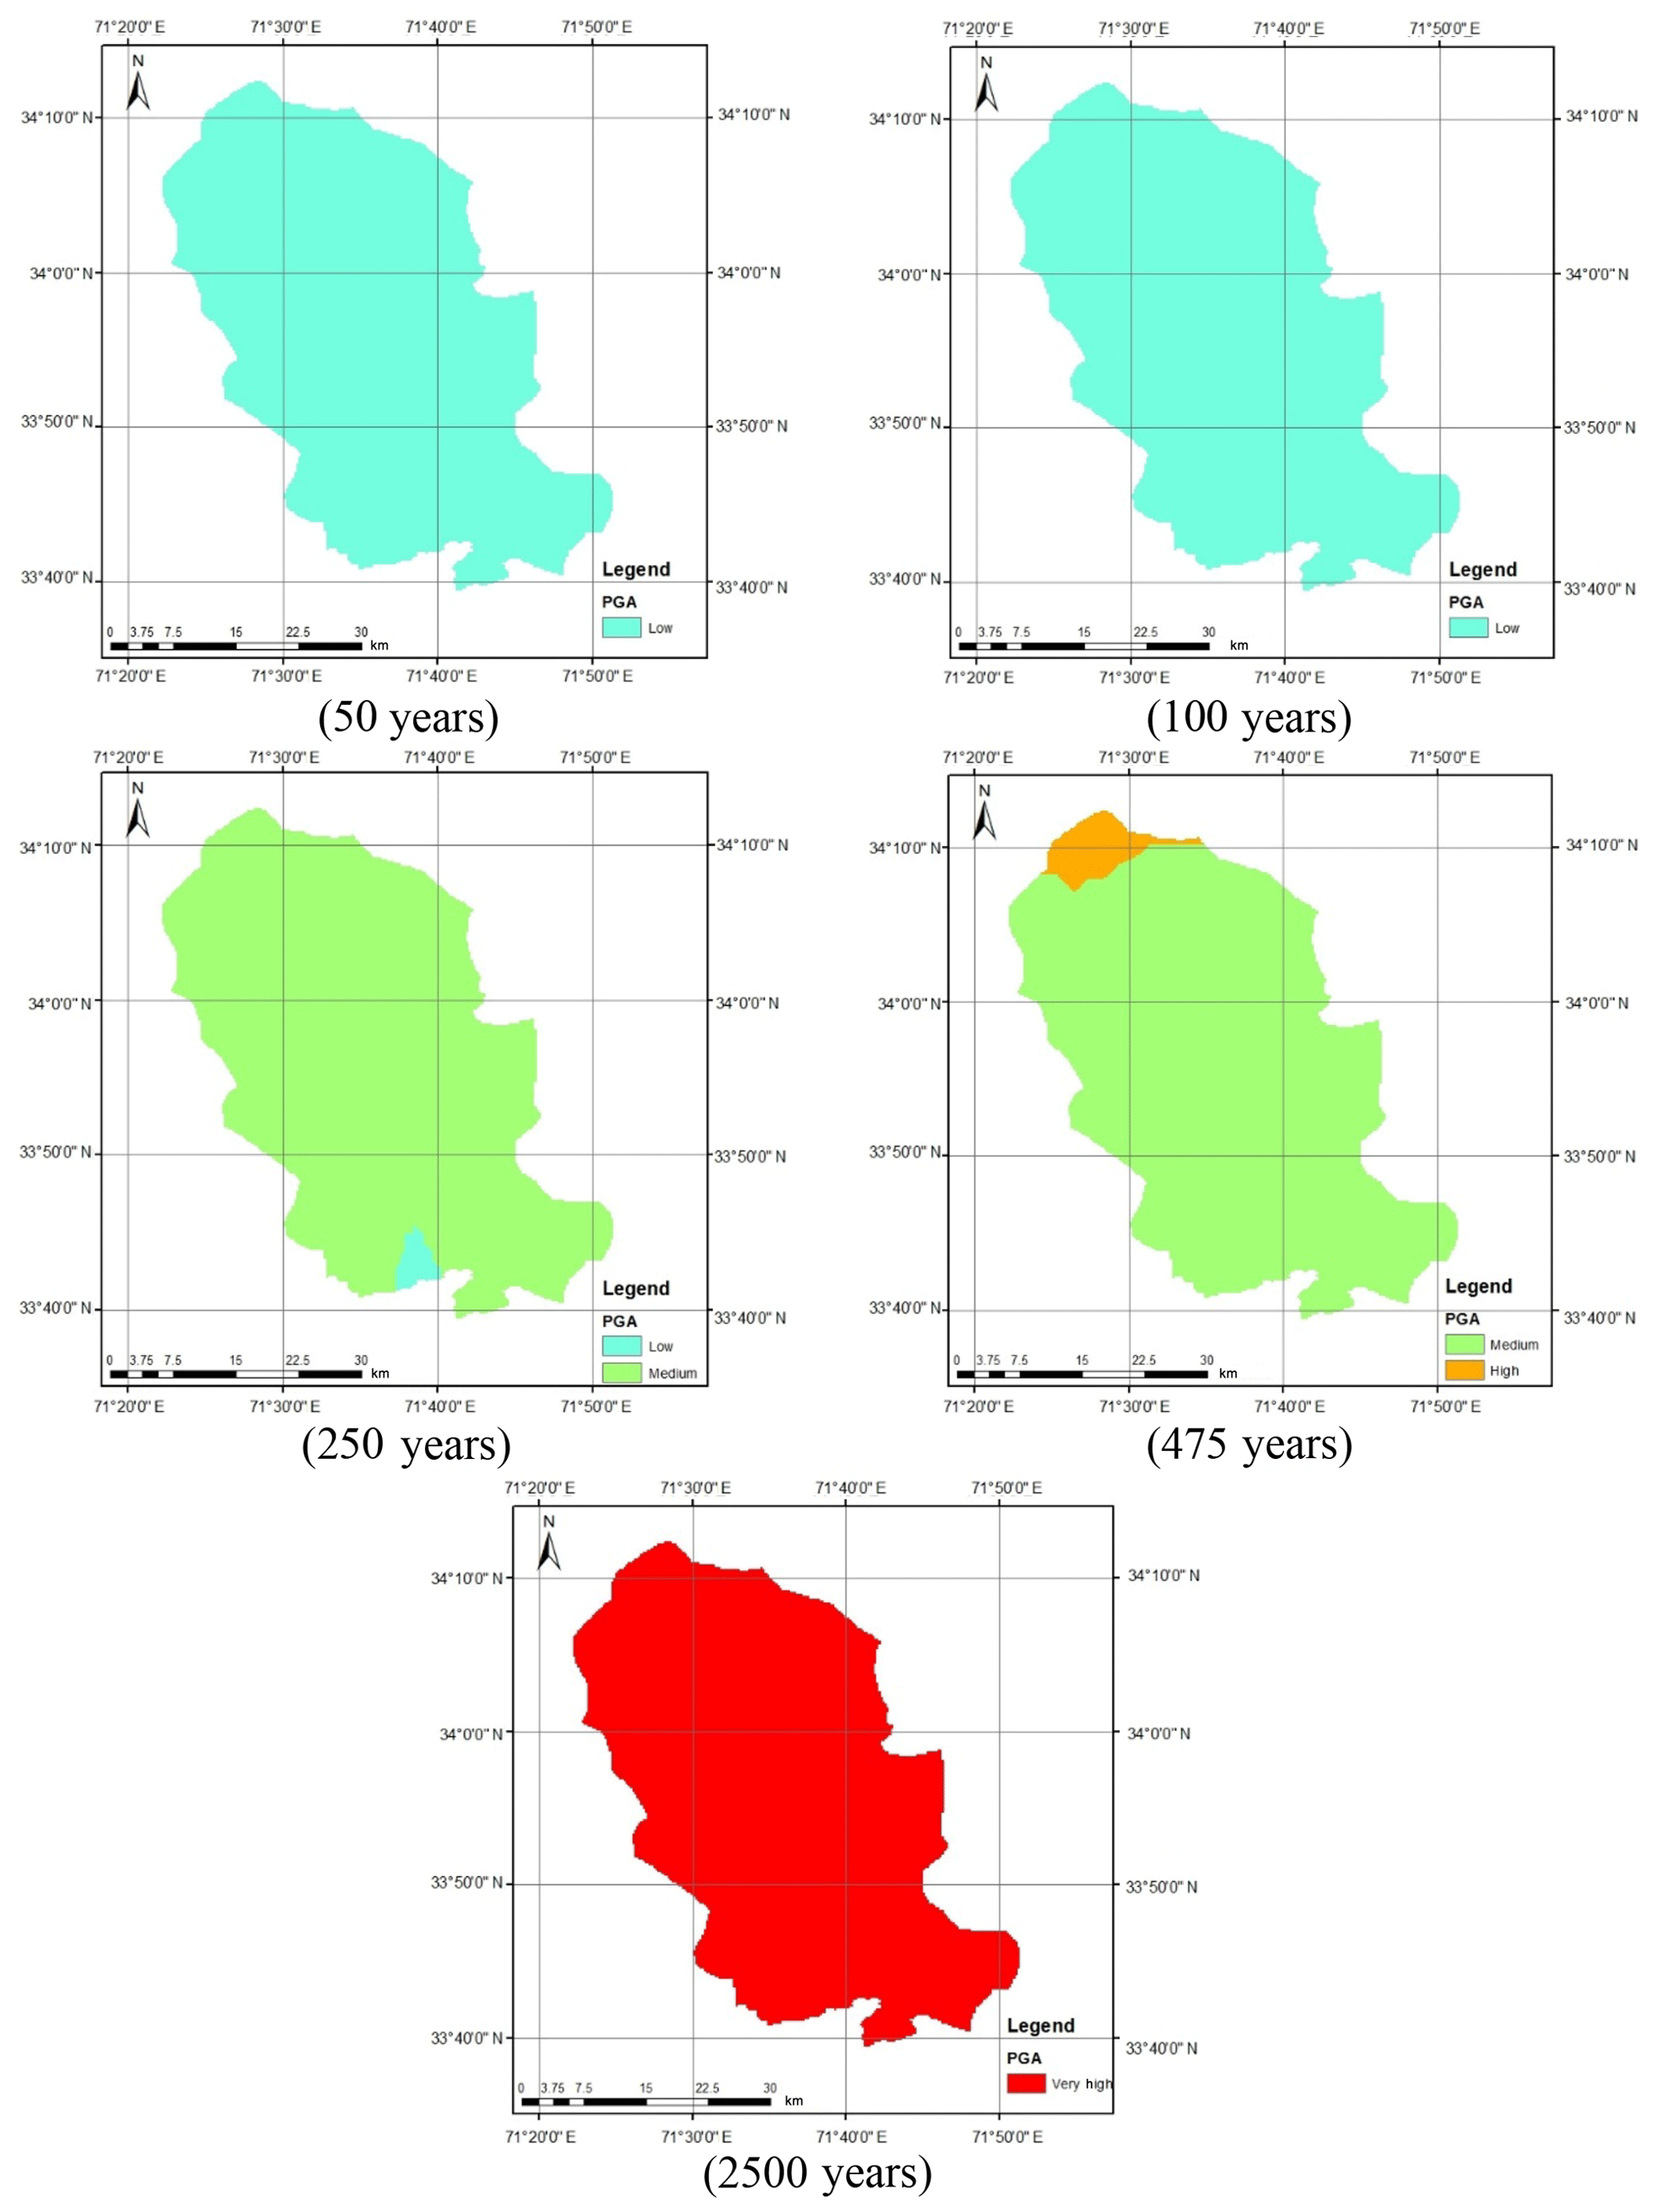
Figure A7Calculated seismic hazard map considering Boore and Atkinson (2008) NGA for shallow earthquakes and Kanno et al. (2006) for deep earthquakes.

Figure A8Calculated seismic hazard map considering Boore and Atkinson (2008) NGA for shallow earthquakes and Lin and Lee (2008) for deep earthquakes.
All data, models and code generated or used during the study are available from the corresponding author by request (Naveed Ahmad, naveed.ahmad@uetpeshawar.edu.pk). Items which may be requested are the earthquake catalogue (raw and processed data), Excel sheets used for G–R parameters derivation, CRISIS input files, etc.
NA contributed as the advisor and supervisor of the research and in the analysis of the earthquake catalogue for the derivation of seismic parameters, selection of GMPEs, preparation of input files for CRISIS program and paper drafting. UK contributed in the compilation of the earthquake catalogue and processing of data, analysis of hazard through the CRISIS program and developing hazard maps. KM has contributed to the data organization, literature review, integration of work tasks and preparation of the initial paper draft. QI has contributed in the selecting and designing of seismic sources for both shallow and deep earthquakes, assignment of source parameters in the CRISIS program, output data compilation, and result plotting.
The authors declare that they have no conflict of interest.
This paper has been produced from MSc research work on the seismic microzonation of Peshawar, Pakistan. The authors are grateful to the reviewers for their constructive remarks that improved the quality of the manuscript.
This paper was edited by Maria Ana Baptista and reviewed by two anonymous referees.
Ahmad, N.: A note on the strong ground motions and behavior of buildings during 26th Oct. 2015 Afghanistan–Pakistan earthquake, EERI – Earthquake Engineering Research Institute, Oakland, CA, USA, 2015.
Ahmad, N., Ullah, S. and Waseem, M.: Discussion of “Assessment of the seismicity of Peshawar region in line with the historical data and modern building codes (ASCE-07 & IBC3-2006)” by Shah et al, J. Earthq. Eng., https://doi.org/10.1080/13632469.2019.1692743, in press, 2019.
Akkar, S. and Bommer, J. J.: Empirical Equations for the Prediction of PGA, PGV, and Spectral Accelerations in Europe, the Mediterranean Region, and the Middle East, Seismol. Res. Lett., 81, 195–206, 2010.
Ali, Q. and Khan, A. N.: A critical review of the seismic hazard zoning of Peshawar and Adjoining areas, J. Earthq. Eng., 9, 587–607, 2004a.
Ali, Q. and Khan, A. N.: A critical review of the seismic risk zoning and development of Design spectra for Peshawar and adjoining areas, in: Paper No. 50, Proceedings of the 13th World Conference on Earthquake Engineering, 1–6 August 2004, Vancouver, Canada, 2004b.
Ambrasey, N.: Reappraisal of north-Indian earthquakes at the turn of the 20th century, Curr. Sci., 79, 1237–1250, 2000.
Ambraseys, N. and Douglas, J. J.: Magnitude calibration of north Indian earthquakes, Geophys. J. Int., 159, 165–206, 2004.
Ambraseys, N. N., Douglas, J., Sarma, S. K., and Smit, P. M.: Equations for the estimation of strong ground motions from shallow crustal earthquakes using data from Europe and the Middle East: horizontal peak ground acceleration and spectral acceleration, Bull. Earthq. Eng., 3, 1–53, 2005.
Arango, M. C., Free, M. W., Lubkowski, Z. A., Pappin, J. W., Musson, R. M. W., Jones, G., and Hodge, E.: Comparing predicted and observed ground motions from UK earthquakes, in: Proceeding of the 15th World Conference on Earthquake Engineering, Lisbon, Portugal, 2012.
BCP: BCP-SP – Building Code of Pakistan Seismic Provision, Ministry of Housing and Works, Islamabad, 2007.
Bhatia, S. C., Kumar, M. R., and Gupta, H. K.: A probabilistic seismic hazard map of India and adjoining regions, Annali di Geofisica, 42, 1153–1164, 1999.
Boore, D. M. and Atkinson, G. M.: Ground-motion prediction equations for the average horizontal component of PGA, PGV, and 5 %-damped PSA at spectral periods between 0.01 s and 10.0 s, Earthq. Spectra, 24, 99–138, 2008.
Çağnan, Z. and Akkar, S.: Assessment of Aleatory and Epistemic Uncertainty for Ground-Motion Intensity Measure Prediction in Turkey, Bull. Seismol. Soc. Am., 109, 263–283, 2018.
Campbell, K. W.: Near source attenuation of peak horizontal acceleration, Bull. Seismol. Soc. Am., 71, 2039–2070, 1981.
Campbell, K. W. and Bozorgnia., Y.: Empirical analysis of strong ground motion from the 1992 Landers, California, earthquake, Bull. Seismol. Soc. Am., 84, 573–588, 1994.
Chen, Z., Burchfiel, B. C., Liu, Y., King, R. W., Royden, L. H., Tang, W., Wang, E., Zhao, J., and Zhang, W.: GPS measurement from eastern Tibet and their implications for India/Eurasia intercontinental deformation, J. Geophys. Res., 105, 2981–2987, 2000.
Cotton, F., Scherbaum, F., Bommer, J. J., and Bungum, H.: Criteria for selecting and adjusting ground-motion models for specific target regions: application to central Europe and rock sites, J. Seismol., 10, 137–156, 2006.
CRISIS: User Manual Crisis 2007 Version 7.2, in: A computer program for seismic hazard assessment, edited by: Ordaz, M., Aguilar, A., and Arbulida, J., Institute of Ingeneria, UNAM, Mexico City, Mexico, 2007.
Crouse, C. B.: Ground-motion attenuation equations for earthquakes on the Cascadia subduction zone, Earthq. Spectra, 7, 210–236, 1991.
Crouse, C. B., Vyas, Y. K., and Schell, B. A.: Ground motions from subduction-zone earthquakes, Bull. Seismol. Soc. Am., 78, 1–25, 1988.
DiPietro, J. A. and Pogue, K.R.: Tectonostratigraphic subdivisions of the Himalaya: A view from the west, Tectonics, 23, 1–20, 2004.
Douglas, J.: Ground motion prediction equations 1964–2019, Technical Report, Department of Civil and Environmental Engineering, University of Strathclyde, Glasgow, UK, 2019.
Gansser, A.: Geology of the Himalayas. Inter-Science Publication, Jon Wiley and Sons, London, 1964.
Gardner, J. K. and Knopoff, L.: Is the sequence of earthquakes in Southern California, with aftershocks removed, Poissonian?, Bull. Seismol. Soc. Am., 64, 1363–1367, 1974.
Hanks, T. C. and Kanamori, H.: A moment magnitude scale, J. Geophys. Res., 84, 2348–2350, https://doi.org/10.1029/JB084iB05p02348, 1979.
Hashash, Y. M., Kim, B., Olson, S. M., and Ahmad, I.: Seismic hazard analysis using discrete faults in Northwestern Pakistan: Part I – methodology and evaluation, J. Earthq. Eng., 16, 963—64, 2012.
Kanamori, H.: The energy release in great earthquakes, J. Geophys. Res., 82, 2981–2987, 1977.
Kanno, T., Narita, A., Morikawa, N., Fujiwara, H., and Fukushima, Y.: A new attenuation relation for strong ground motion in Japan based on recorded data, Bull. Seismol. Soc. Am., 96, 879–897, 2006.
Khaliq, A. H., Waseem, M., Khan, S., Ahmed, W., and Khan, M. A.: Probabilistic seismic hazard assessment of Peshawar District, Pakistan, J. Earth Syst. Sci., 128, 6, https://doi.org/10.1007/s12040-018-1028-y, 2019.
Khan, M. A., Aslam, M., Hussain, A., Ashraf, M., and Afridi, A. G. K.: Geological map of North West Frontier Province, Pakistan (Colored, Scale ), Geological Survey of Pakistan (Map Series), GSP, Islamabad, 2006.
Khan, S., Waseem, M., Khan, M. A., and Ahmed, W.: Updated earthquake catalogue for seismic hazard analysis in Pakistan, J. Seismol., 22, 841–861, https://doi.org/10.1007/s10950-018-9736-y, 2018.
Kramer, S. L.: Geotechnical earthquake engineering, Prentice Hall, Upper Saddle River, NJ, 1996.
Lin, P.-S. and Lee, C. T.: Ground-Motion Attenuation Relationships for Subduction Zone Earthquakes in Northeastern Taiwan, Bull. Seismol. Soc., 98, 220–240, 2008.
Lisa, M., Khawaja, A. A., and Jan, M. Q.: Seismic hazard assessment of NW Himalayan thrust belt using probabilistic approach, J. Earthq. Eng., 11, 257–301, 2007.
McGuire, R. K.: Seismic hazard and risk analysis, EERI – Earthquake Engineering Research Institute, CA, USA, 2004.
Molas, G. L. and Yamazaki, E.: Attenuation of earthquake ground motions in Japan including deep focus events, Bull. Seismol. Soc. Am., 85, 1343–1358, 1995.
Mulargia, F. and Tinti, S.: Completeness analysis of a seismic catalogue, Ann. Geophys., 3, 407–414, 1985.
Ornthammarath, T., Douglas, J., Sigbjórnsson, R., and Lai, C.: Assessment of ground motion variability and its effects on seismic hazard analysis: A case study for Iceland, Bull. Earthq. Eng., 9, 931–953, 2011.
Rafi, Z., Lindholm, C., Bungum, H., and Ahmed, N.: Probabilistic seismic hazard analysis and zonation of Pakistan, Azad Jammu and Kashmir, Nat. Hazards, 61, 1317–1354, 2012.
Rowshandel, B.: Capturing and PSHA implementation of spatial variability of Near-source ground motion hazard, in: Proceedings of the Geotechnical Earthquak Engineering and Soil Dynamics V, 10–13 June 2018, Austin, Texas, 2018.
Rupakhety, R. and Sigbjörnsson, R.: Ground-motion prediction equations (GMPEs) for inelastic displacement and ductility demands of constant-strength SDOF systems, Bull. Earthq. Eng., 7, 661–679, 2009.
Şeşetyan, K., Danciu, L., Tümsa, M. B. D., Giardini, D., Erdik, M., Akkar, S., Gülen, L., Zare, M., Adamia, S., Ansari, A., Arakelyan, A., Askan, A., Avanesyan, M., Babayan, H., Chelidze, T., Durgaryan, R., Elias, A., Hamzehloo, H., Hessami, K., Kalafat, D., Kale, Ö., Karakhanyan, A., Khan, M. A., Mammadli, T., Al-Qaryouti, M., Sayab, M., Tsereteli, N., Utkucu, M., Varazanashvili, O., Waseem, M., Yalçın, H., and Yılmaz, M. T.: The 2014 seismic hazard model of the Middle East: overview and results, Bull. Earthq. Eng., 16, 3535–3566, 2018.
Shah, B. A., Sadiq, M. M., Memon, S. A., and Rehman, S. K. U.: Assessment of the seismicity of Peshawar region in line with the historical data and modern building codes (ASCE-07 & IBC-2006), J. Earthq. Eng., https://doi.org/10.1080/13632469.2019.1605315, in press, 2019.
Tahirkheli, R. A.: Geology of the Himalayas, Karakorum, and Hindu Kush in Pakistan, Univers. Peshawar Geol. Bull., 15, 1–49, 1982.
Toro, G. R., Abrahamson, N. A., and Schneider, J. F.: Engineering model of strong ground motions from earthquake in the central and eastern United States, Earthq. Spectra, 68, 41–57, 1995.
Toro, G. R., Abrahamson, N. A., and Schneider, J. F.: Model of strong ground motions from earthquakes in Central and Eastern North America: best estimates and uncertainties, Seismol. Res. Lett., 68, 41–57, 1997.
Waseem, M., Khan, M. A., Javed, M. W., and Ali, S. M.: Deterministic seismic hazard analysis for Peshawar, Pakistan, J. Himal. Earth Sci., 46, 67–72, 2013.
Waseem, M., Spacone, E., and Lai, C. G.: Seismic hazard assessment of northern Pakistan, Nat. Hazards, 90, 563–590, 2018.
Waseem, M., Khan, S., and Asif Khan, M.: Probabilistic Seismic Hazard Assessment of Pakistan Territory Using an Areal Source Model, Pure Appl. Geophys., https://doi.org/10.1007/s00024-020-02455-7, in press, 2020.
Youngs, R. R., Abrahamson, N. A., Makdisi, E., and Sadlgh, K.: Magnitude dependent dispersion in peak ground acceleration, Bull. Seismol. Soc. Am., 85, 1161–1176, 1995.
Zaman, S. and Warnitchai, P.: Probabilistic seismic hazard maps for Pakistan, in: Proceedings of the 15th World Conference on Earthquake Engineering, Bangkok, Thailand, 2010.
Zhang, P. Z., Yang, Z.-X., Gupta, H. K., Bhatia, S. C., and Shedlock, K. M.: Global seismic hazard assessment program (GSHAP) in continent Asia, Annali Di Geofisica, 42, 1167–1190, 1999.