the Creative Commons Attribution 4.0 License.
the Creative Commons Attribution 4.0 License.
 | 18 May 2020
A multivariate statistical method for susceptibility analysis of debris flow in southwestern China
Feng Ji
Zili Dai
Renjie Li
Southwestern China is characterized by many steep mountains and deep valleys due to the uplift activity of the Tibetan Plateau. The 2008 Wenchuan earthquake left large amounts of loose materials in this area, making it a severe disaster zone in terms of debris flow. Susceptibility is a significant factor of debris flows for evaluating their formation and impact. Therefore, there is an urgent need to analyze the susceptibility to debris flows of this area. To quantitatively predict the susceptibility of the area to debris flows, this study evaluates 70 typical debris flow gullies, which are distributed along the Brahmaputra River, Nujiang River, Yalong River, Dadu River, and Ming River, as statistical samples. Nine indexes are chosen to construct a factor index system and then to evaluate the susceptibility to debris flow. They are the catchment area, longitudinal gradient, average gradient of the slope on both sides of the gully, catchment morphology, valley orientation, loose material reserves, location of the main loose material, antecedent precipitation, and rainfall intensity. Following this, an empirical model based on the Type I quantification theory is established for susceptibility prediction for debris flows in southwestern China. Finally, 10 debris flow gullies upstream of the Dadu River are analyzed to verify the reliability of the proposed model. The results show that the accuracy of the statistical model is 90 %.
- Article
(4766 KB) - Full-text XML
- BibTeX
- EndNote


Debris flows are a common geological hazard in mountainous areas that transport large amounts of sediment down-slope and cause serious damage to dwellings, roads, and other structural facilities. China has a chiefly mountainous topography and is one of the most debris-flow-prone countries in the world. Up to March 2019, approximately recorded 50 000 debris flows have occurred in China (Di et al., 2019). A significant percentage of these debris flows are distributed in southwestern China, particularly in the Wenchuan earthquake area, where large amounts of loose material were produced by the earthquake-induced landslides (Xu et al., 2012; Huang et al., 2015; Dai et al., 2017).
Due to the complex nature of debris flows, it is quite difficult to fully understand their initiation mechanism and precisely forecast their occurrence (Brayshaw and Hassan, 2009; Gao et al., 2019). The uncertainty of debris flows poses a significant threat to human life in downstream areas (Schürch et al., 2011). Debris flow susceptibility expresses the occurrence possibility of debris flow in an area with respect to its geomorphologic characteristics (Kappes et al., 2011; Bertrand et al., 2013). Therefore, susceptibility analysis is an essential step for conducting risk assessments of debris flow hazards (Di et al., 2019; Zou et al., 2019).
Debris flow susceptibility analyses include two steps: (1) identification of the potential source areas and (2) prediction of the possible deposition areas (Kang and Lee, 2018). In the literature, a large number of prediction models have been proposed for the susceptibility analyses of debris flows. For the first step, statistical models that use various environmental factors contributing to possible instabilities are well established. For example, Blahut et al. (2010) performed susceptibility assessment for the source areas of landslide-induced debris flows in the Valtellina Valley based on bivariate statistics. Bertrand et al. (2013) used two multivariate statistical models, a linear discriminant analysis (LDA) and a logistic regression (LR), to analyze the debris flow susceptibility of upland catchments. Jomelli et al. (2015) proposed a Bayesian hierarchical probabilistic model to investigate how debris flows respond to environmental and climatic variables in the French Alps. Carrara et al. (2008) discussed the application of different statistical models to debris flows in Val di Fassa, Trentino, Italy. Lucà et al. (2011) compare bivariate and multivariate statistical models for the evaluation of gullying susceptibility in northern Calabria, southern Italy, and concluded that multivariate statistical models were found to be the best model for predicting the debris flow susceptibility of the study area. For the second step, the concept “angle of reach” was widely used in the empirical models to predict the run out distance of debris flows (Hürlimann et al., 2012; Horton et al., 2013). Recently, many numerical models have been proposed to simulate the propagation of debris flows and predict the deposition area. For example, Pirulli and Sorbino (2008) analyzed the propagation of potential debris flows in southern Italy using two numerical codes RASH3D and FLO2D. Beguería et al. (2009) proposed a two-dimensional model based on numerical integration of the depth-averaged motion equations to predict debris flow propagation over complex terrain near Lienz, East Tyrol, Austria. Huang et al. (2015) presented a numerical model based on the smoothed particle hydrodynamic (SPH) method to calculate the run out distance of catastrophic debris flows that occurred in the Wenchuan earthquake area. Gregoretti et al. (2016) used a cell model to simulate a debris flow that occurred on the Rio Lazer. Moraci et al. (2017) performed debris flow susceptibility zoning of debris flows in the Province of Reggio Calabria based on the SPH method. Some recent analysis methods of debris flow susceptibility can be found in Cama et al. (2017), Prieto et al. (2018), and Rosatti et al. (2018).
The previous studies mentioned above have attempted to conduct debris flow susceptibility analysis in specified regions. Southwestern China is characterized by steep mountains and deep valleys, and is strongly affected by the uplift activity of the Tibetan Plateau. Moreover, southwestern China has abundant loose material after the 2008 Wenchuan earthquake. Therefore, a series of large-scale debris flows have been occurred during the rainy seasons in southwestern China (Wu et al., 2019). In the literature, many models for debris flow risk prediction in this area have been proposed. For example, Xu et al. (2012) assess debris flow susceptibility based on an information value model and Geographic Information System (GIS) in Sichuan, China. Wang et al. (2016) adopted a self-organizing map method to analyze the susceptibility to debris flows at the Wudongde Dam site in southwestern China. Li et al. (2017) carried out a susceptibility analysis on debris flows also in the Wudongde Dam area using the fuzzy C-means algorithm (FCM). Recently, Liu et al. (2018) presented a comprehensive risk assessment model based on semiquantitative methods to quantify the risk level of each zone in southwestern China. Di et al. (2019) developed a gradient boosting machine (GBM) to predict the susceptibilities of debris flows in southwestern China. Wu et al. (2020) implemented logistical regression models to identify the areas that are susceptible to debris flow formations in Sichuan Province, China. Through the above research, some promising results have been achieved concerning the susceptibility analysis of the debris flows in southwestern China. This work aims to provide a multivariate statistical method for susceptibility analysis of debris flow in southwestern China. A total of 70 debris flow gullies in southwestern China were analyzed, and nine key indicators were extracted through the initial analysis of the debris flows. Through multivariate statistics, an empirical formula of susceptibility was established, which was then validated with the data of the 10 debris flow gullies upstream of the Dadu River. It is worth noting that this work is confined to identifying the potential debris flow source areas in southwestern China and neglects the run out of the phenomenon.
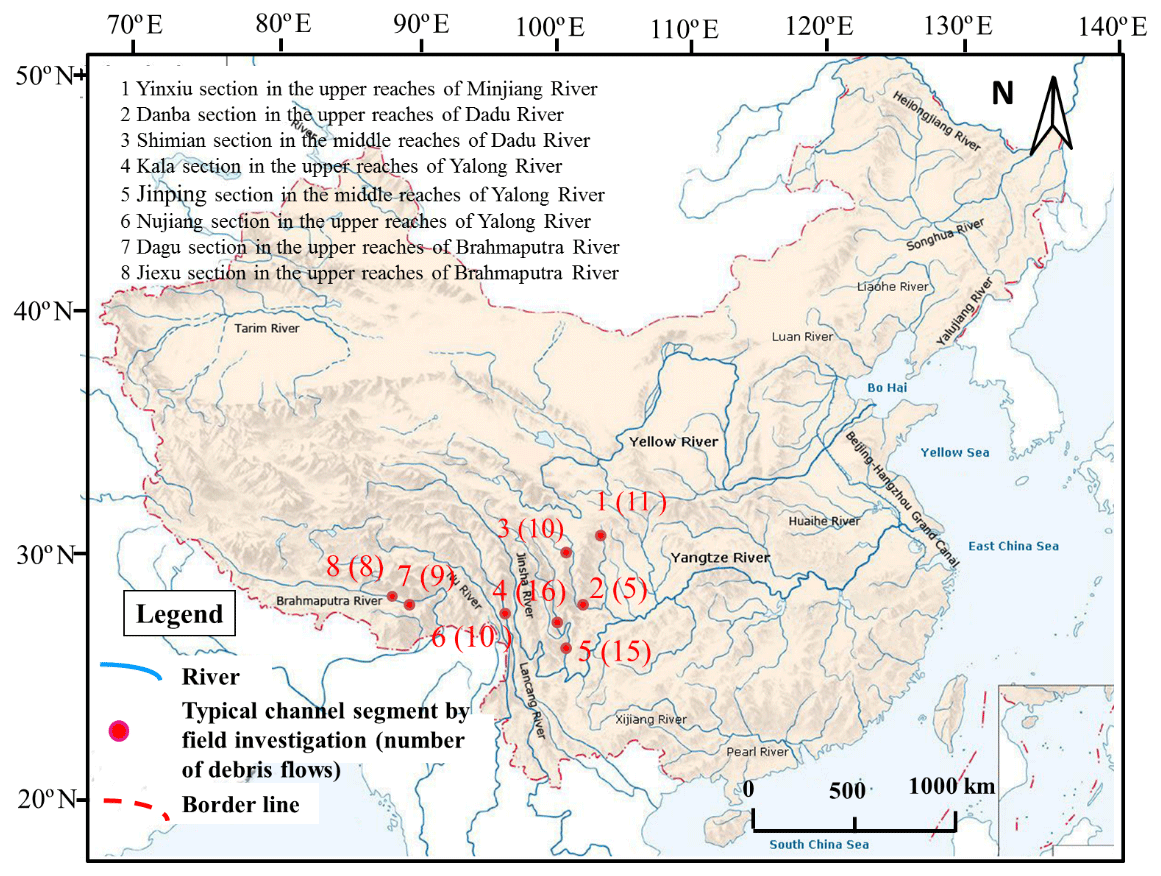
Figure 1Distribution of the 70 debris flow gullies investigated in southwestern China (the base map is from Zhao, 2014). Publisher’s note: Please note that the above figure contains disputed territories.
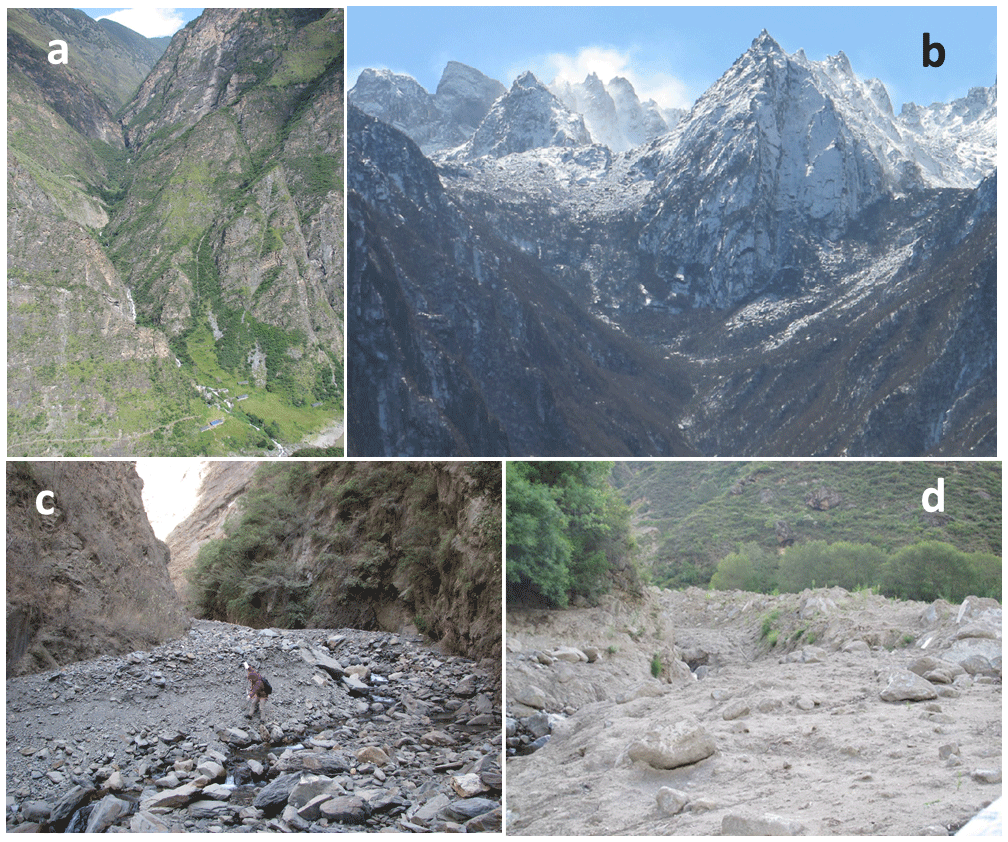
Southwestern China is characterized by steep mountains and deep valleys and is strongly affected by the uplift activity of the Qinghai–Tibet Plateau. Furthermore, there is abundant loose material and rainfall in this area. Therefore, it is a severe disaster zone in terms of debris flow. In the past 3 years, 70 typical debris flows distributed along the Brahmaputra River, Nujiang River, Yalong River, Dadu River, and Ming River are investigated. The location of the debris flows is shown in Fig. 1, and some typical debris flows are shown in Fig. 2. Based on the field investigation, the characteristics of the five water catchments are summarized as follows.
-
Upstream of the Brahmaputra River, 18 debris flow gullies along the Dagu River and Jiexu River are investigated. The lithology in this area is the irruptive rock of the late Yanshanian–Himalayan epoch, with a wide distribution of granodiorite. The average annual rainfall in this area is about 540 mm and concentrates mostly in summer. Large-scale ice-melting-type debris flow once occurred in this region. However, in recent years, the debris flows in this area are mainly caused by precipitation. Material reserves are abundant in the valleys, whereas unstable materials are found less frequently and the deposit zone is small. It is found that most of the debris flows in this area are in the decline phase, and that most debris flow gullies are in the low-frequency category.
-
In the midstream of the Nujiang River catchment, 11 debris flow gullies located in the Zuogong River section are investigated. The stratum mainly includes the Permian Nacuo group slate and Triassic Wapu group marble. As this region is located in the subtropical zone south of the Himalayas, it is characterized by a humid climate and plentiful precipitation. This leads to an extensive distribution of debris flow gullies.
-
Midstream in the Yalong River catchment, 27 debris flow valleys are investigated, which belong to a plateau climate zone with complex meteorological and hydrological conditions. The concentricity and suddenness of rainfall provide hydraulic conditions for the debris flow breakouts. Collapses and landslides in the valley occur frequently, which provide abundant material resources for the debris flow occurrence. Moreover, the debris flow activity is intensified by unreasonable human engineering activities, such as deforestation and accumulation of highway waste residue.
-
In the Dadu River catchment, 42 gullies in the midstream and the upstream are surveyed. This area is characterized by intense new tectonic movement, high earthquake intensity, and rock fragmentation on the mountain surface. Debris flow, collapse, and other geological disasters are widely distributed, and the deposit zone of the debris flow is large. The maturity of the valley is high.
-
In the Minjiang River catchment, the Wenchuan River section are surveyed, and 32 debris flows are investigated. This region is characterized by abundant loose materials, frequent debris flows, and a high possibility of the breakout of large-scale debris flows. Most of these debris flows are intensive in activity and have not declined in recent times.
3.1 Investigation and statistical data
In total, 70 debris flow gullies distributed in five water catchments in southwestern China were investigated from the gully outlet to the watershed over the past 3 years. This work includes the investigation of the watershed terrain, geological structure, outbreak scale, loose material distribution, processes of occurrence and movement, frequency of debris flows, and so on. The role of each factor causing instability of the source materials are analyzed.
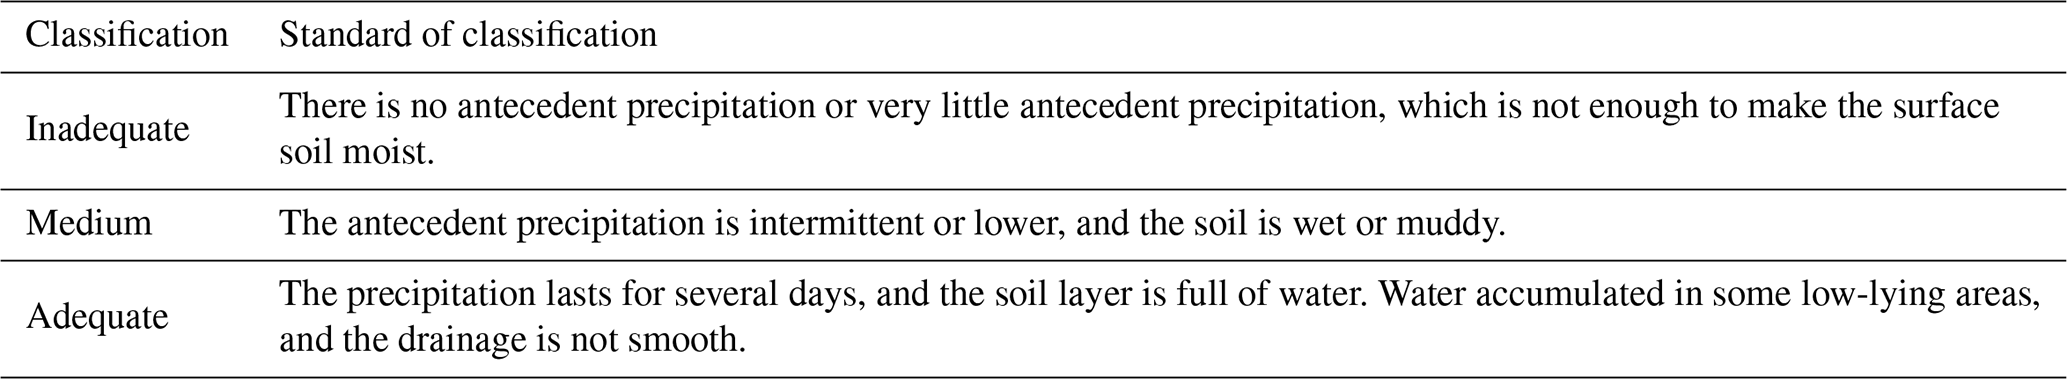
The antecedent precipitation can reduce the soil shear strength, and has an important influence on the formation and the scale of debris flows (Shieh et al., 2009). Therefore, the precipitation data before the outbreak of debris flows was collected from local meteorological bureaus and used as one of the main influence factors to assess the susceptibility of debris flows in this study. In this work, the antecedent precipitation is classified into three categories: inadequate, medium, and adequate. The classification criteria are listed in Table 1.
Table 1Qualitative grading criteria of antecedent precipitation.
3.2 Field test
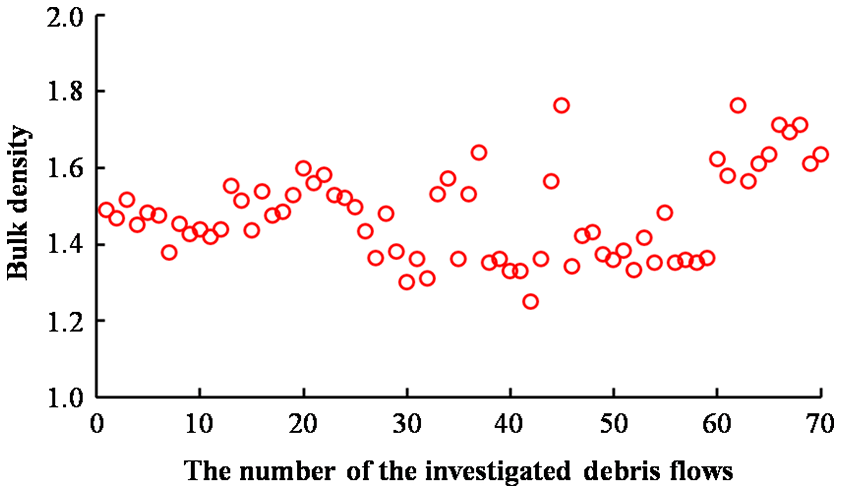
Bulk density tests and soil screening tests are carried out in the 70 debris flow deposit areas. Figure 3 shows the results of the bulk density tests. The bulk densities of the soil material in the debris flow deposits are mainly between 1.3 and 1.8 g cm−3, and the average bulk density is about 1.48 g cm−3. The results of the screening test show that the material composition in the deposit zone is mainly composed of block gravel mixed soil, the content of the block gravel is 30 %–50 %, the content of silt and clay is about 20 %–40 %, and the rest of the deposit material is breccia. The reason for the high content of coarse stone soil is that the collapse phenomenon is quite common due to the active crustal movement in the study area.
3.3 Drilling and geophysical prospecting
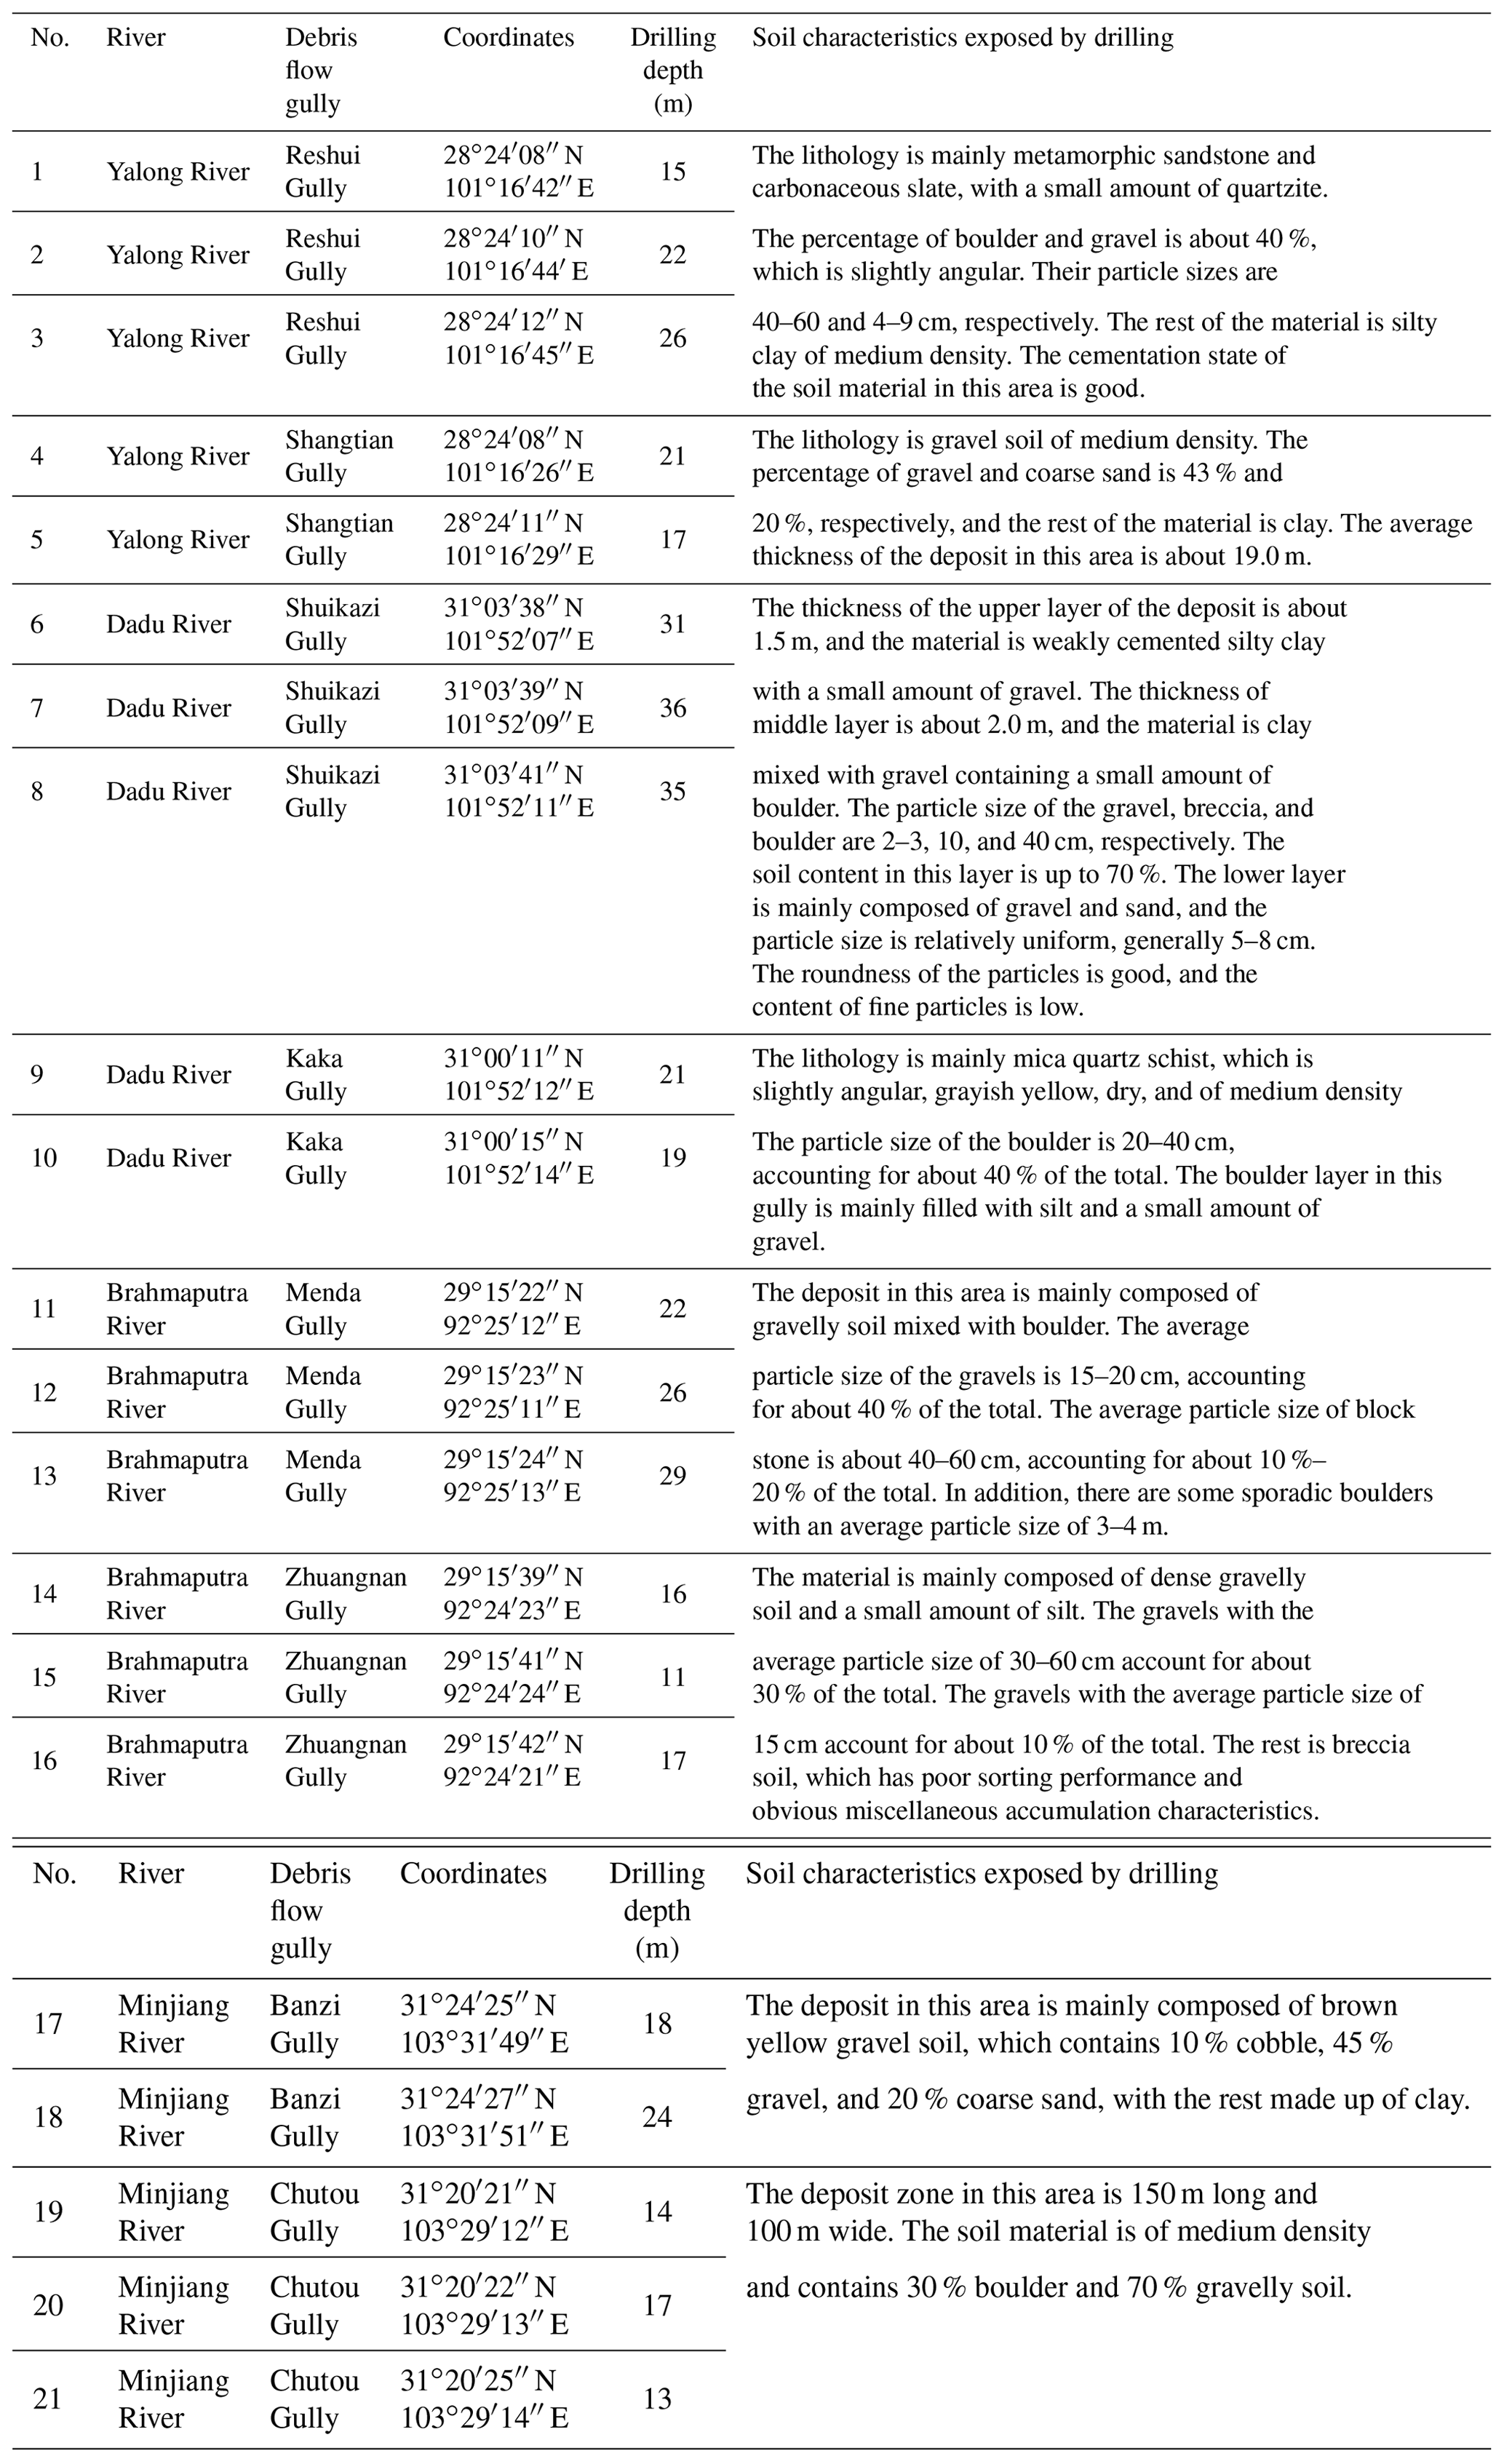
The geologic condition in the active debris flow gullies in southwestern China is very complicated. To investigate the material composition and the thickness of the deposit area, the geological drilling was conducted in the active debris flow gullies along the Dadu River, Yalong River, Yaluzangbo River, and Minjiang River. The drilling information, such as the drilling location, drilling depth, and soil characteristics, are provided in Table 2.
3.4 Statistical technique
The statistical techniques can be grouped into bivariate and multivariate methods. A bivariate statistical method analyses each parameter individually; therefore, the calculation and application in bivariate statistical models are straightforward and efficient (Suzen and Doyuran, 2004). On the other hand, a multivariate statistical method considers the interaction of all parameters in controlling the occurrence of a phenomenon and is considered one of the best methods in predicting debris flow susceptibility (Lucà et al., 2011). Hayashi's quantification theory is a well-known multivariate statistical method developed by Hayashi (1961). The Type I quantification theory applies multiple linear regression methods, which can simultaneously process qualitative and quantitative variables, and evaluate the weight of each variable. Therefore, it is widely used in various fields (Matsumura, 2004; Ishihara et al., 2007; Inoue et al., 2009; Shen and Chen, 2018). In this method, the qualitative and quantitative variables can be mutually transformed based on a reasonable principle. Therefore, this method has very good applicability for processing the quantitative and qualitative influencing factors of debris flow risk.
In Hayashi's Type I quantification theory , qualitative variables are termed items. All possibilities for each item are termed categories. A dummy variable δi(j, k) is introduced in the method to express the response of an item and the category for each sample:
where n is the number of samples and m denotes the number of items.
The response matrix X can be expressed as a n×p order matrix composed of all categories δi(j, k):
To establish a quantitative analysis model, the qualitative and quantitative in situ observations are used to fit the linear relationship between the concerned independent variable and the dependent variable. In Hayashi's Type I quantification theory , the random variable changes with the m variables:
where yi represents the susceptibility of the ith debris flow gully, rj is the number of categories of the item j, bjk is a constant coefficient depending on category k in item j, and εi is a random error.
To establish an analysis model of debris flow susceptibility, some necessary steps should be followed based on Hayashi's Type I quantification theory: (1) building an index system, (2) selecting samples and assigning values, (3) establishing the analysis model using single slopes, (4) conducting a significance test of the regression equation and each variable, and (5) applying this analysis model to regional debris flow hazards evaluation.
4.1 Indexes and categories in the statistical model
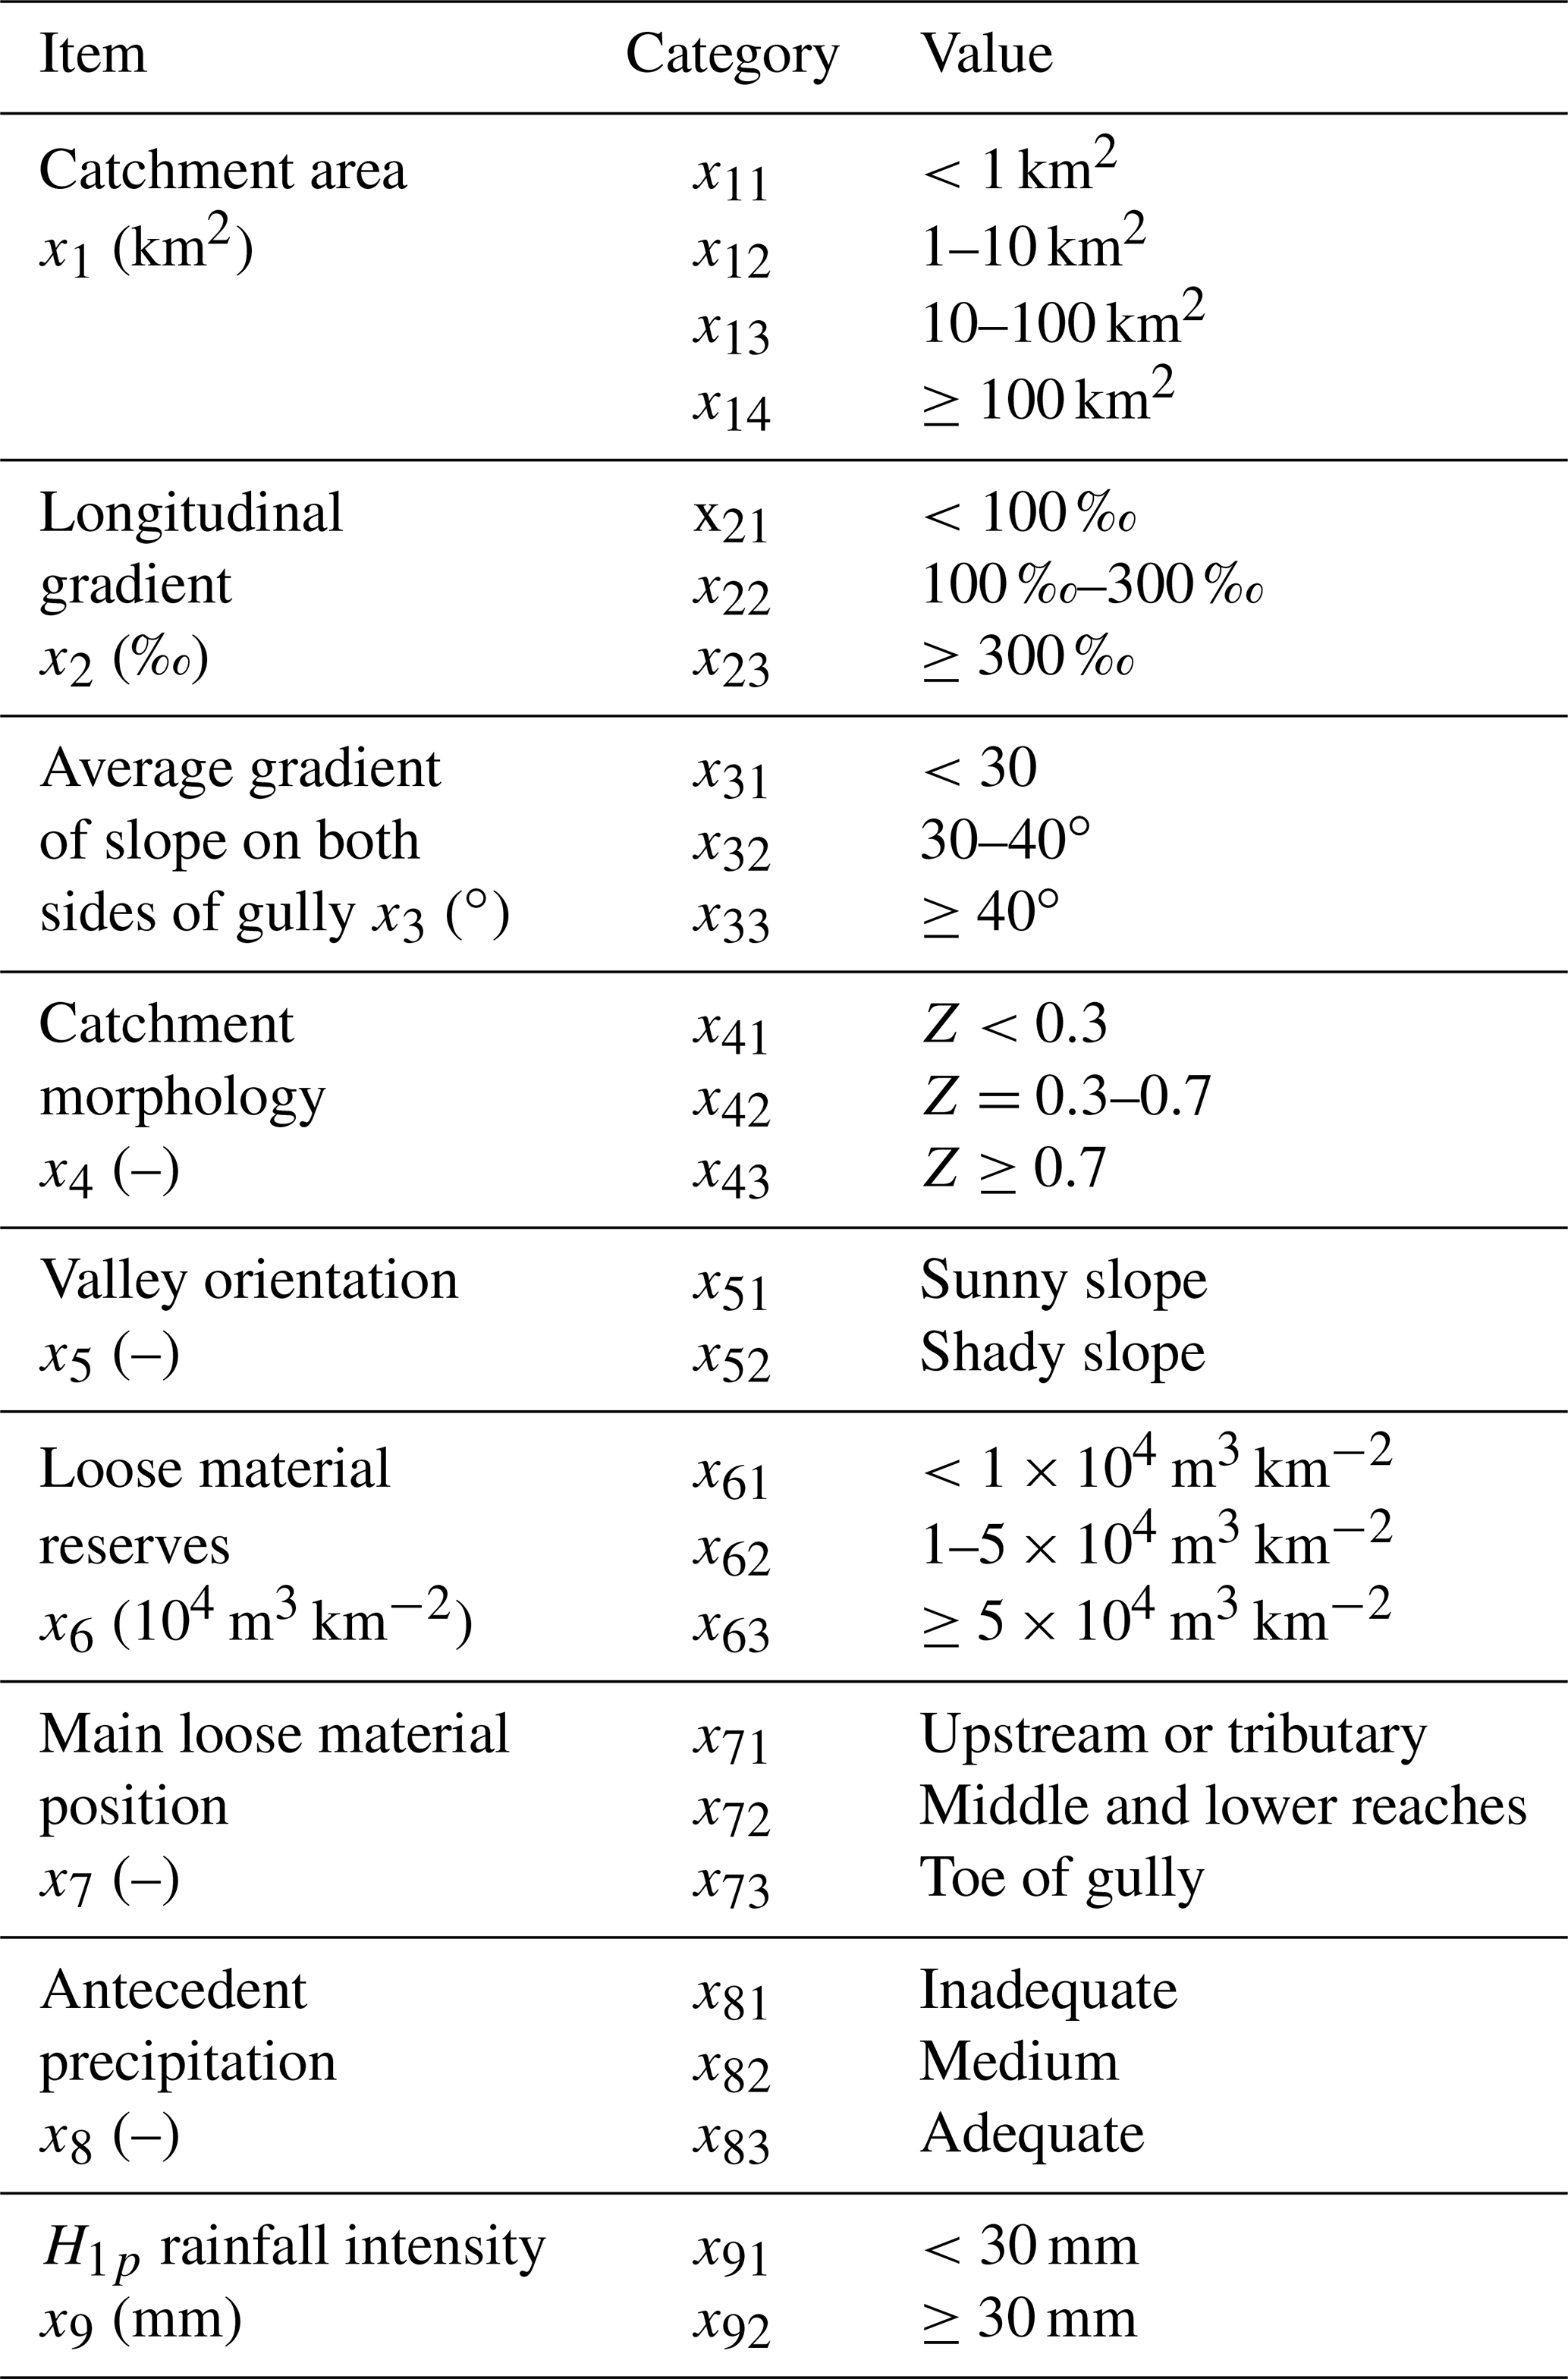
There are many factors that affect debris flow formation and development. From the perspective of source material of the debris flows, the main influence factors are catchment area, loose material position, and loose material reserves. The antecedent precipitation and H1p rainfall intensity are the main generating conditions of debris flows. Aside from this, the catchment morphology, longitudinal gradient, average gradient of slope on both sides of the gully, and valley orientation are the main factors affecting the development of debris flows. Therefore, these nine indexes (listed in Table 3) are selected in this study to assess the susceptibility of debris flows. Each factor is classified into certain categories according to the values shown in Table 4.
Table 3The nine indexes used in the prediction model of debris flow susceptibility.

Table 4Grading criteria of the evaluation indexes in the prediction model of debris flow susceptibility.
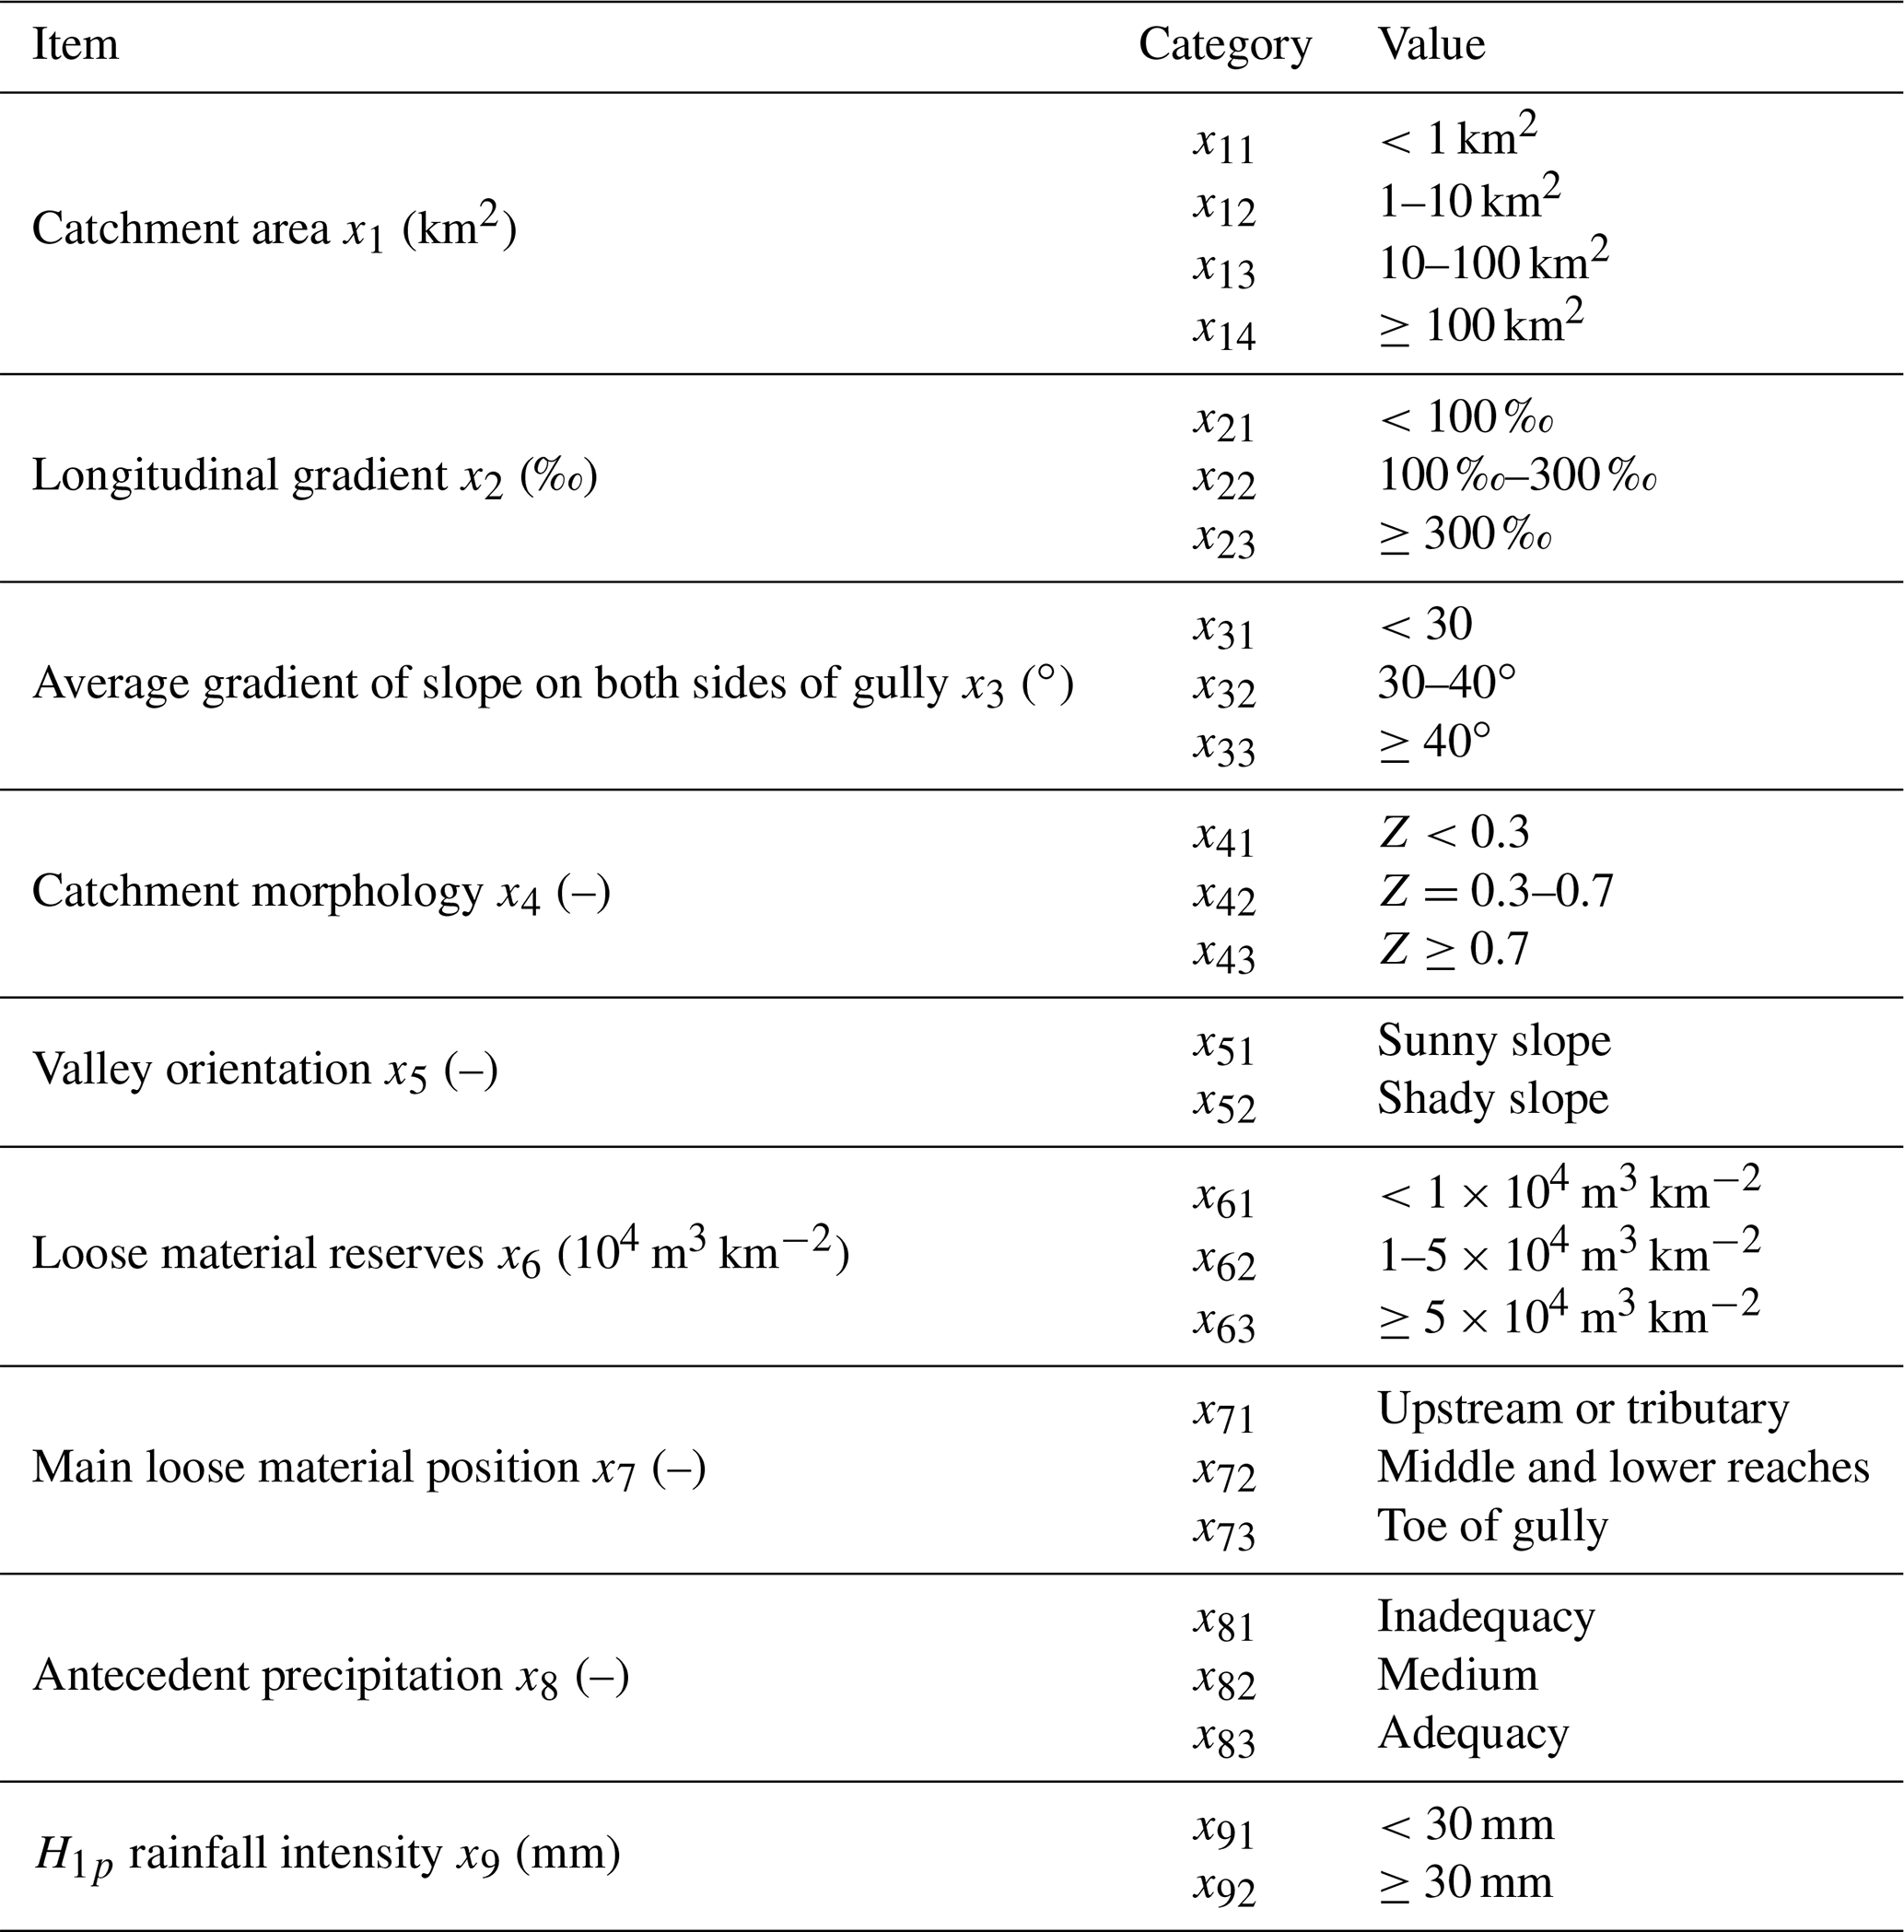
Note that Z is the length to width ratio of the debris gully.
4.2 Sample quantification
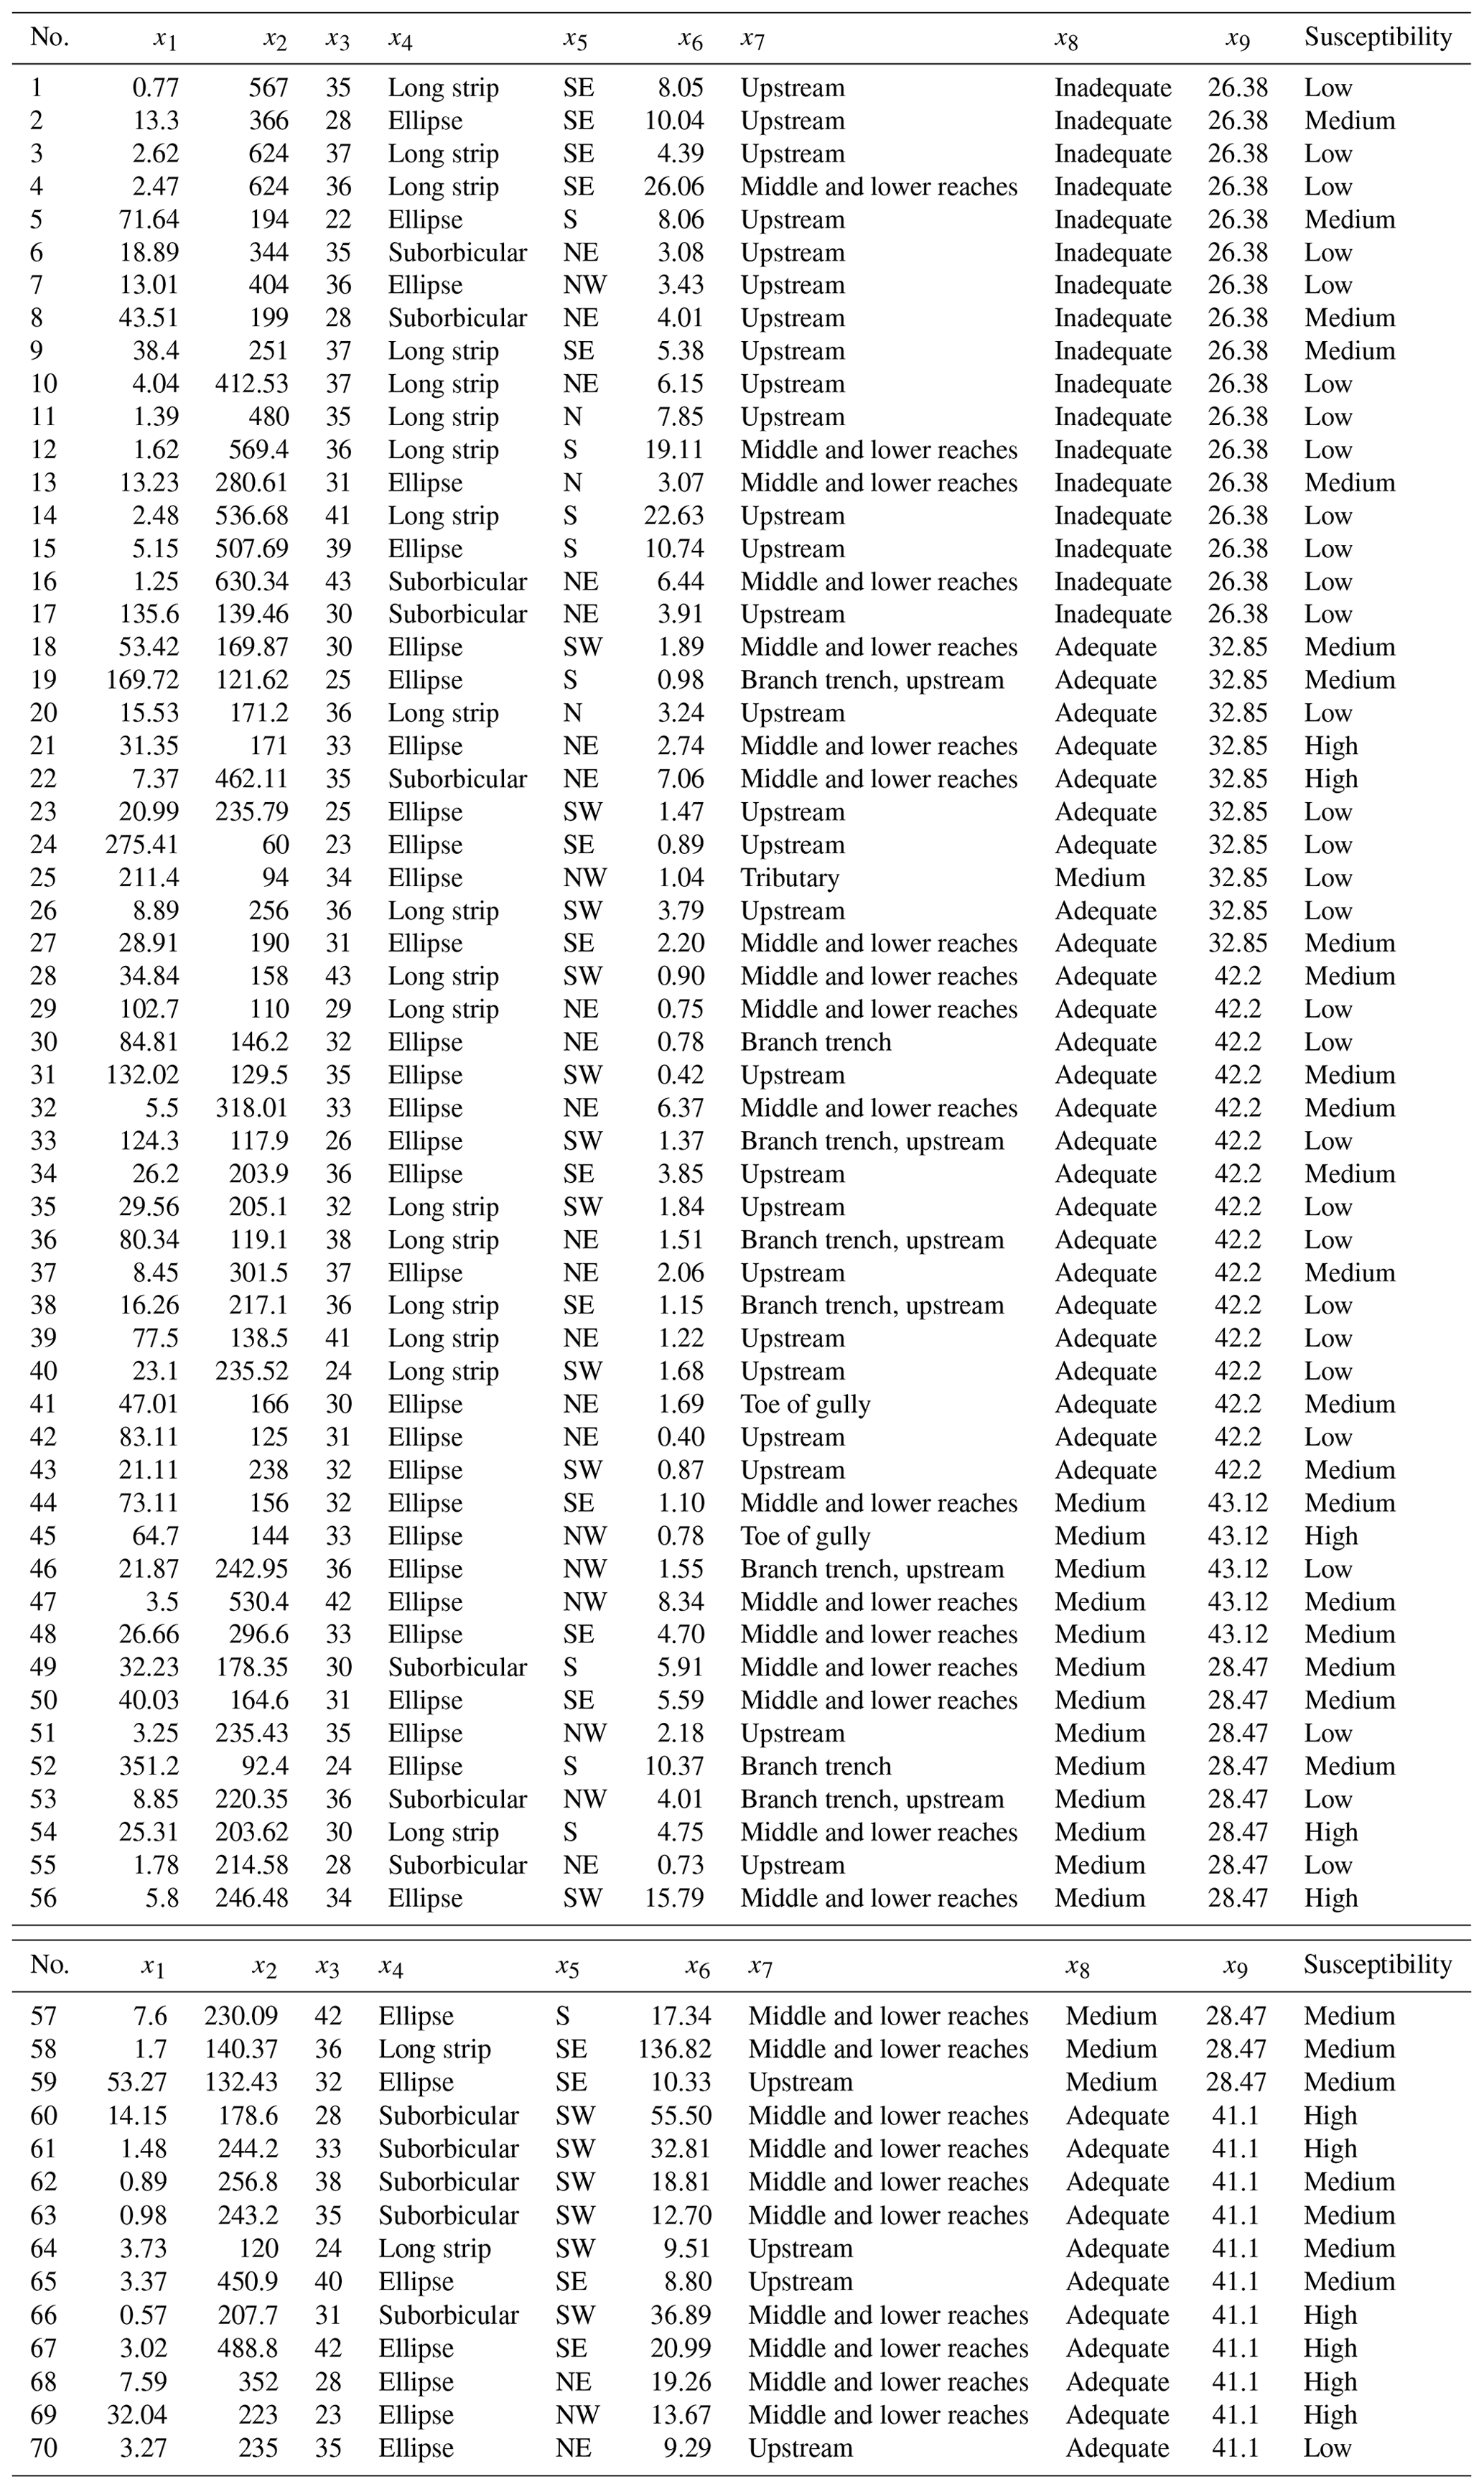
A total of 70 debris flow gullies in southwestern China are selected as the sample to evaluate the performance of the statistical model. Detailed information about these debris flow gullies is given in Table 5. The values of the samples are assigned according to Eq. (1), and the response from each category is obtained. The sample data then can be transformed into a “0–1” reflection matrix.
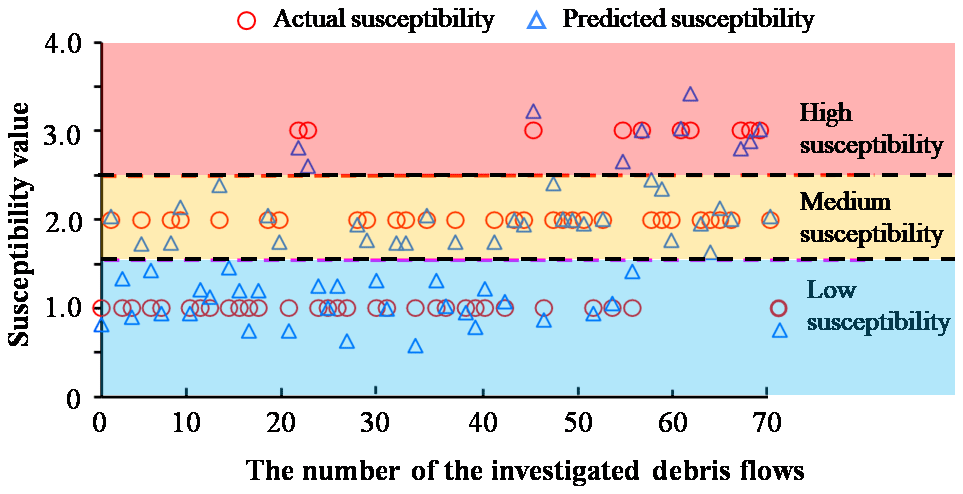
Figure 4Typical characteristics of the Danba section in the upper reaches of the Dadu River.
4.3 Statistical model based on Hayashi's quantification theory
When the quantitative theory and regression analysis take the binary-state variables 0 and 1, the equation can be revised as the following linear regression expression:
Based on Eq. (4) and matrix derivation regression calculation, the contribution values of each item are obtained, as shown in Table 6.
Substituting the numerical values in Eq. (4), the susceptibility prediction model of debris flow is established, which can be represented as follows:
In Eq. (5), Y is the susceptibility for the debris flow, and the meanings of x11, x12, x13, and other indexes are detailed in Table 4. Based on the statistical analysis of the debris flows that occurred in southwestern China, the susceptibility values are classified into three categories in the proposed model:
5.1 Fitting degree analysis
R2 is the fitting degree, which is widely used to evaluate the accuracy of prediction models. As shown in Table 7, the fitting degree of the proposed model is 71.8 %, which shows that this model can precisely predict the susceptibility of debris flows in southwestern China.

5.2 Self-test coincidence rate
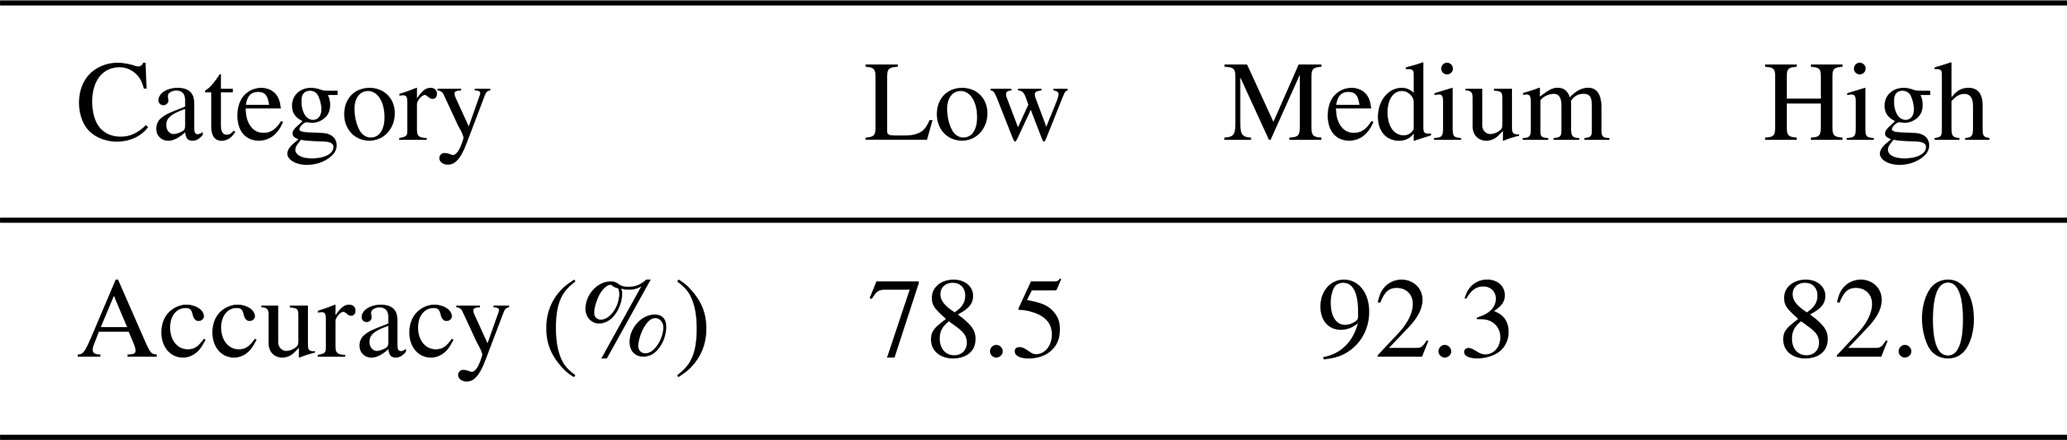
The values of each index are used in the established model to calculate the predicted values of the susceptibility based on Eq. (5), and then the predicted values are compared with the actual susceptibility. In this study, self-test coincidence rate is defined as the ratio of the predicted result to the actual susceptibility. As shown in Fig. 4, the predicted values of debris flow susceptibility are graded. For the calculated results listed in Table 8, the prediction accuracy for the low-susceptibility, medium-susceptibility, and high-susceptibility debris flows are 78.5 %, 92.3 %, and 82.0 %, respectively, which indicates that the proposed model can predict the debris flow susceptibility well.

5.3 Residual error analysis
Residual error is the difference between a group of values observed and their arithmetical mean. As shown in Fig. 5, the residual error of the model mainly fluctuates by ±0.45, which indicates that the regression line can fit the field value well, and the residual frequency is approximately close to the normal distribution.
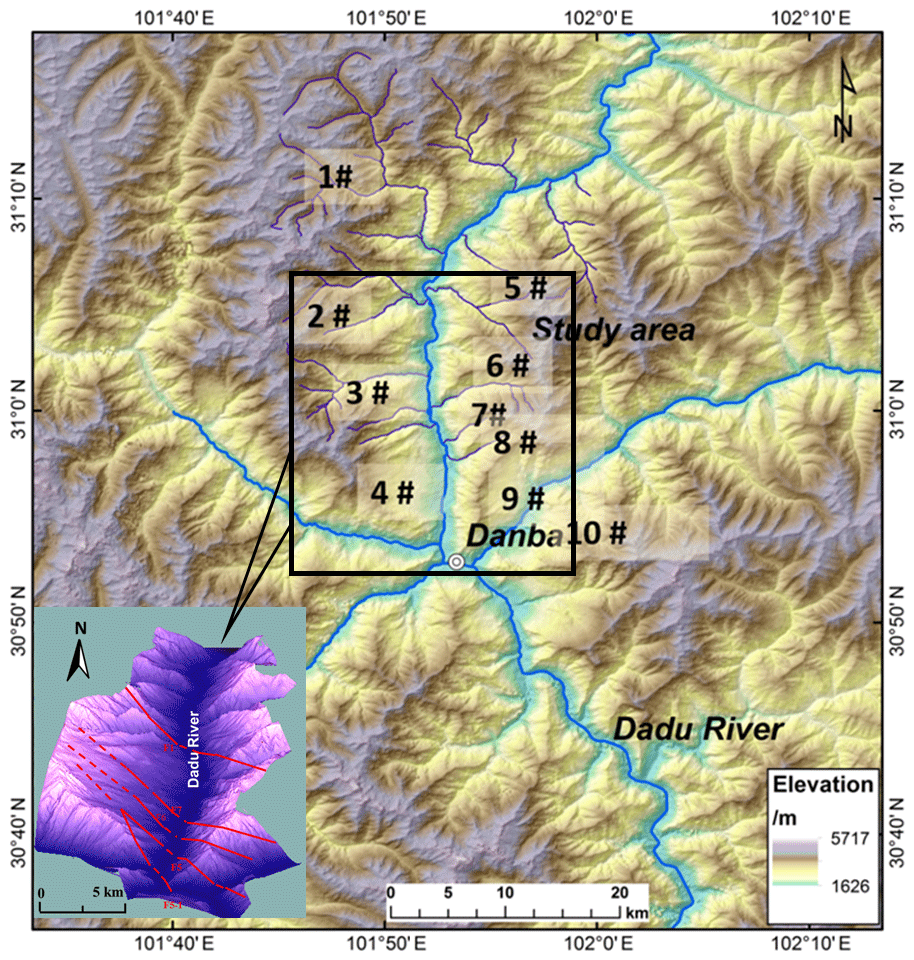
Figure 6Residual distribution in the regression model of debris flow susceptibility.
5.4 Verification of proposed model
The Kaka basin is located on the upper part of the Dadu River, southeast of the Qinghai–Tibet Plateau. The valley is deep and the river runs from north to south. The regional topography is characterized by high altitudes in the east and low altitudes in the west. The terrain is composed of high mountains with elevations of 2000 m. There are three layers of wide valley mesas, and the uplift of mountains and river erosion is significant in this area. The river elevation in the Kaka basin is approximately 1800 m, the river width is 140–185 m, and the slope angle is approximately 45–60∘. The main faults are denoted as F1, F5, F5-1, F6, and F7 in Fig. 6. The strike is in a northwest direction, and they have a 40–60∘ angle with the river. A series of debris flow gullies have occurred in the basin.

A total of 10 typical debris flow gullies upstream of the Dadu River are selected as samples for the model validation (as shown in Fig. 7, and listed in Table 9). The accuracy of the established model is verified through the comparison with field investigation results. Table 9 provides the relevant basic data for the samples. Each secondary index is transformed into a 0–1 mode, and all the samples are adopted to construct a 9×26 matrix. Table 10 shows the predicted susceptibility from the proposed model, and the actual susceptibility obtained by the field investigation. The comparison shows that the accuracy rate of the model is 90 %, and only the prediction result of the Linong Gully deviates from the actual susceptibility. Therefore, detailed field investigation was then carried out to analyze the debris flow susceptibility in the Linong Gully.

Table 10Comparison of predicted values and actual measured values.
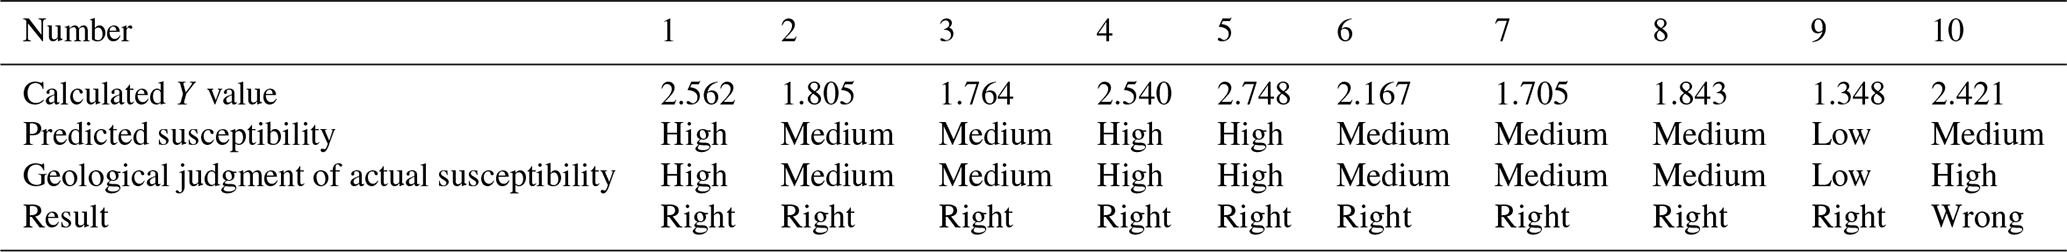
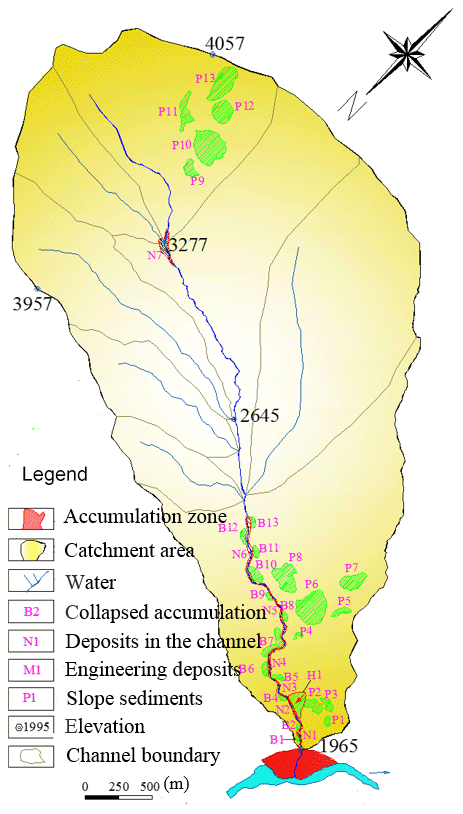
Figure 8Distribution of loose deposits of Linong Gully.
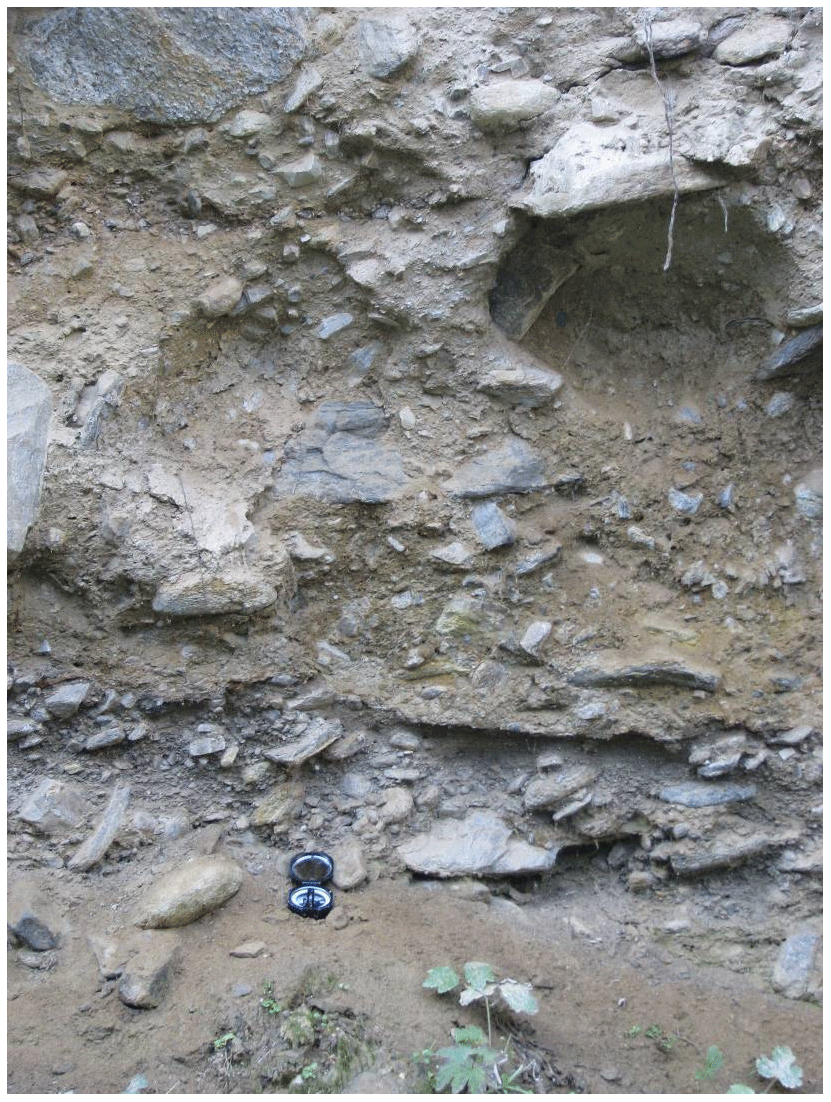
Figure 8 shows the catchment of the Linong Gully. The total area of the catchment is about 10.09 km2, and the total amount of loose material is about 4.04×10⁶ m3. The soil material, as shown in Fig. 9, is mainly composed of block and crushed stone. Their particle sizes are generally 10–40 cm. In the calculation process, the catchment area is quite large and the loose material per catchment area is relatively very small, as shown in Fig. 8. Based on the data, the prediction susceptibility of the Linong Gully is 2.421, which is very close to the high susceptibility threshold value 2.5. Therefore, although there is a minor deviation, it can still be concluded that the proposed model can perform well in predicting debris flow susceptibility in southwestern China.
Debris flows frequently occurred in southwestern China and resulted in severe damage to dwellings and lifelines. Based on Hayashi's Type I quantification theory , an initiation susceptibility model of debris flows in southwestern China was proposed in this work. The following conclusions can be drawn.
-
According to the topography and geomorphology characteristics in southwestern China, the following nine indexes were used as evaluation factors of debris flow initiation susceptibility: the catchment area, longitudinal gradient, average gradient of the slope on both sides of the gully, catchment morphology, valley orientation, loose material reserves, location of the main loose material, antecedent precipitation, and rainfall intensity.
-
A total of 70 typical debris flow gullies distributed along the Brahmaputra River, Nujiang River, Yalong River, Dadu River, and Ming River were investigated as statistical samples. The parameters of the prediction model were obtained based on Hayashi's quantitative theory and regression analysis.
-
The proposed model was applied to analyze the initiation susceptibility of 10 debris flow gullies located upstream of the Dadu River, and the result showed that the judgment coincidence rate is 90 %, indicating that the proposed model can accurately predict the initiation susceptibility of debris flow gullies in southwestern China.
The data in this paper are not provided due to the confidentiality. Notwithstanding, the authors will try to address specific requests for scientific purposes.
FJ developed the model. RL did the field investigation. ZD prepared the manuscript with contributions from all co-authors.
The authors declare that they have no conflict of interest.
This article is part of the special issue “Advances in extreme value analysis and application to natural hazards”. It is not associated with a conference.
The presented work was supported by the Sichuan Science and Technology Program (no. 2018JY0471), Sichuan Provincial Youth Science and Technology Innovation Team Special Projects of China (no. 2017TD0018), the Open Fund of Key Laboratory of Geological Hazards on Three Gorges Reservoir Area (China Three Gorges University) (no. 2018KDZ01), the Chinese Ministry of Education, and the JSPS Grant-in-Aid for Early Career Scientists (no. 19K14804).
This research has been supported by the Sichuan Science and Technology Program (grant no. 2018JY0471), the Open Fund of State Key laboratory of Geohazard Prevention and Geoenvironmental Protection (Chengdu University of Technology (grant no. SKLGP2017K005), the Open Fund of Key Laboratory of Geological Hazards on Three Gorges Reservoir Area (China Three Gorges University) (grant no. 2018KDZ01), the Chinese Ministry of Education, and the JSPS Grant-in-Aid for Early Career Scientists (grant no. 19K14804).
This paper was edited by Yasser Hamdi and reviewed by three anonymous referees.
Beguería, S., Van Asch, T. W., Malet, J. P., and Gröndahl, S.: A GIS-based numerical model for simulating the kinematics of mud and debris flows over complex terrain, Nat. Hazards Earth Syst. Sci., 9, 1897–1909, https://doi.org/10.5194/nhess-9-1897-2009, 2009.
Bertrand, M., Liébault, F., and Piégay, H.: Debris-flow susceptibility of upland catchments, Nat. Hazards, 67, 497–511, https://doi.org/10.1007/s11069-013-0575-4, 2013.
Blahut, J., van Westen, C. J., and Sterlacchini, S.: Analysis of landslide inventories for accurate prediction of debris-flow source areas, Geomorphology, 119, 36–51, https://doi.org/10.1016/j.geomorph.2010.02.017, 2010.
Brayshaw, D. and Hassan, M. A.: Debris flow initiation and sediment recharge in gullies, Geomorphology, 109, 122–131, https://doi.org/10.1016/j.geomorph.2009.02.021, 2009.
Cama, M., Lombardo, L., Conoscenti, C., and Rotigliano, E.: Improving transferability strategies for debris flow susceptibility assessment: Application to the Saponara and Itala catchments (Messina, Italy), Geomorphology, 288, 52–65, https://doi.org/10.1016/j.geomorph.2017.03.025, 2017.
Carrara, A., Crosta, G., and Frattini, P.: Comparing models of debris-flow susceptibility in the alpine environment, Geomorphology, 94, 353–378, https://doi.org/10.1016/j.geomorph.2006.10.033, 2008.
Dai, Z., Huang, Y., Cheng, H., and Xu, Q.: SPH model for fluid–structure interaction and its application to debris flow impact estimation, Landslides, 14, 917–928, https://doi.org/10.1007/s10346-016-0777-4, 2017.
Di, B. F., Zhang, H. Y., Liu, Y. Y., Li, J. R., Chen, N. S., Stamatopoulos, C. A., Luo, Y. Z., and Zhan, Y.: Assessing Susceptibility of Debris Flow in Southwest China Using Gradient Boosting Machine, Sediment Res., 9, 12532, https://doi.org/10.1038/s41598-019-48986-5, 2019.
Gao, Y., Sun, D. A., Zhu, Z. C., and Xu, Y. F.: Hydromechanical behavior of unsaturated soil with different initial densities over a wide suction range, Acta Geotech., 14, 417–428, https://doi.org/10.1007/s11440-018-0662-5, 2019.
Gregoretti, C., Degetto, M., and Boreggio, M.: GIS-based cell model for simulating debris flow runout on a fan, J. Hydrol., 534, 326–340, https://doi.org/10.1016/j.jhydrol.2015.12.054, 2016.
Hayashi, C.: Sample survey and theory of quantification, Bull. Inter. Stat. Inst., 38, 505–514, 1961.
Horton, P., Jaboyedoff, M., Rudaz, B. E. A., and Zimmermann, M.: Flow-R, a model for susceptibility mapping of debris flows and other gravitational hazards at a regional scale, Nat. Hazards Earth Syst. Sci., 13, 869–885, https://doi.org/10.5194/nhess-13-869-2013, 2013.
Huang, Y., Cheng, H., Dai, Z., Xu, Q., Liu, F., Sawada, K., Moriguchi, S., and Yashima, A. SPH-based numerical simulation of catastrophic debris flows after the 2008 Wenchuan earthquake, B. Eng. Geol. Environ., 74, 1137–1151, https://doi.org/10.1007/s10064-014-0705-6, 2015.
Hürlimann, M., Abancó, C., and Moya, J.: Rockfalls detached from a lateral moraine during spring season. 2010 and 2011 events observed at the Rebaixader debris-flow monitoring site (Central Pyrenees, Spain), Landslides, 9, 385–393, https://doi.org/10.1007/s10346-011-0314-4, 2012.
Inoue, H., Tabata, H., and Tsuji, H.: Emotion color combination models using the quantification theory type I and its application to uniform color combination, T. Jpn. Soc. Kansei Eng., 8, 775–781, 2009.
Ishihara, S., Nagamachi, M., and Ishihara, K.: Analyzing Kansei and design elements relations with PLS, in: 10th Quality Management and Organiqatinal Development (QMOD) Conference, No. 026, 18–20 June 2007, Helsingborg, Sweden, 2007.
Jomelli, V., Pavlova, I., Eckert, N., Grancher, D., and Brunstein, D.: A new hierarchical Bayesian approach to analyse environmental and climatic influences on debris flow occurrence, Geomorphology, 250, 407–421, https://doi.org/10.1016/j.geomorph.2015.05.022, 2015.
Kang, S. and Lee, S. R.: Debris flow susceptibility assessment based on an empirical approach in the central region of South Korea, Geomorphology, 308, 1–12, https://doi.org/10.1016/j.geomorph.2018.01.025, 2018.
Kappes, M. S., Malet, J. P., Remaître, A., Horton, P., Jaboyedoff, M., and Bell, R.: Assessment of debris-flow susceptibility at medium-scale in the Barcelonnette Basin, France, Nat. Hazards Earth Syst. Sci., 11, 627–641, https://doi.org/10.5194/nhess-11-627-2011, 2011.
Li, Y., Wang, H., Chen, J., and Shang, Y.: Debris flow susceptibility assessment in the Wudongde Dam area, China based on rock engineering system and fuzzy C-means algorithm, Water, 9, 669, https://doi.org/10.3390/w9090669, 2017.
Liu, G., Dai, E., Xu, X., Wu, W., and Xiang, A.: Quantitative assessment of regional debris-flow risk: a case study in Southwest China, Sustainability, 10, 2223, https://doi.org/10.3390/su10072223, 2018.
Lucà, F., Conforti, M., and Robustelli, G.: Comparison of GIS-based gullying susceptibility mapping using bivariate and multivariate statistics: Northern Calabria, South Italy, Geomorphology, 134, 297–308, https://doi.org/10.1016/j.geomorph.2011.07.006, 2011.
Matsumura, T.: Analysis of ovipositional environment using Quantification Theory Type I: the case of the butterfly, Luehdorfia puziloi inexpecta (Papilionidae), J. Insect Conserv., 8, 59–67, https://doi.org/10.1023/B:JICO.0000027509.99459.b5, 2004.
Moraci, N., Mandaglio, M. C., Gioffrè, D., and Pitasi, A.: Debris flow susceptibility zoning: an approach applied to a study area, Riv. Ital. Geotec., 51, 47–62, https://doi.org/10.19199/2017.2.0557-1405.047, 2017.
Pirulli, M. and Sorbino, G.: Assessing potential debris flow runout: a comparison of two simulation models, Nat. Hazards Earth Syst. Sci., 8, 961–971, https://doi.org/10.5194/nhess-8-961-2008, 2008.
Prieto, J. A., Journeay, M., Acevedo, A. B., Arbelaez, J. D., and Ulmi, M.: Development of structural debris flow fragility curves (debris flow buildings resistance) using momentum flux rate as a hazard parameter, Eng. Geol., 239, 144–157, https://doi.org/10.1016/j.enggeo.2018.03.014, 2018.
Rosatti, G., Zorzi, N., Zugliani, D., Piffer, S., and Rizzi, A.: A Web Service ecosystem for high-quality, cost-effective debris-flow hazard assessment, Environ. Model. Softw., 100, 33–47, https://doi.org/10.1016/j.envsoft.2017.11.017, 2018.
Schürch, P., Densmore, A. L., Rosser, N. J., and McArdell, B. W.: Dynamic controls on erosion and deposition on debris-flow fans, Geology, 39, 827–830, https://doi.org/10.1130/G32103.1, 2011.
Shen K. S. and Chen, K. H.: Exploring the Critical Appeal of Mobility-Augmented Reality Games, in: International Conference on Kansei Engineering & Emotion Research, 19–22 March 2018, Kuching, Sarawak, Malaysia, 451–459, 2018.
Shieh, C. L., Chen, Y. S., Tsai, Y. J., and Wu, J. H.: Variability in rainfall threshold for debris flow after the Chi-Chi earthquake in central Taiwan, China, Int. J. Sediment Res., 24, 177–188, https://doi.org/10.1016/S1001-6279(09)60025-1, 2009.
Suzen, L. M. and Doyuran, V.: A comparison of the GIS based landslide susceptibility assessment methods: multivariate versus bivariate, Environ. Geol., 45, 665–679, https://doi.org/10.1007/s00254-003-0917-8, 2004.
Wang, Q., Kong, Y., Zhang, W., Chen, J., Xu, P., Li, H., Xue, Y., Yuan, X., Zhan, J., and Zhu, Y.: Regional debris flow susceptibility analysis based on principal component analysis and self-organizing map: a case study in Southwest China, Arab. J. Geosci., 9, 718, https://doi.org/10.1007/s12517-016-2752-8, 2016.
Wu, S., Chen, J., Zhou, W., Iqbal, J., and Yao, L.: A modified Logit model for assessment and validation of debris-flow susceptibility, B. Eng. Geol. Environ., 78, 4421–4438, https://doi.org/10.1007/s10064-018-1412-5, 2019.
Wu, S., Chen, J., Xu, C., Zhou, W., Yao, L., Yue, W., and Cui, Z.: Susceptibility Assessments and Validations of Debris-Flow Events in Meizoseismal Areas: Case Study in China's Longxi River Watershed, Nat. Hazards Rev., 21, 05019005, https://doi.org/10.1061/(ASCE)NH.1527-6996.0000347, 2020.
Xu, Q., Zhang, S., Li, W. L., and Van Asch, T. W.: The 13 August 2010 catastrophic debris flows after the 2008 Wenchuan earthquake, China, Nat. Hazards Earth Syst. Sci., 12, 201–216, https://doi.org/10.5194/nhess-12-201-2012, 2012.
Zhao, F. C.: Chinese drainage map, China Atlas Press, Beijing, China, 2014.
Zou, Q., Cui, P., He, J., Lei, Y., and Li, S.: Regional risk assessment of debris flows in China – An HRU-based approach, Geomorphology, 340, 84–102, https://doi.org/10.1016/j.geomorph.2019.04.027, 2019.
- Abstract
- Introduction
- Characteristics of the debris flows in the study area
- Methodology
- Model generation and results
- Validation and discussion
- Conclusions
- Data availability
- Author contributions
- Competing interests
- Special issue statement
- Acknowledgements
- Financial support
- Review statement
- References