the Creative Commons Attribution 4.0 License.
the Creative Commons Attribution 4.0 License.
Coastal vulnerability assessment: through regional to local downscaling of wave characteristics along the Bay of Lalzit (Albania)
Francesco De Leo
Giovanni Besio
Guido Zolezzi
Marco Bezzi
Coastal vulnerability is evaluated against inundation risk triggered by wave run-up through the evaluation of vulnerability levels (referred to as VLs) introduced by Bosom and Jiménez (2011). VLs are assessed through different wave climate characterizations, referring to regional (offshore wave climate) or local (nearshore wave climate) scales. The study is set along the Bay of Lalzit, a coastal area near Durrës (Albania). The analysis reveals that the results vary due to uncertainties inherent in the run-up estimation, showing that the computational procedure should be developed by taking into account detailed information about the local wave climate. Different approaches in choosing wave characteristics for run-up estimation significantly affect the estimate of shoreline vulnerability. The analysis also shows the feasibility and challenges of applying VL estimates in contexts characterized by limited data availability through targeted field measurements of the coast geomorphology and an overall understanding of the recent coastal dynamics and related controlling factors.
- Article
(5145 KB) - Full-text XML
- BibTeX
- EndNote
Coastal zones are often characterized by a fragile equilibrium, being subjected to hydro-geomorphic processes that change their shape over time and space and are also under stress due to the presence of conflicting human activities (Kamphuis, 2010). Moreover, these areas have a huge socio-economic value, which has often triggered their high exploitation in the last decades: coastal population, together with maritime commerce and coastal tourism, is constantly increasing (Neumann et al., 2015). This implies enhanced anthropogenic pressures, which challenge the sustainable management and preservation of coastal zones.
The present paper focuses on extreme natural storm events and on their impact on coastal vulnerability within such a complex framework. As clearly specified by the Integrated Protocol on Coastal Zone Management (ICZM), the effect of storms should be embedded into coastal zone territorial plans and policies, yielding coastal vulnerability assessment (UNEP, 2008). Efficient assessment and decision support tools are required, providing easily accessible information for decision makers. Coastal vulnerability assessment represents a viable option because it is helpful to classify the shorelines in relation to their vulnerability towards extreme events, such as storm-induced inundation and erosion.
This usually requires taking into account the long-term wave statistics and the geomorphology of the beaches to evaluate the level of risk they are exposed to. The estimate of the environmental risk, coupled with the evaluation of the existing anthropic pressure (economic and industrial activities), leads to vulnerability maps. Different approaches to compute coastal vulnerability have been so far proposed, which differently combine relevant environmental and socio-economic variables (Gornitz et al., 1994; Soukissian et al., 2010; Di Paola et al., 2014; Fitton et al., 2016; Satta et al., 2016; Ciccarelli et al., 2017; Ferreira et al., 2017; Ferreira Silva et al., 2017; Montreuil et al., 2017; Narra et al., 2017; Mavromatidi et al., 2018, among others). A methodological issue of particular concern is related to the computation of wave climate characteristics suitable for estimating vulnerability levels (VLs) that are of management significance. This can be illustrated by referring to the practical procedure proposed by Bosom and Jiménez (2011) to assess coastal vulnerability to inundation. The procedure foresees computing long-term run-up values, starting from the ones evaluated through the model of Stockdon et al. (2006) (hereinafter referred to as S2006), and then combining it with the berm or dune heights of a shore to achieve its run-up vulnerability. However, S2006 formulation intrinsically leads to a conservative result, as it quantifies the run-up exceeded by 2 % of the total run-up values induced during a given sea state; this means that, for given wave and beach characteristics, the computed run-up is not the one most likely occurring but one of the highest possibly observed within a hypothetical series of records. Conversely, if the input wave parameters are provided in the nearshore region at a depth of 10 m, S2006 has shown to provide estimates closer to a sea state run-up expected value (Sancho-García et al., 2012), also in the case of an extreme event (Di Risio et al., 2017). This applies a fortiori when the geometry of the study site is complex (as in the case of the Bay of Lalzit); thus the wave transformation processes become relevant (Plant and Stockdon, 2015). Such an approach therefore requires changing the scale of the wave climate characterization moving from a national or regional scale to a more detailed local scale.
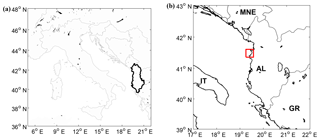
The main goal of the present paper is to quantify differences in assessing coastal vulnerability to inundation when using a regional rather than a local (nearshore) characterization of the wave climate. The study refers to the Bay of Lalzit, immediately north of the city of Durrës (Albania; see Fig. 1). The focus on such a rapidly developing context also allows us to discuss the potential implications of coastal vulnerability assessment when decision-making requires being highly adaptive and when data availability is scarce. Preliminary studies on the wave climate characterized its directional frames. With this information, it has been possible to compute new VLs to then be compared with the offshore omnidirectional ones. Such an approach is particularly relevant because it could highlight the critical issues related to coastal zone management when the littoral use and exploitation change drastically among different seasons and represents an additional novelty of the present work.
VL assessment was performed referring to both offshore and nearshore wave data to evaluate variations in shoreline vulnerability depending on the employed spatial (regional or local) and temporal scales (extreme events, seasonal, directional).
The paper is organized as follows: in Sect. 2 we present the index computation procedure, along with the investigation area and the data used; in Sect. 3 we show results of coastal vulnerability using a wave dataset at regional and nearshore scales; in Sect. 4, results are presented and possible future developments and improvements are discussed.
The vulnerability assessment is part of a wider research project, aimed at evaluating and quantifying the ongoing coastal erosion affecting the Bay of Lalzit area. In order to collect all the required data, a 2-week field campaign was performed during the month of July 2015.
2.1 Study area: Bay of Lalzit, Albania
The Bay of Lalzit is included between two capes and can therefore be considered an independent physiographic unit; it is possible to focus on the processes affecting this coastline independently from those characterizing the nearby physiographic units. A physiographic unit is indeed defined as a portion of shoreline with coherent characteristics in terms of natural coastal processes and of land use, which can thus be studied independently from neighbouring shores (UNEP, 2008).
2.2 Field measurements
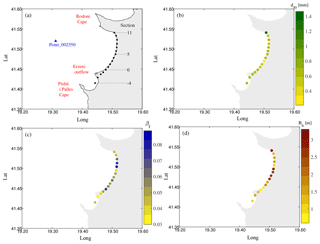
Field activities were aimed at collecting the minimum required data to investigate the relevant processes affecting the local coastal dynamics. The geomorphology of the beaches along the bay was characterized through 16 sections crossing the shoreline, spaced nearly every kilometre along almost 20 km of the bay length (from section −4, south, to section 11, north; see Fig. 3a). We recorded the cross-shore section elevation at topographically relevant locations, in correspondence with the main slope changes, with particular attention to the submerged bar system. This allowed us to assess the cross-shore section shapes, their berm height and the overall cross-shore profile mean slope (e.g. Fig. 2). Moreover, we collected different sand samples along every section to characterize their grain size distribution. Sediment samples were taken at selected locations along each section. Every sand sample was analysed through a multi-filter sieve to assess the weight percentages of sand in each size class, thus building the grading curve. The obtained data were then post-processed by using the software GRADISTAT (Blott and Pye, 2001), further evaluating the median grain size (d50) for every sampled location. As the resulting values of d50 were not significantly vary along each cross-shore profile, we chose to use those characterizing the water edge foreshore as the representative ones of each section.
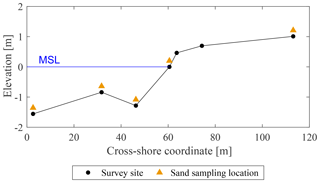
Figure 2Typical cross-shore profile along the Bay of Lalzit (example of section 2; see Fig. 3a). It is possible to note the presence of the submerged bar some tens of metres away from the coastline.
Results of the grain size surveys are summarized in Fig. 3. The mean grain size (d50) happens to be quite homogeneous among all the sections (Fig. 3b), and the granulometry of the bay can be considered representative of a “medium sand”, according to the classification of Wentworth (1922). The only exception is represented by the section next to the Cape of Rodon, which is close to a rocky promontory and is therefore characterized by coarser sediments. Conversely, cross-shore mean slopes (βf) and berm heights (Bh) are more variable along the coast, with steeper sections being characterized by lower berms and vice versa (Fig. 3c, d).
2.3 Vulnerability level assessment (VL)
Run-up VLs are meant to quantify the vulnerability of a coast toward extreme inundation events. VL assessment follows the approach proposed by Bosom and Jiménez (2011): for the investigated beach section (or length of shore), a long-term statistical computation for the run-up is required, leading to an intermediate dimensionless variable IV (inundation vulnerability), defined as follows:
where Bh and Ru2 % are the beach berm or dune height and the long-term run-up respectively. For each section, the IV value is then evaluated within a given range, obtained by setting two boundary values:
It can be noticed that the minimum and the maximum values of IV have a clear physical meaning: actually, IVmin is explanatory of the case in which the run-up is half of the berm height, ensuring the beach would not be overtopped and thus guaranteeing the protection of the hinterland. Conversely, IVmax refers to a situation characterized by a run-up 2 m higher than the berm height and therefore potentially able to flood the hinterland over a substantial area.
This interval is then scaled to a range from 0 to 1, grouped in five classes of equally spaced VLs (very low, low, medium, high, very high) as reported in Table 1.
2.4 Wave data and run-up
The assessment of VL first requires us to compute the long-term run-up statistics. Regardless of the reference model, run-up computation always implies combining information about both characteristic wave climate and morphology of a shore (Battjes, 1971; Holman, 1986; Mase, 1989, among others). With regards to the wave data, we referred to the hindcast provided by the Department of Civil, Chemical and Environmental Engineering of the University of Genoa (DICCA, http://www.dicca.unige.it/meteocean/hindcast.html, last access: 24 January 2019). The hindcast is defined all over the Mediterranean Sea from 1979 to 2016 with a 0.1∘ resolution in both longitude and latitude, has 1 h sampling resolution, and it is based on NCEP Climate Forecast System Reanalysis (CFSR) for the period from January 1979 to December 2010 and CFSv2 for the period from January 2011 to December 2016 (Mentaschi et al., 2013). The DICCA hindcast was widely validated (Mentaschi et al., 2015), and, being densely defined over a large time period, it helps to perform reliable long-term statistical computations (Coles and Pericchi, 2003). The location we referred to for this study is shown in Fig. 3a (Point_002550), whereas data about the shore geomorphology were collected as explained in Sect. 2.2.
Run-up is therefore computed according to S2006 as follows:
where βf stands for the mean slope of the beach, and H0 and L0 refer to deep water wave height and length respectively.
2.5 Extreme value analysis (EVA)
When dealing with run-up estimation, if the data linked to the shore characteristics can be well defined, more uncertainties arise when trying to empirically parametrize exceptional phenomena (extreme events), of which run-up can be considered an instance. For this reason we tested two different approaches for the estimation of extreme run-up values.
First, in the frame of a regional analysis, we considered the deep-water data as defined in Point_002550, selecting the annual maximum sea storms from the wave dataset and evaluating the annual maximum run-ups through Eq. (3). This resulted in a 38 extreme run-up datasets for each of the 16 sections. Every dataset was then modelled through a generalized extreme value (GEV) distribution (Coles et al., 2001) in order to carry out the long-term design of run-up values. Given the distributions, we set two target return periods, 50 and 500 years, and further computed the resulting run-ups for every section in both cases. This allowed us to quantify how VL estimation could be affected by differently conservative approaches.
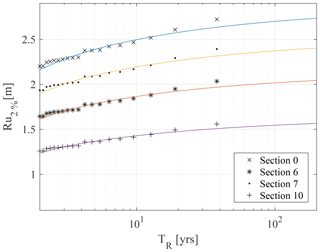
Figure 4Return period curves for the run-up parameter; results are presented for just some of the cross-sections for the sake of clarity.
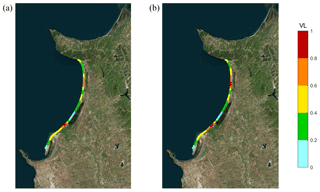
Figure 5Run-up vulnerability levels for the Bay of Lalzit from the regional analysis, using deep water data: (a) 50-year return period; (b) 500-year return period.
Afterwards, we switched from a regional to a locale scale: in this case, EVAs were performed directly over the extreme sea storm wave parameters to assess the 50- and the 500-year waves. We thus propagated the target waves in front of each section, afterwards computing the long-term run-up values. Here, as the wave climate shows different patterns with respect to the average incident wave direction, we split the initial wave dataset according to two meaningful directional fetches. This choice involved an important consequence: when performing the directional analysis, reference return periods for each of the identified sectors have to in fact be carefully assigned (Forristall, 2004):
with F the probability of non-exceedance, TR the significant return period and Np the number of directional patterns; subscripts o and i stand for omnidirectional and the ith directional patterns respectively. The Fi probabilities are fixed in order to obtain equal Np values whose product gives Fo (given the reference omnidirectional return period). Then, probabilities obtained with Eq. (4) were retained to carry out the long-term significant wave heights, as previously explained for the design run-up values for the regional analysis. In both the cases, the validity of the distribution was tested through the Kolmogorov–Smirnov test (Massey Jr., 1951).
To completely characterize the target waves (to be downscaled at a later time in the nearshore zone), we linked the peak periods to the computed long-term significant wave heights following the empirical model proposed by Callaghan et al. (2008). With regards to the waves' mean incident directions, they were assessed due to the particular wave climate of the area. Resulting wave features were therefore propagated over the local bathymetry to obtain the parameters at a depth of 10 m in front of each of the investigated sections; downscaling of waves was performed through SWAN, a third generation wave model developed to compute waves in coastal regions with shallow waters (Booij et al., 2003). The obtained wave parameters were then used to compute the 10 m depth run-up for both the considered return periods. With regards to the bathymetry of the bay, we referred to both the ETOPO1 dataset (https://www.ngdc.noaa.gov, last access: 13 December 2018) and a nautical chart of the Italian Hydrographic Institute (http://www.marina.difesa.it, last access: 24 January 2019).
It is worth mentioning that the return period of a forcing variate is not necessarily equal to the return period of the outcomes. As an instance, a given return period wave may not lead to the corresponding return period run-up (Hawkes et al., 2002, in this case it depends on the characteristics of the wave climate of the study site). Nevertheless, when performing the regional analysis, the run-up long-term curves computed starting from the annual maxima Hs (AM1 approach) happened to lie very close to those linked to the annual maxima retained from the computed initial distribution of run-ups. Furthermore, previous studies demonstrated that this approach can still lead to satisfactory results (Garrity et al., 2007), and it has already been adopted within similar works (Vitousek et al., 2008). We therefore decided to refer to the AM1 approach for both the regional and the local scales (omnidirectional and directional analysis respectively), as in the latter case it allows us to considerably reduce the computational time and effort (there is no need to downscale the whole wave dataset in the shallow waters, but just the target waves).
Once we computed the long-term run-ups, we evaluated the resulting VLs according to the morphology of the testing locations. Since results are punctual (e.g. one index for each of the 16 sampling locations), we linearly interpolated the VL values within hypothetical intermediate sections in order to obtain a more meaningful overview of the whole bay.
We initially referred to the regional scale; in this case, an omnidirectional analysis was performed, leading to two sets of results linked to the tested return periods. Secondly, we detailed our study to the local scale: in this case, we obtained two sets of results for every directional sector taken into account. We first present the VL obtained from the regional study.
3.1 Regional scale (offshore wave conditions)
At the regional scale the environmental inputs were the same for each section, with the wave characteristics defined in deep water (Point_002550, Fig. 3a); the differences in the run-up significant values were just due to different morphological characteristics of each cross-shore section (literally, the mean slope of the different beach profiles). This can be clearly noticed in Fig. 4: the empirical run-ups show the same distribution for every section, as their values are just rigidly translated from a quantity that depends on the value of the section slope βf (see Eq. 3). From the curves in Fig. 4, the run-ups linked to 50- and 500-year return periods were extrapolated, and the inundation VLs were accordingly computed, as explained in Sect. 2.3. Results are shown in Fig. 5.
3.2 Local scale (nearshore wave conditions)
Evaluation of coastal VLs has been carried out by also employing the propagated values of the wave climate at the local scale. It has to be remarked that, in this case, the mean cross-shore slope is not the only changing parameter between one section and another: as waves are propagated toward the shore in front of each of the investigated locations, they are modified due to the occurring transformation processes, resulting in different wave characteristics (heights, lengths and incident directions) depending on the position of a section along the bay.
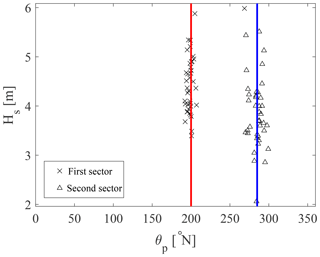
The first step to compute VL at a local scale is to characterize the wave climate. As shown in Fig. 6a, the bay is characterized by waves prevalently propagating from the S-SW and W-NW directions. We therefore considered two directional sectors, literally the third (180–270∘ N, called the first sector) and fourth (270–360∘ N, called the second sector) quadrants of the wave rose. Furthermore, it has been previously shown that the waves' incoming direction is tied to the seasonality of the wave climate (De Leo et al., 2017), with S-SW being the prevalent incoming direction for waves generated during winter and autumn. This is still reflected in the annual maxima wave heights, with those belonging to the second sector more uniformly distributed along the year (even though the peak of occurrence still happens during winter; see Fig. 6b).
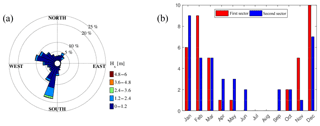
Figure 6(a) Rose of significant wave height for hindcast Point_002550; (b) seasonal distribution of the annual maxima wave height due to the considered sectors.
Extreme events have been defined for each of the identified sectors, computing the resulting 50- and 500-year-return-period wave heights. The target wave incoming direction for each sector was defined through a linear interpolation in order to minimize the root-mean-square error with respect to the directions of the annual maxima sea storms (see Fig. 7). Finally, for the wave periods, we evaluated their expected values thanks to the empirical equation of Callaghan et al. (2008) (Eq. 5). This equation was developed assuming a Hs∕Tp conditioned log-normal distribution, which is the most diffused model for these bivariate analysis (see Haver, 1985; Mathisen and Bitner-Gregersen, 1990, among others). We fit Eq. (5) to the sea storms of the directional sectors, selected through a partial duration series (PDS) approach fixing a wave height threshold equal to the 98 % quantile of the total Hs and an inter-event duration of 24 h (details on the partial duration series approach can be found in Lang et al., 1999; Claps and Laio, 2003).
where H is the target wave height computed through the EVA as previously explained; a, b, c, f, d and g are the estimated coefficients for the first (subscript 1) and the second (subscript 2) directional sectors.
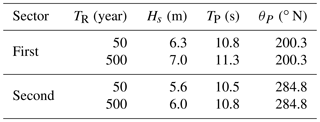
We therefore characterized the design wave for each of the identified directional sectors (W-NW and S-SW), defining its significant height, peak period and angle of attack. These parameters were set at a time as inputs of the wave propagation model, computing the shallow water waves. The starting values are shown in Table 2. The inundation VLs following the downscaled wave features are shown in Figs. 8 and 9.
For the sake of clarity, in order to compare the results obtained with the two different approaches mentioned before, we discuss just the results linked to the punctual investigated sections; analogous considerations can therefore be extended to the intermediate sections, whose VLs were assessed through a linear interpolation as previously explained.
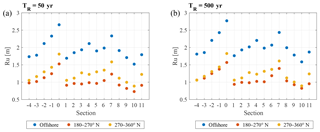
Looking at the punctual results (Figs. 10 and 11), it can be seen that in all considered cases even sections lying next to each other can show very different VLs: as the sampling locations are 1 km apart from one another, their morphological characteristics can significantly vary, and this is consequently reflected in the results.
Table 2Design wave parameters for the directional sectors. TR is the return period; Hs, TP and θP stand for wave height, period and incoming direction respectively
Referring to the regional-scale offshore analysis and 50-year return period, the vulnerability towards inundation happens to be very high in section 0 and still high in sections 7 and 8; sections −4, 1 and 2 are characterized by a very low vulnerability, whereas sections 3, 4, 6, 9 and 10 show low vulnerability. The other sections are characterized by a medium vulnerability. As we could expect, VLs increase when referring to the 500-year return period: in this case, a very high vulnerability characterizes section 7 as well, whereas the level increases from medium to high in section −1 and from low to medium in section 9; vulnerability class does not change for sections −4, −3, and −2 and for sections between 0 and 6.
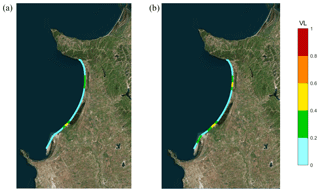
Figure 8Run-up vulnerability levels for the Bay of Lalzit, using nearshore data for the 180–270∘ N sector: (a) 50-year return period; (b) 500-year return period.
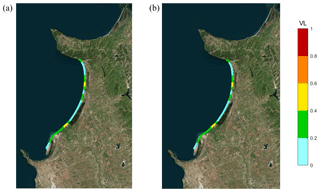
Figure 9Run-up vulnerability levels for the Bay of Lalzit, using nearshore data for the 270–360∘ N sector: (a) 50-year return period; (b) 500-year return period.
The directional analysis indicates that results are less varying with respect to the return period: if we refer to the first directional sector (180–270∘ N), 50-year return period, VLs are very low for all sections but 7 and 8, which show low vulnerability, and 0 (medium vulnerability). Switching to the 500-year return period, vulnerability rises from very low to low in sections −3 and −1 and from low to medium in section 7, and it is unvaried in all the other ones. Results are slightly different for the second (270–360∘ N) sector: in this case, 50-year vulnerability is low (instead of very low) for sections −3, −2, −1, 5 and 11; section 7 shows a medium instead of a low vulnerability. Here, increasing the return period up to 500 years does not involve any variation in the resultant VL.
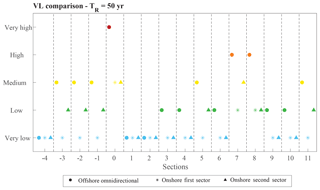
Figure 10Comparison among the run-up vulnerability indexes for each sampling location; return period equal to 50 years.
It is interesting to evaluate how VL can change due to the starting wave features: the EVA performed using deep water data yields higher VLs than those obtained after propagating waves toward the shore. Referring to 50-year return period, the most exposed sections are still characterized by very high (0) and high (7, 8) levels of vulnerability, whereas through the directional analysis VLs never happen to be higher than medium, despite the considered return period; to increase from 50 to 500 years involves at most moving from low to one VL higher (section 7, first sector).
Actually, result divergence decreases for sections characterized by a very low VL in the northern part of the bay: in this case, the morphology of the surrounding beach seems to guarantee safe conditions, regardless of the magnitude of the forcing waves.
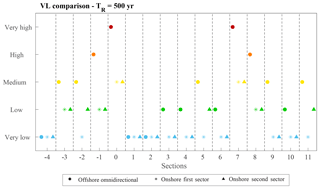
Figure 11Comparison among the run-up vulnerability indexes for each sampling location; return period equal to 500 years.
As a general trend, assessing coastal vulnerability to inundation using the wave climate computed at the local scale leads to lower VLs compared to those obtained through the regional analysis. If the VLs are similarly distributed along the bay (depending on the single section profiles), the long-term run-up estimates are clearly dependent on the reference spatial scale: the geometry of the bay indeed strongly affects the waves' propagation toward the coast. Moving onshore, wave heights likely decrease due to refraction and diffraction, which can be expected to be the dominant processes as suggested by the concave enclosed shape of the coast. Consequently, run-up estimates come to be lower when dealing with the local-scale analysis, and resulting VLs behave accordingly. It is worth mentioning that, as a common practice, this kind of computation is performed the other way around. Literally, when shallow water wave data are available, it is possible to propagate them backward through simple formulations in order to obtain the equivalent deep water data with which to feed the run-up model (like Snell's law; see CERC, 1984). In this case, though, we did not propagate waves backward: we already had the offshore data, and the goal of the research is to evaluate how VLs change when employing shallow water parameters for estimating run-ups. Results reported in Figs. 10 and 11 highlight another important aspect: if we refer to the local scale, the vulnerability of the bay as a whole is higher when looking at the wave climate generally characterizing the 270–360∘ N sector. This outcome is justified as well by the geometry of the bay; in fact, even if the starting wave features of the third quadrant are higher (Table 2), waves coming from the W-NW are not diffracted by the southern cape as occurs for those coming from the S-SW. The absence of obstacles along the wave path (but that of the submerged bar) implies a lower reduction of the wave heights, involving, in turn, higher values of the following run-up and thus higher values for the IV variables. Nevertheless, differences among the long-term wave parameters due to the considered return period are less pronounced than those of the first sector. This is still reflected in the final run-up values, showing a lower variability, which consequently reflects in the final VLs (whose values do not change among the considered return periods, as happens when looking at the 180–270∘ N sector).
Higher run-up estimates due to offshore analysis suggest another consideration about the different variability in the results between regional (offshore) and local (onshore) analysis: as previously demonstrated, the directional data result in a more homogeneous VL along the coastline. This can be simply justified looking at the VL computation: the same IV index may belong to different vulnerability classes, depending on the value that the IVmax variable obtains; in fact, while IVmin is constant for any of the investigation approaches, the maximum IV depends on the run-up values (see Eq. 2). High run-ups imply lower IVmax values and thus a lower total range, which, being spaced in five classes, leads to narrower intervals. Resulting VLs are therefore more sensitive to smaller variations in the IV values (as Figs. 10 and 11 show).
Finally, if we enlarge our analysis to the coastline as a whole, we can better appreciate how vulnerability is distributed. Despite the differences due to the reference wave data, the most vulnerable areas happen to be those near the Erzeni outflow and, in the north, towards the Cape of Rodon (see Fig. 3a for references), even if for different causes. If we look at the berm height component, it is evident how the aforementioned areas are characterized by lower berms (Fig. 3d): the Erzeni outflow area has shown a significant ongoing coastal erosion in the last years, as it is estimated that the coastline is retreating at a speed of 0.3–0.5 m yr−1 (Boçi, 1994), resulting in the berms levelling; actually, the concurring reduction of river sediment transport has also implied steeper profiles (Fig. 3c), which lead to higher run-up estimates. Moving to the north, the lower berms are due instead to recently developed anthropic activities, which required the levelling of the beach as well. Concerning the cross-shore slope, there is actually no evidence of steeper profiles but that of section 7.
The vulnerability assessment of a coastline can be a helpful device to plan its land use, for instance, not holding high-value activities when there is a high risk of the beaches being submerged or eroded. In this framework, VL estimates provide an easy and reliable tool in order to obtain an overall overview about a shore vulnerability distribution toward inundation and/or erosion events.
In this paper, we evaluated the coastal inundation vulnerability for the Bay of Lalzit (Durrës, Albania), following the model proposed by Bosom and Jiménez (2011). We first performed a regional analysis, referring to the original formula of Stockdon et al. (2006), in order to compute the extreme values for the run-ups at 16 sections along the bay; then, we detailed the study, downscaling the wave features in the shallow waters thanks to a wave propagation model.
We showed that, even if the vulnerability distribution does not change along the shore (e.g. the most exposed sections are placed in the same areas), the results linked to the local scale yield considerably lower VLs. This is mainly due to the run-up estimates, which are very sensitive to the input wave characteristics, which may be defined in shallow or deep waters. In the case of Lalzit, when wave propagation processes (such as refraction and breaking) become influential, run-up estimates can considerably change depending on the level of detail of wave characterization, as VLs accordingly do.
Since S2006 returns a high statistic for the run-up variable, it appears more plausible to refer to the modified model as proposed by Sancho-García et al. (2012) to estimate the return period linked to a closer expected run-up value. This precaution may allow us to obtain more representative VL assessment, properly scaling their related values due to the chosen return period, particularly when the modifying processes of the waves are relevant. A critical analysis of the coastline vulnerability could prevent adopting too conservative of approaches that could lead to unnecessary countermeasures, translating to loss of money and unnecessary invasive interventions.
The feasibility of VL assessment can represent a crucial ingredient for rapidly developing and transforming coastal regions such as the Bay of Lalzit in Albania, which present more options to drive virtuous future coastal development compared to industrialized countries, where coastal vulnerability assessment may mostly represent a tool for ICZM applied to manage conflicts among relevant stakeholders.
The datasets generated and/or analysed during the current study are available from the corresponding author upon reasonable request.
FDL and GB designed the vulnerability study. FDL, GB, GZ and MB designed the fieldwork and collected field data. FDL analysed data and prepared the first paper draft. FDL, GB, GZ and MB reviewed and refined the paper. FDL and GB finalized the revised paper.
The authors declare that they have no conflict of interest.
This study is part of a project shared between the University of Trento and
the University of Genoa (Italy), along with the Polytechnic University of Tirana
(Albania). The authors would like to thank everyone who joined the field data
collection: Alessandro Chesini, Alessandro Dotto, Alessio Maier, Daniele
Spada, Dario Guirreri, Erasmo Vella, Federica Pedon, Giorgio Gallerani, Laura
Dalla Valle, Martina Costi, Navarro Ferronato, Stefano Gobbi, Tommaso Tosi
(University of Trento), Ardit Omeri, Arsela Caka, Bardhe Gjini, Bestar
Cekrezi, Erida Beqiri, Ferdinand Fufaj, Idlir Lami, Marie Shyti, Mikel
Zhidro, Nelisa Haxhi, Xhon Kraja and Tania Floqi (Tirana Polytechnic). The
collected data were then analysed by the Italian partners in the framework
of the UNESCO Chair in Engineering for Human and Sustainable Development
(DICAM-Unesco
Chair). Giovanni Besio has been funded by the University of Genoa through the “Fondi per
l'Internazionalizzazione” grant.
Edited by: Piero Lionello
Reviewed by: Jose A. Jiménez and one anonymous referee
Battjes, J. A.: Run-up distributions of waves breaking on slopes, Journal of Waterways and Harbors Division, 97, 91–114, 1971. a
Blott, S. J. and Pye, K.: GRADISTAT: a grain size distribution and statistics package for the analysis of unconsolidated sediments, Earth Surf. Proc. Land., 26, 1237–1248, 2001. a
Boçi, S.: Evoluzione e problematiche ambientali del litorale albanese, B. Soc. Geol. Ital., 113, 7–14, 1994. a
Booij, N., Ris, R., and Holthuijsen, L.: A third-generation wave model for coastal regions, J. Geophys. Res., 104, 7649–7666, 2003. a
Bosom, E. and Jiménez, J. A.: Probabilistic coastal vulnerability assessment to storms at regional scale – application to Catalan beaches (NW Mediterranean), Nat. Hazards Earth Syst. Sci., 11, 475–484, https://doi.org/10.5194/nhess-11-475-2011, 2011. a, b, c, d
Callaghan, D., Nielsen, P., Short, A., and Ranasinghe, R.: Statistical simulation of wave climate and extreme beach erosion, Coast. Eng., 55, 375–390, 2008. a, b
CERC: Shore Protection Manual, US Army Corps of Engineers, Washington, DC, 1984. a
Ciccarelli, D., Pinna, M., Alquini, F., Cogoni, D., Ruocco, M., Bacchetta, G., Sarti, G., and Fenu, G.: Development of a coastal dune vulnerability index for Mediterranean ecosystems: A useful tool for coastal managers?, Estuar. Coast. Shelf S., 187, 84–95, 2017. a
Claps, P. and Laio, F.: Can continuous streamflow data support flood frequency analysis? An alternative to the partial duration series approach, Water Resour. Res., 39, https://doi.org/10.1029/2002WR001868, 2003. a
Coles, S. and Pericchi, L.: Anticipating catastrophes through extreme value modelling, J. R. Stat. Soc. C.-Appl., 52, 405–416, 2003. a
Coles, S., Bawa, J., Trenner, L., and Dorazio, P.: An introduction to statistical modeling of extreme values, vol. 208, Springer, London, UK, 2001. a
De Leo, F., Besio, G., Zolezzi, G., Bezzi, M., Floqi, T., and Lami, I.: Coastal erosion triggered by political and socio-economical abrupt changes: the cse of Lalzit Bay, Albania, Proc 35th International Coastal Engineering Conference, ASCE, Antalya, Turkey, 1, 13, 2017. a
Di Paola, G., Aucelli, P. P. C., Benassai, G., and Rodríguez, G.: Coastal vulnerability to wave storms of Sele littoral plain (southern Italy), Nat. Hazards, 71, 1795–1819, 2014. a
Di Risio, M., Bruschi, A., Lisi, I., Pesarino, V., and Pasquali, D.: Comparative Analysis of Coastal Flooding Vulnerability and Hazard Assessment at National Scale, Journal of Marine Science and Engineering, 5, https://doi.org/10.3390/jmse5040051, 2017. a
Ferreira, O., Plomaritis, T. A., and Costas, S.: Process-based indicators to assess storm induced coastal hazards, Earth-Sci. Rev., 173, 159–167, 2017. a
Ferreira Silva, S., Martinho, M., Capitão, R., Reis, T., Fortes, C., and Ferreira, J.: An index-based method for coastal-flood risk assessment in low-lying areas (Costa de Caparica, Portugal), Ocean Coast. Manage., 114, 90–104, 2017. a
Fitton, J. M., Hansom, J. D., and Rennie, A. F.: A national coastal erosion susceptibility model for Scotland, Ocean Coast. Manage., 132, 80–89, 2016. a
Forristall, G. Z.: On the use of directional wave criteria, J. Waterw. Port. C., 130, 272–275, 2004. a
Garrity, N. J., Battalio, R., Hawkes, P. J., and Roupe, D.: Evaluation of event and response approaches to estimate the 100-year coastal flood for Pacific coast sheltered waters, in: 30th International Conference on Coastal Engineering, ICCE 2006, 3 September 2006 through 8 September 2006, San Diego, CA, USA, 1651–1663, 2007. a
Gornitz, V. M., Daniels, R. C., White, T. W., and Birdwell, K. R.: The development of a coastal risk assessment database: vulnerability to sea-level rise in the US Southeast, J. Coastal Res., 12, 327–338, 1994. a
Haver, S.: Wave climate off northern Norway, Appl. Ocean Res., 7, 85–92, 1985. a
Hawkes, P. J., Gouldby, B. P., Tawn, J. A., and Owen, M. W.: The joint probability of waves and water levels in coastal engineering design, Hydraul. Res., 40, 241–251, 2002. a
Holman, R.: Extreme value statistics for wave run-up on a natural beach, Coast. Eng., 9, 527–544, 1986. a
Kamphuis, J. W.: Introduction to coastal engineering and management, vol. 30, World Scientific Publishing Co Inc, Singapore, 2010. a
Lang, M., Ouarda, T., and Bobée, B.: Towards operational guidelines for over-threshold modeling, J. Hydrol., 225, 103–117, 1999. a
Mase, H.: Random Wave Runup Height on Gentle Slope, J. Waterw. Port C., 115, 649–661, 1989. a
Massey Jr., F. J.: The Kolmogorov-Smirnov test for goodness of fit, J. Am. Stat. Assoc., 46, 68–78, 1951. a
Mathisen, J. and Bitner-Gregersen, E.: Joint distributions for significant wave height and wave zero-up-crossing period, Appl. Ocean Res., 12, 93–103, 1990. a
Mavromatidi, A., Briche, E., and Claeys, C.: Mapping and analyzing socio-environmental vulnerability to coastal hazards induced by climate change: An application to coastal Mediterranean cities in France, Cities, 72, 189–200, 2018. a
Mentaschi, L., Besio, G., Cassola, F., and Mazzino, A.: Developing and validating a forecast/hindcast system for the Mediterranean Sea, J. Coastal Res., SI 65, 1551–1556, 2013. a
Mentaschi, L., Besio, G., Cassola, F., and Mazzino, A.: Performance evaluation of WavewatchIII in the Mediterranean Sea, Ocean Model., 90, 82–94, 2015. a
Montreuil, A.-L., Chen, M., and Elyahyioui, J.: Assessment of the impacts of storm events for developing an erosion index, Regional Studies in Marine Science, 16, 124–130, 2017. a
Narra, P., Coelho, C., Sancho, F., and Palalane, J.: CERA: An open-source tool for coastal erosion risk assessment, Ocean Coast. Manage., 142, 1–14, 2017. a
Neumann, B., Vafeidis, A. T., Zimmermann, J., and Nicholls, R. J.: Future coastal population growth and exposure to sea-level rise and coastal flooding-a global assessment, PloS one, 10, e0118571, https://doi.org/10.1371/journal.pone.0131375, 2015. a
Plant, N. G. and Stockdon, H. F.: How well can wave runup be predicted? Comment on Laudier et al. (2011) and Stockdon et al. (2006), Coast. Eng., 102, 44–48, 2015. a
Sancho-García, A., Guillén, J., Simarro, G., Medina, R., and Cánovas, V.: Beach inundation prediction during storms using direferents wave heights as inputs, Proc 33th International Coastal Engineering Conference, ASCE, Santander, Spain, 1, 32, 2012. a, b
Satta, A., Snoussi, M., Puddu, M., Flayou, L., and Hout, R.: An index-based method to assess risks of climate-related hazards in coastal zones: The case of Tetouan, Estuar. Coast. Shelf S., 175, 93–105, 2016. a
Soukissian, T. H., Ntoumas, M. C., Anagnostou, C., and Kiriakidou, C.: Coastal Vulnerability of Eastern Saronikos Gulf to intense natural events, in: The Twentieth International Offshore and Polar Engineering Conference, International Society of Offshore and Polar Engineers, Beijing, 2010. a
Stockdon, H., Holman, R., Howd, P., and Sallenger Jr., A.: Empirical parameterization of setup, swash, and runup, Coast. Eng., 53, 573–588, 2006. a, b
UNEP, M.: ICZM Protocol in the Mediterranean, available at: https://www.pap-thecoastcentre.org/ (last access: 22 January 2019), 2008. a, b
Vitousek, S., Fletcher, C. H., and Barbee, M. M.: A practical approach to mapping extreme wave inundation: Consequences of sea-level rise and coastal erosion, in: Solutions to Coastal Disasters Congress, 13–16 April 2008, ASCE, Turtle Bay, Oahu, Hawaii, USA, 85–96, 2008. a
Wentworth, C. K.: A scale of grade and class terms for clastic sediments, J. Geol., 30, 377–392, 1922. a


