the Creative Commons Attribution 4.0 License.
the Creative Commons Attribution 4.0 License.
 | 04 Dec 2019
Crops' exposure, sensitivity and adaptive capacity to drought occurrence
Catarina Alonso
Ana Russo
Patrícia Páscoa
In the context of sustainable agricultural management, drought monitoring plays a crucial role in assessing the vulnerability of agriculture to drought occurrence. Drought events are very frequent in the Iberian Peninsula (and in Portugal in particular), and an increase in frequency of these extreme events are expected in a very near future. Therefore, the quantitative assessment of the natural-ecosystem vulnerability to drought is still very challenging, mainly due to the difficulties of having a common definition of vulnerability. Consequently, several methods have been proposed to assess agricultural vulnerability. In this work, a principal component analysis (PCA) was performed based on the components which characterize the exposure, sensitivity and adaptive capacity of the agricultural system to drought events with the aim of generating maps of vulnerability of agriculture to drought in Portugal. Several datasets were used to describe these components, namely drought indicators, vegetation indices and soil characterization variables. A comparison between the PCA-based method and a variance method using the same indicators was performed. Results show that both methods identify Minho and Alentejo as regions of low and extreme vulnerability, respectively. The results are very similar between the two methods, with small differences in certain vulnerability classes. However, the PCA method has some advantages over the variance method, namely the ability to identify the sign of the indicators, not having to use the indicator–component subjective relationship, and not needing to calculate weights. Furthermore, the PCA method is fully statistical and presents results according to prior knowledge of the region and the data used.
- Article
(3543 KB) - Full-text XML
- BibTeX
- EndNote


The frequency and severity of extreme weather events have increased notably in recent decades (Field et al., 2012). Studies on climate variability and future projections indicate that weather extremes pose and will continue to pose a threat to agriculture (FAO, 2016), undermining food security and sustainable agriculture (Murthy et al., 2015b). Droughts may produce significant impacts on agriculture, namely through shortages in water supply, destruction of ecological resources and losses in agricultural production. In more sensitive regions, these impacts may result in hunger, human suffering, death and abandonment of geographical regions (WMO, 2014; FAO, 2017). Thus, identification, assessment and ranking of drought events is a crucial step towards disaster risk reduction (Maskrey, 1993; Bogardi and Birkmann, 2005).
A drought event is commonly defined as a period with abnormally reduced precipitation resulting in water scarcity in the region (Vicente-Serrano et al., 2010a). However, the scarcity of water is not exclusively due to reduced precipitation. High temperatures lead to increased soil water demand due to evapotranspiration (Sheffield et al., 2012; Wang et al., 2012), also promoting dryness (Dai, 2011). Several methods for analyzing drought episodes have been developed and applied, allowing better monitoring and characterization of drought events. Among the most-used approaches, drought indices such as the Palmer Drought Severity Index (PDSI; Palmer, 1965), the Standardized Precipitation Index (SPI; McKee et al., 1993) and the Standardized Precipitation-Evapotranspiration Index (SPEI; Vicente-Serrano et al., 2010a, b) are frequently referred to, each one presenting advantages and weaknesses in its application. The SPEI combines the thermal sensitivity of the PDSI, i.e., the effect of temperature on evapotranspiration, with the multi-scalar nature of the SPI (Vicente-Serrano et al., 2010b). Thus, the SPEI has been widely used in various studies for analyzing drought variability (Potop et al., 2014; Yu et al., 2014; Páscoa et al., 2017a) and severity (Liberato et al., 2017; García-Herrera et al., 2019), and several authors agree that it is better suited to the analysis of the impacts of the increased temperature trends in drought severity than the SPI (Vicente-Serrano et al., 2010a, 2012, 2014; Blauhut et al., 2016; Páscoa et al., 2017a).
A turning point in monitoring extreme events was the recent development in satellite technologies and the easier access to remote-sensing data. The use of remote-sensing datasets provides several advantages in the case of the analysis of phenomena with large spatial coverage, such as droughts. At the end of the 20th century and based on information from the Advanced Very High-Resolution Radiometer (AVHRR) sensor, three satellite-derived indices were proposed with the aim of monitoring the thermal and moisture conditions of vegetation: the Vegetation Condition Index (VCI; Kogan, 1995), the Temperature Condition Index (TCI; Kogan, 1997) and the Vegetation Health Index (VHI; Kogan, 1997, 1998). These indices proved to be very useful in the detection and monitoring of extensive areas affected by drought, as they account for different crop sensitivities to drought, such as to moisture and thermal conditions over the vegetative cycle (Kogan, 2001; Zarei et al., 2013; Bokusheva et al., 2016; Ribeiro et al., 2018). Regardless of each approach's advantages and weaknesses, the use of combined drought indicators, drought indices and satellite-derived indices, which account for different timescales of drought occurrence, have shown added value in the performance of the crop yield simulations (Vicente-Serrano et al., 2006; Hernandez-Barrera et al., 2017; Ribeiro et al., 2018).
Even with the worldwide intense emphasis on the evaluation of drought and of its impacts, the quantitative assessment of the natural-ecosystem vulnerability to drought continues to be very challenging. One of the factors which contributes to the difficulty inherent to the assessment of drought vulnerability is related to the fact that the definition of vulnerability is complex and not entirely agreed upon. In this context, the “Fifth Assessment Report” of the Intergovernmental Panel on Climate Change (IPCC; IPCC, 2014) defines vulnerability as “the propensity or predisposition to be adversely affected. Vulnerability encompasses a variety of concepts including sensitivity or susceptibility to harm and lack of capacity to cope and adapt.”
Several approaches have been proposed to assess the agricultural vulnerability of a given region, namely based on vulnerability maps (Luers et al., 2003; O'Brien et al., 2004), composite index methods (Kim et al., 2015; Murthy et al., 2015b, a; Wiréhn et al., 2015; Jiang et al., 2012) and principal component analysis (PCA; Li et al., 2006), among others. Conversely, Bogardi and Birkmann (2005) emphasize the need to address the components of exposure, sensitivity adaptive capacity of crops in vulnerability studies. Following Murthy et al. (2015b), the component of exposure is associated with the nature, extent, duration and frequency of drought conditions over a geographic area. In contrast, sensitivity is the degree to which the crops respond to drought conditions, and it is related to the cropping pattern and crop condition. Finally, the adaptive capacity incorporates the ability of an agricultural area to cope with an agricultural drought episode. This study was later reinforced by the IPCC “Fourth Assessment Report” (IPCC, 2007), which indicated that vulnerability assessments should encompass the above components.
Vulnerability assessment and risk management for drought events allowed for mitigating the adverse effects of these events in a proactive way (Murthy et al., 2015b). Consequently, and considering (1) the significant impacts of drought events and (2) the need for adaptation and resilience of the population against these extremes, a vulnerability assessment method is proposed here to identify the most vulnerable regions over Portugal.
The most important drought impacts reported for past events in mainland Portugal have been agricultural losses, interruptions to public water supply and wildfires, and therefore a way of increasing drought preparedness is to identify specific periods where water shortage is crucial for maximizing impacts (Dias et al., 2019). Therefore, in this paper we present an important application of an automatic approach which is able to identify agricultural areas which are vulnerable to drought conditions. The proposed approach is grounded in the application of a PCA to the exposure, sensitivity and adaptive capacity components to obtain agriculture vulnerability maps to drought in mainland Portugal, using the above-mentioned vulnerability components and considering that the PCA approach enables a considerable reduction in the number of input data needed for achieving drought vulnerability maps. This reduction in the amount of input information is possible because the derived variables incorporate a great amount of information which is able to reduce redundancy in the input variables and summarize the most important features (Wilks, 2011). Moreover, the PCA assumes that the significant information retained by the derived variables does not significantly change, which is a major advantage when working with observational data. Finally, to support and corroborate the PCA approach, variance methodology (Murthy et al., 2015a, b) was applied based on the same components used in the PCA.
This paper is organized into five sections. After the introduction to the proposed work, Sect. 2 briefly describes the study area and the data used to represent the components of exposure, sensitivity and adaptive capacity. In Sect. 3 the methodology is described. In Sect. 4 the results for the PCA and the Murthy approaches are discussed, and Sect. 5 concludes the paper.
2.1 Study area
The precipitation regime presents high interannual and decadal variability over the Mediterranean Basin, namely in Portugal (García-Herrera et al., 2007; Trigo et al., 2013). A pronounced northwest–southeast precipitation gradient is observed over Portugal, and annual precipitation ranges from more than 2000 mm in the north to less than 500 mm in the south (AEMET-IM, 2011). Moreover, most of the precipitation is concentrated in the months from October to March (García-Herrera et al., 2007; Trigo and DaCamara, 2000). There is also a north–south temperature gradient, and the high temperatures occurring in the summer coincide with the dry season (AEMET-IM, 2011). There is a clear trend towards warmer conditions (Espírito Santo et al., 2014a), in agreement with the global warming trend, and a decrease in spring precipitation (Espírito Santo et al., 2014b).
The majority of the climate change scenarios for the Mediterranean region show a evolution in the future, indicating declining precipitation and rising temperatures in southern Europe (Giorgi and Lionello, 2008; García-Ruiz et al., 2011; Mariotti et al., 2015). This combined effect of lower precipitation and higher temperatures is expected to increase the frequency, magnitude and severity of drought episodes (Vicente-Serrano et al., 2014). These trends create a potential threat to the agricultural sector, especially to rain-fed agriculture, since its production is dependent on the precipitation regime, and thus they may affect the economic viability of some crops (Valverde et al., 2014). Previous studies focusing on drought occurrence in the Iberian Peninsula (Gouveia et al., 2009, 2017; Vicente-Serrano et al., 2014; Páscoa et al., 2017a) identified several severe or intense drought episodes, namely in 1981, 1995, 2000, 2002, 2005 and 2012. Vicente-Serrano et al. (2014) showed that between 1961 and 2011, drought severity and the surface area affected by drought increased in the Iberian Peninsula. On the other hand, Ribeiro et al. (2018) showed that there are anomalies in the production of cereal yields (wheat and barley) during the years 1992, 1995 and 2005, coinciding with the main drought events that affected the Iberian Peninsula (García-Herrera et al., 2007; Andrade and Belo-Pereira, 2015). Therefore, this type of study in mainland Portugal will be added value, as it will allow the identification of areas in which crops are more susceptible to drought events, allowing for better future planning.
2.2 Drought indicators and aridity index
Drought assessment was made using two types of indicators, one calculated based on ground meteorological observations and the others based on satellite information. The first indicator was the SPEI (Vicente-Serrano et al., 2010a, b). The SPEI was computed using monthly precipitation and reference evapotranspiration from the Climatic Research Unit (CRU) TS4.01 high-resolution gridded dataset (https://crudata.uea.ac.uk/cru/data/hrg/, last access: 25 November 2019) with a spatial resolution of 0.5∘, for the period 1901–2016 and for temporal scales of 6 and 12 months (Harris et al., 2014). Reference evapotranspiration (ET0) was estimated using the Penman–Monteith method (Monteith, 1965). The SPEI was estimated using a log-logistic probability distribution, which allows for a very good fit to the series of differences between precipitation and ET0 (Vicente-Serrano et al., 2010b). The parameters were estimated using the L-moment method (Vicente-Serrano et al., 2010a; Russo et al., 2015).
The second type of indicator used to assess drought was the VHI (Kogan, 1997), which evaluates the vegetation condition, including the effect of humidity and temperature. The VHI is calculated as the mean between the VCI and TCI and, in this work, was used to characterize the sensitivity component. The VHI evaluates the vegetation condition, including the effect of humidity and temperature, while the VCI allows for identifying zones of stressed vegetation related to the amount of water (moisture), and the TCI allows identifying zones of vegetation in thermal stress (Kogan, 1997).
A 1-month time frame could be too long to describe the vegetative cycle, as morphological changes and leaf appearances occur every 3–7 d (Kogan, 1997). On the other hand, weather patterns change even faster, considering that an elementary synoptic period continues for 3–5 d (Kogan, 1997). Therefore, in case of severe drought, vegetation can be desiccated in a matter of days (Kogan, 1997). The values of the VHI were produced and disseminated by NOAA (ftp://ftp.star.nesdis.noaa.gov/pub/corp/scsb/wguo/data/Blended_VH_4km/geo_TIFF, last access: 25 November 2019), with weekly frequency and 4 km of spatial resolution. The data used in the present work cover the period 1981 to 2019.
The aridity index (AI) applied in this work was proposed by the FAO (Food and Agriculture Organization of the United Nations; Spinoni et al., 2015). This index was calculated from the average relation between total annual precipitation (P) and potential evapotranspiration (PET) for a period of 30 years, in this case 1971–2000. The precipitation was extracted from a control run for the period 1971–2000 of the WRF (Weather Research and Forecasting Model) with a 9 km resolution for the Iberian Peninsula and forcing from EC-Earth (Soares et al., 2017). The PET was calculated using the Hargreaves equation (Hargreaves and Samani, 1985), based also on the WRF precipitation and temperature data. Although the Penman–Monteith method is generally the recommended method to estimate ET0, it needs a large number of meteorological variables, and they may not all be available. The Hargreaves method is known to provide estimates closer to the Penman–Monteith method when compared with other methods that require fewer variables (Beguería et al., 2014). Moreover, the high spatial resolution of this dataset is advantageous, since aridity depends on variables that are sensitive to topography.
2.3 Agriculture data
The agriculture datasets were extracted from the National Statistics Institute platform (INE; https://www.ine.pt/xportal/xmain?xpid=INE&xpgid=ine_base_dados, last access: 25 November 2019). The main agricultural crops' (main grain crops, main dry legumes, potatoes, major crops for industry, horticultural crops, main forage crops, main fresh fruits, small berries, main subtropical fruits, citrus fruits, principal nuts, vines and olive groves) production area datasets were disseminated at an annual basis, in hectares, from 1986 to 2015, and organized into Territorial Units for Statistics (NUTs II): North, Center, Lisbon, Alentejo and Algarve. Using the area in hectares of each NUT, this variable was converted into the percentage of annual area of the main agricultural crops by NUT.
The percentage of irrigable area in agricultural areas was also extracted from the INE platform. Data were only available for the years 1989, 1993, 1995, 1997, 1999, 2005, 2007, 2009 and 2013 for each NUT II.
2.4 Soil characterization
The water table depth (WTD) provided by Fan et al. (2013) was used as a proxy of soil water availability over the considered region (with a 30 arc resolution). The authors used a groundwater model, forced with climate, terrain, sea level, and observations of WTD compiled from government archives and literature. The WTD obtained is a mean value, and it should be noted that only the time series longer than 4 years and with declining trends smaller than 0.6 m yr−1 were included in the model. For Portugal, the authors used 438 points which are not evenly distributed in the study area, but this is related to the uneven distribution of the available stations that piezometrically monitor Portugal (Gomes Marques et al., 2019). Nonetheless, it is likely that the data are biased, and this should be taken into consideration (Fan et al., 2013).
2.5 Land cover
Information regarding land cover classification was obtained using the Corine Land Cover (CLC) map version 18 for the year 2006. CLC maps contain 44 land cover classes and are available with a spatial resolution of 250 m. The original projection is a Lambert azimuthal equal-area projection, so it was reprojected and resampled to match the VHI projection and spatial resolution using a nearest-neighbor interpolation.
3.1 Components of vulnerability
The methodology proposed in this work relies on the use of the indicators described in the previous section. The indicators are grouped, considering the three components used to characterize vulnerability, i.e., exposure, sensitivity and adaptive capacity (Table 1).
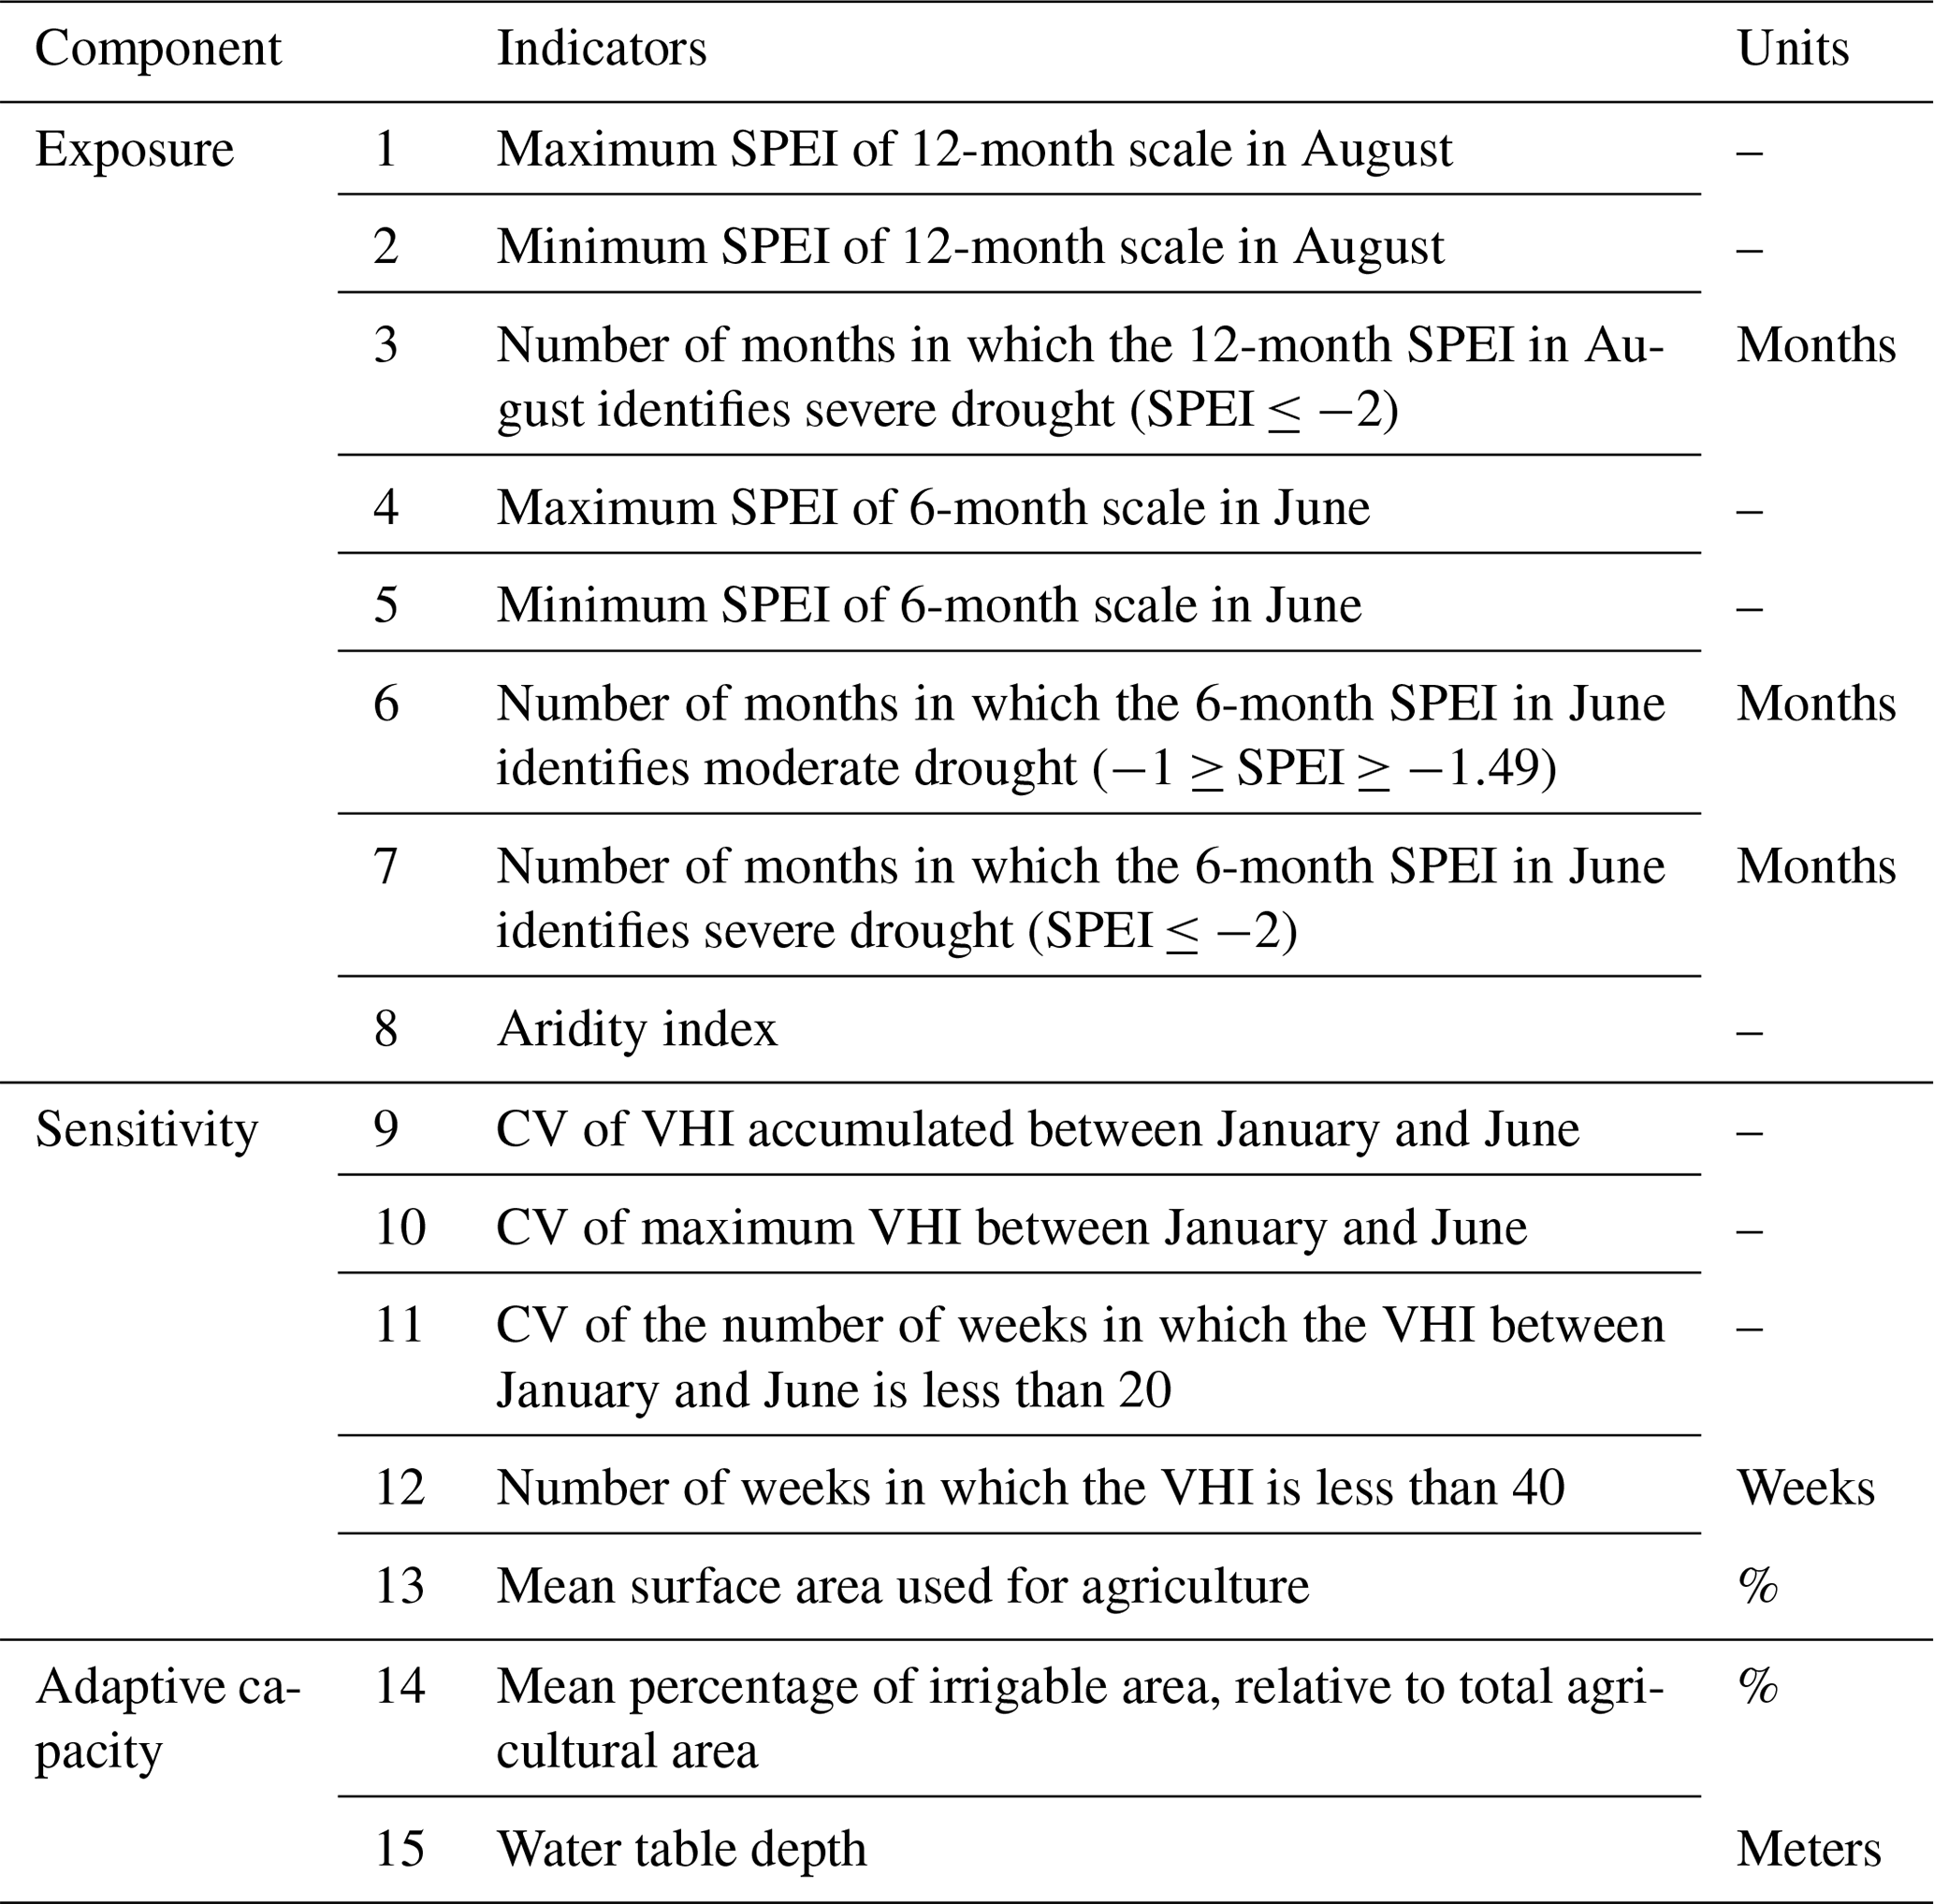
3.1.1 Exposure component
The exposure of the study area to drought was characterized during the growing season of crops using the SPEI at the a 6-month timescale and during the hydrological year using the SPEI at the 12-month timescale. In the study area, the influence of drought on crops is more pronounced from January to June (Páscoa et al., 2017b; Ribeiro et al., 2018), so we used the SPEI 6 value in June. The SPEI 12 value in August was used. Although the hydrological year in Portugal ranges from October to September of the following year, we considered the period from September to August (Gouveia et al., 2009) from 1981 to 2016. Maximum and minimum values of the SPEI were computed as well as the number of months identified as extreme drought (SPEI ). Using the SPEI 6, the number of months identified as moderate-drought months ( SPEI ) were also computed. The thresholds used to characterize drought intensity were proposed by Rhee and Cho (2016). The values of each variable derived from the SPEI data were spatially smoothed, using a mean filter over a user-defined rectangle, aiming to harmonize the resolution of the SPEI data with VHI data. In order to classify the region in terms of water balance under normal climatic conditions, the AI was used. The indicators used for characterizing the exposure component are shown in Fig. 1.

Figure 1Spatial distribution of different indicators used to assess the exposure component. The title numbers correspond to the number of the indicators in Table 1.
3.1.2 Sensitivity component
Two metrics were applied to the VHI data during the growing season of the winter crops, i.e., the period ranging between January and June (Páscoa et al., 2017b; Ribeiro et al., 2018), namely the season's integrated (SI) and the season's maximum (SM) period (Murthy et al., 2015b). The first metric is relative to the annual coefficient of variation (CV) of accumulated VHI values during the growing season, and the second refers to the annual CV of the maximum VHI value for the same period. In addition, in order to characterize the frequency of drought impacts on vegetation, the CV was computed for the number of weeks per year in which VHI values were lower than 20, indicating severe vegetation stress conditions during the growing season, and the number of weeks in which VHI values were less than 40, indicating vegetation stress conditions, in the total data period from September 1981 to August 2016 (i.e., number of weeks in the 35-year data in which VHI <40). The thresholds used were proposed by Kogan (1998). The statistical parameter corresponding to the main agricultural crops' annual area was used to characterize the type of crop. The indicators used to simulate the sensitivity component are shown in Fig. 2.
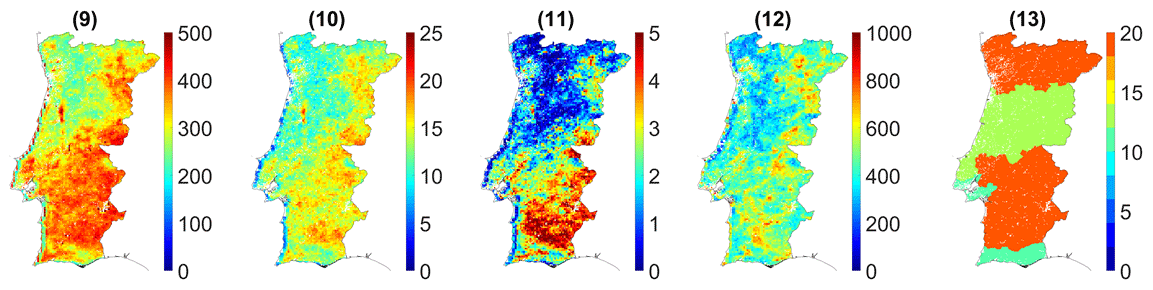
Figure 2As in Fig. 1, but with respect to sensitivity component.
3.1.3 Adaptive capacity component
Adaptive capacity is generally determined by the static parameters of the agro-region, i.e., parameters without intra-annual variation (Murthy et al., 2015a). In this case, the irrigable area, the aridity index and the groundwater table depth were considered to be static parameters. Data of irrigable area were only available for some years by NUTs II; thus the mean was calculated. The mean of the total agricultural area was also computed and then used to compute the percentage of the irrigable area in relation to the total agricultural area, making this a static parameter.
The soil indicates the connection between climate and crops, and it can be an important factor in determining the severity of agricultural droughts (Murthy et al., 2015b). The WTD data were used to characterize the groundwater distribution of the region, since the WTD may be a source of water even in dry conditions. Considering that the WTD data used consist of mean values, this is also a static parameter. Figure 3 shows the indicators used for modeling the adaptive-capacity component over the Portuguese mainland.
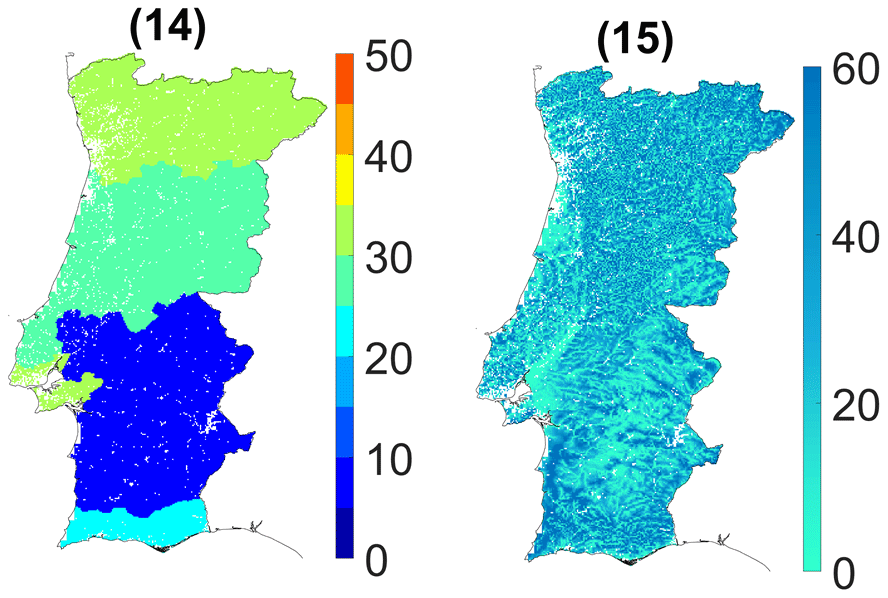
Figure 3As in Fig. 1, but with respect to the adaptive-capacity component.
3.2 Drought vulnerability assessment
The assessment of drought vulnerability was performed using two methods: a principal component analysis and a variance method. The pixels corresponding to urban and industrial zones and areas of high humidity – surface water resources – were excluded according to CLC. The results obtained with these methods were then compared, and the CLC classes occurring in areas with different classification were examined. The two methods used are described in the following sections.
3.2.1 Principal component analysis
Some of the variables used to compute the different indicators of the exposure, sensitivity and adaptive-capacity components (Table 1) might correlate, as they have a certain amount of overlap (Anselin and Getis, 1993; Kang et al., 2015). For this reason, a principal component analysis was performed, since it converts potentially correlated variables into uncorrelated variables that capture the variability in the underlying data (Abson et al., 2012). One advantage of applying PCA is its efficacy to highlight patterns within multivariable data (Abson et al., 2012).
Each variable is standardized, and therefore PCA uses orthogonal linear transformation to identify a vector in the N-dimensional space that accounts for as much of the total variability in a set of N variables as possible. The first principal component (PC) explains the higher amount of variance within the dataset (Hatcher, 1997). The second PC has two characteristics: this component will account for a maximal amount of variance in the dataset that was not accounted by the first component, and it is uncorrelated with the first component (Hatcher, 1997). Each succeeding PC accounts for as much of the remaining variability as possible that was not accounted by the preceding components; each PC is uncorrelated with all other PCs (Hatcher, 1997). When the original variables are correlated, then the higher-order PCs capture more of the total variability in the data than any individual original variable. Excluding the lower-order PCs, the dimensionality (number of variables) of the data is reduced while minimizing the loss of information (Smith, 2002). Each PC can be related to the original variables in that the PC is most influenced by the reported principal component loading factors. Loading factors associated with each retained PC allow the original variables to be readily associated with the resulting indices. As a result, PCA provides an approach to move from a large suite of individual indicators to a small number.
In this work, PCA was applied as a three-step process. Firstly, the PCA was applied to the indicators of the exposure, sensitivity and adaptive-capacity components (Table 1), and the group of PCs that represented more than 85 % of explained variance of each group of indicators was chosen to represent each exposure, sensitivity and adaptive-capacity component, as in Eq. (1):
where y is the vulnerability component, i is the pixel number, j is the indicator, λ values are the eigenvalues of the indicator covariance matrix and X is the principal component.
Then, a second PCA was applied to the three maps obtained before (exposure, sensitivity and adaptive capacity). We chose the set of PCs that represented more than 85 % of explained variance, and the final map was obtained using Eq. (1) again. Finally, the resultant is scaled between 0 and 1 and then divided into five drought vulnerability classes. The assignment of the obtained results to the set of five drought vulnerability classes (less vulnerable, moderately vulnerable, vulnerable, highly vulnerable and extremely vulnerable) was based on the computation of the 20th, 40th, 60th and 80th percentiles.
3.2.2 Variance method
The variance method used in this work was based on the methodology applied by Murthy et al. (2015b) to determine the Agricultural Drought Vulnerability Index (ADVI). This crop-generic index of agriculture drought vulnerability was derived from the composite indices of exposure, sensitivity and adaptive capacity (Murthy et al., 2015b). Firstly, the differences in the units of the input indicators were normalized based on the functional relationships between indicators and respective component index (Table 1). Since exposure is associated with the nature, extent, duration and frequency of drought conditions, the contribution of SPEI values is negative to exposure because negative values of the SPEI represent drought events. In other words, the number of months in which the SPEI is less than −1 or −2 is the frequency of droughts, and it is positively related to exposure of agriculture crops to droughts. In the case of sensitivity indicators (9–13 indicators; Table 1), they all have a positive relationship with the component; the higher the CV (indicators 9–11), the more sensitive the agricultural area is to weather variations (Murthy et al., 2015b), the higher the number of weeks in which the VHI is less than 40 and the higher the frequency of drought in crops. The mean surface area used for agriculture has a positive relationship with the sensitivity. All of the adaptive-capacity indicators (14 and 15 indicators; Table 1) are related to water in soil, and the more water is available in the soil, the greater the adaptability of agricultural crops is to drought (positive relationship).
An indicator, X, which is positively related to respective component index, is normalized using the formula
were X is the indicator, i is the pixel number, Xmin is the minimum value of the indicator and Xmax is the maximum value of the indicator.
When X is negatively related to the respective component index, it is normalized by the following formula:
To assess of the weights, w, to indicators for each component index, Murthy et al. (2015b) use the method proposed by Iyengar and Sudarshan (1982) and followed by Hiremath and Shiyani (2012):
where c is a normalizing constant such that
In this case, K is the number of indicators such that .
For each component the composite index, y, is defined by the following formula:
Using the respective weights, the three vulnerability components were computed and scaled to range between 0 and 1 for easy interpretation. They were defined by the authors as the exposure index (EI), sensitivity index (SI) and adaptive-capacity index (ACI). Finally, the ADVI was then computed as follows:
where
and a, b and c are the weights of indicators.
After computing the ADVI map, the values of ADVI were scaled between 0 and 1, with Eq. (2), and the values of five classes were also obtained using the 20th, 40th, 60th and 80th percentiles.
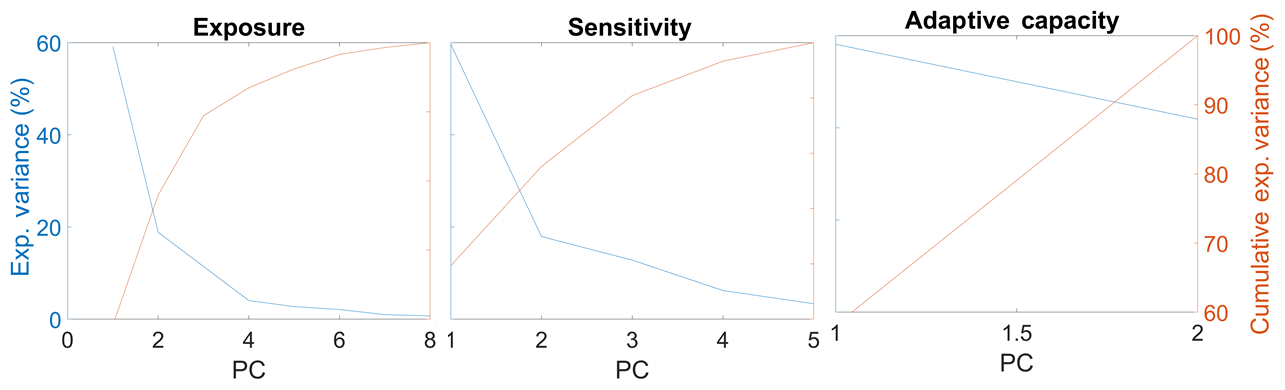
Figure 4Explained variance and cumulative explained variance by each of the PCs of each component: exposure, sensitivity and adaptive capacity.
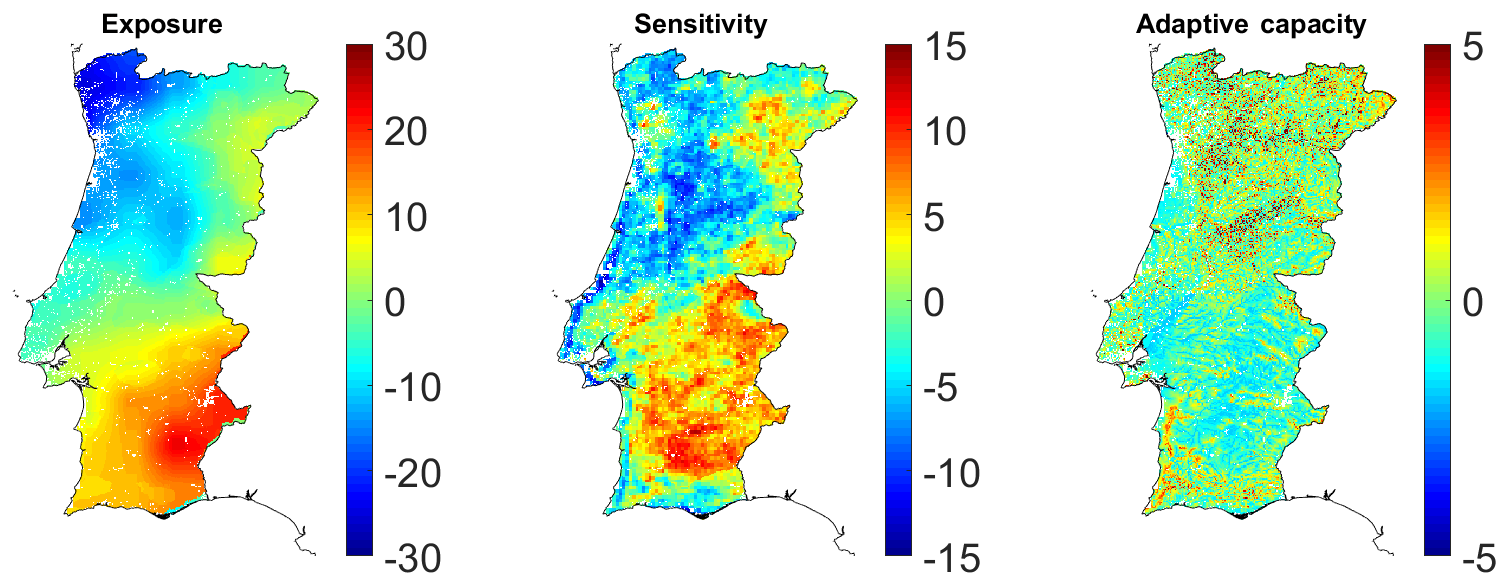
Figure 5Spatial pattern for the exposure, sensitivity and adaptive-capacity components, as obtained by PCA applied to the indicators presented in Table 1.
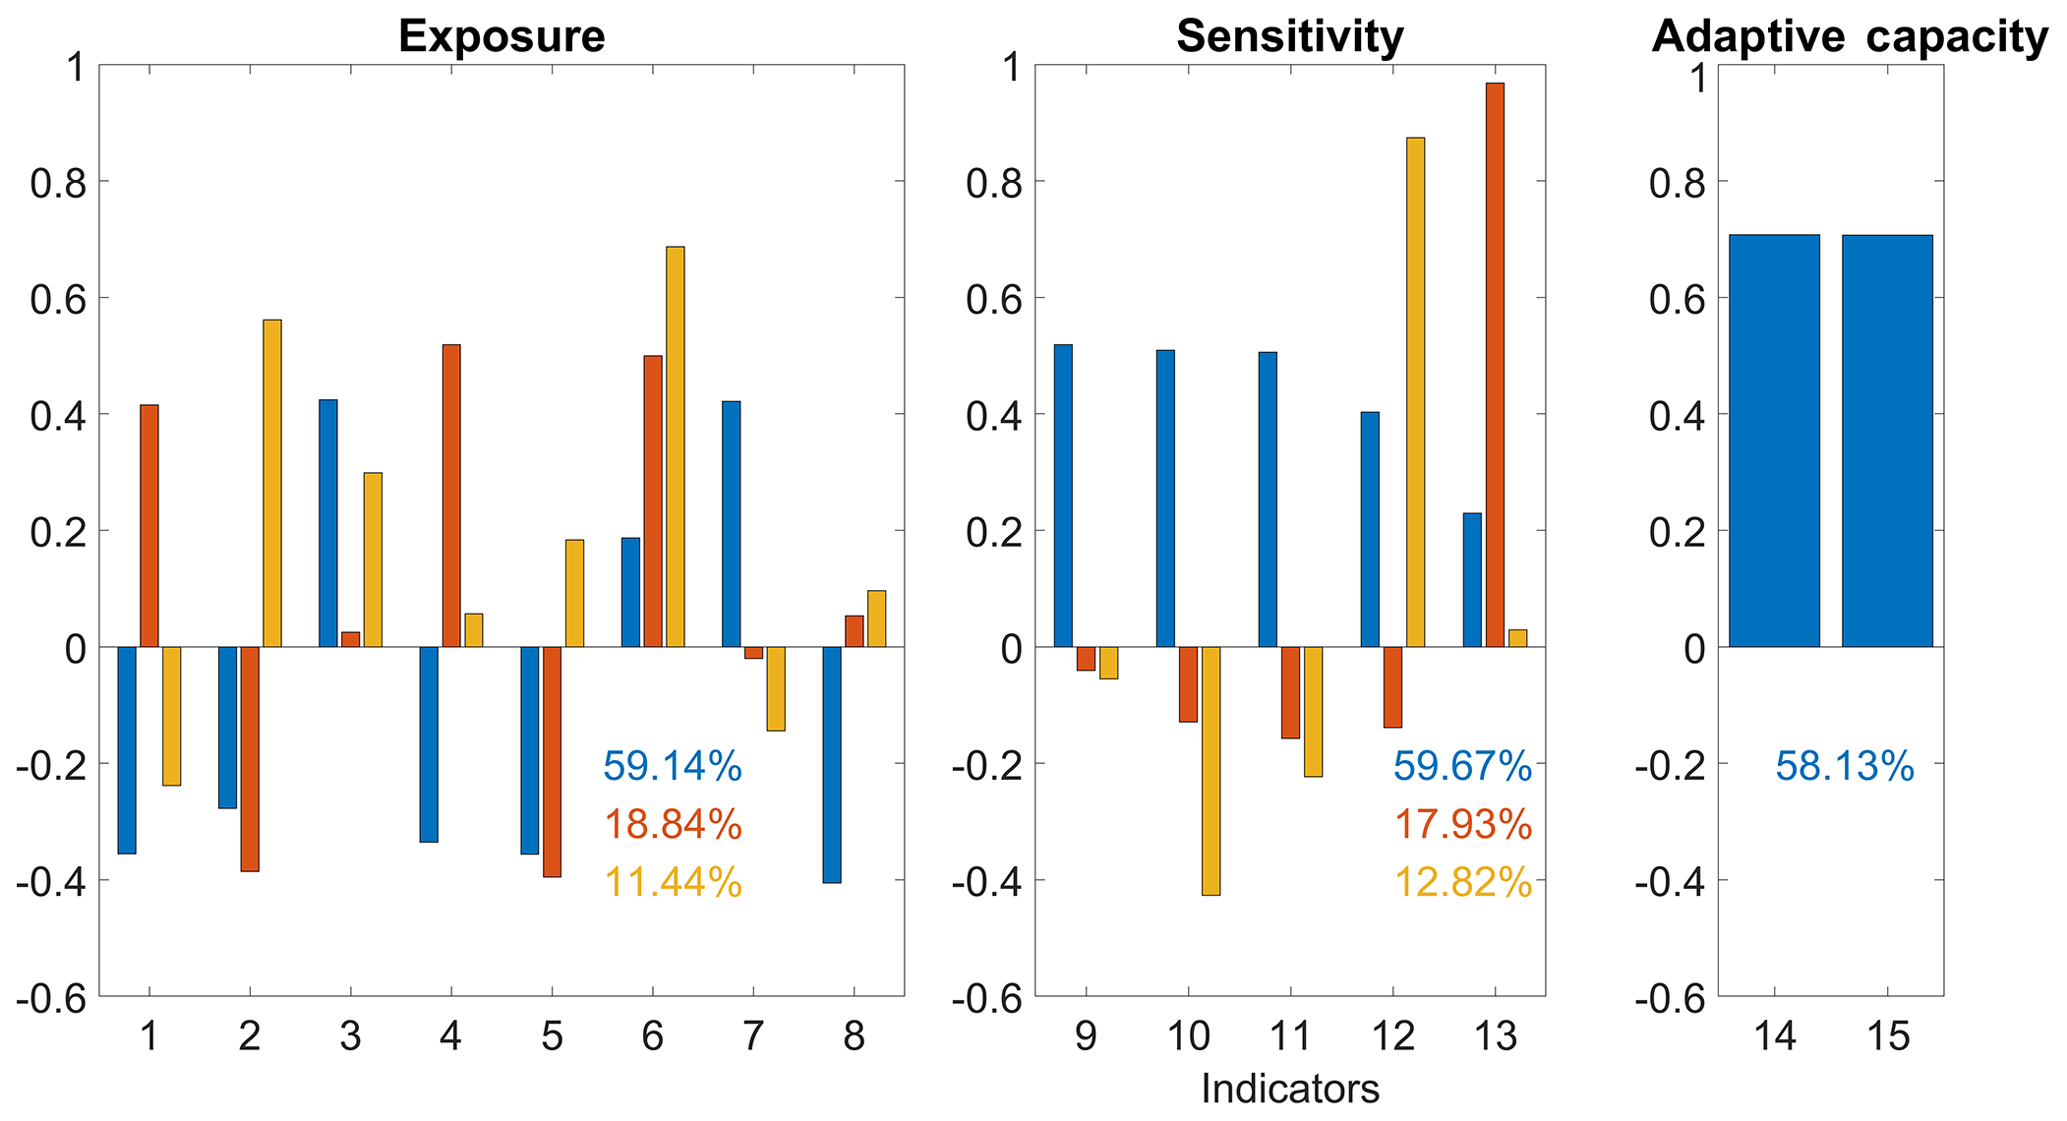
Figure 6Loading factors of original 15 indicators corresponding to each PC (PC 1 – blue; PC 2 – orange; PC 3 – yellow) used to represent the components: X values correspond to the original indicators described in Table 1. The percentage of variance explained for each PC is presented in the bottom right corner.
The spatial pattern of each component of exposure, sensitivity, and adaptive capacity and loading factors for each of the original variables used to build each component are showed in Figs. 5 and 6, respectively. The spatial pattern associated to the exposure component is obtained by the first three PCs of indicators 1–8 of Table 1, which explains 89.42 % of the total variance (Fig. 4). This component presents negative values in the northwest and positive values in the southeast. PC 1 has negative contributions from indicators 1, 2, 4, 5 and 8; i.e., both the maximum and the minimum values of the SPEI and aridity index negatively contribute to PC 1. PC 2 has negative contributions from indicators 2, 5 and 7, corresponding to the minimum SPEI values and to the occurrence of severe drought, and PC 3 has negative contributions from indicators 1 and 7 only. Indicators 3 and 6 only have positive contributions.
On the other hand, the sensitivity component is represented by the first three PCs of the indicators 9–13 (Table 1). The ensemble of first three PCs of these five indicators explains 90.42 % of the variance (Fig. 4) and presents positive values in the northeastern and southern regions, except in the extreme south. The sensitivity component shows a spatial pattern very close to the exposure component. In the case of this component, PC 1 has positive contributions from all indicators. The indicators 9–11 have a negative contribution in PC 2 and PC 3. The number of weeks in which the VHI is less than 40 (indicator 12; mean surface area used in culture in indicator 13) has a negative (positive) contribution to PC 2 (PC 3). Indicator 13 has a positive contribution of three PCs.
To quantify the adaptive-capacity component, only the first PC was selected from the last two indicators, representing a total of 58.13 % of the explained variance (Fig. 4). This component shows slight negative (positive) values in Alentejo (north). All the indicators (mean percentage of irrigable area and water table depth) have a positive contribution to PC 1.
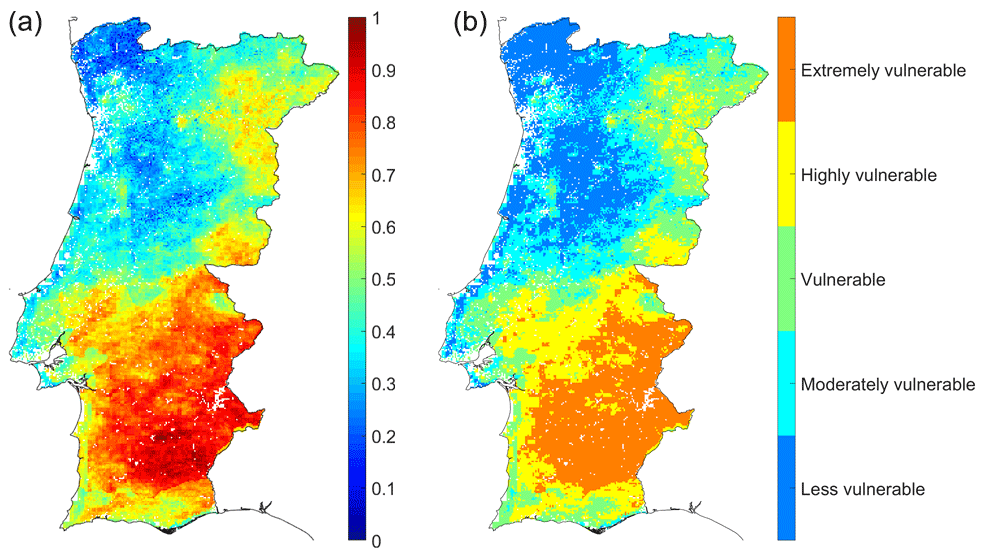
Figure 7(a) Two initial PCs resulting from the application of the PCA to the three components presented in Fig. 4, and loading factors for each component. (b) Classes of vulnerability of the main crops to drought, derived from the map on the left.
A PCA in the three vulnerability components obtained previously was performed, and the two first principal components were selected to represent vulnerability, explaining 90.01 % of the total variance (Figs. 7a and 8). For PC 1, the exposure and sensitivity components present a positive contribution to the final map of vulnerability and show similar weights, whereas the adaptive capacity presents the opposite. PC 2 shows a positive contribution of the three vulnerability components. The spatial pattern in Fig. 7 is characterized by maximum values in the Alentejo region and minimum values in the northwestern region, with a southwest–northeast transition zone.
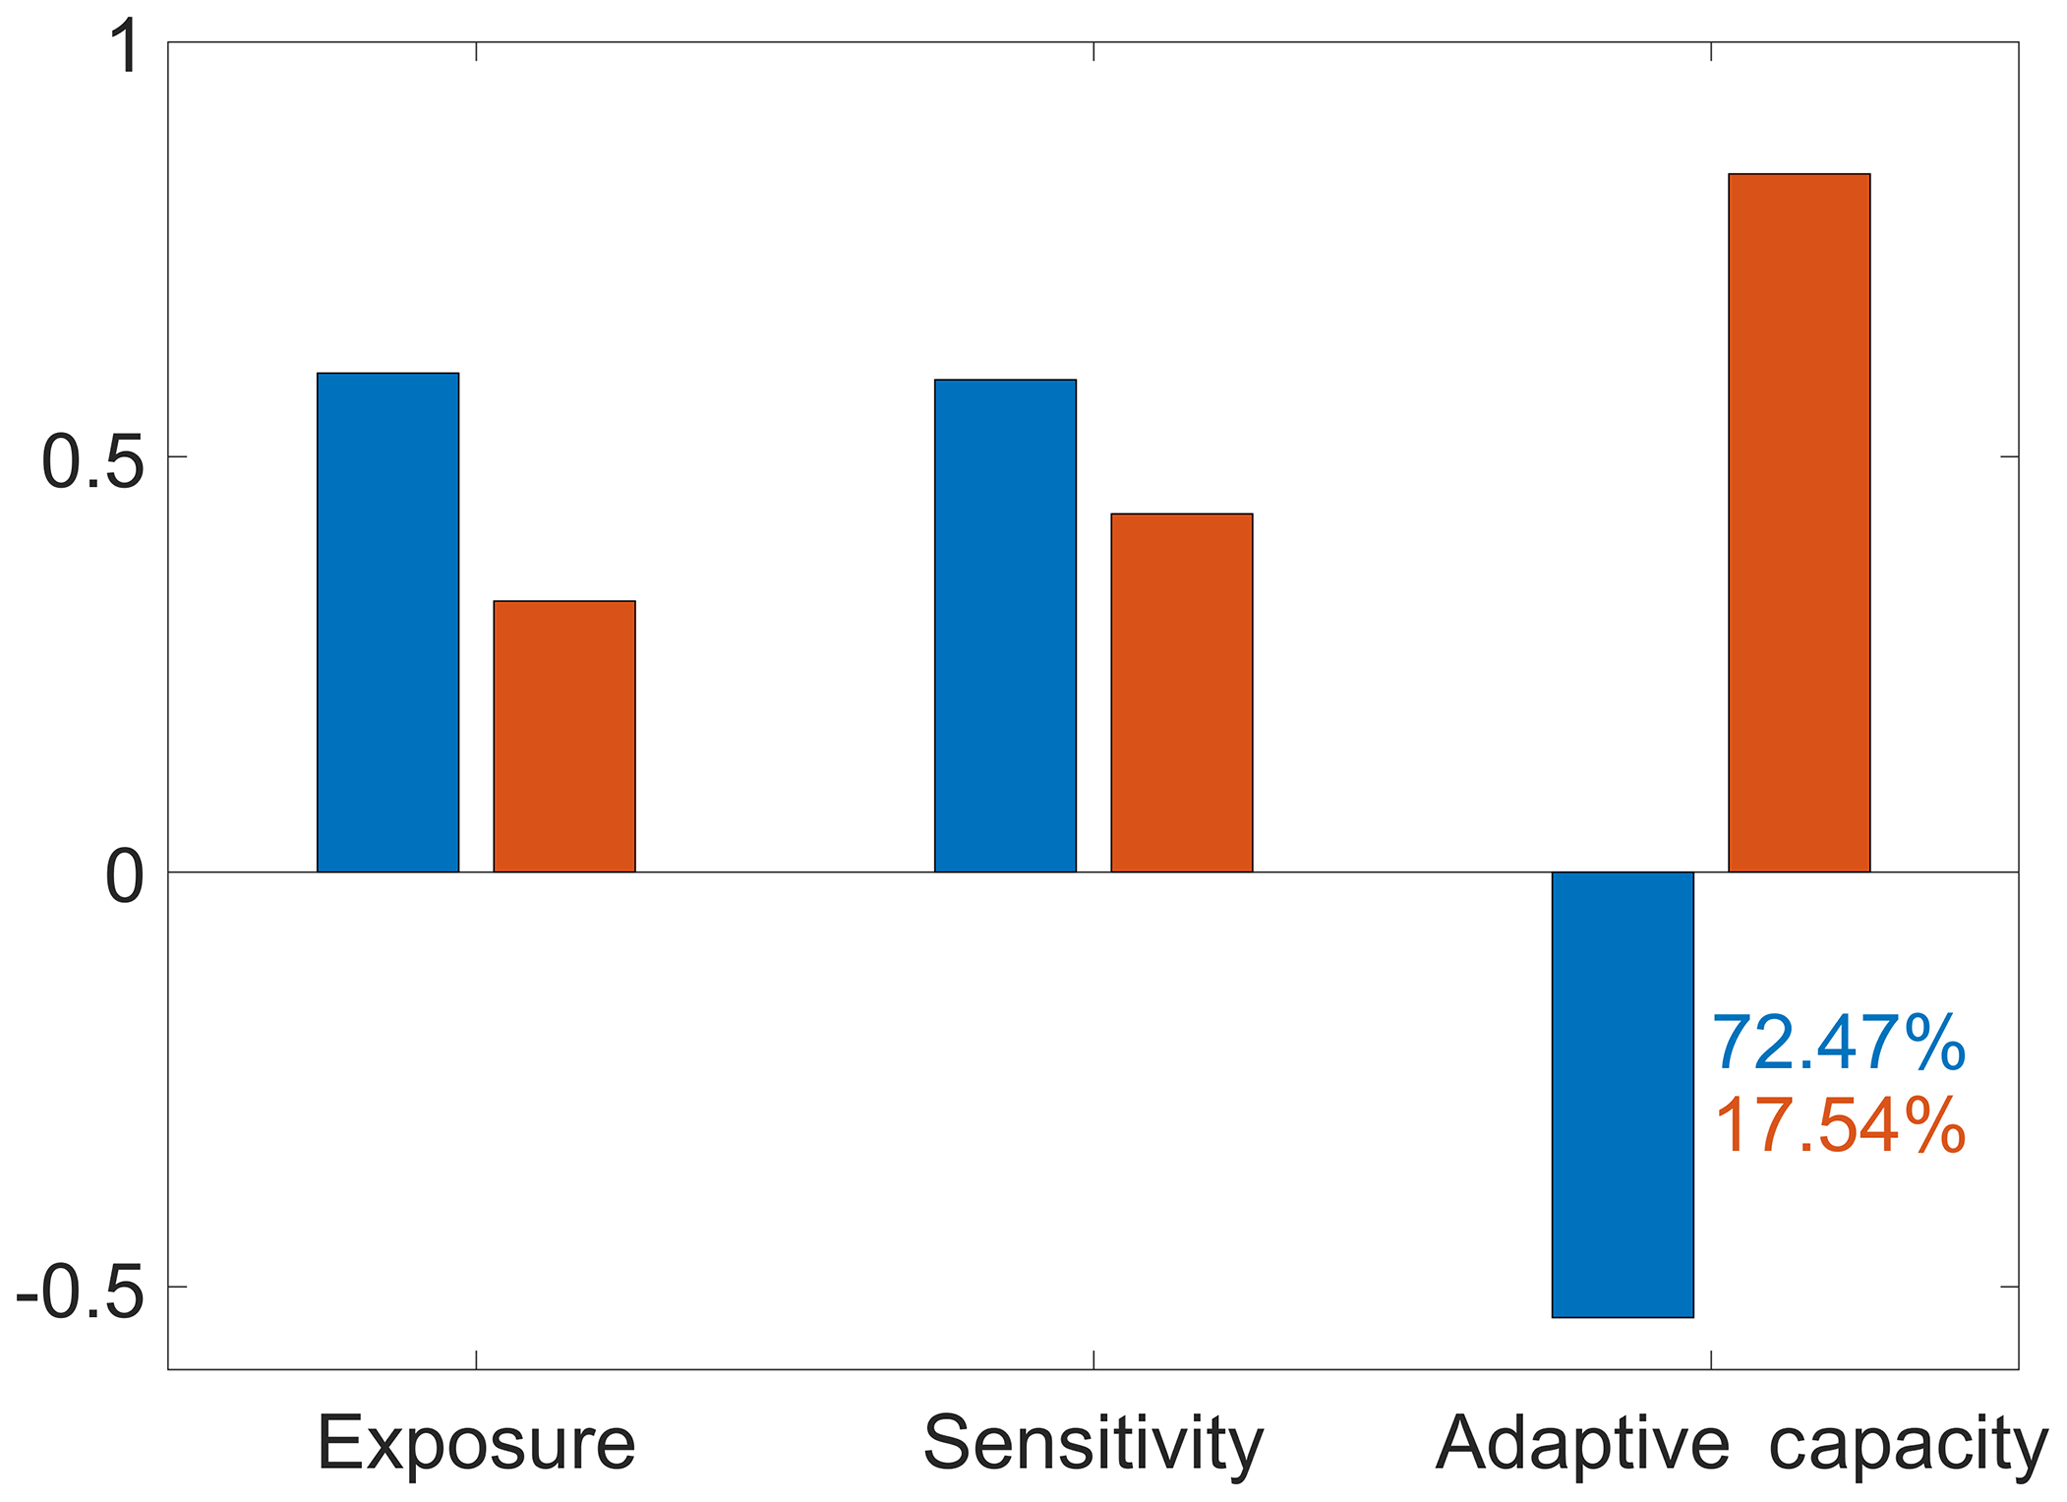
Figure 8Loading factors of each PC (PC 1 – blue; PC 2 – orange) of exposure, sensitivity and adaptive capacity shown in Fig. 5. The percentage of variance explained for each PC is presented in bottom right corner.
Figure 7b presents the spatial distribution of the five defined classes of vulnerability to drought for the main agricultural crops derived from the map obtained previously (Fig. 7a). Agriculture over central and northern coastal areas of Portugal seems to be less to moderately vulnerable to drought. Alentejo, with the exception of the coastal region and that near the Tagus River that is highly vulnerable, exhibits the higher vulnerability class (extremely vulnerable). The southwest–northeast transition region is a vulnerable zone as well as the northeast of Portugal.
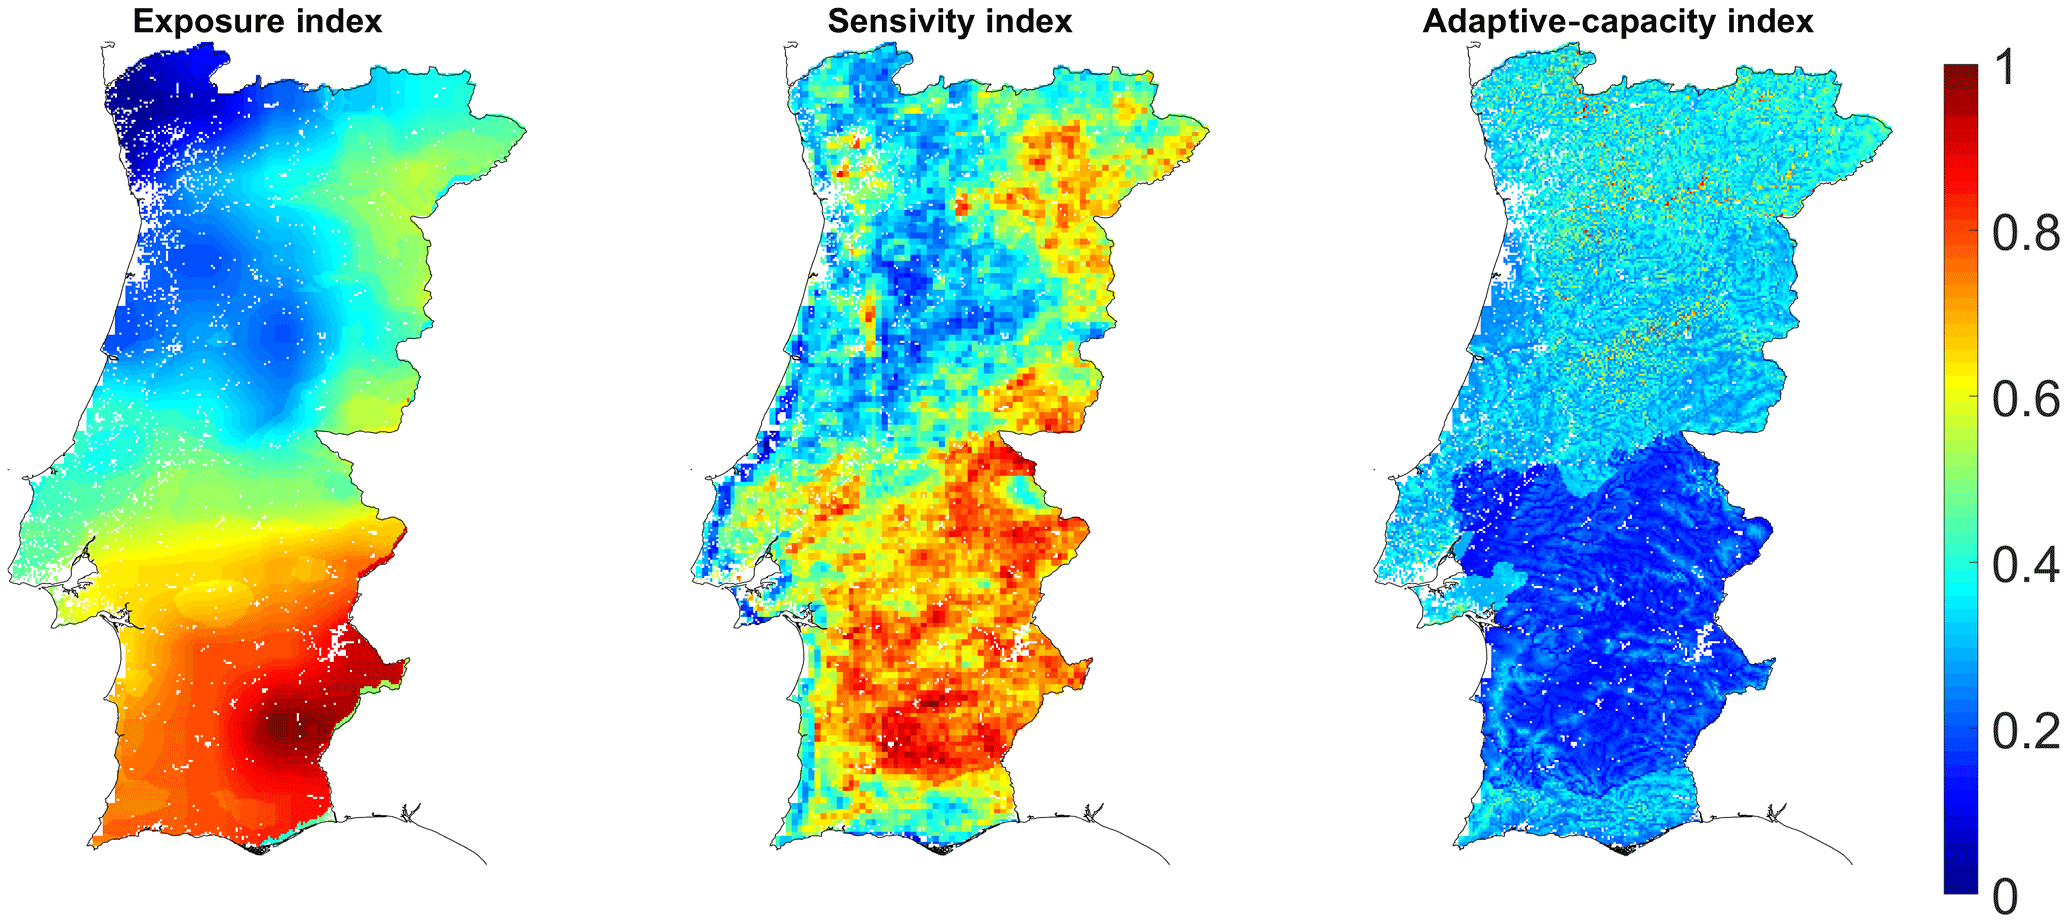
Figure 9Exposure, sensitivity and adaptive-capacity indices obtained with variance method.
The variance method of Murthy et al. (2015b) was also used based on the same indicators (Table 1). Figure 9 presents the spatial pattern of exposure, sensitivity and adaptive-capacity indices obtained; the weights and the contribution (positive or negative) for each of the original 15 indicators corresponding to each index are shown in Fig. 10. The map representing the exposure of crops to drought shows higher values in the southeast and lower values in the northwest (Fig. 9, left panel). As the negative values of the SPEI represent drought events, the contribution of SPEI values is negative to exposure (Fig. 10, left panel); the number of months in which the SPEI is less than −1 or −2 is the frequency of droughts, and it is positively related to exposure of agriculture crops to droughts. The maximum values of AI represent humid zones, and the minimum values correspond to the desert zones, so the AI-like SPEI values are negatively related to exposure of agriculture crops to droughts. The exposure index has a similar contribution from each indicator, with the contribution of indicators 2 and 5 (minimum SPEI) being slightly higher (Fig. 10, left panel).
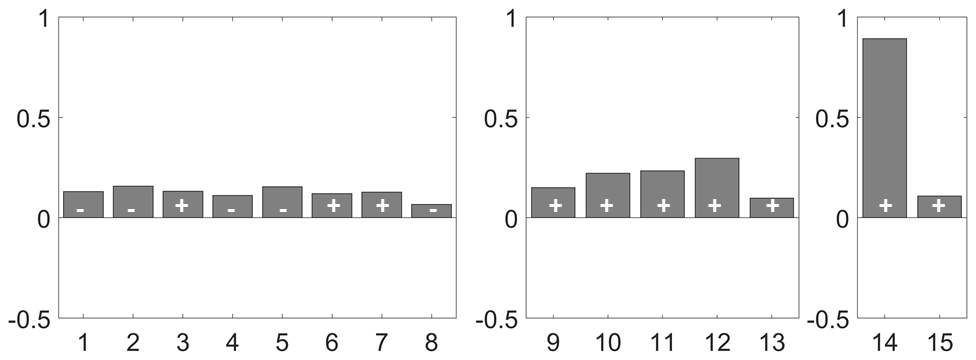
Figure 10Weights associated to each of the 15 original indicators and their respective sign.
Through the analysis of the spatial pattern of the sensitivity index, it is evident that the sensitivity of crops to drought is higher in Alentejo and northeastern region and lower in the central area of Portugal (Fig. 9, middle panel), showing a spatial pattern very close to the exposure index. The SI of the VHI captures most of the total growth of the crops, and the SM of the VHI represents the maximum VHI of the growing season. The SI and SM (indicators 9 and 10) together represent the crop health and its sustenance in the season (Murthy et al., 2015b). The higher the CV (indicators 9–11), the higher the sensitivity of the agricultural area to weather variations (Murthy et al., 2015b). The number of weeks where the VHI is less than 40 represents the frequency of drought in crops (indicator 12), and this group of indicators, along with the mean surface area used for agriculture (indicator 13), has a positive contribution to the sensitivity of crops to drought (Fig. 10, middle panel).
Additionally, the spatial distribution of the adaptive-capacity index values presents a spatial pattern similar with the previous ones; however it shows smaller values. Indicator 14 (mean percentage of irrigable area, relative to total agricultural area) has a higher contribution than water table depth. All of the indicators have a positive contribution because they are related to water in the soil, and the more water available in the soil, the greater the adaptability of agricultural crops to drought.

Figure 11Agriculture drought vulnerability index (ADVI) obtained by the three composite indices of Fig. 8 (a). Classes of vulnerability of main crops to drought derived from the ADVI map (b).
The spatial distribution of the ADVI was obtained through Eq. (7) using the obtained exposure, sensitivity and adaptive-capacity indices based on the Murthy approach. The ADVI values were scaled between 0 and 1 (Fig. 11, left panel) and then converted into vulnerability classes based on the previously referred percentiles (Fig. 11, right panel). The spatial pattern of scaled ADVI (Fig. 11, left panel) identifies areas with high and low vulnerability of agriculture to drought, namely the central and northern coastal areas; this presents the lowest vulnerability to drought (ADVI is less than the 40th percentile), and Alentejo presents the highest vulnerability (ADVI is more than the 60th percentile).
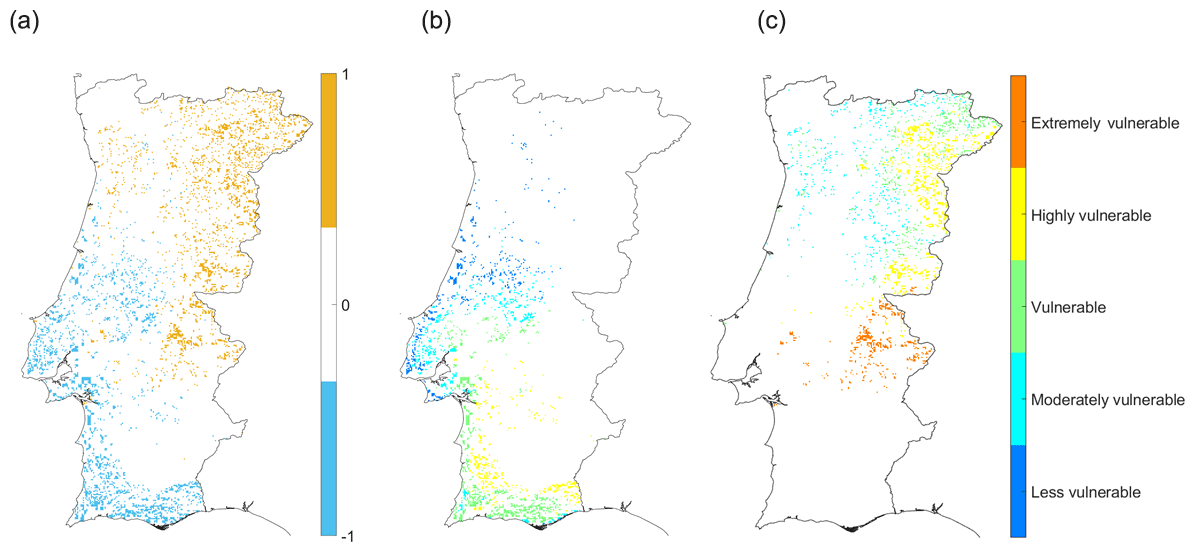
Figure 12(a) Differences between the vulnerability maps obtained by the PCA and variance methods. Vulnerability classes map calculated from the PCA corresponding to the difference equal to (b) −1 and (c) 1.
The final vulnerability maps (Figs. 7a and 11a) are quite similar; however they show some differences (Fig. 12). It should be noted that the differences found in Fig. 12 correspond only to changes between two successive intermediate classes. Furthermore, both methods identify the same regions of low and extreme vulnerability, namely Minho and Alentejo, respectively. In the other vulnerability classes, a few sparse differences of one class are observed; i.e., blue regions (PCA − ADVI < 0) are regions in which the vulnerability class estimated by PCA is smaller than that estimated by the ADVI, and yellow regions (PCA − ADVI > 0) are areas where PCA estimates a higher vulnerability class than that estimated by the ADVI. The blue regions are more common in the central and southern coastal regions of the country. In this case, the PCA method presents a lower class than the ADVI; classes of lower vulnerability predominate in this region, and the vulnerable class is dominant (Table 2). The main land cover type corresponding to these pixels is coded as heterogeneous agricultural areas, open spaces with little or no vegetation, forests and shrubs, and/or herbaceous vegetation associations, according to Corine Land Cover 2006 (Caetano et al., 2009; Table 3). The yellow regions are mainly in the central and northern interior of the country and correspond to higher vulnerability classes. In this case, the vulnerability class is higher as classified by PCA than by the ADVI, and most of these pixels correspond to the highly vulnerable class. Regarding the types of land cover in these areas, there is a greater area of the heterogeneous agricultural areas, open spaces with little or no vegetation, and the shrubs and/or herbaceous vegetation associations. Therefore, when comparing both approaches, we may conclude that both approaches are able to identify agricultural areas which are vulnerable to drought conditions given that the differences between them are negligible.
Table 2Percentage of pixels of each vulnerability class, calculated from the PCA, corresponding to the difference equal to PCA − ADVI <0 and PCA − ADVI >0.
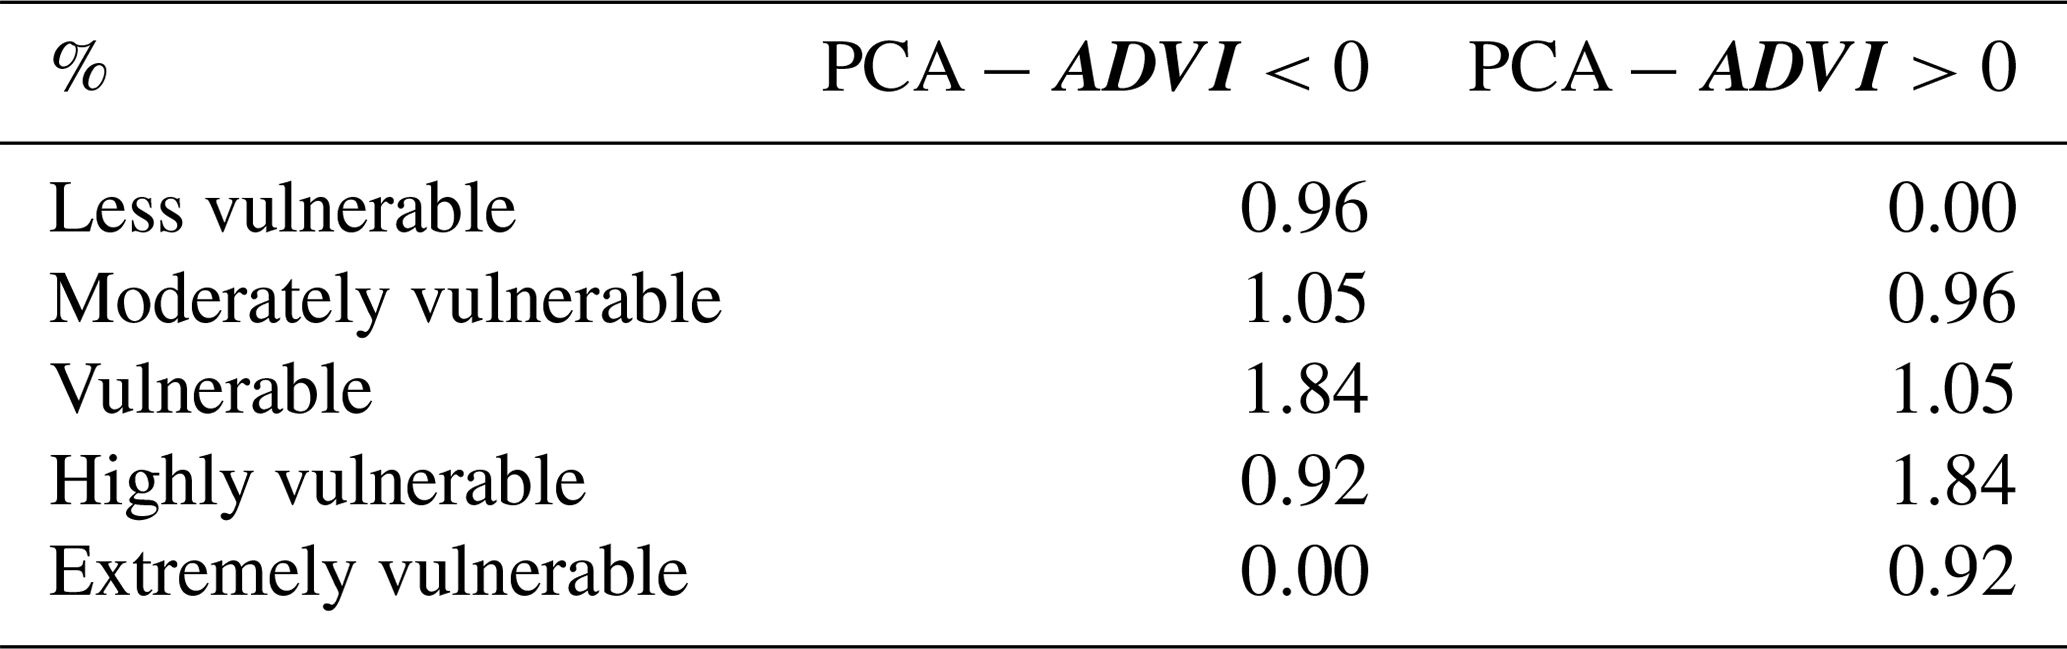
Table 3Percentage of pixels of each Corine Land Cover classification (Caetano et al., 2009), calculated from the PCA, corresponding to the difference equal to PCA − ADVI <0 and PCA − ADVI >0.

The 24th report of the DROUGHT-R & SPI project (Fostering European Drought Research and Science-Policy Interfacing; Kampragou et al., 2015) presents a study of vulnerability and the risk associated with droughts (including Portugal), taking into account the components of exposure, sensitivity and adaptive capacity in some European countries. This study shows that for a vulnerability scale of 1–5 (with 1 corresponding to less vulnerable and 5 corresponding to extremely vulnerable), Portugal presents a vulnerability class of 4, which corresponds to a country showing high vulnerability to drought events. The present work has the advantage of having a much higher spatial resolution, allowing a regional characterization of agriculture drought vulnerability, which is crucial for regional management and better future planning at a regional scale, namely in the climate change context.
In the variance method, the functional relationships between indicators and respective component indices (Fig. 10) are made from the a priori knowledge of the variable. Moreover, it is important to point that in both methods, weights are driven by data. PCA adopts a linear approach for weight generation. It also should be stressed that the sign of scores and of loadings obtained from PCA is arbitrary and meaningless. It can be flipped, but only if the sign of both scores and loadings is reversed at the same time. Therefore, PCA does not necessarily define the sign of the indicators, and it should be noted that the sign of the indicators in PC 1 (blue bars in Fig. 6) is the same of the sign defined intuitively in the Murthy method. When applying the second PCA in order to obtain the exposure, sensitivity and adaptive-capacity maps, the sign of PC 1 (blue bars in Fig. 8) is the same of the sign of the three components in Eq. (7). Therefore, the PCA could be used to normalize the indicators according to the signal of the loading factors obtained in the first PC. In some vulnerability assessment studies, a simple and unique normalization is made for each indicator, and then a PCA is applied to generate the weights. Since the first principal component contains the most information, the absolute value of the loading of the first single component is considered valid for assigning weights (Filmer and Pritchett, 2001; Gbetibouo et al., 2010). Consequently, the PCA approach has several advantages over the variance method: (i) the approach based on PCA does not require performing two types of normalization to the indicators based on the functional relationships between indicators and the respective component index, and (ii) the signal of the variable contributions to vulnerability components is automatically chosen by PCA.
The application of PCA to characterize and monitor drought events in Portugal is not innovative; however it has only been applied using isolated variables such as the SPEI, SPI and PDSI (Martins et al., 2012; Santos et al., 2010; Vicente-Serrano, 2006). The approach used for the present work is applied to a larger and more diverse number of variables related to the components of exposure, sensitivity and adaptive capacity of the crops, which allows evaluating the vulnerability of crops to drought. In addition, its application is supported by similar results attained by the variance method. It also should be noted that the proposed automatic methodology, based on PCA, could be easy extended to a broad region, such as the Mediterranean Basin, as it does not require a priori knowledge of regional agriculture behavior.
Projections of the future temperature and precipitation rise in southern Europe (García-Ruiz et al., 2011) point to an increase in the vulnerability to drought (Dai, 2011; IPCC, 2007, 2014). Water resources will tend to be increasingly scarce, bringing consequences for the production of agricultural crops (García-Ruiz et al., 2011), and, therefore, a better management of water resources will enable a better adaptation to future drought events. Agricultural drought, due to reduced moisture availability in the soil for crops, undermines food security and sustainable agriculture, giving rise to significant losses in the economy. The present work proposes an automatic method which is able to identify the agricultural areas most vulnerable to drought and therefore provides a tool to assist in the future planning and management in these areas. As the IPCC “Fourth Assessment Report” (IPCC, 2007) proposes vulnerability assessments covering the components of exposure, sensitivity and adaptive capacity of the system, this work applies a PCA to several indicators based on the definition of these components. A variance method based in same indicators was also applied (Murthy et al., 2015b).
Both methods applied in the present study identify Alentejo as an extremely vulnerable zone and the Minho as a less vulnerable zone. The regions that are classified by both the PCA and the variance method as belonging to the same vulnerability class are more likely to correspond to these two types of vulnerability. There are small differences between the methods. These differences are higher in heterogeneous agricultural areas, forests and shrubs, and/or herbaceous vegetation associations. However, the PCA method has some advantages over the variance method because it can identify the sign of the indicators, not having to use the indicator–component relationship nor calculate weights.
Alentejo is a region which requires special attention, as this is the region where the area used for the main agricultural crops is larger than the other regions, and it was classified by both methods as the region most vulnerable to drought. The spatial pattern of vulnerability highlights the high dependence of Portuguese agriculture on water availability (Páscoa et al., 2017b; Ribeiro et al., 2018). The most vulnerable region (Alentejo) is characterized as arid, and the less vulnerable regions (central and north coast) are characterized as humid.
Exploring the links between meteorological drought indicators and other variables that express drought impacts is considered to be a step towards the improvement of an early warning system for seasonal drought impacts (Dias et al., 2019). The present approach, by making use of higher-resolution data, allows the identification of different zones within the country that present different vulnerabilities. The proposed automatic technique does not require previous knowledge about the regional relationship between drought events and crops; therefore this advantage may be applied to a larger region. It is hoped that this study will contribute to a better understanding of how and how much the agricultural sector is affected in a drought situation in order to reduce the damage in this sector that play an important role in the national context.
The values of monthly precipitation and reference evapotranspiration are available from https://crudata.uea.ac.uk/cru/data/hrg/ (Harris et al., 2014).
The values of the VHI are available from ftp://ftp.star.nesdis.noaa.gov/pub/corp/scsb/wguo/data/Blended_VH_4km/geo_TIFF/ (last access: 25 November 2019; Kogan et al., 2015).
The main agricultural areas in Portugal are available from https://www.ine.pt/xportal/xmain?xpid=INE&xpgid=ine_indicadores&indOcorrCod=0000018&contexto=bd&selTab=tab2 (INE, 2016a), and the percentage of irrigable area in agricultural areas in Portugal is available in https://www.ine.pt/xportal/xmain?xpid=INE&xpgid=ine_indicadores&indOcorrCod=0003006&contexto=bd&selTab=tab2 (INE, 2016b).
The WTD is available from https://glowasis.deltares.nl/thredds/catalog/opendap/opendap/Equilibrium_Water_Table/catalog.html (Fan et al., 2013).
The CLC map for the year 2006 is available from https://land.copernicus.eu/pan-european/corine-land-cover/clc-2006 (Büttner et al., 2014).
CA, AR and CG participated in the conceptual design of the study and the interpretation and redaction of the paper. CA, AR and PP calculated the meteorological indices. Each of the co-authors performed a thorough revision of the paper, provided useful advice on the intellectual content and improved the English language.
The authors declare that they have no conflict of interest.
This article is part of the special issue “Hydroclimatic extremes and impacts at catchment to regional scales”. It is not associated with a conference.
The authors are in debt to Pedro Matos Soares for his support with WRF data for the Iberian Peninsula.
This research has been supported by the Fundação para a Ciência e a Tecnologia (FCT), under projects IMPECAF (grant no. PTDC/CTA-55 CLI/28902/2017), IMDROFLOOD (grant no. WaterJPI/0004/2014) and CLMALERT grant no. (ERA4CS/0005/2016).
This paper was edited by Sergio Martín Vicente Serrano and reviewed by C. S. Murthy and one anonymous referee.
Abson, D. J., Dougill, A. J., and Stringer, L. C.: Using Principal Component Analysis for information-rich socio-ecological vulnerability mapping in Southern Africa, Appl. Geogr., 35, 515–524, https://doi.org/10.1016/j.apgeog.2012.08.004, 2012.
AEMET-IM: Iberian Climate Atlas. Air temperature and Precipitation (1971–2000), Agencia Estatal Meteorol. Minist. Medio Ambient. y Medio Rural y Mar. Inst. Meteorol. Port., ISBN 978-84-7837-079–5, available at: http://www.ipma.pt/resources.www/docs/publicacoes.site/atlas_clima_iberico.pdf (last access: 30 July 2019), 2011.
Andrade, C. and Belo-Pereira, M.: Assessment of droughts in the Iberian Peninsula using the WASP-Index, Atmos. Sci. Lett., 16, 208–218, https://doi.org/10.1002/asl2.542, 2015.
Anselin, L. and Getis, A.: Spatial statistical analysis and geographic information systems, in Geographic Information Systems, Spatial Modelling and Policy Evaluation, Springer Berlin Heidelberg, Berlin, Heidelberg, Germany, 35–49, 1993.
Beguería, S, Vicente-Serrano, S. M., Reig, F., and Latorre, B.: Standardized precipitation evapotranspiration index (SPEI) revisited: parameter fitting, evapotranspiration models, tools, datasets and drought monitoring, Int. J. Climatol., 34, 3001–3023, https://doi.org/10.1002/joc.3887, 2014.
Blauhut, V., Stahl, K., Stagge, J. H., Tallaksen, L. M., De Stefano, L., and Vogt, J.: Estimating drought risk across Europe from reported drought impacts, drought indices, and vulnerability factors, Hydrol. Earth Syst. Sci., 20, 2779–2800, https://doi.org/10.5194/hess-20-2779-2016, 2016.
Bogardi, J. J. and Birkmann, J.: Vulnerability assessment?: the first step towards sustainable risk reduction, Disasters and Society – From Hazard Assessment to Risk Reduction, Universität Karlsruhe, Logos, Berlin, Germany, 1–83, 2005.
Bokusheva, R., Kogan, F., Vitkovskaya, I., Conradt, S., and Batyrbayeva, M.: Satellite-based vegetation health indices as a criteria for insuring against drought-related yield losses, Agr. Forest Meteorol., 220, 200–206, https://doi.org/10.1016/j.agrformet.2015.12.066, 2016.
Büttner, G., Soukup, T., and Kosztra, B.: CLC2012 Addendum to CLC2006 Technical Guidelines. Final Draft, EEA, Copenhagen, Denmark, 2014 (data available at: https://land.copernicus.eu/pan-european/corine-land-cover/clc-2006, last access: 25 November 2019).
Caetano, M., Nunes, V. and Nunes, A.: CORINE Land Cover 2006 for Continental Portugal, Technical Report, Instituto Geográfico Português, Lisboa, Portugal, available at: http://mapas.dgterritorio.pt/atom-dgt/pdf-cous/CLC2006/CORINE_Land_cover_2006_for_Continental_Portugal.pdf (last access: 25 November 2019), 2009.
Dai, A.: Drought under global warming: a review, WIRES Clim. Change, 2, 45–65, https://doi.org/10.1002/wcc.81, 2011.
Dias, S., Acácio, V., Bifulco, C., and Rego, F.: Improving Drought Preparedness in Portugal, Drought: Science and Policy, in: Part III, Understanding the natural hazard, Wiley Publishers, https://doi.org/10.1002/9781119017073.ch10, 2019.
Espírito Santo, F., Ramos, A. M., de Lima, M. I. P., and Trigo, R. M.: Seasonal changes in daily precipitation extremes in mainland Portugal from 1941 to 2007, Reg. Environ. Change, 14, 1765–1788, https://doi.org/10.1007/s10113-013-0515-6, 2014a.
Espírito Santo, F., de Lima, M. I. P., Ramos, A. M., and Trigo, R. M.: Trends in seasonal surface air temperature in mainland Portugal, since 1941, Int. J. Climatol., 34, 1814–1837, https://doi.org/10.1002/joc.3803, 2014b.
Fan, Y., Li, H., and Miguez-Macho, G.: Global Patterns of Groundwater Table Depth, Science, 339, 940–943, https://doi.org/10.1126/science.1229881, 2013 (data available at: https://glowasis.deltares.nl/thredds/catalog/opendap/opendap/Equilibrium_Water_Table/catalog.html, last access: 25 November 2019).
FAO: Climate Change, Agriculture and Food Segurity, Food and Agriculture Organization of the United Nations, Rome, Italy, available at: http://www.fao.org/3/a-i6030e.pdf (last access: 25 November 2019), 2016.
FAO: The impact of disasters and crises on agriculture and food security, Food and Agriculture Organization of the United Nations, Rome, Italy, available at: http://www.fao.org/3/I8656EN/i8656en.pdf (last access: 25 November 2019), 2017.
Field, C. B., Barros, V., Stocker, T. F., and Dahe, Q.: Managing the Risks of Extreme Events and Disasters to Advance Climate Change Adaptation: A Special Report of Working Groups I and II of the Intergovernmental Panel on Climate Change, Cambridge, UK, available at: https://www.ipcc.ch/site/assets/uploads/2018/03/SREX_Full_Report-1.pdf (last access: 22 July 2019), 2012.
Filmer, D. and Pritchett, L.: Estimating Wealth Effects Without Expenditure Data–Or Tears: An Application to Educational Enrollments in States of India, Demography, 38, 115–132, https://doi.org/10.1353/dem.2001.0003, 2001.
García-Herrera, R., Hernández, E., Barriopedro, D., Paredes, D., Trigo, R. M., Trigo, I. F. and Mendes, M. A.: The Outstanding 2004/05 Drought in the Iberian Peninsula: Associated Atmospheric Circulation, J. Hydrometeorol., 8, 483–498, https://doi.org/10.1175/JHM578.1, 2007.
García-Herrera, R., Garrido-Perez, J. M., Barriopedro, D., Ordóñez, C., Vicente-Serrano, S. M., Nieto, R., Gimeno, L., Sorí, R., and Yiou, P.: The European 2016/17 Drought, J. Climate, 32, 3169–3187, https://doi.org/10.1175/JCLI-D-18-0331.1, 2019.
García-Ruiz, J. M., López-Moreno, I. I., Vicente-Serrano, S. M., Lasanta-Martínez, T., and Beguería, S.: Mediterranean water resources in a global change scenario, Earth-Sci. Rev., 105, 121–139, https://doi.org/10.1016/j.earscirev.2011.01.006, 2011.
Gbetibouo, G. A., Ringler, C., and Hassan, R.: Vulnerability of the South African farming sector to climate change and variability: An indicator approach, Nat. Resour. Forum, 34, 175–187, https://doi.org/10.1111/j.1477-8947.2010.01302.x,, 2010.
Giorgi, F. and Lionello, P.: Climate change projections for the Mediterranean region, Global Planet. Change, 63, 90–104, https://doi.org/10.1016/J.GLOPLACHA.2007.09.005, 2008.
Gomes Marques, I., Nascimento, J., Cardoso, R. M., Miguéns, F., Condesso de Melo, M. T., Soares, P. M. M., Gouveia, C. M., and Kurz Besson, C.: Mapping the suitability of groundwater-dependent vegetation in a semi-arid Mediterranean area, Hydrol. Earth Syst. Sci., 23, 3525–3552, https://doi.org/10.5194/hess-23-3525-2019, 2019.
Gouveia, C., Trigo, R. M., and DaCamara, C. C.: Drought and vegetation stress monitoring in Portugal using satellite data, Nat. Hazards Earth Syst. Sci., 9, 185–195, https://doi.org/10.5194/nhess-9-185-2009, 2009.
Gouveia, C. M., Trigo, R. M., Beguería, S., and Vicente-Serrano, S. M.: Drought impacts on vegetation activity in the Mediterranean region: An assessment using remote sensing data and multi-scale drought indicators, Global Planet. Change, 151, 15–27, https://doi.org/10.1016/j.gloplacha.2016.06.011, 2017.
Hargreaves, G. H. and Samani, Z. A.: Reference crop evapotranspiration from temperature, Appl. Eng. Agric., 1, 96–99, 1985.
Harris, I., Jones, P. D., Osborn, T. J., and Lister, D.: Updated high-resolution grids of monthly climatic observations – The CRU TS3.10 Dataset, Int. J. Climatol., 34, 623–642, https://doi.org/10.1002/joc.3711, 2014 (data available at: https://crudata.uea.ac.uk/cru/data/hrg/, last access: 25 November 2019).
Hatcher, L.: A step by step approach to using SAS for factor analysis and structural equation modeling, SAS Institute Inc, Cary, North Carolina, USA, 1997.
Hernandez-Barrera, S., Rodriguez-Puebla, C., and Challinor, A. J.: Effects of diurnal temperature range and drought on wheat yield in Spain, Theor. Appl. Climatol., 129, 503–519, https://doi.org/10.1007/s00704-016-1779-9, 2017.
Hiremath, D. B. and Shiyani, R. L.: Evaluating Regional Vulnerability to Climate Change: A Case of Saurashtra, Indian J. Agr. Econ., 67, 334–344, 2012.
INE: Estatísticas agrícolas: 2015, Instituto Nacional de Estatística, available at: https://www.ine.pt/xportal/xmain?xpid=INE&xpgid=ine_indicadores&indOcorrCod=0000018&contexto=bd&selTab=tab2 (last access: 25 November 2019), 2016a.
INE: Estatísticas agrícolas: 2015, Instituto Nacional de Estatística, available at: https://www.ine.pt/xportal/xmain?xpid=INE&xpgid=ine_indicadores&indOcorrCod=0003006&contexto=bd&selTab=tab2 (last access: 25 November 2019), 2016b.
IPCC: Climate Change 2007: Impacts, Adaptation and Vulnerability. Contribution of Working Group II to the Fourth Assessment Report of the Intergovernmental Panel on Climate Change, edited by: Parry, M. L., Canziani, O. F., Palutikof, J. P., van der Linden, P. J., and Hanson, C. E., Cambridge University Press, Cambridge, UK, 2007.
IPCC: Climate Change 2014: Synthesis Report. Contribution of Working Groups I, II and III to the Fifth Assessment Report of the Intergovernmental Panel on Climate Change, edited by: Core Writing Team, Pachauri, R. K., and Meyer, L. A., IPCC, Geneva, Switzerlan, 2014.
Iyengar, N. S. and Sudarshan, P.: A Method of Classifying Regions from Multivariate Data, Econ. Polit. Wkly., 17, 2047–2049, 1982.
Jiang, G., Yu, F., and Zhao, Y.: An analysis of vulnerability to agricultural drought in China using the expand grey relation analysis method, Procedia Engineer., 28, 670–676, https://doi.org/10.1016/j.proeng.2012.01.789, 2012.
Kampragou, E., Assimacopoulos, D., Andreu, J., Bifulco, C., Carli, A. De, Tánago, I. G., Monteagudo, D. H., Massarutto, A., Musolino, D., Rego, F., Seidl, I., Solera, A., Reguera, J. U., and Wolters, W.: Systematic Classification of Drought Vulnerability and Relevant Strategies – Case Study Scale, DROUGHT-R&SPI (Fostering European Drought Research and Science-Policy Interfacing), Technical Report No. 24, Athens, Greece, 2015.
Kang, H., Xuxiang, L., and Jing, Z.: GIS analysis of changes in ecological vulnerability using a SPCA model in the Loess plateau of Northern Shaanxi, China, Int. J. Env. Res. Pub. He., 12, 4292–4305, https://doi.org/10.3390/ijerph120404292, 2015.
Kim, H., Park, J., Yoo, J., and Kim, T. W.: Assessment of drought hazard, vulnerability, and risk: A case study foradministrative districts in South Korea, J. Hydro-Environ. Res., 9, 28–35, https://doi.org/10.1016/j.jher.2013.07.003, 2015.
Kogan, F. N.: Droughts of the Late 1980s in the United States as Derived from NOAA Polar-Orbiting Satellite Data, B. Am. Meteorol. Soc., 76, 655–668, https://doi.org/10.1175/1520-0477(1995)076<0655:DOTLIT>2.0.CO;2, 1995.
Kogan, F. N.: Global Drought Watch from Space, B. Am. Meteorol. Soc., 78, 621–636, https://doi.org/10.1175/1520-0477(1997)078<0621:GDWFS>2.0.CO;2, 1997.
Kogan, F. N.: A typical pattern of vegetation conditions in southern africa during EL nino years detected from AVHRR data using three-channel numerical index, Int. J. Remote Sens., 19, 3688–3694, https://doi.org/10.1080/014311698213902, 1998.
Kogan, F. N.: Operational space technology for global vegetation assessment, B. Am. Meteorol. Soc., 82, 1949–1964, https://doi.org/10.1175/1520-0477(2001)082<1949:OSTFGV>2.3.CO;2, 2001.
Kogan, F., Guo, W., Ding, H., and NOAA JPSS Program Office: NOAA JPSS Visible Infrared Imaging Radiometer Suite (VIIRS) Vegetation Health and Drought Products (VHDP) from NDE. VHI. NOAA National Centers for Environmental Information, https://doi.org/10.7289/V58W3BCR, 2015 (data available at: ftp://ftp.star.nesdis.noaa.gov/pub/corp/scsb/wguo/data/Blended_VH_4km/geo_TIFF/, last access: 25 November 2019).
Li, A., Wang, A., Liang, S., and Zhou, W.: Eco-environmental vulnerability evaluation in mountainous region using remote sensing and GIS – A case study in the upper reaches of Minjiang River, China, Ecol. Modell., 192, 175–187, https://doi.org/10.1016/J.ECOLMODEL.2005.07.005, 2006.
Liberato, M. L. R., Ramos, A. M., Gouveia, C. M., Sousa, P., Russo, A., Trigo, R. M., and Santo, F. E.: Exceptionally extreme drought in Madeira Archipelago in 2012: Vegetation impacts and driving conditions, Agr. Forest Meteorol., 232, 195–209, https://doi.org/10.1016/J.AGRFORMET.2016.08.010, 2017.
Luers, A. L., Lobell, D. B., Sklar, L. S., Addams, C. L., and Matson, P. A.: A method for quantifying vulnerability, applied to the agricultural system of the Yaqui Valley, Mexico, Global Environ. Chang., 13, 255–267, https://doi.org/10.1016/S0959-3780(03)00054-2, 2003.
Mariotti, A., Pan, Y., Zeng, N., and Alessandri, A.: Long-term climate change in the Mediterranean region in the midst of decadal variability, Clim. Dynam., 44, 1437–1456, https://doi.org/10.1007/s00382-015-2487-3, 2015.
Martins, D. S., Raziei, T., Paulo, A. A., and Pereira, L. S.: Spatial and temporal variability of precipitation and drought in Portugal, Nat. Hazards Earth Syst. Sci., 12, 1493–1501, https://doi.org/10.5194/nhess-12-1493-2012, 2012.
Maskrey, A.: Vulnerability accumulation in peripheral regions in Latin America: the challenge for disaster prevention and management, Natural Disasters: Protecting Vulnerable Communities: Proceedings of the Conference held in London, 13–15 October 1993, London, UK, Thomas Telford Publishing, 461–472, 1993.
McKee, T. B., Doesken, N. J., and Kleist, J.: The relationship of drought frequency and duration to time scales, Boston, USA, 1993.
Monteith, J. L.: Evaporation and environment, Symp. Soc. Exp. Biol., 19, 205–234, 1965.
Murthy, C. S., Yadav, M., Mohammed Ahamed, J., Laxman, B., Prawasi, R., Sesha Sai, M. V. R., and Hooda, R. S.: A study on agricultural drought vulnerability at disaggregated level in a highly irrigated and intensely cropped state of India, Environ. Monit. Assess., 187, 140, https://doi.org/10.1007/s10661-015-4296-x, 2015a.
Murthy, C. S., Laxman, B., and Sesha Sai, M. V. R.: Geospatial analysis of agricultural drought vulnerability using a composite index based on exposure, sensitivity and adaptive capacity, Int. J. Disast. Risk Re., 12, 163–171, https://doi.org/10.1016/j.ijdrr.2015.01.004, 2015b.
O'Brien, K., Leichenko, R., Kelkar, U., Venema, H., Aandahl, G., Tompkins, H., Javed, A., Bhadwal, S., Barg, S., Nygaard, L., and West, J.: Mapping vulnerability to multiple stressors: Climate change and globalization in India, Global Environ. Chang., 14, 303–313, https://doi.org/10.1016/j.gloenvcha.2004.01.001, 2004.
Palmer, W. C.: Meteoroligal Drought, Meteorol. drought, U.S. Res. Pap. No. 45, US Weather Bur., Washington, D.C., USA, 58, 1965.
Páscoa, P., Gouveia, C. M., Russo, A., and Trigo, R. M.: Drought Trends in the Iberian Peninsula over the Last 112 Years, Adv. Meteorol., 2017, 1–13, https://doi.org/10.1155/2017/4653126, 2017a.
Páscoa, P. , Gouveia, C. M., Russo, A., Trigo R. M.: The role of drought on wheat yield interannual variability in the Iberian Peninsula from 1929 to 2012, Int. J. Biometeorol., 61, 439–451, https://doi.org/10.1007/s00484-016-1224-x, 2017b.
Potop, V., Boroneanţ, C., Možný, M., Štěpánek, P., and Skalák, P.: Observed spatiotemporal characteristics of drought on various time scales over the Czech Republic, Theor. Appl. Climatol., 115, 563–581, https://doi.org/10.1007/s00704-013-0908-y, 2014.
Rhee, J. and Cho, J.: Future changes in drought characteristics: regional analysis for South Korea under CMIP5 projections, J. Hydrometeorol, 17, 437–451, 2016.
Ribeiro, A. F. S., Russo, A., Gouveia, C. M., and Páscoa, P.: Modelling drought-related yield losses in Iberia using remote sensing and multiscalar indices, Theor. Appl. Climatol., 136, 203–220, https://doi.org/10.1007/s00704-018-2478-5, 2018.
Russo, A. C., Gouveia, C. M., Trigo, R. M., Liberato, M. L. R., and DaCamara, C. C.: The influence of circulation weather patterns at different spatial scales on drought variability in the Iberian Peninsula, Front. Environ. Sci., 3, 1–15, https://doi.org/10.3389/fenvs.2015.00001, 2015.
Santos, J. F., Pulido-Calvo, I., and Portela, M. M.: Spatial and temporal variability of droughts in Portugal, Water Resour. Res., 46, W03503, https://doi.org/10.1029/2009WR008071, 2010.
Sheffield, J., Wood, E. F., and Roderick, M. L.: Little change in global drought over the past 60 years, Nature, 491, 435–438, 2012.
Smith, L. I.: A tutorial on Principal Components Analysis, Technical Report OUCS-2002-12, Department of Computer Science, University of Otago, Dunedin, Otago, New Zealan, 2002.
Soares, P. M. M., Cardoso, R. M., Lima, D. C. A., and Miranda, P. M. A.: Future precipitation in Portugal: high-resolution projections using WRF model and EURO-CORDEX multi-model ensembles, Clim. Dynam., 49, 2503–2530, https://doi.org/10.1007/s00382-016-3455-2, 2017.
Spinoni, J., Vogt, J., Naumann, G., Carrao, H., and Barbosa, P.: Towards identifying areas at climatological risk of desertification using the Köppen–Geiger classification and FAO aridity index, Int. J. Climatol., 35, 2210–2222, https://doi.org/10.1002/joc.4124, 2015.
Trigo, R. M. and DaCamara, C. C.: Circulation weather types and their influence on the precipitation regime in Portugal, Int. J. Climatol., 20, 1559–1581, https://doi.org/10.1002/1097-0088(20001115)20:13<1559::AID-JOC555>3.0.CO;2-5, 2000.
Trigo, R. M., Añel, J., Barriopedro, D., García-Herrera, R., Gimeno, L., Nieto, R., Castillo, R., Allen, M. R., and Massey, N.: The record Winter drought of 2011–12 in the Iberian Peninsula, in Explaining Extreme Events of 2012 from a Climate Perspective, B. Am. Meteorol. Soc., 94, S41–S45, 2013.
Valverde, P., Serralheiro, R., Carvalho, M., and Shahidian, S.: Efeitos das alterações climáticas nas necessidades úteis de rega na bacia do Guadiana, Recur. Hídricos, 35, 53–67, 2014.
Vicente-Serrano, S. M.: Differences in spatial patterns of drought on different time scales: An analysis of the Iberian Peninsula, Water Resour. Manag., 20, 37–60, https://doi.org/10.1007/s11269-006-2974-8, 2006.
Vicente-Serrano, S. M., Cuadrat-Prats, J. M., and Romo, A.: Early prediction of crop production using drought indices at different timescales and remote sensing data: application in the Ebro Valley (north-east Spain), Int. J. Remote Sens., 27, 511–518, https://doi.org/10.1080/01431160500296032, 2006.
Vicente-Serrano, S. M., Beguería, S., and López-Moreno, J. I.: A multiscalar drought index sensitive to global warming: The standardized precipitation evapotranspiration index, J. Climate, 23, 1696–1718, https://doi.org/10.1175/2009JCLI2909.1, 2010a.
Vicente-Serrano, S. M., Beguería, S., López-Moreno, J. I., Angulo, M., and El Kenawy, A.: A New Global 0.5∘ Gridded Dataset (1901–2006) of a Multiscalar Drought Index: Comparison with Current Drought Index Datasets Based on the Palmer Drought Severity Index, J. Hydrometeorol., 11, 1033–1043, https://doi.org/10.1175/2010JHM1224.1, 2010b.
Vicente-Serrano, S. M., Begueria, S., Lorenzo-Lacruz, J., Camarero, J. J., Lopez-Moreno, J. I., ,Azorin-Molina, C., Revuelto, J., Moran-Tejeda, E., and Sanchez-Lorenzo A.: Performance of drought indices for ecological, agricultural, and hydrological applications, Earth Interact., 16, 1–27, https://doi.org/10.1175/2012ei000434.1, 2012.
Vicente-Serrano, S. M., Lopez-Moreno, J. I., Beguería, S., Lorenzo-Lacruz, J., Sanchez-Lorenzo, A., García-Ruiz, J. M., Azorin-Molina, C., Morán-Tejeda, E., Revuelto, J., Trigo, R., Coelho, F., and Espejo, F.: Evidence of increasing drought severity caused by temperature rise in southern Europe, Environ. Res. Lett., 9, 044001, https://doi.org/10.1088/1748-9326/9/4/044001, 2014.
Wang, K., Dickinson, R. E., and Liang, S.: Global Atmospheric Evaporative Demand over Land from 1973 to 2008, J. Climate, 25, 8353–8361, https://doi.org/10.1175/JCLI-D-11-00492.1, 2012.
Wilks, D. S.: Statistical methods in the atmospheric sciences, 3rd edn., International geophysics series, vol. 100, Elsevier/Academic Press, Oxford, UK, 2011.
Wiréhn, L., Danielsson, Å., and Neset, T. S. S.: Assessment of composite index methods for agricultural vulnerability to climate change, J. Environ. Manage., 156, 70–80, https://doi.org/10.1016/j.jenvman.2015.03.020, 2015.
WMO: Atlas of Mortality and Economic Losses from Weather and Climate Extremes 1970–2012–2012 – Documents & Publications – Professional Resources, No. 1123, Geneva, Switzerland, available at: http://preventionweb.net (last access: July 2019), 2014.
Yu, M., Li, Q., Hayes, M. J., Svoboda, M. D., and Heim, R. R.: Are droughts becoming more frequent or severe in China based on the Standardized Precipitation Evapotranspiration Index: 1951-2010?, Int. J. Climatol., 34, 545–558, https://doi.org/10.1002/joc.3701, 2014.
Zarei, R., Sarajian, M., and Bazgeer, S.: Monitoring Meteorological Drought in Iran Using Remote Sensing and Drought Indices, Desert, 18, 89–97, 2013.