the Creative Commons Attribution 4.0 License.
the Creative Commons Attribution 4.0 License.
 | 20 Nov 2019
Towards an automatic early warning system of flood hazards based on precipitation forecast: the case of the Miño River (NW Spain)
José González-Cao
Orlando García-Feal
Diego Fernández-Nóvoa
José Manuel Domínguez-Alonso
Moncho Gómez-Gesteira
An early warning system for flood prediction based on precipitation forecast is presented. The system uses rainfall forecast provided by MeteoGalicia in combination with a hydrologic (Hydrologic Modeling System, HEC-HMS) and a hydraulic (Iber+) model. The upper reach of the Miño River and the city of Lugo (NW Spain) are used as a study area. Starting from rainfall forecast, HEC-HMS calculates the streamflow and Iber+ is automatically executed for some previously defined risk areas when a certain threshold is exceeded. The analysis based on historical extreme events shows that the system can provide accurate results in less than 1 h for a forecast horizon of 3 d and report an alert situation to decision makers.
- Article
(7012 KB) - Full-text XML
- BibTeX
- EndNote


According to Noji (2000), floods are one of the most dangerous natural hazards in the world. Jonkman (2005) estimated that more than 100 000 deaths in the last century were caused by floods. From 1940 to 2018 the number of deaths related to flood events (8138) is only surpassed by lightning fatalities (9386) in the US (https://www.weather.gov/hazstat/, last access: September 2019). Furthermore, the effect of climate change will increase the number of flood events and their negative impact on people and properties (Dankers and Feyen, 2008; Alfieri et al., 2017). Therefore, the ability to predict these extreme events and prevent their consequences is a challenge for the scientific community worldwide.
In this context early warning systems (EWSs) play a key role. UNISDR (2009) defines early warning systems as
the set of capacities needed to generate and disseminate timely and meaningful warning information to enable individuals, communities and organisations threatened by a hazard to prepare and to act appropriately and in sufficient time to reduce the possibility of harm or loss.
A complete EWS is divided in four steps: (1) risk knowledge, (2) monitoring, forecasting and warning, (3) communication of an early warning system, and (4) response capability (UN, 2006). The first two steps are related to the field of physical sciences while the two last steps are associated with social science aspects. There are several works related to the impact of early warning systems on the prevention of floods. Baudoin et al. (2014) and UNISDR (2015) show some interesting examples on how early warning systems can save lives and reduce the damage to people. Borga et al. (2011) developed an early warning system methodology for flash floods in Europe through the HYDRATE project. The authors enhanced the capability of flash flood forecasting in ungauged basins by exploiting the extended availability of flash flood data and the improved process understanding. Alfieri et al. (2012) analysed several early warning systems applied to detect surface water flooding, flash floods, debris flows, landslides induced by extreme rainfall events, a river and coastal floods. The authors proposed several tasks to palliate the main drawbacks of some of these systems. Also, Hossain et al. (2014) developed a system to measure the water depth of the river at the “Valley of Death” and Cools et al. (2012) developed an early warning system to detect flash floods in the Sinai Peninsula, both based on a satellite-based forecast system. In Europe a very interesting example of an early warning system is the EWS applied to the region of Flanders (Schelfaut et al., 2011 and CIW, 2011). In this work, the different steps are analysed under the FREEMAN project (Flood Resilience Enhancement and Management). The European Flood Awareness System (EFAS) is also another example of an EWS developed under the sponsorship of the European Commission. This system provides daily streamflow forecasts for Europe starting from up to 10 d weather forecasts (medium-term forecast). More details of this model can be shown in Thielen et al. (2009), Pappenberger et al. (2011), Cloke et al. (2013) and Alfieri et al. (2014). Using this model Dottori et al. (2017) develop a methodology to adapt EFAS to real-time forecasting. Demerit et al. (2013) analyse the problems derived from the use of the early warning system for medium- and long-term flood forecasts, mainly the dissemination of the information to people potentially affected by these events. They reveal that flood forecasters usually wait for the confirmation from local institutions (hydrologic confederations) instead of acting following the information provided by the early warning systems. These local systems are focused on short-term forecasts (0 to 48 h) that are more suitable to evacuation than damage mitigation. Some examples of these short-term local systems focused on river floods are the River Forecast Centers (https://water.weather.gov/ahps/rfc/rfc.php, last access: September 2019) in the United States of America or “Sistema de Ayuda a la Decisión” (http://www.chebro.es/contenido.visualizar.do?idContenido=12789&idMenu=2902, last access: November 2019) developed by the Hydrographic Confederation of the Ebro River (Spain). In Europe Meteoalarm (http://www.meteoalarm.eu/?lang=en_UK, last access: September 2019) provides advice on exceptional weather events including floods with a temporal window of 48 h. There are mainly two kind of floods derived from precipitation events: flash floods and river floods. On the one hand, flash floods are characterised by a time delay, from the peak precipitation time to the peak of flood, from 3 to 6 h. These floods are usually registered in a dry climate and rocky terrain due to the lack of vegetation to filtrate the precipitation into the ground. These kinds of floods have a very high associated level of risk due to their velocity of propagation. On the other hand, river floods are generally registered in larger rivers in areas with a wet climate and the delay time is greater than 6 h. The consequences associated with river floods can also be dramatic for the people and their property. This makes it necessary to develop an EWS to improve the security of the areas exposed to these events. The area of study analysed in this work is mainly affected by river floods.
In this paper, a flood early warning system based on precipitation forecasts is presented. The system, which is being developed in collaboration with the Hydrographic Confederation of Miño–Sil, consists of three steps: (i) precipitation forecast, (ii) use of a hydrologic model to predict extreme flows and (iii) use of a hydraulic model that is applied at certain areas only under extreme flows. Starting from 1, 2 and 3 d precipitation forecast windows provided by the regional meteorological office (MeteoGalicia), the outflows associated with the catchment of the Miño River (NW Spain) were obtained using the Hydrologic Modeling System (HEC-HMS) model (U.S. Army Corps of Engineers, 2018). This model was calibrated for the area of study by means of a series of historical flood events detected over the last decade. The numerical model Iber (Bladé et al., 2014) was used to obtain water depth and velocity under extreme flow conditions for some risk areas where previous events have caused damage or material losses. Both models (i.e. HEC-HMS and Iber) are freely available software so the system can be applied at any location without costs derived from the licences of commercial codes. The main contribution of the EWS presented in this work with respect to the systems shown in the bibliography is that all the components are freely available and easily adaptable to different areas of the world.
The paper, which aims to describe the steps followed to develop the EWS, is organised as follows. First, a description of the area of study (the upper reach of Miño River and the city of Lugo, NW Spain) is shown. Then the methodology to obtain the weather forecast, the computation of the runoff and the hydraulic processes are briefly presented. Also, the communication among all the models (precipitation forecast–runoff–hydraulic processes) is explained. Next, the results of the precipitation and outflow forecast of a series of historical flood events are presented along with a statistic analysis of their accuracy. Finally, the numerical water depth obtained for a particular flood event at the city of Lugo is shown and compared with field data measured during the event.
The area of study is located in northwestern Spain (Fig. 1). It corresponds to the upper reach of the Miño River. This sub-catchment area is about 2200 km2 and the elevation ranges from 360 to 980 m a.s.l. The average annual precipitation ranges from 144 to 1300 mm yr−1. Miño River presents an annual hydrologic cycle characterised by a pluvial regime, with maximum river discharges during winter months, then descending to reach its minimum values during summer (Fernández-Nóvoa et al., 2017). Specifically, considering the period under study at Lugo station, Miño River reaches maximum flows of 114 and 128 m3 s−1 in January and February and minimum flows of 7 and 8 m3 s−1 in August and September, respectively.
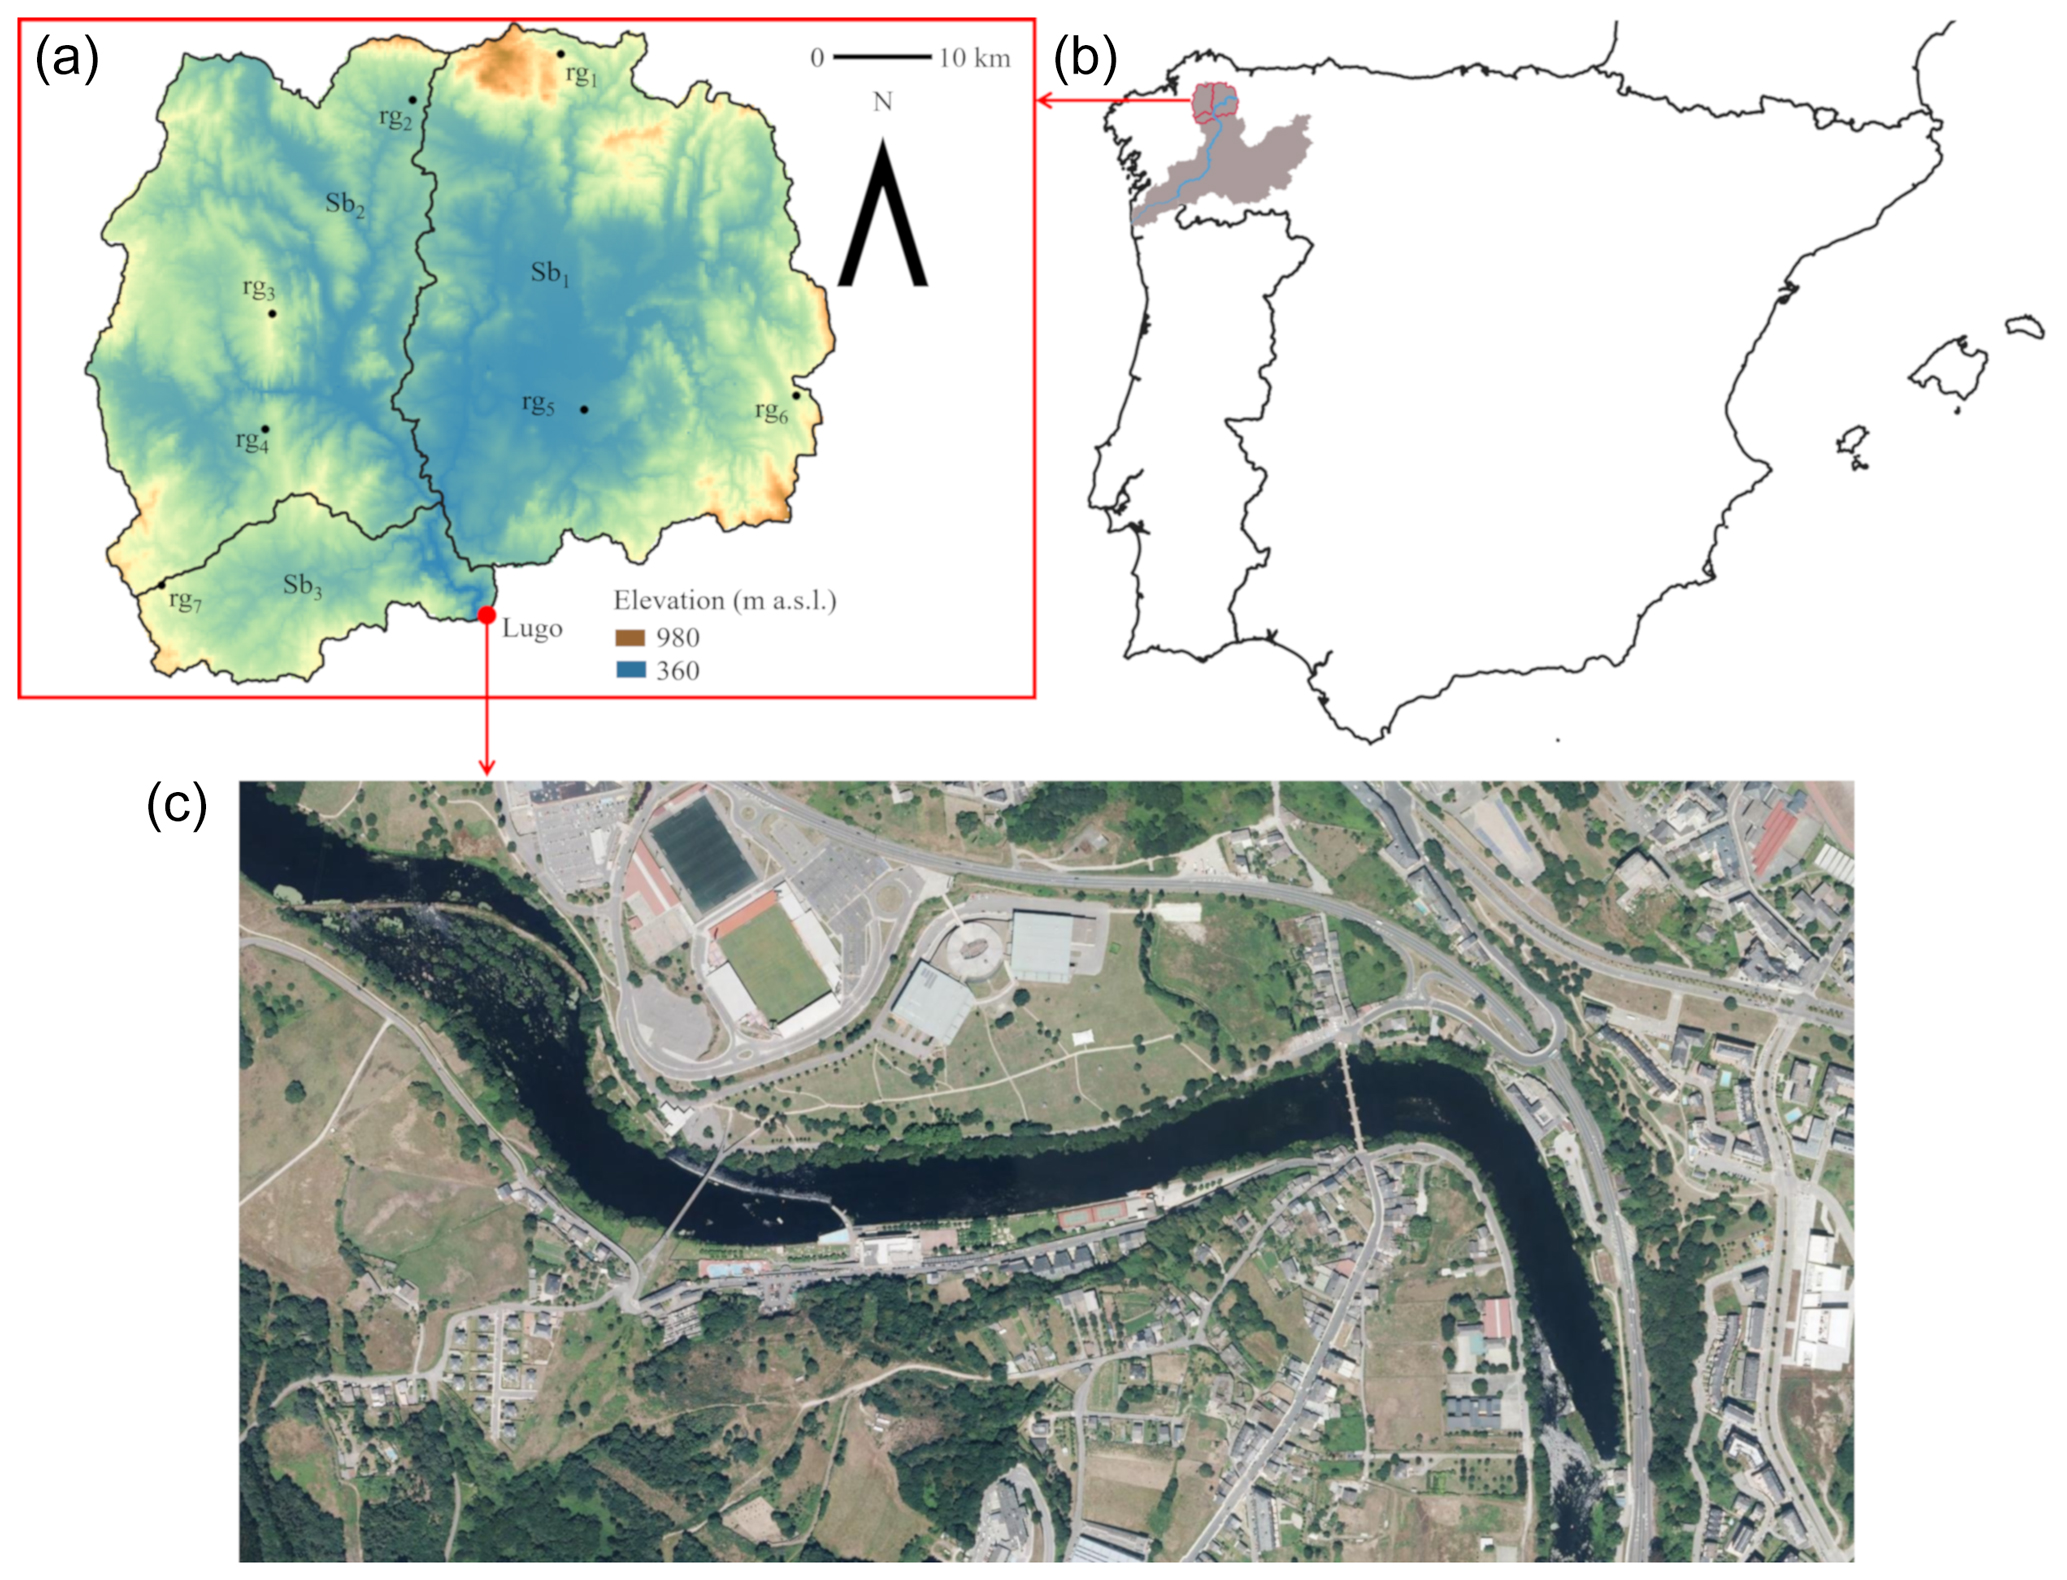
Figure 1Area of study. In (b), the location of the entire catchment of the shared Portuguese–Spanish river (shaded area) in the Iberian Peninsula and the riverbed of the Miño River (blue line) are shown. The rain gauges (rg1, …, rg7) located in the catchment and the sub-basins (Sb1, Sb2 and Sb3) of the domain (a) as well as the area of study in Lugo (c) are also shown (PNOA courtesy of © Instituto Geográfico Nacional).
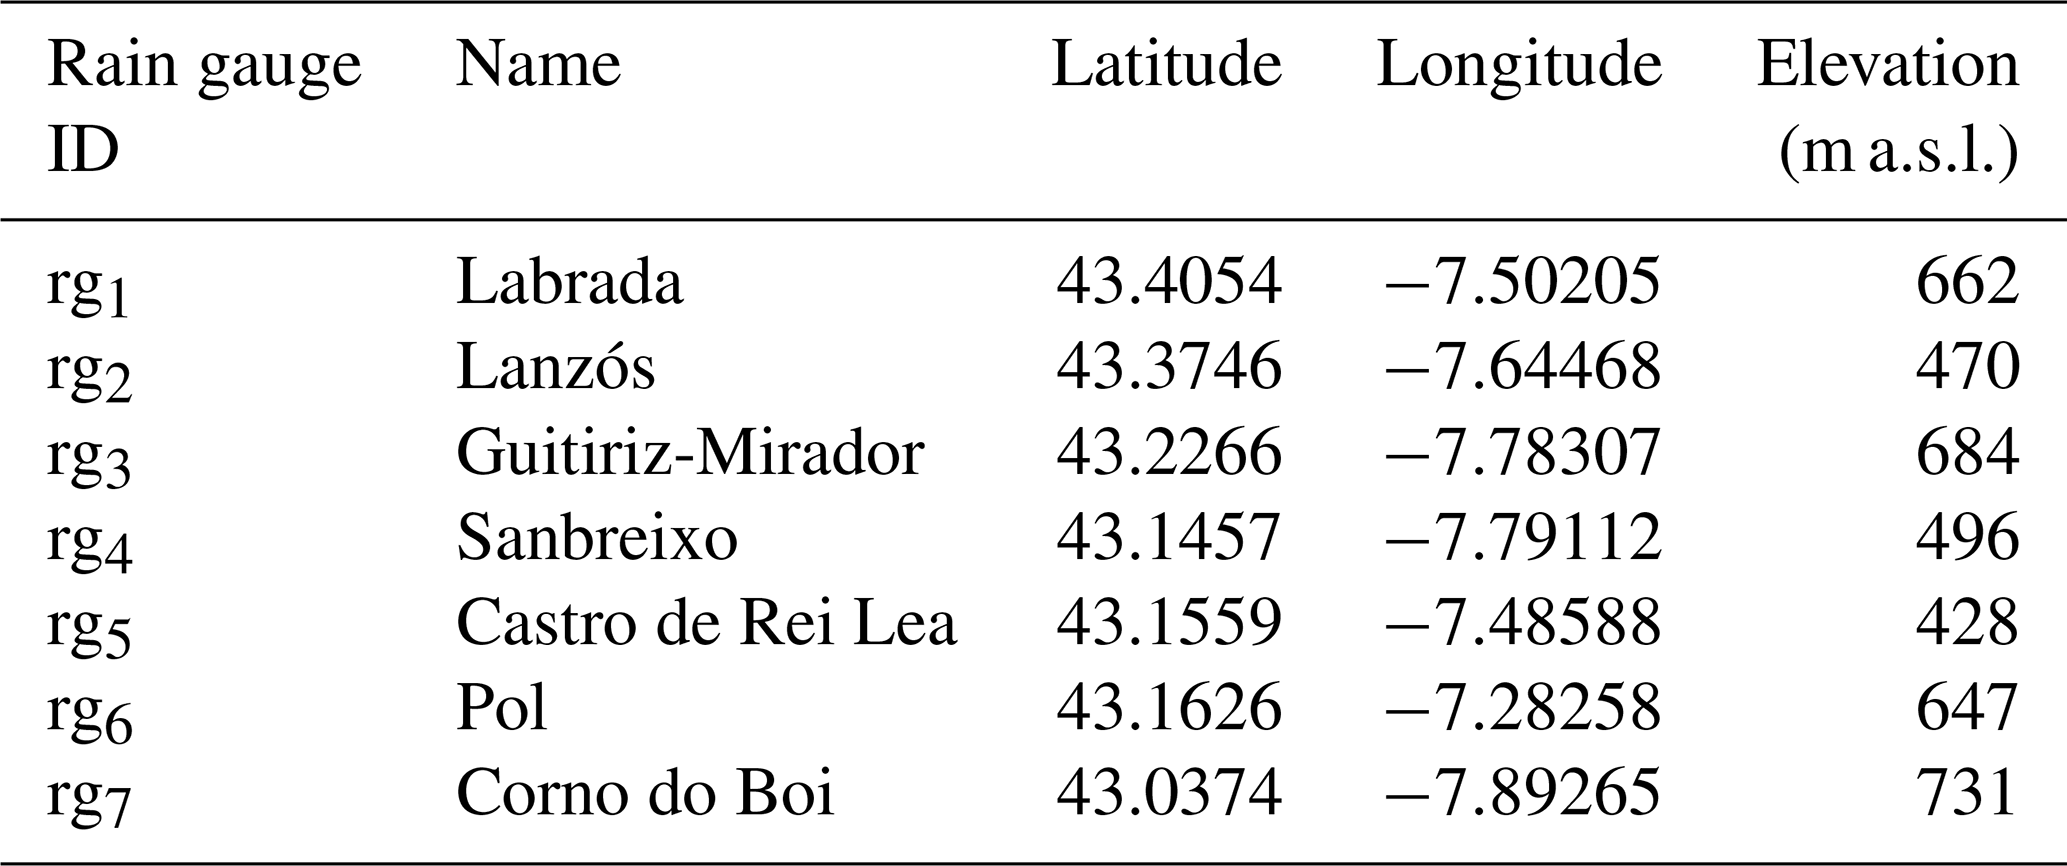
Figure 1a shows the catchment of the upper reach of the Miño River, which is divided into three main sub-basins according to their topographic characteristics. Seven rain gauges operated by MeteoGalicia are located in the entire sub-catchment. Table 1 shows the location and the elevation of each of the rain gauges located in the upper reach of the Miño River. The outlet of this catchment is located in the city of Lugo (Fig. 1c). This area is usually flooded during events of extreme precipitation in the upper reach of the Miño River. The absence of dams in the catchment to regulate the flow also affects the high frequency of these events.
Table 1Location and elevation of the rain gauges located in the area of study (the system of reference for latitude and longitude is the EPSG: 4326).
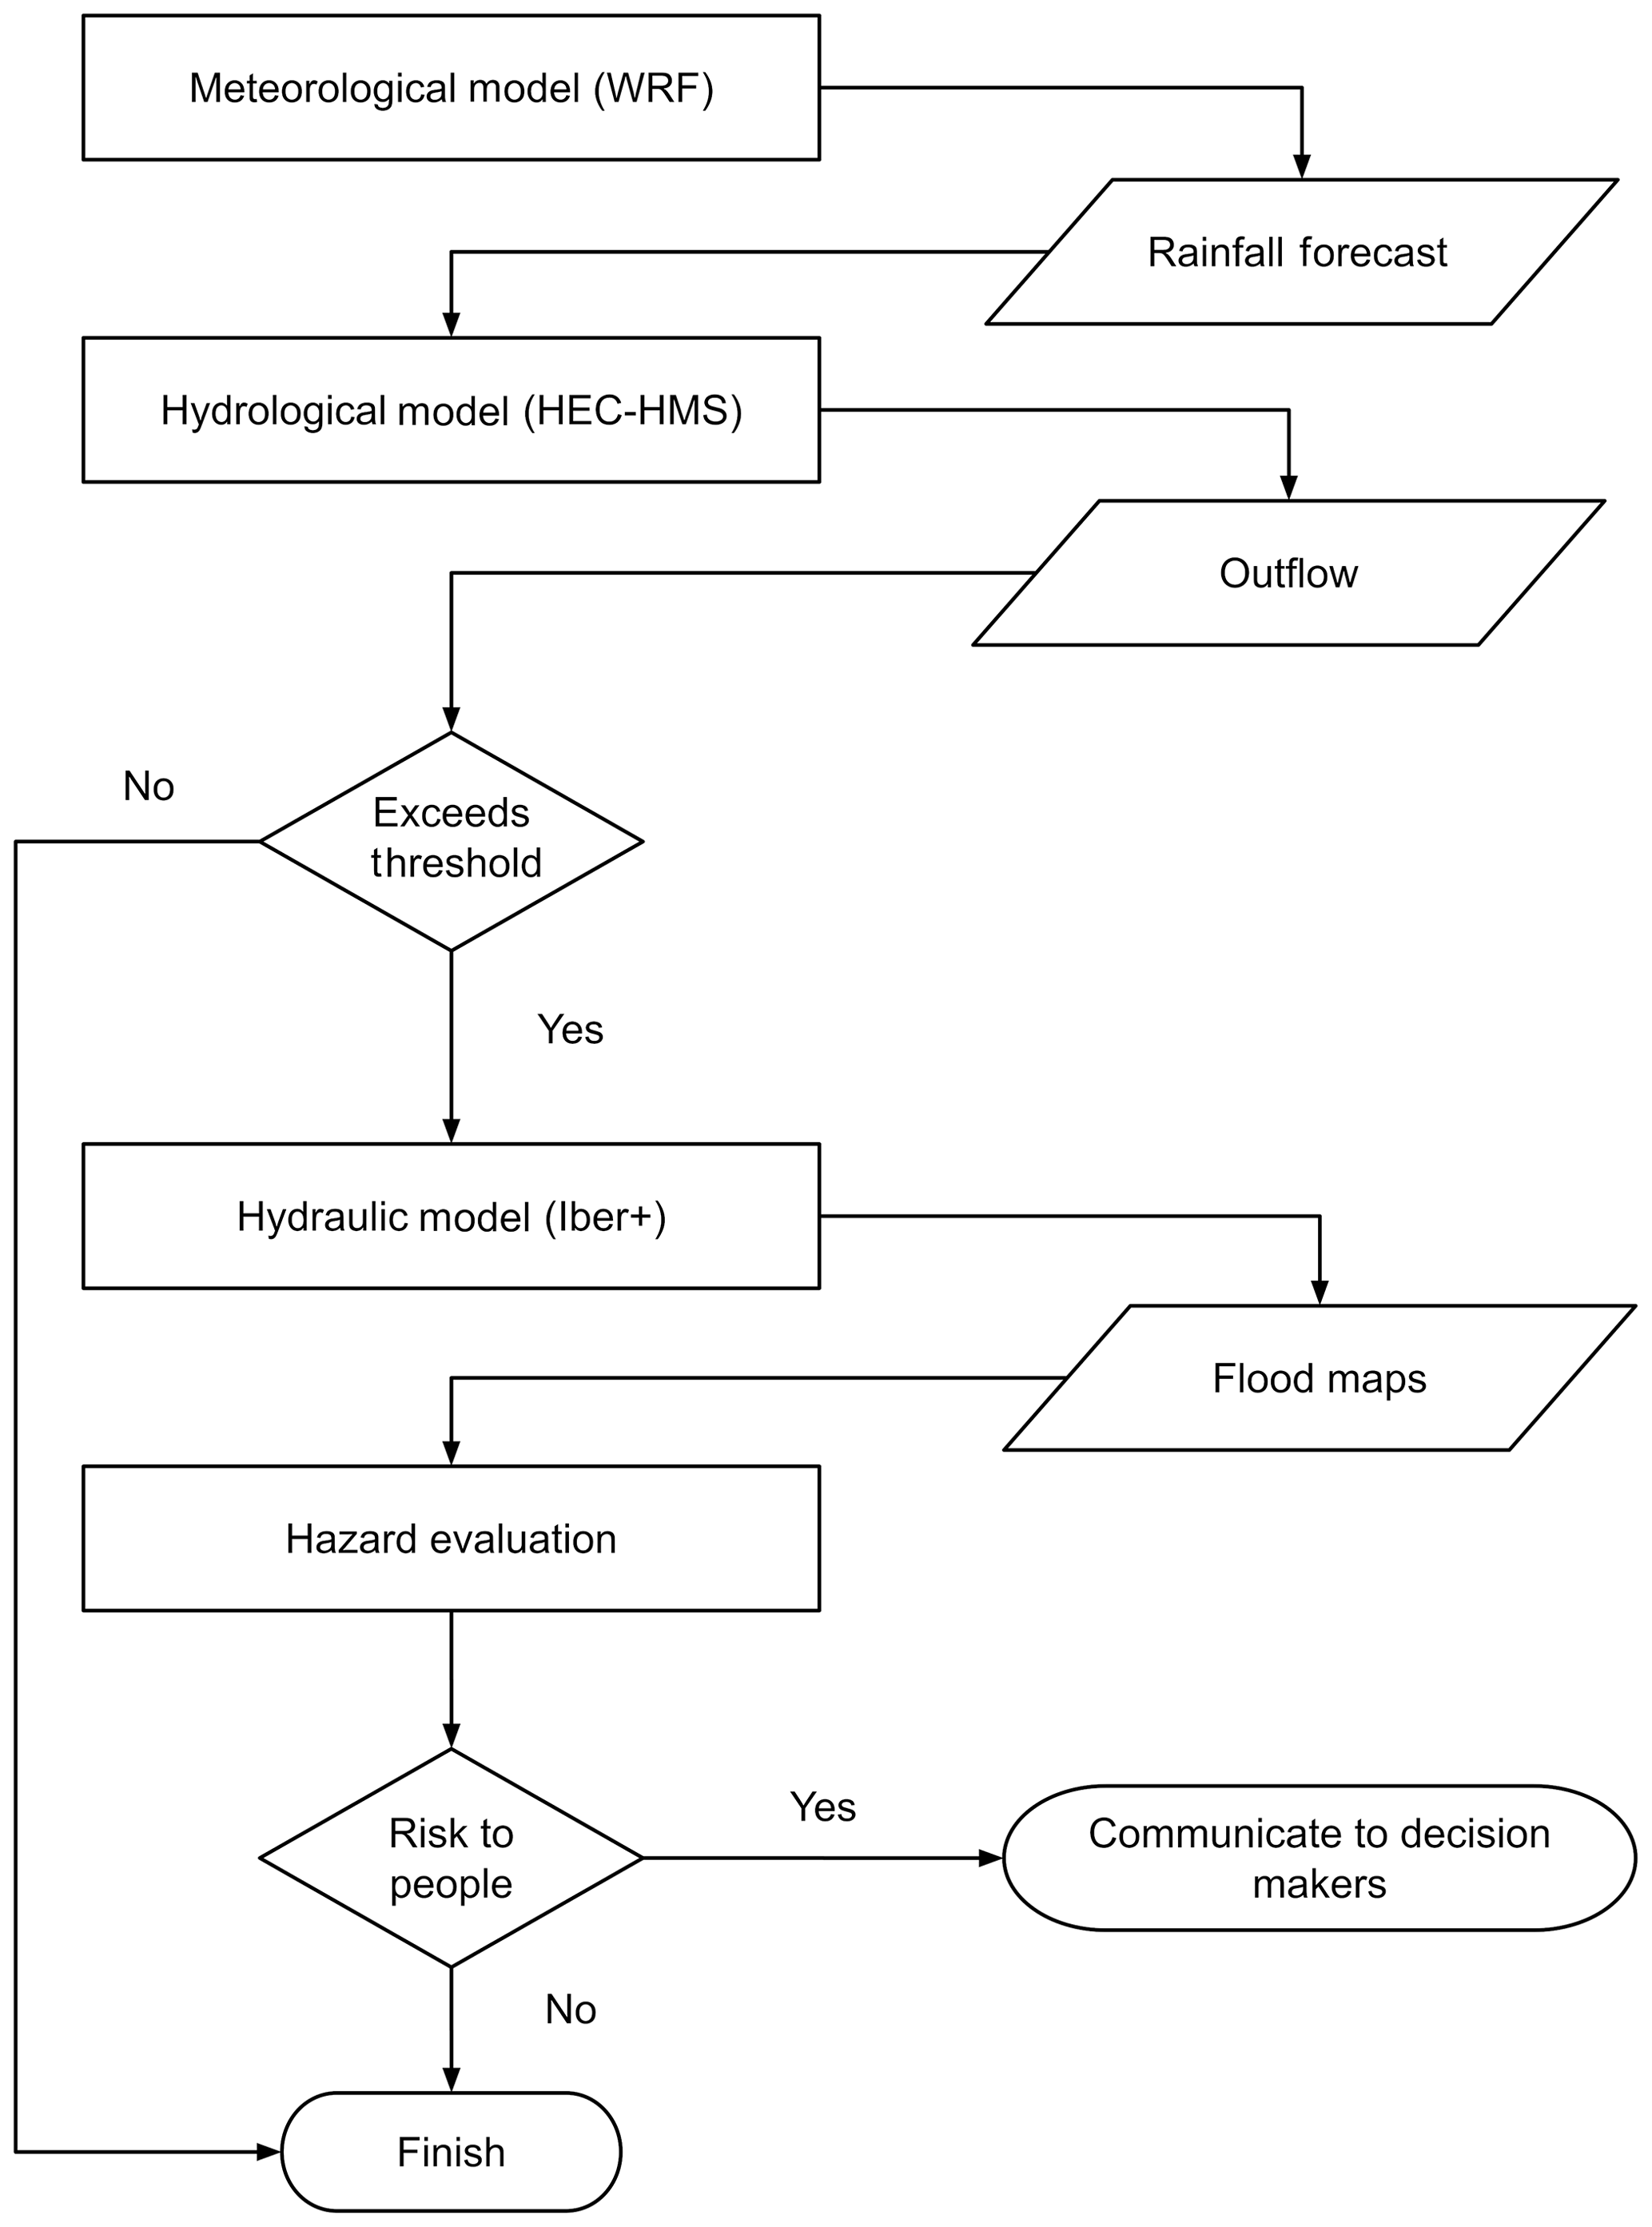
In this work, an automatic EWS is proposed. This system is composed of several elements as shown in Fig. 2. All these components are orchestrated by a Python script that is responsible for gathering and transforming the data properly in order to feed the models used in the system. First of all, the rainfall forecast performed with the Weather Research and Forecasting model is provided by the weather agency (MeteoGalicia). Details are provided in next section. Forecasted data are automatically downloaded, and the rainfall relative to each sub-basin is extracted to feed the hydrological model HEC-HMS. When the catchment outflow obtained with HEC-HMS surpasses the 90th percentile of historical data, it is considered a possible extreme event and the following steps will be applied. This outflow will be used as the inlet condition for the hydraulic simulation using the model Iber to provide flood maps with water depths and velocities at certain risk areas (the city of Lugo in this particular case). Data provided by Iber are processed for hazard evaluation. At this stage the system checks if there is a risk condition in the areas accessible by pedestrians. These areas are user defined and can be changed depending on seasonal events. In order to emit a warning alert, the criteria of Cox et al. (2010) are used to define safety limits for children since they are the most vulnerable population group. Following this criterion, a warning will be emitted if there is a zone where any of the following thresholds are surpassed: the water depth (h) is higher than 0.5 m, the magnitude of water velocity (v) is higher than 0.2 ms−1 or the product (h×v) in excess of 0.4 m2 s−1. This warning is sent in the form of report to a decision maker so an expert can validate the resulting data and discard false positives.
The details of the components of the EWS, the data sources and the calibration processes are described in the following sections.
3.1 Precipitation data
3.1.1 Forecasted precipitation data
Forecasted precipitation data were obtained from the regional meteorological office (MeteoGalicia, http://www.meteogalicia.gal/, last access: September 2019). MeteoGalicia publishes weather forecast results based on the Weather Research and Forecasting (WRF) model (Skamarock et al., 2005) (https://www.mmm.ucar.edu/weather-research-and-forecasting-model, last access: September 2019). The WRF model is a numerical weather prediction system at the regional mesoscale designed mainly for forecasting applications. WRF has been run operationally since 2008 providing daily data until the end of 2012 (00:00 UTC) and twice a day (00:00 and 12:00 UTC) from then on, with a 72 h forecast window, a temporal resolution of 1 h and maximum spatial resolution of 4 km (Sousa et al., 2013). Data provided by MeteoGalicia are freely available from the THREDDS (Thematic Realtime Environmental Distributed Data Service) server, also maintaining a historical archive of past forecasts since 2008. The model outputs provide several variables related to weather. In the case of this study, precipitation information was automatically obtained for the areas under interest at 00:00 UTC of each day during the period 2008–2018.
3.1.2 Measured precipitation data
Real precipitation data at an hourly scale were obtained from the rain gauges managed by MeteoGalicia, which is responsible for their maintenance and data quality control. Data from these rain gauges were used to assess the performance of the MeteoGalicia weather forecast to predict extreme rain events. The mentioned rain gauges are pictured in Fig. 1 and their location and elevation are detailed in Table 1.
3.2 River discharge data
Daily discharge data of the Miño River were provided by the corresponding river basin authority (Confederación Hidrográfica del Miño-Sil, https://www.chminosil.es, last access: September 2019). In this case of study, Miño flow data at Lugo station covering the period 2008–2018 were selected. River data were used to calibrate and validate the hydrologic model system used during the development of this study.
3.3 HEC-HMS & Iber+
Here the hydrological and hydraulic models used in the study will be briefly described along with the methods to analyse their accuracy.
The semi-distributed model HEC-HMS (Feldman, 2000 and U.S. Army Corps of Engineers, 2018) was used to analyse the rain–runoff processes, and the numerical model Iber (Bladé et al., 2014) was used to compute the hydraulic processes.
The HEC-HMS is a model developed by the U.S. Army Corps of Engineers that is applied to simulate continuous hydrological processes. The HEC-HMS model can be used to analyse various hydrological aspects, such as flooding events, reservoir capacity, storm water warnings and stream restoration (U.S. Army Corps of Engineers, 2008). HEC-HMS is divided into four components: (i) an analytical model: calculation of direct runoff and channel routing; (ii) a basin model: representation of hydrological elements in a watershed; (iii) a system to manage input data and store data; and (iv) a post-processing tool to report and illustrate simulation results. Two main processes were taken into account in the methodology developed in this case of study: loss (infiltration) and transformation methods. In the first case, the Soil Conservation Service (SCS) curve number was selected. This method implements the curve number methodology for incremental losses since it was designed to calculate the infiltration during periods of heavy rainfall and therefore is well suited to this type of study. With respect to the transform process, based on the method of converting the excess precipitation as runoff, the SCS unit hydrograph method was also selected for the reasons mentioned above. More information about the loss and transformation methods used in this work is detailed in NRCS (2007). Last, the Muskingum–Cunge routing method was selected for runoff propagation because it provides a good approach in basins with similar slopes. This method takes into account the conservation of mass as well as the diffusion representation of the conservation of momentum (U.S. Army Corps of Engineers, 2008). Other parameters like the base flow were not considered because they represent less than 3 % of the peak flow for this kind of event and can be neglected.
Taylor diagrams (Taylor, 2001) were used to compute the accuracy of the results obtained with HEC-HMS by means of the normalised standard deviation (Eq. 1), normalised centred root-mean-square difference (Eq. 2) and correlation (Eq. 3).
Here A is a numerical variable and B a reference variable. The subscript n refers to the normalised parameter, subscript i refers to the different samples, N is the number of samples, barred variables refer to mean values and σ is the standard deviation.
The hydraulic simulations were carried out using the numerical model Iber (Bladé et al., 2014). Iber is a numerical code that solves the 2-D (two-dimensional) shallow water equations by means of finite volume schemes (FVSs). The software package is formed by three elements: a preprocessing tool, numerical model and post-processing tool. The first and the last modules are based in the software GID (GID, 2018). It provides a user-friendly graphical interface (GUI) to create the case and edit the parameters that define the problem to solve. It also provides tools to analyse the results of the numerical simulations. The preprocessing and post-processing tools were used only during the modelling and testing of the study area. However, the automatic EWS runs the model in batch mode without user interaction. Iber was recently improved in terms of efficiency, becoming Iber+ (García-Feal et al., 2018). This new parallel implementation of the Iber model takes advantage of GPU (graphics processing unit) computing using the Nvidia CUDA (NVIDIA Corporation, 2019) platform. Using this technology, the new implementation is able to run up to 100 times faster. This fact makes Iber+ especially suitable for the implementation of an EWS where the response times can be crucial to issuing an early alert. The accuracy of the water depth results computed with Iber+ at five control points was assessed by means of the bias and the RMSE (root-mean-square error) for the extreme event recorded on January 2013.
Here A is the numerical value, B the measured value and N the number of control points.
4.1 Accuracy of MeteoGalicia precipitation forecast
The capability of the MeteoGalicia weather forecast system to predict rain events was evaluated by means of the comparison with real precipitation data provided by the rain gauges in the area of study. For that purpose, the predicted (numerical) precipitation was obtained at the grid points closest to the location of the rain gauges. The correlation between predicted and measured precipitation was calculated for each rain gauge during the available period (2008–2018). Spearman rank correlation was used due to its robustness of deviations from linearity as well as its strength against the influence of outliers. This procedure was carried out for three forecast windows (1–24, 25–48 and 49–72 h; 1, 2 and 3 d forecast from now on) to determine the accuracy of the forecast at different temporal scales. The comparison is carried out for an aggregation time of 24 h, which matches the recording frequency of rain data provided by MeteoGalicia and is compatible with the kind of flood events (mainly river floods) of the area.
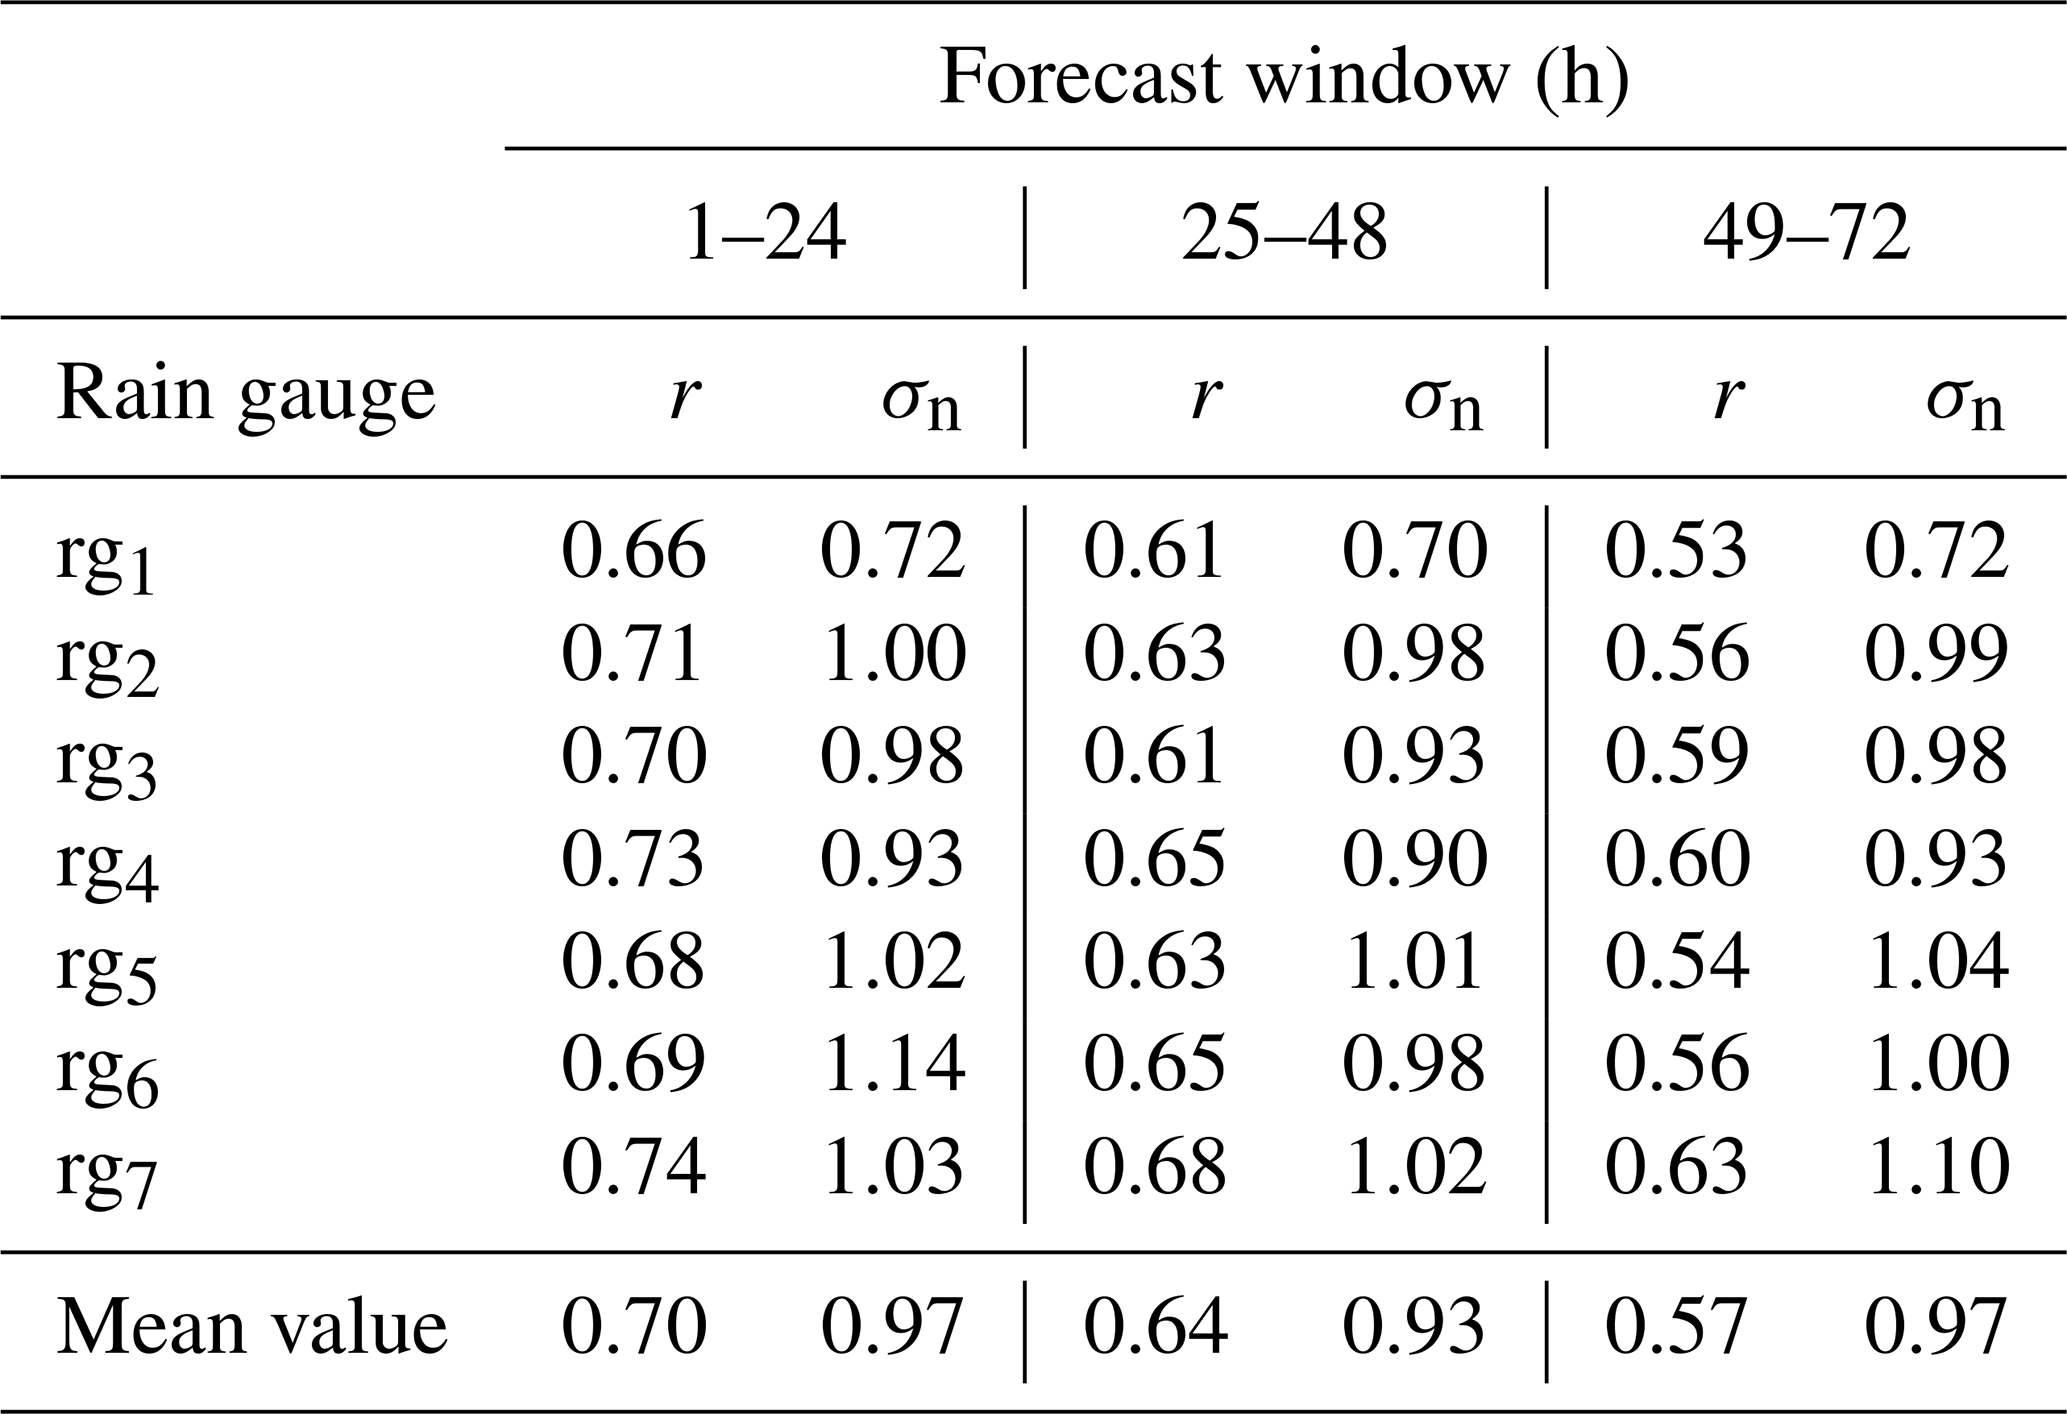
The values of the correlation and the normalised standard deviation for each rain gauge are shown in Tables 2 and 3. Table 2 shows the analysis for the complete series and Table 3 shows the results considering only rainy events (precipitation above the 75th percentile). In general, considering the complete series, precipitation prediction offers a good representation of the registered values and the variability of precipitation. In fact, correlations above 0.8 were obtained for the first two windows (1 and 2 d forecast), although with a higher correlation for the first one. The correlation is slightly lower for the 3 d forecast, although it is still close to 0.8. When only rainy events are considered mean correlation values are slightly lower than considering the complete series, although they show a good representation of the registered data. The high correlation shown under a 1 d forecast window with a mean value above 0.7 is especially remarkable (Table 3). With respect to the normalised standard deviation, most cases in both series are similar to 1, which shows a good agreement between forecast and real precipitation. Therefore, it can be concluded that the precipitation forecast provided by MeteoGalicia offers results very close to the real rain events for the entire time series of precipitation data (2008–2018). This shows the accuracy of MeteoGalicia models to forecast precipitation events up to 3 d in advance.
Table 2Values of the correlation (Spearman's r) and normalised standard deviation (σn) of the precipitation forecast using the measured data as reference at each rain gauge, considering the complete time series of precipitation. The averaged values for each precipitation forecast are also shown.
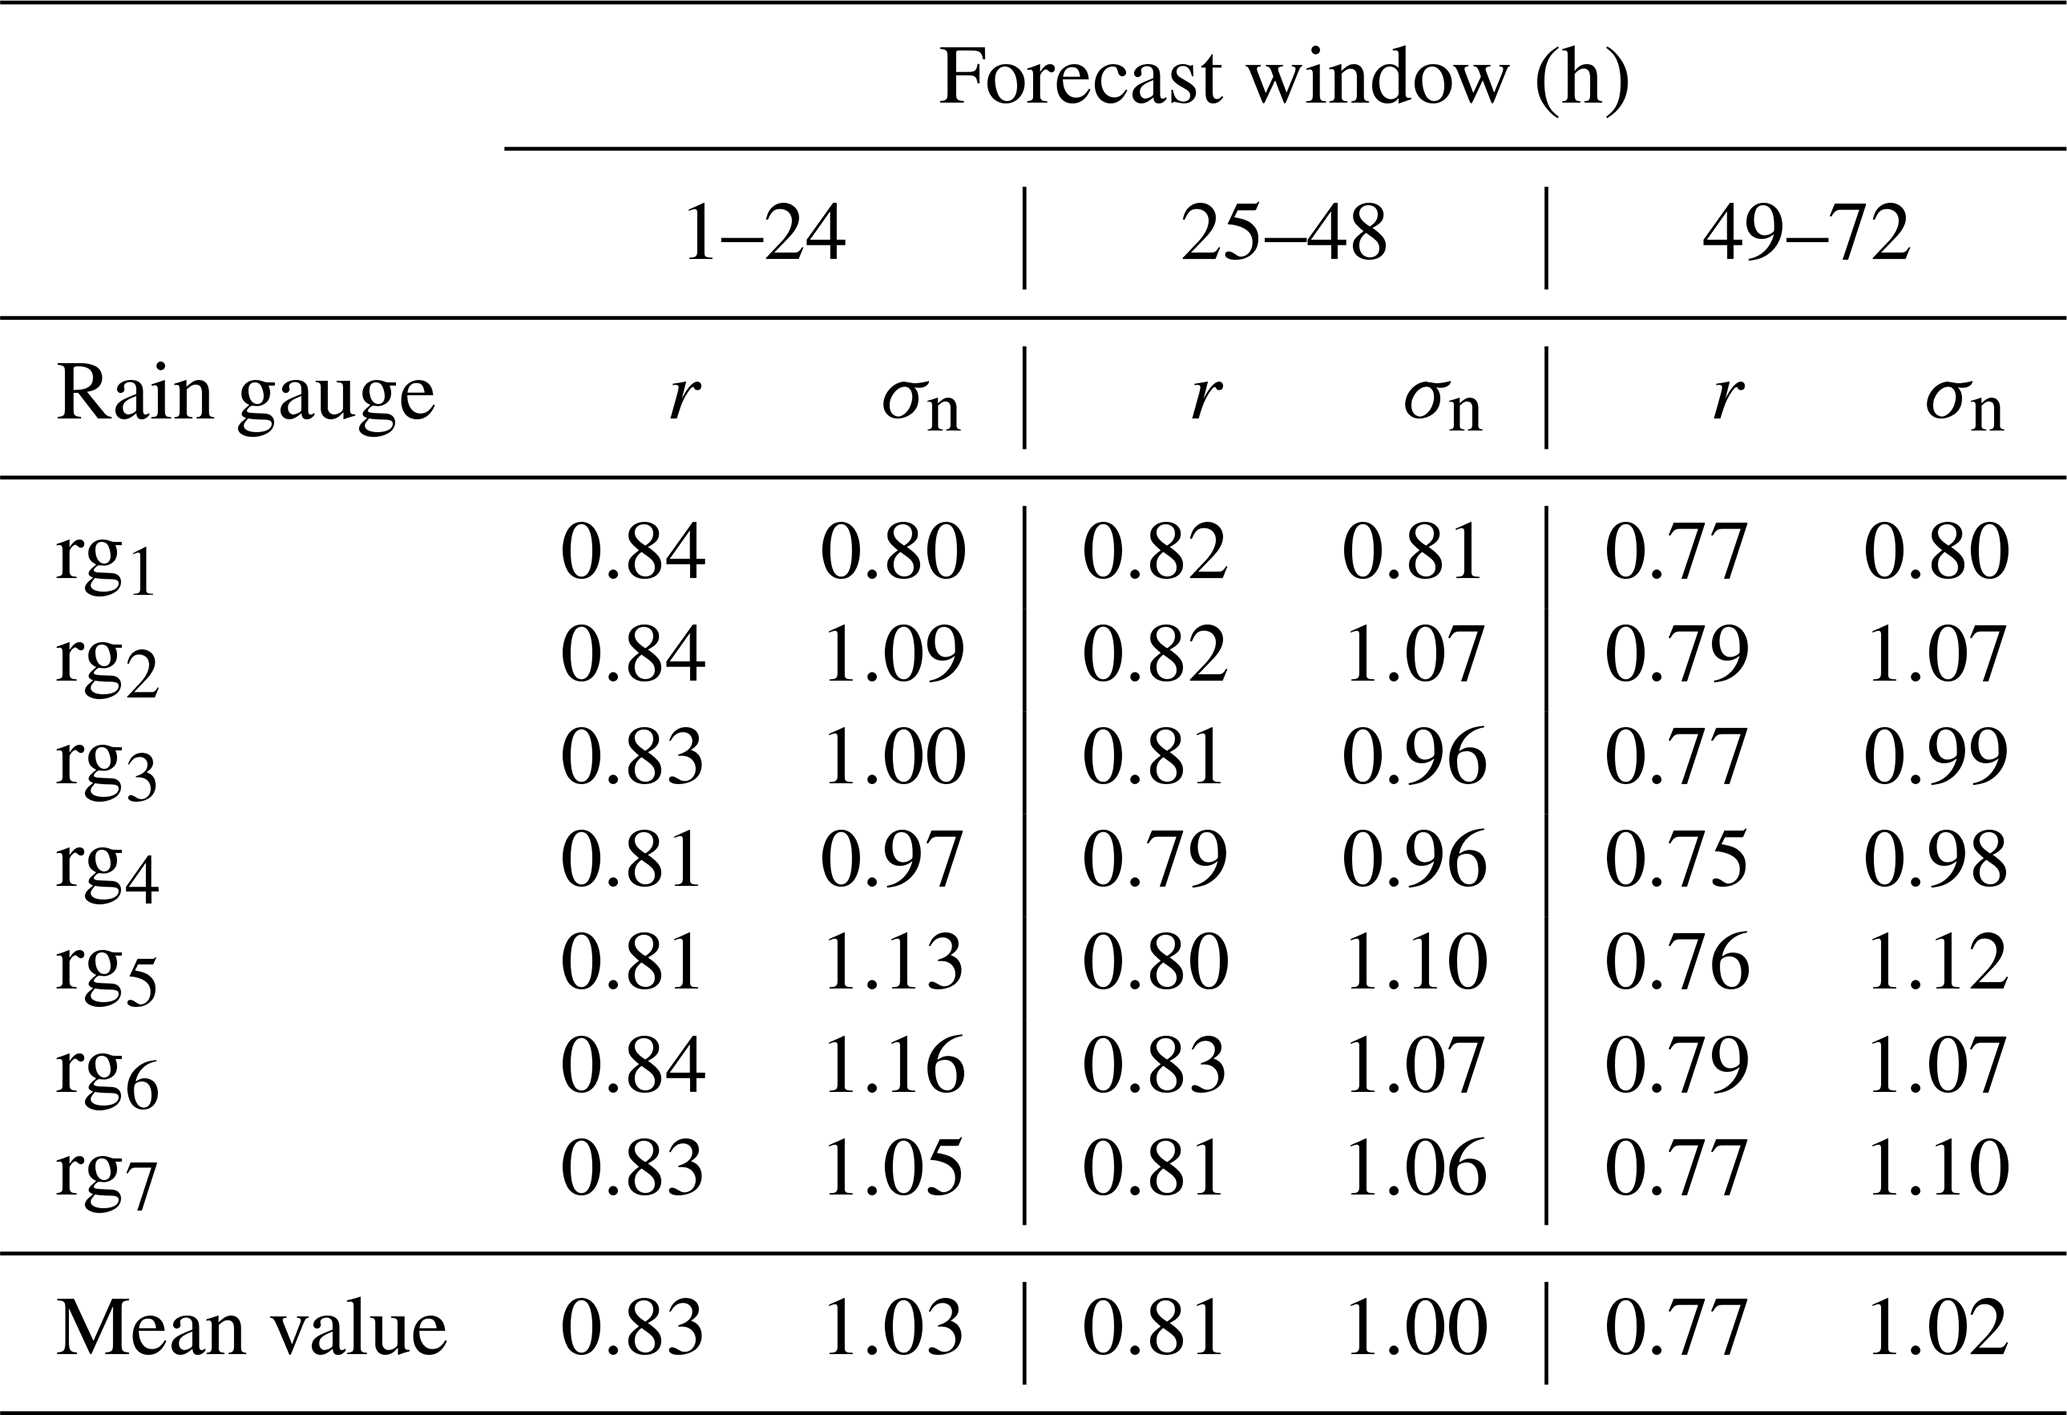
Table 3Values of the correlation (Spearman's r) and normalised standard deviation (σn) of the precipitation forecast using the measured data as reference at each rain gauge, considering only rainy events (above the 75th percentile). The averaged values for each precipitation forecast are also shown.
4.2 Calibration and validation of hydrological processes using HEC-HMS
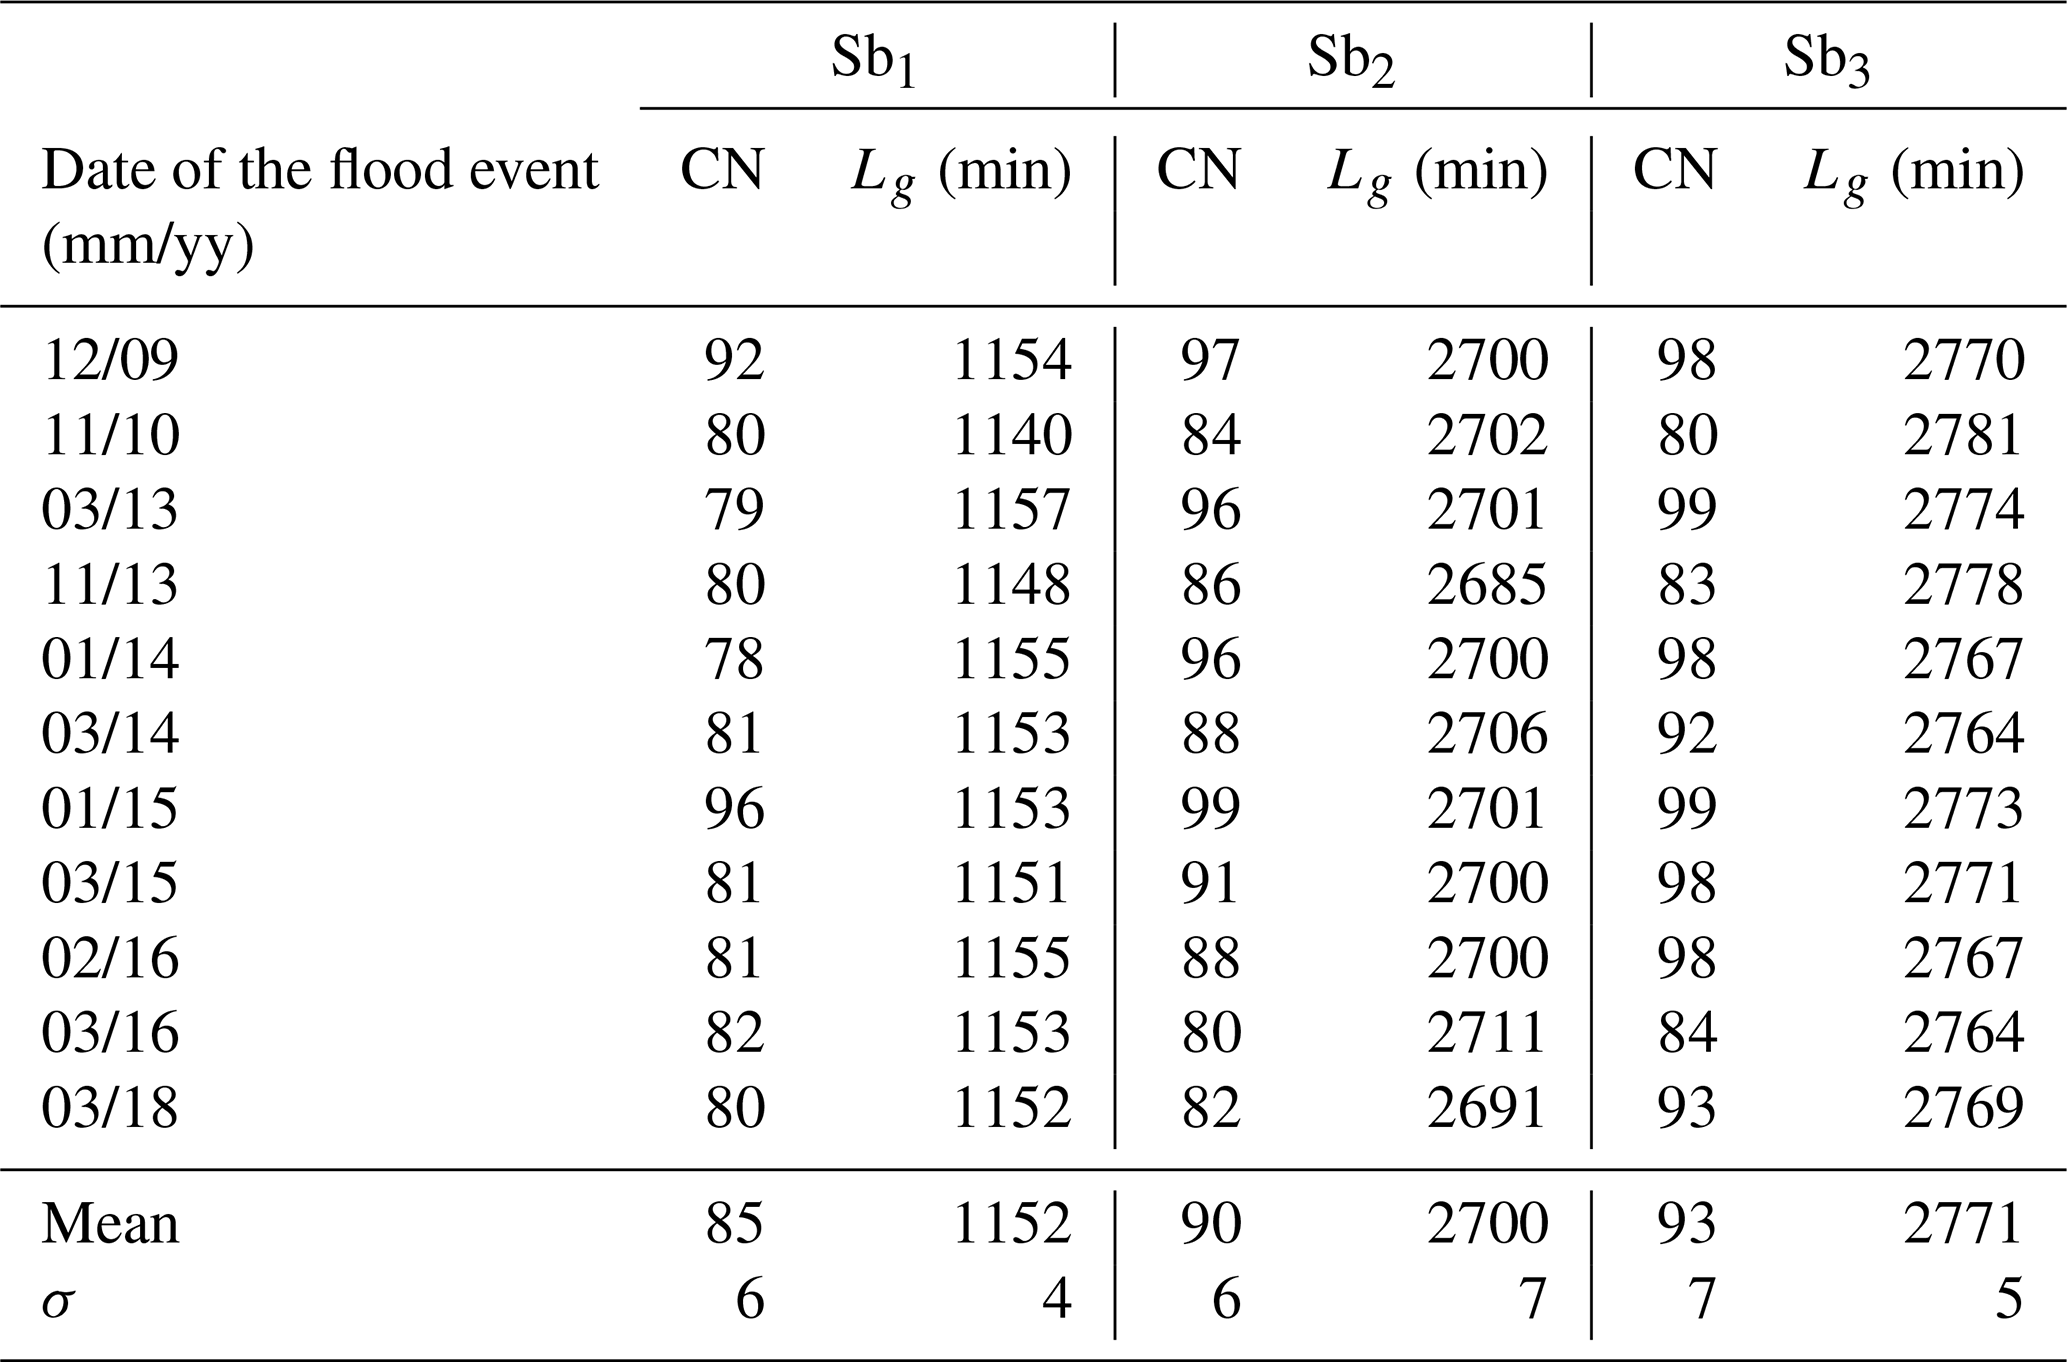
A set of 15 extreme flood events registered during the period 2008–2018 were used to calibrate and validate the rain–runoff model HEC-HMS (Table 4) by comparing the outflows measured at the gauge station located at Lugo with the flows obtained with HEC-HMS using the 1 d forecast of precipitation. Forecasted rain data were considered because they are used to feed the model in its forecast version. In situ data would be only valid for hindcast purposes. Calibration was carried out using the specific calibration tools implemented in HEC-HMS (Feldman, 2000) in order to choose two independent parameters, the curve number (CN) and lag time (Lg), for each sub-basin. The values of CN and Lg were computed using a particle swarm algorithm (Kennedy and Eberhart, 1995; Pedersen, 2010 and Mezura-Montes and Coello, 2011) to minimise the error between the measured streamflow and the numerical one. No empirical formulas were used for CN and Lg due the uncertainty associated with their definition (Fang et al., 2008; Upegui and Gutiérrez, 2011; Grimaldi et al., 2012). A total of 11 flood events were used for calibration purposes and the rest of the cases were used to validate the model. Table 5 shows the values of the CN and Lg for each sub-basin obtained for each event used in the calibration step.
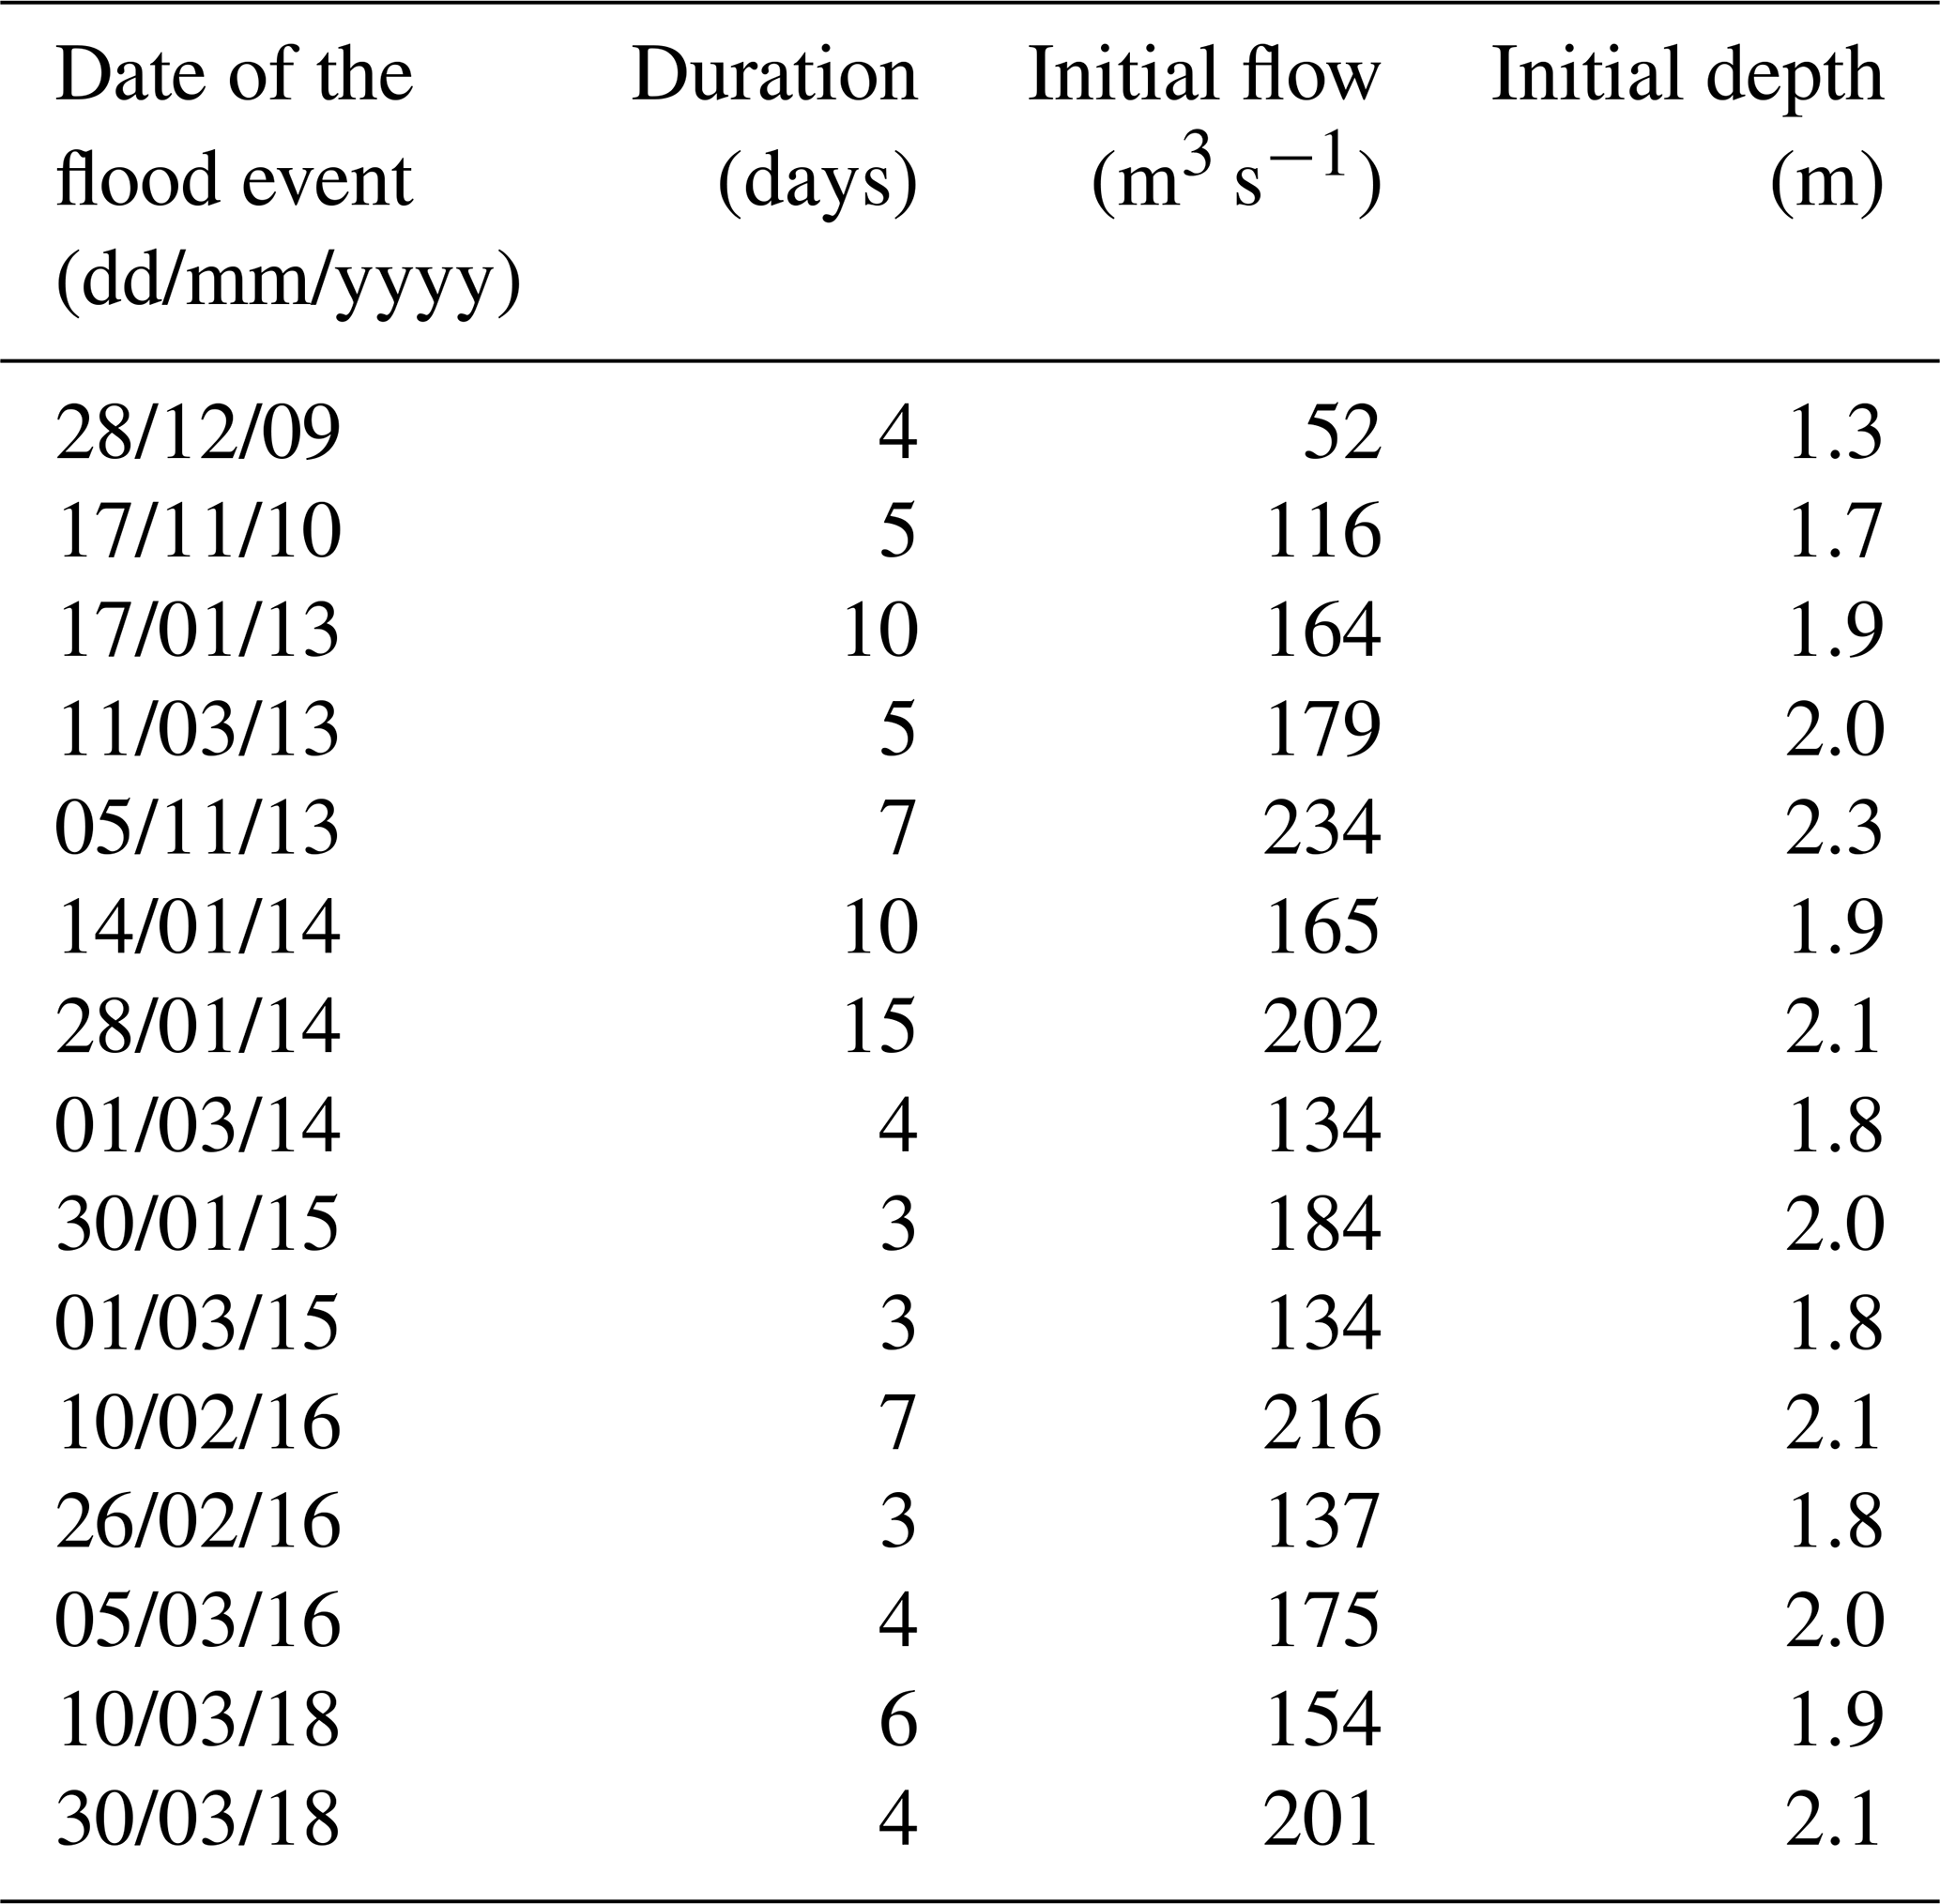
Table 5Curve number (CN) and lag time (Lg) values for each sub-basin for different flood events. The mean value and the standard deviation are provided in lower rows.
The mean values of CN and Lg of each sub-basin were used to validate the model in four flood events (January 2013, January 2014, February 2016 and March 2018) by means of a Taylor diagram (Fig. 3).

Figure 3Time series of the registered streamflow (dashed line) and numerical streamflow (orange line) of the validation events: (a) January 2013, (b) January 2014, (c) February 2016 and (d) March 2018. Taylor diagram of the validation cases is also shown.
The values of normalised standard deviation (σn) range from 0.8 to 1.2, the values of the root-mean-squared difference (RMSD) range from 0.3 to 0.6 and the correlation of the numerical results ranges from 0.85 to 0.95. The values of σn mean that the variability of the numerical results are quite similar to the variability of the reference time series (difference less than 20 %) and the values of En can be considered good values according to Moriasi et al. (2007). These values of σn, En and correlation show that the mean values of CN and Lg obtained in the calibration step characterise the behaviour of the basin with a high accuracy.
Figure 4 compares the numerical and measured streamflow for the event that happened in January 2013 using the three forecast windows. Panel a shows that time series of the flows predicted by the model are similar to those measured at the gauge station. Panel b is the Taylor diagram corresponding to the three forecast windows. The standard deviation is observed to range from 0.8 to 1.2 for the three forecasts. RMSD values for 1 and 2 d forecasts are around 0.3 and around 0.6 for the 3 d forecast. Finally, the correlation coefficient for 1 and 2 d forecasts is close to 0.95 and around 0.85 for the 3 d forecast.
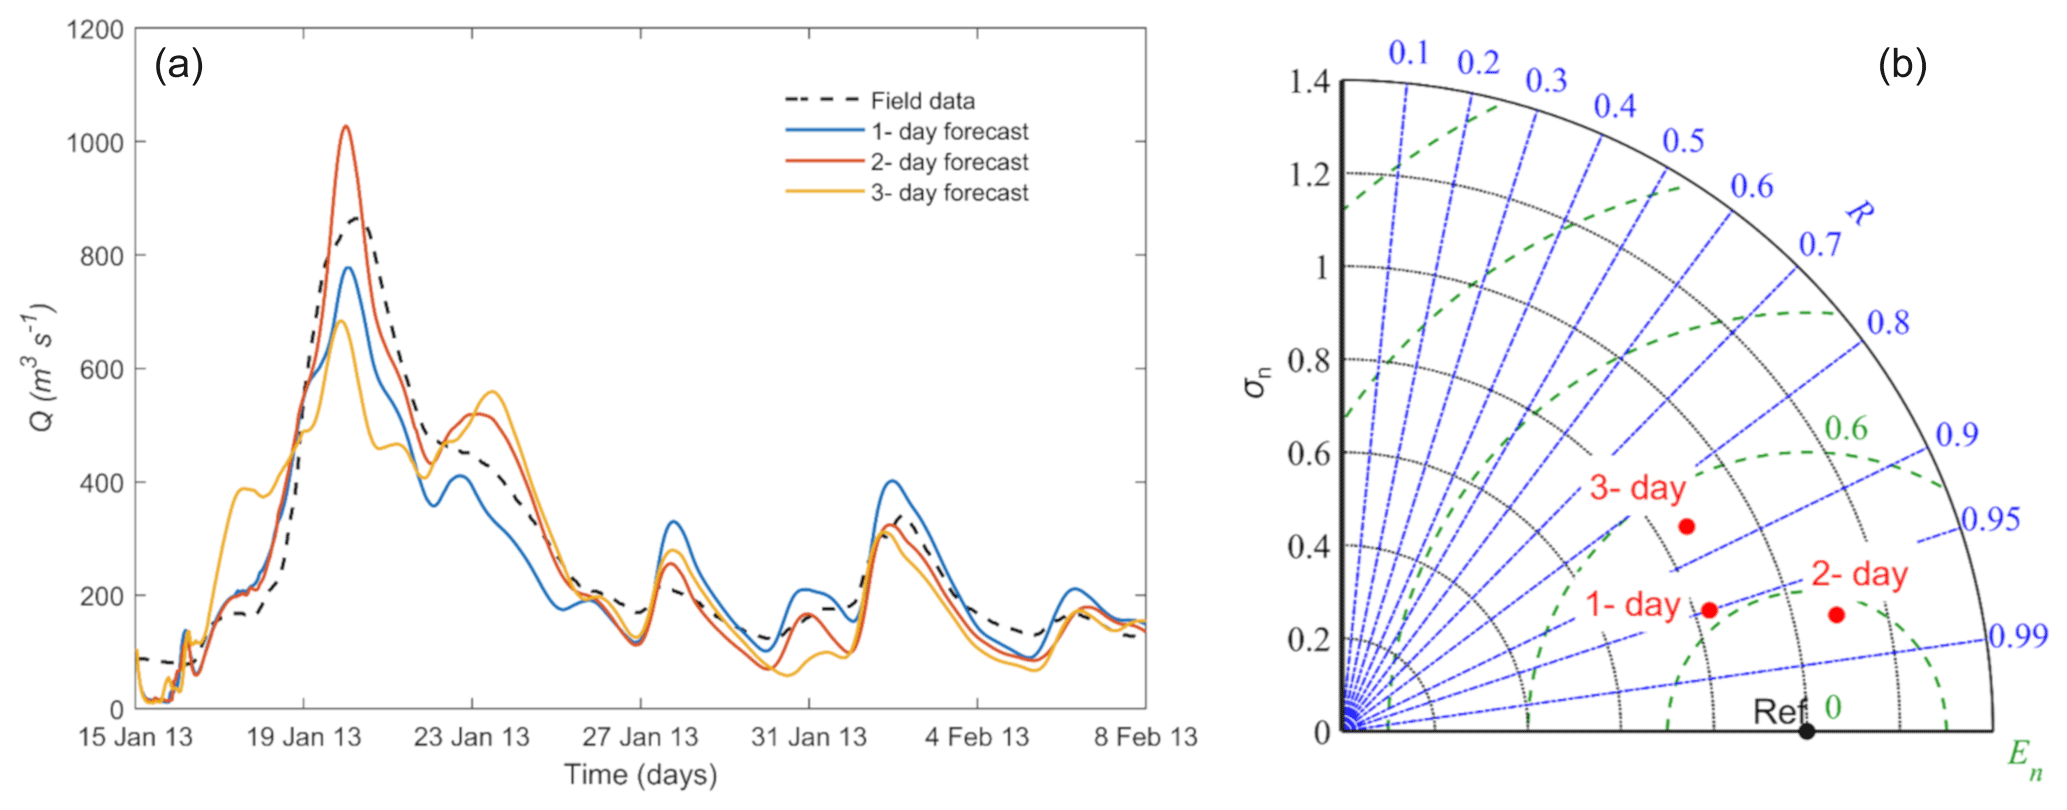
Figure 4Time series of the outflow at the control point obtained in the gauge station (dashed line) and calculated using the three forecast windows (a) and Taylor diagram for the same cases (b).
4.3 Case of study
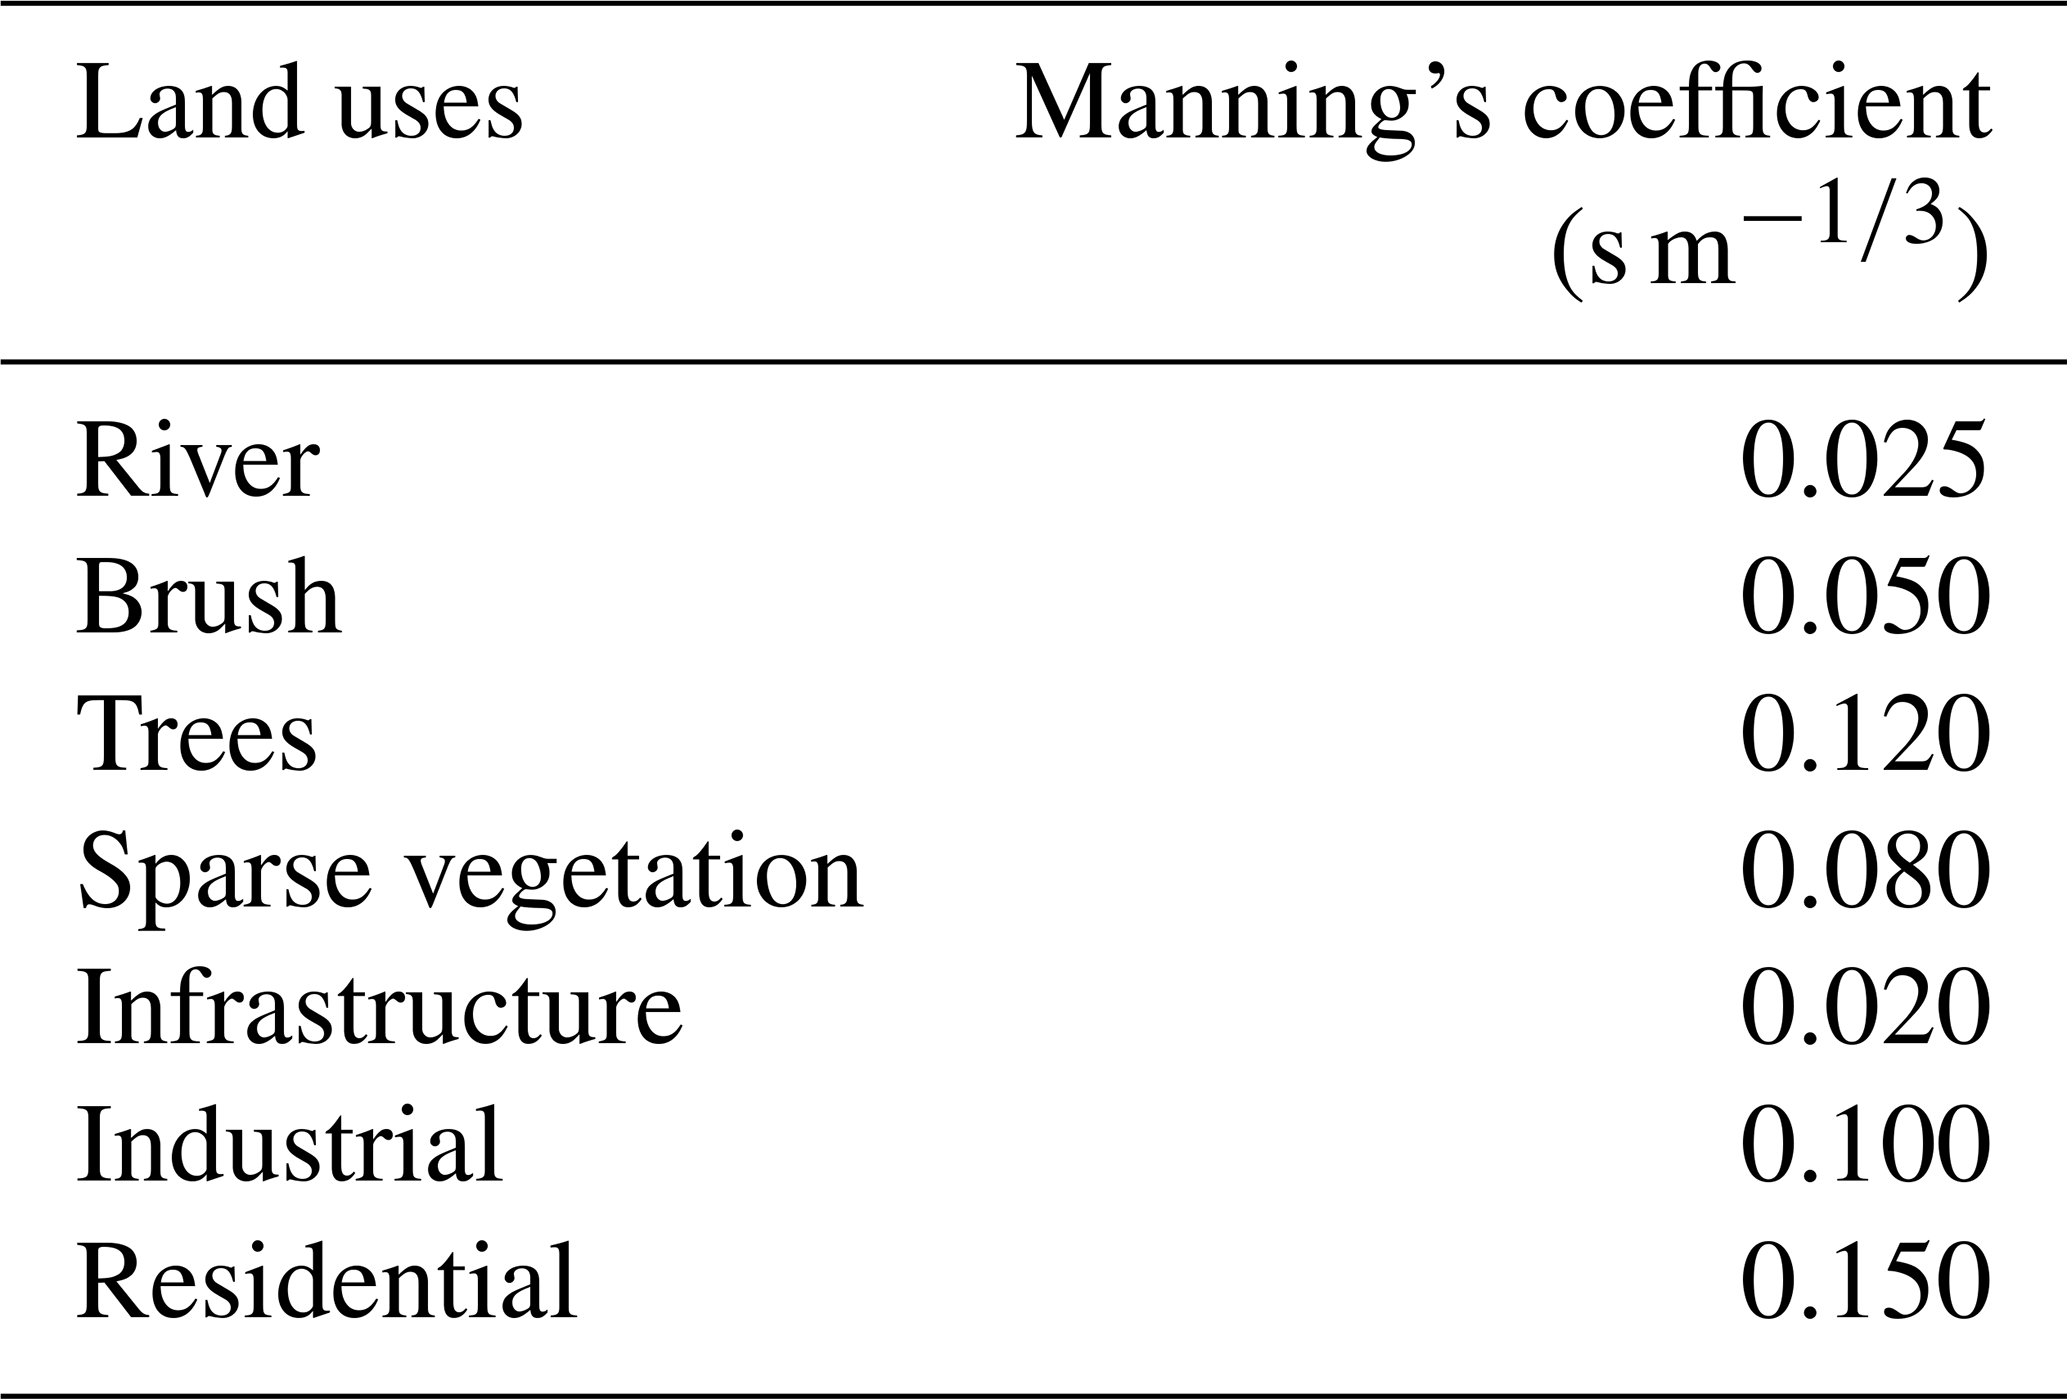
Once the predicted water flow was shown to reproduce the real events with a high accuracy (En∼0.8, σn∼0.3 and R∼0.95), the water depth and velocity during the flood event that affected Lugo on 20 January 2013 were computed using the numerical code Iber+ (García-Feal et al., 2018). Figure 5 shows the numerical domain at Lugo, where seven land uses were defined to model the characteristics of the terrain. Manning's coefficient associated with each land use is shown in Table 6. Figure 5 also shows the location of the inlet and outlet boundary conditions. The initial water depth was obtained from data provided by the gauge station located at Lugo. The inlet condition was defined by means of the input hydrograph (critical–subcritical) and the outlet condition was defined using a supercritical–critical outflow. Turbulence was not taken into account as suggested by SNCZI (2011) and in accordance with similar works (Erpicum et al., 2010; Liu et al., 2013; Segura-Beltrán et al., 2016).
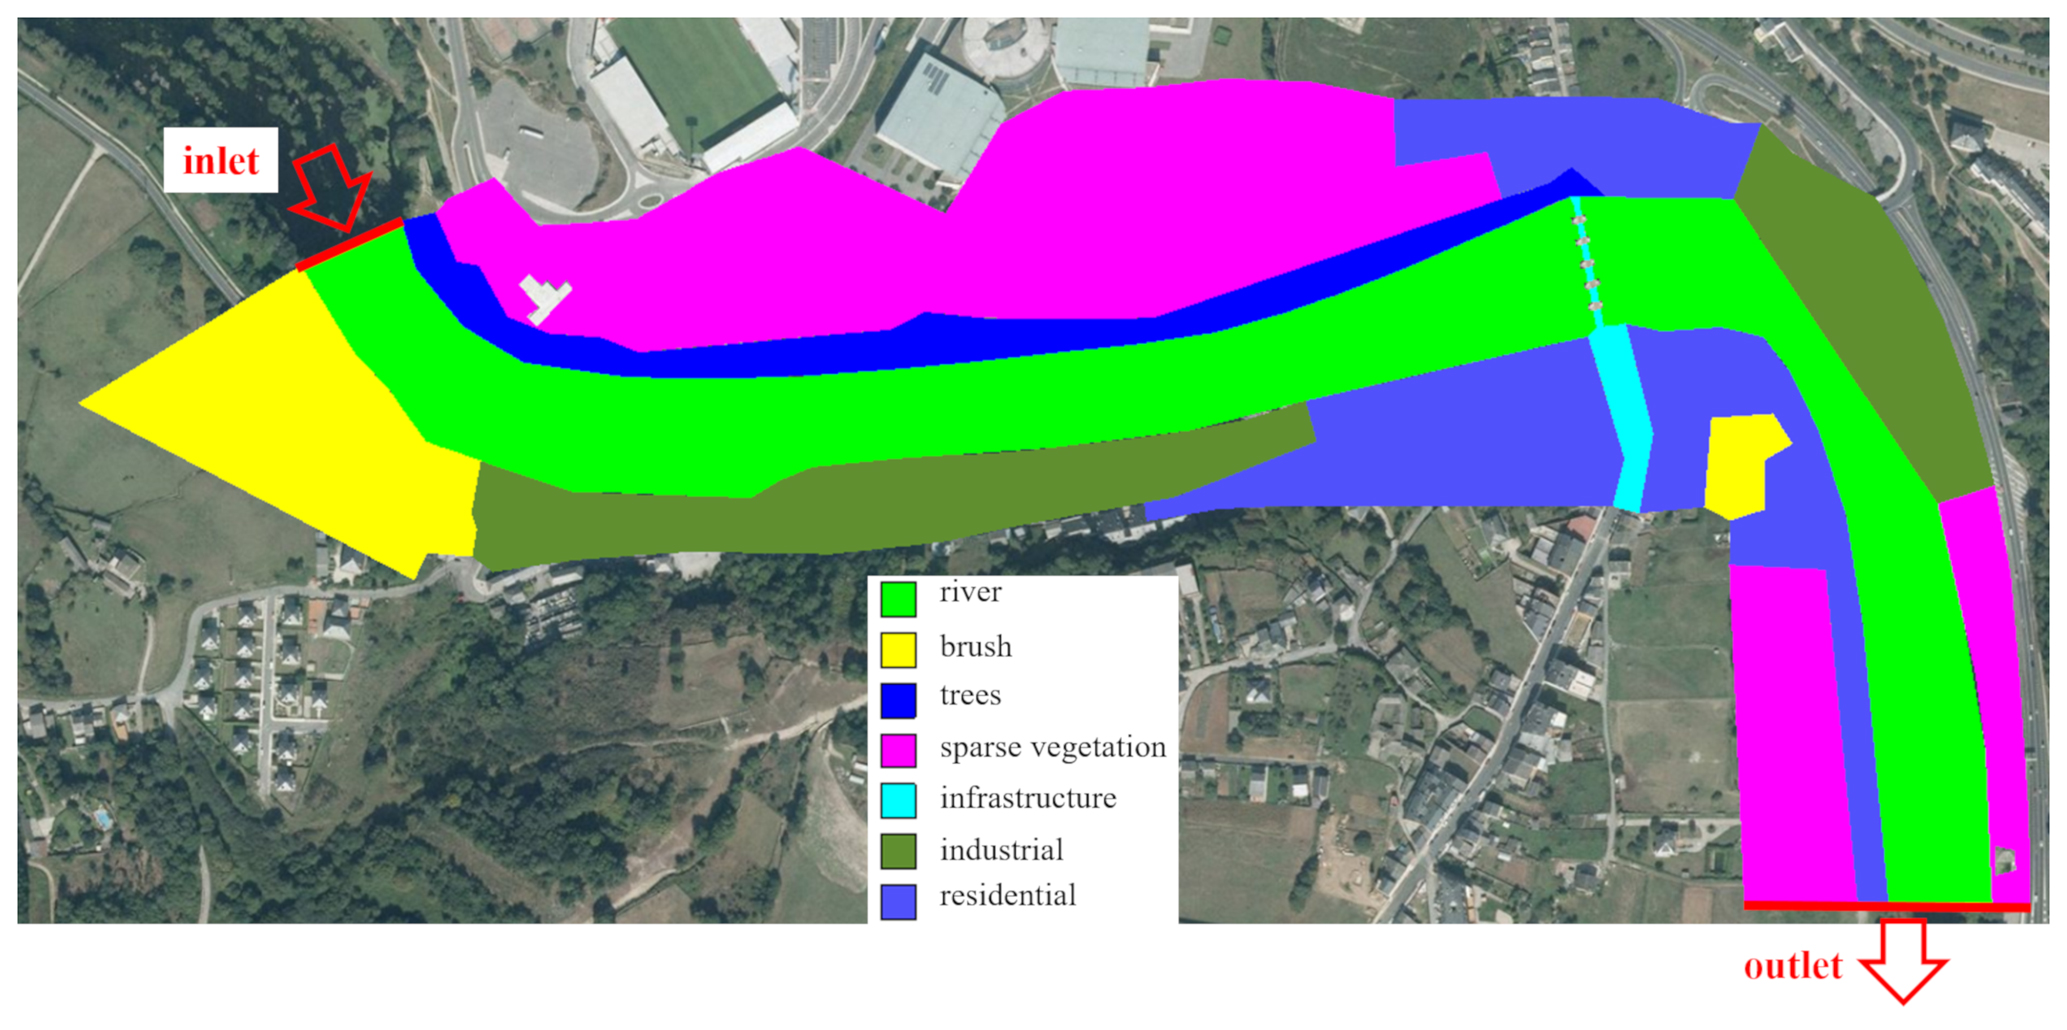
Figure 5Numerical domain at Lugo. The land uses and the location of the boundary conditions (red lines) are also shown (PNOA courtesy of © Instituto Geográfico Nacional).
The topography of the area of study was obtained from raster files freely downloaded from the Instituto Geográfico Nacional website (https://www.ign.es/web/ign/portal, last access: September 2019). The computational domain was discretised using a mesh with nearly 200 000 unstructured triangular elements, with an average area of 2 m2.
Five control points were defined at the area of study (see Fig. 6) to analyse the accuracy of the numerical results. Points from 1 to 4 are located in places next to the riverbank usually frequented by pedestrians while the last one is located in the riverbed. Therefore, the first four points are of special interest to issue an alert.
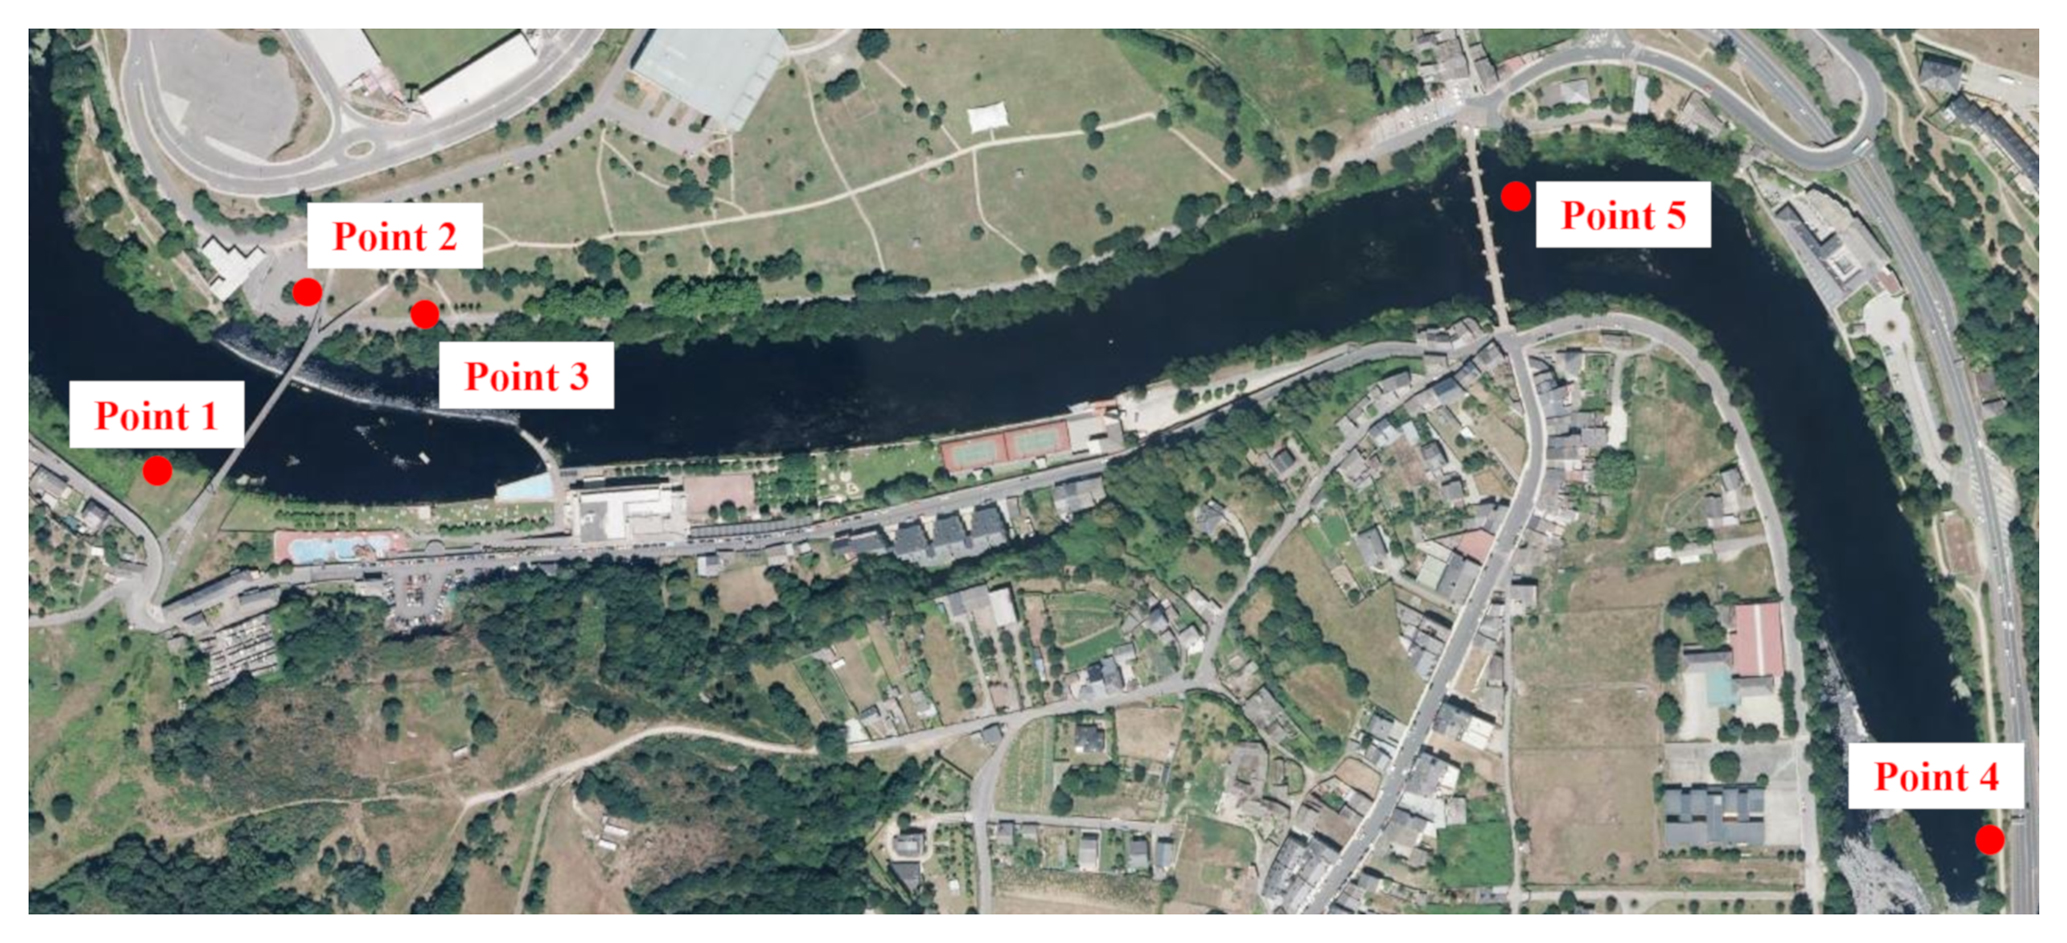
Figure 6Location of the five control points at the area of study in Lugo (PNOA courtesy of © Instituto Geográfico Nacional).
Figure 7 shows the values of the water depth obtained in the numerical simulations along with the water depth obtained at the control points during the flood event. These field values were obtained from photographs provided by volunteers and local media and taken within the interval 12:00–16:00 UTC+1 (for all times throughout the paper) on 20 January. The numerical water depth is expressed in terms of a mean value and a range that corresponds to 3 times the standard deviation of the values within that interval. Visually, the numerical results are quite similar to the field data when considering the 1 d forecast, especially if one considers that the accumulation of the small inaccuracies of the three models involved can give rise to biases. The values are slightly less accurate when considering the 2 d forecast and worse for the 3 d forecast due to lower accuracy in rainfall forecast. Finally, it must be mentioned that the depicted values do not correspond to the peak flow that took place on 21 January 2013 (at approximately 04:00).
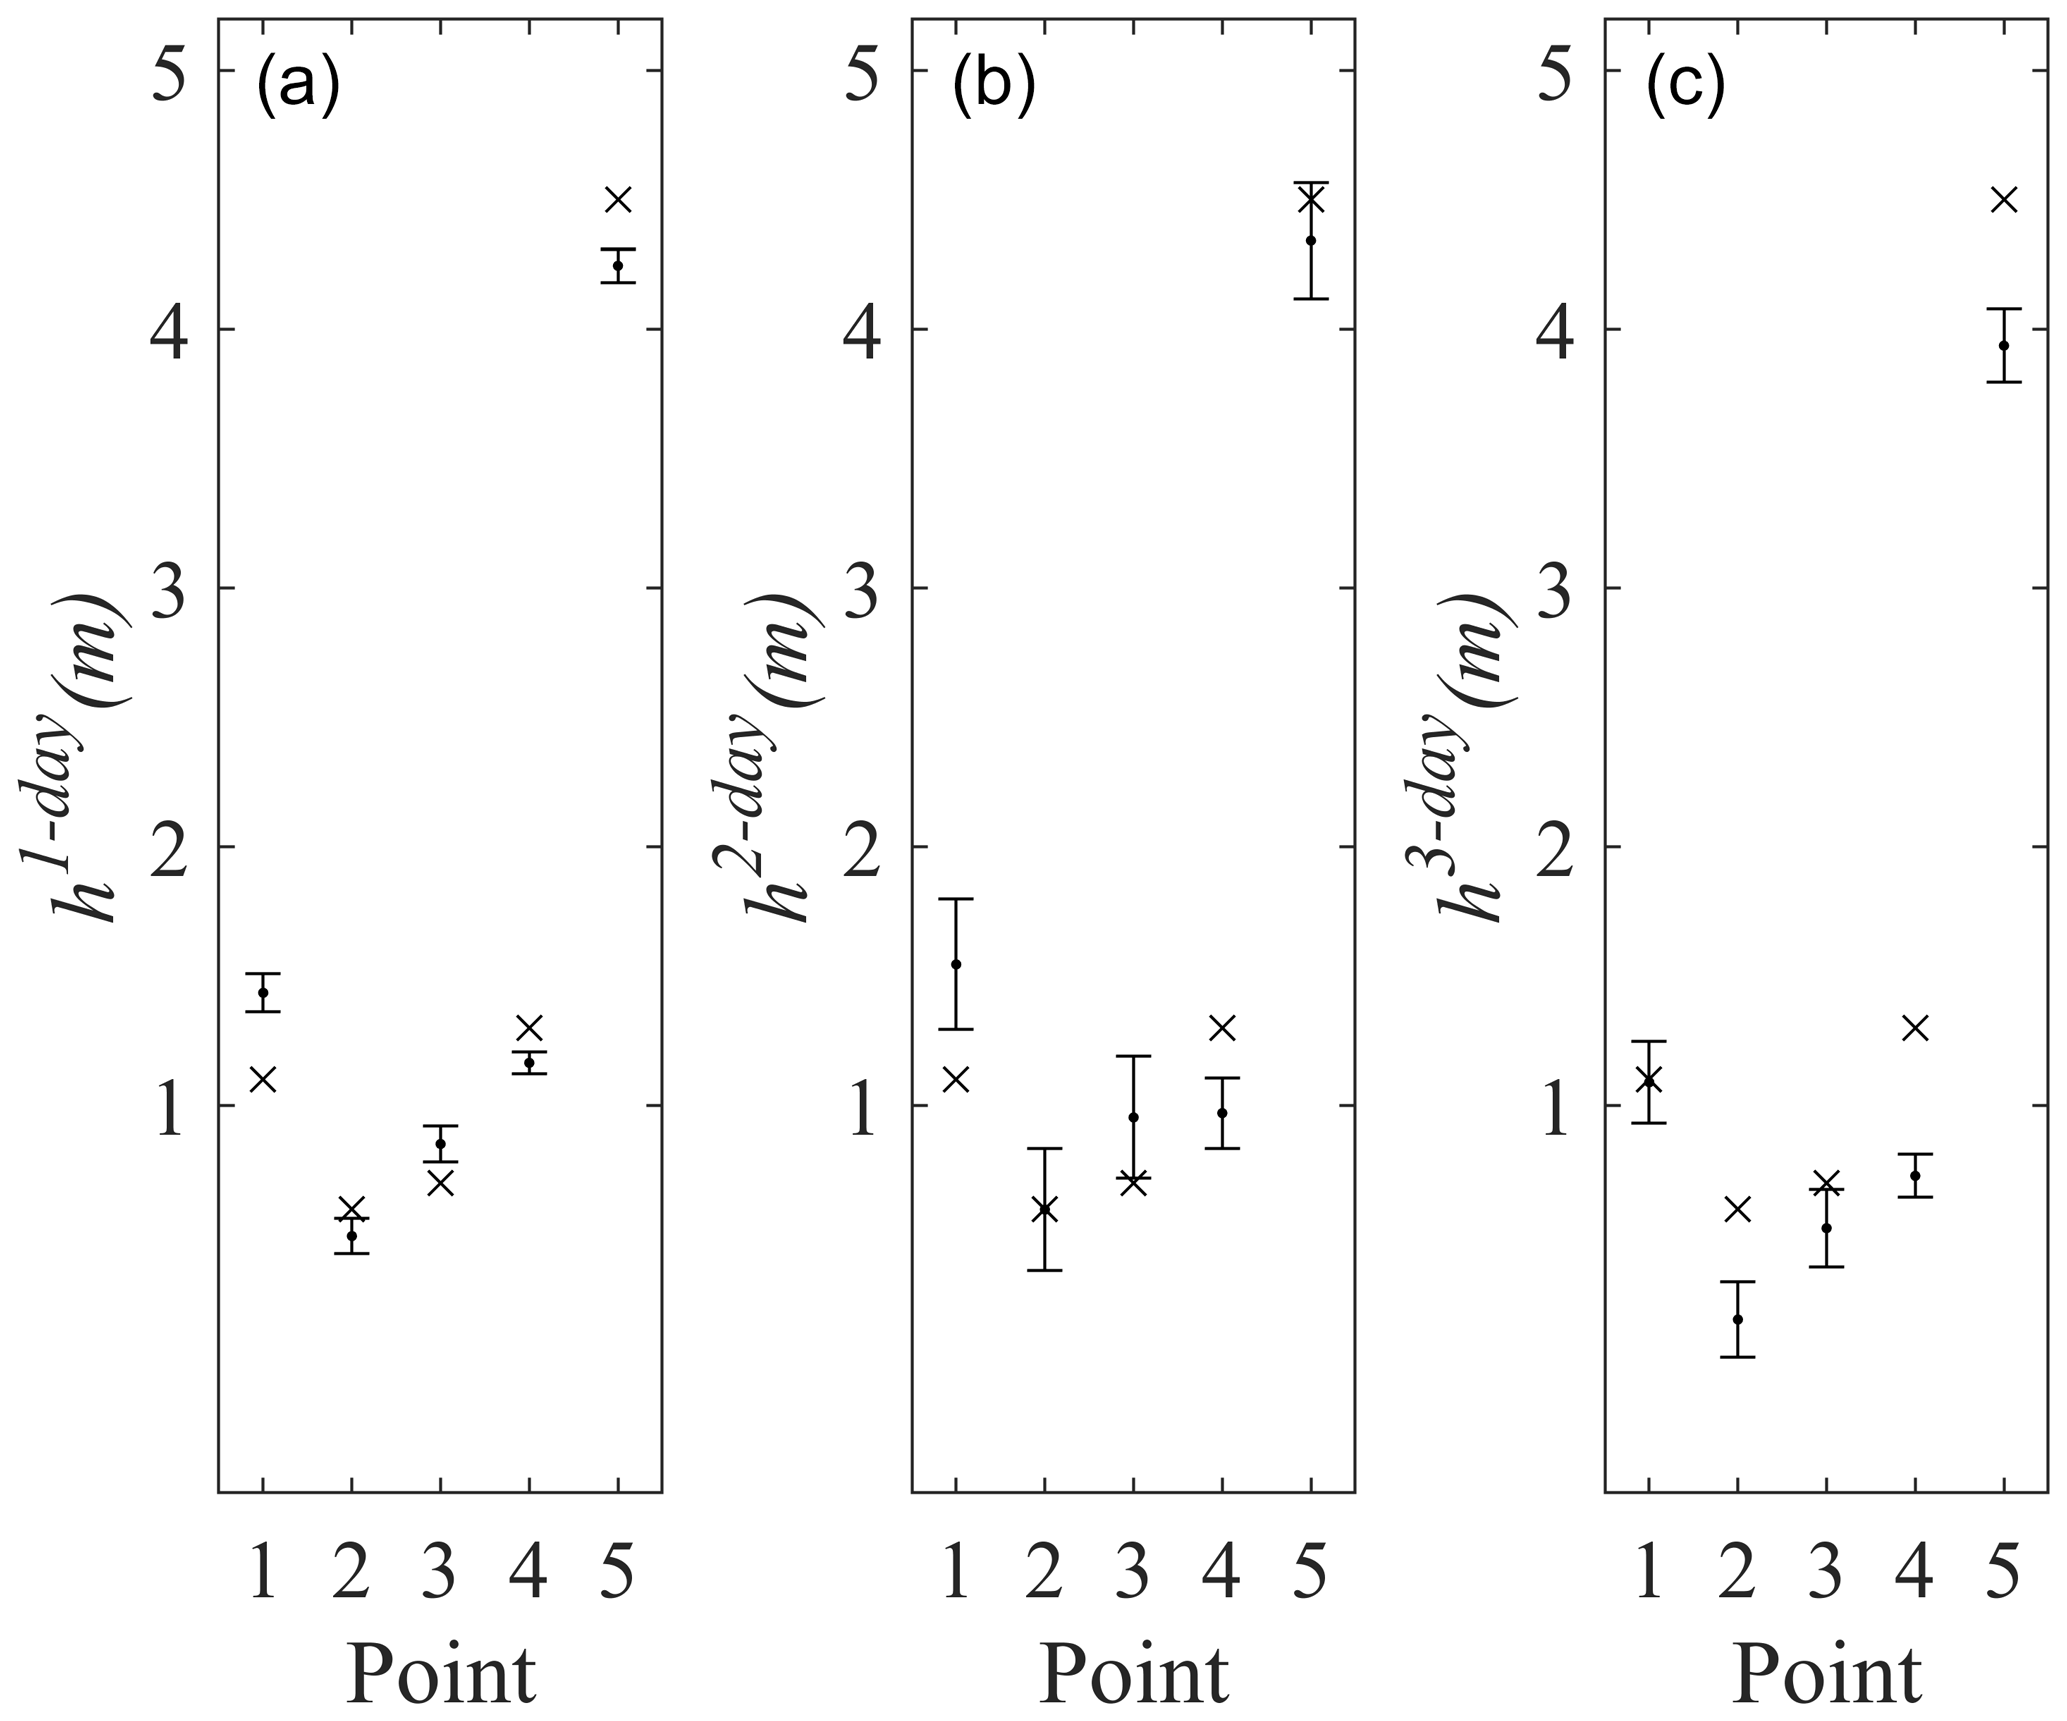
Figure 7Comparison between water depth (h in metres) between the numerical model (⋅) and the field data (×) for the three forecast windows 1 d (a), 2 d (b) and 3 d (c). The range of the numerical values corresponds to 3 times the standard deviation of the elevations obtained from 12:00 to 16:00 on 20 January 2013.
Apart from the visual comparison, the accuracy of the model to calculate water elevation was analysed in terms of two estimators (RMSE and bias) computed using the three forecast windows. The minimum values of RMSE and bias are obtained with the 24 h forecast window (21 and 0 cm, respectively). The RMSE is satisfactory when compared with the mean upward displacement of water during the event, which is about 2.5 m. In addition, the bias is null, showing that the model (in average) neither overestimates nor underestimates real water elevation. The accuracy decreases with the forecast window, although results are still good for a 2 d forecast (RMSE =28 cm and bias =4 cm). Finally, the accuracy is acceptable for a 3 d forecast (RMSE =41 cm and bias cm), although with limitations in terms of bias since the model clearly tends to underestimate field measurements. In summary, the agreement between measured and computed values indicates that the system can be used to issue an alert up to 3 d in advance.

Figure 8Maximum water depth (a) and maximum velocity (b) obtained with Iber+ for the 1 d precipitation forecast (PNOA courtesy of © Instituto Geográfico Nacional).
Figure 8 shows the maximum water depth and maximum velocity obtained for the 1 d forecast. Hazard maps (Fig. 9) can be computed from these data according to the criterion of Cox et al. (2010). Several recreation areas near the riverbanks are shown to have surpassed the aforementioned hazard threshold. Therefore, decision makers can use the map to restrict activities in these areas, in order to mitigate the consequences of floods.
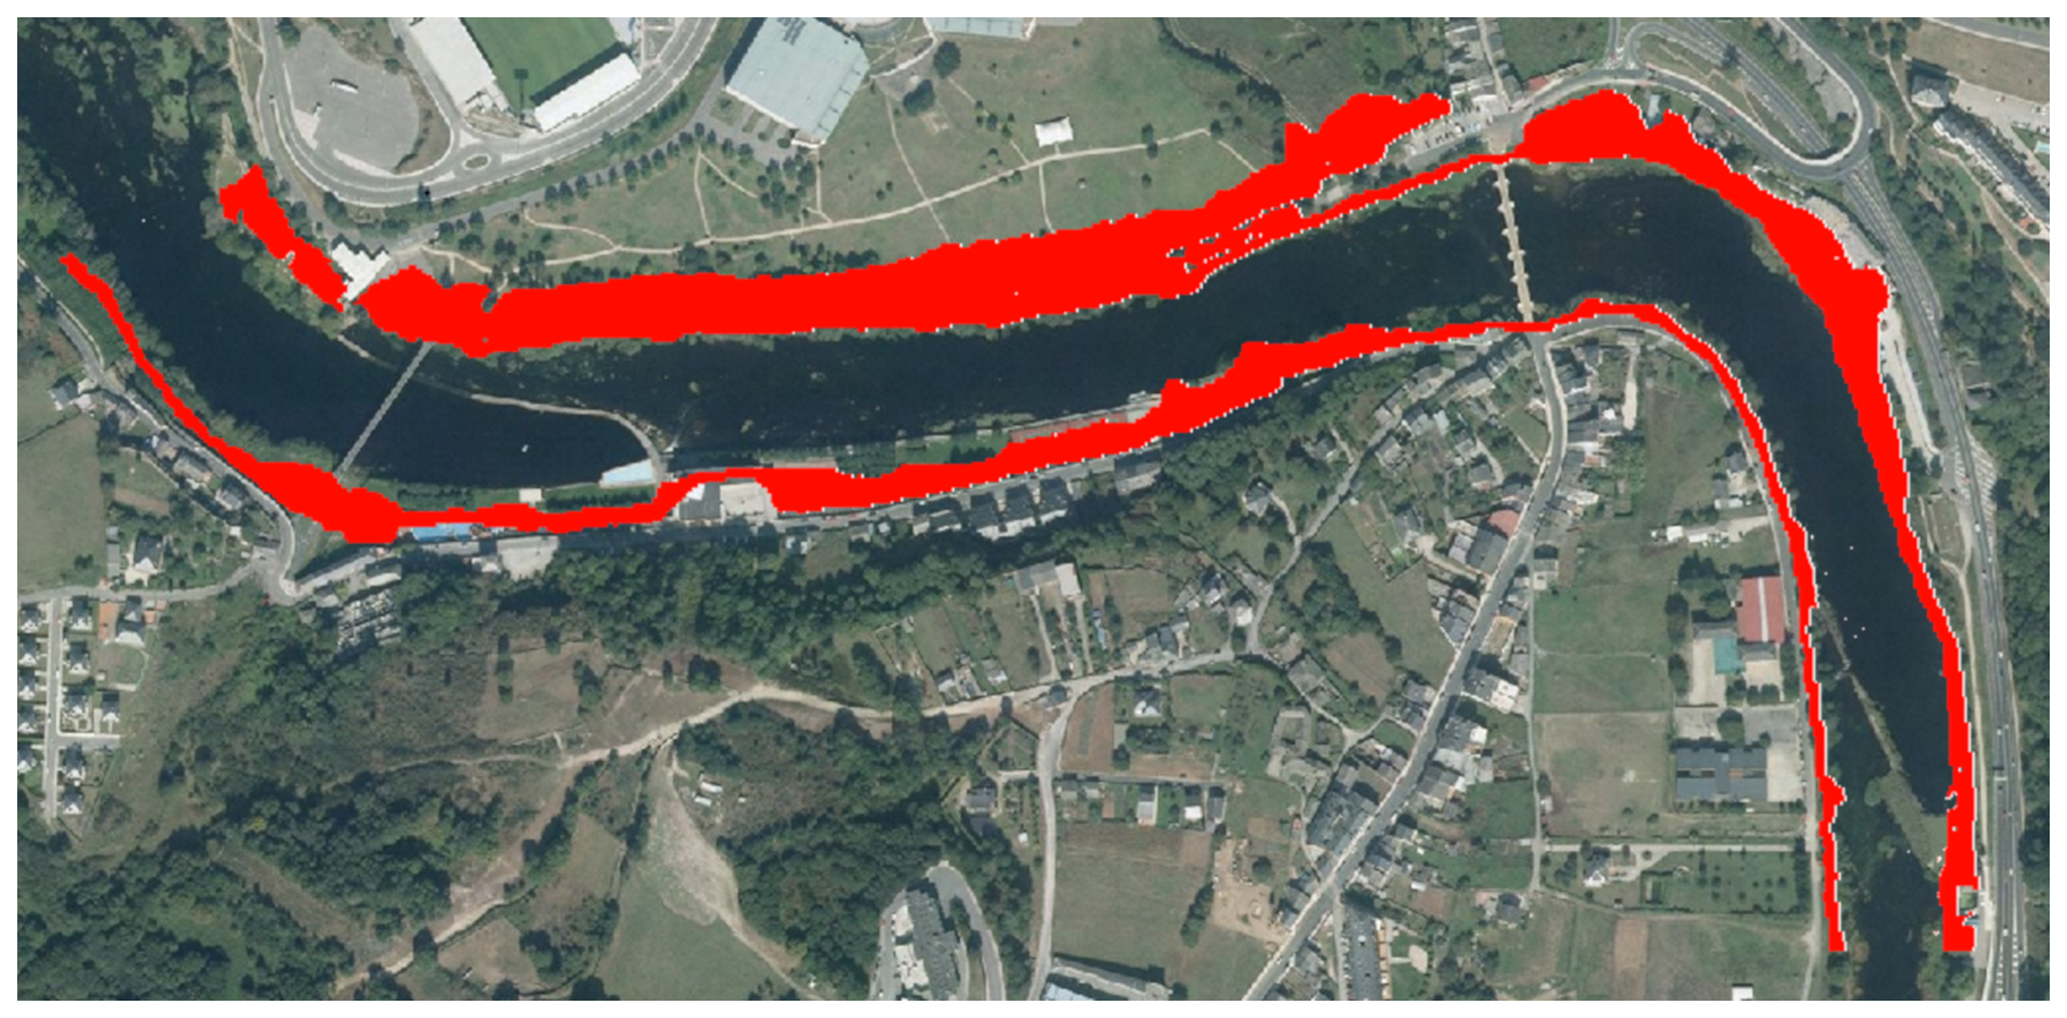
Figure 9Areas where hazard criterion is surpassed (PNOA courtesy of © Instituto Geográfico Nacional).
In this paper an early warning system for flood prediction using precipitation forecast was presented. This system starts automatically using rain forecast data retrieved from the regional meteorological office (MeteoGalicia) and concatenates two freely available software packages (HEC-HMS and Iber+). The upper reach of the Miño River (NW Spain) and, in particular, the city of Lugo were used as benchmarks.
A Python script was developed to deal with all the components involved in the system without user interaction. First, the precipitation forecast provided by MeteoGalicia is automatically obtained for the area of study. Second, the rain forecast is provided to HEC-HMS as an input to compute the streamflow in the catchment area. When the streamflow obtained with HEC-HMS surpasses the 90th percentile of the historical percentile at some previously selected risk area (the city of Lugo in this particular case), the possibility of an extreme event is detected and that streamflow is automatically defined as an inlet condition for Iber+. Finally, data obtained from Iber+ are processed for risk assessment and, if applicable, decision makers are notified.
The accuracy of the different models was assessed to analyse the capability of the system to provide reliable results. First, the accuracy of the precipitation forecast provided by MeteoGalicia was analysed for the period 2008–2018 showing that the 1 d forecast is slightly more accurate than the 2 d forecast, with the 3 d forecast being slightly worse, although the three forecast windows showed a reasonable agreement with field data. As a second step, the accuracy of HEC-HMS to reproduce extreme flows was assessed by means of 15 flood events recorded over for the period 2008–2018. Taylor diagrams were used to compute the accuracy of the numerical streamflow compared with field data obtained at the control station located near Lugo. Once again, results were satisfactory for the three forecast windows, especially for the 1 and 2 d forecasts. Finally, a historical flood event recorded in January 2013 was used to assess the accuracy of Iber+ to reproduce real water elevation at five control points located at the riverbank and riverbed. Both the RMSE and the bias between the measured and computed elevations were satisfactory, especially for the 1 d forecast.
The system needs less than 1 h to run the models for a 3 d forecast horizon. While data can be downloaded in a few seconds and the hydrologic model can be run in less than a minute, no matter the extent of the area, the real bottleneck in the system is the hydraulic model. Fortunately, the execution time does not necessarily increase with the number of risk areas since different areas can be run concurrently when the available hardware resources allow it. Taking into account that meteorological data are available every day at 05:00, the system can provide an alert report to decision makers before 06:00. Additional improvements can be applied without additional cost in terms of runtime. For example, an ensemble approach can be applied when rain forecasts from different sources are used as an input condition for HEC-HMS, in such a way that Iber+ is only executed when at least one of the hydrological realisations indicates a possible extreme event.
Additional research is still needed to cover the entire Miño River basin, where other problems may arise from the presence of dams. The system, when fully developed, can even help to manage dams intelligently, maximising energy production and dampening floods at the same time.
The early warning system can be easily adapted for any area of the world since the required input data can be obtained freely from public institutions and the models to compute the hydrological and the hydraulic processes (HEC-HMS and Iber+, respectively) are both freely available. Therefore, the EWS is especially interesting for developing countries where the acquisition of commercial software is not sustainable.
Freely available data and software (HEC-HMS and Iber+) were used for this work. The detailed processing flow chart is shown in Fig. 2 (Sect. 3 – Methodology).
JGC, OGF and DFN designed the research, conducted the analysis and wrote the paper. JMDA and MGG supervised the research and revised the paper.
The authors declare that they have no conflict of interest.
This article is part of the special issue “Hydroclimatic extremes and impacts at catchment to regional scales”. It is not associated with a conference.
We especially thank Carlos Ruiz del Portal Florido, Head of the Hydrological Planning Office, Hydrographic Confederation of Miño-Sil River for helpful discussions and for providing access to real data within the context of INTERREG-POCTEP Programme project RISC_ML (Code: 0034_RISC_ML_6_E).
This work was partially supported by the Water JPI-WaterWorks Programme under project Improving Drought and Flood Early Warning, Forecasting and Mitigation (IMDROFLOOD, code: PCIN-2015-243) and by Xunta de Galicia under project ED431C 2017/64-GRC “Programa de Consolidación e Estructuración de Unidades de Investigación Competitivas (Grupos de Referencia Competitiva)”.
This paper was edited by Fernando Domínguez-Castro and reviewed by Rodrigo Maia and one anonymous referee.
Alfieri, L., Salamon, P., Pappenberger, F., Wetterhall, F., and Thielen, J.: Operational early warning systems for water-related hazards in Europe, Environ. Sci. Policy, 21, 35–49, https://doi.org/10.1016/j.envsci.2012.01.008, 2012.
Alfieri, L., Pappenberger, F., Wetterhall, F., Haiden, T., Richardson, D., and Salamon. P.: Evaluation of ensemble streamflow predictions in Europe, J. Hydrol., 517, 913–922, https://doi.org/10.1016/j.jhydrol.2014.06.035, 2014.
Alfieri, L., Bisselink, B., Dottori, F., Naumann, G., de Roo, A., Salamon, P., Wyser, K., and Feyen, L.: Global projections of river flood risk in a warmer world, Earth's Future, 5, 171–182, https://doi.org/10.1002/2016EF000485, 2017.
Baudoin, M., Henly-Shepard, S., Fernando, N., Sitati, A., and Zommers, Z.: Early warning systems and livelihood resilience: exploring opportunities for community participation, UNU-EHS Working Paper Series, No. 1, United Nations University Institute of Environment and Human Security (UNU-EHS), Bonn, 2014.
Bladé, E., Cea, L., Corestein, G., Escolano, E., Puertas, J., Vázquez-Cendón, E., Dolz, J., and Coll, A.: Iber -River modelling simulation tool [Iber: herramienta de simulación numérica del flujo en ríos], Revista Internacional de Metodos Numericos para Calculo y Diseno en Ingenieria, 30, 1–10, https://doi.org/10.1016/j.rimni.2012.07.004, 2014.
Borga, M., Anagnostou, E. N., Blöschl, G., and Creutin, J. D.: Flash flood forecasting, warning and risk management: The HYDRATE project, Environ. Sci. Policy, 14, 834–844, https://doi.org/10.1016/j.envsci.2011.05.017, 2011.
CIW: Rapport Globale Evaluatie Overstromingen, [Evaluation Report for Floods] Committee for Integrated Water Resources Management (CIW), Flemish Authority, Brussels, Belgium, 2011 (in Dutch).
Cloke, H., Pappenberger, F., Thielen, J., and Thiemig, V.: Operational European flood forecasting, in: Environmental Modelling: Finding Simplicity in Complexity, 2nd ed., edited by: Wainwright, J. and Mulligan, M., John Wiley and Sons, Ltd, Chichester, UK, https://doi.org/10.1002/9781118351475.ch25, 2013.
Cools, J., Vanderkimpen, P., El Afandi, G., Abdelkhalek, A., Fockedey, S., El Sammany, M., Abdallah, G., El Bihery, M., Bauwens, W., and Huygens, M.: An early warning system for flash floods in hyper-arid Egypt, Nat. Hazards Earth Syst. Sci., 12, 443–457, https://doi.org/10.5194/nhess-12-443-2012, 2012.
Cox, R. J., Shand, T. D., and Blacka, M. J.: Australian Rainfall and Runoff revision project 10: appropriate safety criteria for people, Water Res., ISBN 978-085825-9454, 2010.
Dankers, R. and Feyen, L.: Climate change impact on flood hazard in Europe: An assessment based on high-resolution climate simulations, J. Geophys. Res., 113, D19105, https://doi.org/10.1029/2007JD009719, 2008.
Demeritt, D., Nobert, S., Cloke, H. L., and Pappenberger, F.: The European Flood Alert System and the communication, perception, and use of ensemble predictions for operational flood risk management, Hydrol. Process., 27, 147–157, https://doi.org/10.1002/hyp.9419, 2013.
Dottori, F., Kalas, M., Salamon, P., Bianchi, A., Alfieri, L., and Feyen, L.: An operational procedure for rapid flood risk assessment in Europe, Nat. Hazards Earth Syst. Sci., 17, 1111–1126, https://doi.org/10.5194/nhess-17-1111-2017, 2017.
Erpicum, S., Dewals, B., Archambeau, P., Detrembleur, S., and Pirotton, M.: Detailed inundation modelling using high resolution DEMs, Eng. Appl. Comp. Fluid., 4, 106–208, https://doi.org/10.1080/19942060.2010.11015310, 2010.
Fang, X., Thompson, D. B., Cleveland, T. G., Pradhan, P., and Malla, R.: Time of concentration estimated using watershed parameters determined by automated and manual methods, J. Irrig. Drain. Eng., 134, 202–211, https://doi.org/10.1061/(ASCE)0733-9437(2008)134:2(202), 2008.
Feldman, A. D.: Hydrologic Modeling System HEC-HMS, Technical Reference Manual, Institute for Water Resources Davis, USA, p. 157, 2000.
Fernández-Nóvoa, D., deCastro, M., Des, M., Costoya, X., Mendes, R., and Gómez-Gesteira, M.: Characterization of Iberian turbid plumes by means of synoptic patterns obtained through MODIS imagery, J. Sea Res., 126, 12–25, https://doi.org/10.1016/j.seares.2017.06.013, 2017.
García-Feal, O., González-Cao, J., Gómez-Gesteira, M., Cea, L., Domínguez, J. M., and Formella, A.: An accelerated tool for flood modelling based on Iber, Water, 10, 1459, https://doi.org/10.3390/w10101459, 2018.
GID: Reference Manual: available at: https://www.gidhome.com/ (last access: September 2019), 2018.
Grimaldi, S., Petroselli, A., Tauro, F., and Porfiri, M.: Time of concentration: a paradox in modern hydrology, Hydrolog. Sci. J., 57, 217–228, https://doi.org/10.1080/02626667.2011.644244, 2012.
Hossain, F., Siddique-E-Akbor, A. H. M., Yigzaw, W., Shah-Newaz, S., Hossain, M., Mazumder, L. C., Ahmed, T., Shum, C. K., Lee, H., Biancamaria, S., Turk, F. J., and Limaye, A.: Crossing the “valley of Death”: Lessons learned from implementing an operational satellite-based flood forecasting system, B. Am. Meteorol. Soc., 95, 1201–1207, https://doi.org/10.1175/BAMS-D-13-00176.1, 2014.
Jonkman, S. N.: Global perspectives on loss of human life caused by floods, Nat. Hazards, 34, 151–175, https://doi.org/10.1007/s11069-004-8891-3, 2005.
Kennedy, J. and Eberhart, R.: Particle swarm optimization. IEEE International Conference on Neural Networks – Conference Proceedings, 4, 1942–1948, 1995.
Liu, Y., Zhou, J., Song, L., Zou, Q., Liao, L., and Wang, W.: Numerical modelling of free-surface shallow flows over irregular topography with complex geometry, Appl. Math. Model, 37, 9482–9498, https://doi.org/10.1016/j.apm.2013.05.001, 2013.
Mezura-Montes, E. and Coello, C. A. C.: Constraint-handling in nature-inspired numerical optimization: Past, present and future, Swarm Evol. Comput., 1, 173–194, 2011.
Moriasi, D. N., Arnold, J. G., Van Liew, M. W., Bingner, R. L., Harmel, R. D., and Veith, T. L.: Model evaluation guidelines for systematic quantification of accuracy in watershed simulations, T. ASABE, 50, 885–900, 2007.
NRCS: Natural Resources Conservation Service: National Engineering Handbook: Chapter 16 Hydrographs, Washington, DC, 2007.
Noji, E. K.: The public health consequences of disasters, Prehospital and disaster medicine: the official journal of the National Association of EMS Physicians and the World Association for Emergency and Disaster Medicine in association with the Acute Care Foundation, 15, 147–157, 2000.
NVIDIA Corporation: CUDA C Programming Guide, available at: https://docs.nvidia.com/cuda/pdf/CUDA_C_Programming_Guide.pdf (last access: September 2019), 2019.
Pappenberger, F., Thielen, J., and Del Medico, M.: The impact of weather forecast improvements on large scale hydrology: analysing a decade of forecasts of the European Flood Alert System, Hydrol. Process., 25, 1091–1113, https://doi.org/10.1002/hyp.7772, 2011.
Pedersen, M. E. H.: Good parameters for particle swarm optimization, Tech. Rep. HL1001, Hvass Lab Copenhagen, Denmark, 2010.
Schelfaut, K., Pannemans, B., van der Craats, I., Krywkow, J., Mysiak, J., and Cools. J.: Bringing flood resilience into practice – the FREEMAN project, Environ. Sci. Policy, 14, 825–833, https://doi.org/10.1016/j.envsci.2011.02.009, 2011.
Segura-Beltrán, F., Sanchis-Ibor, C., Morales-Hernández, M., González-Sanchís, M., Bussi, G., and Ortiz, E.: Using post-flood surveys and geomorphologic mapping to evaluate hydrological and hydraulic models: The flash flood of the Girona River (Spain) in 2007, J. Hydrol., 541, 310–329, https://doi.org/10.1016/j.jhydrol.2016.04.039, 2016.
Skamarock, W. C. , Klemp, J. B., Dudhia, J., Gill, D. O., Barker, D. M., Wang, W., and Powers, J. G.: A Description of the Advanced Research WRF Version 2, Tech. Rep., National Center for Atmospheric Research, 2005.
SNCZI: Guía Metodológica para el Desarrollo del Sistema Nacional de Cartografía de Zonas Inundables, Ministerio de Medio Ambiente y Medio Rural y Marino, Gobierno de España, 2011.
Sousa, M. C., Alvarez, I., Vaz, N., Gomez-Gesteira, M., and Dias, J. M.: Assessment of wind pattern accuracy from the QuikSCAT satellite and the WRF model along the Galician coast (Northwest Iberian Peninsula), Mon. Weather Rev., 141, 742–753, https://doi.org/10.1175/MWR-D-11-00361.1, 2013.
Taylor, K. E.: Summarizing multiple aspects of model performance in a single diagram, J. Geophys. Res., 106, 7183–7192, 2001.
Thielen, J., Bartholmes, J., Ramos, M.-H., and de Roo, A.: The European Flood Alert System – Part 1: Concept and development, Hydrol. Earth Syst. Sci., 13, 125–140, https://doi.org/10.5194/hess-13-125-2009, 2009.
UNISDR: UNISDR terminology on disaster risk reduction, United Nations Office for Disaster Risk Reduction, 30 pp., 2009.
UNISDR: Making development sustainable: the future of disaster risk management. Global Assessment Report on Disaster Risk Reduction, United Nations Office for Disaster Risk Reduction (UNISDR), Geneva, Switzerland, 2015.
UN: Global survey of early warning systems, A report prepared at the request of the Secretary-General of the United Nations, Platform for the Promotion of Early Warning (UNDRR PPEW), 2006.
Upegui, J. J. V. and Gutiérrez, A. B.: Estimation of the time of concentration and the lag time at san Luis creek basin, Manizales [Estimación del tiempo de concentración y tiempo de rezago en la cuenca experimental urbana de la quebrada san luis, manizales], DYNA (Colombia), 78, 58–71, 2011.
U.S. Army Corps of Engineers: Hydrologic Modeling System (HEC-HMS) Applications Guide: Version 3.1.0. Davis: Institute for Water Resources, Hydrologic Engineering Center, 2008.
U.S. Army Corps of Engineers: Hydrologic Modeling System (HEC-HMS) User's Manual: Version 4.3. Institute for Water Resources Davis: Hydrologic Engineering Center, 2018.