the Creative Commons Attribution 4.0 License.
the Creative Commons Attribution 4.0 License.
 | 01 Oct 2019
Probabilistic seismic hazard analysis using the logic tree approach – Patna district (India)
Panjamani Anbazhagan
Ketan Bajaj
Karanpreet Matharu
Sayed S. R. Moustafa
Nassir S. N. Al-Arifi
Peak ground acceleration (PGA) and study area (SA) distribution for the Patna district are presented considering both the classical and zoneless approaches through a logic tree framework to capture the epistemic uncertainty. Seismicity parameters are calculated by considering completed and mixed earthquake data. Maximum magnitude is calculated using three methods, namely the incremental method, Kijko method, and regional rupture characteristics approach. The best suitable ground motion prediction equations (GMPEs) are selected by carrying out an “efficacy test” using log likelihood. Uniform hazard response spectra have been compared with Indian standard BIS 1893. PGA varies from 0.38 to 0.30 g from the southern to northern periphery considering 2 % probability of exceedance in 50 years.
- Article
(7401 KB) - Full-text XML
-
Supplement
(2431 KB) - BibTeX
- EndNote


Seismic hazard analysis is effective in presenting the potentially damaging phenomenon associated with earthquake. Earthquake disaster is not only associated with collapsing of structures due to ground shaking but also triggers fire, liquefaction, and landslide. Thus, it is indispensable to forecast the ground shaking level to serve the engineering needs in mitigating the risk associated with earthquakes. In India, moderate earthquakes (Mw<7) including Anjar 1956, Koyna 1967, Udaypur 1988, Uttarkashi 1991, and Chamoli 1999 have caused significant damage in last 10 decades (Nath and Thingbaijam, 2012). In addition, many great events (2015, Nepal earthquake) have originated from continent-to-continent collision. The Himalayan seismic gap (Bilham and Wallace, 2005) and thick soft soil sediments make the scenario more dangerous for cities close to the Himalayan region. Apart from this, improper planning, increase in population density, poor land use, and substandard construction practices in these cities magnify the prevailing seismic risk. Most of the existing seismic hazard maps are mainly on a macro-level for different parts of the Indian subcontinent and are not up to state-of-the-art knowledge in engineering seismology. For example, Khattri et al. (1984) developed a hazard map representing peak ground acceleration (PGA) for all of India with 10 % probability of exceedance in 50 years. Under the Global Seismic Hazard Assessment Program (GSHAP), Bhatia et al. (1999) presented a probabilistic seismic hazard analysis (PSHA) of India. Mahajan et al. (2010) delivered PSHA for the northwestern Himalayas. Recently, the National Disaster Management Authority (NDMA, 2010) and Nath and Thingbaijam (2012) have presented the PSHA map for all of India. The deterministic seismic hazard microzonation was proposed by Kolathayar et al. (2012). Further, Sitharam and Kolathayar (2013) developed the seismic hazard map of India using an areal source. In addition, Kumar et al. (2013) developed a deterministic seismic hazard analysis (DSHA) and PSHA map for the Lucknow region considering local and active seismic gaps. Additionally, the current Indian Standard (IS 1893, 2016) code consists of many constraints such as poor delamination of active seismic sources, lack of vulnerable sources to study, improper seismic hazard parameters which are not region-specific, and limited soil amplification consideration (Anbazhagan et al., 2014). Subsequently an updated seismic hazard map at the micro-level is essential for the cities near the Himalayan region, by considering new data, updated knowledge, and improvement in previous methodologies.
There are two types of uncertainties associated with hazard analysis. One is due to randomness of the nature of earthquake, wave propagation, and site amplification, named “aleatory uncertainty”, while the other is due to incomplete knowledge of earthquake process, named “epistemic uncertainty”. The former can be easily reduced by integrating the distribution of ground motion about the median (Bommer and Abrahamson, 2006) and the latter can be assessed using the logic tree approach. Gullu and Iyisan (2016) selected the ground motion prediction equations (GMPEs) for the logic tree based on the weighting factors that were incorporated with a Venn diagram of attenuation models regarding the experimenter's concern and expert's knowledge. Epistemic uncertainty is due to improper knowledge about the processes involved in earthquake events and algorithms used to model them. Hence, in this study, the logic tree framework has been used to reduce the epistemic uncertainty in the final hazard value calculation. In the absence of the appropriate region-specific models of wave propagation, ground motion prediction models are generally used to determine the hazard value. The uncertainty in GMPEs can be reduced by incorporating a logic tree in the hazard analysis study. Logic trees represent the various nodes that define the alternative input choices and each branch is assigned a weight factor that signifies the quantitative degree of likelihood assigned. To quantify the epistemic uncertainty, different branches of logic tree need to be considered, which is based on source models, regionalization of b value, determination of magnitude of completeness and maximum magnitude, and epistemic uncertainty in GMPE using the suitable representative approach.
In the present study, PSHA of Patna district (India) at the micro-level has been prepared along with the response spectrum by reducing the epistemic uncertainty. Patna lies at 250 km from the central seismic gap (Khattri, 1987) in the Himalayan region where huge devastation and destruction due to the 1803, 1934 Bihar–Nepal and 2015 Nepal earthquakes were reported. Similar to Bilham (2015), a large earthquake appears to be imminent in future due to rupturing of the main fault beneath the Himalayas because of the Nepal 2015 earthquake. Hence such studies need to be done for the cities that lie within the vicinity of the Himalayan region and the Indo-Gangetic Basin. Seismic sources and seismic events have been measured for a 500 km radius around the district centre as per Anbazhagan et al. (2015a). The a and b parameters have been obtained by taking into consideration the completed earthquake data using the Gutenberg–Richter (G–R) relationship and mixed data using methods proposed by Woessner and Wiemer (2005). The magnitude of completeness (Mc) is also calculated using nine methods proposed by Woessner and Wiemer (2005). Maximum magnitude has been determined using weighted mean considering three methods: increment factor on maximum observed magnitude, the method of Kijko and Sellevoll (1989), and regional rupture characteristics (Anbazhagan et al., 2015b). Ground motion prediction equations (GMPEs) have been selected from the 28 numbers of applicable GMPEs for the region. The seismic hazard map for Patna district has been developed using PSHA applying probabilistic methods, namely the classical method proposed by Cornell (1968), which was later upgraded by Algermissen et al. (1982), and the smoothed–gridded seismicity models using areal source and four models proposed by Frankel (1995). For the development of a hazard map using the areal approach, delineation of seismic zones has been performed based on the seismicity parameters, i.e. a, b, and Mc. The hazard curves between mean annual rate of exceedance versus PGA and spectral acceleration (Sa) are developed at the rock levels by both models. The final hazard map in terms of the rock level peak ground acceleration values is for 2 % and 10 % probability of exceedance in 50 years, i.e. a return period of 2475 and 475 years based on a logic tree. Additionally, a hazard map for Sa at 0.2 and 1 s for a return period of 2475 and 475 years is also given. Furthermore, uniform hazard spectrum for Patna district at the rock level for a return period of 2475 and 475 years based on a logic tree has been estimated and compared with Indian standard IS 1893.
Regional seismicity, geological, seismological, and seismotectonics information of the seismic study area (SSA) have been assembled and evaluated for a desirable radius for seismic hazard analysis. The present study area covers the longitude 84.6–85.65∘ E and latitude 25.2–25.8∘ N and is near various rivers such as Gandak in the west, Ganga in the south, and Kosi and Bhagmati in the north (see Fig. 1). Patna lies in seismic zone IV with a zone factor of 0.24 as per IS 1893 (2016). To carry out a seismic hazard analysis, details and documentation about seismic features such as faults, shear zones, and lineaments along with all earthquake events (Mw>4) that have occurred in the SSA are mandatory. Based on a damage distribution map, i.e. isoseismal map (1833 Nepal earthquake and 1934 Bihar–Nepal earthquake), and location of the main boundary thrust, main central thrust, and Himalayan Frontal Thrust (HFT), a radius of 500 km has been selected for the present SSA. A detailed study about selecting the SA of 500 km is given in Anbazhagan et al. (2015a). Geographical information of India demonstrates that approximately 60 % of the land is highly susceptible to earthquakes (NDMA, 2010). The tectonic features of the SA have been compiled from the Seismotectonic Atlas (SEISAT, 2010) published by the Geological Survey of India (GSI, 2000). The seismotectonic map was developed by considering a 500 km radius from the Patna district boundary by considering linear sources (faults and lineaments) from SEISAT and published literature (e.g. NDMA, 2010; Nath and Thingbaijam, 2012; Kumar et al., 2013). Separation of the main boundary thrust (MBT) and the main central thrust (MCT) has been performed and all the faults along with MBT and MCT have also been numbered. The seismotectonic map for Patna district is shown in Fig. 1. A brief description of seismicity and seismotectonics of SSA is given below.
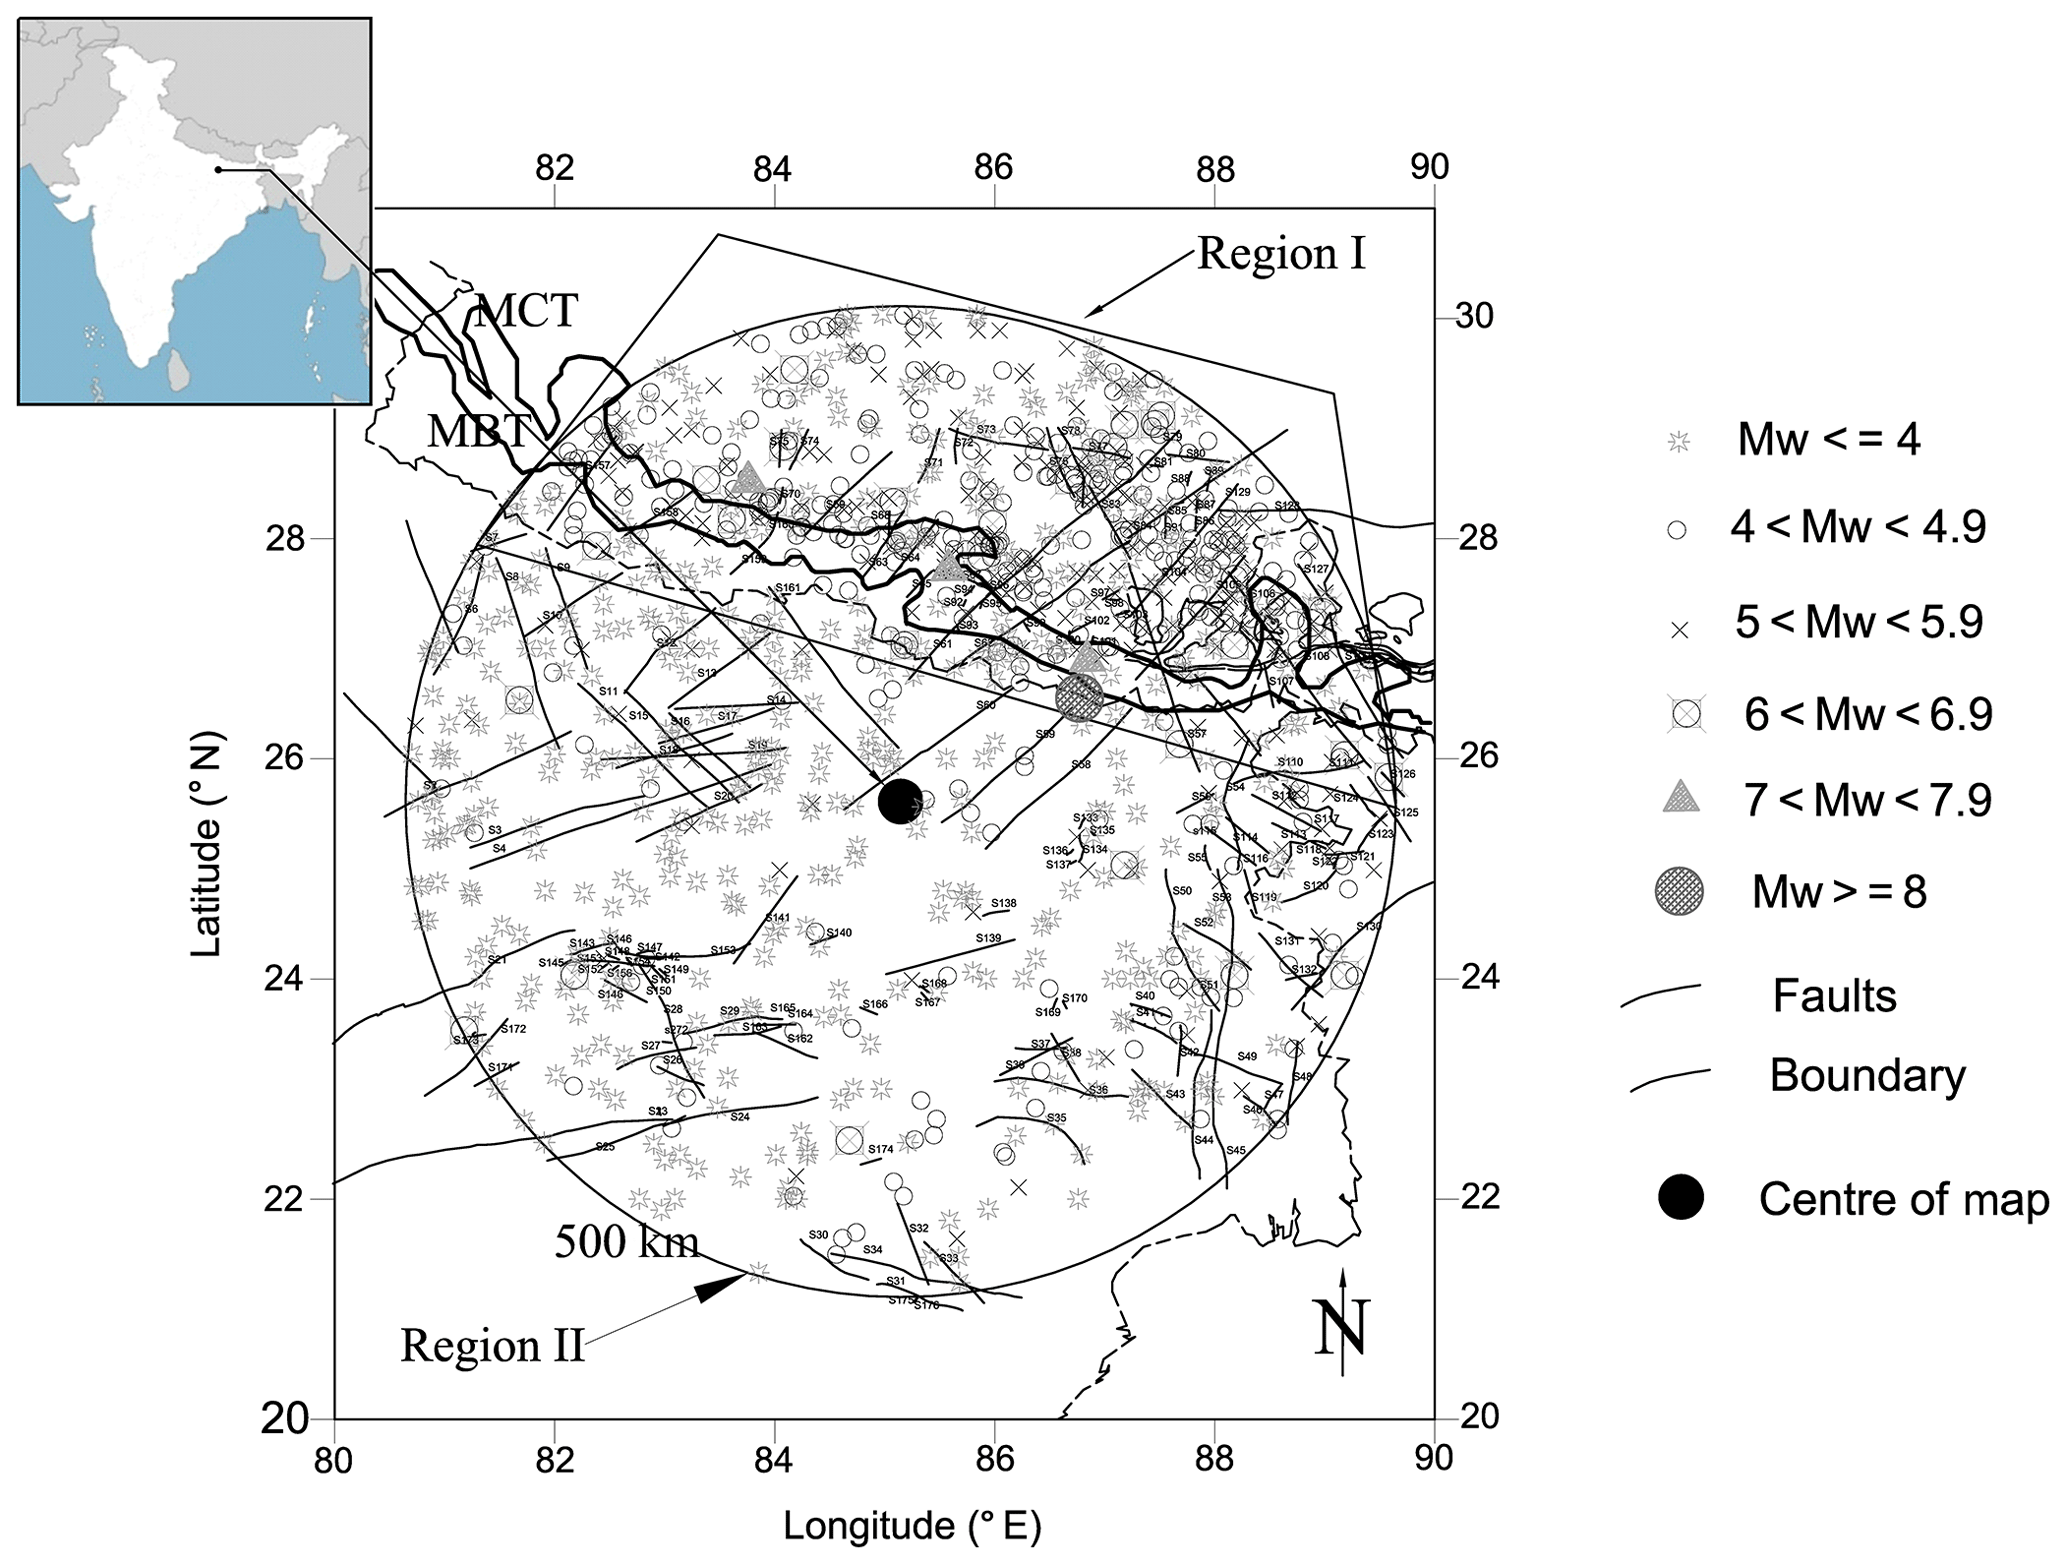
Figure 1Seismotectonic map of Patna SSA.
Patna district lies near the seismically active Himalayan belt and on the deep deposits of the Indo-Gangetic Basin (IGB). It is also surrounded by various active ridges such as the Monghyr–Saharsa Ridge Fault, many active tectonic features such as the Munger–Saharsa Ridge Fault, and active faults such as the East Patna Fault or West Patna Fault. These faults are acknowledged as transverse faults, and the occurrence of seismic events is due to stimulus of fluvial dynamics in the North Patna plains transverse faults (Valdiya, 1976; Dasgupta et al., 1987). According to Banghar (1991) the East Patna Fault is one of the active faults in the study area and its interaction with the Himalayan Frontal Thrust is characterized by a cluster of earthquakes. Dasgupta et al. (1993) state that all other faults between Motihari and Kishanganj cities have the same possibility of seismic hazard as they form part of a related fault system. Historic earthquakes such as 1833 Bihar, 1934 Bihar–Nepal, and 1988 Bihar–Nepal have affected Patna city as far as economic loss and loss of lives is concerned. Many other earthquakes that have occurred near the Bihar–Nepal border also prove to be devastating for Patna district. In addition, the north side of Patna is near the East and West Patna faults. The frequency of seismic events on these faults is high (Valdiya, 1976; Dasgupta et al., 1987). In addition SSA is also 250 km from the Himalayan plate boundary. These plate boundaries were the source of major historic earthquakes. Considering the above seismic aspects, Patna district can be acknowledged to be under a high seismic risk. Thus, in the present work, PSHA of Patna district has been carried out by considering all seismic sources and earthquake events by reducing epistemic uncertainty using the logic tree approach.
The earthquake data are collected from various agencies such as the National Earthquake Information Centre (NEIC), International Seismological Centre, Indian Meteorological Department (IMD), United States Geological Survey (USGS), Northern California Earthquake Data Centre (NCEDC), and GSI. The events have been selected from all the mentioned agencies. Duplicate events have been deleted, and the magnitude has been homogenized to moment magnitude scale. A total of 2325 events have been compiled which are on different magnitude scales such as local magnitude, surface wave magnitude, and body wave magnitudes. To attain uniformity, all the reported events are converted to moment magnitude (Mw) using relations given by Scordilis (2006) considering worldwide data. Furthermore, the declustering algorithm proposed by Gardner and Knopoff (1974), and modified by Uhrhammer (1986), was used for the separation of the main event from dependent events. Out of 2325 events, 54 % were noticed as dependent events, i.e. 1272 events were documented as main shocks for the Patna region. The complete catalogue contains 454 events having a moment magnitude less than 4 and 1127 events with Mw≥4. To develop the seismotectonic map, the linear source map was superimposed with the declustered earthquake events and given as Fig. 1. Near MBT and MCT, earthquake events are densely located (See Fig. 1) compared to other parts of the seismotectonic map. As per Cornell (1968) and Frankel (1995), the seismic study area needs to be divided based on the seismicity or tectonic provision for calculating the significant hazard value from any potential source. Based on the event distribution SSA is divided into region I (which belongs to MBT and MCT) and region II. These regions were separated using a polygon, as shown in Fig. 1; region I fit into events inside the polygon and region II belongs to events outside the polygon. Region I contained 280 events with Mw 4 to 5, 197 events with Mw 5.1 to 6, 26 events with Mw 6.1 to 7, and 4 events with Mw greater than 7, whereas Region II contained a total of 310 significant events, viz. 168 events with Mw 4 to 5, 121 events with Mw 5.1 to 6, and 21 events with Mw 6.1 to 7. Both the regions were separately analysed for the seismic hazard estimation.
3.1 a and b parameters considering period of completeness
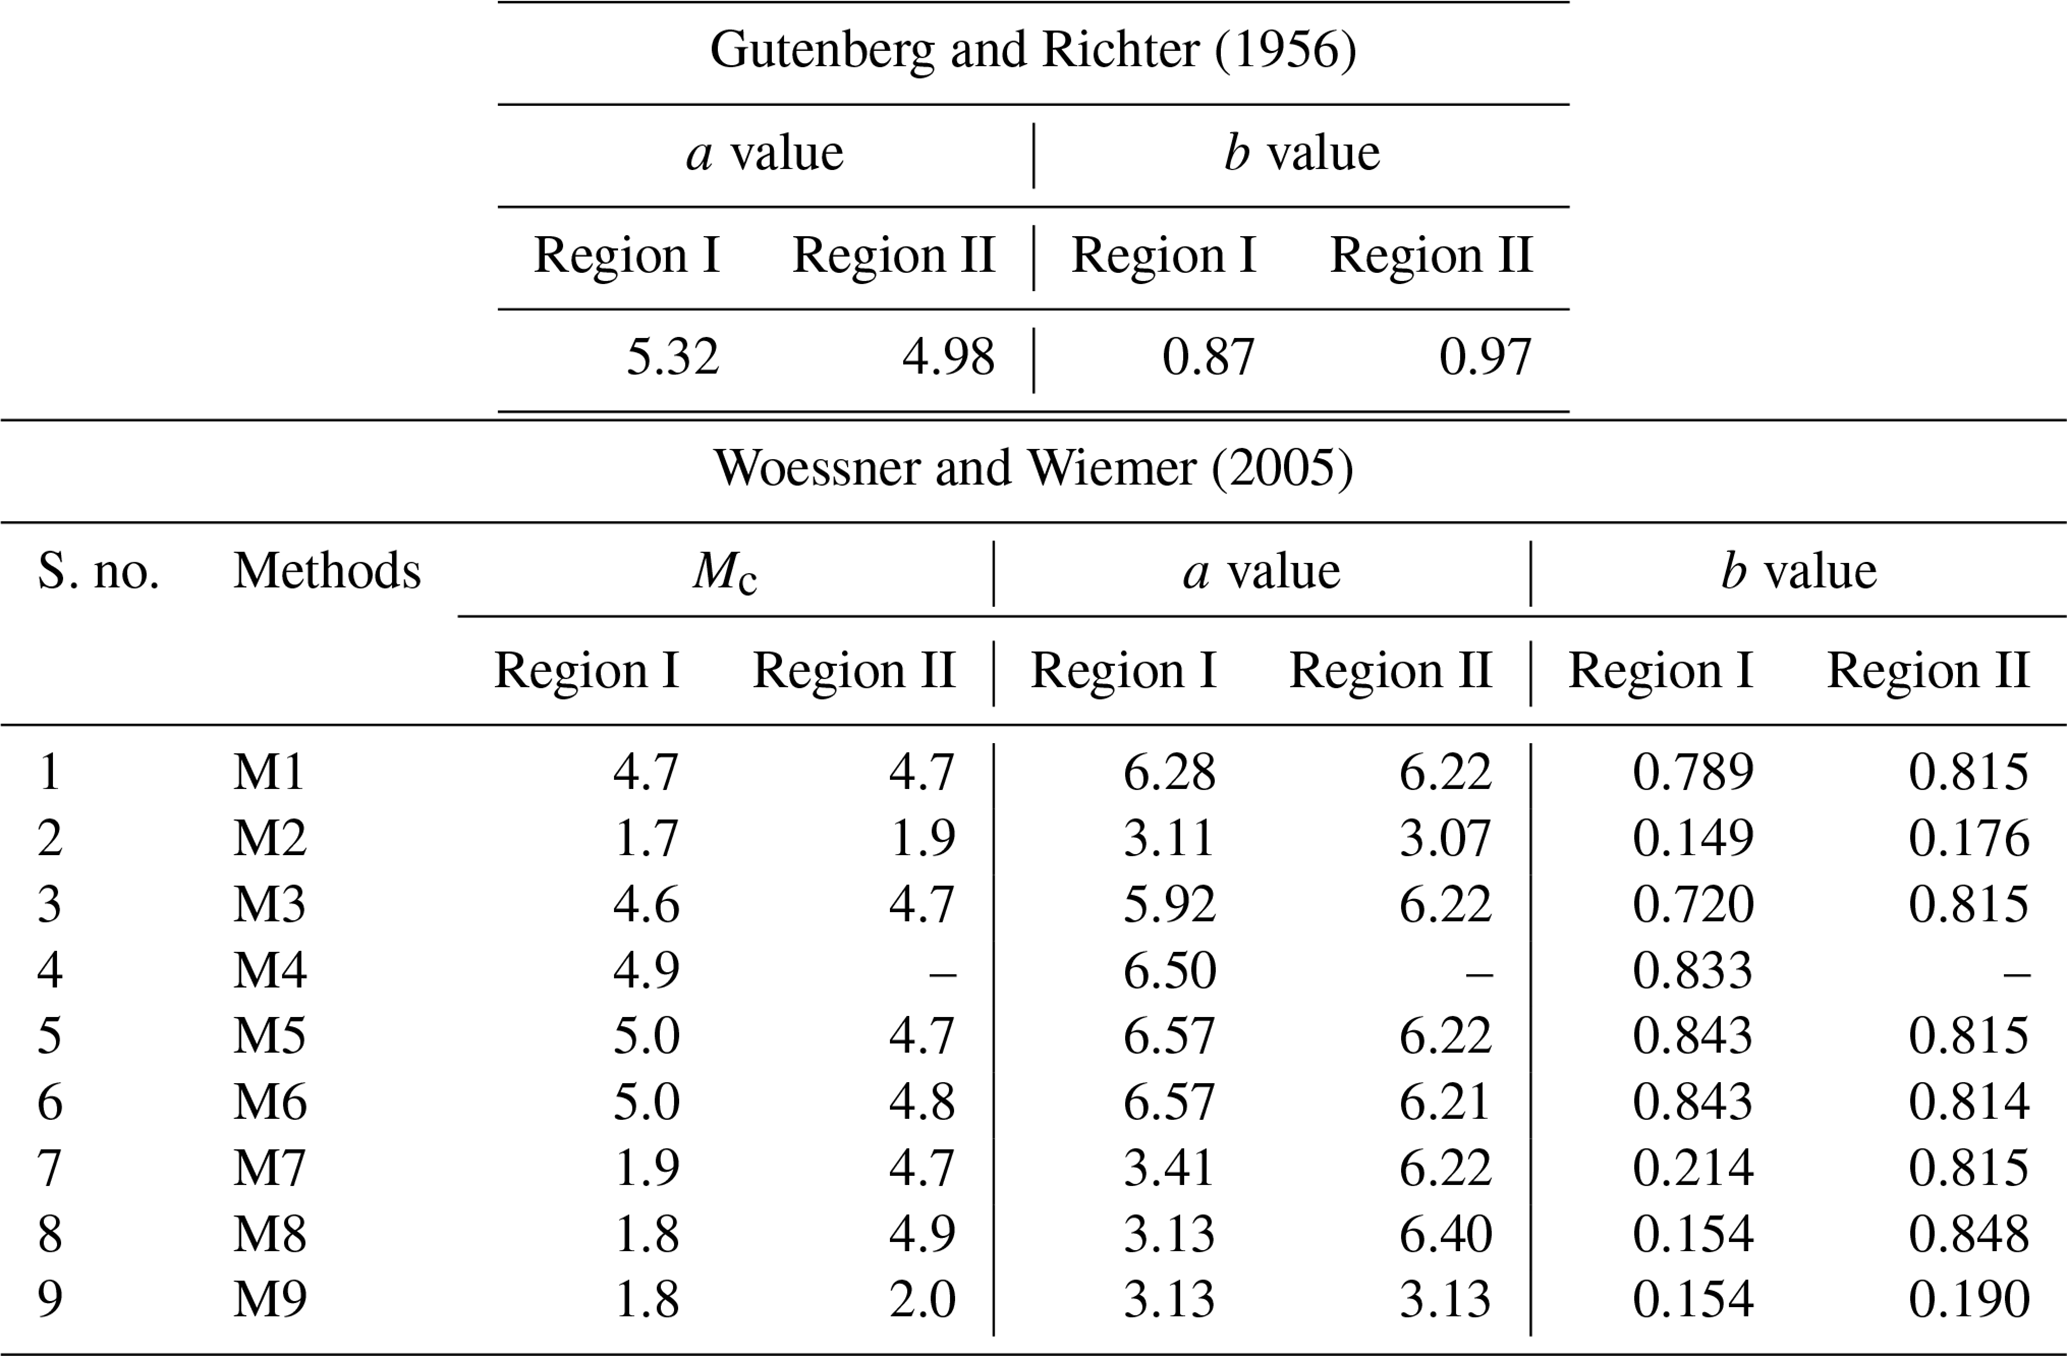
The most widely known Gutenberg–Richter (G–R) relationship (Gutenberg and Richter, 1956) is usually used for the determination of a and b parameters for any SSA. The seismic recurrence rate can be precisely calculated only for the complete seismic event data. Stepp (1972) is used for examining the completeness of both the regions. Based on the analysis, it has been observed that for Mw>5, the catalogue is completed for 110 years for both the regions. However, for Mw<5, the catalogue is completed for the last 80 and 70 years respectively for region I and region II. After determining the completeness of catalogue, G–R recurrence law for both the regions has been estimated. The b value for region I and region II respectively was found as 0.87 and 0.97. Whereas the a value for region I and region II respectively for the present study was determined as 5.32 and 4.98. More details about period of completeness and G–R recurrence law are described in Anbazhagan et al. (2015a).
3.2 Magnitude of completeness (Mc)
Magnitude of completeness is defined as the lowest magnitude at which 100 % of the events in a space–time volume are detected (Rydelek and Sacks, 1989; Taylor et al., 1990; Wiemer and Wyss, 2000). Mc is also important for mapping out seismicity parameters such as b value of the Gutenberg–Richter relationship. The magnitude of completeness was calculated using nine different methods defined by Woessner and Wiemer (2005). In addition to magnitude of completeness, these methods also estimate G–R a and b parameters. These methods are maximum curvature method (M1), fixed minimum magnitude observed (Mmin) (M2), goodness of fit Mmin90 (M3) and Mmin95 (M4), best combination of Mmin90 and Mmin90 and maximum curvature (M5), entire magnitude range (M6), Shi and Bolt (1982) method (M7), bootstrap method (M8), and Cao and Gao (2002) method (M9). Magnitude of completeness for Patna site for region I and region II (shown in Fig. 1) was estimated using software package ZMAP (Wiemer, 2001), a MATLAB-based programme. The a, b, and Mc from each method are represented as Fig. 2 for M1, M2, M3, M4, M5, M6, M7, M8, and M9 for both the regions. It has been observed that Mc varies from 1.7 to 5.0 Mw for region I and 1.9 to 4.9 Mw for region II. It is also observed that an R value of 95 % for the observed magnitude–frequency distribution cannot be modelled by a straight line for region II due to lack of data. The Gutenberg–Richter a and b parameters calculated using these nine methods are different from those calculated using completed data with G–R relationship values for both the regions. Calculated values of G–R a and b parameters for both the regions are given in Table 1. The value of the a parameter calculated from the above methods varies from 3.11 to 6.57 for region I and 3.07 to 6.4 for region II. However, the b parameter calculated from the above methods varies from 0.149 to 0.843 for region I and 0.176 to 0.848 for region II. The lower b value is observed as it is calculated based on the magnitude of completeness, which may be due to the change in the algorithm as it selected the completed magnitude as minimum observed magnitude. This is not used further in the hazard calculation. The difference in a and b parameters is determined using the above methods, as it is calculated based on magnitude of completeness using mixed data (Woessner and Wiemer, 2005) instead of period of completeness for completed data of earthquake events. It can be seen from Table 1 that the average value of the a parameter is 4.95 for region I, which is low compared with the number of earthquakes in the region. Similarly, the average b values of 0.522 and 0.661 for region I and region II are also low when compared to the number of earthquake events having a larger magnitude. According to Boomer et al. (2005) calculation effort increases dramatically with the inclusion of more branches in the logic tree. Therefore, Bommer et al. (2005) suggested avoiding using branches with slight differences between the options, in cases when those options result in very similar nodes. Hence, only M6 has been used because this method synthetically maximizes the available data and stabilizes the Mc value. Woessner and Wiemer (2005) suggested that the M6 method is capable for Mc calculation as it synthetically maximizes the available data and stabilizes the Mc value. Therefore, for further analysis, a and b values of 6.57 and 0.843 and 6.22 and 0.815 respectively had been considered for region I and II. For further study, a weight factor of 0.5 was given to each of the methods (i.e. period of completeness and magnitude of completeness, viz. M6) used to determine the a and b values for both the regions. The final values of 5.0 Mw and 4.8 Mw are adopted as magnitude of completeness for region I and II respectively for further study.
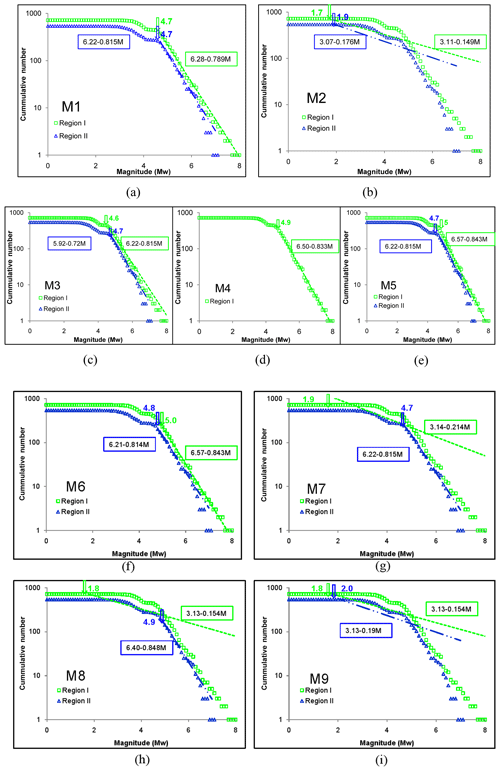
Figure 2Mc value along with a and b parameters for M1, M2, M3, M4, M5, M6, M7, M8, and M9 for region I (open square) and region II (open triangle).
Table 1Variation in magnitude of completeness (Mc) and a and b parameters of G–R relationship.
3.3 Maximum magnitude estimation (Mmax)
The maximum probable earthquake magnitude has been calculated using both deterministic and probabilistic approaches. Three methods, viz. conventional methods of increment of 0.5 in maximum observed magnitude () based on b values, the Kijko method (Kijko and Sellevoll, 1989), and regional rupture characteristics (Anbazhagan et al., 2015b), have been used in Mmax calculation. For the estimation of Mmax using Kijko and Sellevoll (1989), calculation of Mc is already discussed above. Secondly, Mmax magnitude has been calculated by adding a constant value of 0.5 to the value at each fault (see Fig. 1) like the NDMA (2010) report. Mmax is also estimated using regional rupture characteristics by considering the and possible seismic source. The whole procedure to calculate region-specific rupture characteristics was presented in Anbazhagan et al. (2015a). As per Risk Engineering Inc (1988) and others, the increment varies from source zone to source zone, and as per Wheeler (2009) short historical records produce samples of seismicity that are too small to constrain Mmax. As per Anbazhagan et al. (2015b), Mmax estimated from probabilistic methods, i.e. Kijko and Sellevoll (1989), is sensitive to SSA and seismicity parameters of a region. However, Mmax determined using regional rupture characteristics is more reliable as it depends upon the seismic source and rupture length. Taking these points into consideration qualitative weight factors of 0.3, 0.3, and 0.4 has been assigned to the incremental method, Kijko method, and regional rupture method respectively. More weight is given to the regional rupture approach as it accounts for rupture of seismic source, which in turn depends upon the energy released for an event. Maximum magnitude calculated corresponding to each fault is available in Table S1 in the Supplement and Anbazhagan et al. (2015a).
GMPEs have been selected based on the efficacy test recommended by Scherbaum et al. (2009) and Delavaud et al. (2009). There are various GMPEs available for the active crustal region and basin. Out of various GMPEs, 27 GMPEs are applicable for the present SA. The details of the efficacy test have been given in Anbazhagan et al. (2015c). Details of these GMPEs are given in Anbazhagan et al. (2015a). Similar to Anbazhagan et al. (2015a), the hypocentral distance is divided into three length bins, viz. 0–100, 100–300, and 300–500 km. The applicable GMPEs with the abbreviation used in the present study are given as Table 2. The determined PGA values are used to estimate the log-likelihood (LLH) values. Further, the data support index (DSI) given by Delavuad et al. (2012) is used to rank the best suitable GMPEs. Positive DSI values have been identified for each segment and ranked based on high to low values. Positive DSI values for the Patna earthquake are marked as bold in Table 3. It can be seen from Table 3 that the three GMPEs ANBU-13, NDMA-10, and KANO-06 can be used for up to 100 km of hypocentral distance. For a 100–300 km distance, ANBU-13, NDMA-10, KANO-06, and BOAT-08 are used and for hypocentral distance greater than 300 km NDMA-10 will be used for further hazard analysis. NDMA-10 is used for a distance more than 300 km, as it is the only available equation for the larger distances. Seismic hazard values in terms of PGA and SA can be calculated considering these equations for each seismic source. The variation in PGA with distance for the selected GMPEs is given as Fig. S1. In addition, LLH-based weight as per Delavaud et al. (2012) for selected GMPEs was also calculated. Scherbaum and Kühn (2011) showed the importance of weight treatments through the logic tree approach as probabilities instead of generic quality measures of attenuation equations, which are subsequently normalized. They also indicated the risk of independently assigning grades by different quality criteria, which could result in an apparent insensitivity to the weights. In order to provide the consistency with a probabilistic framework, they proposed assigning the weight factors in a sequential manner, which is used in the present study. The weight factors of 0.72, 0.17, and 0.11 are calculated with ANBU-13, NDMA-10, and KANO-06 at up to 100 km of hypocentral distance according to Delavaud et al. (2012). For a 100–300 km distance, KANO-06, ANBU-13, NDMA-10, and BOAT-08 with weight factors of 0.32, 0.28, 0.26, and 0.14 are calculated, and for a hypocentral distance greater than 300 km a weight factor of 1 has been associated with NDMA-10. It can be noted here that only one GMPE is surfaced with positive DSI for a distance segment of 300 to 500 km and required additional GMPEs in this range, which is important for the far-field damage scenario in the region. These GMPEs with associated weight factors were further used in probabilistic seismic hazard analysis of Patna SSA. These weight factors would be further useful in forming the logic tree to reduce the epistemic uncertainty in final hazard value. Detailed analysis of determination of LLH and weight factor corresponding to each GMPE is given in Anbazhagan et al. (2015a).
Table 2Available GMPEs with their Abbreviations considered for the seismic study area.
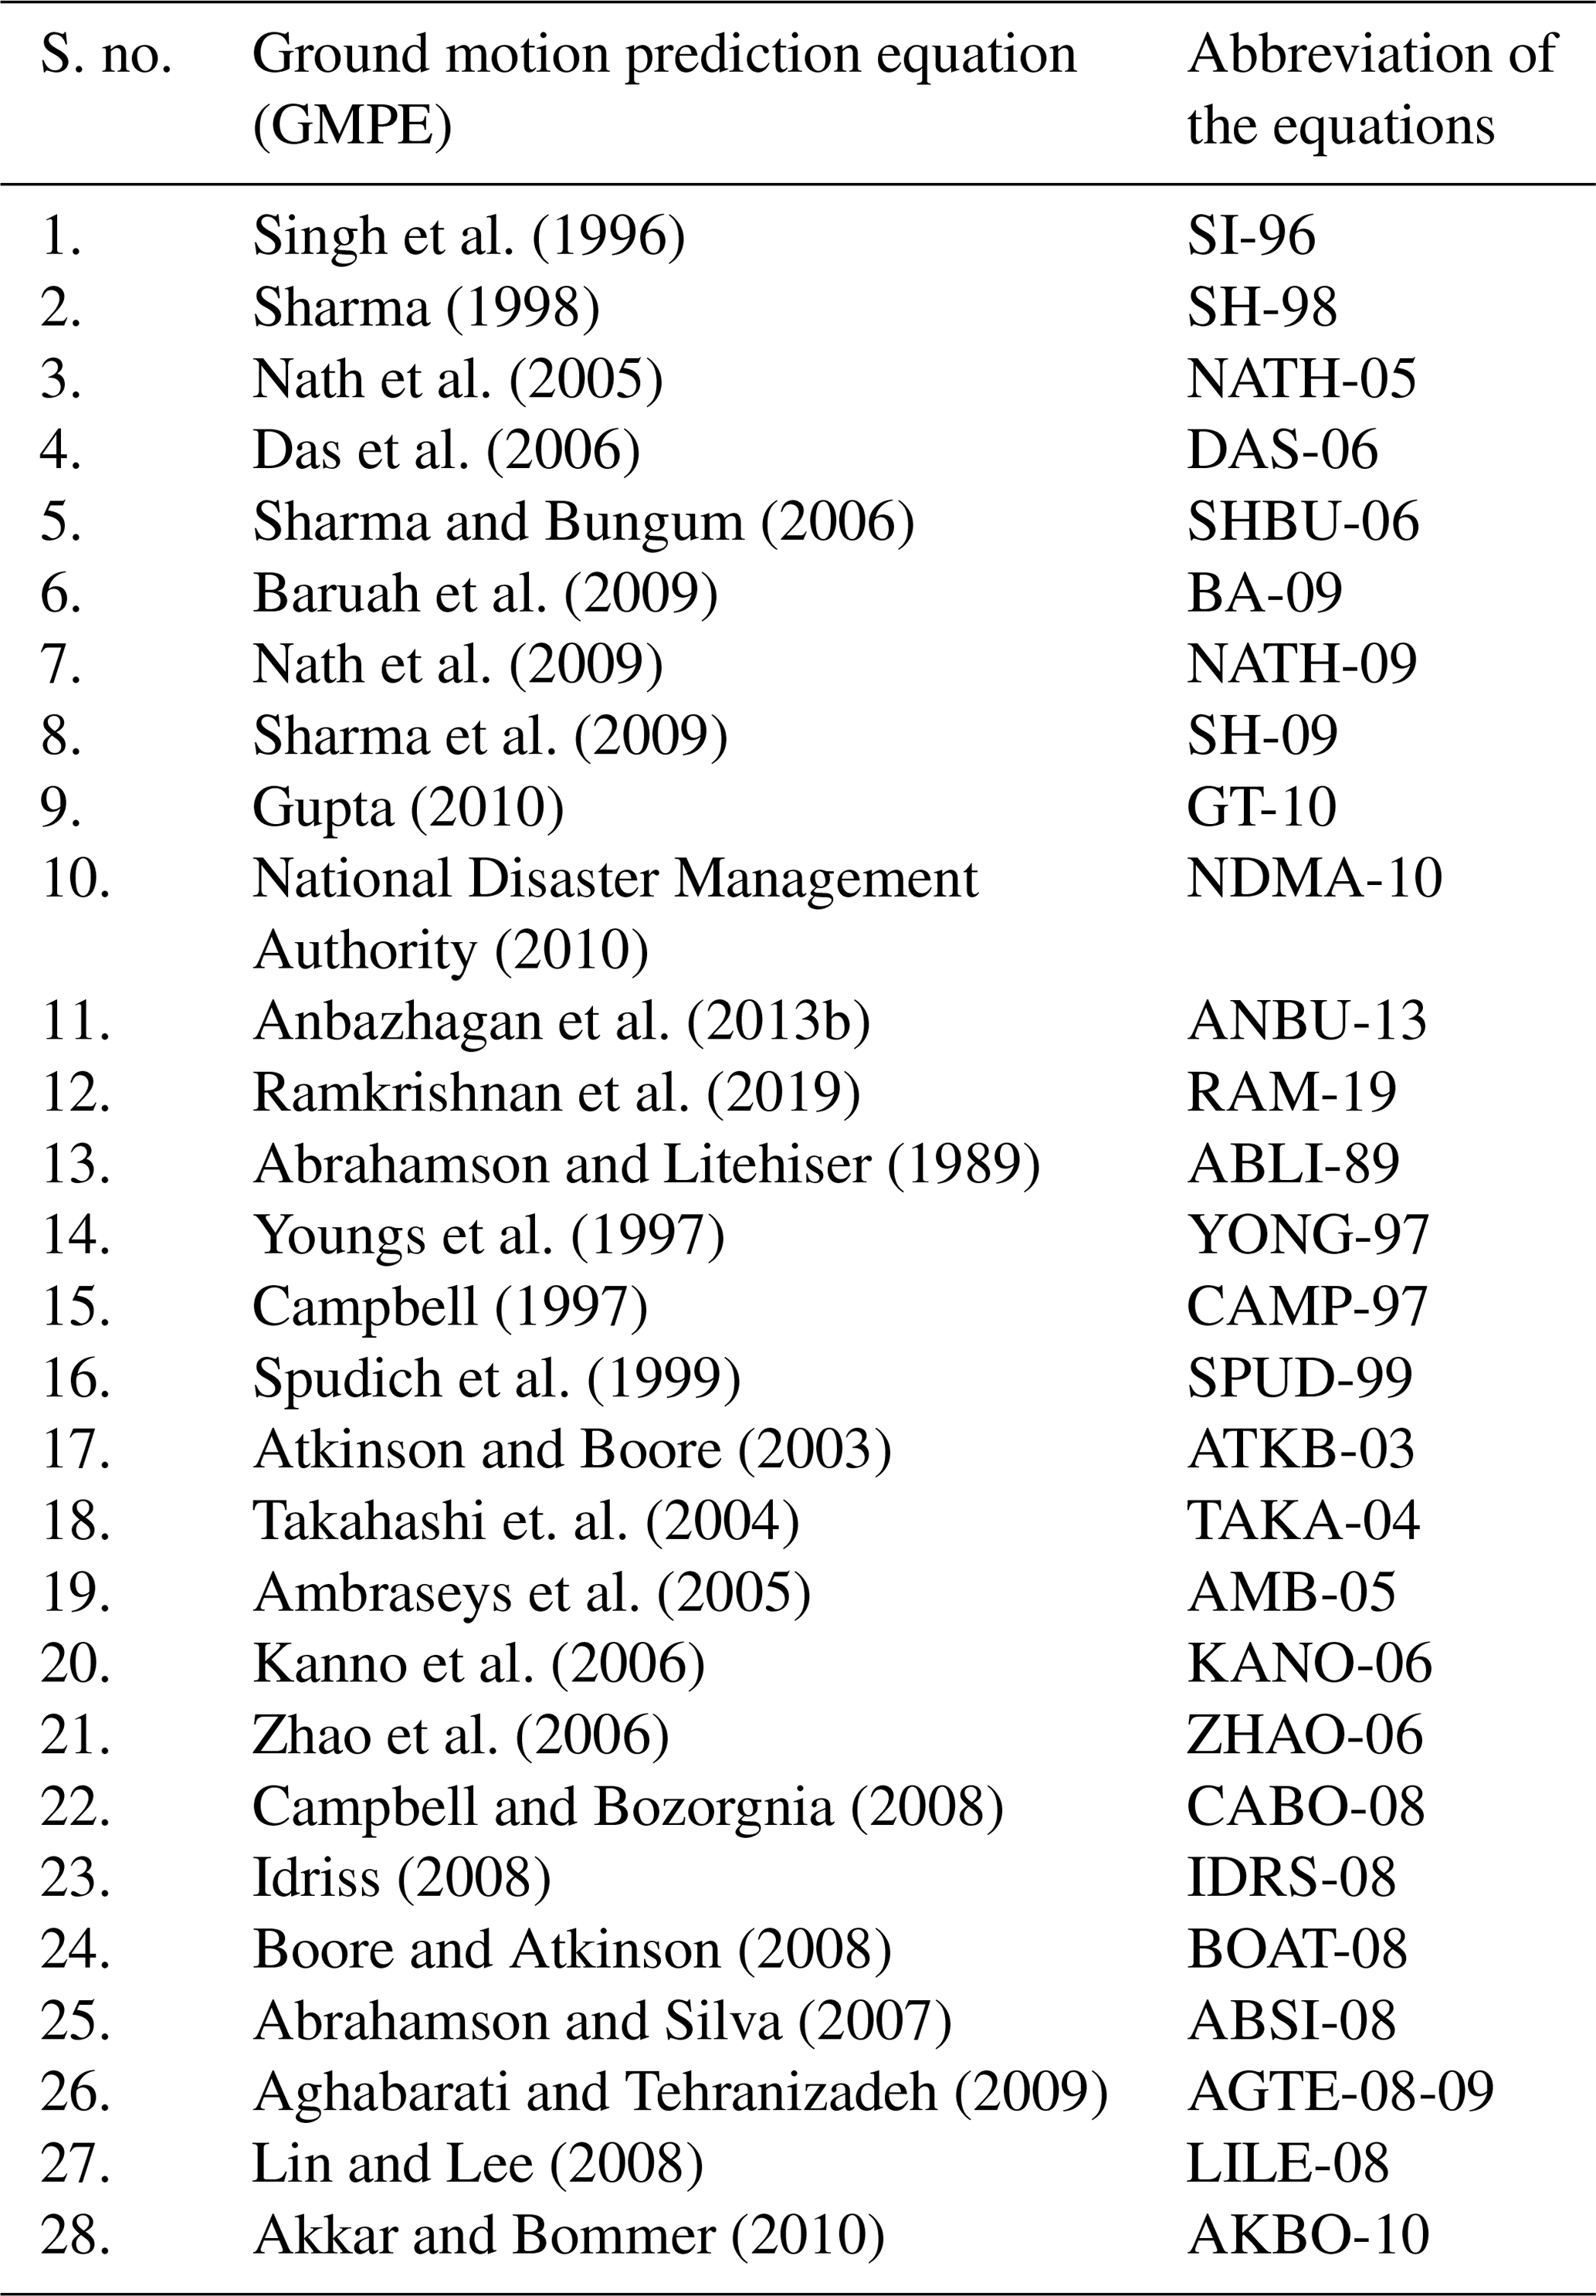
Table 3Segmented ranking of GMPEs for the Patna region. Positive DSI values for the Patna earthquake are marked as bold.
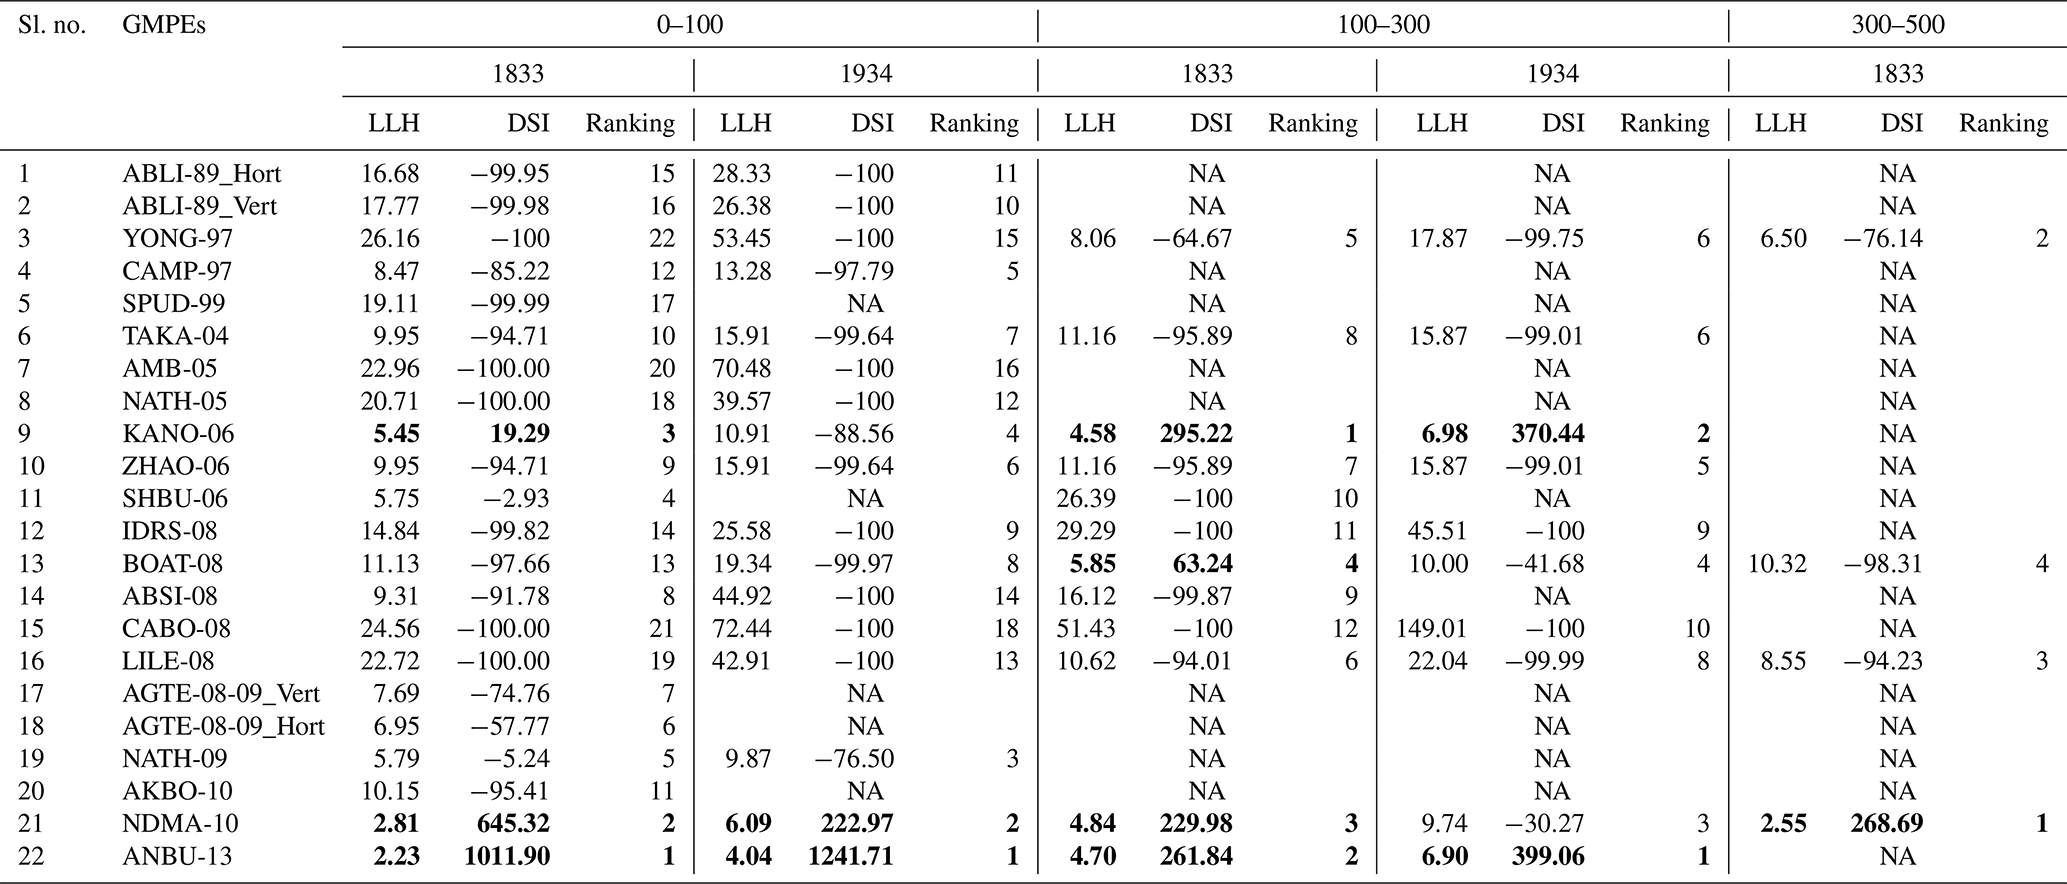
NA: not available.
Various researchers have delineated the seismic source for various parts of India. Considering tectonic features and past earthquake events, Gupta (2006) delineated the seismic sources for India. Kiran et al. (2008) and NDMA (2010) have done the same on the basis of the seismicity parameters. Furthermore, Nath and Thingbaijam (2011) have delineated based on focal mechanism data from the Global Centroid Moment Tensor database. Kolathayar and Sitharam (2012) identified and delineated India into 104 seismic zones based on similar seismicity characteristics. Vipin and Sitharam (2013) determined the seismic sources on the peninsula considering the seismicity parameters. In the present study, delineation of the seismic sources has been performed based on the seismicity parameters, viz. a, b, and magnitude of completeness (Mc). For delineation of different zones, Patna SSA has been divided into a grid size of and from the centre of each grid a radius of 500 km is considered. The number of earthquake events within 500 km of each radius were considered to determine the seismicity parameters. The reason for selection of a 500 km radius was discussed above and given in detail in Anbazhagan et al. (2015a, 2013a). Considering the seismicity parameters (a value, b value, and Mc), the whole study area has been divided into seven areal seismic zones and shown in Fig. 3 (variation in only b value is shown in background). These seven zones are considered areal seismic sources as these are spread over a large area. The seismicity parameter has been calculated for each of these zones considering the frequency magnitude distribution (FMD) at the 90 % confidence level. Mmax for each seismic zone has been calculated as per the method discussed earlier. The average values of a, b, Mc, and Mmax have been given in Table 4.
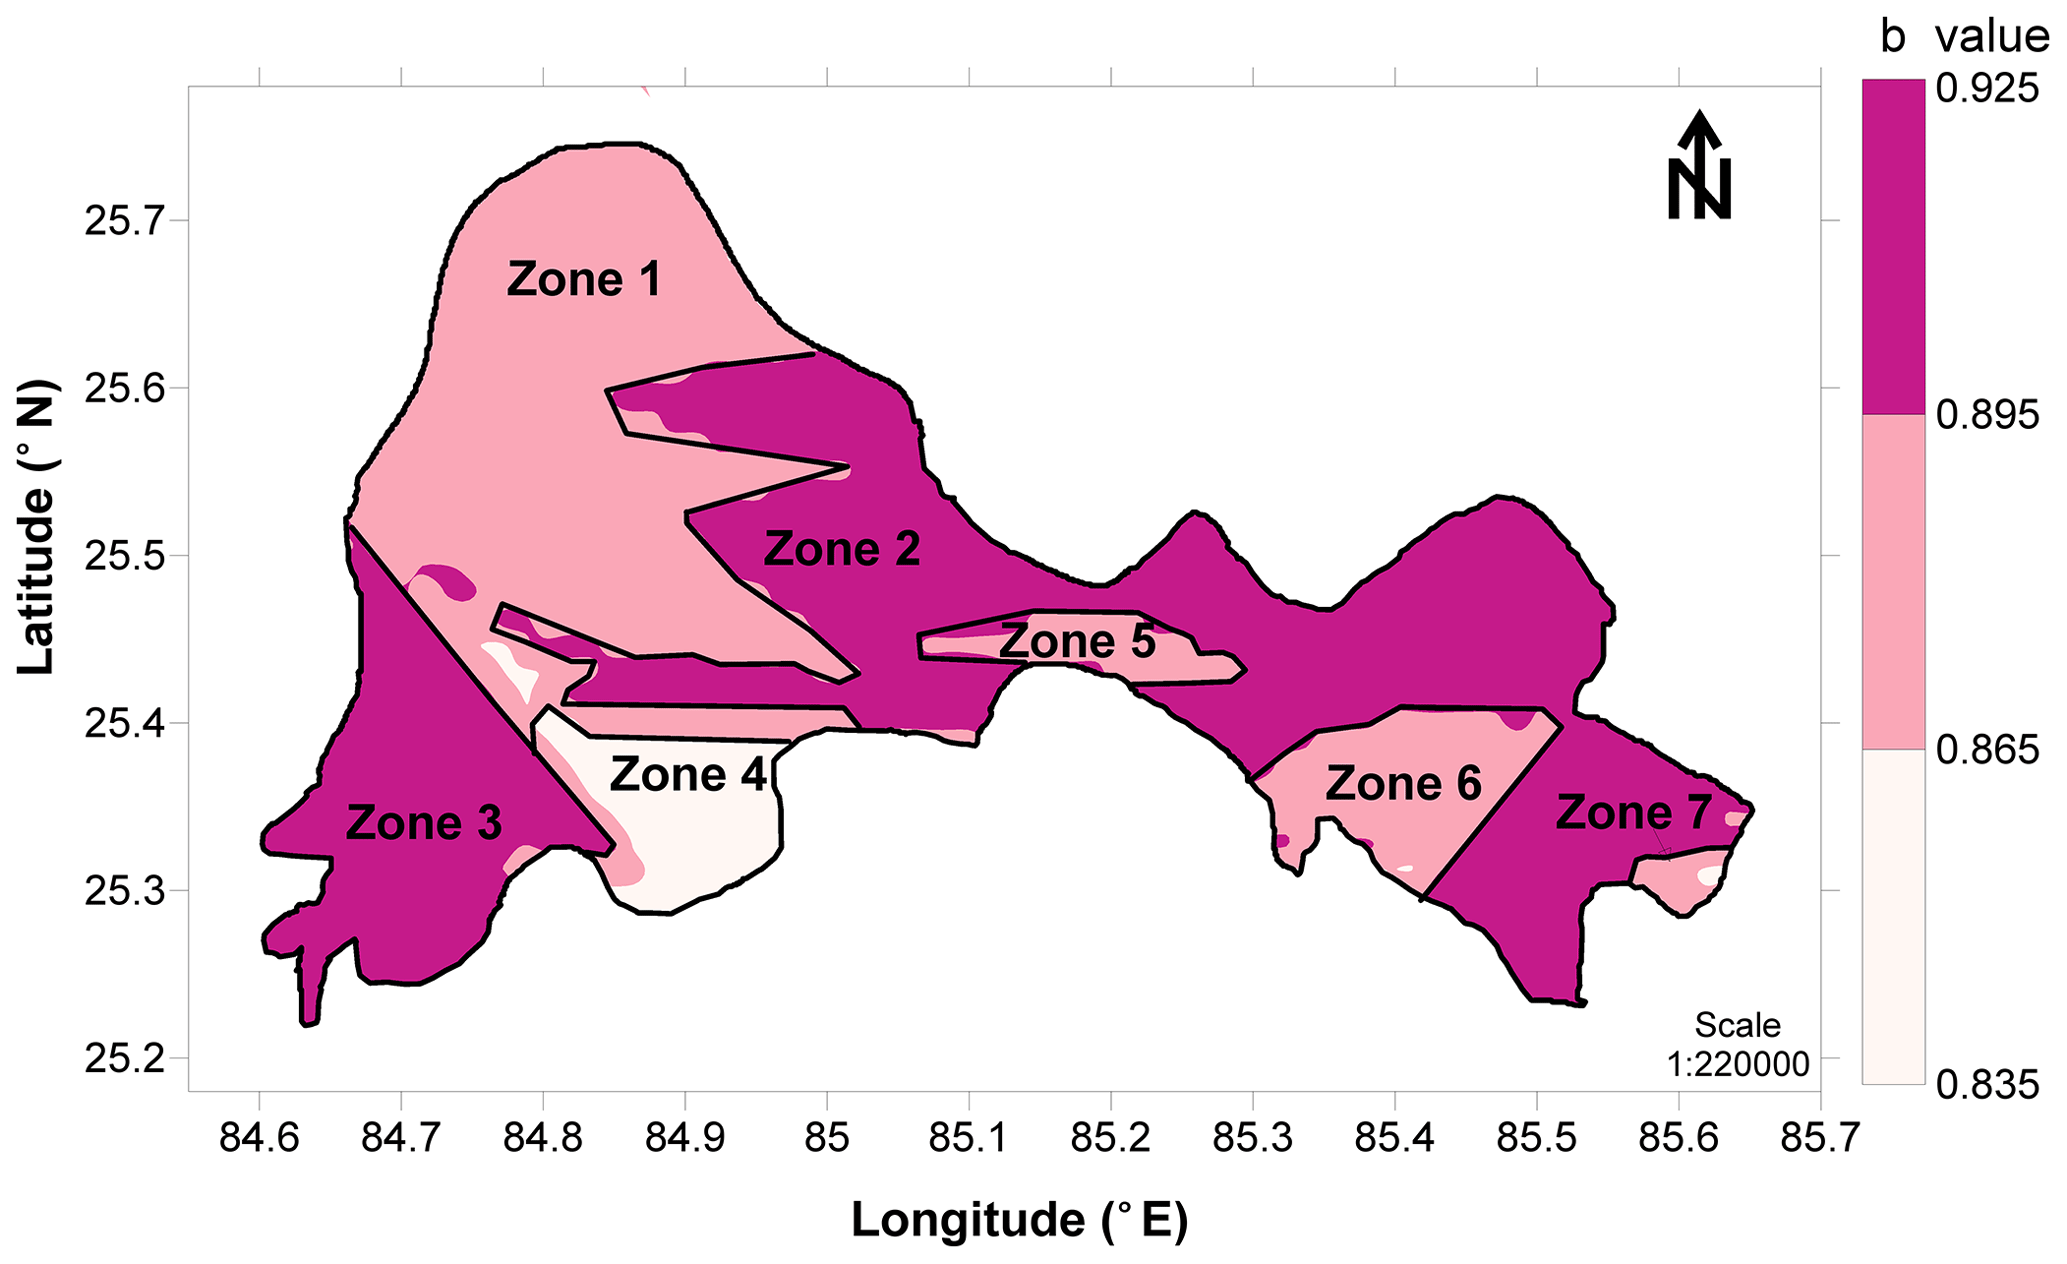
Figure 3New seismic source zones identified for Patna based on seismicity parameters (variation in b value is shown in background).
Table 4Seismic parameters for adopted source models (uncertainties with bootstrapping).
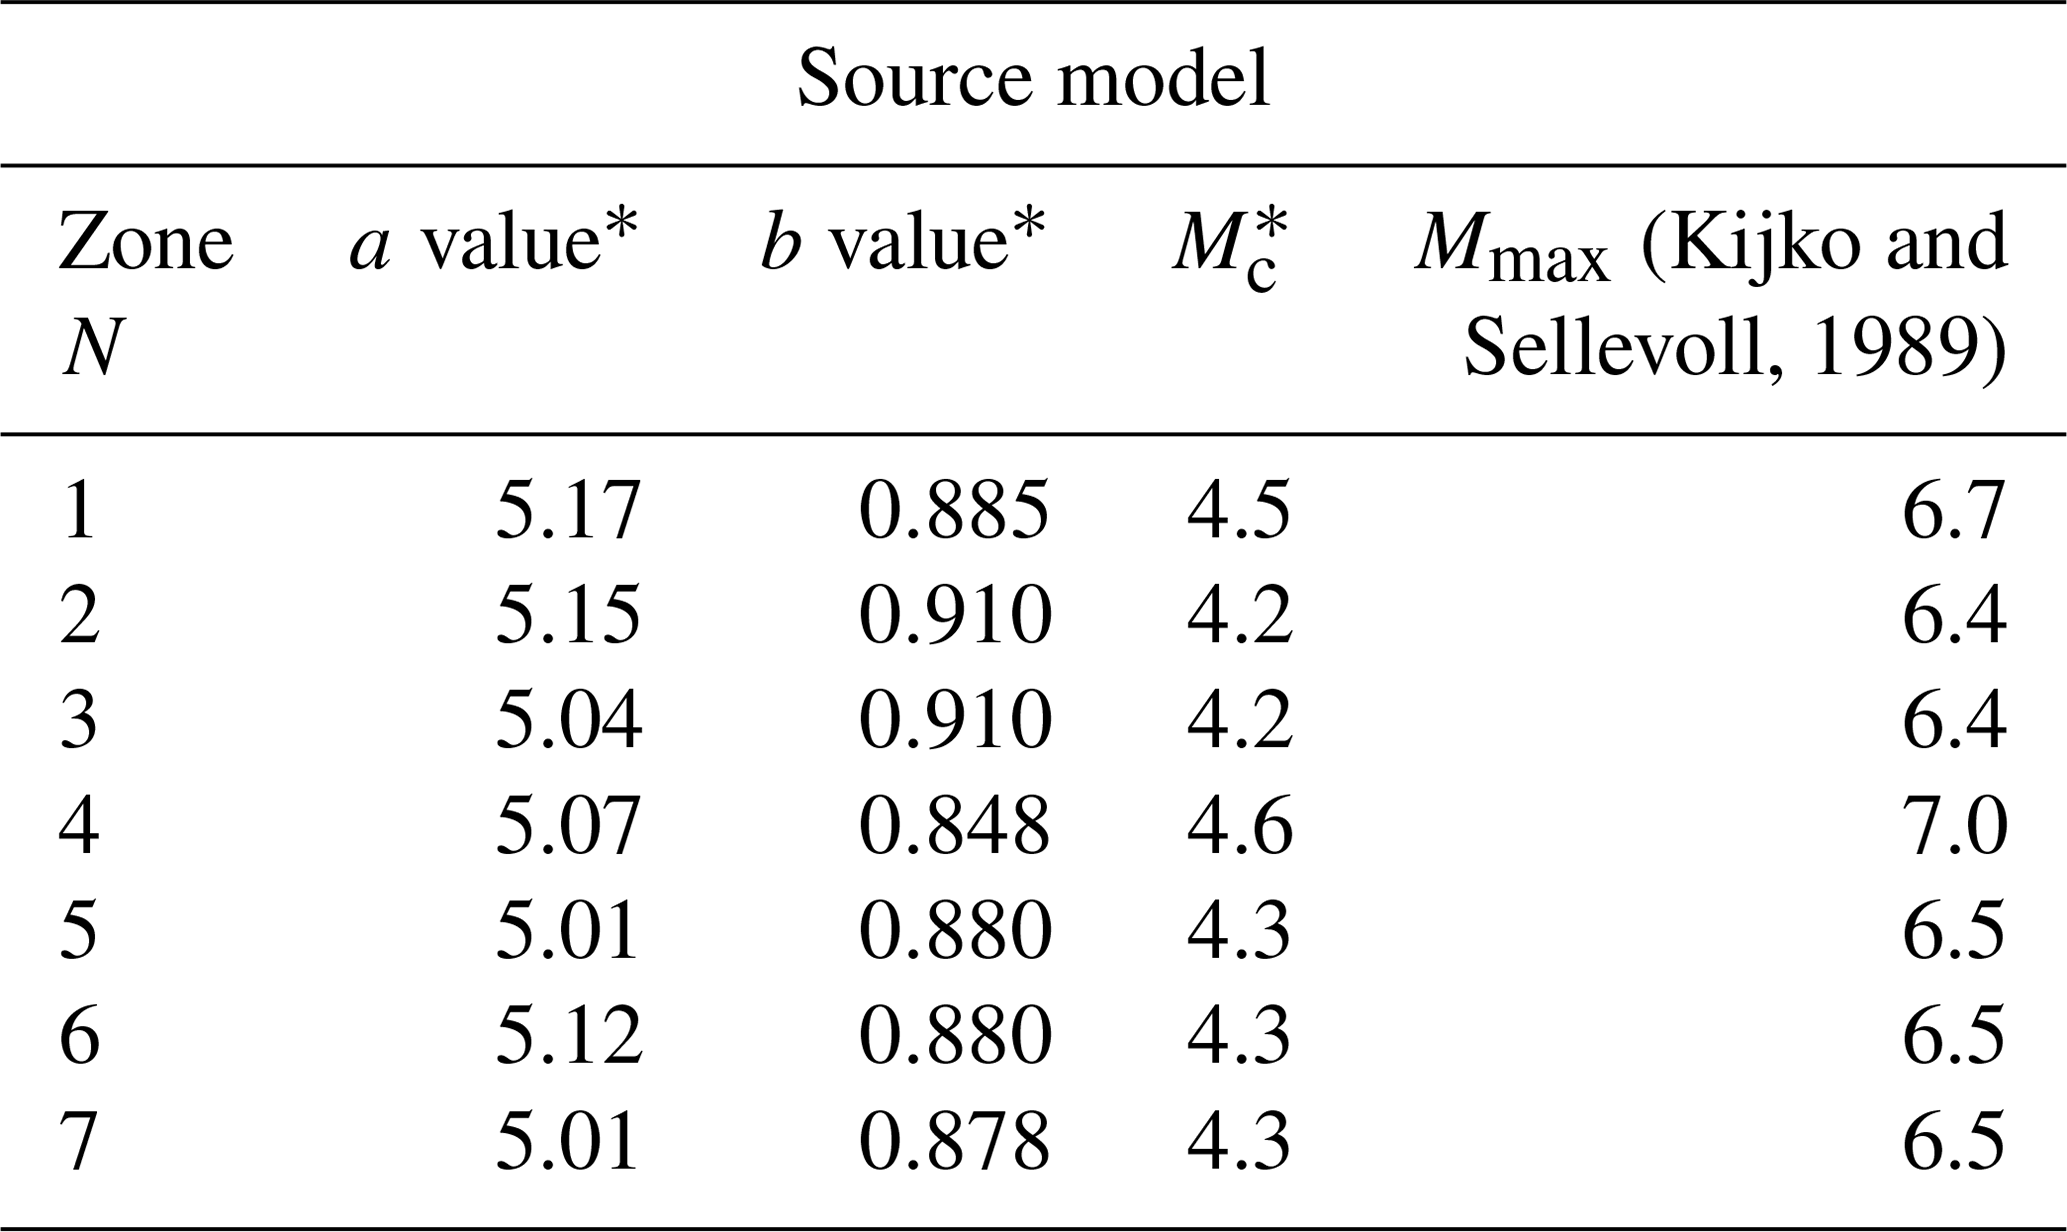
∗ Average value of seismicity parameters.
For spatial smoothening of the seismic source model, a grid size of along longitude and latitude was selected for representing different kinds of seismic sources and to count the number of earthquakes with magnitude less than or equal to Mc for each grid. To account for the seismicity of the Patna SSA, the maximum likelihood estimates of 10a for that grid cell have been determined, which correspond to the number of earthquakes per year. Using a maximum likelihood estimate of 10a, the recurrence rate for different magnitude intervals has been estimated using an algorithm recommended by McGuire and Arabasz (1990). The value 10a for each grid has been smoothed by applying a Gaussian function, given as Eq. (1), to find the final modified values corresponding to each grid. This smoothing is made to account for the uncertainty related to the location of earthquake events.
where nj is the number of earthquakes in the jth grid, is the smoothed number of earthquakes in the ith cell, c is the correlation distance to account for the location uncertainties, and Δij is the distance between the ith and the jth cells. The sum taken over the jth cell should be within the distance of 3c of the ith cell.
Probability of exceedance of a ground motion for a spectral period can be determined once the probability of its size, location, and level of ground shaking are identified cumulatively. Seismic hazard map for the Patna district has been developed by applying probabilistic methods, namely the classical method proposed by Cornell (1968), which was later improved by Algermissen et al. (1982), and smoothed–gridded seismicity models (Frankel, 1995).
A tool of 178 seismic sources (shown in Fig. 1 and given as Table ET1) have been used for determining the probability of occurrence of a specific magnitude, probability of hypocentral distance and probability of ground motion exceeding a specific value as per Cornell (1968). Probability of rupture to occur at different hypocentral distances has been determined as per Kiureghian and Ang (1977). The condition probability of exceedance for GMPEs was determined using a lognormal distribution as given by EM-1110 (1999). The ground motion at a site for a known probability of exceedance in a desired period has been calculated by amalgamating all the above probabilities. As a result of PSHA, the hazard curve is determined and shows the variation in PGA or SA with the frequency of exceedance of the different levels of seismic ground motion. A detailed explanation is given in Anbazhagan et al. (2015a). The deaggregation based on the principle of superposition proposed by Iyenger and Ghosh (2004) has been used. The probability of exceedance of ground motion for each seismic source has been computed by merging these uncertainties. Detailed discussion on the methodology of PSHA can be found in Anbazhagan et al. (2009).
It can be noted that in the SSA, the northwest and central parts of Patna are not fully covered by well-identified seismic sources and many sources given in the Fig. 1 are not well studied to prove its seismic activity. Moreover, there are many places where the linear source has not been identified. Thus, to overcome the limitation, a zoneless approach proposed by Frankel (1995) has been used for developing the PSHA map for Patna SSA. This method accounts for the spatial smoothing of historic seismicity to directly calculate the probabilistic hazard. The annual rate of exceedance for a given ground acceleration level is given by Eq. (2):
where d and i are indices for distance and magnitude bins. Nd is the total of values over a given hypocentral distance increment (calculated using Eq. 1), ) will give the probability that a PGA of Z will exceed z when an earthquake of magnitude Mi occurs at a distance of Dd, and T is the time in years of earthquake catalogue used to determine Nd. The probability that a PGA of Z will exceed z can be determined using EM-1110 (1999). The hazard map has been determined by the four models proposed by Frankel (1995). Model 1, model 2, and model 3 are used for a magnitude less than 7; however model 4 can be used for a magnitude greater than 7. In model 1, the earthquake events having Mw between 3 and 5 are assumed to illuminate areas of faulting which can produce destructive events. Model 2 also ensures that the hazard map reflects the local historic rate of magnitude moment of 5 and larger events. As this model cannot explain the cause of major earthquakes in the active region with certainty, it is prudent to address the possibility of near repeats, i.e. within about 100 km of a historic moderate earthquake. Model 3 is based on a uniform source zone encompassing the active seismicity zone, which is opposite to model 2. Model 4 is associated with hazard from the larger events that is Mw>7. As these events are less in the active seismic region and limited to a few areas only, sources associated with them have been considered for determining hazard. These models are shown in Fig. 4, which is used for the development of the PSHA map using the method proposed by Frankel (1995).

Figure 4Four models used in the development of the PSHA map of Patna based on the zoneless approach.
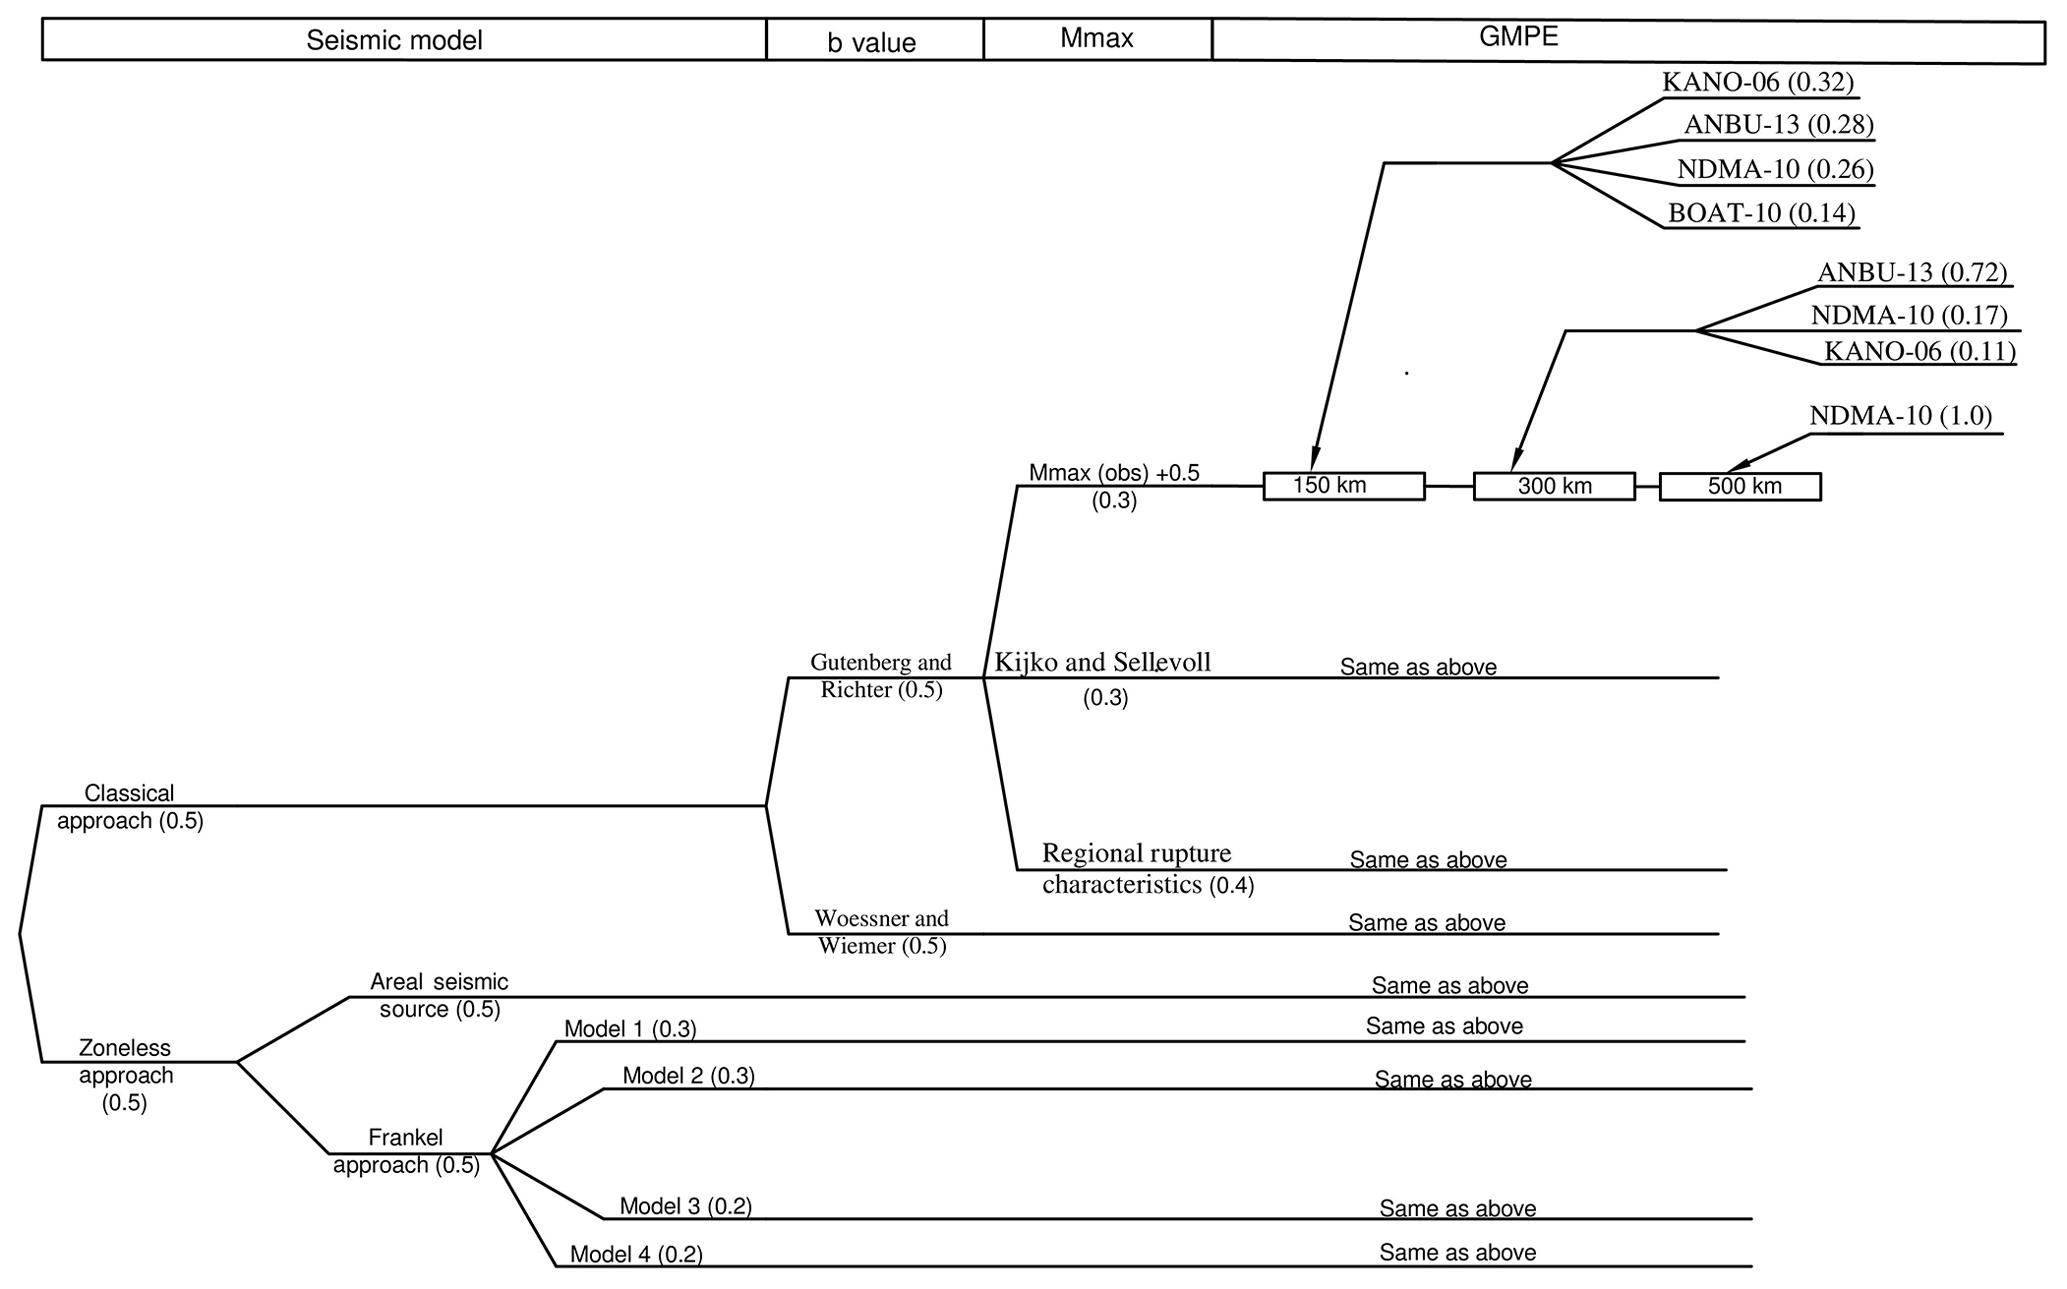
Seismic hazard can be assessed more practically using a logic tree (Kulkarni et al., 1984) as it includes the accounted for epistemic errors, components of seismic models, and ground motion predictions (Fig. 5). For determining the consistent model with different degrees of confidence, each branch of logic tree is to be investigated for implementing the uncertainties in probability models. Important consideration has been given to each branch of logic tree by incorporating the weights for assessing the final hazard of the Patna district. After declustering the catalogue and developing the seismotectonic map, two models have been used with an equal weight of 50 % for both the classical and zoneless approaches. The zoneless approach has been further divided into the areal approach and Frankel approach of equal weight of 50 % each. For the Frankel approach, SSA has been considered for four models (discussed above) with weight factors of 30 %, 30 %, 20 %, and 20 % for model 1, model 2, model 3, and model 4 respectively. These weights have been adopted based on the reliability of the source model. Larger weights are assigned to model 1 and model 2 because they are based on more reliable data and assumedly have better representation of seismicity of SSA. Model 3 deals with the weak assumption that earthquakes with magnitude 3.0–7.0 are equally probable everywhere in Patna SSA whereas there is a great uncertainty in the data used for model 4. In addition, b values were calculated for each of the models using Gutenberg and Richter (1956) and Woessner and Wiemer (2005) (using the entire magnitude range method) by assigning an equal weight factor of 0.5. Furthermore, Mmax has been calculated using three methods, namely increment to , Kijko and Sellevoll (1989), and regional rupture characteristics with weight factors of 30 %, 30 %, and 40 % respectively for each model as shown in Fig. 5. Segmented-based analysis of GMPE was performed and weight was assigned to each GMPE based on the efficacy test. Based on the above discussion, a final hazard map for Patna SSA has been produced for 2 % and 10 % probability of exceedance in 50 years.
8.1 Classical approach (Cornell, 1968)
For determining the hazard value, a different weight has been considered with respect to b value, maximum magnitude and GMPE (see Fig. 5). The seismic hazard using the classical approach (Cornell, 1968) has been estimated using 178 seismic sources. SSA is divided into 1725 grids of size . The whole procedure can be referred to in Anbazhagan et al. (2015a). Hazard curves from the 10 most venerable sources are given as Fig. 6a and S60 is determined as the most reliable for the Patna district (7.5 Mw and hypocentral distance 55.11 km). Figure 6b shows a cumulative hazard curve obtained at the Patna district centre for 0, 0.05, 0.1, 0.2, 0.3, 0.4, 0.6, 0.8, 1.0, 1.6, and 2 s. It can be observed from Fig. 6b that the frequency of exceedance for 0.075 g at 0 s is 0.001, which will give the return period of 834 years. This indicates that PGA of 0.075 g has 5.03 % probability of exceedance in 50 years at Patna. Further explanation can be referred to in Anbazhagan et al. (2015a). The mean deaggregation plot for Patna for return periods of 2475 and 475 years is given as Fig. 7a and b. PGA for 6.0 Mw at 40 km hypocentral distance is notable for 2 % probability of exceedance at 50 years. Likewise, for 10 % probability of exceedance at 50 years the motion for 5.5 Mw at 50 km hypocentral distance contributes most. Hazard curves have been generated at each grid for Patna, and the level of ground motion for ν(z) can be estimated from it. Figure 8a and b show the PSHA maps for Patna district for return periods of 2475 and 475 years respectively. PGA varies from 0.35 g in the northwestern and 0.43 g in the northeastern peripheries to 0.08 g towards the central part (see Fig. 8a). Similarly, the PGA value at the northeastern periphery is 5.3 times more than in the central part of Patna considering 10 % probability in 50 years (see Fig. 8b). These results are similar to those of the previous study carried out by Anbazhagan et al. (2015a).
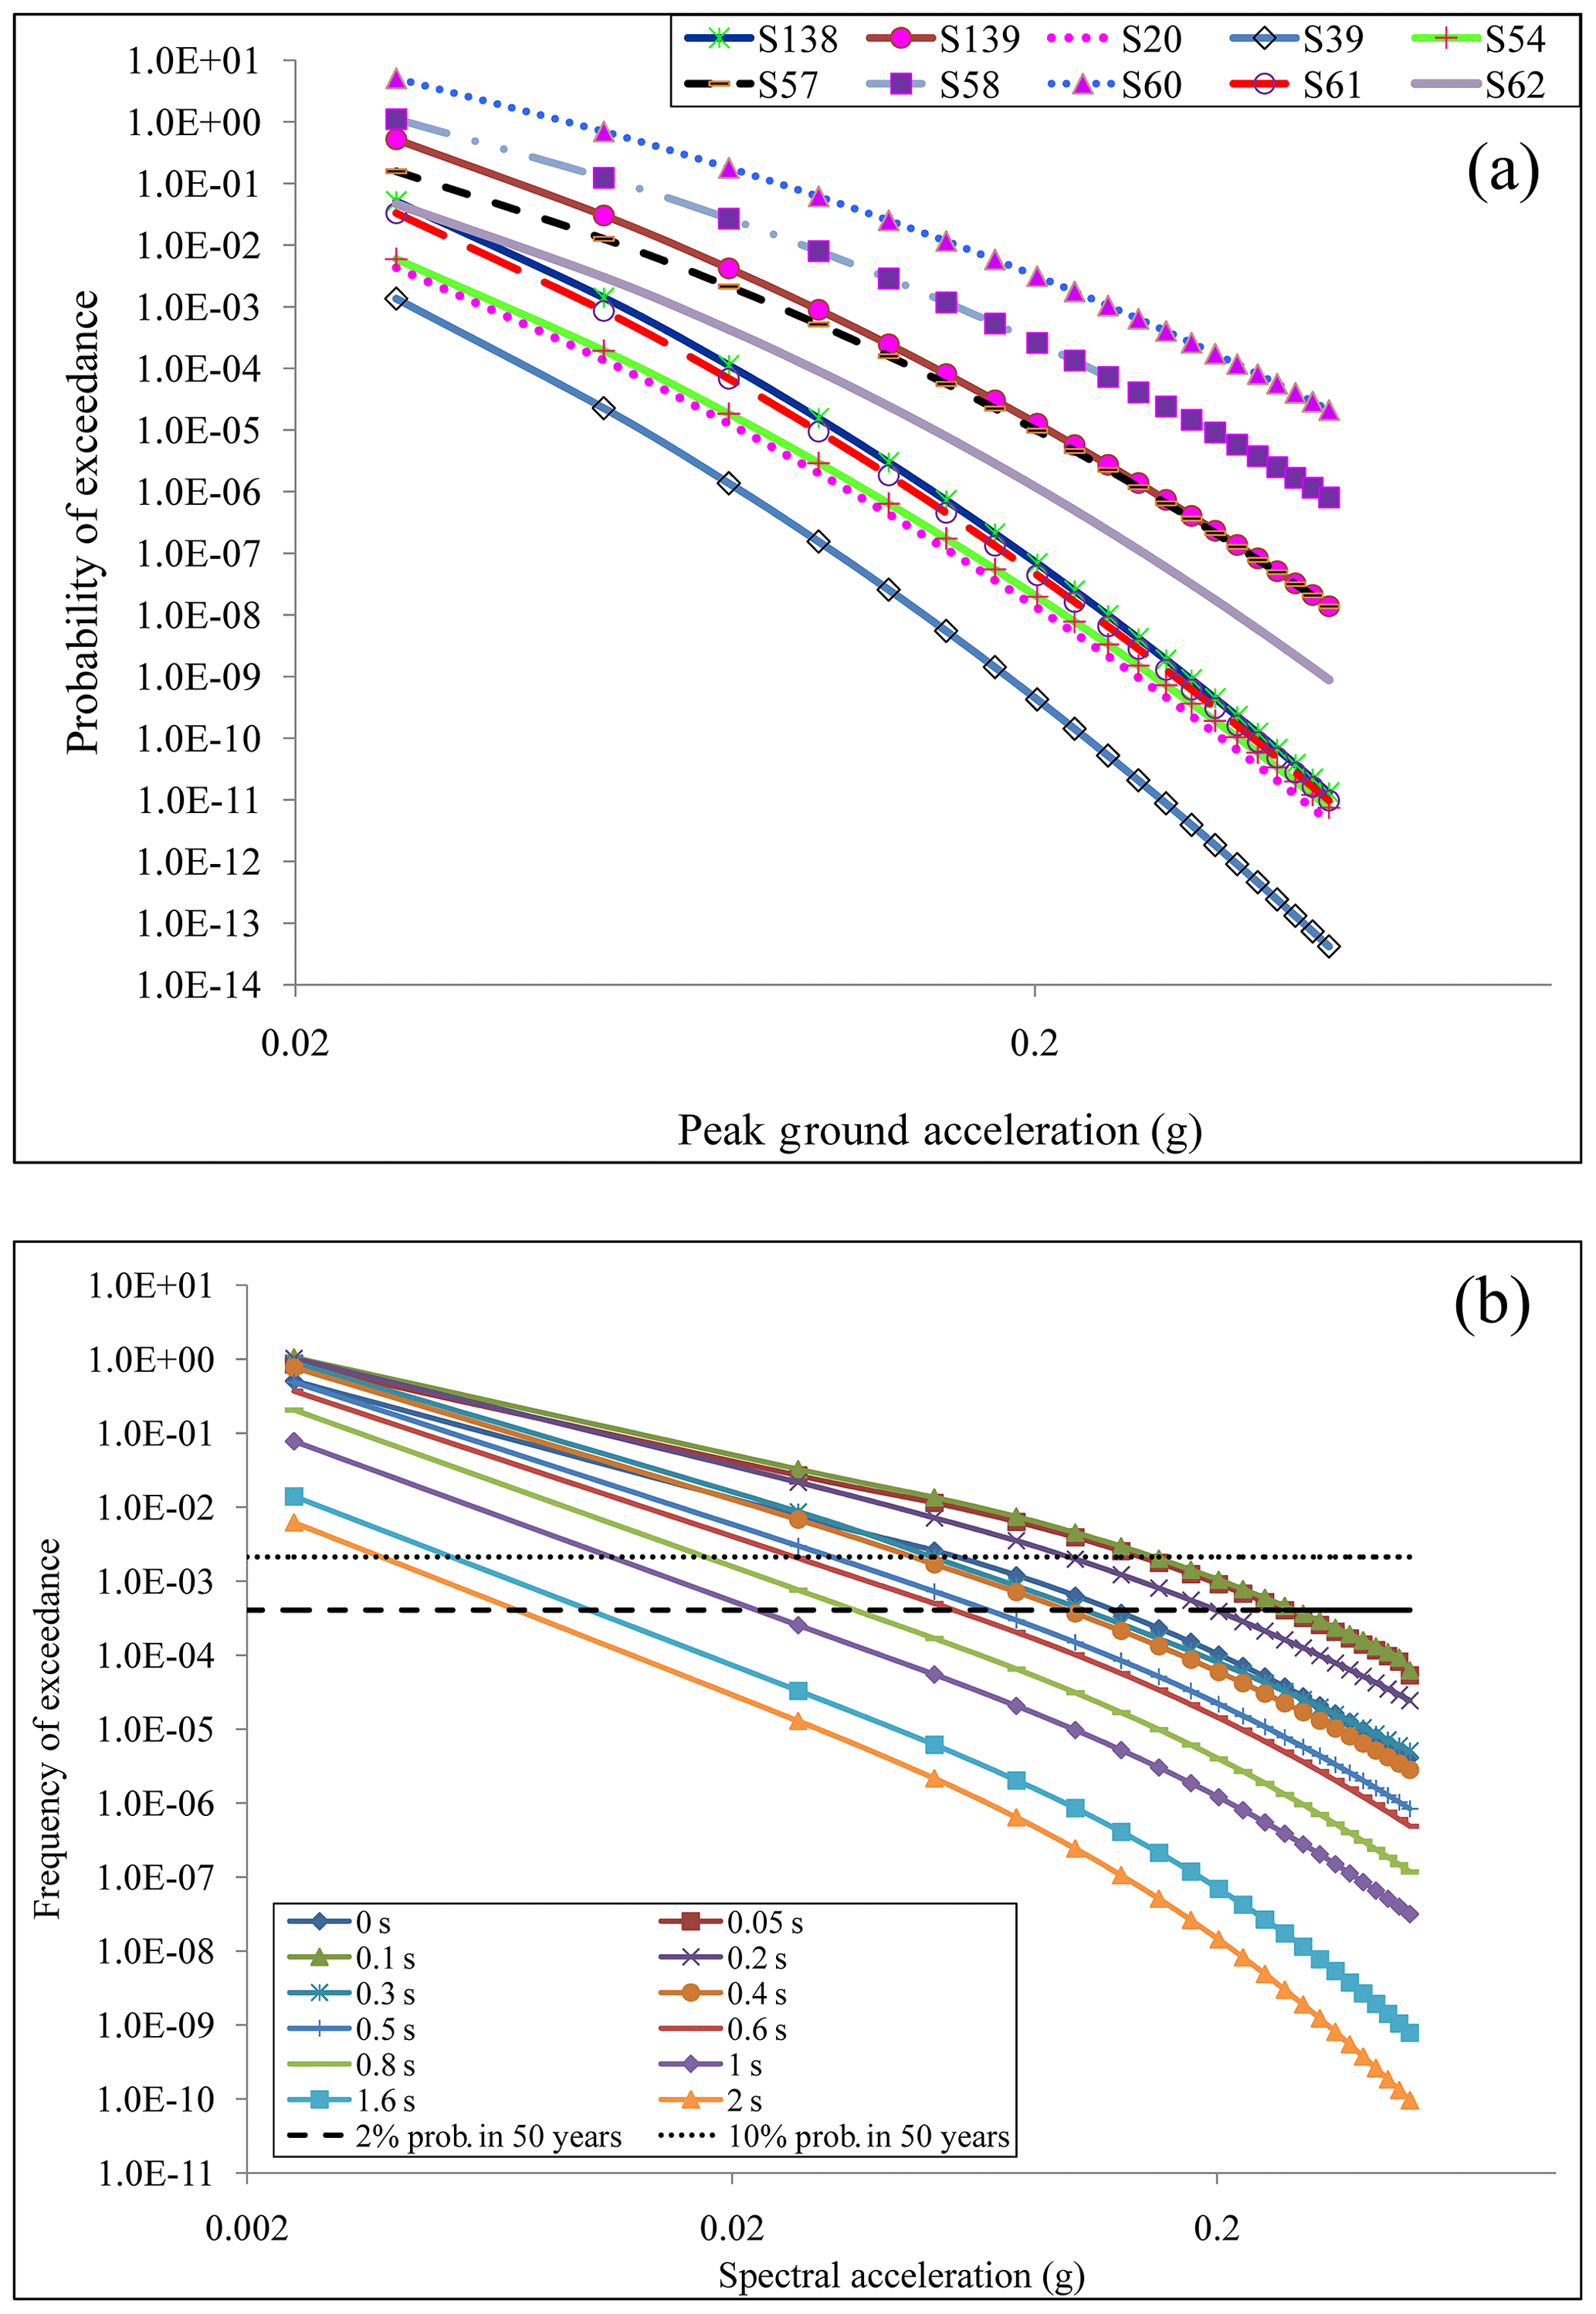
Figure 6(a) Hazard curve for 10 most contributing seismic sources at Patna city centre. (b) Hazard curve at Patna district centre for different periods using the classical approach.

Figure 7(a) Deaggregation of hazard value at Patna at bedrock at PGA for 2 % probability of exceedance in 50 years using the classical approach. (b) Deaggregation of hazard value at Patna at bedrock at PGA for 10 % probability of exceedance in 50 years with the classical approach.
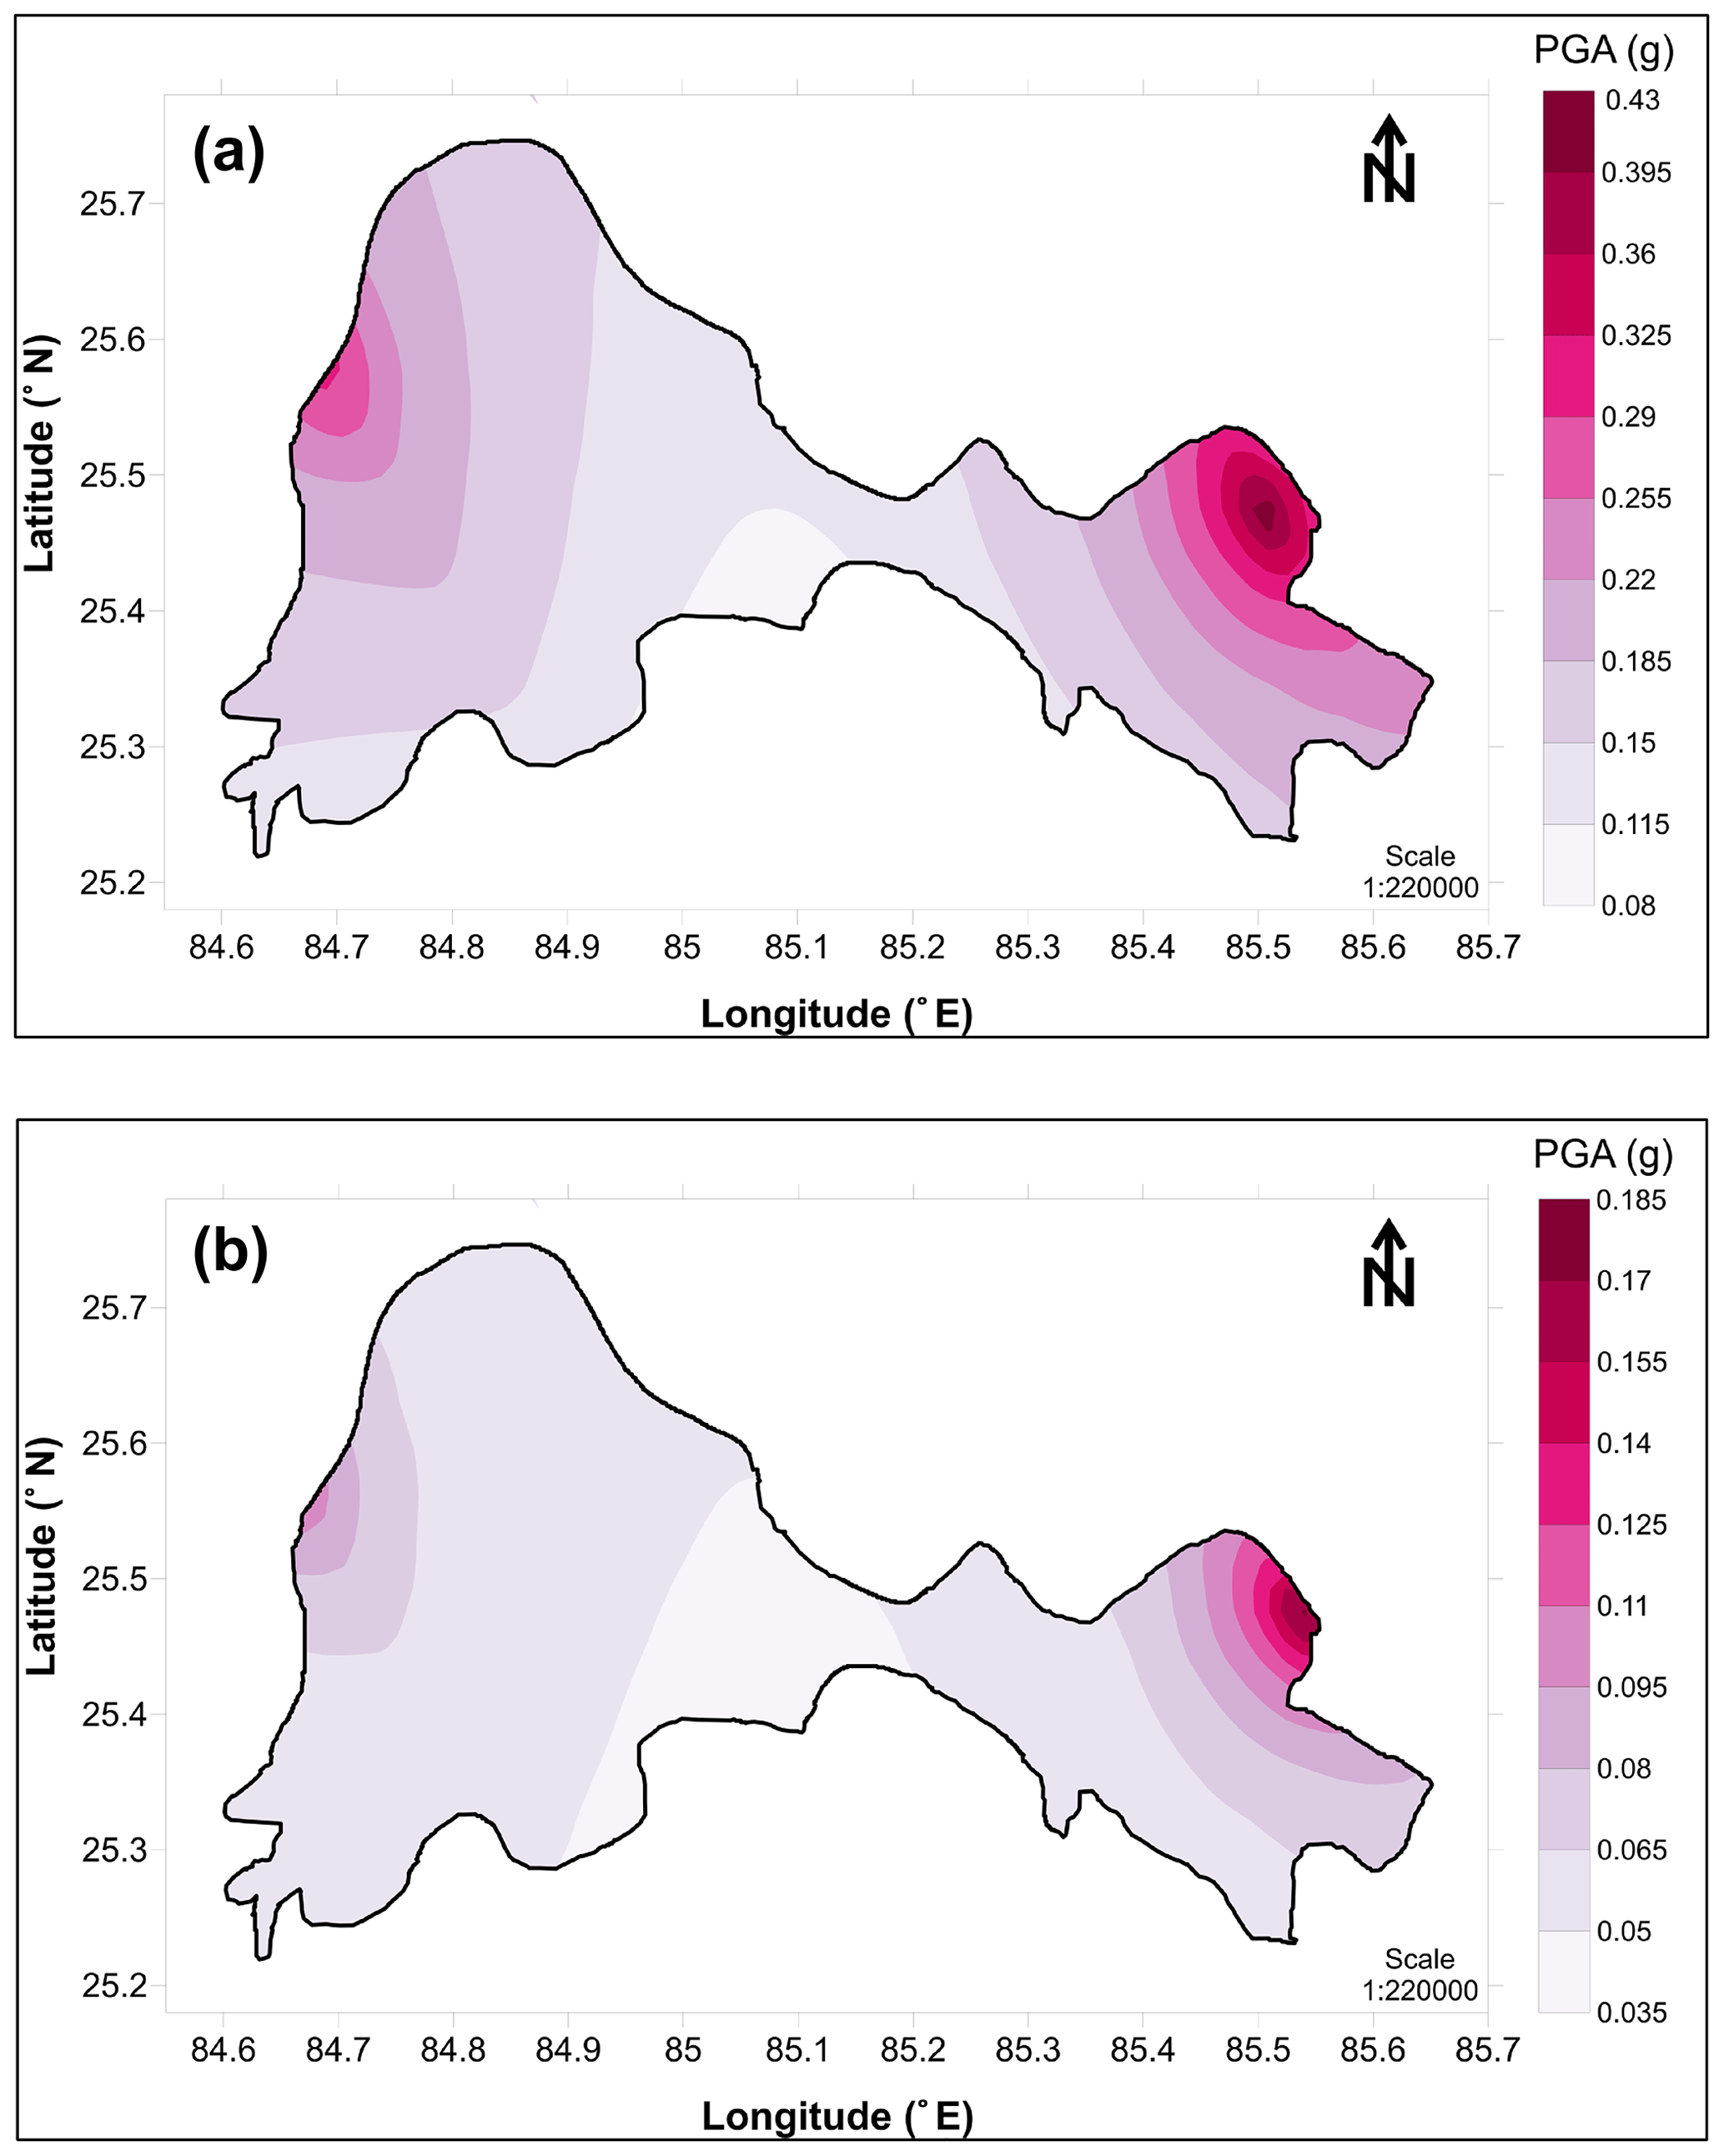
Figure 8(a) PSHA map for Patna urban centre for 2 % probability of exceedance in 50 years using the classical approach. (b) PSHA map for Patna urban centre for 10 % probability of exceedance in 50 years using the classical approach.
8.2 Zoneless approach
Likewise, in classical approaches, epistemic uncertainty has been considered and weight factors are considered as shown in Fig. 5. The PGA map of Patna has been developed using the zoneless approach by dividing it into seven areal zones based on seismicity parameters (Fig. 3), similar to Kolathayar and Sitharam (2012) and Vipin and Sitharam (2013). For the development of the PSHA map using a simplified areal zonal model, the seven zones along with the seismic parameters (Fig. 3 and Table 4) are used. These seven areal seismic sources are smoothed using the smoothed historic seismicity approach recommended by Frankel (1995). For development of the seismic hazard map, each zone is considered to be of seismic source with a constant seismicity value. The activity rate was calculated for each zone and it was obtained by counting the earthquakes having magnitude greater than or equal to Mc (Table 4) for the whole earthquake catalogue using MATLAB. The calculated activity rate was then spatially smoothed according to Eq. (1), and the chosen correlation distance c=50 km. The annual rate of exceedance at the centre of each grid for the seven zones has been calculated using Eq. (2). The cumulative hazard curves for different periods at the Patna district centre are given as Fig. S2. At the zero period, frequency of exceedance for 0.075 g is 0.012 and estimated return period is 84 years, which means 0.075 g has 44.96 % probability of exceedance in 50 years. Similarly, for 0.5 g, the return period is 24.4 thousand years and probability of exceedance is % in 50 years at the Patna district centre. As the period of interest rises from 0 s to 0.8 seconds, a huge change in return period has been noticed (see Fig. S2, submitted as Supplement). Primarily the return period decreases from 84 years at zero periods to 13 years at 1.0 s, which has further increased to 28 years at 0.2 s and again to 1.97×10⁵ years for 2 s. The mean deaggregation plot for Patna SSA for return periods of 2745 and 475 years is given as Fig. S3a and b. Figure S3a shows that the motion for 6.0 Mw at 15 km hypocentral distance is dominant for 2 % probability of exceedance at 50 years. It changed to 5.75 Mw at 20 km hypocentral distance for 10 % probability of exceedance at 50 years. Figure 9a and b are the PSHA maps for the Patna urban centre for 2 % and 10 % probabilities of exceedance in 50 years respectively considering the zoneless approach. PGA varies from 0.41 g in the southeastern periphery to 0.34 g towards the central part (See Fig. 9a). However, the southwest part of the district encounters PGA of 1.4 times that of the northwest part of the district. Similar PGA in the southwest part increases 1.57-fold compared to the northwestern part while considering 10 % probability of exceedance in 50 years (Fig. 9b).
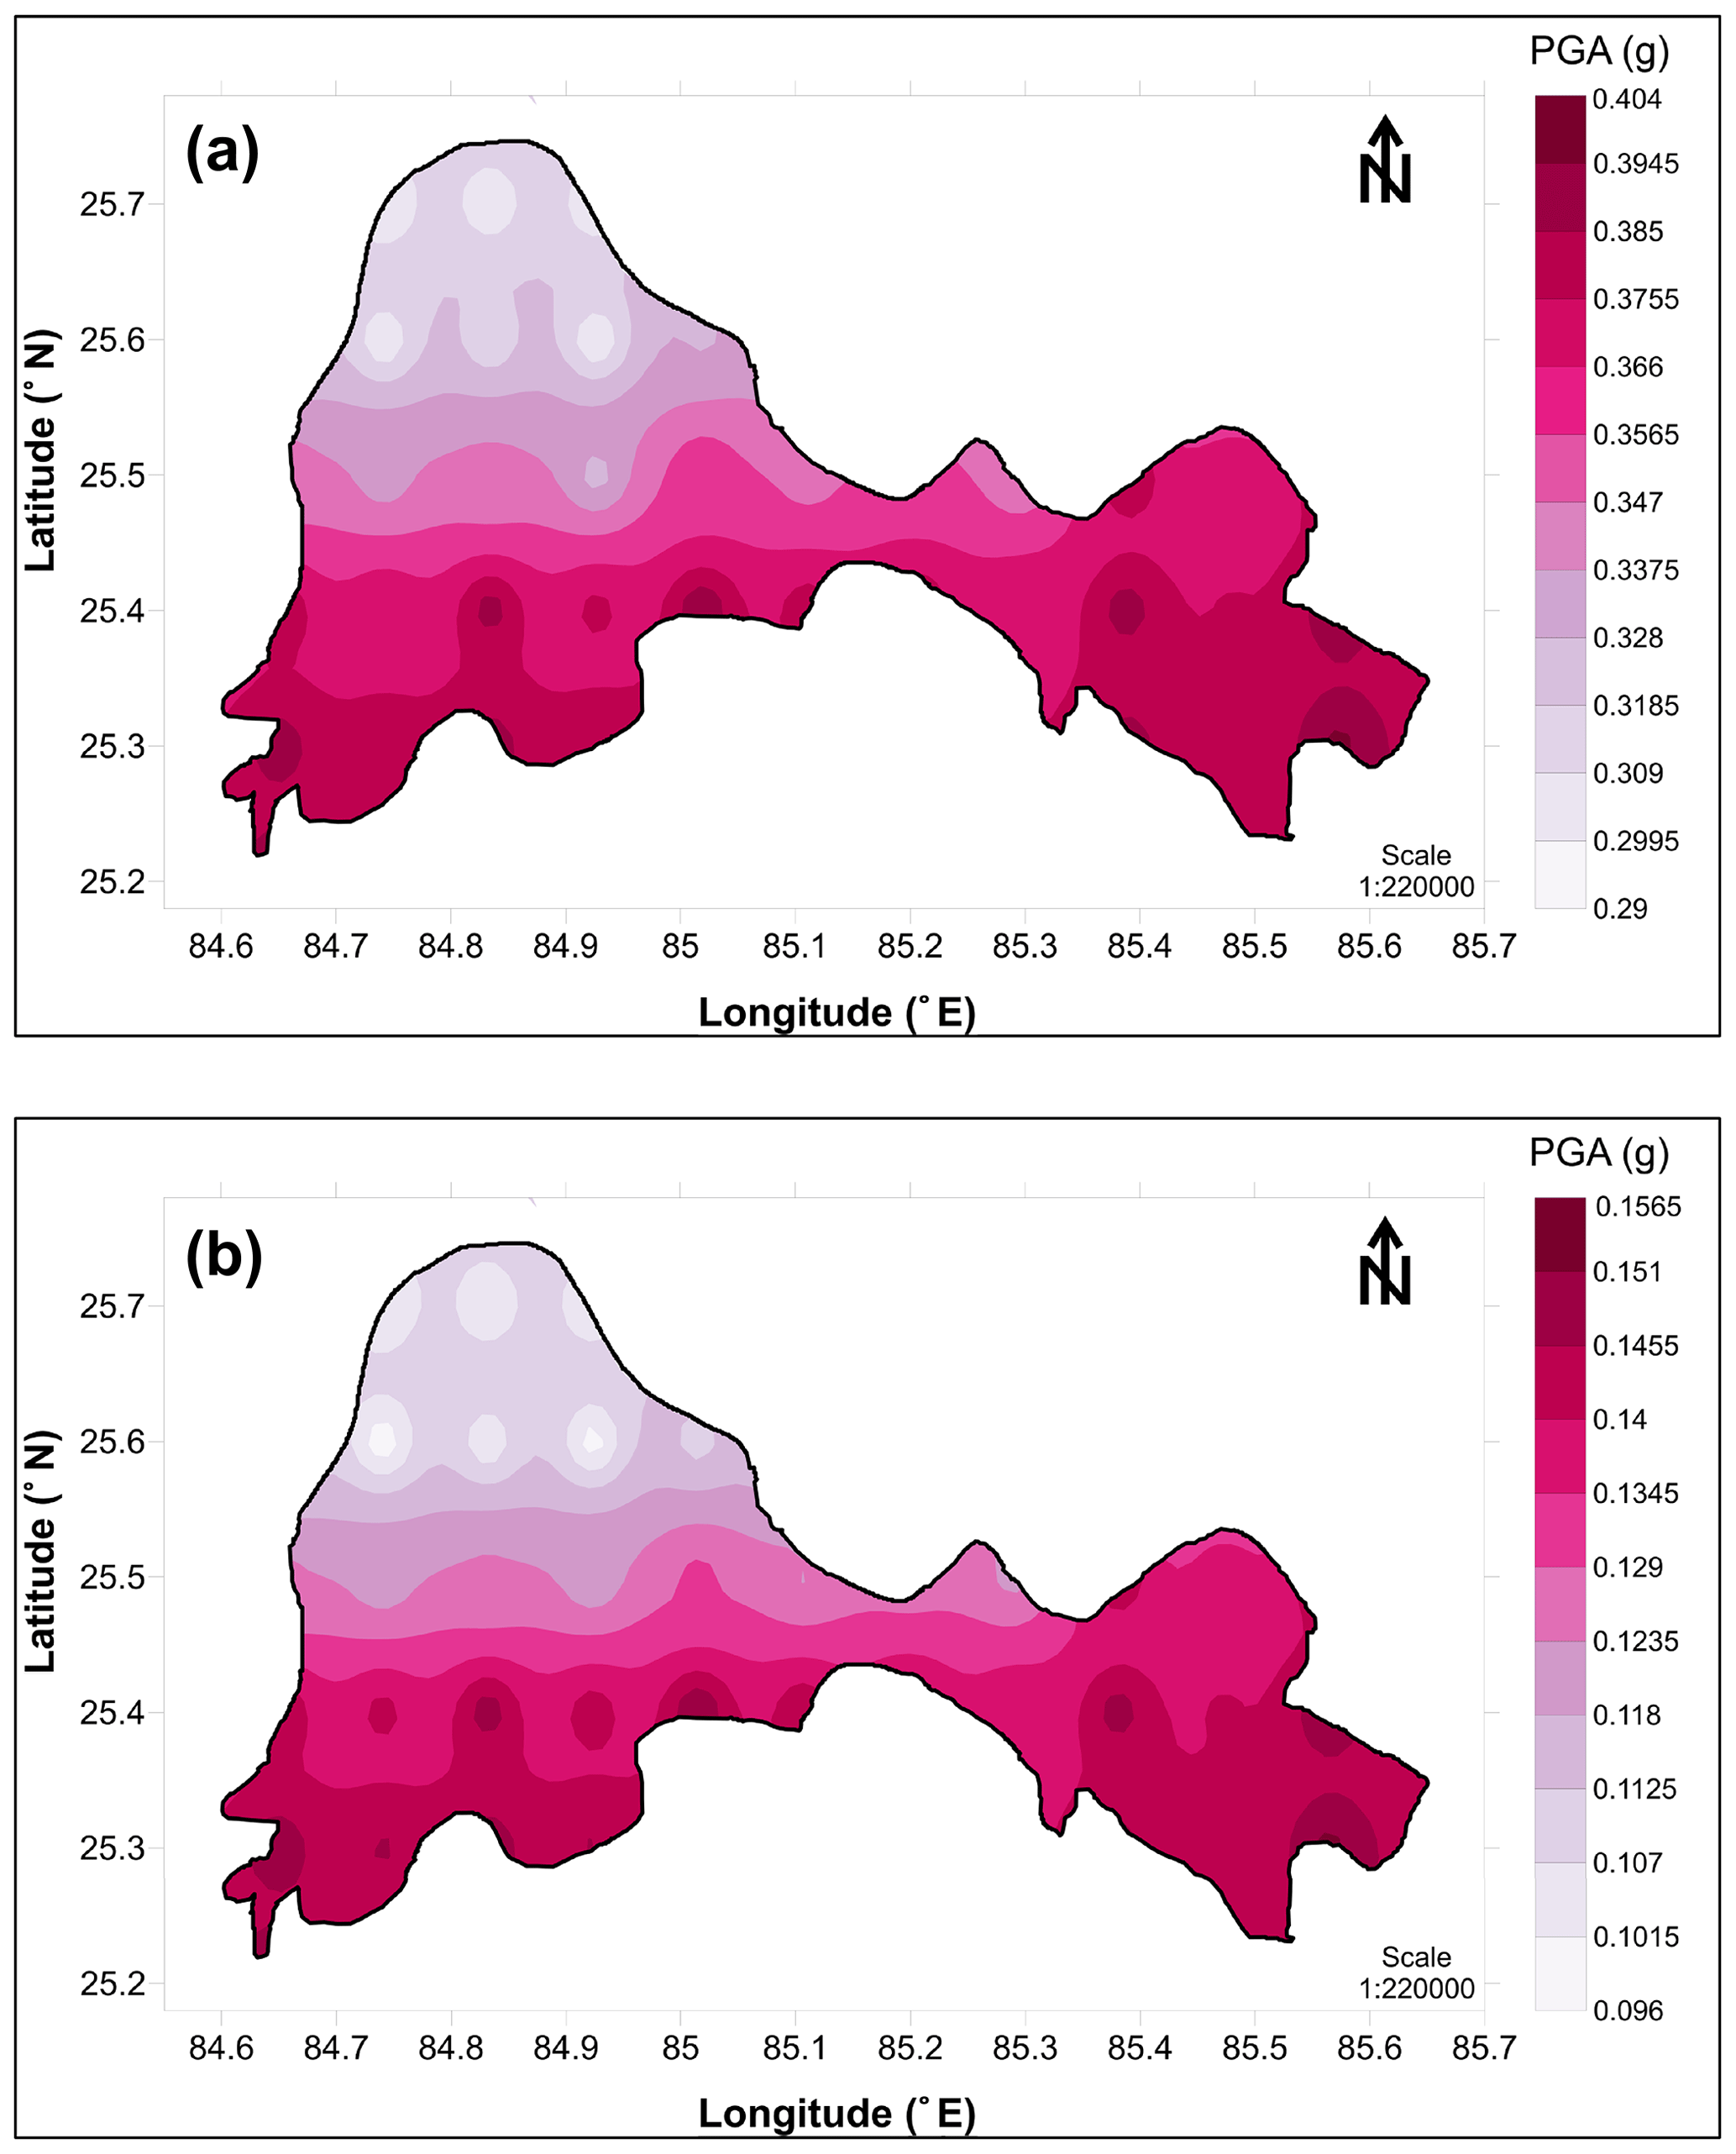
Figure 9(a) PSHA map for Patna urban centre for 2 % probability of exceedance in 50 years using the areal seismic zone. (b) PSHA map for Patna urban centre for 10 % probability of exceedance in 50 years using the areal seismic zone.
8.3 Four models using the zoneless approach (Frankel, 1995)
The hazard value for the Patna district has also been determined with the four models proposed by Frankel (1995). Each of these four models (Fig. 4) has a different spatial distribution of seismic activity. However, the present SSA has five characteristic earthquakes (Mw≥7) so models 1, 2, and 3 have been analysed separately by considering earthquake events, and a PGA map using model 4 has been developed based on seismic sources associated with characteristic earthquakes. The seismic hazard map is generated considering a grid size of . The activity rate was calculated in every grid cell and it has been obtained by counting the earthquakes having a magnitude greater than or equal to Mc=3.0 and 5.0 for model 1 and models 2 and 3 for different periods of the earthquake catalogue (Fig. 4) using MATLAB. The calculated activity rate was then spatially smoothed according to Eq. (1), and the chosen correlation distance c=50 and 75 km for model 1 and models 2 and 3. The annual rate of exceedance at the centre of each grid for the seven zones has been calculated using Eq. (2). The cumulative hazard curve has been obtained from models 1, 2, 3, and 4 at the Patna district centre for 0, 0.05, 0.1, 0.2, 0.3, 0.4, 0.6, 0.8, 1.0, 1.6, and 2 s and shown in Fig. S4. At the zero period, the return period is 85 years and 0.075 g with 43.96 % probability of exceedance in 50 years at the Patna district centre and 0.5 g with a return period increased by 24.4 thousand years in the case of PGA. Primarily the frequency of exceedance declines from 85 years at zero periods to 14 years at 1.0 s, which further increases to 29 years at 0.2 s and again till 2.0×10⁵ years for 2 s. Figure S5a and b show the mean deaggregation plot for Patna for 2 % and 10 % probability of exceedance at 50 years. The deaggregation has been calculated by considering the weighted mean from all four models. PGA for 6.0 Mw at 25.25 km hypocentral distance and 5.75 Mw at 30.3 km hypocentral distance is predominant for 2 and 10 % probability of exceedance at 50 years. With the four models described in Fig. 4, a PGA map has been developed for Patna SSA and given in Fig. S6a–d considering 2 % probability of exceedance in 50 years and Fig. S7a–d considering 10 % probability of exceedance in 50 years. It can be noted from model 1 that the southwestern part of Patna has a high hazard value and a similar trend has been seen from model 2. Model 3 is a map of uniform hazard whereas as far as model 4 is concerned, the northeastern part and central part have high hazard because that portion of SSA is associated with characteristic earthquakes. The weighted-mean PGA map for Patna has been developed by assigning different weight to these four models as 0.3, 0.3, 0.2, and 0.2 for models 1, 2, 3, and 4 respectively. A larger weight is given to models 1 and 2 as they represent real seismic activity because they are based on more reliable data. However, model 3 deals with weak conjecture that earthquake events between 3 to 7 are equally likely everywhere in Patna and model 4 has great uncertainty in occurrence of characteristic earthquakes. Figure 10a and b are the PSHA maps for the Patna district for return periods of 2475 and 475 years respectively. PGA varies from 0.34 g in the eastern periphery to 0.26 g towards the northwestern periphery, while it increases 1.38-fold for the southwest part of the district (see Fig. 10a). Similarly, considering 10 % probability of exceedance in 50 years, the PGA value in the southwestern part of Patna is 1.5 times larger (see Fig. 10b).
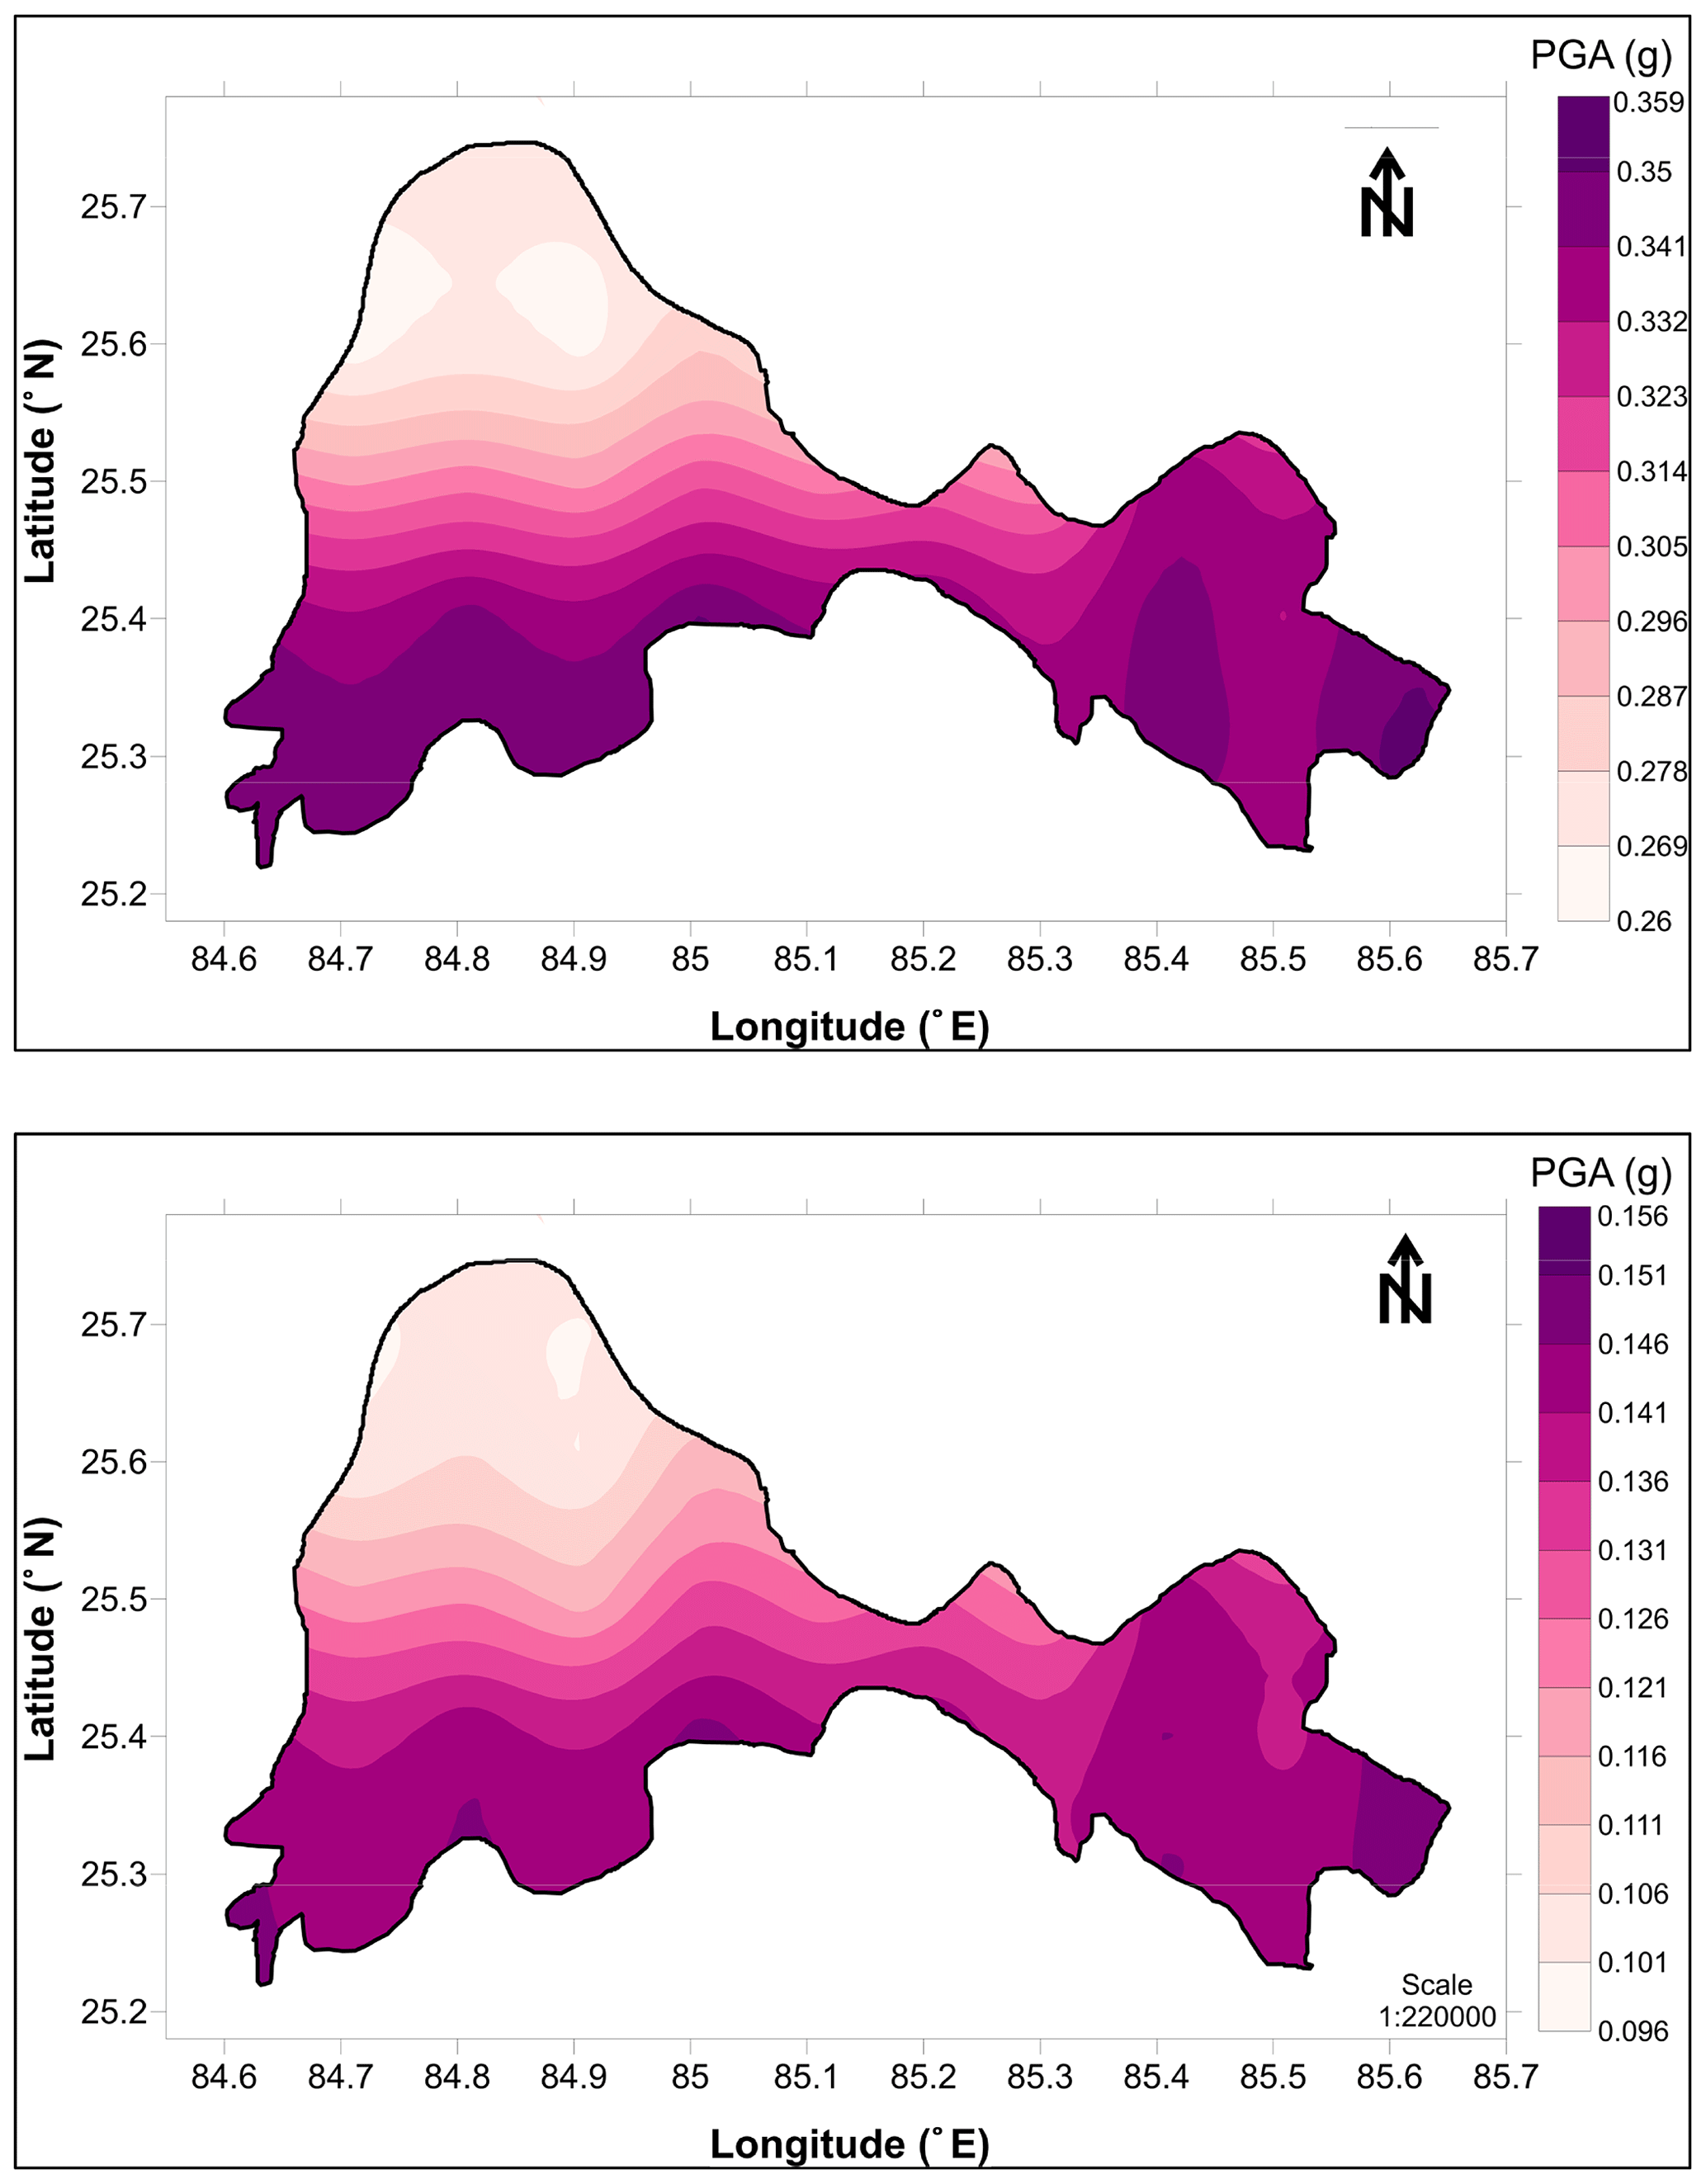
Figure 10(a) Weighted-mean PGA map of Patna SSA for 2 % probability of exceedance in 50 years using the Frankel approach (1995). (b) Weighted-mean PGA map of Patna SSA for 10 % probability of exceedance in 50 years using the Frankel approach (1995).
It can be seen from the mean deaggregation plot that the motion for 6.0 Mw at 40 km hypocentral distance, 6.0 Mw at 15 km hypocentral distance, and 6.0 Mw at 25.25 km hypocentral distance is predominant in the case of the Cornell, areal, and Frankel approaches respectively considering 2 % probability in 50 years. However, the motion for 5.5 Mw at 50 km hypocentral distance, 5.75 Mw at 20 km hypocentral distance, and 5.75 Mw at 30.3 km hypocentral distance respectively predominate in the case of the Cornell, areal, and Frankel approaches. The PGA values vary from 0.08 to 0.43, 0.29 to 0.41, and 0.26 to 0.36 g in the case of the Cornell, areal, and Frankel approaches respectively considering 2 % probability in 50 years. However, it ranges from 0.04 to 0.18, 0.09 to 0.16, and 0.09 to 0.16 g respectively considering 10 % probability of exceedance in 50 years in the case of the Cornell, areal, and Frankel approaches. Comparing hazard maps developed using a classical approach and zoneless approach, it has been seen that the northeastern part of Patna SSA has experienced the maximum PGA value. As per the classical approach (Cornell, 1968), predicted PGA value for the central part of the Patna district is 0.08 g, whereas per Frankel's approach (Frankel, 1995) it is 0.32 g; however as per the areal approach it is 0.31 g. Similarly, PGA values of 0.15, 0.39, and 0.39 g have been observed in the case of the Cornell, Frankel, and areal approaches in the southwestern part of Patna SSA. It is because of absence of well-defined seismic source in that area, whereas earthquake events of moment magnitude of 6 and above have occurred. However, in the northwestern part the PGA value is almost equal when calculated using these approaches. This is the reason why both zoneless and classical approaches have been considered in this study to counter the epistemic uncertainty. Thus, both the seismic sources and earthquake events can be accounted for properly.
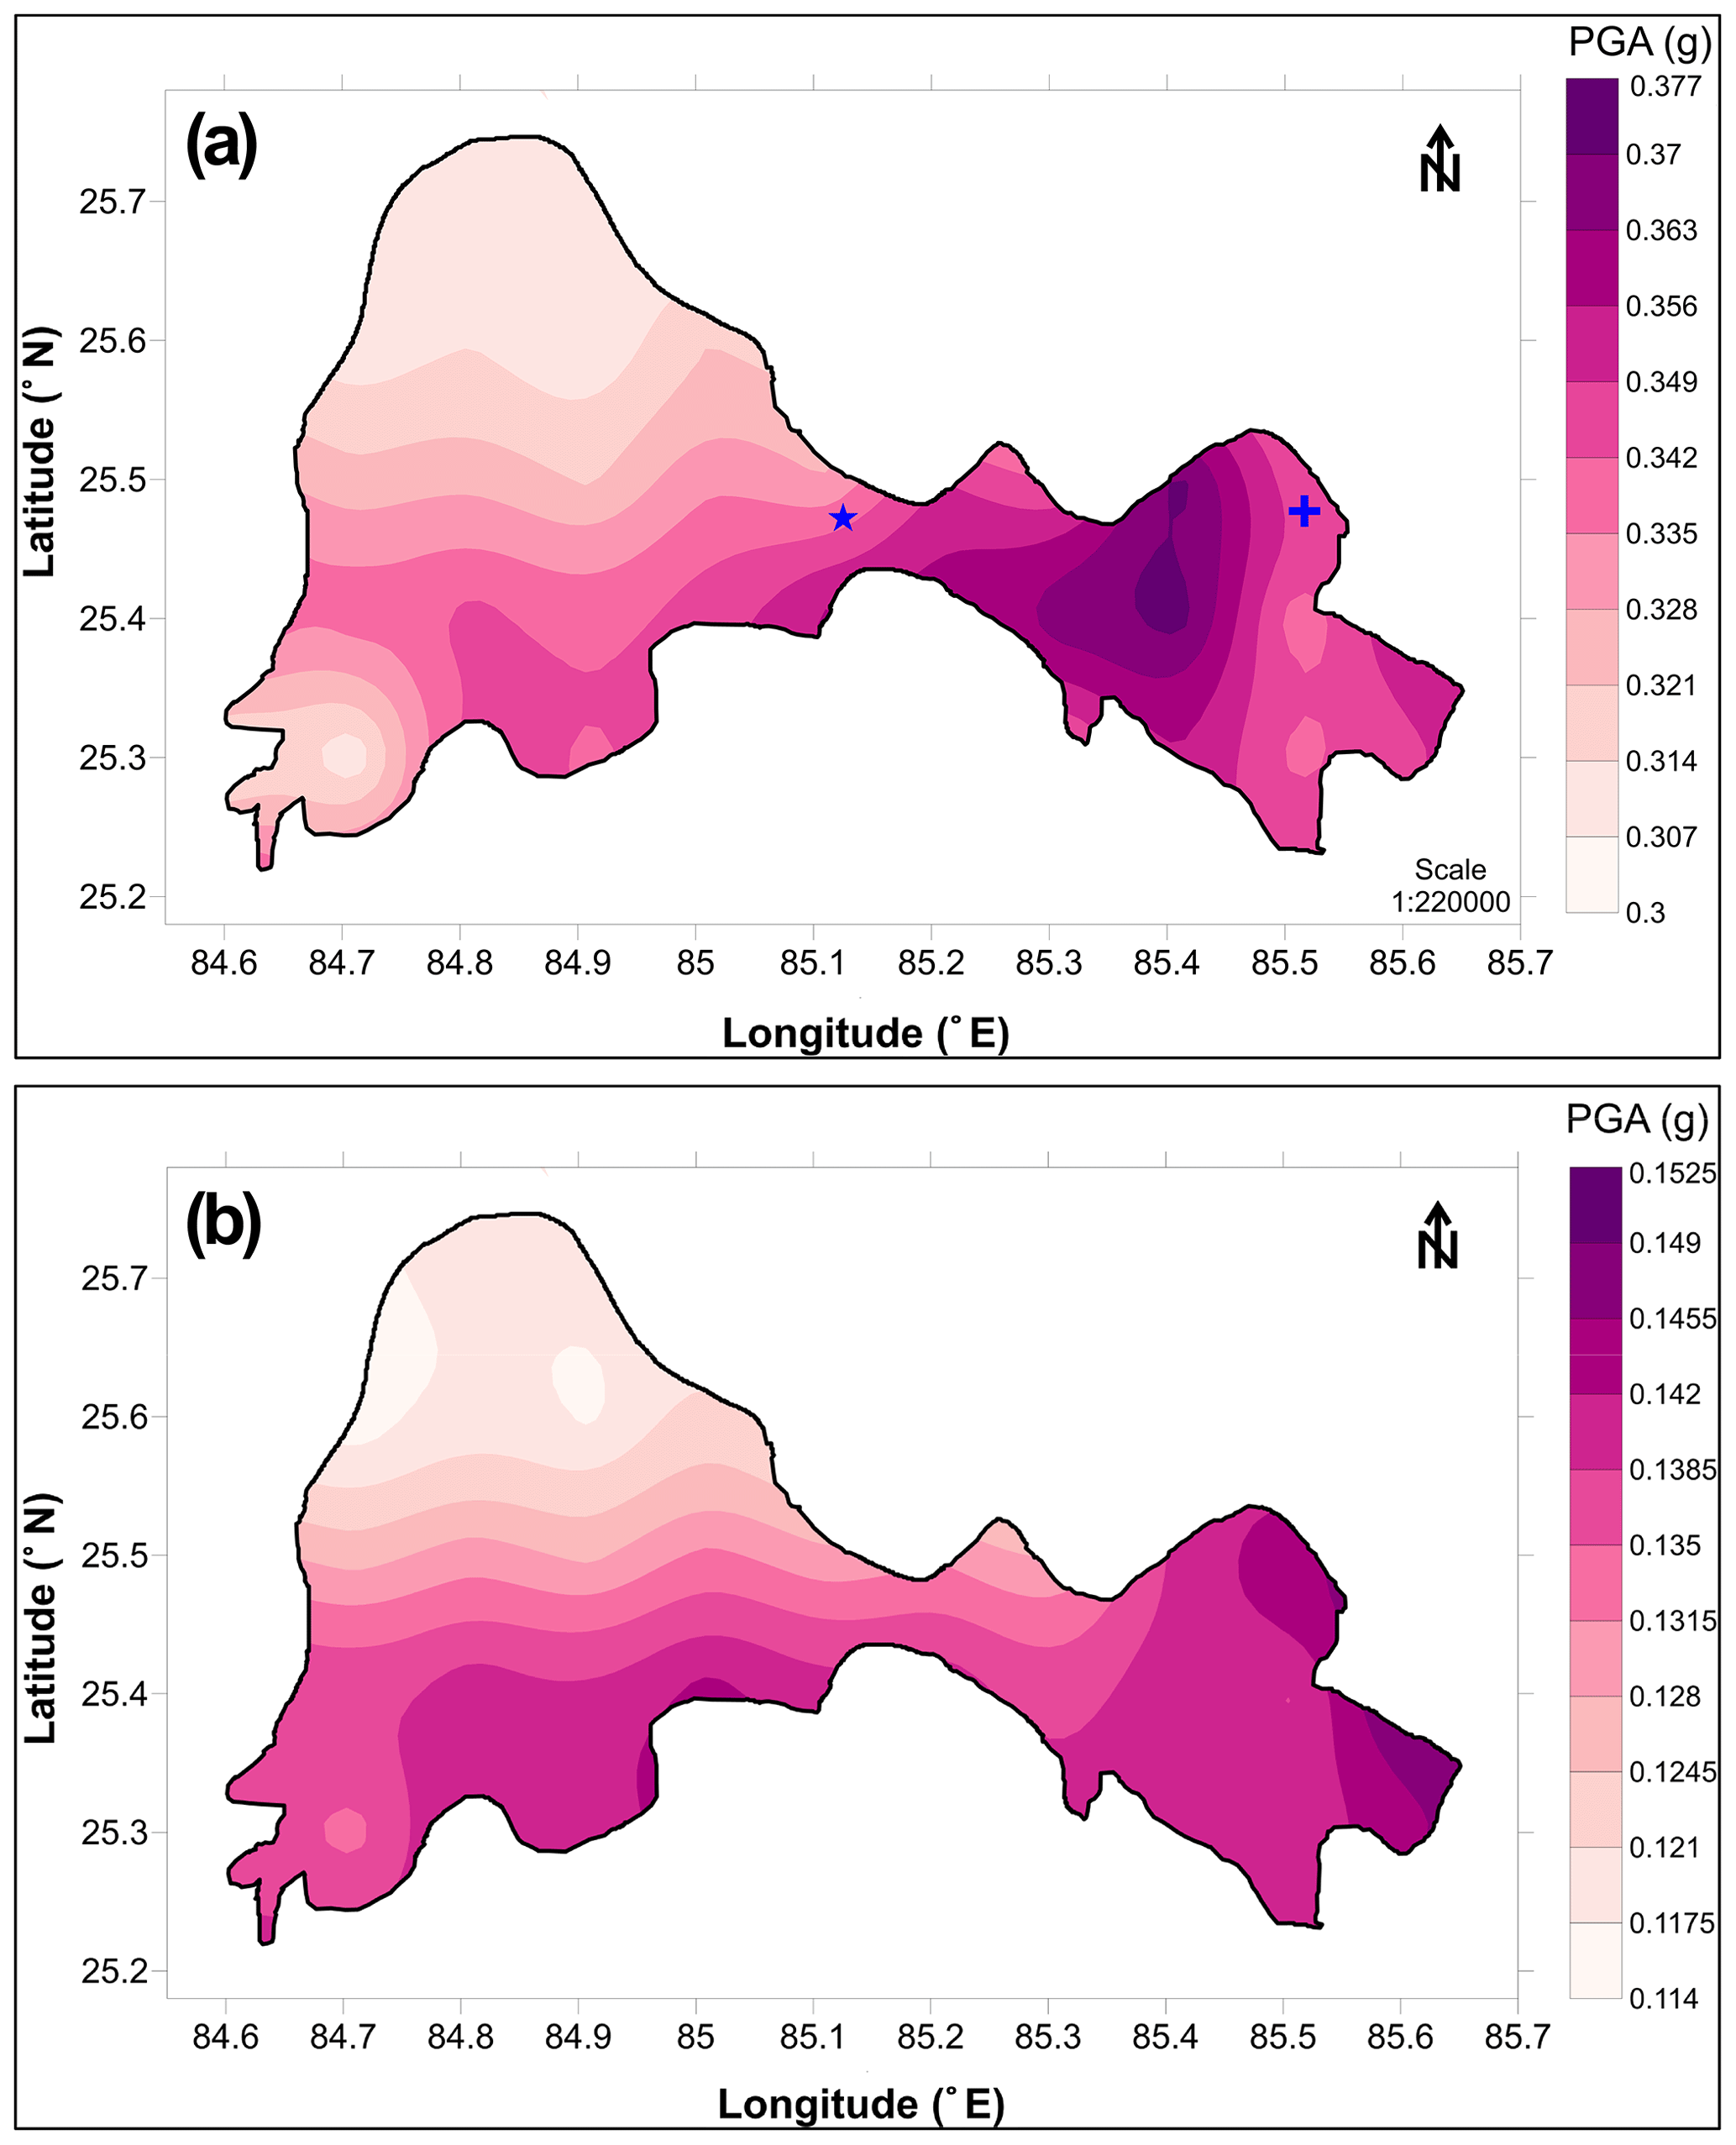
Figure 11(a) Final seismic hazard map of Patna SSA for 2 % probability of exceedance in 50 years using the logic tree approach. (b) Final seismic hazard map of Patna SSA for 10 % probability of exceedance in 50 years using the logic tree approach.
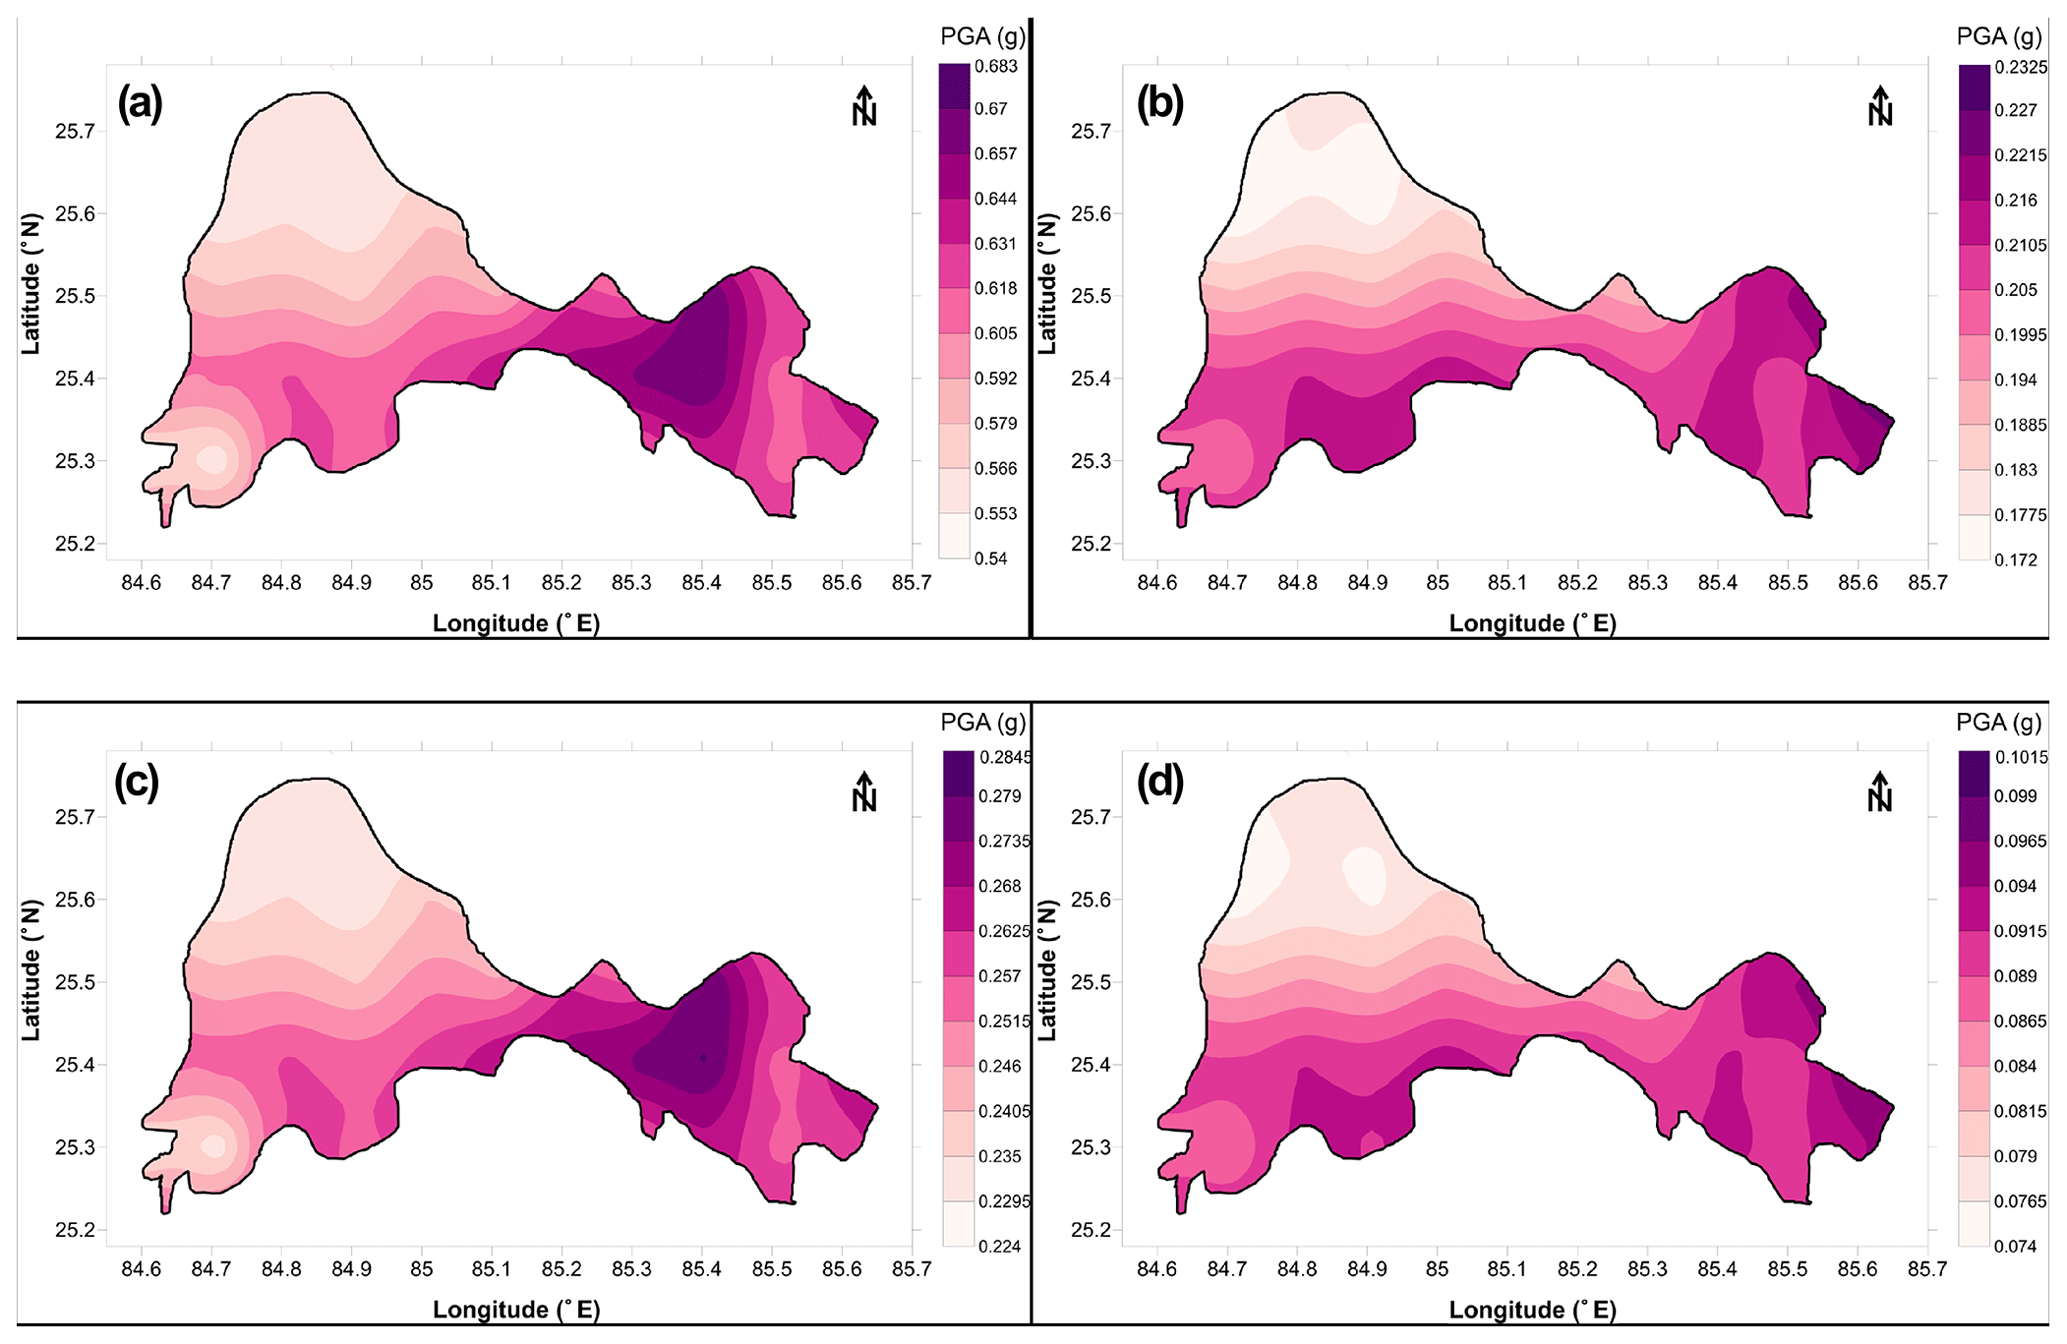
Figure 12Final seismic hazard map of Patna SSA for (a) 2 % and (b) 10 % probability of exceedance in 50 years at 0.2 s and (c) 2 % and (d) 10 % probability of exceedance in 50 years at 1 s using the logic tree approach.
The final hazard value has been developed by assigning the weight factor of 0.5 to both PGA values calculated with the classical and zoneless approaches. In the present study the average of the hazard values from both the methods have been considered. Hazard integration has been performed as the SSA seismic sources are not identified fully (e.g. northwest and central parts of Patna); hence, to overcome the limitation, the zoneless approach has also been used for developing the PSHA map. It is necessary here to note that the experimenters performing for the seismic hazard assessment using a weighting factor may lead to complication in the calculations with the inclusion of different branches. To prevent this trouble, Bommer et al. (2005) suggested avoiding using the branches having slight differences between the options that it carries, in cases when those options result in very similar nodes. Therefore, when selecting the weighting factors in the logic tree in this study, the cases contrasting (or different) with each other as much as possible have been taken into consideration. In the zoneless approach, 0.5 weight factors were given to both PGA maps developed using areal and Frankel (1995) approaches as explained earlier. Thus, both the hazard maps were compiled and finally a 0.5 weight factor is given to the zoneless approach. The final PGA variation corresponds to 2 % and 10 % probability of exceedance in 50 years, was shown in Fig. 11a and b. In addition, SA at 0.2 and 1 s considering epistemic uncertainty has been given as Fig. 12a, b, c, and d for 2 % and 10 % probability of exceedance in 50 years. PGA varies from 0.37 g in the southeastern periphery to 0.30 g towards the northwest periphery, whereas the southwest part of the district encounters PGA of 0.31 g (See Fig. 11a). Similarly, PGA corresponding to a 475-year return period is about 0.12 g in the northwestern periphery and 0.15 g in the southeastern periphery (Fig. 11b). The reason for having a high PGA value in the southeastern periphery is due to the location of the East Patna and West Patna faults, and PGA value of 0.35 g in the southwestern part is due to the presence of earthquake events of a magnitude moment more than 6. It can be seen from the mean deaggregation plot that the motion for 6.0 Mw at a 40 km hypocentral distance, 6.0 Mw at a 15 km hypocentral distance, and 6.0 Mw at a 25.25 km hypocentral distance are predominant in the case of the Cornell, areal, and Frankel approaches respectively considering 2 % probability in 50 years. However, the motion for 5.5 Mw at 50 km hypocentral distance, 5.75 Mw at 20 km hypocentral distance, and 5.75 Mw at 30.3 km hypocentral distance respectively predominate in the case of the Cornell, areal, and Frankel approaches. The PGA values vary from 0.08 to 0.43, 0.29 to 0.41, and 0.26 to 0.36 g in the case of the Cornell, areal, and Frankel approaches respectively considering 2 % probability in 50 years. However, it varies from 0.04 to 0.18, 0.09 to 0.16, and 0.09 to 0.16 g considering 10 % probability of exceedance in 50 years in the case of the Cornell, areal, and Frankel approaches. The PGA value varies from 0.12 to 0.15 g for a return period of 2475 years, which is comparable with the PSHA map of India developed by Nath and Thingbaijam (2012). Recently, a major thrust faulting earthquake of magnitude 7.8 on 25 April 2015 occurred in Nepal, which affected various places in India including the Patna district. We had completed our mapping before this earthquake and compared our results with a shake map published by USGS (2019). It is noticed that PGA values for 10 % probability of exceedance in 50 years matches with the USGS (2019) shake map for the recent Nepal earthquake.
In addition, a uniform hazard response spectrum (UHRS) has been developed considering all three approaches and compared with IS 1893 (2002). For developing UHRS, seismic hazard curves of spectral accelerations at a different spectral period for the same probability of exceedance have been developed. The UHRS at 2 % and 10 % probability of exceedance for 50 years at the centre of the district using classical and zoneless approaches, viz. Frankel and areal approaches, has been drawn and given as Fig. 13a (marked as star in Fig. 11a). Similarly, the UHRS has been developed at the northeastern part of Patna considering 2 % and 10 % probability of exceedance, shown as Fig. 13b (marked as plus in Fig. 11a). It can be seen from Fig. 13 that the hazard value at 2 % probability is more for the same return period when compared to 10 % probability of exceedance in 50 years. It has also been observed that spectral acceleration at the zero period, i.e. PGA, is less in the case of the Cornell approach when compared to the Frankel and areal approaches at the centre of the district where as it is more when compared to the northeastern part of SSA. The developed UHRS has been compared with IS 1893 (2002) and it has been observed that the SA predicted is lower at the centre of the district at 2 % and 10 % probability of exceedance in 50 years except for Frankel's approach. However, in the case of the northeastern parts of SSA, the predicted SA values are more compared to IS 1893 (2002) (Fig. 13b). Hence, UHRS should be developed based on the regional characteristics so that it could be effectively used in infrastructural development of a district.
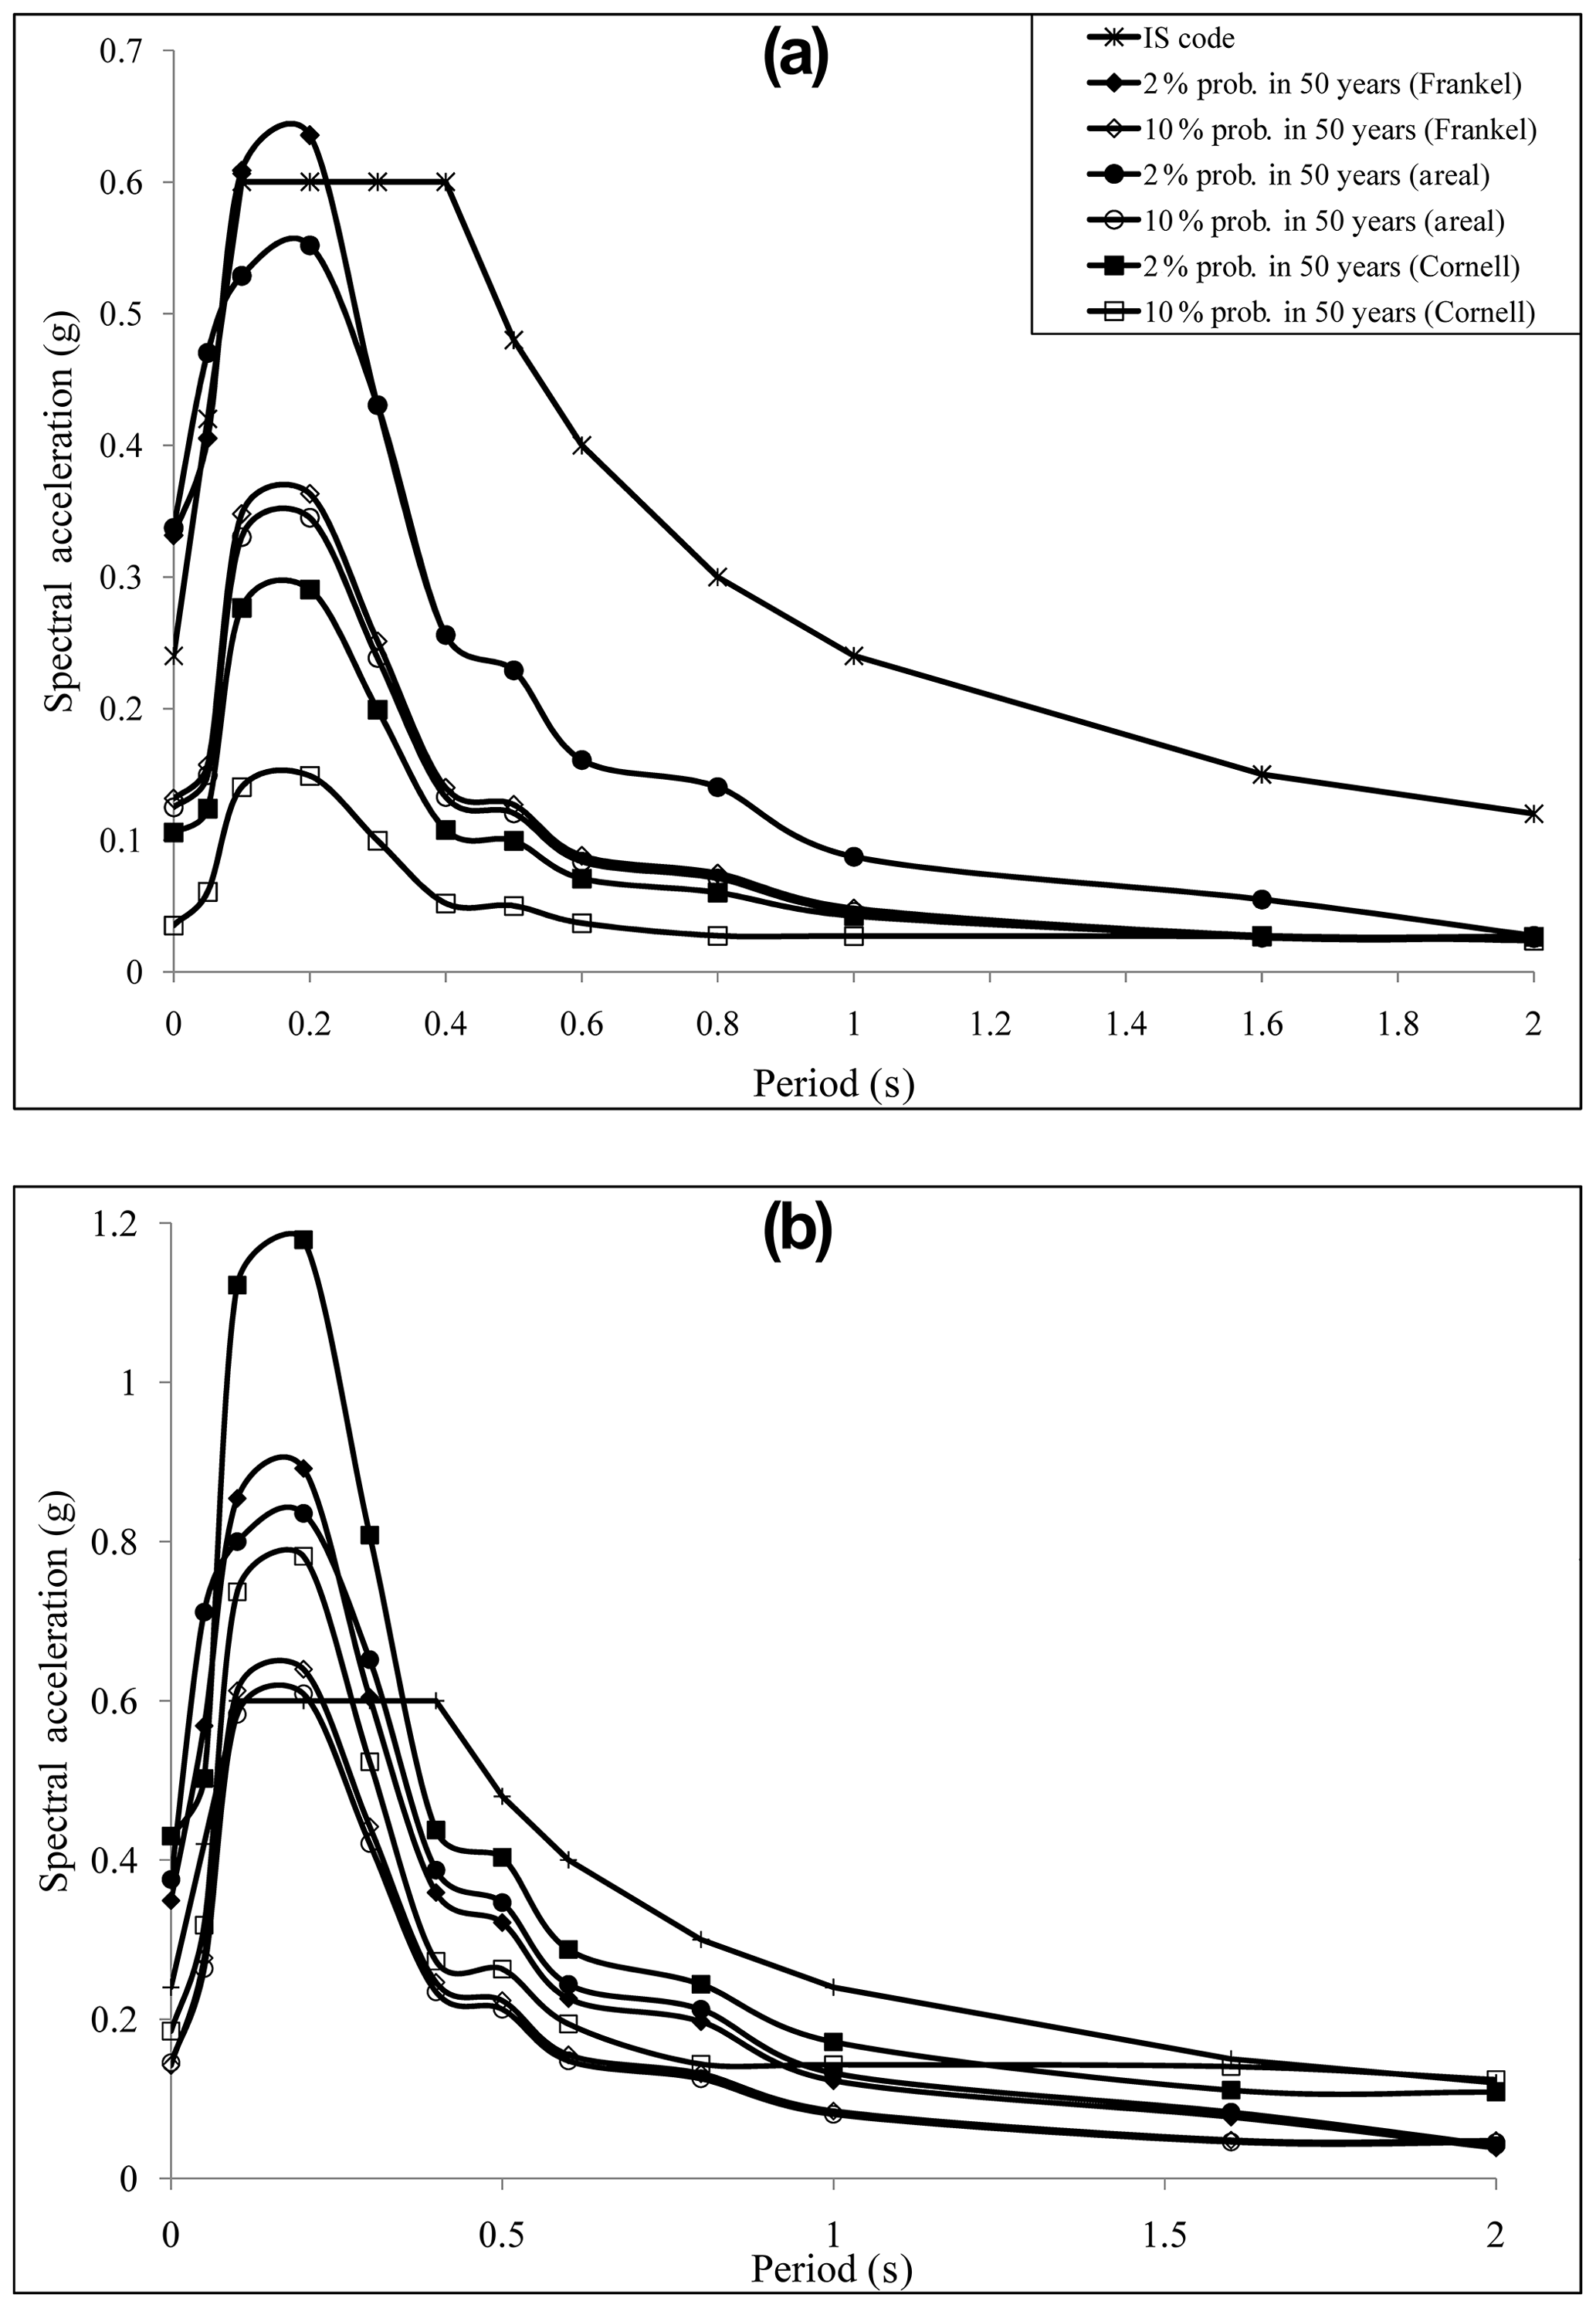
Figure 13(a) Design spectrum for Patna for 5 % damping from 2 % and 10 % probability of exceedance in 50 years and IS 1893 (2002) at centre of the city (marked in Fig. 11a). (b) Design spectrum for Patna for 5 % damping from 2 % and 10 % probability of exceedance in 50 years and IS 1893 (2002) at the northeastern part of the city (marked in Fig. 11a).
A new seismic hazard map for the Patna district was developed considering the earthquake events and seismic sources through the logic tree approach. Based on past earthquake damage distribution, the seismic study area of 500 km was arrived at and the seismotectonic map was generated. The maximum magnitude has been estimated by considering three weighted-mean methods, i.e. incremental method, Kijko method and regional rupture-based characteristics. From 28 applicable GMPEs, GMPEs ANBU-13, NDMA-10, and KANO-06 were selected up to 100 km epicentral distance; however ANBU-13, NDMA-10, BOAT-10, and KANO-06 were selected up to 300 km and NDMA-10 for more than 300 km. These GMPEs were ranked and weights were found based on the log-likelihood method. A new hazard map for the Patna district has been developed using both classical and zoneless approaches considering different weight factor corresponding to b value, maximum magnitude, and GMPE to reduce the uncertainty values. The logic tree has been accounted for to capture this epistemic uncertainty in the seismicity models. The final seismic hazard map corresponding to 2 % and 10 % probability of exceedance in 50 years has been developed by giving a weight factor to the seismicity models, maximum magnitude, and GMPEs. The PGA values vary from 0.08 to 0.43, 0.29 to 0.41, and 0.26 to 0.36 g in the case of Cornell, areal, and Frankel approaches respectively considering 2 % probability in 50 years. However it varies from 0.04 to 0.18, 0.09 to 0.16, and 0.09 to 0.16 g respectively considering 10 % probability of exceedance in 50 years in the case of the Cornell, areal, and Frankel approaches. However, hazard values in terms of PGA at bedrock level after considering logic tree vary from 0.30 to 0.37 and 0.11 to 0.15 g respectively considering 2 % and 10 % probability of exceedance in 50 years. In addition, a spectral acceleration hazard map has been developed at a period of 0.2 and 1 s corresponding to 2 % and 10 % probability of exceedance in 50 years. Hence the logic tree should be used to reduce the epistemic uncertainty in determining the hazard value for any seismic study area. It has been also concluded that uniform hazard response spectra should be developed considering region-specific parameters.
The earthquake data are collected from National Earthquake Information Centre, International Seismological Centre, Indian Meteorological Department, United State Geological Survey, and Geological Survey of India. A software package developed by Stefan Wiemer named ZMAP has been used for analysing the seismicity of the study area (http://www.seismo.ethz.ch/en/research-and-teaching/products-software/software/ZMAP/, last access: 20 October 2018). MATLAB is also used for developing code for hazard analysis (https://www.mathworks.com/, last access: 20 October 2018).
The supplement related to this article is available online at: https://doi.org/10.5194/nhess-19-2097-2019-supplement.
PA and KB analysed the data and developed the in-hand MATLAB code for developing the hazard map. KM, SSRM, and NSNA helped in developing the maps and writing the paper.
The authors declare that they have no conflict of interest.
The authors thank the Science and Engineering Research Board (SERB) of the Department of Science and Technology (DST), India, for funding.
Funding has been provided by the Science and Engineering Research Board (SERB) of the Department of Science and Technology (DST), India, for the project titled “Measurement of shear wave velocity at deep soil sites and site response studies”, Ref: SERB/F/162/2015-2016. This research has been also supported by the International Scientific Partnership Program (ISPP), King Saud University (grant no. ISPP#040).
This paper was edited by Maria Ana Baptista and reviewed by Hamza Gullu, Sreevalsa Kolathayar, and two anonymous referees.
Abrahamson, N. A. and Litehiser, J. J.: Attenuation of vertical peak accelerations, B. Seismol. Soc. Am., 79, 549–580, 1989.
Abrahamson, N. A. and Silva, W. J.: Abrahamson & Silva NGA ground motion relation for the geometric mean horizontal component of peak and spectral ground motion parameters. Report Pacific Earthquake Research Center, University of California, Berkeley, 2007.
Aghabarati, H. and Tehranizadeh, M.: Near-source ground motion attenuation relationship for PGA and PSA of vertical and horizontal components, B. Earthq. Eng., 7, 609–635, 2009.
Akkar, S. and Bommer, J. J.: Empirical equations for the prediction of PGA PGV and spectral acceleration in Europe the Mediterranean region and the Middle East, Seismol. Res. Lett., 81, 195–206, 2010.
Algermissen, S. T., Perkins, D. M., Thenhaus, P. C., Hanson, S. L., and Bender, B. L.: Probabilistic estimates of maximum acceleration and velocity in rock in the contiguous, United States Open File Report 82–1033, USGS Washington, D.C., USA, 99, 1982.
Ambraseys, N., Douglas, J. S., Sarma, K., and Smit, P. M.: Equation for the estimation of strong ground motions from shallow crustal earthquakes using data from Europe and the Middle East: horizontal peak ground acceleration and the spectral acceleration, B. Earthq. Eng., 3, 1–53, 2005.
Anbazhagan, P., Vinod, J. S., and Sitharam, T. G.: Probabilistic seismic hazard analysis for Bangalore, Nat. Hazards, 48, 145–166, 2009.
Anbazhagan, P., Smitha, C. V., Kumar, A., and Chandran, D.: Seismic hazard Assessment of NPP site at Kalpakkam Tamil Nadu India, Nucl. Eng. Des., 259, 41–64, 2013a.
Anbazhagan, P., Kumar, A., and Sitharam, T. G.: Ground motion prediction equation considering combined data set of recorded and simulated ground motions, Soil Dyn. Earthq. Eng., 53, 92–108, 2013b.
Anbazhagan, P., Prabhu, G., Moustafa, S. S. R., Nassir, S. N. A., and Aditya, P.: Provisions for Geotechnical Aspects and Soil Classification in Indian Seismic Design Code IS-1893, Disaster Adv., 7, 72–89, 2014.
Anbazhagan, P., Bajaj, K., and Satyajit, P.: Seismic Hazard Maps and Spectrum for Patna Considering Region Specific Seismotectonic Parameters, Nat. Hazards, 78, 1163–1195, 2015a.
Anbazhagan, P., Bajaj, K., Moustafa, S. S. R., and Nassir, S. N. A.: Maximum Magnitude Estimation Considering the Regional Rupture Character, J. Seismol., 19, 695–719, 2015b.
Anbazhagan, P., Sreenivas, M., Bajaj, K., Moustafa, S. S. R., and Nassir, S. N. A.: Selection of Ground Motion Prediction Equations for seismic hazard Analysis of Peninsular India, J. Earthq. Eng., 20, 699–737, 2015c.
Atkinson, G. M. and Boore, D. M.: Empirical ground-motion relations for subduction-zone earthquakes and their applications to Cascadian and other regions, B. Seismol. Soc. Am., 93, 1703–1717, 2003.
Banghar, A. R.: Mechanism solution of Nepal-Bihar earthquake of August 20, 1988, J. Geol. Soc. India, 37, 25–30, 1991.
Baruah, S., Gogoi, N. K., Erteleva, Q., Aptikaev, F., and Kayal, J. R.: Ground Motion parameters of Shillong plateau one of the most seismically active zones of Northeastern India Earthquake, Science, 22, 283–291, 2009.
Bhatia, S. C., Ravi, M. K., and Gupta H. K.: A probabilistic seismic hazard map of India and adjoining regions, Ann. Geofis., 42, 1153–1164, 1999.
Bilham, R.: Raising Kathmandu, Nat. Geosci., 8, 582–584, 2015.
Bilham, R. and Wallace, K.: Future Mw >8 earthquakes in the Himalaya: implications from the 26 Dec 2004 Mw = 9.0 earthquake on India's eastern plate margin, Geol. Surv. India. Spl. Pub., 85, 1–14, 2005.
Bommer, J. J. and Abrahamson, N. A.: Why do modern probabilistic seismic hazard analyses lead to increased hazard estimates, B. Seismol. Soc. Am., 96, 1967–1977, 2006.
Bommer, J. J., Scherbaum, F., Bungum, H., Cotton, F., Sabetta, F., and Abrahamson N. A.: On the use of logic trees for ground motion prediction equations in seismic hazard assessment, B. Seismol. Soc. Am., 95, 377–389, 2005.
Boore, D. M. and Atkinson, G. M.: Ground-Motion Prediction Equations for the average horizontal component of PGA PGV and 5 % damped PSA at spectral periods between 001 s to 100 s, Earthq. Spectra, 24, 99–138, 2008.
Campbell, K. W.: Empirical Near-Source attenuation relationships for horizontal and vertical components of peak ground acceleration peak ground velocity and pseudo-absolute acceleration response spectra, Seismol. Res. Lett., 68, 154–179, 1997.
Campbell, K. W. and Bozorgnia, Y.: NGA ground motion model for the geometric mean horizontal component of PGA, PGV, PGD and 5 % damped linear elastic response spectra for periods ranging from 0.01 to 10 s, Earthq. Spectra 24, 139–171, 2008.
Cao, A. M. and Gao, S. S.: Temporal variation of seismic b-values beneath northeastern Japan island arc, Geophys. Res. Lett., 29, 1–3, 2002.
Cornell, C. A.: Engineering seismic rick analysis, B. Seismol. Soc. Am., 58, 1583–1606, 1968.
Das, S., Gupta, I. D., and Gupta, V. K. A probabilistic seismic hazard analysis of Northeast India, Earthq. Spectra, 22, 1–27, 2006.
Dasgupta, S., Mukhopadyay, M., and Nandy, D. R.: Active transverse features in the central portion of the Himalaya, Tectonophysics, 136, 255–264, 1987.
Dasgupta, S., Sengupta, P., Mondal, A., and Fukuoka, M.: Mineral chemistry and reaction textures in metabasites from the Eastern Ghats belt India and their implications, Mineral. Mag., 57, 113–120, 1993.
Delavaud, E., Scherbaum, F., Kuehn, N., and Riggelsen, C.: Information-theoretic selection of Ground-motion Prediction equations for Seismic hazard analysis: an applicability study using Californian data, B. Seismol. Soc. Am., 99, 3248–3263, 2009.
Delavaud, E., Scherbaum, F., Kuehn, N., and Allen, T.: Testing the Global Applicability of Ground-Motion Prediction Equations for Active Shallow Crustal Regions, B. Seismol. Soc. Am., 102, 702–721, 2012.
EM-1110: Engineer manual 1110-2-6050, Department of Army, US Army corps of Engineers, Washington, D.C., USA, DC-20314-1000, 1999.
Frankel, A.: Mapping seismic hazard in the Central Eastern United States, Seismol. Res. Lett., 66, 8–21, 1995.
Gardner, J. K. and Knopoff, L.: Is the sequence of earthquakes insouthern California with aftershocks removed Poissonian?, B. Seismol. Soc. Am., 64, 1363–1367, 1974.
Gullu, H. and Iyisan, R.: A seismic hazard study through the comparison of ground motion prediction equations using the weighing factor of logic tree, J. Earthq. Eng., 20, 861–884, 2016.
GSI: Eastern Nepal Himalaya and Indo-Gangetic Plains of Bihar, in: Seismotectonics Atlas of India and Its Environs Geological Survey of India, edited by: Narula, P. L., Acharyya, S. K., and Banerjee, J., Delhi, India, 26–27, 2000.
Gupta, I. D.: Delineation of probable seismic sources in India and neighbourhood by a comprehensive analysis of seismotectonic characteristics of the region, Soil Dyn. Earthq. Eng., 26, 766–790, 2006.
Gupta, I. D.: Response spectral attenuation relations for inslab earthquakes in Indo-Burmese subduction zone, Soil Dyn. Earthq. Eng., 30, 368–377, 2010.
Gutenberg, B. and Richter, C. F.: Earthquake magnitude intensity energy and acceleration, B. Seismol. Soc. Am., 46, 105–145, 1956.
Idriss, I. M.: An NGA empirical model for estimating the horizontal spectral values generated by shallow crustal earthquakes, Earthq. Spectra, 16, 363–372, 2008.
IS 1893: Indian standard criteria for earthquake resistant design of structures part 1-general provisions and buildings, Bureau of Indian Standards, New Delhi, India, 2002.
IS 1893: Part 1: Indian standard criteria for earthquake resistant design of structures, Sixth Revision, Bureau of Indian Standards, New Delhi, 2016.
Iyenger, R. N. and Ghosh, S: Microzonation of earthquake hazard in Greater Delhi area, Curr. Sci., 87, 1193–1202, 2004.
Kanno, T., Narita, A., Morikawa, N., Fujiwara, H., and Fukushima, Y.: A new attenuation relation for strong ground motion in Japan based on recorded data, B. Seismol. Soc. Am., 96, 879–897, 2006.
Khattri, K. N.: Great earthquakes seismicity gaps and potential for earthquakes along the Himalayan plate boundary, Tectonophysics, 38, 79–92, 1987.
Khattri, K. N., Rogers, A. M., Perkins, D. M., and Algermissen, S. T.: A seismic hazard map of India and adjacent areas, Tectonophysics, 108, 93–134, 1984.
Kijko, A. and Sellevoll, M. A.: Estimation of earthquake hazard parameters from incomplete data files Part I Utilization of extreme and complete catalogues with different threshold magnitudes, B. Seismol. Soc. Am., 79, 645–654, 1989.
Kiran, K. S. T., Nath, S. K., Yadav, A., Raj, A., Yanger, W. M., and Mohanty, W. K.: Recent seismicity in northeast India and its adjoining region, J. Seismol., 12, 107–123, 2008.
Kiureghian, D. A. and Ang, A. H. S.: A fault rupture model for seismic risk analysis, B. Seismol. Soc. Am., 67, 1173–1194, 1977.
Kolathayar, S. and Sitharam, T. G.: Characterization of regional seismic source zones in and around India, Seismol. Res. Lett., 83, 77–85, 2012.
Kolathayar, S., Sitharam, T. G., and Vipin, K. S.: Deterministic seismic hazard macrozonation of India, J. Earth Syst. Sci., 121, 1351–1364, 2012.
Kulkarni, R. B., Youngs, R. R., and Coppersmith, K. J.: Assessment of confidence intervals for results of seismic hazard analysis, Proceedings Eighth World Conference on Earthquake Engineering, 21–28 July 1984, San Francisco, USA, 1, 263–270, 1984.
Kumar, A., Anbazhagan, P., and Sitharam, T. G. Seismic Hazard Analysis of Luckhnow considering local and active seismic gaps, Nat. Hazards, 69, 327–350, 2013.
Lin, P. S. and Lee, C. H.: Ground-Motion Attenuation relationship for subduction-zone earthquakes in Northeastern Taiwan, B. Seismol. Soc. Am., 98, 220–240, 2008.
Mahajan, A. K., Thakur, V. C., Sharma, M. L., and Chauhan, M.: Probabilistic seismic hazard map of NW Himalaya and its adjoining area India, Nat. Hazards, 53, 443–457, 2010.
McGuire, R. K. and Arabasz, W. J.: An introduction to probabilistic seismic hazard analysis, in: Geotechnical and Environmental Geophysics, edited by: Ward, S. H., Society of Exploration Geophysicist, 1, 333–353, Tulsa, Oklahoma, USA, 1990.
Nath, S. K. and Thingbaijam, K. K. S.: Peak ground motion predictions in India: an appraisal for rock sites, J. Seismol., 15, 295–315, 2011.
Nath, S. K. and Thingbaijam, K. K. S.: Probabilistic seismic hazard assessment of India, Seismol. Res. Lett., 83, 135–149, 2012.
Nath, S. K., Vyas, M., Pal, I., and Sengupta, P.: A hazard scenario in the Sikkim Himalaya from seismotectonics spectral amplification source parameterization and spectral attenuation laws using strong motion seismometry, J. Geophys. Res., 110, 1–24, 2005.
Nath, S. K., Raj, A., Thingbaijam, K. K. S., and Kumar, A.: Ground motion synthesis and seismic scenario in Guwahati city a stochastic approach, Seismol. Res. Lett., 80, 233–42, 2009.
NDMA: Development of probabilistic seismic hazard map of India Technical report by National Disaster Management Authority, Government of India, Delhi, India, 2010.
Ramkrishnan, R., Sreevalsa, K., and Sitharam T. G.: Development of New Ground Motion Prediction Equation for the North and Central Himalayas Using Recorded Strong Motion Data, J. Earthq. Eng., https://doi.org/10.1080/13632469.2019.1605318, 2019.
Risk Engineering Inc.: Program FRISK88: Description of Capabilities, Boulder, CO, Risk Engineering Inc, 1988.
Rydelek, P. A. and Sacks, I. S.: Testing the completeness of earthquake catalogs and the hypothesis of self-similarity, Nature, 337, 251–253, 1989.
Scherbaum, F. and Kühn, N. M.: Logic tree branch weights and probabilities: Summing up to one is not enough, Earthq. Spectra, 27, 1237–1251, 2011.
Scherbaum, F., Delavaud, E., and Riggelsen, C.: Model selection in seismic hazard analysis: an information theoretic perspective, B. Seismol. Soc. Am., 99, 3234–3247, 2009.
Scordilis, E. M.: Empirical global relations converting MS and mb to moment magnitude, J. Seismol., 10, 225–236, 2006.
SEISAT: Seismotectonic Atlas of India and its environs, Geological Survey of India, Delhi, India, 2010.
Sharma, M. L.: Attenuation relationship for estimation of peak ground horizontal acceleration using data from strong motions arrays in India, B. Seismol. Soc. Am., 88, 1063–1069, 1998.
Sharma, M. L. and Bungum, H.: New strong ground motion spectral acceleration relation for the Himalayan region, in: First European conference on earthquake engineering and seismology, 3–8 September 2006, Geneva, Switzerland, 1459 pp., 2006.
Sharma, M. L., Douglas, J., Bungum, H., and Kotadia, J.: Ground-motion prediction equations based on data from Himalayan and Zagros regions, J. Earthq. Eng., 13, 1191–1210, 2009.
Shi, Y. and Bolt, B. A.: The standard error of the magnitude-frequency b-value; B. Seismol. Soc. Am., 72, 1667–1687, 1982.
Singh, R. P., Aman, A., and Prasad, Y. J. J.: Attenuation relations for strong ground motion in the Himalayan region, Pure Appl. Geophys., 147, 161–80, 1996.
Sitharam, T. G. and Kolathayar, S.: Seismic hazard analysis of India using areal sources, J. Asian Earth Sci., 62, 647–653, 2013.
Spudich, P., Joyner, W. B., Lindh, A. G., Boore, D. M., Margaris, B. M., and Fletcher, J. B.: SEA99 A revised ground motion prediction relation for use in Extensional tectonic regions, B. Seismol. Soc. Am., 89, 1156–1170, 1999.
Stepp, J. C.: Analysis of completeness of the earthquake sample in the Puget Sound area and its effect on statistical estimates of earthquake hazard, in: Proceeding of the International conference on microzonation, 30 October–3 November 1972, Seattle, USA, 2, 897–910, 1972.
Takahashi, T., Saiki, T., Okada, H., Irikura, K., Zhao, J. X., Zhang, J., Thoi, H. K., Somerville, P. G., Fukushima, Y., and Fukushima, Y.: Attenuation models for response spectra derived from Japanese strong-motion records accounting for tectonic source types, 13th World Conference of Earthquake Engineering, 1–6 August 2004, Vancouver, BC, Canada, paper 1271, 2004.
Taylor, D. W. A., Snoke, J. A., Sacks, I. S., and Takanami, T.: Nonlinear frequency-magnitude relationship for the Hokkaido corner Japan, B. Seismol. Soc. Am., 80, 340–353, 1990.
Uhrhammer, R. A.: Characteristics of northern and central California seismicity, Earthq. Notes, 1, 21–37, 1986.
USGS: Poster of the Nepal Earthquake of 25 April 2015 – Magnitude 78, available at: https://earthquake.usgs.gov/earthquakes/eventpage/us20002926/executive, last access: 20 September 2019.
Valdiya, K. S.: Himalayan transverse faults and their parallelism with subsurface structures of north Indian plains, Tectonophysics, 32, 352–386, 1976.
Vipin, K. S. and Sitharam, T. G.: Delineation of seismic source zones based on seismicity parameters and probabilistic evaluation of seismic hazard using logic tree approach, J. Earth Syst. Sci., 122, 661–676, 2013.
Wheeler, R. L.: Methods of Mmax estimation east of the Rocky MountainsUS Geological Survey Open-File Report 2009-1018, available at: https://www.nrc.gov/docs/ML1019/ML101970459.pdf (last access: 20 September 2019), 2009.
Wiemer, S.: A software package to analyze seismicity: zmap, Seismol. Res. Lett., 72, 374–383, 2001.
Wiemer, S. and Wyss, M.: Minimum magnitude of complete reporting in earthquake catalogues: example from Alaska the Western United States and Japan, B. Seismol. Soc. Am., 90, 859–869, 2000.
Woessner, J. and Wiemer, S.: Assessing the quality of earthquake catalogues: Estimating the magnitude of completeness and its uncertainty, B. Seismol. Soc. Am., 95, 684–698, 2005.
Youngs, R. R., Chiou, S. J., Silva, W. J., and Humphrey, J. R.: Strong ground motion relationship for subduction earthquakes, Seismol. Res. Lett., 68, 58–73, 1997.
Zhao, J. X., Zhang, J., Asano, A., Ohno, Y., Oouchi, T., Takahashi, T., Ogawa, H., Irikura, K., Thio, H. K., Somerville, P. G., and Fukushima, Y.: Attenuation relations of strong ground motion in Japan using site classification based on predominant period, B. Seismol. Soc. Am., 96, 898–913, 2006.
- Abstract
- Introduction
- Geology, seismotectonics, and seismicity of study area (SA)
- Seismicity parameters
- Selection of ground motion prediction equation (GMPE)
- Delineation and spatial smoothening of seismic source model
- Computation models for determining hazard value
- Modelling of logic tree for hazard analysis
- Mapping of probability of exceedance using a different approach considering epistemic uncertainty
- Final hazard map using logic tree approach
- Conclusion
- Code and data availability
- Author contributions
- Competing interests
- Acknowledgements
- Financial support
- Review statement
- References
- Supplement