the Creative Commons Attribution 4.0 License.
the Creative Commons Attribution 4.0 License.
New approaches to modelling of local seismic amplification susceptibility using direct characteristics of influencing criteria: case study of Bam City, Iran
Reza Hassanzadeh
Mehdi Honarmand
Mahdieh Hossienjani Zadeh
Farzin Naseri
This paper proposes a new model in evaluating local seismic amplification susceptibility by considering direct characteristics of influencing criteria and it deals with uncertainty of modelling through production of fuzzy membership functions for each criterion. For this purpose, relevant criteria were identified by reviewing previous literature. These criteria include alluvial thickness, stiffness and strength of alluvial deposits, type of soil and particle size distribution of alluvial deposits, depth of groundwater, type of rock, topographic irregularities, slope, and type of bedrock. Two methods, analytic hierarchy process (AHP) and fuzzy logic (FL), were applied in order to define priority rank of each criterion and sub-criteria of each criterion through interview data of 10 experts. The criteria and sub-criteria were combined using the weighted linear combination method in GIS to develop a model for assessing local seismic amplification susceptibility in the study area of Bam City, Iran. The model's output demonstrated high to very high seismic amplification levels in central, eastern, northeastern, and northern parts of the study area. The validation results based on overall accuracy and kappa statistics showed 73.6 % accuracy, with 0.74 kappa indicating a good fit to the model's output. This model assists planners and decision makers in determining local seismic amplification susceptibility to be incorporated in designing new development plans of urban and rural areas and in making informed decisions regarding safety measures of existing buildings and infrastructures.
- Article
(13610 KB) - Full-text XML
-
Supplement
(228 KB) - BibTeX
- EndNote
This paper explores direct characteristics of influencing criteria in evaluating susceptibility of local seismic amplification and deals with uncertainty of modelling through production of fuzzy membership functions of each criterion. The MERM (2003) microzonation manual sets different criteria affecting the amplitude and duration of ground shaking at a specific site. These include
the magnitude of the earthquake, focal point and depth of the earthquake, directivity of the energy released, distance of rupture from the site, geological condition from the site to the location of the earthquake, local geological settings, geotechnical properties, and topographical condition of the site (SM Working Group, 2015; Boore, 2003; Hassanzadeh et al., 2013; Castelli et al., 2016a, b).
It has long been known that local conditions of foundation soils have a significant impact on the effects of an earthquake on building destruction level, as was demonstrated in previous earthquakes such as Mexico City, 1985 (Beck and Hall, 1986); Kobe, 1995 (Wald, 1996); Izmit, 1999 (Tang, 2000); Umbria-Marche earthquake, 1997 (Moro et al., 2007); Bam earthquake, 2003 (Ramazi and Jigheh, 2006); and L'Aquila earthquake, 2009 (Monaco et al., 2012; Capilleri et al., 2014), and buildings that were located on unconsolidated sediments had greater destruction levels (Ramazi and Jigheh, 2006).
The aim of seismic microzonation studies is to produce a ground-shaking map that can communicate efficient data to planners and policymakers in a geographic area to make informed decisions regarding development policies in urban areas. Therefore, this community requires accurate information for developing mitigation plans and strategies. In spite of this, there are uncertainties in determining local seismic amplification at a site, as this can be influenced by complex factors such as the earthquake source (epicentre of the earthquake), wave propagation, and site conditions. Uncertainty in these criteria results in an uncertain ground-motion estimate from earthquakes (Wang et al., 2016, 2017; Petersen et al., 2016). There are different methods that have been used for assessing ground-motion hazards such as probabilistic seismic hazard analysis (PSHA), deterministic seismic hazard analysis (DSHA), and scenario-based seismic hazard analysis (SSHA). The probabilistic seismic hazard analysis (PSHA) method (Cornell, 1968; Atkinson et al., 2015; Petersen et al., 2016) depends on “the length of the causative faults and depth of the earthquake”, which are generally unknown, thus causing uncertainty in assessing ground motion of earthquakes (Wang et al., 2017). In the DSHA method (Campbell, 2003; Atkinson and Boore, 2006) a lack of relevant ground motion–attenuation relationships for specific geographic areas can cause uncertainty in assessing ground motions of an earthquake (Wang et al., 2017). SSHA (Panza et al., 2012) applies ground-motion simulations of a scenario earthquake using specified source, path, and site parameters; however the parameters need to be defined in more detail. By conducting many simulations, earthquake variability of different sources, ground-motion propagation characteristics, and local site effects can be considered. Therefore, uncertainties using SSHA are quantified explicitly (Wang et al., 2017), although this method is still under development. Furthermore, Aucelli et al. (2018) proposed a method for producing a susceptibility index for local seismic amplification in Isernia Province, Italy, based on geological and geomorphological properties of studied areas. This research mostly followed an evidence-based approach to estimate the susceptibility level of local seismic amplification in the area, although they have not considered the use of multi-criteria decision-making methods (MCDMs) in their study. Several MCDM methods have been developed to deal with ranking and weighting of criteria, such as regime (Hinlopen et al., 1983), ELECTRE family (Figueira et al., 2005), analytical hierarchy process (AHP) (Saaty, 1980), and multiple attribute utility approach (MAUT) methods (Keeney and Raiffa, 1993). In this research, the analytical hierarchal process (AHP) (Saaty, 1980) has been utilized as it is one of the most useful methods in calculating criteria weights, and AHP in combination with GIS were applied to produce seismic microzonation maps of Bangalore (Sitharam and Anbazhagan, 2008), Delhi (Mohanty et al., 2007), Haldia, Bengal Basin (India) (Mohanty and Walling, 2008), Erbaa (Turkey) (Akin et al., 2013), and Al-Madinah (Moustafa et al., 2016) and to generate a ground-shaking map for Catania (Italy) using GIS (Castelli et al., 2016a). According to these methods experts evaluate and choose among qualitative and quantitative criteria. Since expert judgements can be subjective and imprecise, uncertainty also exists in this analysis. Such uncertainties can be dealt with based on fuzzy logic principles (Zadeh, 1965) and inference systems (Klir, 2004; Zadeh, 1975).
The fuzzy logic method was used for evaluation of earthquake damage to buildings (Sen, 2010), and evaluation of seismic microzonation (Teramo et al., 2005; Nath and Thingbaijam, 2009; Boostan et al., 2015). Although there were a number of publications on evaluating the local seismic amplification in the literature, few researchers have considered the use of the fuzzy logic approach and direct characteristics of each criterion in evaluation of local seismic amplification susceptibility. These are the motivations behind conducting this research.
The purpose of this paper is to develop a model for evaluation of local seismic amplification based on direct characteristics of relevant criteria. Firstly, selected criteria were weighted using the AHP method by interviewing 10 experts, next criteria were converted into fuzzy sets, then fuzzy membership functions (MFs) were produced, and finally the weighted linear combination (WLC) method and fuzzy inference rules were applied to produce a level 1 susceptibility map of local seismic amplification for a study area.
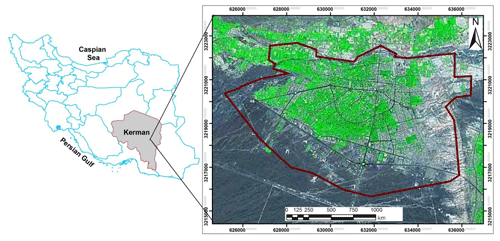
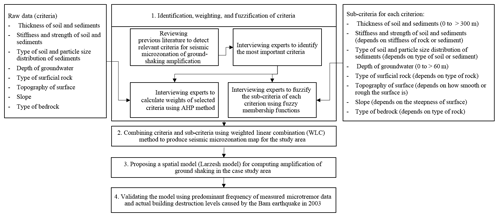
This study investigates the importance of influencing factors for susceptibility of local seismic amplification. Firstly, these criteria have been derived by a critical analysis of previous literature. Secondly, the analytic hierarchy process (AHP) and fuzzy logic (FL) methods have been applied to deal with weighting and fuzziness of criteria due to associated uncertainties in the decision-making process for preparing a susceptibility map of local seismic amplification through interviewing experts. Next, criteria and sub-criteria have been combined based on the WLC method to develop a model. Finally, the model has been validated using overall accuracy (OA) and kappa statistics methods by comparing to the measured values. This study has been conducted on a case study of Bam City, southeast of Iran (Fig. 1), and it followed the four steps of investigations shown in Fig. 2.
2.1 Identification, weighting, and fuzzification of criteria
The susceptibility level of local seismic amplification can be influenced by several criteria. These criteria were identified by reviewing literature and interviewing experts in the data gathering process. Then, identified and selected criteria were weighted and fuzzified using the AHP and FL methods, as explained in the following subsections.
2.2 Analytical methods
2.2.1 Analytic hierarchy process (AHP) method
AHP is one of the most commonly used multi-criteria decision-making (MCDM) tools and allows the consideration of both objective and subjective factors in ranking alternatives in a hierarchical decision model (Saaty, 1980, 1990). This method is applied to convert the experts' view on the importance of each criterion and sub-criterion to a numerical value by comparing each other, one pair at a time (pair-wise comparison) (Saaty, 1980).
An AHP matrix (A) is developed from the pair-wise comparison of the relative importance of criterion Ai to criterion Aj (αij, represents a quantified judgement on a pair of criteria) (Eq. 1). The values assigned to αij according to the scale of Saaty (1980) range from 1 to 9 or their reciprocals. In order to calculate the priority ranking of each criterion (weight), Saaty (1990) suggested the mathematical computation of an eigenvector based on Eqs. (2) and (3).
where λmax is the largest eigenvalue, αij is the judgement, Wi and Wj are numerical weights for judgement αij.
where A is the AHP matrix, λmax is the largest eigenvalue, I is the unique matrix, and X is the eigenvector.
In addition, the assignment of weights to each criterion relates to the process of the experts' logical and analytical thinking, which is tested for each matrix with consistency ratio (CR) statistics. If the statistics are less than 0.1 (CR < 0.1), the experts' answers are logical. Following the testing for consistency, the weights are aggregated to determine ranking of decision alternatives (the weights) for each criteria. Therefore, in this research, the AHP method is applied to calculate the degree of importance of each criterion influencing the susceptibility level of local seismic amplification in a region.
2.2.2 Fuzzy logic (FL) method
Fuzzy logic is a method of “approximating modes of reasoning” (Novák et al., 2012), and it is a mathematical tool that deals with uncertainty in a different way that can relate independent variables to dependent variables. Zadeh (1965) introduced fuzzy set theory indicating that the boundary is not precise and the gradual change is expressed by a membership function, and it changes from non-membership to membership in a fuzzy set (Eq. 4). The characteristic function value ranges between 0 and 1. Each membership function is represented by a curve that indicates the assignment of a membership degree in a fuzzy set to each value of a variable. Curves of the membership functions can be linear, triangles, trapezoids, bell-shaped, or more complicated shapes (Fig. 3) depending on the purpose of the subject (Demicco and Klir, 2003).
where Aa is called the a-cut or a-level set of A, and μA(x) represents membership degree of the element x.
Fuzzy systems are mainly based on expert knowledge to formalize reasoning in natural language mostly using sets of fuzzy inference rules or “if–then” rules (Eq. 5).
As membership function curves can easily be changed by small increments based on expert knowledge, fuzzy logic can characterize and model geologic systems in an efficient way (Klir, 2004; Demicco and Klir, 2003). Therefore, in this research using a fuzzy set, the uncertainties in producing a microzonation map of ground shaking can be managed by defining fuzzy membership functions for each criterion. This happens by assigning meaningful values (0 to 1) to each individual (sub-criteria) of each criterion. For the purpose of defuzzification, the largest-of-the-maximum method was applied. Based on this method the largest value of the fuzzy subset was the output value (Mancini et al., 2012).
2.3 Data gathering
In order to identify influencing criteria in local seismic amplification, the required data were collected through a literature review and semi-structured interviews with 10 experts, who were involved in the geology, seismology, tectonic, structural engineering, and geomorphology fields. They were asked about the criteria that can influence local seismic amplification, and then these data were analysed using AHP and FL methods as explained in the following.
2.3.1 Determining the relevant criteria by reviewing literature
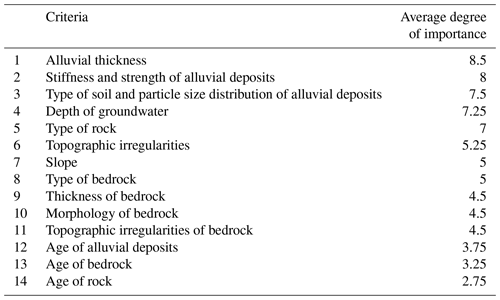
The potential criteria influencing local seismic amplification susceptibility were determined through a critical review of literature. By reviewing documents on earthquake engineering, seismology, geology, tectonic and structural engineering, geomorphology, and seismic microzonation reports and guidelines (Fäh et al., 1997; Ding et al., 2004; Molina et al., 2010; Mundepi et al., 2010; Marulanda et al., 2012; Hassanzadeh et al., 2013; FEMA, 2014; Fraume et al., 2014; Grelle et al., 2014, 2016; SM Working Group, 2015; Rehman et al., 2016; Nwe and Tun, 2016; GEM, 2017; CAPRA, 2017; Michel et al., 2017; Trifunac, 2016; Hassanzadeh and Nedovic-Budic, 2016), in total 14 influencing criteria were identified (Table 1).
2.3.2 Expert-knowledge data
a. Interviewing disaster managers (semi-structured interviews) to determine the important criteria
The most important criteria were determined by conducting a semi-structured interview with 10 experts using the snowball or chain-referral sampling method (Biernacki and Waldorf, 1981). In this study, all 10 interviewees were highly experienced and had been involved in seismic microzonation studies. The average age of the sampled individuals was 43 years, and all of them had a postgraduate degree.
A list of criteria that were identified by reviewing previous studies were given to the experts and they were asked to add other criteria if they thought they were applicable. They were asked to rank each criterion using a five-point Likert scale (Likert, 1932), so respondents could choose the option that best reflected their opinion on each criterion. When surveying many people for the same criterion, the five codes could be summed up, averaged, or used to calculate the mode, indicating overall positive or negative orientation towards that criterion. This basis was used to identify the degree of importance for each criterion in local seismic amplification in a region. Therefore, in order to elicit the most relevant criteria, the significance of specific factors was measured on a five-point Likert scale, where 1 represents “not important at all”, 3 “of little importance”, 5 “of average importance”, 7 “very important”, and 9 “extremely important” (Likert, 1932; Jamieson, 2004). The collected data were analysed and criteria with mean ratings above 5 (of average importance) were selected (Table 2). These have then been considered for further analysis using the analytic hierarchy process (AHP) method.
A questionnaire based on an AHP matrix (A) was developed for a pair-wise comparison of the relative importance of the criteria for calculating the weights (priority ranking) of each criterion. As AHP is a subjective method, a large sample size is not needed (Cheng and Li, 2002; Lam and Zhao, 1998). For this reason, data were collected by interviewing 10 experts (the same experts who were interviewed in the first round) based on the structured questionnaire (closed-ended questions). They were asked to compare the relative importance of each criterion against all others, based on Saaty's scale by verbal preferences (Saaty, 1980). A pair-wise comparison that was carried out with an expert is shown in Table 3. These data are used by the AHP method to compute the weight of each criterion as explained previously.
b. Determining fuzzy set and fuzzification of thresholds of sub-criteria for each criterion
In the next step, since each criterion and its sub-criteria have a different effect on local seismic amplification susceptibility in a region, fuzzy membership functions (MFs) for sub-criteria of each criterion are defined. As designed parameters of each membership function depend on expert knowledge, then number of memberships, shape, positioning, an overlay area of memberships of each MF for each criterion would be different. To conduct this analysis, 10 experts were interviewed regarding membership degree of sub-criteria of each criterion, and mode of each sub-criterion was calculated and MFs for each criterion were depicted as described in the following.
-
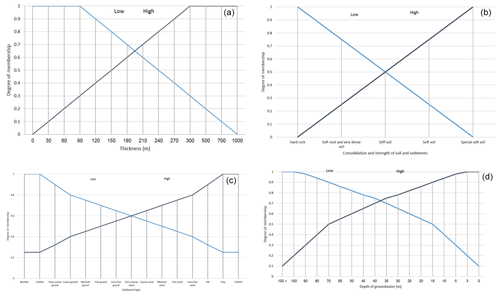
Thickness of soil and sediments. An effective factor in site effect assessment is the thickness of sediments. Rezaei et al. (2009) stated that the soil thickness demonstrated a positive relationship to damage rate observations in the Bam earthquake. This layer was produced by 245 geophysical, geotechnical, and sedimentological sampling sites across the city. The alluvial thickness varies in different parts of the city. In the northern part of the city, the sediment (marine to continental Quaternary deposits including alluvial plain gravels with interlayered clay, silt, and sand) thickness ranges from 0 m, where bedrock is exposed beneath Arg-e-Bam, to 90 m across most of the northern half of the study area. Toward the south and centre of the study area, sediment thickness increases over a short distance, to more than 270 m. This defines a subsurface of high sediment thickness that extends across the entire study area from west to east and underlies south-central Bam. Therefore, based on a positive relationship between the damage rate and alluvial thickness (Rezaei et al., 2009; Marie Nolte, 2010), MF for this criterion is depicted in Fig. 4a.
-
Consolidation and strength of soil and sediments. It has been frequently observed that earthquake damage is greater in settlements located on unconsolidated and soft soils than in those sited on stiff soils or hard rock. For example, in the Bam earthquake strong amplification occurred due to the extremely soft clay layers that caused high-rise buildings to collapse (Jafari et al., 2005). Another example was the Loma Prieta earthquake that happened in 1989, where much of the damage occurred in the central San Francisco Bay area at sites underlain by thick deposits of soft clay soils (Stewart, 1997). The soil classification has been based on different thresholds for the average shear wave velocity (Vs) to a depth of 30 m by the National Earthquake Hazard Reduction Program (NEHRP) to characterize sites for purposes of estimation amplification of seismic motions. This standard was applied in Unified Building Code (Dobry et al., 2000) and Eurocode 8 (Sabetta and Bommer, 2002; Kanlı et al., 2006). Based on this classification in areas on unconsolidated sediments, shear wave velocity decreases, and expected amplification during earthquakes could be increased. Therefore, with this in mind, MFs for each class have been calculated as shown in Fig. 4b.
-
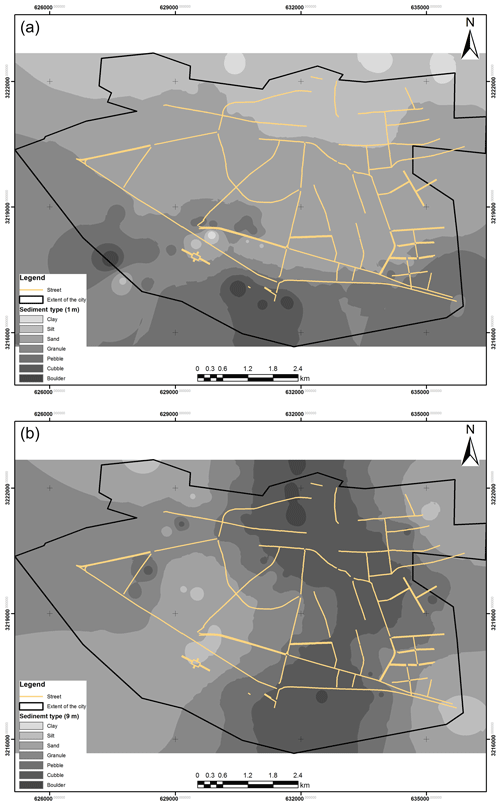
Type of soil and particle size distribution of sediments. It has long been recognized that the destructiveness of ground shaking during earthquakes can be significantly worsened by the type of local soil and subsurface sediment conditions. In past events, the observed variability in seismic intensity and structural damage severity has often been attributed to the variability of soil and subsurface sediment stratigraphy in a given area. Among the geotechnical properties of soil and sediments, grain size is one of the most important criteria (Assimaki et al., 2006; Phoon et al., 2006). In the study area, Rezaei et al. (2009) identified eight sediment types: clay, silt, sand, granules, pebbles, cobbles, and boulders. They stated that the grain size in the shallow subsurface (<10 m) decreases across the city from south to north and increases with depth. Their investigation showed that fine-grained soils and sediments (clay, clayey sand, cohesive sandy mud, and cohesive muddy sand) dominated the northern part of the city at shallow depths. In the central part of the city, fine-grained sediments changed laterally to coarse-grained sediments (poorly sorted sand, well-rounded gravel, poorly sorted gravel, and muddy or sandy gravel), which dominated in the south part of the city. As a rule, it can be assumed that the smaller the grain size of sediments, the lower the shear wave velocity and therefore the greater the effect of the seismic wave on the destruction level of buildings (Rezaei et al., 2009; Assimaki et al., 2006; Phoon et al., 2006). Therefore, the MFs for each specific grain size are calculated in Fig. 4c.
-
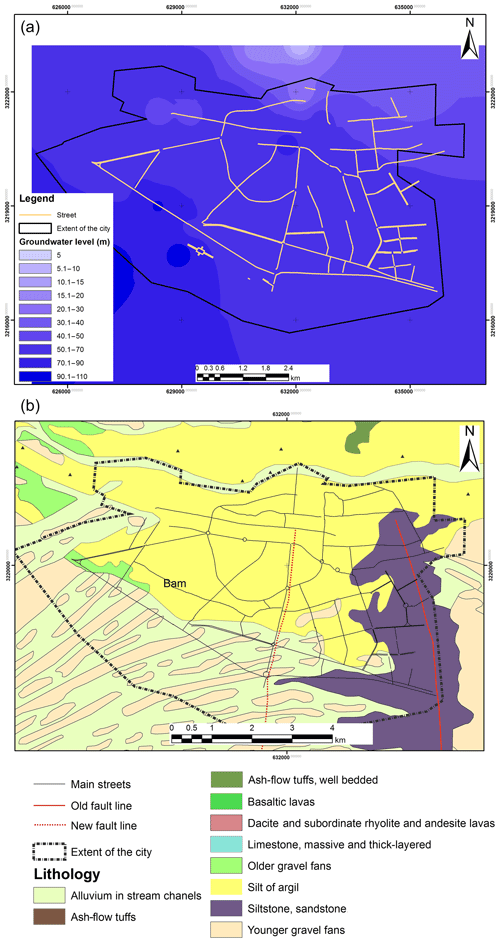
Depth of groundwater. Research on the effects of groundwater shows it can magnify an earthquake's damage. The most well-known effect is liquefaction. The geologic and hydrologic factors that affect liquefaction susceptibility are the age and the type of sedimentary deposits, the looseness of cohesion, and the depth to the groundwater table (Tinsley et al., 1985; Cavallaro et al., 2018). The liquefaction is mostly limited to water-saturated, cohesionless sediments and granular sediments at depths less than 15 m (Iguchi and Tainosho, 1998; NDMA, 2011). Noack and Fah (2001) categorized it by the depth of the water table, which is split into three classes where the weight of the class increases while the groundwater table decreases (Fäh et al., 1997). Therefore, due to the geological conditions in Bam, liquefaction is considered of minor importance because Talebian et al. (2004) and Rezaei et al. (2009) found water-saturated sands in very few places; however, they reported high amplification in areas where groundwater level was very close to the ground surface by analysing microtremor data. Accordingly, MFs for each class of groundwater depth are computed as shown in Fig. 4d.
-
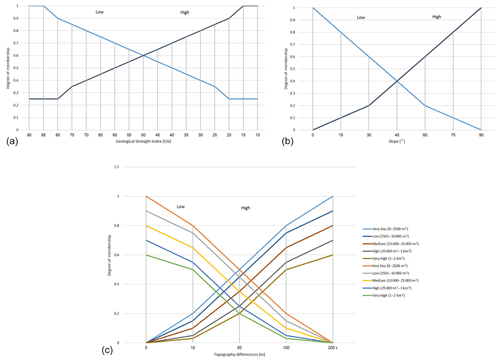
Type of rock. The type of rocks can affect local seismic amplification susceptibility in a region. Three main types of rock based on their formation process include igneous, metamorphic, and sedimentary rocks. Each type has its own subcategories and what matters in this research is how hard or soft and how dense the specific type of rock is in comparison with the other types. Geological Strength Index (GSI) of “rock masses depends on rock's material, the amount of joints and their relations, alteration, and presence of water” (Hoek and Brown, 1997). There are many rock types in nature for which GSI can be calculated based on their condition, and then this value can be fuzzified, addressing the rock type's effect on seismic microzonation level of ground shaking. There are five classes of GSI including very good, good, fair, poor, and very poor based on their surface quality and interlocking of rock pieces such as massive, blocky, very blocky, disintegrated, and laminated/sheered (Marinos et al., 2007). The GSI values are categorized into five classes including very low, low, medium, high, and very high. These classes show the geological strength of rocks that the high and very high GSI demonstrate. Therefore, previous studies demonstrate that in massive rocks, with high GSI values, seismic waves pass quickly and therefore have a small influence in seismic microzonation level of ground shaking, and vice versa if GSI value is low. Thus, in the fuzzification process of surficial rocks, the rocks with very high GIS are assigned 0 and the rocks with very low GSI are assigned 1 (Fig. 5a). Furthermore, the criterion of type of bedrock acts the same as the surficial rock type criterion as explained above. Type of bedrock rarely changed over a small extent with homogenous lithology. However, it was of concern for experts in determining local seismic amplification susceptibility.
-
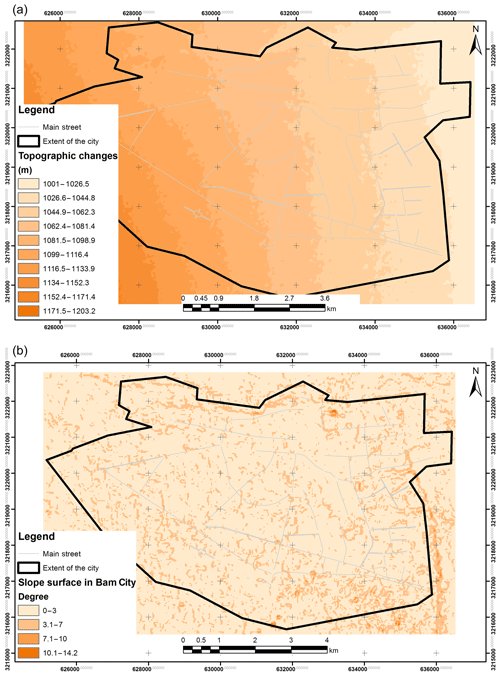
Slope. The effects of slope angle on topographic amplification factor were investigated by Bisch et al. (2012), and they classified the slope angle into three categories with different effect levels including 0–15 with no effect, 15–30∘ with 1.2 (coefficient), and more than 30∘ with a 1.4 amplification coefficient. However, Cavallaro et al. (2012) suggested that topographic amplification factor can be considerable for slope even less than 15∘. Furthermore, Bouckovalas and Papadimitriou (2005) investigated the influence of slope topography in amplifying the peak horizontal seismic ground acceleration suggesting high amplifications near the crest. Grelle et al. (2016) presented formulae for topographic amplification on slope surface. These studies indicated that with the increase in slope angle the amplification factor would increase. This can be a basis for depicting MFs of this criterion (Fig. 5b).
-
Topographic irregularities. Seismic amplification has been witnessed in several earthquakes due to topographical changes (Geli et al., 1988; Paolucci, 2002; Cavallaro et al., 2012). Bisch et al. (2012) classified the site in two classes of “isolated cliff and ridge with crest width significantly less than base width” (CEN European Committee for Standardisation, 1994, p. 93). However, this seems simplistic, as it does not consider the elevation differences. Furthermore, Grelle et al. (2016) presented an equation that considered the local slope height, relief height, regional share wave velocity, and relief ratio. In addition, several calibration constants should be calculated using 2-D numerical analysis for each study area to compute topographic effects on local seismic amplification. Cavallaro et al. (2008) investigated a 2-D model for analysing site response of the Monte Po Hill in the city of Catania considering the effect of topographic and stratigraphic properties on the amplification factor in an area. They concluded that near the slope crest, the effect of topographic properties on amplification factor is more relevant than stratigraphic property. Lee et al. (2009) found out that the amplification on top of elevated surfaces with a small extent was much higher than for valleys and flat areas. Therefore, the elevation differences (dH, m) between the base of a hill to the top of the hill and the area (A, m2) of the top part of the hill are the main drivers in computing the amplification coefficient of seismic waves that can affect the local seismic amplification susceptibility level of ground. Therefore, the higher the elevation differences and the smaller the area of the elevated surface, the higher the amplification of the ground in this part. Here, using fuzzy logic and expert knowledge, the effect of topography in terms of elevation differences in determining local seismic amplification susceptibility in the study area is defined (Fig. 5c).
2.3.3 Preparing thematic data
The required data were collected from relevant organizations and documents and they were converted to GIS files in that papered maps were scanned, geo-referenced, and then digitized. These maps were imported into a geodatabase to validate topological rules and overlaying conditions for all layers. To produce thematic maps, interpolation methods such as the inverse distance weighting (IDW) method were applied. The produced maps were then classified based on sub-criteria for each criterion; then they were reclassified and converted to raster layers enabling raster combination of all layers to each other. These thematic data included alluvial thickness (Fig. 6a), stiffness and strength of soil and sediments (Fig. 6b), type of soil and particle size distribution of soil and sediments (Fig. 7a and b), depth of groundwater (Fig. 8a), type of rock (Fig. 8b), topographic irregularities (Fig. 9a), and slope (Fig. 9b) layers.
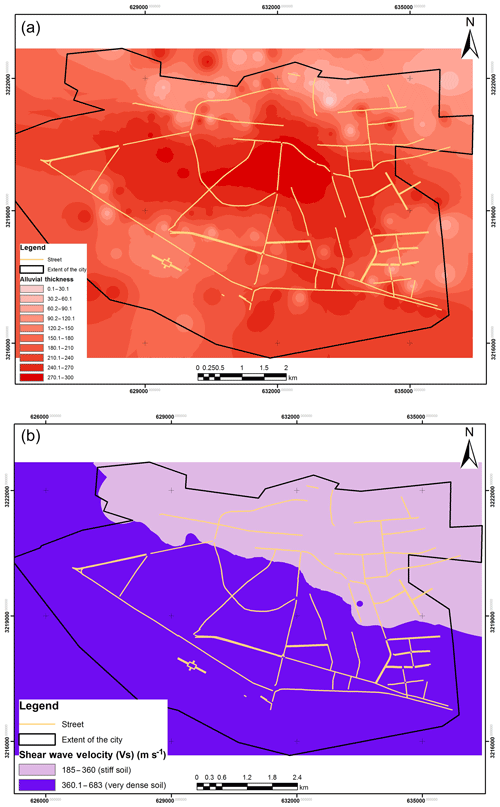
Figure 6Thematic layers of Bam City: alluvial thickness (m) (a) and stiffness and strength of soil and sediments (b).
2.3.4 Preparing control data
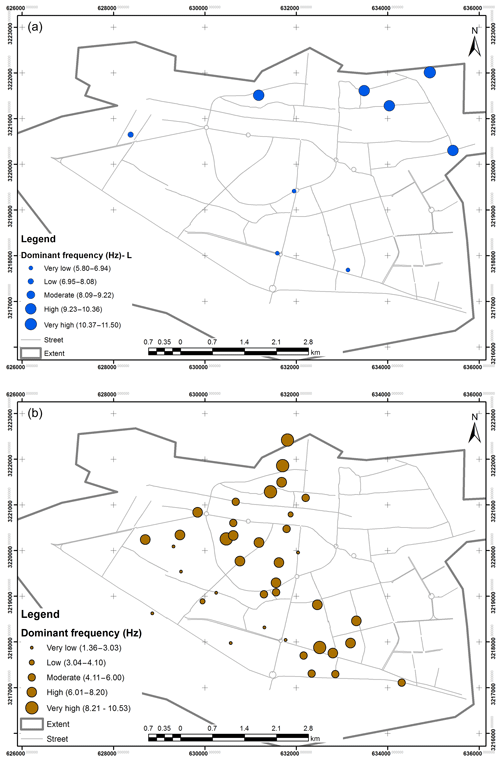
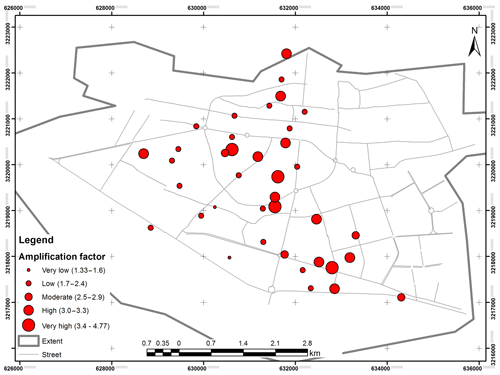
NCCI (2003) and Hisada et al. (2005) collected data on the destruction level of buildings after the Bam earthquake (Fig. 10a and b). LashkariPour et al. (2006) and Motamed et al. (2007) collected data on the dominant frequency of soil (Fig. 11a and b) and amplification factor by Motamed et al. (2007) (Fig. 12) using microtremor measurements in Bam City. These datasets were classified into five classes based on an equal interval classification method including very low, low, moderate, high, and very high classes. Then the datasets were applied to validate the model's output through a comparison analysis and calculating overall accuracy and kappa coefficient.
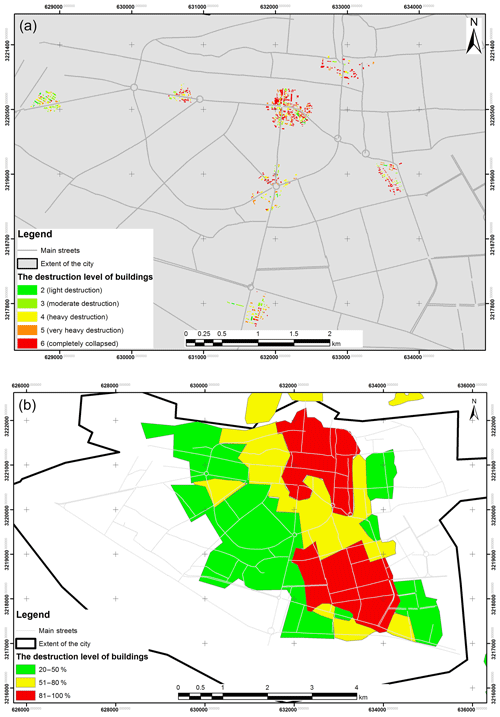
Figure 10Control data: actual building destruction level (Hisada et al., 2005) (a) and percentage of damage to buildings caused by the Bam earthquake in 2003 (NCCI, 2003) (b).
2.4 Spatial combination methods and overlay rules
The spatial multi-criteria decision-making (MCDM) approach is a decision aid and a mathematical tool that combines and transforms spatially referenced data into a raster layer with a priority score (Roy, 1996; Malczewski, 2006). Several combination methods have been developed, such as Boolean operations (Malczewski, 1999), weighted linear combination (WLC: combining the normalized criteria based on overlay analysis) (Voogd, 1983; Drobne and Lisec, 2009; O'Sullivan and Unwin, 2010) (Eq. 6), ordered weighted averaging (OWA) (Yager, 1988; Rinner and Malczewski, 2002), and the analytical hierarchy process (AHP) based on additive weighting methods (Zhu and Dale, 2001). In this research, the AHP method (Saaty, 1980) was used to derive the weights associated with criteria and the fuzzy logic method was applied to compute sub-criteria's membership functions (MFs) in order to produce the local seismic amplification. Then, the degree of membership of each sub-criterion (calculated with the fuzzy logic method) is assigned to the corresponding sub-criteria. Next, this is multiplied by the weight of the corresponding criteria (calculated with the AHP method). Finally, they are summed up in a linear manner using the WLC method (Eq. 6) to develop the model (Larzesh model) for production of the local seismic amplification in the study area.
where wj is the calculated weight of criterion j, Xij is the degree of membership of the ith sub-criterion with respect to the jth criterion, and Ai is the local seismic amplification index at the ith location.
2.5 Validation and comparison methods
In order to validate the model, as categorical variables are the main driver of model development in this research, relevant measures such as overall accuracy and kappa statistics will be applied to measure the performance of the model.
a. Overall accuracy (OA)
Accuracy assessments determine the quality of the results derived from data analysis or a model, in comparison with a reference or ground truth data (where ground truth data are assumed to be 100 % correct) (Congalton and Green, 2009). The accuracy assessment can be obtained by creating a contingency table of counts of observations, with calculated, estimated, or predicted data values as rows and with reference data values as columns. The values in the shaded cells along the diagonal represent counts for correctly classified observations, where the reference data match the predicted value. This contingency table is often referred to as a confusion matrix, misclassification matrix, or error matrix (Czaplewski, 1992; Congalton and Green, 2009) (Eq. 7).
where OA is overall accuracy, nkk is values in a diagonal cell of the matrix (correctly classified observations), and n is number of observations.
b. Kappa analysis
The kappa statistic (κ) (Sim and Wright, 2005; Congalton and Green, 2008) calculates degree of agreement between classes of two independent observations measuring the same property. The degree of kappa would be 0 for a random classification and 1 for classification. Degree of agreement of kappa interpretations are as follows: less than 0.4: poor agreement; 0.4 and 0.8: moderate agreement; and greater than 0.80: strong agreement (Congalton and Green, 2008) (Eq. 8).
where Po is the relative observed agreement among raters, and Pe is the hypothetical probability of chance agreement.
In order to produce the local seismic amplification susceptibility, the most important criteria were identified and then weighted using the AHP pair-wise comparison method. The higher weights belong to alluvial thickness (0.271), stiffness and strength of soil and sediments (0.207), type of soil and particle size distribution of sediments (0.177), depth of groundwater (0.171), topographic irregularities (0.054), type of rock (0.041), slope (0.040), and type of bedrock (0.040). Then, based on the fuzzy logic method sub-criteria of each criterion were fuzzified and membership functions for them was defined. Next, these criteria were combined based on the weighted linear combination (WLC) (Drobne and Lisec, 2009) in GIS to develop the model for producing the susceptibility map of local seismic amplification for the study area, as is proposed in the following (Eq. 9):
where Aj is local seismic amplification susceptibility. Weights of each criterion are as follows: wSs is stiffness and strength of soil and sediments, wTA is alluvial thickness, wSA is type of soil and particle size distribution of sediments, wDGw is depth of groundwater, wTR is type of rock, wTBr is type of bedrock, wTS is topographic irregularities, wSL is slope. Fuzzified sub-criteria of each criterion are as follows: FSss is stiffness and strength of soil and sediments, FSTA is alluvial thickness, FSSA is type of soil and particle size distribution of soil and sediments, FSDGW is depth of groundwater, FSTR is type of rock, FSTBR is type of bedrock, FSTS is topographic irregularities, and FSSL is slope.
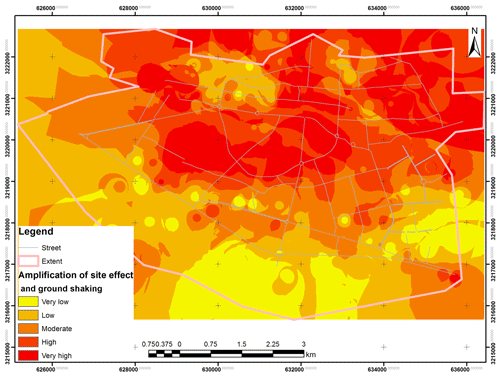
Figure 13 displays the resulting microzonation map of ground shaking in Bam City. The areas with high to very high susceptibility to local seismic amplification are located in the north, east, and northeast parts of Bam City. This is due to the widespread unconsolidated sediments and low groundwater level in combination with high sediment thickness.
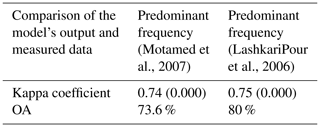
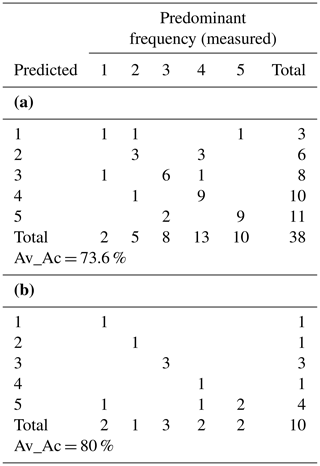
In order to validate the results, the OA and kappa methods were applied comparing the output of the model with the measured predominant frequency (Askari et al., 2004; LashkariPour et al., 2006; Motamed et al., 2007) in the study area. The results demonstrated 73.6 % and 82 % (Table 4a and b) for OA and 0.74 and 0.75 for kappa (Table 5), indicating a good fit of the model's output with the measured data. Moreover, the overlay of the building destructions caused by the Bam earthquake in 2003 (Hisada et al., 2005; NCCI, 2003) shows that high destruction levels happened in locations with high ground shaking, which were located in the central, north, and northeast parts of the city.
Table 4Comparison between the model's output and the measured predominant frequency in Bam City by (a) Motamed et al. (2007) and (b) LashkariPour et al. (2006).
In this study, we have focused on the site effect and local geology properties of a site that have a massive influence on local seismic amplification susceptibility in the study area. To deal with related uncertainties in preparing seismic microzonation, the most important criteria were selected, weighted, and then fuzzified. Criteria with a high uncertainty degree such as distance of active fault to the site, depth, and magnitude of the probable earthquake were not considered because there was no possibility to find out exactly where and how an earthquake will be triggered. Therefore, only the criteria with known location (x and y) and known characteristics were taken into consideration.
Furthermore, to deal with uncertainties fuzzy logic is a suitable approach as we can define the membership function of the effect of each criterion in the amplification of ground shaking by interviewing 10 experts and obtaining expert knowledge. This can result in realistic output regarding the behaviour of each criterion in ground-shaking calculation.
The newly developed model uses AHP and fuzzy logic (Zadeh, 1965) to deal with complexities and uncertainties in data analyses in weighting the criteria and fuzzifying the sub-criteria of each criterion. However, in studies for evaluating seismic microzonation in Bangalore (India) (Sitharam and Anbazhagan, 2008), Delhi (Mohanty et al., 2007), Haldia (India) (Mohanty et al., 2007), Erbaa (Turkey) (Akin et al., 2013), and Al-Madinah (Moustafa et al., 2016) only the AHP method was applied to weight the criteria, and none of these studies considered weighting of sub-criteria for each criterion, even using other methods.
Few researchers have considered direct properties of influencing factors in assessing ground-shaking amplification. Even in evaluating developed seismic response models such as SiSeRHMap v1.0 (Grelle et al., 2016) and the GIS cubic model (Grelle et al., 2014), the researchers have applied only lithodynamic, stratigraphic, and topographic effects as influencing factors. Furthermore, Aucelli et al. (2018) suggested a method for producing susceptibility index to local seismic amplification in Isernia Province, Italy, and they have considered geological and geomorphological properties of studied areas. However, they have not considered the use of multi-criteria decision-making methods (MCDMs) in weighting and combining the influencing criteria, which is the aim of the current study. The current research considers direct properties of each criteria and tries to manage uncertainties in criteria and sub-criteria of each criterion via weighting and fuzzification processes using expert knowledge and the use of direct properties of criteria. These processes can be extended in more details, which are subject to more investigation in the future.
The Larzesh model introduces a new method based on AHP and fuzzy logic rules that enables experts to produce local seismic amplification susceptibility using direct properties of lithological, sedimentological, geological, hydrological, and topographical effects in a study area using expert knowledge in weighting and fuzzifying criteria and sub-criteria that can be readily perceived and consulted.
The application of the model was carried out in the urban area of Bam City in Iran. The results demonstrated that high to very high ground-shaking amplifications were located in the central, east, and northeast to north parts of the city, which was confirmed by comparing with measured microtremor data on predominate frequency in the study area. However, as the proposed model is a spatial computational tool, the validation of output in producing local seismic amplification is strictly dependent on the quality and preparation of input data.
In conclusion, the model enables disaster managers, planners, and policymakers to produce local seismic amplification susceptibility and make informed decisions in urban planning and designing appropriate plans for urban development, especially in areas with high levels of seismic activity.
Data sets can be found in the Supplement.
The supplement related to this article is available online at: https://doi.org/10.5194/nhess-19-1989-2019-supplement.
RH conceived and designed the analysis, collected the data and performed data analysis, and wrote the paper. MH conceived and designed the analysis and helped write the paper. MHZ and FN helped with data analysis and writing the paper.
The authors declare that they have no conflict of interest.
The authors would like to express their appreciation to the Institute of Science and High Technology and Environmental Sciences, Graduate University of Advanced Technology, Kerman, Iran, for financial support of this study under grant number 7/C/95/2053.
This research has been supported by the Department of Ecology, Institute of Science and High Technology and Environmental Sciences, Graduate University of Advanced Technology, Kerman, 7631133131, Iran (grant no. 7/C/95/2053).
This paper was edited by Oded Katz and reviewed by three anonymous referees.
Akin, M. K., Topal, T., and Kramer, S. L.: A newly developed seismic microzonation model of Erbaa (Tokat, Turkey) located on seismically active eastern segment of the North Anatolian Fault Zone (NAFZ), Nat. Hazards, 65, 1411–1442, https://doi.org/10.1007/s11069-012-0420-1, 2013.
Askari, F., Azadi, A. M. D., Ghayamghamian, E. H., Hamzehloo, H., Jafari, M. K., Kamalian, M., Keshavarz, M., Ravanfar, O., and Shafiee, A., and Sohrabi-Bidar, A.: Preliminary Seismic Microzonation of Bam, J. Seismol. Earthq. Eng., 5, 69–80, 2004.
Assimaki, D., Steidl, J., and Liu, P.: Attenuation and Velocity Structure for Site Response Analyses via Downhole Seismogram Inversion, Pure Appl. Geophys., 163, 81–118, https://doi.org/10.1007/s00024-005-0009-7, 2006.
Atkinson, G. M. and Boore, D. M.: Earthquake ground-motion prediction equations for eastern North America, Bull. Seismol. Soc. Am., 96, 2181–2205, 2006.
Atkinson, G. M., Ghofrani, H., and Assatourians, K.: Impact of induced seismicity on the evaluation of seismic hazard: Some preliminary considerations, Seismol. Res. Lett., 86, 1009–1021, 2015.
Aucelli, P. P. C., Di Paola, G., Valente, E., Amato, V., Bracone, V., Cesarano, M., Di Capua, G., Scorpio, V., Capalbo, A., and Pappone, G.: First assessment of the local seismic amplification susceptibility of the Isernia Province (Molise Region, Southern Italy) by the integration of geological and geomorphological studies related to the first level seismic microzonation project, Environ. Earth Sci., 77, 118, 2018.
Beck, J. L. and Hall, J. F.: Factors contributing to the catastrophe in Mexico City during the earthquake of September 19, 1985, Geophys. Res. Lett., 13, 593–596, 1986.
Biernacki, P. and Waldorf, D.: Snowball sampling: Problems and techniques of chain referral sampling, Sociol. Meth. Res., 10, 141–163, 1981.
Bisch, P., Carvalho, E., Degee, H., Fajfar, P., Fardis, M., Franchin, P., Kreslin, M., Pecker, A., Pinto, P., and Plumier, A.: Eurocode 8: seismic design of buildings worked examples, Joint Research Centre European Union, Luxembourg, 2012.
Boore, D. M.: Simulation of ground motion using the stochastic method, in: Seismic Motion, Lithospheric Structures, Earthquake and Volcanic Sources: The Keiiti Aki Volume, edited by: Ben-Zion, Y., Birkhäuser, Basel, 635–676, 2003.
Boostan, E., Tahernia, N., and Shafiee, A.: Fuzzy – probabilistic seismic hazard assessment, case study: Tehran region, Iran, Nat, Hazards, 77, 525–541, 2015.
Bouckovalas, G. D. and Papadimitriou, A. G.: Numerical evaluation of slope topography effects on seismic ground motion, Soil Dynam. Earthq. Eng., 25, 547–558, 2005.
Campbell, K. W.: Prediction of strong ground motion using the hybrid empirical method and its use in the development of ground-motion (attenuation) relations in eastern North America, Bull. Seismol. Soc. Am., 93, 1012–1033, 2003.
Capilleri, P., Cavallaro, A., and Maugeri, M.: Static and dynamic soil characterization at Roio Piano (AQ), Ital. Geotech. J., 35, 38–52, 2014.
CAPRA – Probabilistic Risk Assessment: Risk Assessment, available at: https://www.ecapra.org/software, last access: 17 April 2017.
Castelli, F., Cavallaro, A., Grasso, S., and Lentini, V.: Seismic microzoning from synthetic ground motion earthquake scenarios parameters: the case study of the City of Catania (Italy), Soil Dynam. Earthq. Eng., 88, 307–327, 2016a.
Castelli, F., Cavallaro, A., Grasso, S., and Ferraro, A.: In situ and laboratory tests for site response analysis in the ancient city of Noto (Italy), in: Proceedings of the 1st IMEKO TC4 International Workshop on Metrology for Geotechnics, Benevento, Italy, 17–18, 2016.
Cavallaro, A., Ferraro, A., Grasso, S., and Maugeri, M.: Site response analysis of the Monte Po Hill in the City of Catania, AIP Conference Proceedings, 2008, 240-251,
Cavallaro, A., Ferraro, A., Grasso, S., and Maugeri, M.: Topographic effects on the Monte Po hill in Catania (Italy), Soil Dynam. Earthq. Eng., 43, 97–113, 2012.
Cavallaro, A., Capilleri, P., and Grasso, S.: Site characterization by dynamic in situ and laboratory tests for liquefaction potential evaluation during Emilia Romagna earthquake, Geosciences, 8, 242, 2018.
CEN European Committee for Standardisation: Eurocode 8. Design Provisions for Earthquake Resistance of Structures – Part 5: Foundations, Retaining Structures and Geotechnical Aspects, ENV 1998-5, Brussels, 1994.
Cheng, E. W. L. and Li, H.: Construction partnering process and associated critical success factors: quantitative investigation, J. Manage. Eng., 18, 194–202, 2002.
Congalton, R. G. and Green, K.: Assessing the accuracy of remotely sensed data: principles and practices, CRC Press, Taylor & Francis Group, Boca Raton, 2008.
Congalton, R. G. and Green, K.: Assessing the Accuracy of Remotely Sensed Data: Principles and Practices, CRC Press, Boca Raton, FL, USA, 2009.
Cornell, C. A.: Engineering seismic risk analysis, Bull. Seismol. Soc. Am., 58, 1583–1606, 1968.
Czaplewski, R. L.: Misclassification bias in areal estimates, Photogram. Eng. Remote Sens., 58, 189–192, 1992.
Demicco, R. V., and Klir, G. J.: Fuzzy logic in geology, Elsevier Academic Press, Amsterdam, Boston, 347 pp., 2003.
Ding, Z., Chen, Y., and Panza, G.: Estimation of site effects in Beijing City, Pure Appl. Geophys., 161, 1107–1123, 2004.
Dobry, R., Borcherdt, R. D., Crouse, C. B., Idriss, I. M., Joyner, W. B., Martin, G. R., Power, M. S., Rinne, E. E., and Seed, R. B.: New site coefficients and site classification system used in recent building seismic code provisions, Earthq. Spectra, 16, 41–67, 2000.
Drobne, S. and Lisec, A.: Multi-attribute Decision Analysis in GIS: Weighted Linear Combination and Ordered Weighted Averaging, Informatica (Slovenia), 33, 459–474, 2009.
Fäh, D., Rüttener, E., Noack, T., and Kruspan, P.: Microzonation of the city of Basel, J. Seismol., 1, 87–102, https://doi.org/10.1023/a:1009774423900, 1997.
FEMA – Federal Emergency Management Agency: Multi-hazard Loss Estimation Methodology, Earthquake Model, HAZUS® MH MR5, User Manual, FEMA, Washington, D.C., 2014.
Figueira, J., Mousseau, V., and Roy, B.: ELECTRE methods, in: Multiple criteria decision analysis: State of the art surveys, Springer Science & Business Media, 133–153, 2005.
Fraume, M., Cristina, M., Carreño Tibaduiza, M. L., Cardona Arboleda, O. D., Ordaz Schroeder, M. G., and Barbat Barbat, H. A.: Probabilistic earthquake risk assessment of Barcelona using CAPRA, in: Second European Conference on Earthquake Engineering and Seismology, 24–29 August 2014, Istanbul, Turkey, 1–3, 2014.
Geli, L., Bard, P.-Y., and Jullien, B.: The effect of topography on earthquake ground motion: a review and new results, Bull. Seismol. Soc. Am., 78, 42–63, 1988.
GEM – Global Earthquake Model: The OpenQuake-engine User Manual, Global Earthquake Model (GEM) Technical Report 2017-02, GEM Foundation, 193 pp., 2017.
Geological Survey of Iran: Geological Map of Iran, 1:100 000 Series, Sheet 7648, Bam, Iran, 1993.
Grelle, G., Bonito, L., Revellino, P., Guerriero, L., and Guadagno, F. M.: A hybrid model for mapping simplified seismic response via a GIS-metamodel approach, Nat. Hazards Earth Syst. Sci., 14, 1703–1718, https://doi.org/10.5194/nhess-14-1703-2014, 2014.
Grelle, G., Bonito, L., Lampasi, A., Revellino, P., Guerriero, L., Sappa, G., and Guadagno, F. M.: SiSeRHMap v1.0: a simulator for mapped seismic response using a hybrid model, Geosci. Model Dev., 9, 1567–1596, https://doi.org/10.5194/gmd-9-1567-2016, 2016.
Hassanzadeh, R. and Nedovic-Budic, Z.: Where to go first: prioritization of damaged areas for allocation of Urban Search and Rescue (USAR) operations (PI-USAR model), Geomat. Nat. Hazards Risk, 7, 1337–1366, https://doi.org/10.1080/19475705.2015.1058861, 2016.
Hassanzadeh, R., Nedović- Budić, Z., Alavi Razavi, A., Norouzzadeh, M., and Hodhodkian, H.: Interactive approach for GIS-based earthquake scenario development and resource estimation (Karmania hazard model), Int. J. Comput. Geosci., 51, 324–338, https://doi.org/10.1016/j.cageo.2012.08.016, 2013.
Hinlopen, E., Nijkamp, P., and Rietveld, P.: Qualitative discrete multiple criteria choice models in regional planning, Reg. Sci. Urban Econ., 13, 77–102, 1983.
Hisada, Y., Shibayama, A., and Ghayamghamian, M. R.: Building damage and seismic intensity in Bam city from the 2003 Iran, Bam, earthquake, Bull. Earthquake Res. Inst., Univ. Tokyo, Tokyo, 81–94, 2005.
Hoek, E. and Brown, E. T.: Practical estimates of rock mass strength, Int. J. Rock Mech. Min. Sci., 34, 1165–1186, 1997.
Iguchi, Y. and Tainosho, Y.: Characteristics of distribution of groundwater level in the seismic damaged zone in eastern part of Kobe city due to the 1995 Hyogo-Ken Nanbu Earthquake, Bull. Facult. Human Dev., 5, 403–415, 1998.
Jafari, M. K., Ghayamghamian, M. R., Davoodi, M., Kamalian, M., and Sohrabi-Bidar, A.: Site Effects of the 2003 Bam, Iran, Earthquake, Earthq. Spectra, 21, 125–136, https://doi.org/10.1193/1.2098266, 2005.
Jamieson, S.: Likert Scales: How to (Ab)use Them, Med. Educ., 38, 1217–1218, 2004.
Kanlı, A. I., Tildy, P., Prónay, Z., Pınar, A., and Hermann, L.: VS30 mapping and soil classification for seismic site effect evaluation in Dinar region, SW Turkey, Geophys. J. Int., 165, 223–235, https://doi.org/10.1111/j.1365-246X.2006.02882.x, 2006.
Keeney, R. L. and Raiffa, H.: Decisions with multiple objectives: preferences and value trade-offs, Cambridge University Press, Cambridge, 993.
Klir, G. J.: Chapter 2 – Fuzzy Logic: A Specialized Tutorial, in: Fuzzy Logic in Geology, Academic Press, Burlington, 11–61, 2004.
Lam, K. and Zhao, X.: An application of quality function deployment to improve the quality of teaching, Int. J. Qual. Reliab. Manage., 15, 389–413, 1998.
LashkariPour, G. R., Sadegh, H., and Sevizi, Z.: Comparison of predominant frequency of Bam city using seismic facies and ratio of H∕V of foreshocks earthquakes, in: 10th Symposium of Geological Society of Iran, 4–6 August 2006, Tehran, Iran, 2006.
Lee, S.-J., Komatitsch, D., Huang, B.-S., and Tromp, J.: Effects of topography on seismic-wave propagation: An example from northern Taiwan, Bull. Seismol. Soc. Am., 99, 314–325, 2009.
Likert, R.: A Technique for the Measurement of Attitudes, Arch. Psychol., 140, 44–53, 1932.
Malczewski, J.: GIS and Multicriteria Decision Analysis, John Wiley and Sons, New York, 1999.
Malczewski, J.: A GIS-based multicriteria decision analysis: A survey of the literature, Int. J. Geogr. Inform. Sci., 20, 703–726, 2006.
Mancini, I. M., Masi, S., Caniani, D., and Lioi, D. S.: Fuzzy logic and neuro-fuzzy networks for environmental hazard assessment, in: Fuzzy Logic-Emerging Technologies and Applications, InTech, IntechOpen, London, 2012.
Marie Nolte, E.: Earthquake risk map development using GIS and optical satellite imagery: case study for rural areas on Java, Indonesia, Center for Disaster Management and Risk Reduction Technology Projektbericht Hertz, Karlsruhe, 112 pp., 2010.
Marinos, P., Marinos, V., and Hoek, E.: Geological Strength Index (GSI). A characterization tool for assessing engineering properties for rock masses, Underground works under special conditions, Taylor and Francis, Lisbon, 13–21, 2007.
Marulanda, M., Carreño, M., Cardona, O., and Barbat, A.: Probabilistic assessment of seismic risk of Barcelona, Spain, using the CAPRA platform, Buletinul Institutului Politehnic din lasi, Sectia Constructii, Arhitectura, 58, 8–25, 2012.
MERM: Microzonation Manual, World Institute for Disaster Risk Management, Turkey, 2003.
Michel, C., Fäh, D., Edwards, B., and Cauzzi, C.: Site amplification at the city scale in Basel (Switzerland) from geophysical site characterization and spectral modelling of recorded earthquakes, Phys. Chem. Earth A/B/C, 98, 27–40, 2017.
Mohanty, W. K. and Walling, M. Y.: First Order Seismic Microzonation of Haldia, Bengal Basin (India) Using a GIS Platform, Pure Appl. Geophys., 165, 1325–1350, https://doi.org/10.1007/s00024-008-0360-6, 2008.
Mohanty, W. K., Walling, M. Y., Nath, S. K., and Pal, I.: First Order Seismic Microzonation of Delhi, India Using Geographic Information System (GIS), Nat. Hazards, 40, 245–260, https://doi.org/10.1007/s11069-006-0011-0, 2007.
Molina, S., Lang, D. H., and Lindholm, C. D.: SELENA – An open-source tool for seismic risk and loss assessment using a logic tree computation procedure, Comput. Geosci., 36, 257–269, https://doi.org/10.1016/j.cageo.2009.07.006, 2010.
Monaco, P., Totani, G., Barla, G., Cavallaro, A., Costanzo, A., d'Onofrio, A., Evangelista, L., Foti, S., Grasso, S., and Lanzo, G.: Geotechnical aspects of the L'Aquila earthquake, in: Special topics in earthquake geotechnical engineering, Springer Netherlands, 66 pp., 2012.
Moro, M., Saroli, M., Salvi, S., Stramondo, S., and Doumaz, F.: The relationship between seismic deformation and deep-seated gravitational movements during the 1997 Umbria–Marche (Central Italy) earthquakes, Geomorphology, 89, 297–307, 2007.
Motamed, R., Ghalandarzadeh, A., Tawhata, I., and Tabatabaei, S. H.: Seismic Microzonation and Damage Assessment of Bam City, Southeastern Iran, J. Earthq. Eng., 11, 110–132, https://doi.org/10.1080/13632460601123164, 2007.
Moustafa, S. S. R., Al-Arifi, N., Jafri, M. K., Naeem, M., Alawadi, E. A., and A. Metwaly, M.: First level seismic microzonation map of Al-Madinah province, western Saudi Arabia using the geographic information system approach, Environ. Earth Sci., 75, 251, https://doi.org/10.1007/s12665-015-5073-4, 2016.
Mundepi, A., Galiana-Merino, J., and Lindholm, C.: Soil characteristics and site effect assessment in the city of Delhi (India) using H∕V and f−k methods, Soil Dynam. Earthq. Eng., 30, 591–599, 2010.
Nath, S. K. and Thingbaijam, K. K. S.: Seismic hazard assessment – a holistic microzonation approach, Nat. Hazards Earth Syst. Sci., 9, 1445–1459, https://doi.org/10.5194/nhess-9-1445-2009, 2009.
NCCI – National Cartographic Center of Iran: Report on the Bam earthquake, Tehran, 98 pp., 2003.
NDMA – National Disaster Management Authority: Technical Document on Geotechnical and Geophysical Investigation for Seismic Microzonation Studies of Urban Centers in India, National Disaster Management Authority (NDMA), Bhawan, Safdarjung Enclave, New Delhi, 123 pp., 2011.
Noack, T. and Fah, D.: Earthquake Microzonation: site effects and local geology; A case study for the Kanton of Basel-Stadt, ETH Hönggerberg, Hönggerberg, 19 pp., 2001.
Novák, V., Perfilieva, I., and Mockor, J.: Mathematical principles of fuzzy logic, Springer Science & Business Media, Germany, 2012.
Nwe, Z. Z. and Tun, K. T.: Seismic Hazard Analysis using AHP-GIS, Int. J. Res. Chem. Metallurg. Civ. Eng., 3, 1442–1450, 2016.
O'Sullivan, D. and Unwin, D. J.: Putting Maps Together – Map Overlay, in: Geographic Information Analysis, John Wiley & Sons, Inc., New Jersey, USA, 315–340, 2010.
Panza, G. F., La Mura, C., Peresan, A., Romanelli, F., and Vaccari, F.: Chapter three-seismic hazard scenarios as preventive tools for a disaster resilient society, Adv. Geophys., 53, 93–165, 2012.
Paolucci, R.: Amplification of earthquake ground motion by steep topographic irregularities, Earthq. Eng. Struct. Dynam., 31, 1831–1853, https://doi.org/10.1002/eqe.192, 2002.
Petersen, M. D., Mueller, C. S., Moschetti, M. P., Hoover, S. M., Llenos, A. L., Ellsworth, W. L., Michael, A. J., Rubinstein, J. L., McGarr, A. F., and Rukstales, K. S.: Seismic-Hazard Forecast for 2016 Including Induced and Natural Earthquakes in the Central and Eastern United States, Seismol. Res. Lett., 87, 1327–1341, 2016.
Phoon, K., Nadim, F., Uzielli, M., and Lacasse, S.: Soil variability analysis for geotechnical practice, in: Characterisation and Engineering Properties of Natural Soils, Taylor & Francis, London, 2006.
Ramazi, H. and Jigheh, H. S.: The Bam (Iran) Earthquake of December 26, 2003: From an engineering and seismological point of view, J. Asian Earth Sci., 27, 576–584, 2006.
Rehman, F., El-Hady, S. M., Atef, A., and Harbi, H. M.: Probablistic Seismic Hazard Assessment Methodelogy And Site Response Analysis Application To Seismic Microzonation, Sci. Int., 28, 2593–2606, 2016.
Rezaei, K., Guest, B., Friedrich, A., Fayazi, F., Nakhaei, M., Beitollahi, A., and Fatemi Aghda, S.: Feed forward neural network and interpolation function models to predict the soil and subsurface sediments distribution in Bam, Iran, Acta Geophys., 57, 271–293, https://doi.org/10.2478/s11600-008-0073-3, 2009.
Rinner, C. and Malczewski, J.: Web-enabled spatial decision analysis using ordered weighted averaging, J. Geogr. Syst., 4, 385–403, 2002.
Roy, B.: Multicriteria methodology for decision aiding, Kluwer Academic Publishers, Dordrecht, 1996.
Saaty, T. L.: The Analytic Hierarchy Process: planning, priority setting, resource allocation, McGraw-Hill International, USA, 1980.
Saaty, T. L.: An Exposition of the AHP in Reply to the Paper “Remarks on the Analytic Hierarchy Process”, Manage. Sci., 36, 259–268, https://doi.org/10.1287/mnsc.36.3.259, 1990.
Sabetta, F. and Bommer, J.: Modification of the spectral shapes and subsoil conditions in Eurocode 8, in: 12th European Conference on Earthquake Engineering, London, UK, 2002.
Sen, Z.: Rapid visual earthquake hazard evaluation of existing buildings by fuzzy logic modeling, Expert Syst. Appl., 37, 5653–5660, 2010.
Sim, J. and Wright, C. C.: The kappa statistic in reliability studies: use, interpretation, and sample size requirements, Phys. Therapy, 85, 257–268, 2005.
Sitharam, T. G. and Anbazhagan, P.: Seismic microzonation: principles, practices and experiments, in: EJGE Special Volume Bouquet, Elect. J. Geotech. Eng., 8, 1–61, 2008.
SM Working Group: Guidelines for Seismic Microzonation, Civil Protection Department and Conference of Regions and Autonomous Provinces of Italy, Civil Protection Department, Rome, 2015.
Stewart, J.: Key Geotechnical Aspects of the 1989 Loma Prieta Earthquake, National Information Service for Earthquake Engineering, University of California, Berkeley, California, 1997.
Talebian, M., Fielding, E. J., Funning, G. J., Ghorashi, M., Jackson, J., Nazari, H., Parsons, B., Priestley, K., Rosen, P. A., Walker, R., and Wright, T. J.: The 2003 Bam (Iran) earthquake: Rupture of a blind strike-slip fault, Geophys. Res. Lett., 31, L11611, https://doi.org/10.1029/2004gl020058, 2004.
Tang, A. K.: Izmit (Kocaeli), Turkey, Earthquake of August 17, 1999 Including Duzce Earthquake of November 12, 1999: Lifeline Performance, ASCE Publications, American Society of Civil Engineers, Reston, VA, 2000.
Teramo, A., Termini, D., Marullo, A., and Marino, A.: Fuzzy interpolators for a quick seismic microzonation, CIMSA, in: 2005 IEEE International Conference on Computational Intelligence for Measurement Systems and Applications, 20–22 July 2005, Sicily, Italy, 107–108, 2005.
Tinsley, J. C., Youd, T. L., Perkins, D. M., and Chen, A. T. F.: Evaluating liquefaction potential, in: Evaluating Earthquake Hazards in the Los Angeles Region – An Earth-Science Perspective, US Geological Survey Professional Paper 1360, USGS, USA, 263–315, 1985.
Trifunac, M. D.: Site conditions and earthquake ground motion – A review, Soil Dynam. Earthq. Eng., 90, 88–100, https://doi.org/10.1016/j.soildyn.2016.08.003, 2016.
Voogd, H.: Multicriteria Evaluation for Urban and Regional Planning, Pion, Ltd, London, 1983.
Wald, D. J.: Slip history of the 1995 Kobe, Japan, earthquake determined from strong motion, teleseismic, and geodetic data, J. Phys. Earth, 44, 489–503, 1996.
Wang, Z., Carpenter, N. S., and Zhang, L.: Assessing Potential Seismic Hazards from Induced Earthquakes in the Central and Eastern United States, in: AAPG Eastern Section Meeting, 25–27 September 2016, Lexington, Kentucky, 2016.
Wang, Z., Carpenter, N. S., Zhang, L., and Woolery, E. W.: Assessing Potential Ground-Motion Hazards from Induced Earthquakes, Nat. Hazards Rev., 18, 04017018, https://doi.org/10.1061/(ASCE)NH.1527-6996.0000264, 2017.
Yager, R. R.: On ordered weighted averaging aggregation operators in multi-criteria decision making, IEEE T. Syst. Man Cybernet. B, 18, 183–190, 1988.
Zadeh, L. A.: Fuzzy sets, Inform. Control, 8, 338–353, 1965.
Zadeh, L. A.: Fuzzy logic and approximate reasoning, Synthese, 30, 407–428, 1975.
Zhu, X. and Dale, A. P.: JavaAHP: a Web-based decision analysis tool for natural resource and environmental management, Environ. Model. Softw., 16, 251–262, 2001.


