the Creative Commons Attribution 4.0 License.
the Creative Commons Attribution 4.0 License.
 | 11 Sep 2019
GIS-based earthquake-triggered-landslide susceptibility mapping with an integrated weighted index model in Jiuzhaigou region of Sichuan Province, China
Yaning Yi
Zhijie Zhang
Wanchang Zhang
Qi Xu
Cai Deng
Qilun Li
A Mw=6.5 earthquake struck the Jiuzhaigou region of Sichuan Province, China, at 21:19 LT on Tuesday, 8 August 2017, and triggered a large number of landslides. For mitigating the damages of earthquake-triggered landslides to individuals and infrastructures of the earthquake-affected region, a comprehensive landslide susceptibility mapping was attempted with an integrated weighted index model by combining the frequency ratio and the analytical hierarchy process approaches under a GIS-based environment in the heavily earthquake-affected Zhangzha town of the Jiuzhaigou region. For this purpose, a total number of 842 earthquake-triggered landslides were visually interpreted and located from Sentinel-2A images acquired before and after the earthquake at first, and then the recognized landslides were randomly split into two groups to establish the earthquake-triggered landslide inventory, among which 80 % of the landslides were used for training the integrated model and the remaining 20 % for validation. Nine landslide controlling factors were considered including slope, aspect, elevation, lithology, distance from faults, distance from rivers, land use–land cover, normalized difference vegetation index and peak ground acceleration. The frequency ratio was utilized to evaluate the contribution of each landslide controlling factor to landslide occurrence, and the analytical hierarchy process was used to analyse the mutual relationship between landslide controlling factors. Finally, the landslide susceptibility map was produced by using weighted overlay analysis. Furthermore, an area under the curve approach was adopted to comprehensively evaluate the performance of the integrated weighted index model, including the degree of model fit and model predictive capability. The results demonstrated the reliability and feasibility of the integrated weighted index model in earthquake-triggered landslide susceptibility mapping at a regional scale. The generated map can help engineers and decision makers assess and mitigate hazards of the earthquake-triggered landslides to individuals and infrastructures of the earthquake-affected region.
- Article
(20286 KB) - Full-text XML
- BibTeX
- EndNote


Recent natural disasters and their associated death tolls and financial costs have put mitigation of natural hazards at the forefront of societal needs. Landslides are the most common natural disasters (geological hazards) that cause heavy human casualties and damage to property every year in many areas of the world (Saha et al., 2002; Su et al., 2015). Landslides can be caused by several factors, such as strong earthquakes, intense or prolonged rainfall, and multiple human actions (Guzzetti et al., 2012; Sato et al., 2007).
On 8 August 2017, a catastrophic earthquake of magnitude 6.5 struck the Jiuzhaigou region of Sichuan Province, China. The epicentre of this earthquake with a depth of 20 km was located at latitude 33.20∘ N and longitude 103.82∘ E, close to the Jiuzhaigou National Nature Reserve, about 39 km west to the city of Jiuzhaigou. According to the China Earthquake Administration, the epicentre of the Jiuzhaigou earthquake was located near the Minjiang, Tazang, and Huya faults (as can be seen in Fig. 1), and this earthquake was caused by tectonic movement of an NW–SE-oriented left-lateral strike-slip fault (Wang et al., 2018a). Although intense rainfall was not observed after the earthquake, numerous landslides were triggered by strong seismic vibration of ground (Zhao et al., 2018). Many scenic spots in the Jiuzhaigou National Nature Reserve were destroyed; as presented in Fig. 2b, the Sparkling Lake was damaged. Due to numerous landslides blocking the roads, many tourists were trapped in the region; as can be seen in Fig. 2d, the S301 highway was severely obstructed by a significant number of small-scale landslides. Based on field investigation, most of these landslides were small-scale rockslides, rockfalls and debris slides (Fan et al., 2018; Zhao et al., 2018). As the China Earthquake Administration reported, this earthquake caused 25 deaths and 176 492 injured or affected (Lei et al., 2018; Wang et al., 2018b). Landslides seriously threaten the anthropogenic activities, as well as tourist facilities of the region. Comprehensive earthquake-triggered landslide susceptibility mapping in the earthquake-affected area, therefore, is essential to assess landslide hazard and mitigate landslide damages through proper prevention actions for the future.
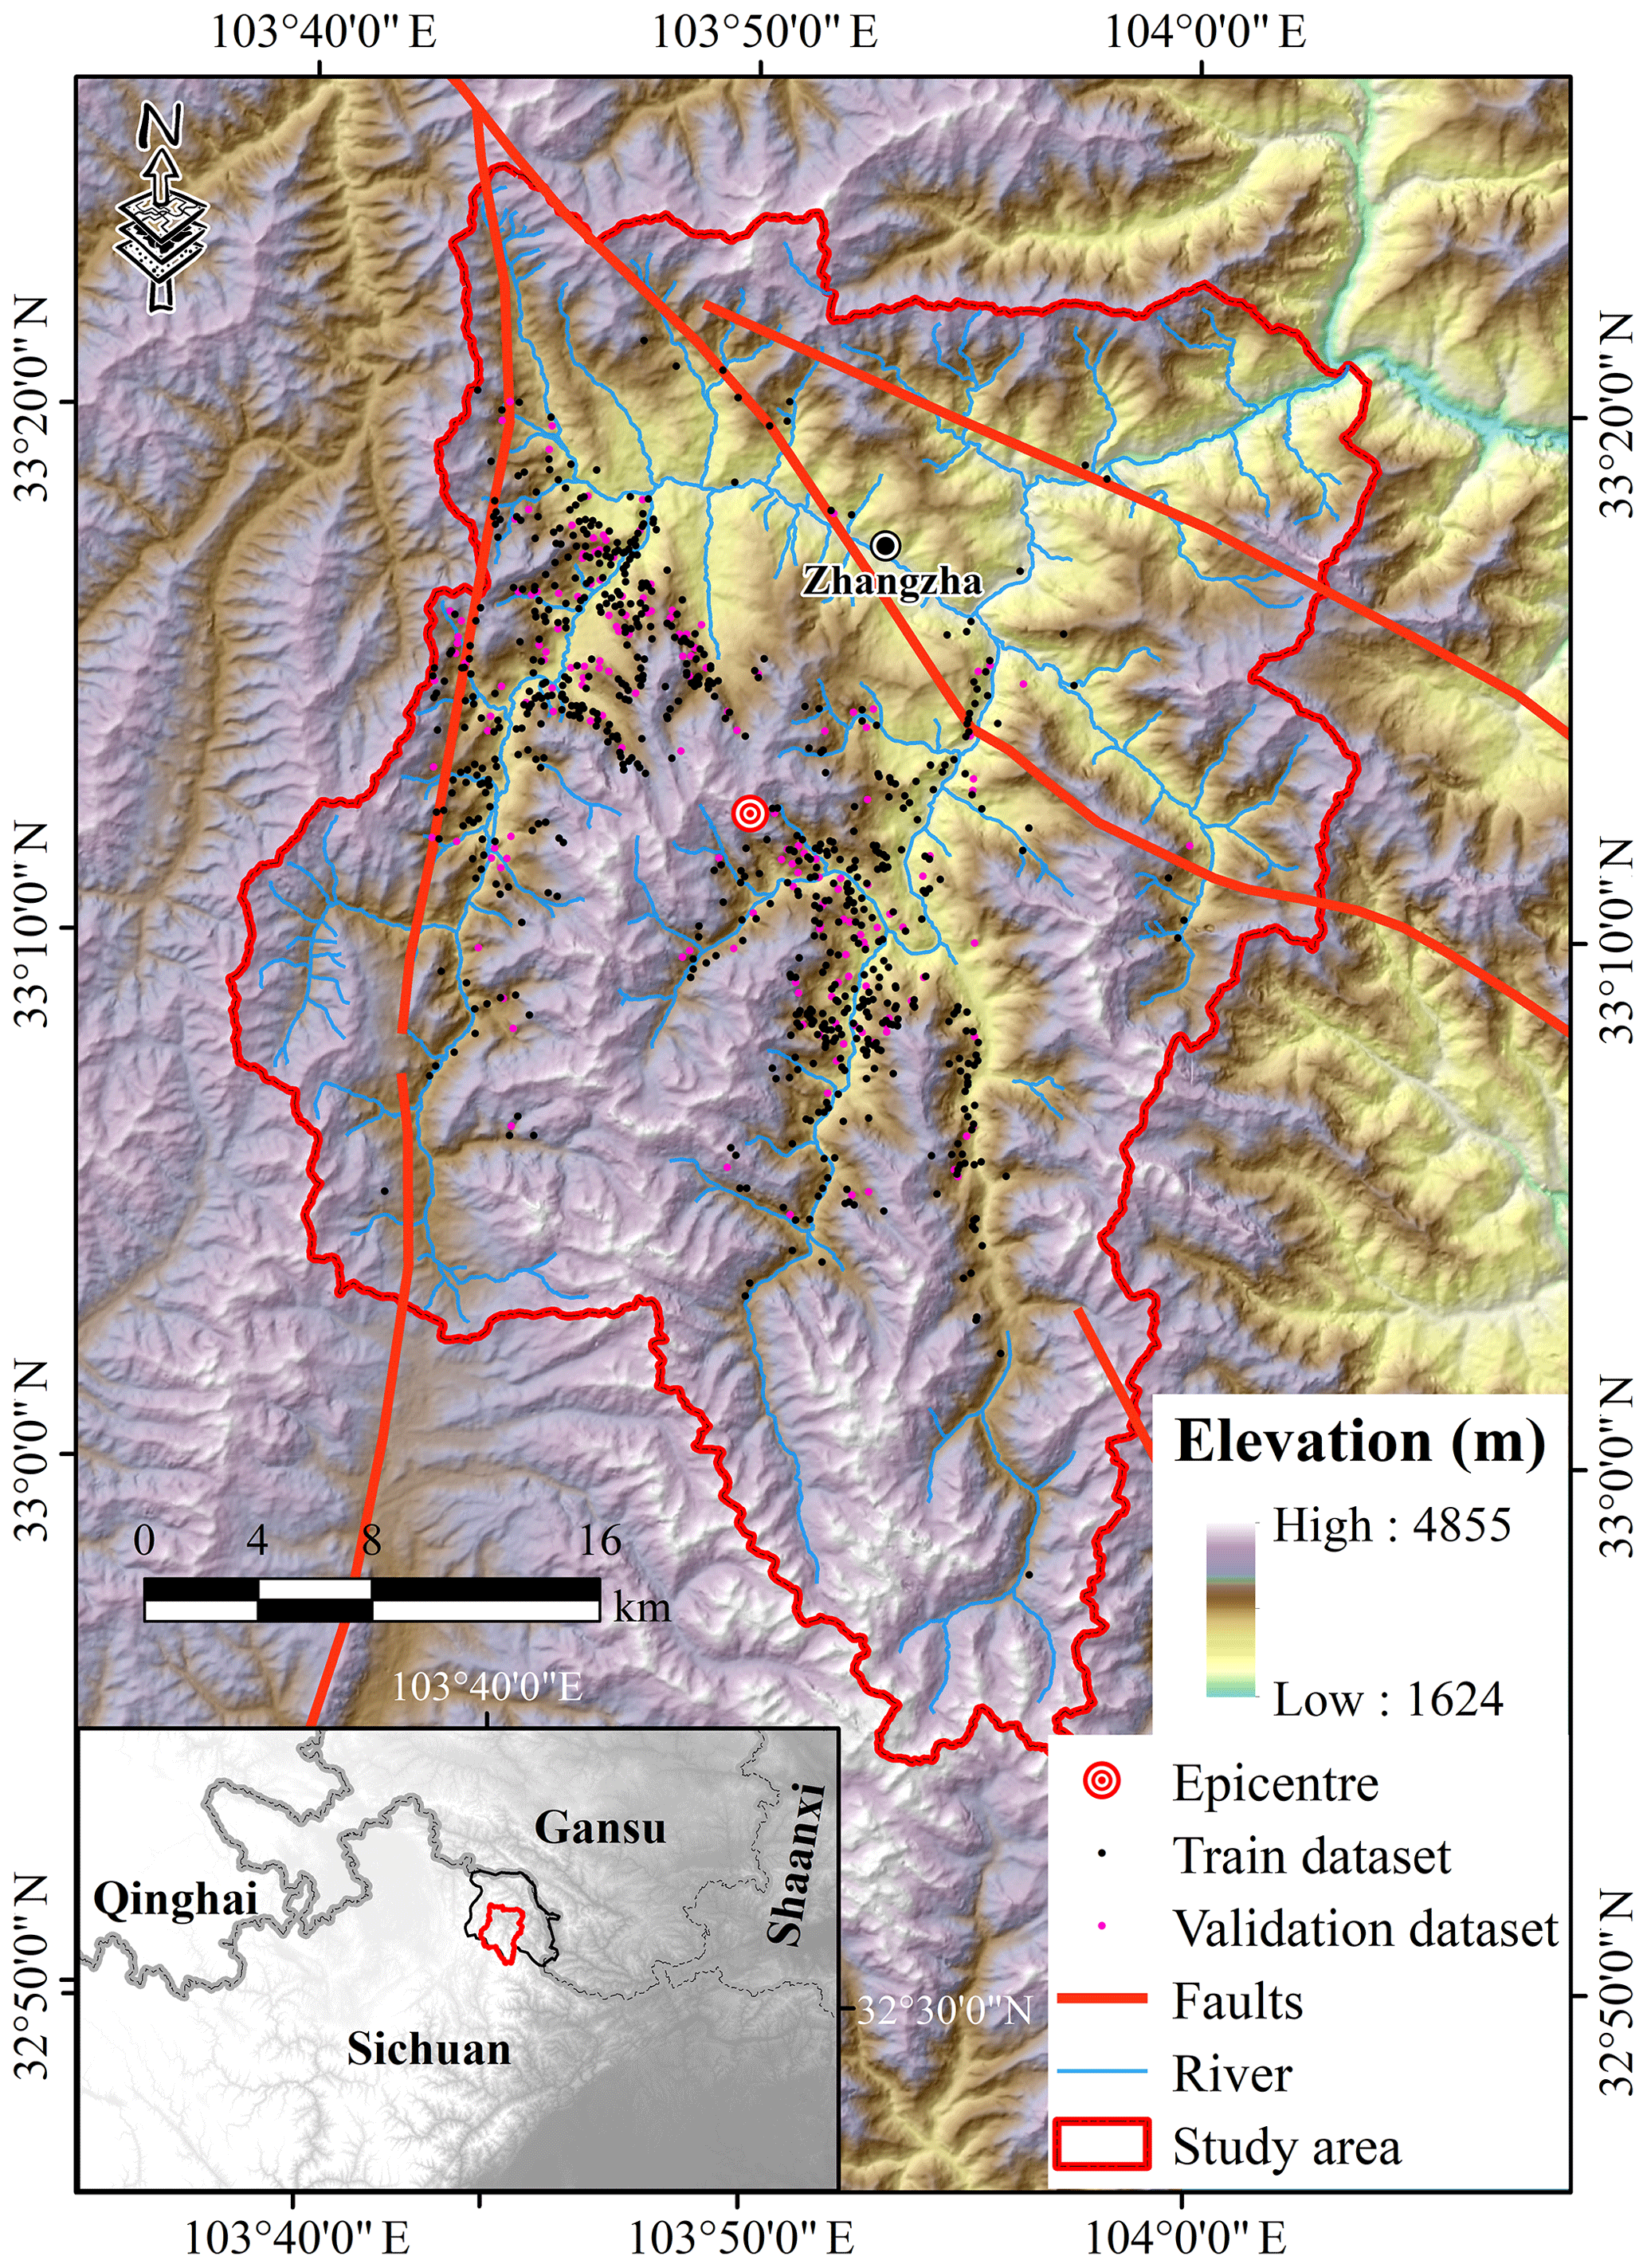
Figure 1The digital map showing the location, topography, river networks, faults, epicentre of the Jiuzhaigou earthquake, and the locations of earthquake-triggered landslides for training and validation over the study area.
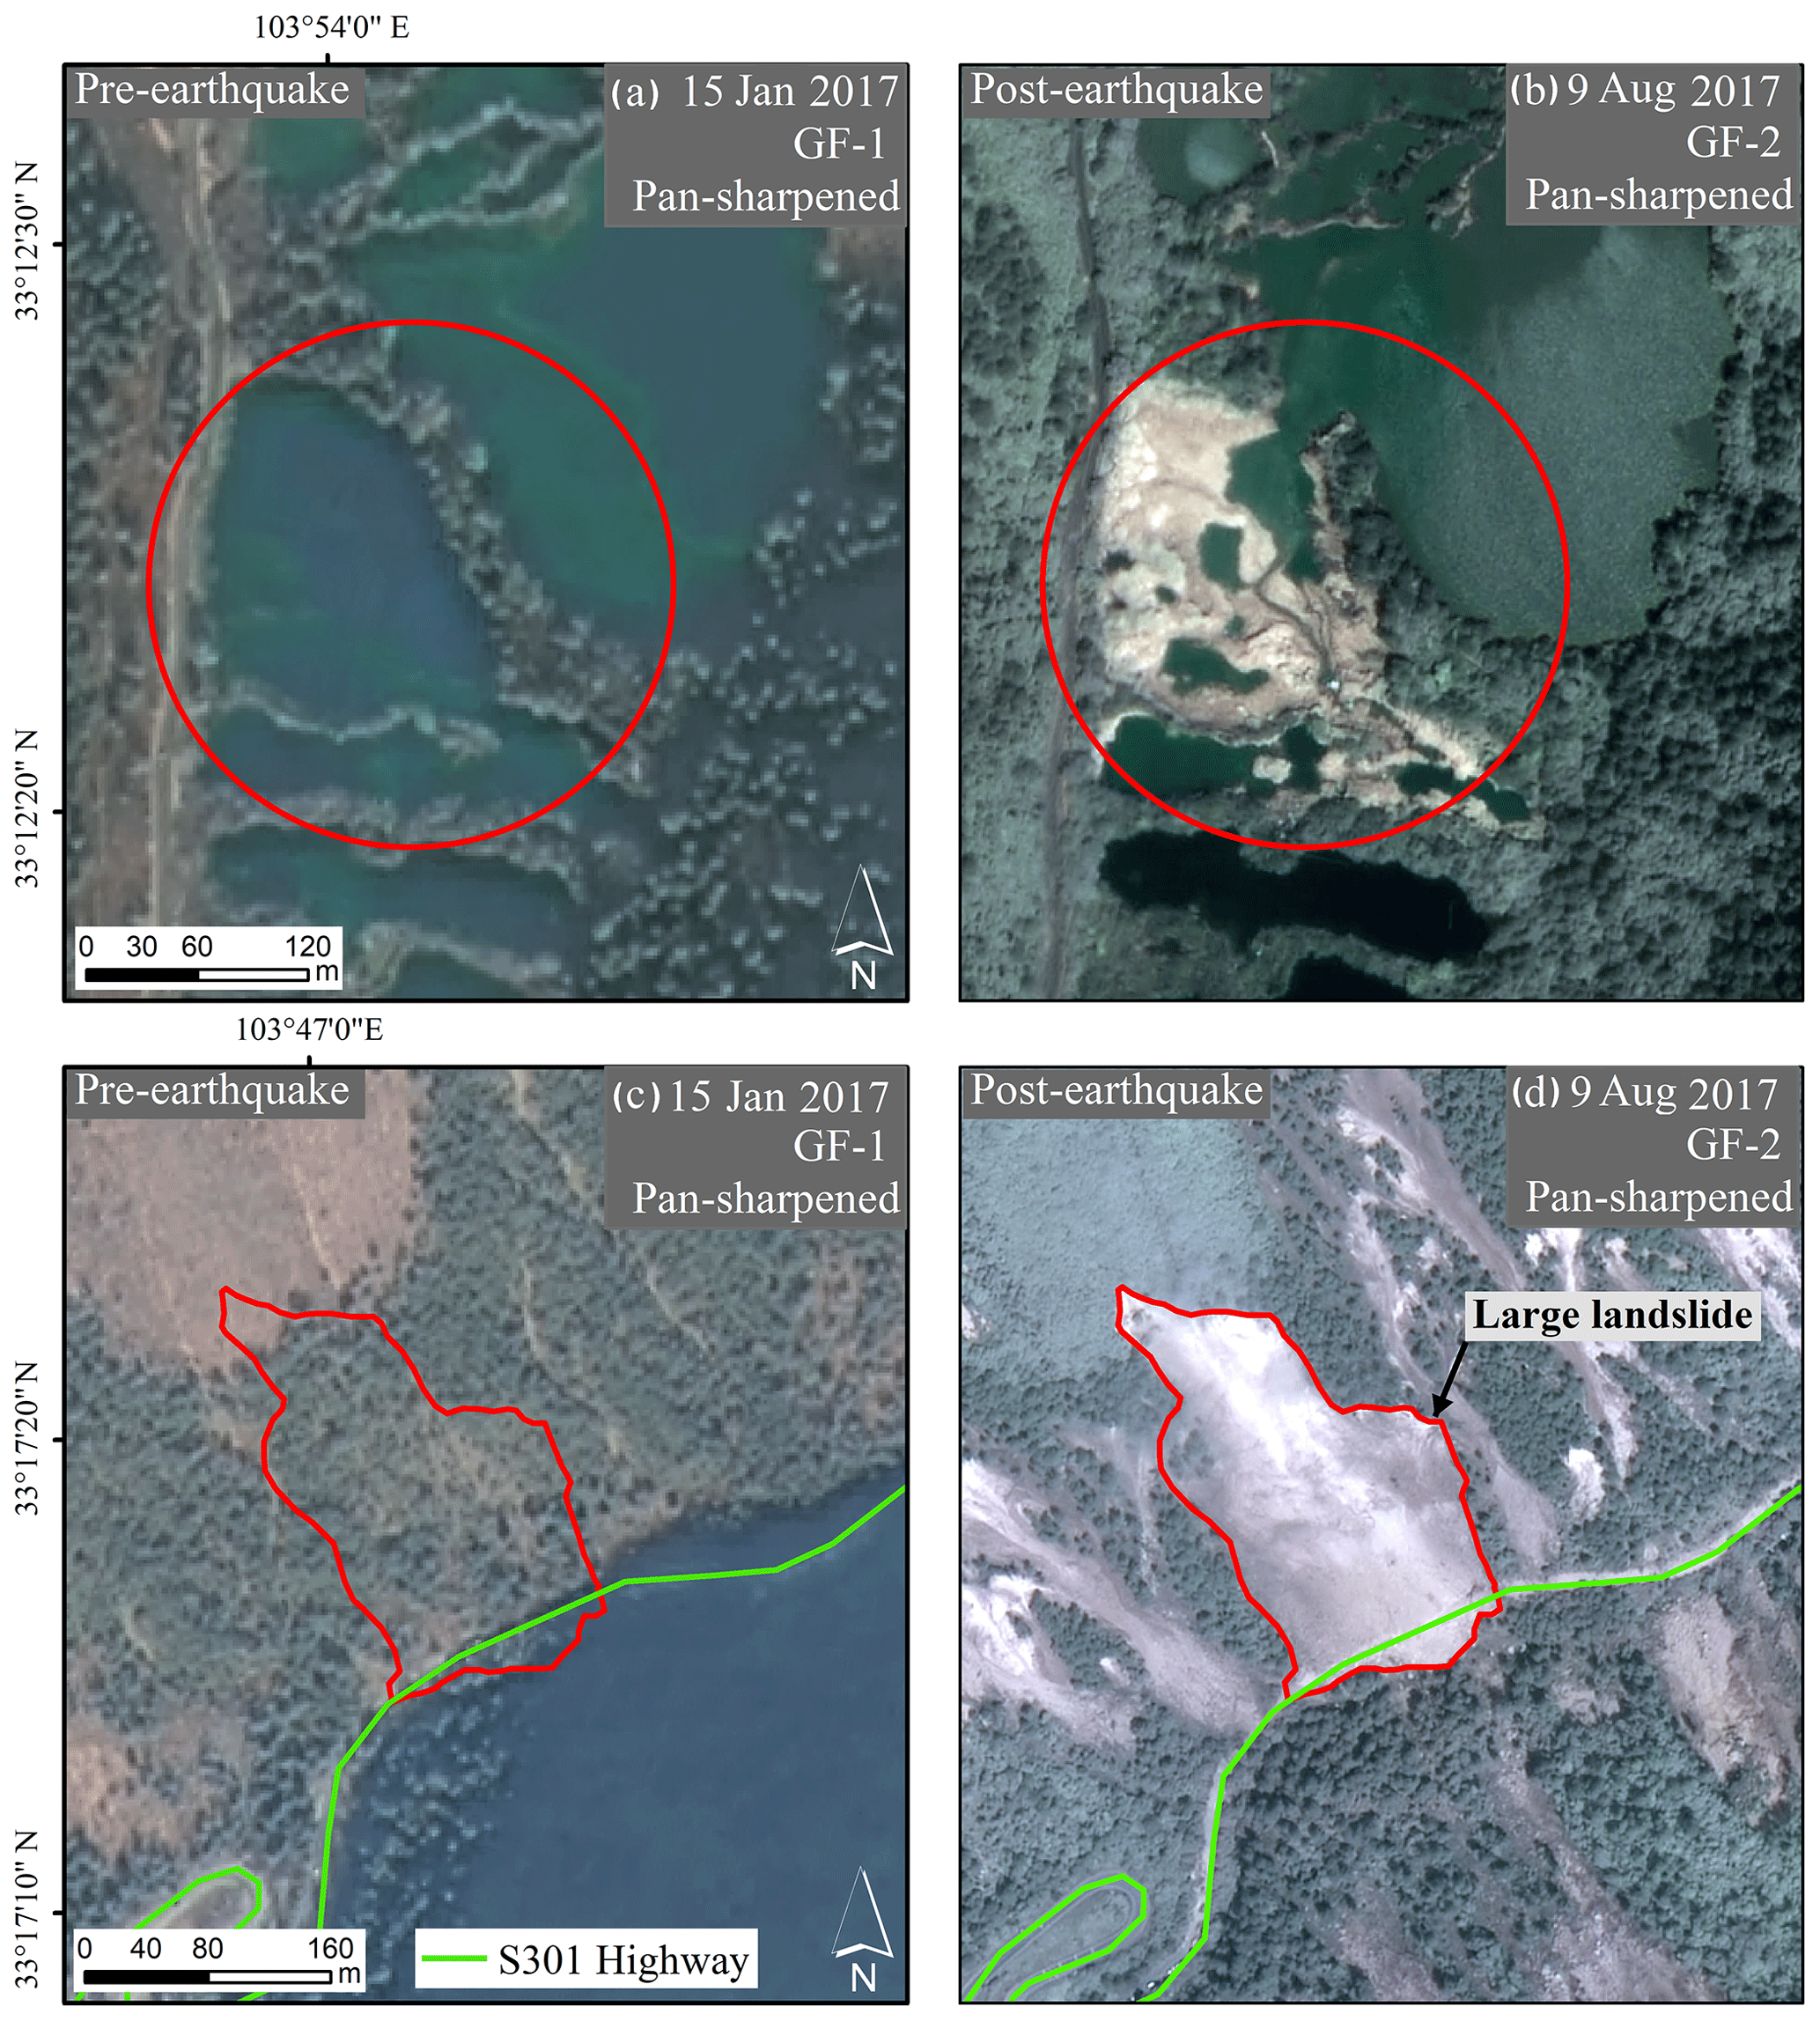
Figure 2Remote sensing interpretation for earthquake disaster of the study area. (a) A 2 m spatial resolution GF-1 remotely sensed image on 15 January 2017 before the earthquake compared with (b) 1 m spatial resolution GF-2 remotely sensed image on 9 August 2017 after the earthquake clearly reveals the dried up Sparkling Lake after the Jiuzhaigou earthquake; (c) 2 m spatial resolution GF-1 remotely sensed image on 15 January 2017 before the earthquake compared with (d) 1 m spatial resolution GF-2 remotely sensed image on 9 August 2017 after the earthquake illustrates the damage of the S301 highway in the Jiuzhaigou earthquake.
Over the last decades, many approaches for landslide susceptibility mapping were proposed, among which the application of remote sensing associated with GIS modelling techniques became the most popular and effective method (Alexander, 2008; Carrara et al., 1991; Dai and Lee, 2002; Guzzetti et al., 1999; Lee, 2005; Mantovani et al., 1996; Mansouri Daneshvar, 2014; Xu et al., 2012a). The most commonly used methods for landslide susceptibility mapping include logistic regression (Ayalew and Yamagishi, 2005; Bai et al., 2010; Manzo et al., 2013; Ozdemir and Altural, 2013), weights of evidence (Althuwaynee et al., 2012; Regmi et al., 2010), analytical hierarchy process (AHP) (Kayastha et al., 2013; Komac, 2006; Mansouri Daneshvar, 2014; Yalcin, 2008), frequency ratio (FR) (Guo et al., 2015; Lee and Pradhan, 2007; Li et al., 2017; Mohammady et al., 2012), support vector machine (SVM) (Marjanović et al., 2011; Su et al., 2015), decision tree (Nefeslioglu et al., 2010; Saito et al., 2009) and artificial neural network (ANN) (Caniani et al., 2008; Catani et al., 2005; Conforti et al., 2014; Ermini et al., 2005; Pradhan and Lee, 2009). These methods have been proven capable of mapping the locations that are prone to landslides; however, some shortcomings still exist in these methods, which reduce the efficiency of these susceptibility methods when applied individually (Tien Bui et al., 2012; Umar et al., 2014). For example, the AHP can be used to identify the mutual relationship between landslide controlling factors and the landslide susceptibility, but the process and results mostly depend on the expert's knowledge, which is subjective in practice (Youssef et al., 2015; Zhang et al., 2016). The FR is capable of representing the influence of the categories of each controlling factor due to landslide occurrences (Lee and Talib, 2005); however, the mutual relationship between the factors is mostly neglected (Zhang et al., 2016). Since different factors have different effects on landslides, analysing the mutual relationship between factors is very important for mapping the landslide susceptibility. Logistic regression is good at analysing the relationships among the landslide controlling factors but is not capable of evaluating the impact of the categories of each factor individually on landslides (Umar et al., 2014). Fuzzy logic has also been employed in landslide susceptibility mapping, but the modelled results largely rely on the expert's knowledge, which often leads to a high degree of uncertainty (Tilmant et al., 2002). In addition, machine learning models (e.g. SVM, decision tree and ANN models) are very popular methods in landslide analysis; nevertheless, heavy dependence of a very high-speed computer along with large amounts of training data needed constrain their practical applications to some extent (Umar et al., 2014).
In addition, the combined approach has been gradually used for landslide susceptibility assessment (Ba et al., 2017; Boon et al., 2015; Dehnavi et al., 2015; Kadavi et al., 2018; Pham et al., 2018; Shrestha et al., 2017; Umar et al., 2014; Youssef et al., 2015). For instance, Umar et al. (2014) used an ensemble method of FR and logistic regression to assess the landslide susceptibility in West Sumatra Province, Indonesia, and a similar integrated method was also applied by Youssef et al. (2015). Dehnavi et al. (2015) combined the step-wise weight assessment ratio analysis method and adaptive neuro-fuzzy inference system to produce a landslide susceptibility map of Iran. Ba et al. (2017) proposed an improved information value model based on grey clustering for landslide susceptibility mapping in Chongqing. Kadavi et al. (2018) proposed a hybrid machine learning approach of AdaBoost, LogitBoost, Multiclass Classifier, and Bagging models for spatial prediction of landslides. Although those studies suggested the effectiveness of the integrated method in some areas of the world, the universality and efficiency of the integrated method still remains an important issue to be confirmed in different regions of the world (Reichenbach et al., 2018).
The main purpose of this study is to map the susceptibility of earthquake-triggered landslides by applying an integrated weighted index model by combining FR and AHP. The integrated model is capable of evaluating the contribution of each landslide controlling factor to landslide occurrence using the FR method, meanwhile taking mutual relationships among controlling factors into account by the use of AHP. Such integration is capable of generating a complete model that largely restrains the shortcomings of these two individual methods and reduces the uncertainty and subjectivity resulting from the utilization of an individual method. The experiment site was selected at Zhangzha town of Jiuzhaigou, a region seriously affected by the Jiuzhaigou earthquake. An earthquake-triggered-landslide susceptibility map was produced by using the integrated weighted index model along with the remotely sensed information, and a validation analysis by using an area under the curve approach was conducted with the generated susceptibility map of the study area for evaluating the reliability and feasibility of the integrated model.
To summarize, the main contributions of this paper are as follows. First, an integrated weighted index model by combining FR and AHP was applied to generate the landslide susceptibility map. Such integration can maximize the benefits of both methods. Second, the landslide susceptibility of Zhangzha town of Jiuzhaigou was investigated. According to the landslide susceptibility map, engineers and decision makers involved in hazard mitigation can understand the probability of landslides in different regions, and may therefore take the effective emergency actions to reduce the impact of the earthquake-triggered landslides. This paper is structured as follows: Sect. 2 introduces the study area. Section 3 describes the data utilized and data preparation procedures. Section 4 gives detailed explanation about the integrated weighted index model. Section 5 presents the results and discussions focusing on validations on the generated earthquake-triggered-landslide susceptibility map of the study area followed by the conclusions drawn in Sect. 6 at the end.
The study area with an area of 1345.19 km2, as shown in Fig. 1, is located in Zhangzha town of Jiuzhaigou County between 33.03–33.35∘ N latitude and 103.63–104.05∘ E longitude in the Min Shan to the north of the Sichuan basin, eastern margin of the Tibetan Plateau. As pointed out in Deng (2011), the geological conditions of this region are complex, and the tectonic movement strongly uplifted the entire western region of Jiuzhaigou, while the eastern region had different fault block movements along the early faults. Regional tectonic movements are intense (Wang et al., 2018b). As summarized in Fan et al. (2018), more than 50 earthquake events with magnitude 5.0 or greater occurred in the Jiuzhaigou area in the past century. Active regional tectonic uplift and tilting cause the elevation of the study area to vary from 1624 m to 4855 m a.m.s.l. (above mean sea level). Jiuzhaigou County belongs to a cold sub-humid and cold semi-arid monsoon climate with annual precipitation of about 550 mm (Li et al., 2014). The topography of the region is characterized by alpine karst terrain formed by glacial, hydrological, and tectonic activity, and with karstification in travertine deposits, many travertine dikes and shoals appeared in the study area. Soluble carbonate rocks are widely distributed, and tufa deposition of karst developed. Due to abundant recharge supply of groundwater in this region, many lakes and streams develop over an extensive alpine karst region, which favours hill slope erosion processes, and results in frequent occurrence of rockslides, debris flows, and rockfalls (Florsheim et al., 2013).
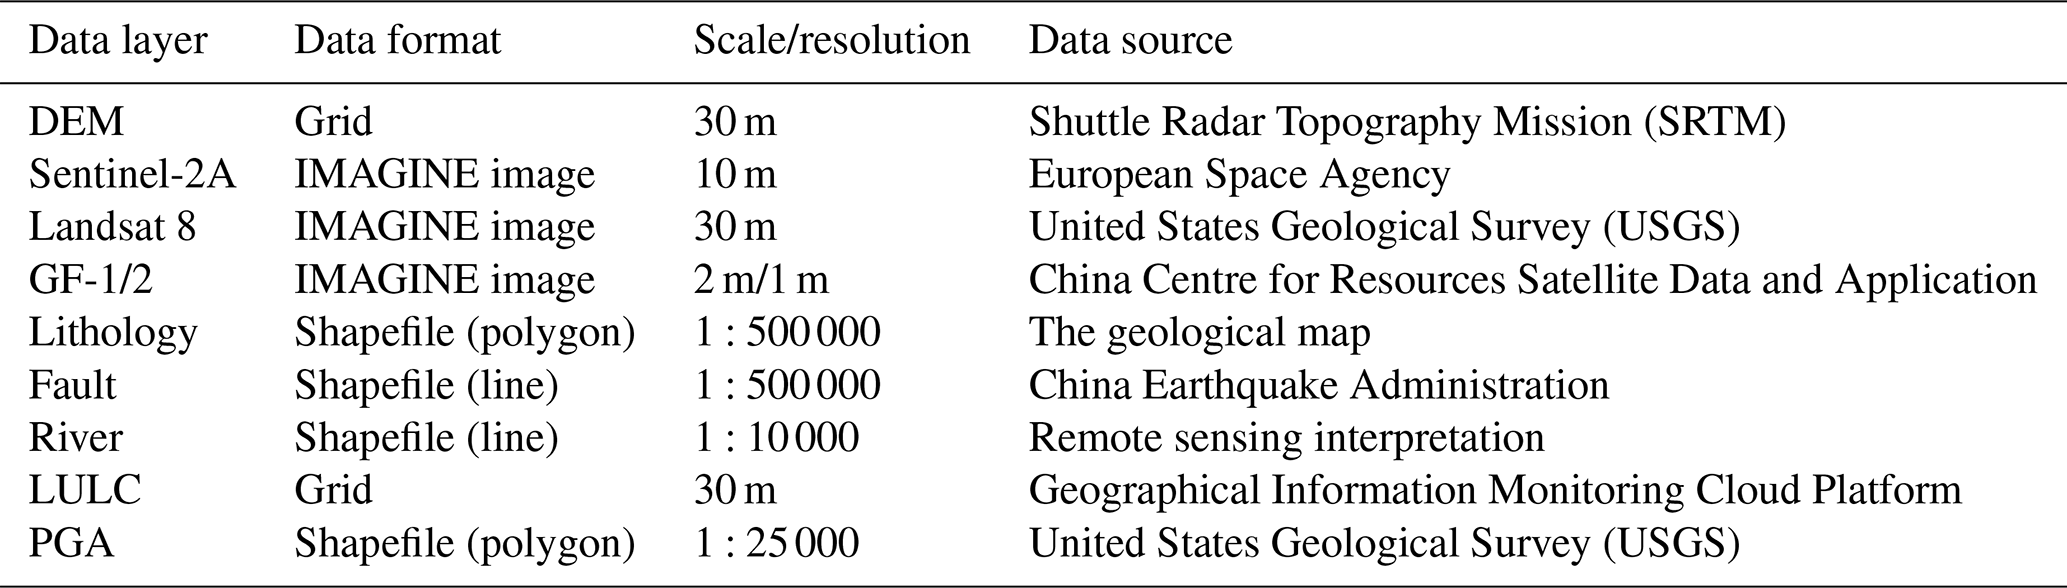
In order to map the landslide susceptibility of the study area, we designed and developed a spatial database with the help of ArcGIS (version 10.2) software. This database contained two primary parts: (1) the landslide inventory dataset for earthquake-triggered landslides and (2) the datasets of background conditions representing the landslide controlling factors. The data layers used in the landslide susceptibility mapping were briefly described in Table 1.
3.1 Landslide inventory
A landslide inventory is essential for assessing landslide hazard or risk on a regional scale (Pellicani and Spilotro, 2015). The Jiuzhaigou earthquake triggered numerous landslides in the study area. To derive a landslide inventory containing detailed and reliable information on landslide distribution, location, etc., Sentinel-2A images on 29 July, 13 August and 7 September 2017 were used to recognize and locate the earthquake-triggered landslides. The Sentinel-2A image has 13 spectral bands (from blue to shortwave infrared) with the spatial resolution of 10, 20 and 60 m, respectively. In this study, three visible bands (red, green, blue) with the spatial resolution of 10 m were adopted to analyse the image characteristics of earthquake-triggered landslides. With the aid of ArcGIS and ENVI tools, the landslide information of the study area was extracted using on-screen visual interpretation on pre- and post-earthquake Sentinel-2A images. In order to ensure the quality of visual interpretation, GF-1 images with spatial resolution of 2 m on 15 January 2017 and GF-2 images with spatial resolution of 1 m on 9 August 2017 were used to verify the results. Consequently, a total number of 842 earthquake-triggered landslides were recognized and positioned. Smaller landslides with total pixels fewer than 20 were not included as they were not clear enough in visual features. It is worthwhile mentioning that most of the interpreted landslides were triggered by the Jiuzhaigou earthquake, and unless otherwise specified, in this article the earthquake-triggered landslide refers to the co-seismic landslide. We assumed that the distribution of the earthquake-triggered landslides was reasonably accurate and complete at a regional scale in order to make the problem tractable. For earthquake-triggered-landslide susceptibility mapping, the landslide inventory dataset was randomly split into two groups, among which 80 % (673 landslides) of the recognized landslides were used for training the integrated weighted index model and the remaining 20 % (169 landslides) for validation.
3.2 Landslide controlling factors
The occurrence of landslides is a consequence of geological, meteorological, anthropogenic and triggering factors, commonly referred to as landslide controlling factors (Bai et al., 2010). Standard guidelines for choosing the optimal landslide controlling factors are unavailable, but the scale of analysis, the nature of the study area, the data availability, and the quasi-empirical and statistical criterions in literature can be referenced (Romer and Ferentinou, 2016; Zhou et al., 2016). In this study, slope, aspect, elevation, lithology, distance from faults, distance from rivers, land use–land cover (LULC), normalized difference vegetation index (NDVI), and peak ground acceleration (PGA) were selected as the landslide controlling factors, as shown in Fig. 3.
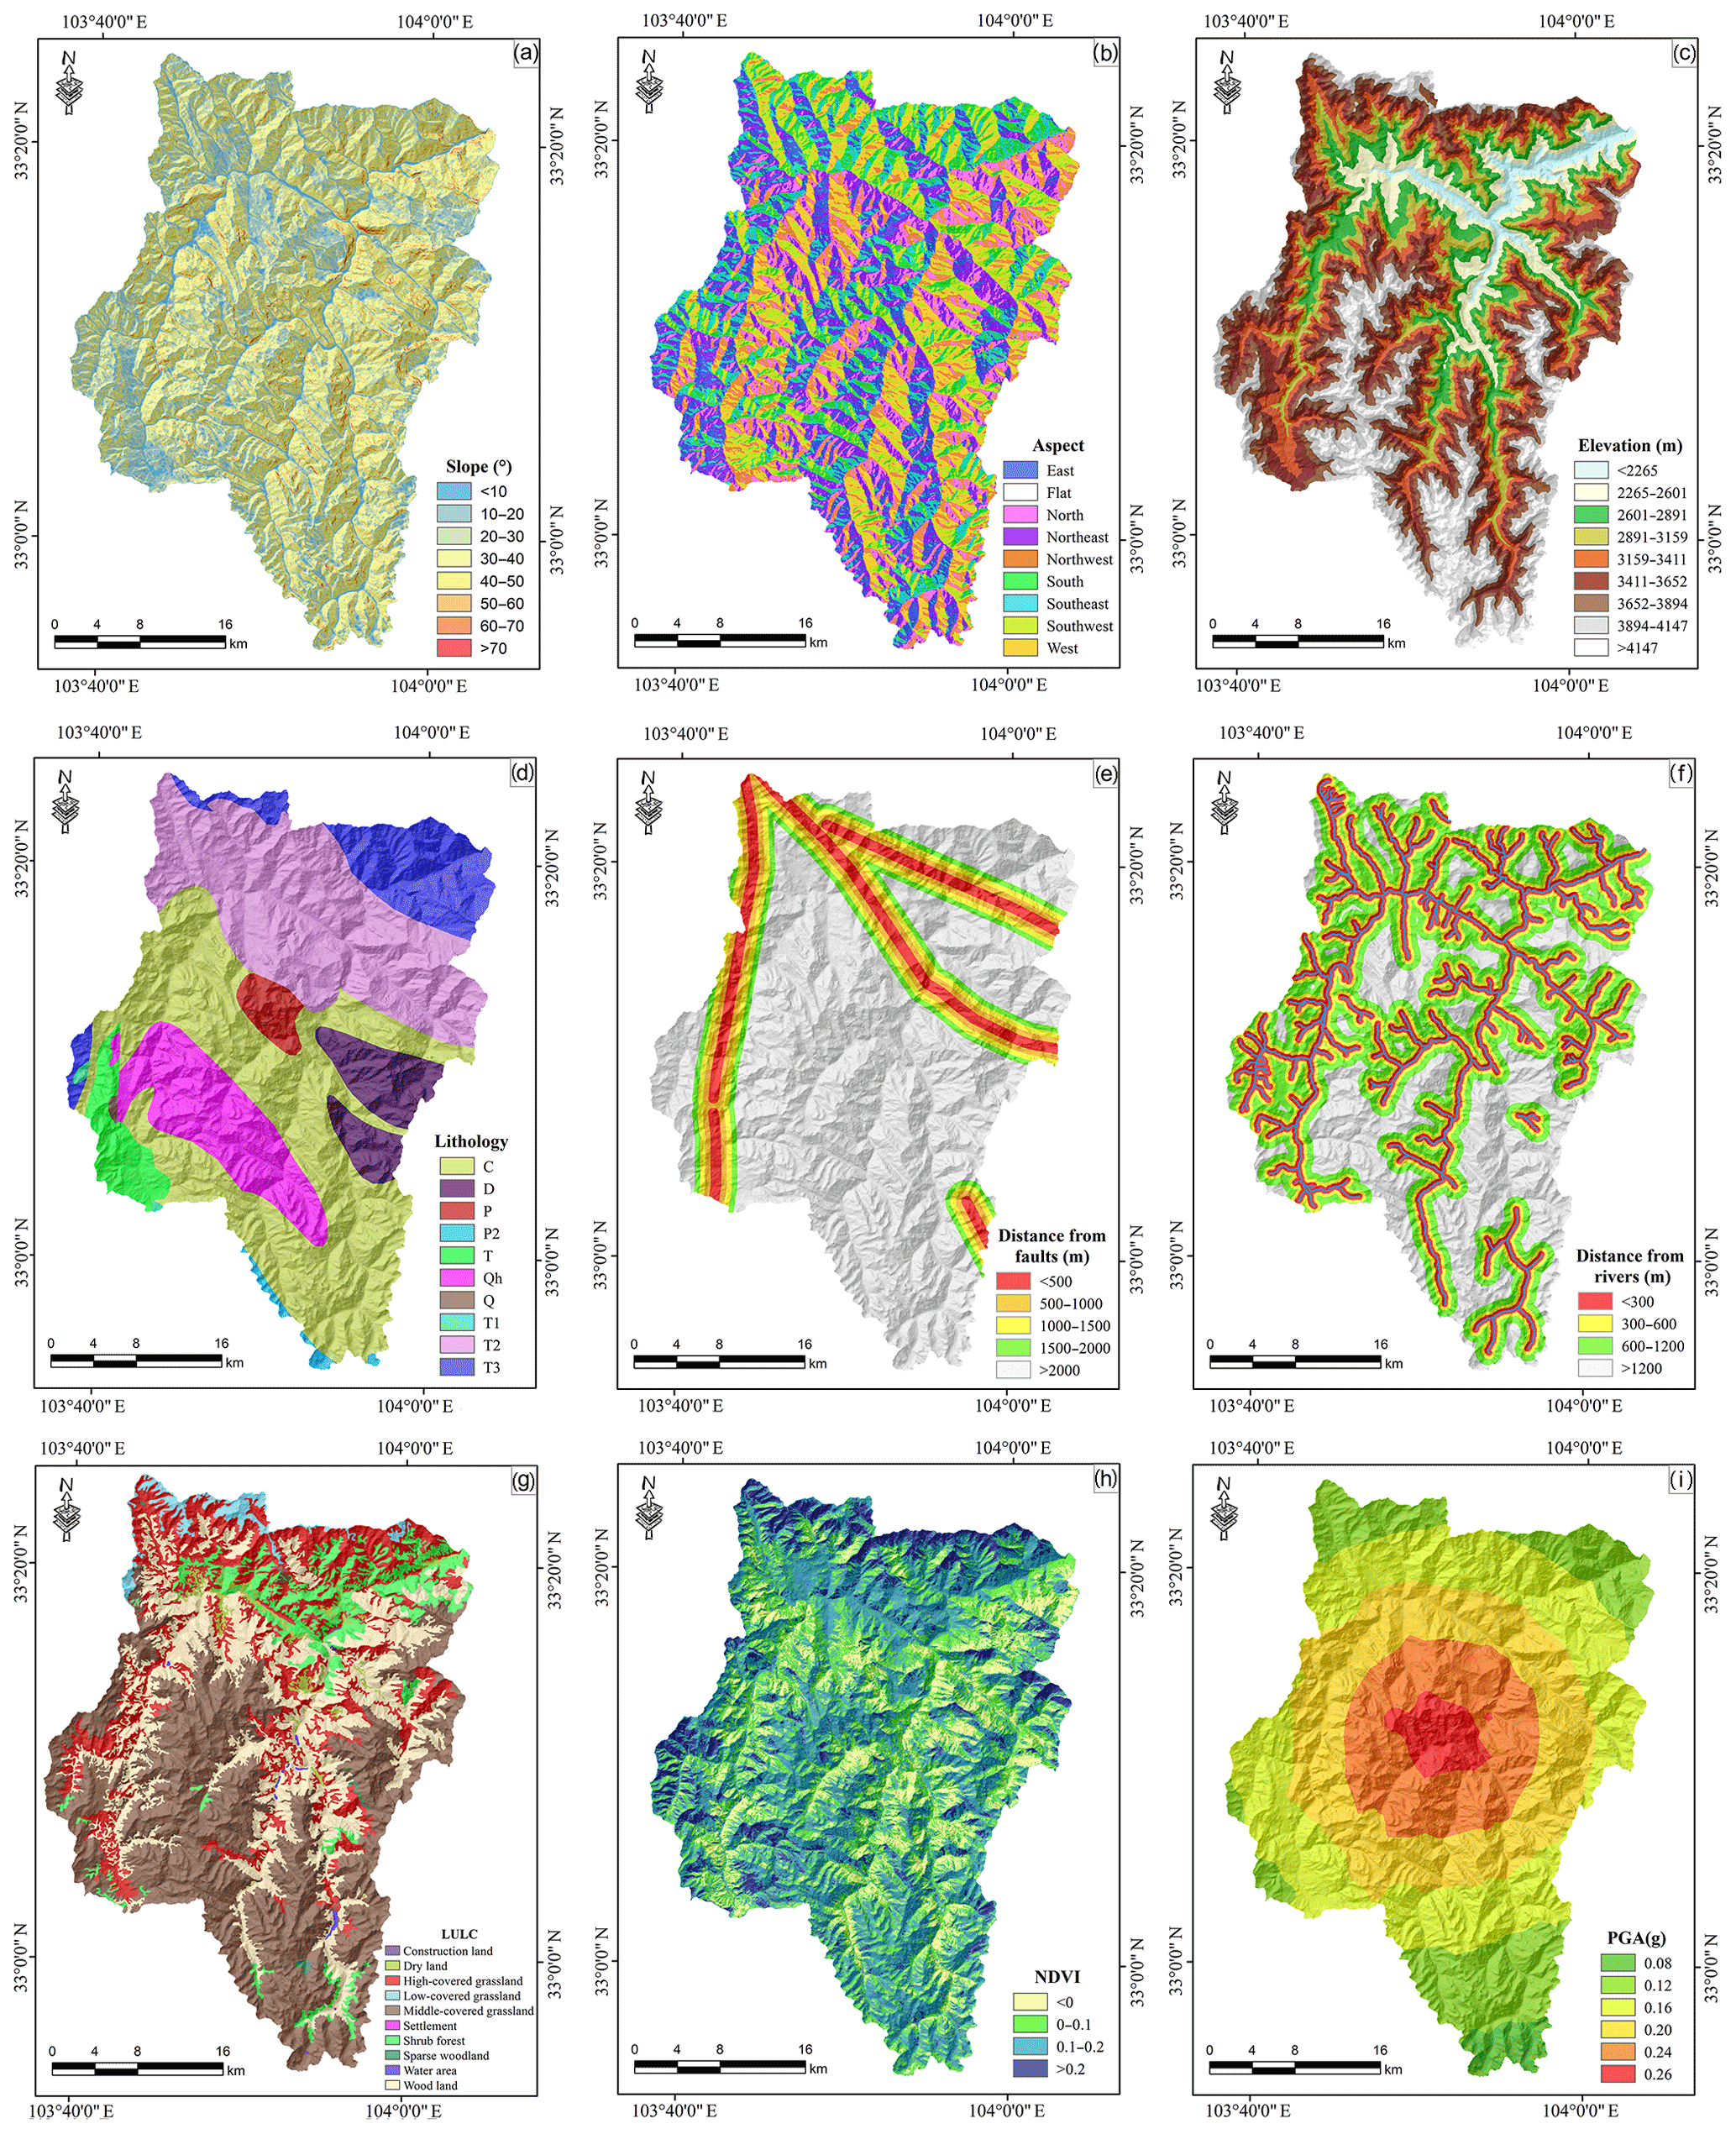
Figure 3Landslide controlling factor layers used for landslide susceptibility mapping in the study area. (a) Slope, (b) aspect and (c) elevation were all extracted from DEM data. (d) Lithology, digitized from the geological map at 1:500 000 scale; (e) distance from faults, calculated by ArcGIS 10.2 software; (f) distance from rivers, calculated by ArcGIS 10.2 software; (g) LULC, collected from the Geographical Information Monitoring Cloud Platform; (h) NDVI, extracted from the Landsat 8 image; (i) PGA, downloaded from the USGS website.
Among all landslide controlling factors, slope, aspect and elevation have been recognized as the most important topographic factors closely related to landslides (Ayalew and Yamagishi, 2005; Chalkias et al., 2016). Slope directly affects the velocity of both surface and subsurface flows (Su et al., 2015). Landslides become more possible once the slope gradient is higher than 15∘ (Lee and Min, 2001). In the study area, the slopes were generally steep, with an average slope angle of about 30∘. Aspect, referring to the direction of slope faces, is related to soil moisture, surface runoff and vegetation, which indirectly affects landslide development (Zhang et al., 2016). The elevation, as the measure of the land surface height, is a key factor determining gravitational potential energy of terrain and is often considered in relevant studies (Conforti et al., 2014; Peng et al., 2014). Topographic factors can be calculated with DEM. The DEM from the SRTM database was used to extract slope (0–78∘), aspect and elevation (1624–4855 m) in the study area.
Lithology is directly related to the slope stability, which plays an important role as a landslide controlling factors (Guo et al., 2015; Saha et al., 2002). A total of 10 geological formation units including Quaternary (Q, Qh), Triassic (T1, T2, T3), Permian (P, P2), Carboniferous (C) and Devonian (D) outcrop in the study area (Wang et al., 2018a). During the Jiuzhaigou earthquake, most landslides in the study area occurred in the Carboniferous formation, which is mainly composed of metamorphic quartzite sandstones, limestone and slate (Fan et al., 2018). In addition, the Permian limestone and Triassic sandstone also exhibited a large number of landslides. In this study, the lithological data were obtained from the geological map at 1:500 000 scale and were digitized in ArcGIS for further analysis. The distance of a slope from faults as well as from the river channels is also an important factor in terms of slope stability (Kanungo et al., 2006). In addition, earthquake-triggered landslides are usually found in the vicinity of active faults. Hence, the distances of a slope from a geological tectonic zone were often taken into account in slope stability analysis. Fan et al. (2018) had revealed that this earthquake occurred along a previously unknown blind fault probably belonging to a south branch of the Tazang fault or north part of the Huya fault. However, due to its great uncertainty, this blind fault was not taken into account in the study area. In this study, the faults were digitized from the geological map at a 1:500 000 scale, and the river channels were interpreted from remote sensing images. Furthermore, the LULC map is one of controlling factors that pose direct impact on the occurrence of landslides (Song et al., 2012; Mansouri Daneshvar, 2014). In this study, the LULC map was downloaded from the Geographical Information Monitoring Cloud Platform.
Vegetation coverage affects soil water erosion, which indirectly affects the occurrence of landslides. NDVI, as the measure of vegetation coverage, is usually adopted in landslide susceptibility analysis (Siqueira et al., 2015). The NDVI is calculated from these individual measurements as follows:
where DNNIR stands for the spectral reflectance derived from the measured radiances in the near-infrared regions (NIR), and DNR stands for the spectral reflectance derived from the measured radiances in the visible (red) regions.
In this study, the NDVI map was generated from the Landsat 8 image acquired on 8 April 2017 over the study area.
Earthquakes as an important dynamic factor often trigger slope failures (Xu et al., 2012a). Usually, the impact of earthquakes on landslides is measured and quantified by recording the absolute maximum amplitude of ground acceleration (PGA) (Chalkias et al., 2016). In this study, the PGA map of the study area was downloaded from the USGS website (https://www.usgs.gov, last access: 14 August 2019).
To ensure the consistency and easy process of these data, all factor layers were converted into raster data format (GeoTIFF) with an identical spatial projection (WGS84 datum) and resampled to a resolution of 30 m by ENVI 5.3 and ArcGIS 10.2.
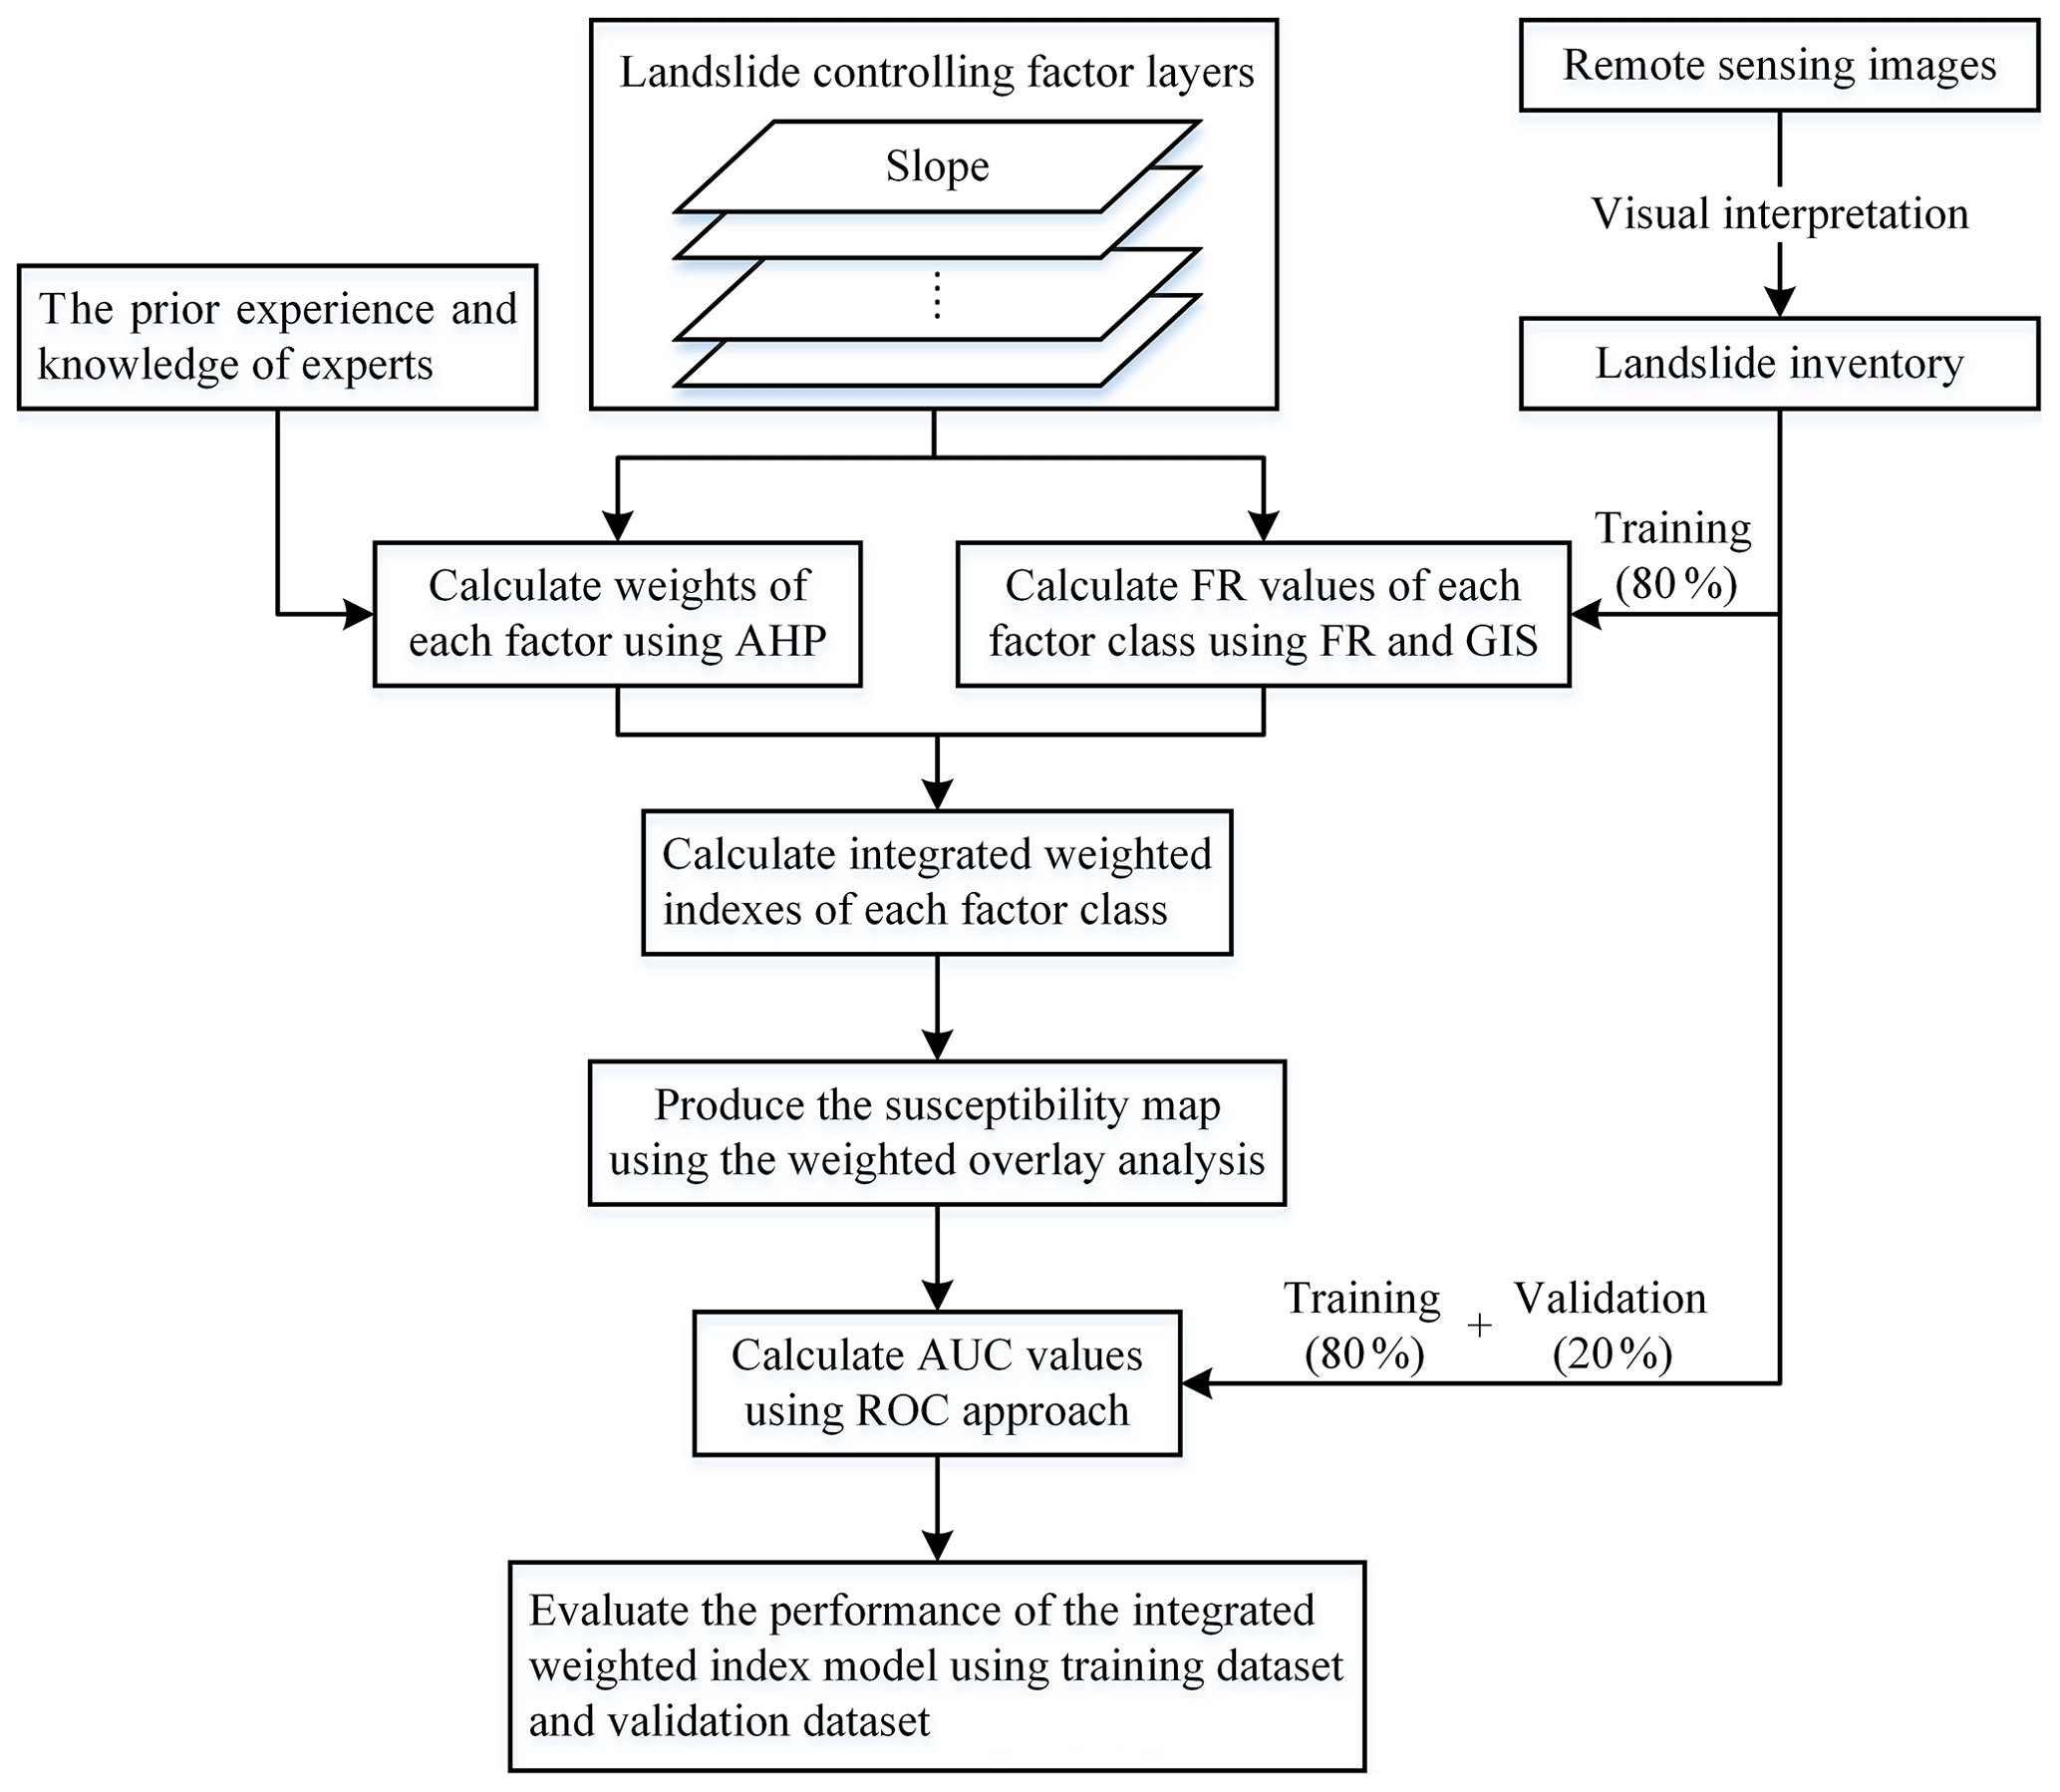
In this study, an integrated weighted index model was developed as a complete landslide susceptibility model by combining AHP and FR approaches. As shown in Fig. 4, the integrated weighted index model was run through three general steps: (1) determining the relative importance of landslide controlling factors using the AHP method, (2) characterizing the relationships between controlling factors and landslide locations using the FR and GIS techniques, and (3) predicting landslide susceptibility using the Weighted Overlay analysis tool of ArcGIS.
4.1 Analytical hierarchy process (AHP)
The AHP method, developed by Saaty (Saaty, 1977), is an important multiple-criteria decision-making method (Vaidya and Kumar, 2006), which has been applied for landslide susceptibility assessment for many years (Akgun, 2012; Barredo et al., 2000; Kayastha et al., 2013; Komac, 2006; Pourghasemi et al., 2012; Yalcin, 2008).
In the AHP, a complex non-structural problem is first broken down into several component factors. Then, based on the expert's prior experience and knowledge, a pair-wise comparison matrix can be constructed through comparing the relative importance of each factor (Vargas, 1990). An underlying nine-point recording scale is used to rate the relative importance of factors (Mansouri Daneshvar, 2014). Specifically, when a factor is more important than another, the score varies between 1 and 9. Conversely, the score varies between 1∕2 and 1∕9. The higher the score, the greater the importance of the factor. With the help of a pair-wise comparison matrix, the contribution of factors can be converted into numerical values. Note that a consistency check of comparison matrix needs to be carried out, and a consistency ratio (CR) of less than 0.1 is generally accepted.
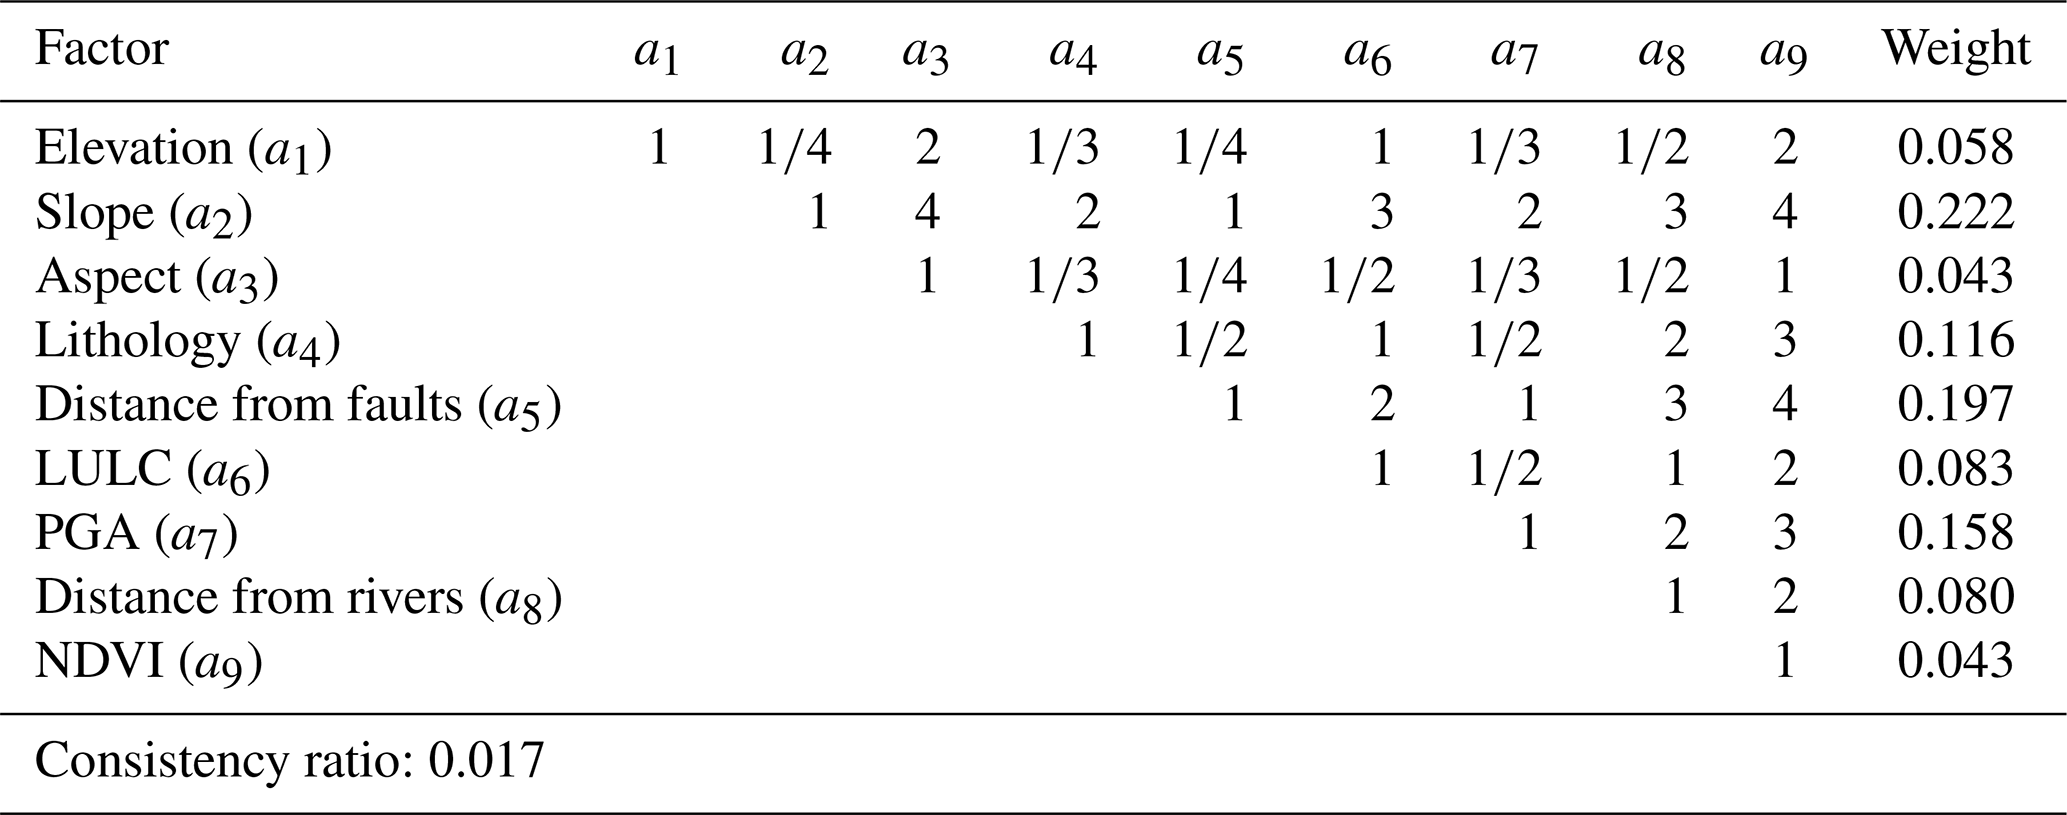
In this study, the relative importance of landslide controlling factors was determined from the prior experience and knowledge of experts. Since the knowledge source varies from person to person, the best judgement always comes from an individual who has good expertise (Ayalew et al., 2004). To find the appropriate correlation between controlling factors, we investigated some related literature (Shahabi and Hashim, 2015; Xu et al., 2012b; Zhang et al., 2016) and consulted with some professional experts. Finally, the pair-wise comparison matrix was determined by means of discussion (Table 2) and a general consensus achieved by experts. Weights of factors were determined in the process of a pair-wise comparison matrix using Python software, as shown in Table 2. The consistency ratio (CR) for this study was 0.017, which showed that the pair-wise comparison matrix satisfied the consistency requirement.
Table 2The pair-wise comparison matrix, factor weights, and consistency ratio obtained in the present study.
4.2 Frequency ratio (FR)
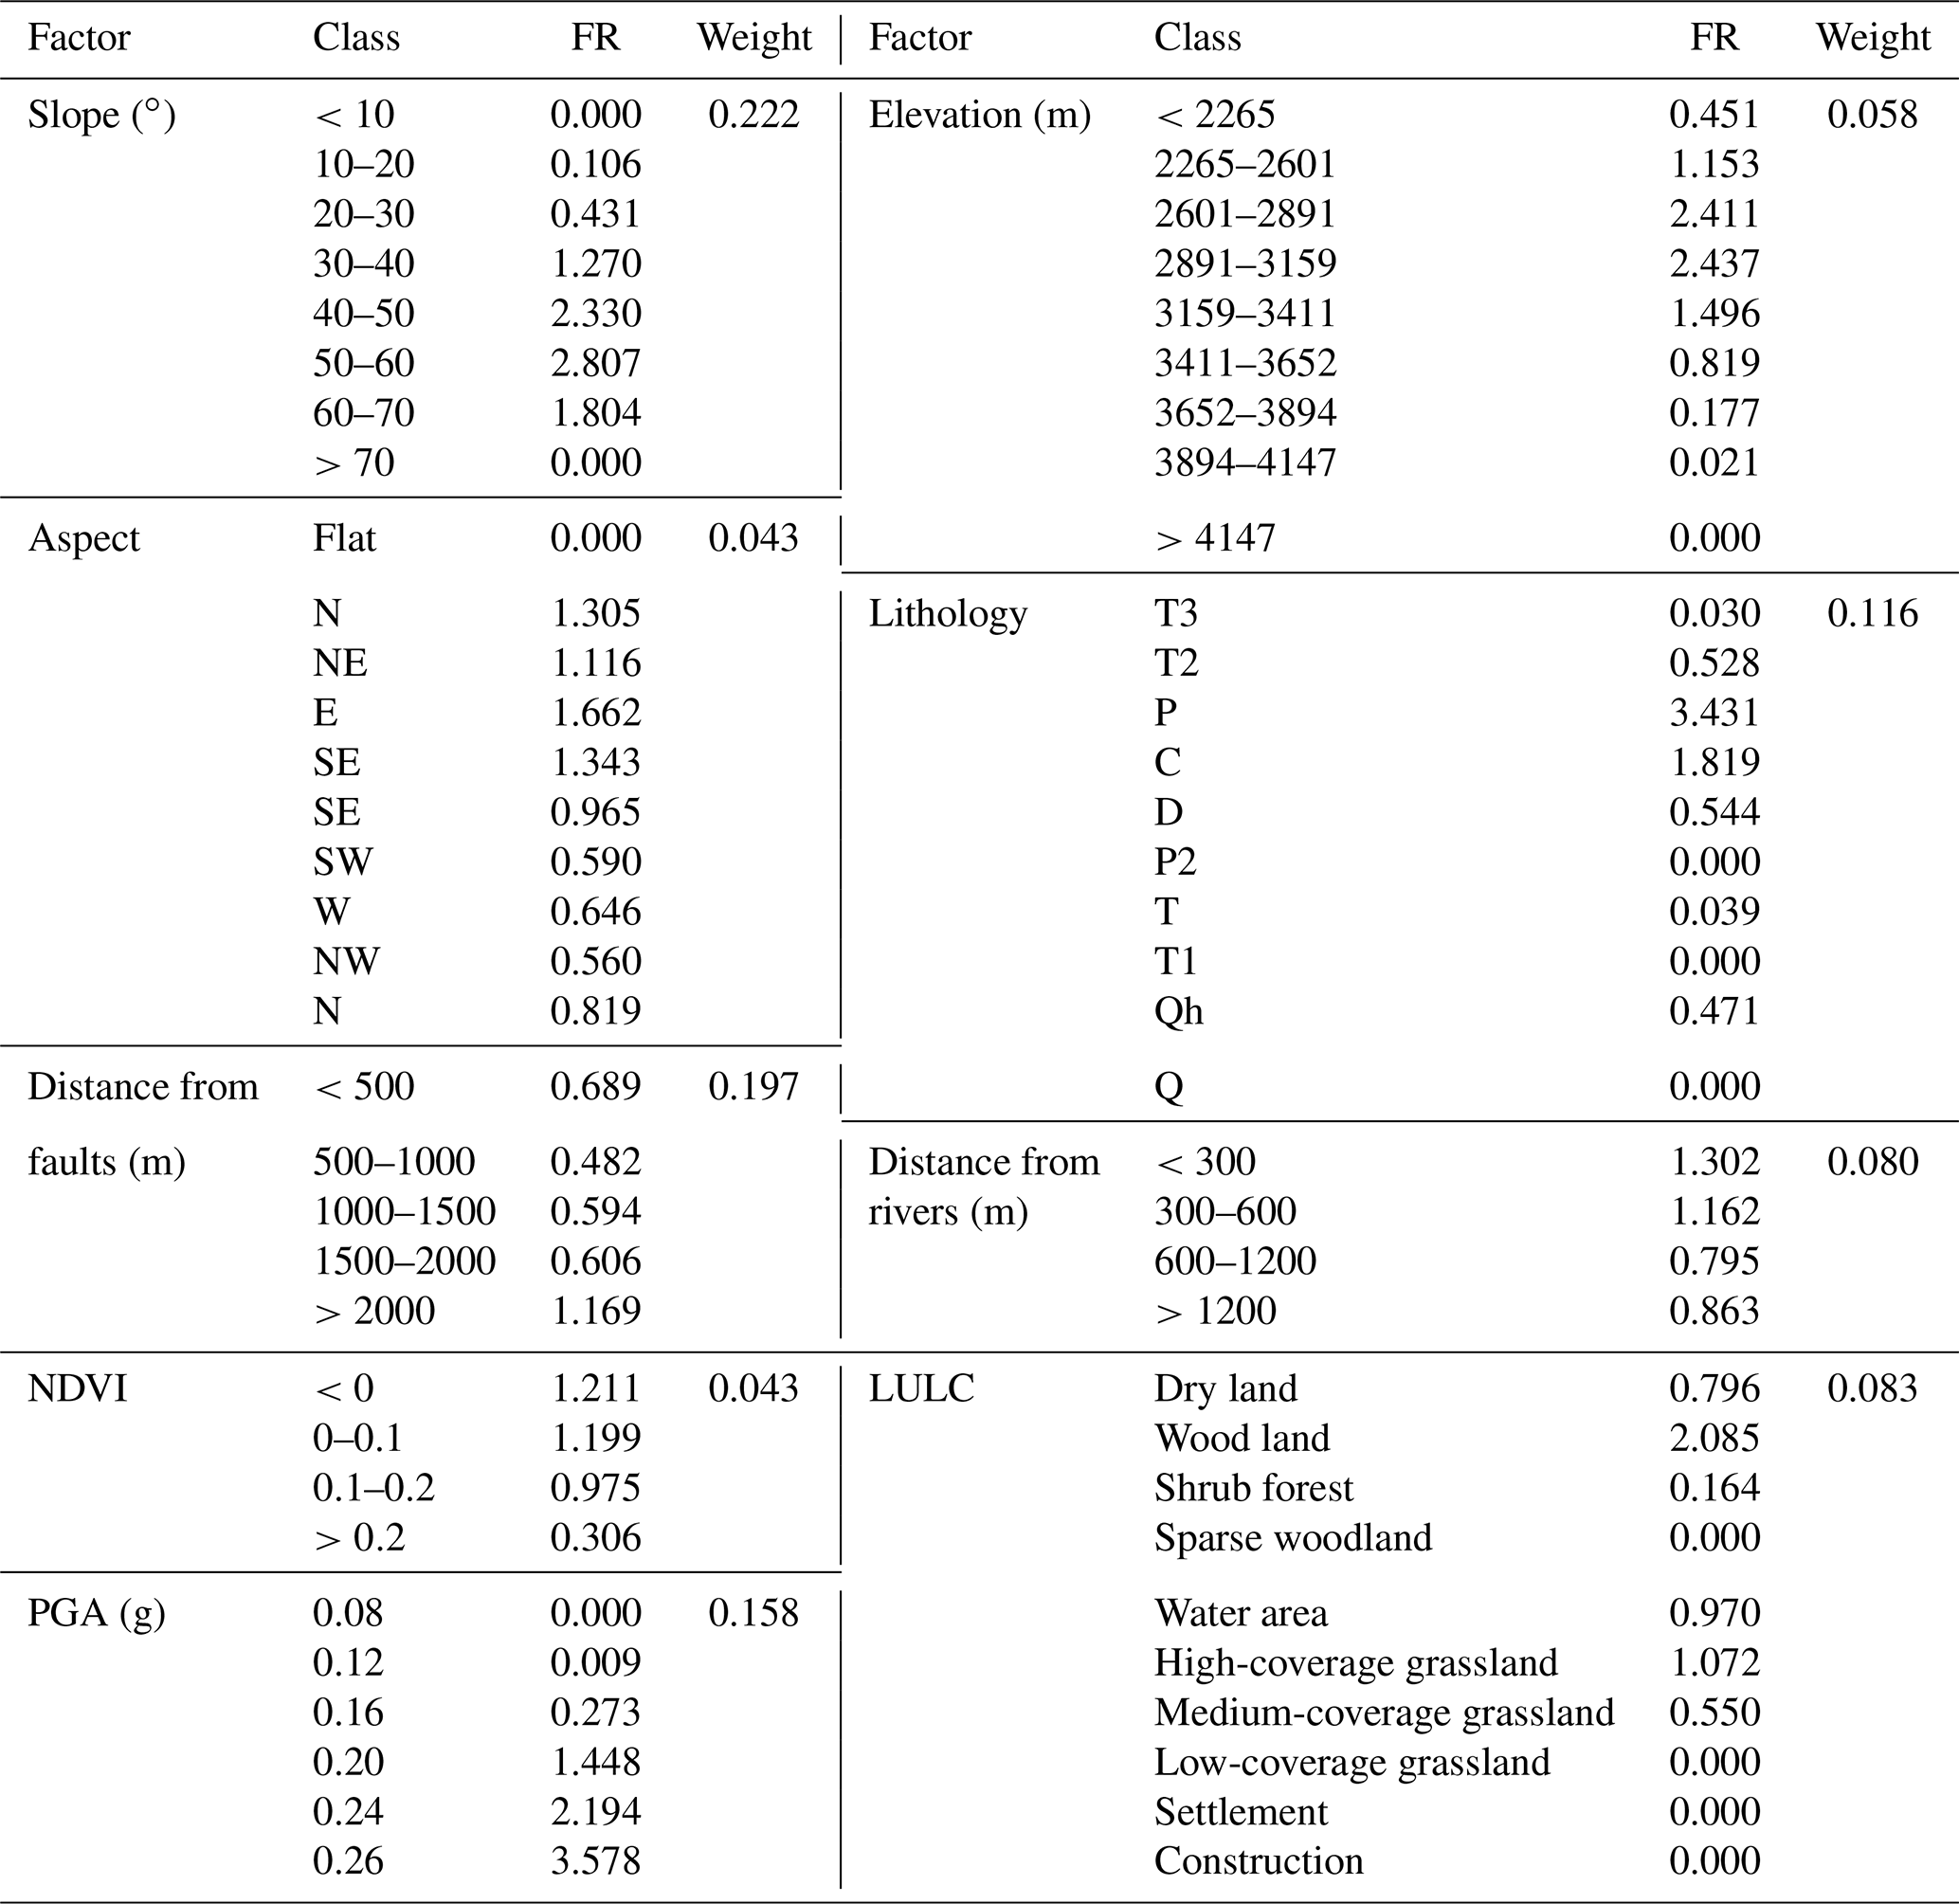
The FR method is one of the most widely used approaches to assess the landslide susceptibility at a regional scale (Guo et al., 2015; Li et al., 2017; Mohammady et al., 2012), which is based on the observed spatial relationship between landslide locations and controlling factors (Lee and Pradhan, 2007; Poudyal et al., 2010). The assumption behind the FR is that future landslides will occur under similar environmental conditions as historical landslides (Guzzetti et al., 1999; Pourghasemi and Rahmati, 2018), and the susceptibility can be evaluated from the relationship between the controlling factors and the landslide occurrence locations (Zhu et al., 2014). The definition of FR is the ratio of the probability of occurrence to non-occurrence for given properties (Lee and Talib, 2005). The spatial relationship between landslides and controlling factors can be investigated by using the FR method. Therefore, the FR values of each controlling factor category were calculated from their relationship with landslide occurrence locations as illustrated in Table 3. The average value of FR is 1 so that a value larger than 1 represents a higher correlation and those less than 1 a lower correlation (Romer and Ferentinou, 2016).
Table 3The FR and weights for landslide controlling factors for the study area.
The FR value can be calculated as follows (Ghobadi et al., 2017):
where Ncell(Si) represents number of grid cells recognized as landslides in class i, and Ncell(Ni) represents total number of grid cells belonging to class i in the whole area. ∑Ncell(Si) stands for the total number of grid cells recognized as landslides in the whole area, and ∑Ncell(Ni) represents total number of grid cells in the whole area.
4.3 Integrated weighted index
The integrated weighted index is considered to measure the probability of slope failures. By combining the FR and AHP methods, the integrated weighted model can assess the correlation between the controlling factors and also the influence of each landslide controlling factor on landslide occurrence.
The integrated weighted index can be calculated as follows:
where m stands for number of controlling factors, Wi is the weight of each controlling factor calculated by the AHP method and FRi is the FR value of the controlling factor calculated by the FR method.
In this study, the values of Wi and FRi were used to obtain the integrated weighted index of each grid cell in the study area, and the final landslide susceptibility map was generated by using the Weighted Overlay analysis tool of ArcGIS.
5.1 Landslide susceptibility mapping
The AHP method was used to assign the weights for each controlling factor. The higher the weight was, the more impacts on landslide occurrence could be expected. As shown in Table 2, the weight of slope was highest, implying the most significant influence of slope on the landslide occurrence, and the weights of aspect and NDVI were the lowest, which indicated that these two factors played the least role in the landslide occurrence.
The FR values of each controlling factor category were calculated by using the Eq. (2) (as shown in Table 3). Table 3 clearly shows the relationship between each controlling factor and the landslide occurrence. In terms of the relationship between landslide occurrence and slope, landslides mostly occurred in the slope ranging from 40 to 60∘. For the elevation, landslides mostly occurred below the elevation of 3400 m, which implied that the probability of landslide occurrence was higher in moderately steep mountainous regions. In terms of the aspect, the FR value was very high for the classes of E, N, SE and NE, and it was lowest for the class of flat. For the lithology, the highest FR value was achieved for the Permian system, which influenced the landslide occurrence. For the factor of distance from faults, the highest FR value belonged to the area higher than 2000 m. The distance from rivers with the highest FR value for frequent landslide occurrence was usually found between 0 and 600 m, and landslides mostly occurred in the region with low vegetation cover with a lower NDVI value. In the case of PGA, the value of 0.26 g had the highest FR value, which indicated the significant influence of the earthquake on the landslide occurrence. In general, our results were basically consistent with the previous study (Fan et al., 2018), which found that most of the landslides mainly occurred in close proximity to rivers and the epicentre, with an elevation of 2600 to 3200 m and a slope of 35 to 55∘.
Finally, the landslide susceptibility map of the study area was generated by using the Weighted Overlay analysis tool of ArcGIS, and the study area was classified into seven categories of landslide susceptibility levels as presented in Fig. 5: very high, high, relatively high, moderate, relatively low, low and very low by using the natural breaks (Jenks) method with ArcGIS, respectively.
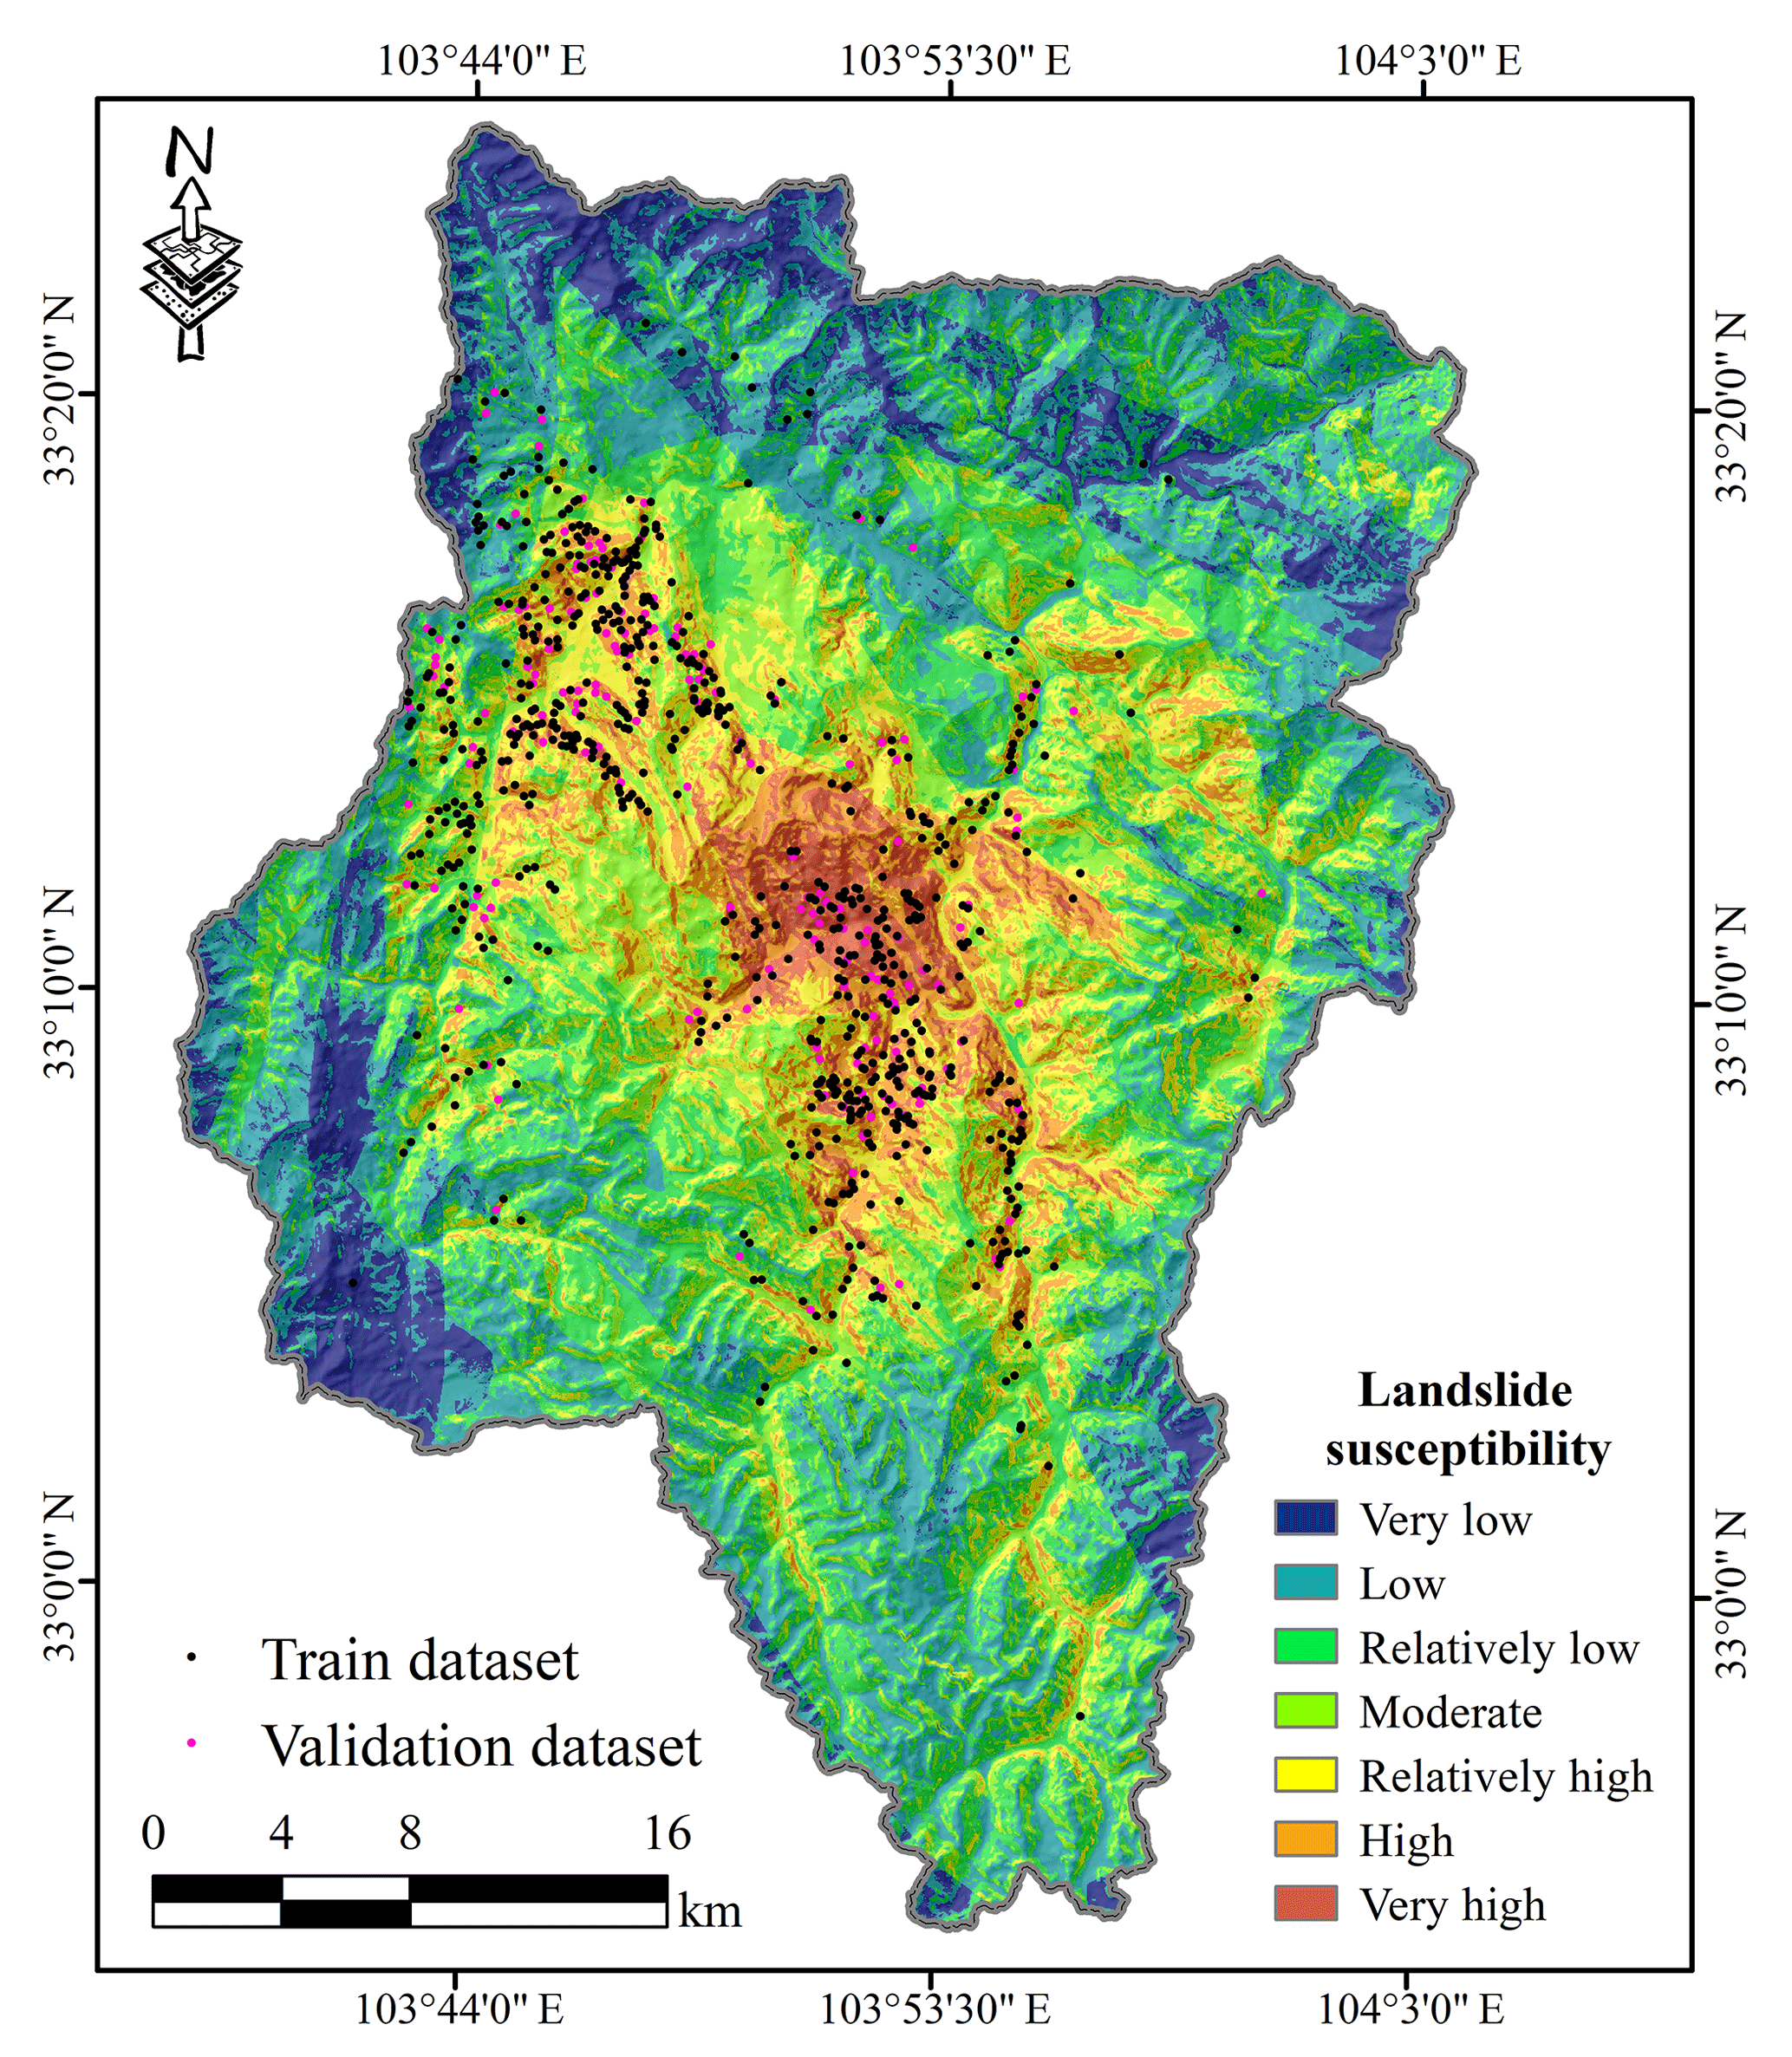
Figure 5Landslide susceptibility map of the study area generated by using the integrated weighted index model.
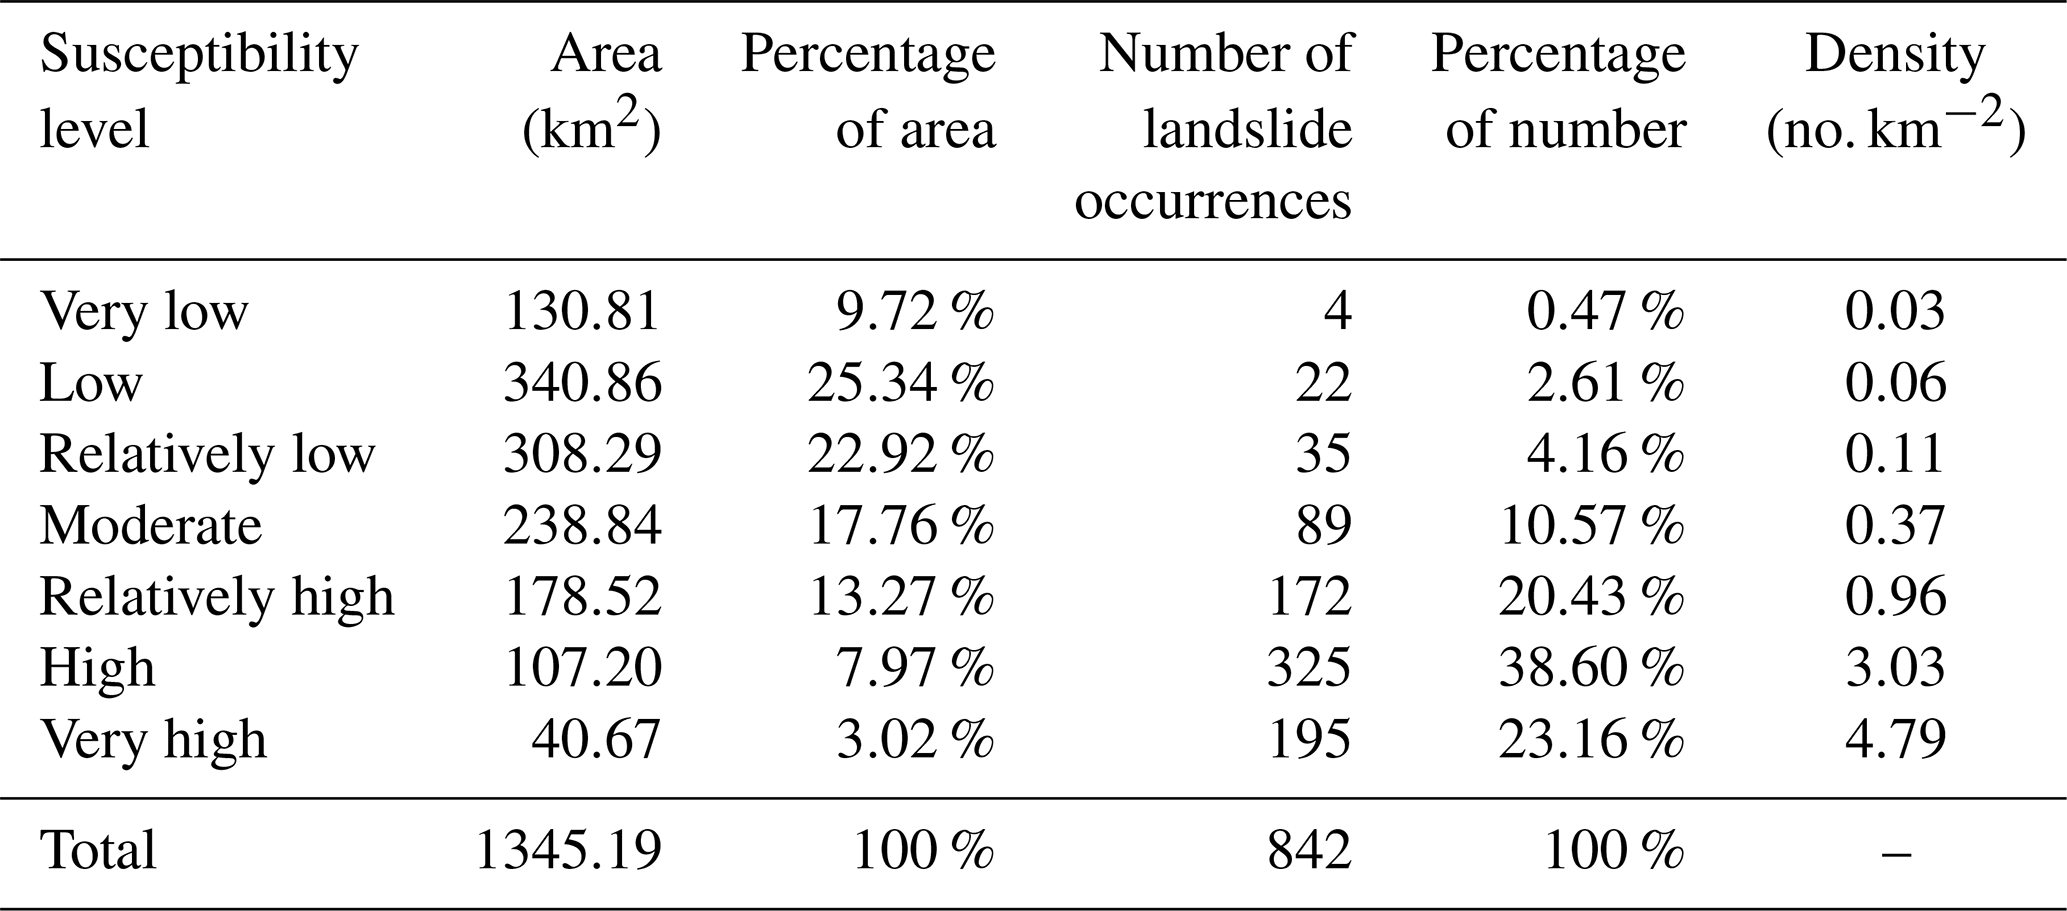
According to the landslide susceptibility map, the location close to the epicentre and rivers was classified as the most susceptible area for landslides, and the areas with high and very high landslide susceptibility were mostly located in the middle central mountainous region. The low- and very low-susceptibility areas were far from the epicentre and less affected by the earthquake, mainly distributed in the north and southwest parts of the study area. Table 4 presented the distribution of seven landslide susceptibility levels. As indicated in Table 4, the very low-susceptibility area covered 9.72 % of the whole area, whereas low, relatively low, moderate, relatively highly, highly and very highly susceptible areas covered 25.34 %, 22.92 %, 17.76 %, 13.27 %, 7.97 % and 3.02 % of the whole area, respectively. A total of 61.76 % of the landslides were observed in the high- and very high-susceptibility areas, and only 3.08 % of the landslides were observed in the low- and very low-susceptibility areas. For the landslide density, the values for very low, low, relatively low, moderate, relatively high, high and very high were 0.03, 0.06, 0.11, 0.37, 0.96, 3.03 and 4.79, respectively. The landslide density for the very highly susceptible area was significantly larger than for the other susceptible areas.
Table 4Landslide susceptibility levels and density of landslides in the study area.
5.2 Validations
For landslide susceptibility mapping, validation of the modelled results is essential. A simple procedure of validation can make a comprehensive and reasonable interpretation of the future landslide hazard (Chung and Fabbri, 2003).
In this study, the operating characteristics curve (ROC) approach (Brenning, 2005; Bui et al., 2016) was adopted to evaluate the performance of the integrated weighted index model, including the degree of model fit and model predictive capability. The ROC was obtained by calculating the area under the curve (AUC) and the AUC value varied from 0.5 to 1.0 (Umar et al., 2014). The AUC value of 1.0 implied a perfect performance of the model, whereas a value close to 0.5 indicated that the model performed not so well. To assess the fitting performance of the integrated weighted index model, five sub-datasets containing 20 %, 40 %, 60 %, 80 % and 100 % of a training dataset (i.e. 673 landslides) were used to obtain the fitting curves. These fitting curves can be generated by comparing resultant maps with the existing training dataset. Figure 6a shows a quantitative measure of the ability of the integrated weighted index model to describe the known distribution of landslides. The AUC values of five sub-datasets were 82.57 %, 84.52 %, 84.99 %, 86.08 % and 85.65 %, which suggested the effective fitting capability of the integrated weighted index model developed in this study.
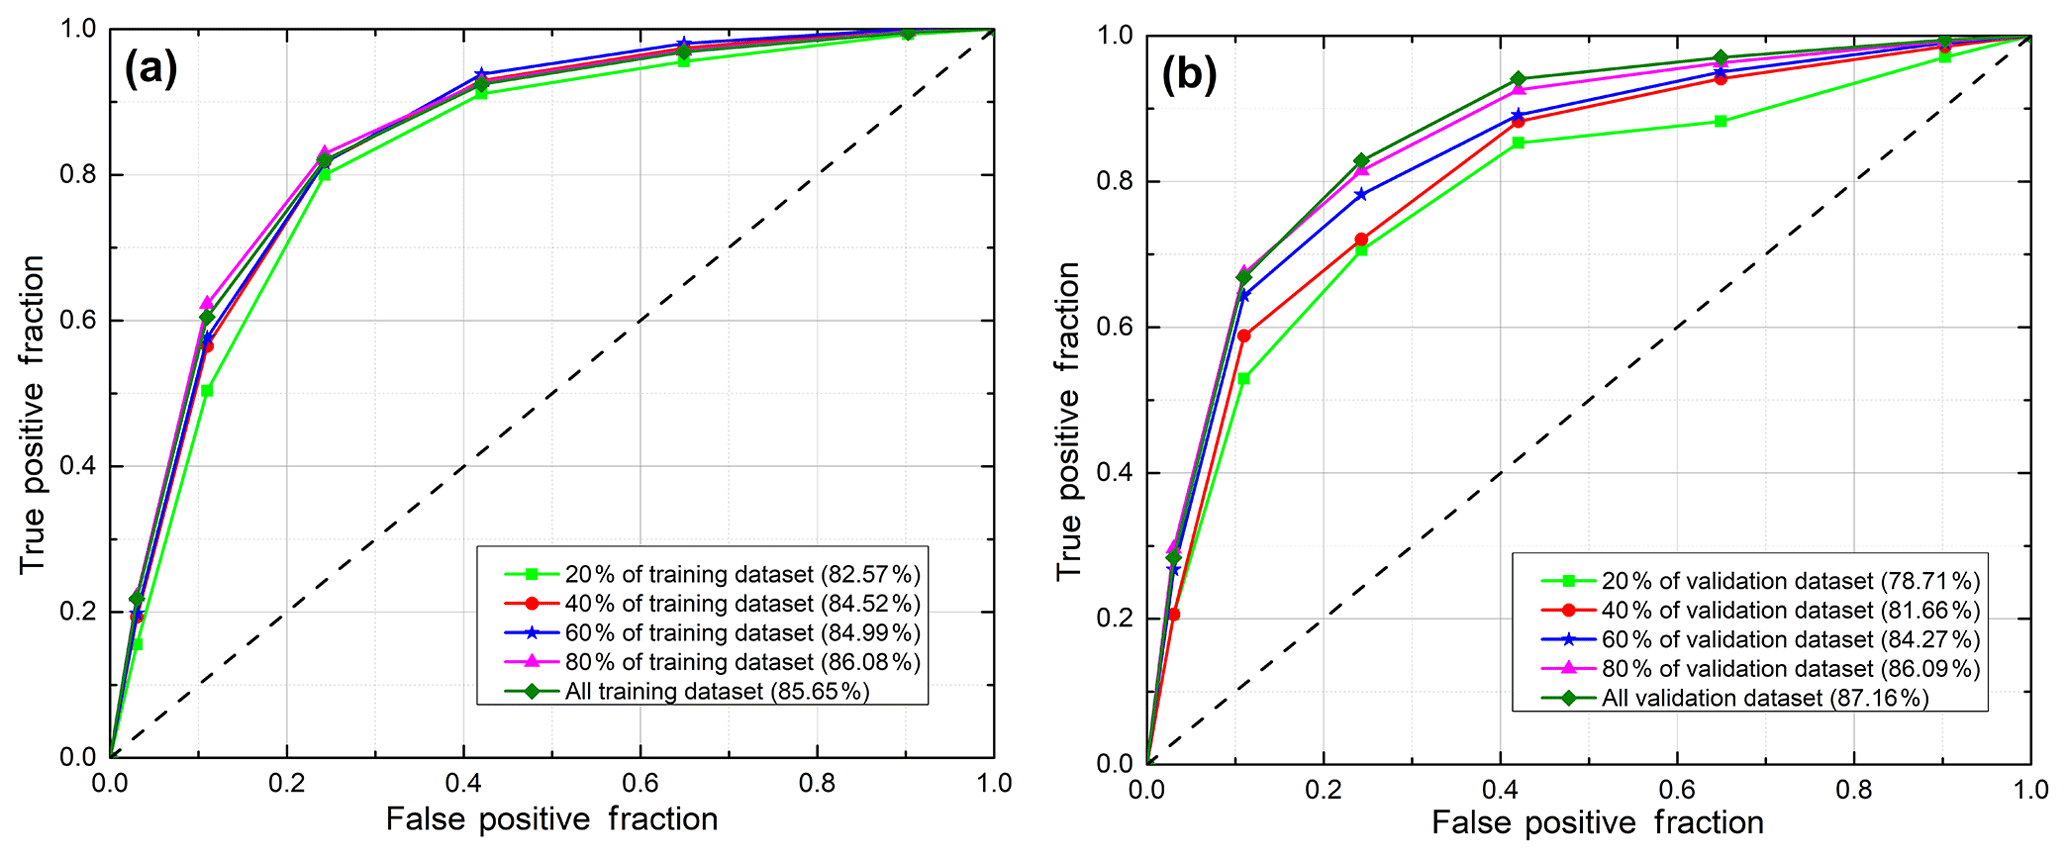
Figure 6ROC of the Jiuzhaigou landslide susceptibility assessment. (a) Fitting performance of the integrated weighted index model; (b) prediction performance of the integrated weighted index model.
To investigate the prediction performance of the integrated weighted index model, we also adopted five sub-datasets containing 20 %, 40 %, 60 %, 80 % and 100 % of the validation dataset (i.e. 169 landslides), to estimate the prediction rates. The prediction rates can be calculated by comparing resultant maps with the unknown validation dataset. Note that the validation dataset (i.e. 20 % of the landslide inventory dataset) was not used in the training process. The AUC values of five sub-datasets, as presented in Fig. 6b, were 78.71 %, 81.66 %, 84.27 %, 86.09 % and 87.16 %. With the increase in input data, the performance of the integrated weighted index model was significantly improved, which indicated a reliable predicting capability of the integrated weighted index model adopted in this study.
In addition, the landslide density distribution of each susceptibility level was computed by associating landslides with the classified landslide susceptibility map (as shown in Table 4). There was a clear trend that the increase in the level of landslide susceptibility was highly correlated with the density of landslides. The high- and very high-susceptibility levels had significantly high landslide density values, while the low-susceptibility categories were just the opposite, which also implied the effectiveness of the generated landslide susceptibility map of the study area.
5.3 Discussions
Landslide susceptibility is defined as the likelihood of landslides occurring in an area under local environmental conditions (Fell et al., 2008; Reichenbach et al., 2018). There are numerous methods that have been proposed to evaluate the susceptibility. The main purpose of this study is to assess the spatial probability of landslide occurrences by using an integrated weighted index model in association with the utilization of FR and AHP approaches. The FR is a data-driven statistical approach which can derive the spatial relationship between landslide locations and controlling factors. However, the FR method does not consider the mutual relationships between controlling factors. The AHP method is an important multiple criteria decision-making method, which can overcome this shortcoming. To some extent, the integrated method preserves the advantages of FR and AHP methods and restrains their weak points. Some similar studies have also pointed out this fact (Reichenbach et al., 2018; Youssef et al., 2015; Zhou et al., 2016).
The implementation of the integrated weighted index model revealed that landslide susceptibility levels were basically consistent with the distribution of earthquake-triggered landslides. The high-susceptibility areas were concentrated in the central mountainous region close to the epicentre of the earthquake of the study area, which indicated the significant influence of the Jiuzhaigou earthquake on the landslide occurrence. From the landslide susceptibility map (as shown in Fig. 5 and Table 4), the very high- and high-susceptibility areas covered 10.99 % of the whole area, and most of the Jiuzhaigou National Nature Reserve was classified as the most-landslide-susceptible areas.
However, some limitations still existed in the proposed method. Firstly, the accuracy of the FR method is highly dependent on the quality of the dataset, especially the landslide inventory (Zhou et al., 2016). Nevertheless, the landslide inventory is generally incomplete (Fell et al., 2008), and is affected by many factors, such as the quality and scale of remote sensing images, the tectonic setting complexity of the study area, and the expertise of the interpreter involved (Malamud et al., 2004). In this study, we mainly focused on the interpretation of earthquake-triggered landslides (i.e. co-seismic landslides). We did not accurately identify the landslides before the Jiuzhaigou earthquake due to the limitations of historical images. Since the remote sensing images we used were very close to the time of earthquake, we have reason to believe that most of the landslides we interpreted were triggered by the Jiuzhaigou earthquake. In addition, interpretation results were basically consistent with the previous studies (Fan et al., 2018; Wang et al., 2018a, b), and smaller landslides were also not completely identified. Future work should focus on the preparation of more detailed landslide inventories, and field work should be carried out in time. Secondly, in this study, as the proposed method was applied to medium-scale datasets, the results may not be suitable for specific analysis on a large or detailed scale. At large or detailed scales, a more detailed landslide inventory dataset and controlling factor layers are required. Additionally, the assumption behind much of the landslide susceptibility mapping is that future landslides will occur under similar environmental conditions as historical landslides (Guzzetti et al., 1999; Pourghasemi and Rahmati, 2018). Although most landslide susceptibility mapping studies are based on this assumption, results obtained in the past environmental conditions are not a guarantee for the future (Guzzetti et al., 2005). In this study, we used a weighted index model by integrating the AHP and FR approaches to map the earthquake-triggered-landslide susceptibility and the generated susceptibility map of the study area was made for the present situation. The susceptibility results need to be adapted as soon as environmental conditions or their causal relationships obviously change in the future. However, for earthquake emergency and safe planning, a reliable landslide susceptibility map can provide rapid assessment for reconstruction of tourism facilities, regional disaster management, etc. Therefore, to some extent, the integrated method can serve engineers and decision makers involved in hazard mitigation.
Earthquakes are one of the dynamic causes of landslide occurrence. Earthquake-triggered landslides can cause extensive and significant damage to both lives and properties. In this study, given the main motivation to adopt an integrated weighted index model based on the FR and AHP methods for earthquake-triggered-landslide susceptibility mapping at Zhangzha town of Jiuzhaigou County where a Mw=6.5 earthquake struck on Tuesday, 8 August 2017, nine factors such as slope, aspect, elevation, lithology, distance from faults, distance from rivers, LULC, NDVI and PGA as landslide controlling factors were adopted in the integrated weighted index model for generating the landslide susceptibility map of the study area with reclassification of seven levels of landslide susceptibility areas within a GIS environment. The ROC approach was used to comprehensively evaluate the performance of the integrated weighted index model, including the degree of model fit and model predictive capability. The results demonstrated the reliability and feasibility of the integrated weighted index model in landslide susceptibility mapping at a regional scale.
Even though some limitations do exist, the integrated weighted index model can generate a reliable landslide susceptibility map at a regional scale that is useful for engineers and decision makers to understand the probability of landslides and mitigate hazards. Furthermore, the integration of some machine learning techniques should be taken into account in the integrated weighted index model for advancement in future studies.
The DEM, Landsat 8 and PGA data used in this study were downloaded from the USGS website (https://www.usgs.gov, last access: 14 August 2019). The Sentinel-2A images were downloaded from the European Space Agency (https://scihub.copernicus.eu, last access: 14 August 2019). Additional data related to this paper can be requested from the authors through email.
WZ, YY and ZZ conceived this research. YY and ZZ designed the methodology and performed the experiments. YY analysed the results and wrote the paper. ZZ, QX, CD and QL gave comments and modified the paper. All authors contributed to the preparation of this paper.
The authors declare that they have no conflict of interest.
We would like to thank the reviewers for their valuable suggestions and comments.
This research has been supported by the National Key Research and Development Program of China (grant nos. 2016YFB0502502 and 2016YFA0602302).
This paper was edited by Filippo Catani and reviewed by Xiao-Xiao Zhang and one anonymous referee.
Akgun, A.: A comparison of landslide susceptibility maps produced by logistic regression, multi-criteria decision, and likelihood ratio methods: a case study at İzmir, Turkey, Landslides, 9, 93–106, https://doi.org/10.1007/s10346-011-0283-7, 2012.
Alexander, D. E.: A brief survey of GIS in mass-movement studies, with reflections on theory and methods, Geomorphology, 94, 261–267, https://doi.org/10.1016/j.geomorph.2006.09.022, 2008.
Althuwaynee, O. F., Pradhan, B., and Lee, S.: Application of an evidential belief function model in landslide susceptibility mapping, Comput. Geosci., 44, 120–135, https://doi.org/10.1016/j.cageo.2012.03.003, 2012.
Ayalew, L. and Yamagishi, H.: The application of GIS-based logistic regression for landslide susceptibility mapping in the Kakuda-Yahiko Mountains, Central Japan, Geomorphology, 65, 15–31, https://doi.org/10.1016/j.geomorph.2004.06.010, 2005.
Ayalew, L., Yamagishi, H., and Ugawa, N.: Landslide susceptibility mapping using GIS-based weighted linear combination, the case in Tsugawa area of Agano River, Niigata Prefecture, Japan, Landslides, 1, 73–81, https://doi.org/10.1007/s10346-003-0006-9, 2004.
Ba, Q., Chen, Y., Deng, S., Wu, Q., Yang, J., and Zhang, J.: An Improved Information Value Model Based on Gray Clustering for Landslide Susceptibility Mapping, ISPRS Int. J. Geo-Inform., 6, 18, https://doi.org/10.3390/ijgi6010018, 2017.
Bai, S.-B., Wang, J., Lü, G.-N., Zhou, P.-G., Hou, S.-S., and Xu, S.-N.: GIS-based logistic regression for landslide susceptibility mapping of the Zhongxian segment in the Three Gorges area, China, Geomorphology, 115, 23–31, https://doi.org/10.1016/j.geomorph.2009.09.025, 2010.
Barredo, J., Benavides, A., Hervás, J., and van Westen, C. J.: Comparing heuristic landslide hazard assessment techniques using GIS in the Tirajana basin, Gran Canaria Island, Spain, Int. J. Appl. Earth Obs. Geoinf., 2, 9–23, https://doi.org/10.1016/S0303-2434(00)85022-9, 2000.
Boon, D. P., Chambers, J. E., Hobbs, P. R. N., Kirkham, M., Merritt, A. J., Dashwood, C., Pennington, C., and Wilby, P. R.: A combined geomorphological and geophysical approach to characterising relict landslide hazard on the Jurassic Escarpments of Great Britain, Geomorphology, 248, 296–310, https://doi.org/10.1016/j.geomorph.2015.07.005, 2015.
Brenning, A.: Spatial prediction models for landslide hazards: review, comparison and evaluation, Nat. Hazards Earth Syst. Sci., 5, 853–862, https://doi.org/10.5194/nhess-5-853-2005, 2005.
Bui, D. T., Tuan, T. A., Klempe, H., Pradhan, B., and Revhaug, I.: Spatial prediction models for shallow landslide hazards: a comparative assessment of the efficacy of support vector machines, artificial neural networks, kernel logistic regression, and logistic model tree, Landslides, 13, 361–378, https://doi.org/10.1007/s10346-015-0557-6, 2016.
Caniani, D., Pascale, S., Sdao, F., and Sole, A.: Neural networks and landslide susceptibility: a case study of the urban area of Potenza, Nat. Hazards, 45, 55–72, https://doi.org/10.1007/s11069-007-9169-3, 2008.
Carrara, A., Cardinali, M., Detti, R., Guzzetti, F., Pasqui, V., and Reichenbach, P.: Gis Techniques and Statistical-Models in Evaluating Landslide Hazard, Earth Surf. Proc. Land., 16, 427–445, https://doi.org/10.1002/esp.3290160505, 1991.
Catani, F., Casagli, N., Ermini, L., Righini, G., and Menduni, G.: Landslide hazard and risk mapping at catchment scale in the Arno River basin, Landslides, 2, 329–342, https://doi.org/10.1007/s10346-005-0021-0, 2005.
Chalkias, C., Polykretis, C., Ferentinou, M., and Karymbalis, E.: Integrating Expert Knowledge with Statistical Analysis for Landslide Susceptibility Assessment at Regional Scale, Geosciences, 6, 14, https://doi.org/10.3390/geosciences6010014, 2016.
Chung, C. J. F. and Fabbri, A. G.: Validation of spatial prediction models for landslide hazard mapping, Nat. Hazards, 30, 451–472, https://doi.org/10.1023/B:Nhaz.0000007172.62651.2b, 2003.
Conforti, M., Pascale, S., Robustelli, G., and Sdao, F.: Evaluation of prediction capability of the artificial neural networks for mapping landslide susceptibility in the Turbolo River catchment (northern Calabria, Italy), Catena, 113, 236–250, https://doi.org/10.1016/j.catena.2013.08.006, 2014.
Dai, F. C. and Lee, C. F.: Landslide characteristics and, slope instability modeling using GIS, Lantau Island, Hong Kong, Geomorphology, 42, 213–228, https://doi.org/10.1016/S0169-555x(01)00087-3, 2002.
Dehnavi, A., Aghdam, I. N., Pradhan, B., and Morshed Varzandeh, M. H.: A new hybrid model using step-wise weight assessment ratio analysis (SWARA) technique and adaptive neuro-fuzzy inference system (ANFIS) for regional landslide hazard assessment in Iran, Catena, 135, 122–148, https://doi.org/10.1016/j.catena.2015.07.020, 2015.
Deng, G.: Study of Tourism Geosciences Landscape Formation and Protection of Jiuzhaigou World Natural Heritage Site, PhD thesis, Chengdu University of Technology, Chengdu, China, 173 pp., 2011.
Ermini, L., Catani, F., and Casagli, N.: Artificial Neural Networks applied to landslide susceptibility assessment, Geomorphology, 66, 327–343, https://doi.org/10.1016/j.geomorph.2004.09.025, 2005.
Fan, X., Scaringi, G., Xu, Q., Zhan, W., Dai, L., Li, Y., Pei, X., Yang, Q., and Huang, R.: Coseismic landslides triggered by the 8th August 2017 Ms 7.0 Jiuzhaigou earthquake (Sichuan, China): factors controlling their spatial distribution and implications for the seismogenic blind fault identification, Landslides, 15, 967–983, https://doi.org/10.1007/s10346-018-0960-x, 2018.
Fell, R., Corominas, J., Bonnard, C., Cascini, L., Leroi, E., and Savage, W. Z.: Guidelines for landslide susceptibility, hazard and risk zoning for land use planning, Eng. Geol., 102, 85–98, https://doi.org/10.1016/j.enggeo.2008.03.022, 2008.
Florsheim, J. L., Ustin, S. L., Tang, Y., Di, B., Huang, C., Qiao, X., Peng, H., Zhang, M., and Cai, Y.: Basin-scale and travertine dam-scale controls on fluvial travertine, Jiuzhaigou, southwestern China, Geomorphology, 180–181, 267–280, https://doi.org/10.1016/j.geomorph.2012.10.016, 2013.
Ghobadi, M. H., Nouri, M., Saedi, B., Jalali, S. H., and Pirouzinajad, N.: The performance evaluation of information value, density area, LNRF, and frequency ratio methods for landslide zonation at Miandarband area, Kermanshah Province, Iran, Arab. J. Geosci., 10, 430, https://doi.org/10.1007/s12517-017-3202-y, 2017.
Guo, C., Montgomery, D. R., Zhang, Y., Wang, K., and Yang, Z.: Quantitative assessment of landslide susceptibility along the Xianshuihe fault zone, Tibetan Plateau, China, Geomorphology, 248, 93–110, https://doi.org/10.1016/j.geomorph.2015.07.012, 2015.
Guzzetti, F., Carrara, A., Cardinali, M., and Reichenbach, P.: Landslide hazard evaluation: a review of current techniques and their application in a multi-scale study, Central Italy, Geomorphology, 31, 181–216, https://doi.org/10.1016/S0169-555x(99)00078-1, 1999.
Guzzetti, F., Reichenbach, P., Cardinali, M., Galli, M., and Ardizzone, F.: Probabilistic landslide hazard assessment at the basin scale, Geomorphology, 72, 272–299, https://doi.org/10.1016/j.geomorph.2005.06.002, 2005.
Guzzetti, F., Mondini, A. C., Cardinali, M., Fiorucci, F., Santangelo, M., and Chang, K. T.: Landslide inventory maps: New tools for an old problem, Earth-Sci. Rev., 112, 42–66, https://doi.org/10.1016/j.earscirev.2012.02.001, 2012.
Kadavi, P., Lee, C.-W., and Lee, S.: Application of Ensemble-Based Machine Learning Models to Landslide Susceptibility Mapping, Remote Sensing, 10, 1252, https://doi.org/10.3390/rs10081252, 2018.
Kanungo, D. P., Arora, M. K., Sarkar, S., and Gupta, R. P.: A comparative study of conventional, ANN black box, fuzzy and combined neural and fuzzy weighting procedures for landslide susceptibility zonation in Darjeeling Himalayas, Eng. Geol., 85, 347–366, https://doi.org/10.1016/j.enggeo.2006.03.004, 2006.
Kayastha, P., Dhital, M. R., and De Smedt, F.: Application of the analytical hierarchy process (AHP) for landslide susceptibility mapping: A case study from the Tinau watershed, west Nepal, Comput. Geosci., 52, 398–408, https://doi.org/10.1016/j.cageo.2012.11.003, 2013.
Komac, M.: A landslide susceptibility model using the Analytical Hierarchy Process method and multivariate statistics in perialpine Slovenia, Geomorphology, 74, 17–28, https://doi.org/10.1016/j.geomorph.2005.07.005, 2006.
Lee, S.: Application of logistic regression model and its validation for landslide susceptibility mapping using GIS and remote sensing data, Int. J. Remote Sens., 26, 1477–1491, https://doi.org/10.1080/01431160412331331012, 2005.
Lee, S. and Min, K.: Statistical analysis of landslide susceptibility at Yongin, Korea, Environ. Geol., 40, 1095–1113, https://doi.org/10.1007/s002540100310, 2001.
Lee, S. and Pradhan, B.: Landslide hazard mapping at Selangor, Malaysia using frequency ratio and logistic regression models, Landslides, 4, 33–41, https://doi.org/10.1007/s10346-006-0047-y, 2007.
Lee, S. and Talib, J. A.: Probabilistic landslide susceptibility and factor effect analysis, Environ. Geol., 47, 982–990, https://doi.org/10.1007/s00254-005-1228-z, 2005.
Lei, H., Wang, X., Hou, H., Su, L., Yu, D., and Wang, H.: The earthquake in Jiuzhaigou County of Northern Sichuan, China on August 8, 2017, Nat. Hazards, 90, 1021–1030, https://doi.org/10.1007/s11069-017-3064-3, 2018.
Li, L., Lan, H., Guo, C., Zhang, Y., Li, Q., and Wu, Y.: A modified frequency ratio method for landslide susceptibility assessment, Landslides, 14, 727–741, https://doi.org/10.1007/s10346-016-0771-x, 2017.
Li, S., Hu, X., Tang, Y., Huang, C., and Xiao, W.: Changes in lacustrine environment due to anthropogenic activities over 240 years in Jiuzhaigou National Nature Reserve, southwest China, Quatern. Int., 349, 367–375, https://doi.org/10.1016/j.quaint.2014.07.069, 2014.
Malamud, B. D., Turcotte, D. L., Guzzetti, F., and Reichenbach, P.: Landslide inventories and their statistical properties, Earth Surf. Proc. Land., 29, 687–711, https://doi.org/10.1002/esp.1064, 2004.
Mansouri Daneshvar, M. R.: Landslide susceptibility zonation using analytical hierarchy process and GIS for the Bojnurd region, northeast of Iran, Landslides, 11, 1079–1091, https://doi.org/10.1007/s10346-013-0458-5, 2014.
Mantovani, F., Soeters, R., and VanWesten, C. J.: Remote sensing techniques for landslide studies and hazard zonation in Europe, Geomorphology, 15, 213–225, https://doi.org/10.1016/0169-555x(95)00071-C, 1996.
Manzo, G., Tofani, V., Segoni, S., Battistini, A., and Catani, F.: GIS techniques for regional-scale landslide susceptibility assessment: the Sicily (Italy) case study, Int. J. Geogr. Inform. Sci., 27, 1433–1452, https://doi.org/10.1080/13658816.2012.693614, 2013.
Marjanović, M., Kovačević, M., Bajat, B., and Voženílek, V.: Landslide susceptibility assessment using SVM machine learning algorithm, Eng. Geol., 123, 225–234, https://doi.org/10.1016/j.enggeo.2011.09.006, 2011.
Mohammady, M., Pourghasemi, H. R., and Pradhan, B.: Landslide susceptibility mapping at Golestan Province, Iran: A comparison between frequency ratio, Dempster–Shafer, and weights-of-evidence models, J. Asian Earth Sci., 61, 221–236, https://doi.org/10.1016/j.jseaes.2012.10.005, 2012.
Nefeslioglu, H. A., Sezer, E., Gokceoglu, C., Bozkir, A. S., and Duman, T. Y.: Assessment of Landslide Susceptibility by Decision Trees in the Metropolitan Area of Istanbul, Turkey, Math. Probl. Eng., 2010, 901095, 1–15, https://doi.org/10.1155/2010/901095, 2010.
Ozdemir, A. and Altural, T.: A comparative study of frequency ratio, weights of evidence and logistic regression methods for landslide susceptibility mapping: Sultan Mountains, SW Turkey, J. Asian Earth Sci., 64, 180–197, https://doi.org/10.1016/j.jseaes.2012.12.014, 2013.
Pellicani, R. and Spilotro, G.: Evaluating the quality of landslide inventory maps: comparison between archive and surveyed inventories for the Daunia region (Apulia, Southern Italy), B. Eng. Geol. Environ., 74, 357–367, https://doi.org/10.1007/s10064-014-0639-z, 2015.
Peng, L., Niu, R., Huang, B., Wu, X., Zhao, Y., and Ye, R.: Landslide susceptibility mapping based on rough set theory and support vector machines: A case of the Three Gorges area, China, Geomorphology, 204, 287–301, https://doi.org/10.1016/j.geomorph.2013.08.013, 2014.
Pham, B. T., Prakash, I., and Bui, D. T.: Spatial prediction of landslides using a hybrid machine learning approach based on Random Subspace and Classification and Regression Trees, Geomorphology, 303, 256–270, https://doi.org/10.1016/j.geomorph.2017.12.008, 2018.
Poudyal, C. P., Chang, C., Oh, H.-J., and Lee, S.: Landslide susceptibility maps comparing frequency ratio and artificial neural networks: a case study from the Nepal Himalaya, Environ. Earth Sci., 61, 1049–1064, https://doi.org/10.1007/s12665-009-0426-5, 2010.
Pourghasemi, H. R. and Rahmati, O.: Prediction of the landslide susceptibility: Which algorithm, which precision?, Catena, 162, 177–192, https://doi.org/10.1016/j.catena.2017.11.022, 2018.
Pourghasemi, H. R., Pradhan, B., and Gokceoglu, C.: Application of fuzzy logic and analytical hierarchy process (AHP) to landslide susceptibility mapping at Haraz watershed, Iran, Nat. Hazards, 63, 965–996, https://doi.org/10.1007/s11069-012-0217-2, 2012.
Pradhan, B. and Lee, S.: Regional landslide susceptibility analysis using back-propagation neural network model at Cameron Highland, Malaysia, Landslides, 7, 13–30, https://doi.org/10.1007/s10346-009-0183-2, 2009.
Regmi, N. R., Giardino, J. R., and Vitek, J. D.: Modeling susceptibility to landslides using the weight of evidence approach: Western Colorado, USA, Geomorphology, 115, 172–187, https://doi.org/10.1016/j.geomorph.2009.10.002, 2010.
Reichenbach, P., Rossi, M., Malamud, B. D., Mihir, M., and Guzzetti, F.: A review of statistically-based landslide susceptibility models, Earth-Sci. Rev., 180, 60–91, https://doi.org/10.1016/j.earscirev.2018.03.001, 2018.
Romer, C. and Ferentinou, M.: Shallow landslide susceptibility assessment in a semiarid environment – A Quaternary catchment of KwaZulu-Natal, South Africa, Eng. Geol., 201, 29–44, https://doi.org/10.1016/j.enggeo.2015.12.013, 2016.
Saaty, T. L.: A scaling method for priorities in hierarchical structures, J. Math. Psychol., 15, 234–281, https://doi.org/10.1016/0022-2496(77)90033-5, 1977.
Saha, A. K., Gupta, R. P., and Arora, M. K.: GIS-based Landslide Hazard Zonation in the Bhagirathi (Ganga) Valley, Himalayas, Int. J. Remote Sens., 23, 357–369, https://doi.org/10.1080/01431160010014260, 2002.
Saito, H., Nakayama, D., and Matsuyama, H.: Comparison of landslide susceptibility based on a decision-tree model and actual landslide occurrence: The Akaishi Mountains, Japan, Geomorphology, 109, 108–121, https://doi.org/10.1016/j.geomorph.2009.02.026, 2009.
Sato, H. P., Hasegawa, H., Fujiwara, S., Tobita, M., Koarai, M., Une, H., and Iwahashi, J.: Interpretation of landslide distribution triggered by the 2005 Northern Pakistan earthquake using SPOT 5 imagery, Landslides, 4, 113–122, https://doi.org/10.1007/s10346-006-0069-5, 2007.
Shahabi, H. and Hashim, M.: Landslide susceptibility mapping using GIS-based statistical models and Remote sensing data in tropical environment, Scient. Rep., 5, 9899, https://doi.org/10.1038/srep09899, 2015.
Shrestha, S., Kang, T.-S., and Suwal, M.: An Ensemble Model for Co-Seismic Landslide Susceptibility Using GIS and Random Forest Method, ISPRS Int. J. Geo-Inform., 6, 365, https://doi.org/10.3390/Ijgi6110365, 2017.
Siqueira, D. S., Marques, J., Pereira, G. T., Teixeira, D. B., Vasconcelos, V., Carvalho Júnior, O. A., and Martins, E. S.: Detailed mapping unit design based on soil–landscape relation and spatial variability of magnetic susceptibility and soil color, Catena, 135, 149–162, https://doi.org/10.1016/j.catena.2015.07.010, 2015.
Song, Y., Gong, J., Gao, S., Wang, D., Cui, T., Li, Y., Wei, B.: Susceptibility assessment of earthquake-induced landslides using Bayesian network: A case study in Beichuan, China, Comput. Geosci., 42, 189–199, https://doi.org/10.1016/j.cageo.2011.09.011, 2012.
Su, C., Wang, L., Wang, X., Huang, Z., and Zhang, X.: Mapping of rainfall-induced landslide susceptibility in Wencheng, China, using support vector machine, Nat. Hazards, 76, 1759–1779, https://doi.org/10.1007/s11069-014-1562-0, 2015.
Tien Bui, D., Pradhan, B., Lofman, O., Revhaug, I., and Dick, O. B.: Landslide susceptibility assessment in the Hoa Binh province of Vietnam: A comparison of the Levenberg–Marquardt and Bayesian regularized neural networks, Geomorphology, 171–172, 12–29, https://doi.org/10.1016/j.geomorph.2012.04.023, 2012.
Tilmant, A., Vanclooster, M., Duckstein, L., and Persoons, E.: Comparison of fuzzy and nonfuzzy optimal reservoir operating policies, J. Water Res. Pl.-ASCE, 128, 390–398, https://doi.org/10.1061/(Asce)0733-9496(2002)128:6(390), 2002.
Umar, Z., Pradhan, B., Ahmad, A., Jebur, M. N., and Tehrany, M. S.: Earthquake induced landslide susceptibility mapping using an integrated ensemble frequency ratio and logistic regression models in West Sumatera Province, Indonesia, Catena, 118, 124–135, https://doi.org/10.1016/j.catena.2014.02.005, 2014.
Vaidya, O. S. and Kumar, S.: Analytic hierarchy process: An overview of applications, Eur. J. Operat. Res., 169, 1–29, https://doi.org/10.1016/j.ejor.2004.04.028, 2006.
Vargas, L. G.: An overview of the analytic hierarchy process and its applications, Eur. J. Operat. Res., 48, 2–8, https://doi.org/10.1016/0377-2217(90)90056-H, 1990.
Wang, J., Jin, W., Cui, Y.-F., Zhang, W.-F., Wu, C.-H., and Alessandro, P.: Earthquake-triggered landslides affecting a UNESCO Natural Site: the 2017 Jiuzhaigou Earthquake in the World National Park, China, J. Mount. Sci., 15, 1412–1428, https://doi.org/10.1007/s11629-018-4823-7, 2018a.
Wang, W., Chen, H., Xu, A. H., and Qu, M. H.: Analysis of the disaster characteristics and emergency response of the Jiuzhaigou earthquake, Nat. Hazards Earth Syst. Sci., 18, 1771–1783, https://doi.org/10.5194/nhess-18-1771-2018, 2018b.
Xu, C., Dai, F. C., Xu, X. W., and Lee, Y. H.: GIS-based support vector machine modeling of earthquake-triggered landslide susceptibility in the Jianjiang River watershed, China, Geomorphology, 145, 70–80, https://doi.org/10.1016/j.geomorph.2011.12.040, 2012a.
Xu, C., Xu, X. W., Dai, F. C., and Saraf, A. K.: Comparison of different models for susceptibility mapping of earthquake triggered landslides related with the 2008 Wenchuan earthquake in China, Comput. Geosci., 46, 317–329, https://doi.org/10.1016/j.cageo.2012.01.002, 2012b.
Yalcin, A.: GIS-based landslide susceptibility mapping using analytical hierarchy process and bivariate statistics in Ardesen (Turkey): Comparisons of results and confirmations, Catena, 72, 1–12, https://doi.org/10.1016/j.catena.2007.01.003, 2008.
Youssef, A. M., Pradhan, B., Jebur, M. N., and El-Harbi, H. M.: Landslide susceptibility mapping using ensemble bivariate and multivariate statistical models in Fayfa area, Saudi Arabia, Environ. Earth Sci., 73, 3745–3761, https://doi.org/10.1007/s12665-014-3661-3, 2015.
Zhang, G., Cai, Y., Zheng, Z., Zhen, J., Liu, Y., and Huang, K.: Integration of the Statistical Index Method and the Analytic Hierarchy Process technique for the assessment of landslide susceptibility in Huizhou, China, Catena, 142, 233–244, https://doi.org/10.1016/j.catena.2016.03.028, 2016.
Zhao, B., Wang, Y.-s., Luo, Y.-h., Li, J., Zhang, X., and Shen, T.: Landslides and dam damage resulting from the Jiuzhaigou earthquake (8 August 2017), Sichuan, China, Roy. Soc. Open Sci., 5, 171418, https://doi.org/10.1098/rsos.171418, 2018.
Zhou, S. H., Chen, G. Q., Fang, L. G., and Nie, Y. W.: GIS-Based Integration of Subjective and Objective Weighting Methods for Regional Landslides Susceptibility Mapping, Sustainability, 8, 334, https://doi.org/10.3390/Su8040334, 2016.
Zhu, A. X., Wang, R. X., Qiao, J. P., Qin, C. Z., Chen, Y. B., Liu, J., Du, F., Lin, Y., and Zhu, T. X.: An expert knowledge-based approach to landslide susceptibility mapping using GIS and fuzzy logic, Geomorphology, 214, 128–138, https://doi.org/10.1016/j.geomorph.2014.02.003, 2014.