the Creative Commons Attribution 4.0 License.
the Creative Commons Attribution 4.0 License.
 | 14 Aug 2019
Fine-scale assessment of cross-boundary wildfire events in the western United States
Palaiologos Palaiologou
Alan A. Ager
Cody R. Evers
Max Nielsen-Pincus
Michelle A. Day
Haiganoush K. Preisler
We report a fine-scale assessment of cross-boundary wildfire events for the western US. We used simulation modeling to quantify the extent of fire exchange among major federal, state, and private land tenures and mapped locations where fire ignitions can potentially affect populated places. We examined how parcel size affects wildfire transmission and partitioned the relative amounts of transmitted fire between human and natural ignitions. We estimated that 85 % of the total predicted wildfire activity, as measured by area burned, originates from four land tenures (Forest Service, Bureau of Land Management, private, and state lands) and 63 % of the total amount results from natural versus human ignitions. On average, one-third of the area burned by predicted wildfires was nonlocal, meaning that the source ignition was on a different land tenure. Land tenures with smaller parcels tended to receive more incoming fire on a proportional basis, while the largest fires were generated from ignitions in national parks, national forests, and public and tribal lands. Among the 11 western states, the amount and pattern of cross-boundary fire varied substantially in terms of which land tenures were mostly exposed, by whom, and to what extent. We also found spatial variability in terms of community exposure among states, and more than half of the predicted structure exposure was caused by ignitions on private lands or within the wildland–urban interface areas. This study addressed gaps in existing wildfire risk assessments that do not explicitly consider cross-boundary fire transmission and do not identify the source of fire. The results can be used by state, federal, and local fire planning organizations to help improve risk mitigation programs.
- Article
(9577 KB) - Full-text XML
- BibTeX
- EndNote


Most environmental hazard issues span multiple social, ecological, and political boundaries, especially atmospheric and water pollution (Mitchell, 1994; Hills et al., 1998; Uitto and Duda, 2002; Zeitoun and Warner, 2006; Van Eerd et al., 2015; Lyons, 2016; Brack, 2017), habitat conservation (Liu et al., 2017), watershed restoration (Sayles and Baggio, 2017), water supply (Bark et al., 2014; Lara, 2015), and numerous natural disturbances. Thus the effectiveness of mitigation programs for these hazards depends on effective engagement of multiple governments, regulatory and land management agencies, and administrators within them to negotiate solutions to render cross-boundary issues governable (Linnerooth-Bayer et al., 2001; Lidskog et al., 2010, 2011). Perhaps one of the most transparent examples is the case of large destructive wildfires in the western US, where fires burn through multiple land tenures across a mosaic of land ownerships and jurisdictional boundaries, destroying communities on private lands and highly valued natural resources on public tracts. The cross-boundary nature of the problem has stimulated multiple new authorities, regulations, and executive orders that specifically address coordinated management across social and political boundaries (US Congress, 2014; USDA Forest Service, 2015a, b, 2018). Implementation of these authorities to perform risk reduction on mixed ownership planning areas has helped demonstrate how cross-boundary collaboration can amplify the capacity of risk reduction activities by leveraging the economies of scale, i.e., expand the scale of fuel management (Graham et al., 2010; Ager et al., 2011) and community protection programs (Sexton, 2006; Abrams et al., 2016) commensurate with the scale of wildfire events (Charnley et al., 2016; Fischer et al., 2018; Markus et al., 2018).
Despite new legislation and a growing number of fuel management and restoration cross-boundary projects, there has not been a systematic large-scale assessment of the extent to which fire is exchanged among the major landowners in the western US or elsewhere. Yet, several recent studies have stressed the need to map potential cross-boundary wildfire as a means to better target areas where cross-boundary planning is needed to solve wildfire issues (Ager et al., 2014b, 2018; Fischer et al., 2018; Evers et al., 2019; Hamilton et al., 2019). For instance, where are zones of high fire transmission between large tracts of US federal and private lands, and are the former areas priorities for investment in hazardous fuel treatments?
In this study we address this gap by using fire simulation modeling to analyze cross-boundary fire exchange among major land tenures on 307 million ha of public and private lands in the 11 western US states, owned or managed by 14 major entities. We ask the following questions. (1) Where is the cross-boundary fire problem greatest and how does it vary among different land tenures and among the western US states? (2) What are the community fire exposure patterns and the extent of the fireshed, i.e., the area that encloses ignition locations that transmit fire to communities (Ager et al., 2015)? (3) How does ignition cause (human versus natural) affect fire transmission across boundaries? (4) How do anthropogenic actions influence the different scales and complexity of fire transmission, notably parcel geometry, ownership composition, and landscape fragmentation (e.g., checkerboard vs. large boundary lines between two land tenures)?
2.1 Study area and land tenures
Our study area (307 million ha) covers the 11 western US states (Arizona, AZ; California, CA; Colorado, CO; Idaho, ID; Nevada, NV; New Mexico, NM; Montana, MT; Oregon, OR; Utah, UT; Washington, WA; and Wyoming, WY), encompassing 76 national forests. Since the 1970s, the average annual number of large fires has tripled and the average fire size has increased 6-fold (Kenward et al., 2016). A checkerboard of different landownerships exists in the western US (USGS, 2016). For analysis purposes, we grouped the 26 detailed land ownership classes found in the USGS Protected Areas Database (PAD) into 14 major land tenures (USGS, 2016). Community boundaries were based on the SILVIS wildland–urban interface (WUI) layer (Radeloff et al., 2005), excluding polygons that were classified as uninhabited, water, or smaller than 0.1 ha or had structure density less than two structures per square kilometer. We used the PAD layer to estimate land tenure characteristics, including the number of parcels, average parcel area, and perimeter for each land tenure.
Federal agencies manage approximately half of the landscape (145.5 million ha, 48 % of all lands), and primarily include the Bureau of Land Management (BLM, 71 million ha) and the US Forest Service (FS, 57.5 million ha). The “other federal” land tenure class covers 300 000 ha and is mostly comprised by the following agencies: Agricultural Research Service, Natural Resources Conservation Service, and the Army Corps of Engineers. Private lands cover an area of 96 million ha, followed by tribal (20 million ha), state (19 million ha), and public lands (public trust and nongovernment organizations), with city/county (2 million ha) (Table 1). The extent of communities, including the WUI, is 22 million ha (Radeloff et al., 2005; Evers et al., 2019). Shrublands cover 27 % of the study area, followed by herbaceous grasslands (25 %), and open (18 %) and closed (11 %) tree canopy forests (83 % of which are conifers) (LANDFIRE, 2014). Approximately 115 million ha are fire adapted with low- and mixed-severity fires, as defined by fire regimes 1 (≤35-year fire return interval) and 3 (>35–200-year fire return interval), with differences among states and land tenures (see Table B1). More than 65 million ha is high or very high fire risk (Dillon et al., 2015) across all land tenures. On high or very high fire risk National Forest System lands we can potentially treat 7 million ha through traditional timber harvest methods and 14 million ha through prescribed fire and/or another fuel treatment (USDA Forest Service, 2018).
Table 1Average parcel area and perimeter, total number of parcels, and total area for each land tenure across the western US. See text for definition of the “other federal” and “public” categories.

2.2 Wildfire simulations
Wildfire simulations were generated by the FS Missoula Fire Science Laboratory (Short et al., 2016) with the Fire Simulation (FSim) system and included a library with millions of simulated ignitions for each US state (19 million simulated fire perimeters in total, 3 million of which were predicted to burn inside community boundaries). FSim attempts to model the ignition and growth with the minimum travel time algorithm (Finney, 2002) of only those wildfires with a propensity to spread, focusing on relatively large and generally fast-moving fires that contribute the greatest to the probability of a wildland fire burning a given parcel of land. The term “large” is used for fires that escape initial attack, irrespective of their actual size (Finney et al., 2011b). These fires are the largest ∼3 %–5 % for each simulation region (67 “pyromes” in the western US) and account for the majority (∼80 %–97 %) of total area burned. FSim generates a historical relationship between these large fires and a fire danger rating index known as energy release component (ERC), restricting fire growth to days on which ERC reaches or exceeds the 80th percentile condition.
Our analysis relied on the 2016 dataset, which used inputs from the 2012 version of LANDFIRE data describing topography, fuels, and vegetation structure at 30 m resolution (Rollins, 2009), resampled to 270 m to achieve practical simulation times. Simulated fires are not only based on different ignition locations, but also on multiple fire seasons. These fire seasons represent between 10 000 and 100 000 potential annual weather scenarios based on observed fire–weather relationships recorded since 1984 (Hall et al., 2003; Abatzoglou, 2013), generating hypothetical contemporary fire seasons from statistical characterizations of the past, without projecting future weather scenarios. To overcome the possible source of error in the location of ignition points, FSim uses an ignition density grid to allocate ignitions proportionally across the landscape, created from the fire history record of each pyrome (Short, 2015). These fire behavior calculations (Finney, 2006) yield the spread and intensity of surface fire (Rothermel, 1972), crown fire (Van Wagner, 1977; Rothermel, 1991), and spotting distances from torching trees (Albini, 1979) based on a spotting probability value. Model results (270 m resolution) are objectively evaluated for each simulation unit through comparison with historical fire patterns and statistics (mean annual burn probability and fire size distribution) (Finney et al., 2011b). This evaluation is part of the FSim calibration process, whereby simulation inputs are adjusted until the slopes of the historical and modeled fire size distributions are similar, and the modeled average burn probability falls within an acceptable range of the historical reference value (i.e., the 95 % confidence interval for the mean) (Thompson et al., 2016). The system was capable of generating output that corresponded well with the patterns and trends evident from historical fire records (Finney et al., 2011b). We omit additional details on the modeling approach since they are covered extensively elsewhere (Finney et al., 2011a, b; Scott et al., 2012).
Fires were partitioned post hoc into human or natural caused fires using historical wildfire occurrence data of the western US for the 1992–2013 period (Short, 2015). Given the location (longitude–latitude in decimal degrees), Geographic Area Coordination Center (GACC, are nine federally established regions in the continental US with the same fire administration), day of ignition (Julian day), and the size of a fire (acres), the probability (p) of the fire being naturally caused was modeled using a logistic regression model with the logit line, θ, given by Eq. (1):
where μ is the intercept of the regression line, long is longitude, lat is latitude, jday is the day-of-year when the fire occurred, gacc is the GACC, lsize is the logarithm of fire size, s1 is a two-dimensional spline function, and s2 and s3 are a cyclic and a regular cubic spline function respectively. The spline functions were estimated from the data using generalized additive models (GAMs) within the R MGCV package (Wood, 2006; R Core Team, 2016).
The goodness of fit of the model was assessed by first fitting the model to the data with a random sample of 20 % of the records being kept for validation. Next, the probability of a given fire being naturally caused was estimated for each fire in the validation group and compared with the actual observed fire cause by producing a reliability diagram (Fig. A1 in the Appendix). The reliability diagram was produced by binning the estimated probabilities into ∼30 classes and plotting the relative frequency of the observed responses against the predicted mean probabilities in each class. Note that the probability of a fire being human caused is 1−p.
2.3 Fire exchange
FSim perimeters were intersected with the PAD land tenure layer and community boundaries. The resulting perimeter fragments were partitioned into self-burning (i.e., burned areas within the same land tenure as the ignition) and outgoing parts (i.e., burned areas outside of the ignition land tenure). The origin of each simulated wildfire (i.e., source land tenure) was assigned based on the location of ignition. The areas of these fragments were summed into three fire exchange values per land tenure class (see Figs. 2, 3): (1) self-burning fire (TFself), the total area burned from fires that ignited within the same tenure class; (2) incoming fire (TFin), the total area burned from fires that ignited on adjacent tenures; and (3) outgoing fire (TFout), the total area burned from fires that ignited within one land tenure class and burned into another land tenure (Fig. 1). The total area burned for a given land tenure equals the sum of TFin and TFself. We used these same metrics to map (see Figs. 4, 5) the percentage of self-burning fire across the entire landscape (self-burning fire index – SBFI). To do so, we first created a regular lattice of points over the entire domain at a resolution of 500 m. We then tallied the amount of annual burned area for TFin and TFself for all fire perimeter fragments that intersected each point in the lattice. These points were converted to pixels, and pixels with values <50 % were classified as areas of high incoming fire (>50 %).
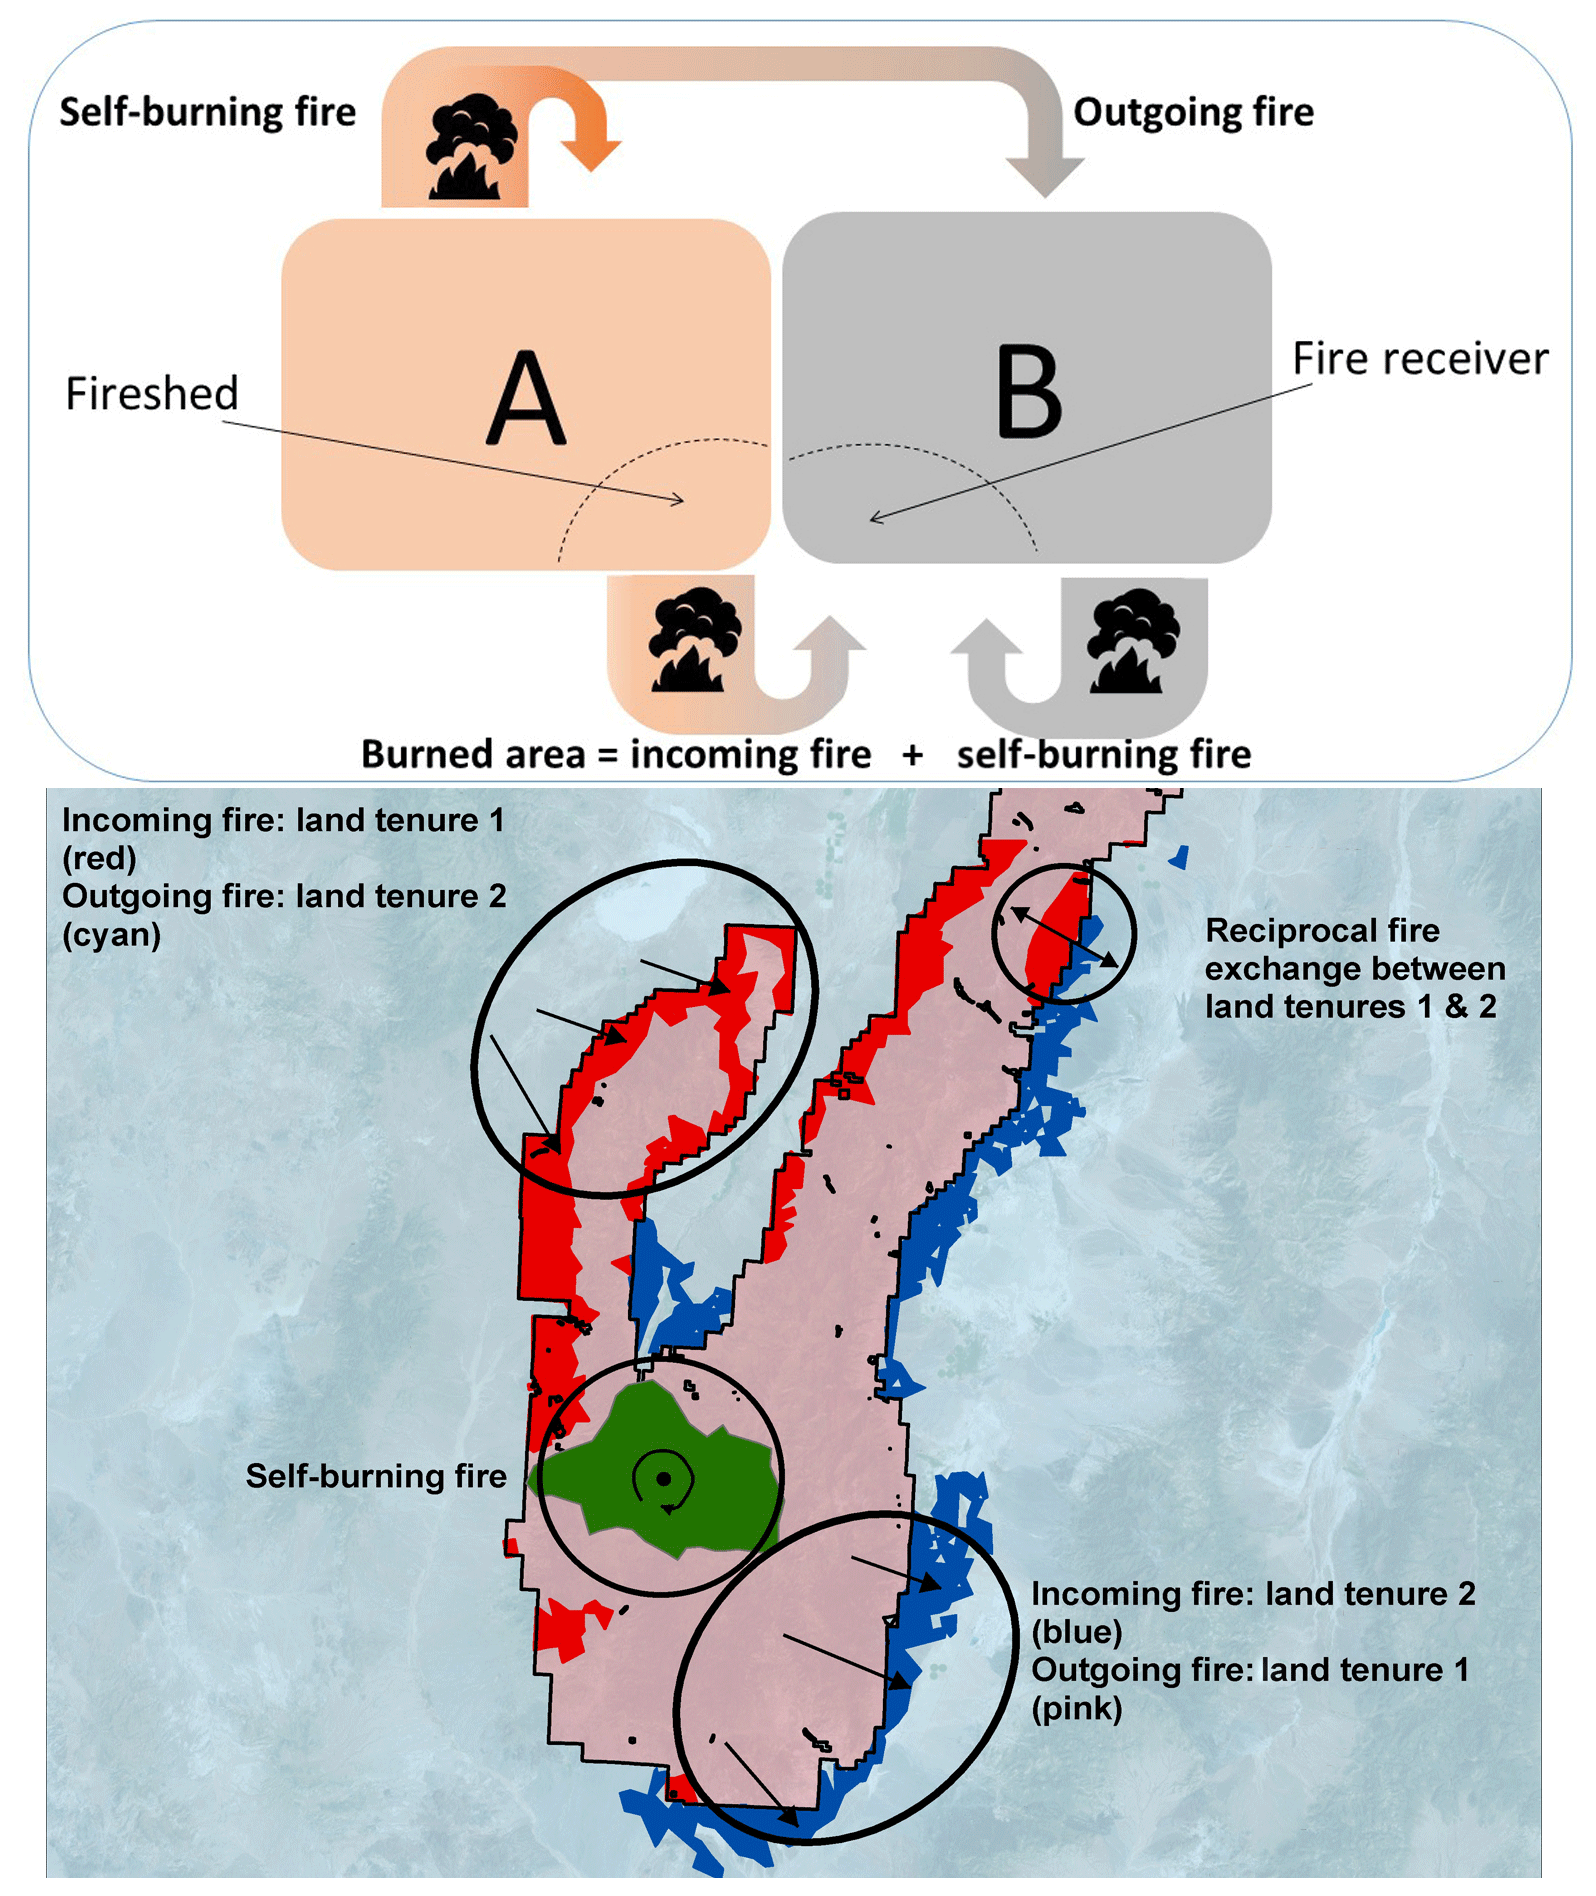
Figure 1Conceptual map showing the cross-boundary fire exchange (incoming, outgoing, self-burning) between two land tenures.
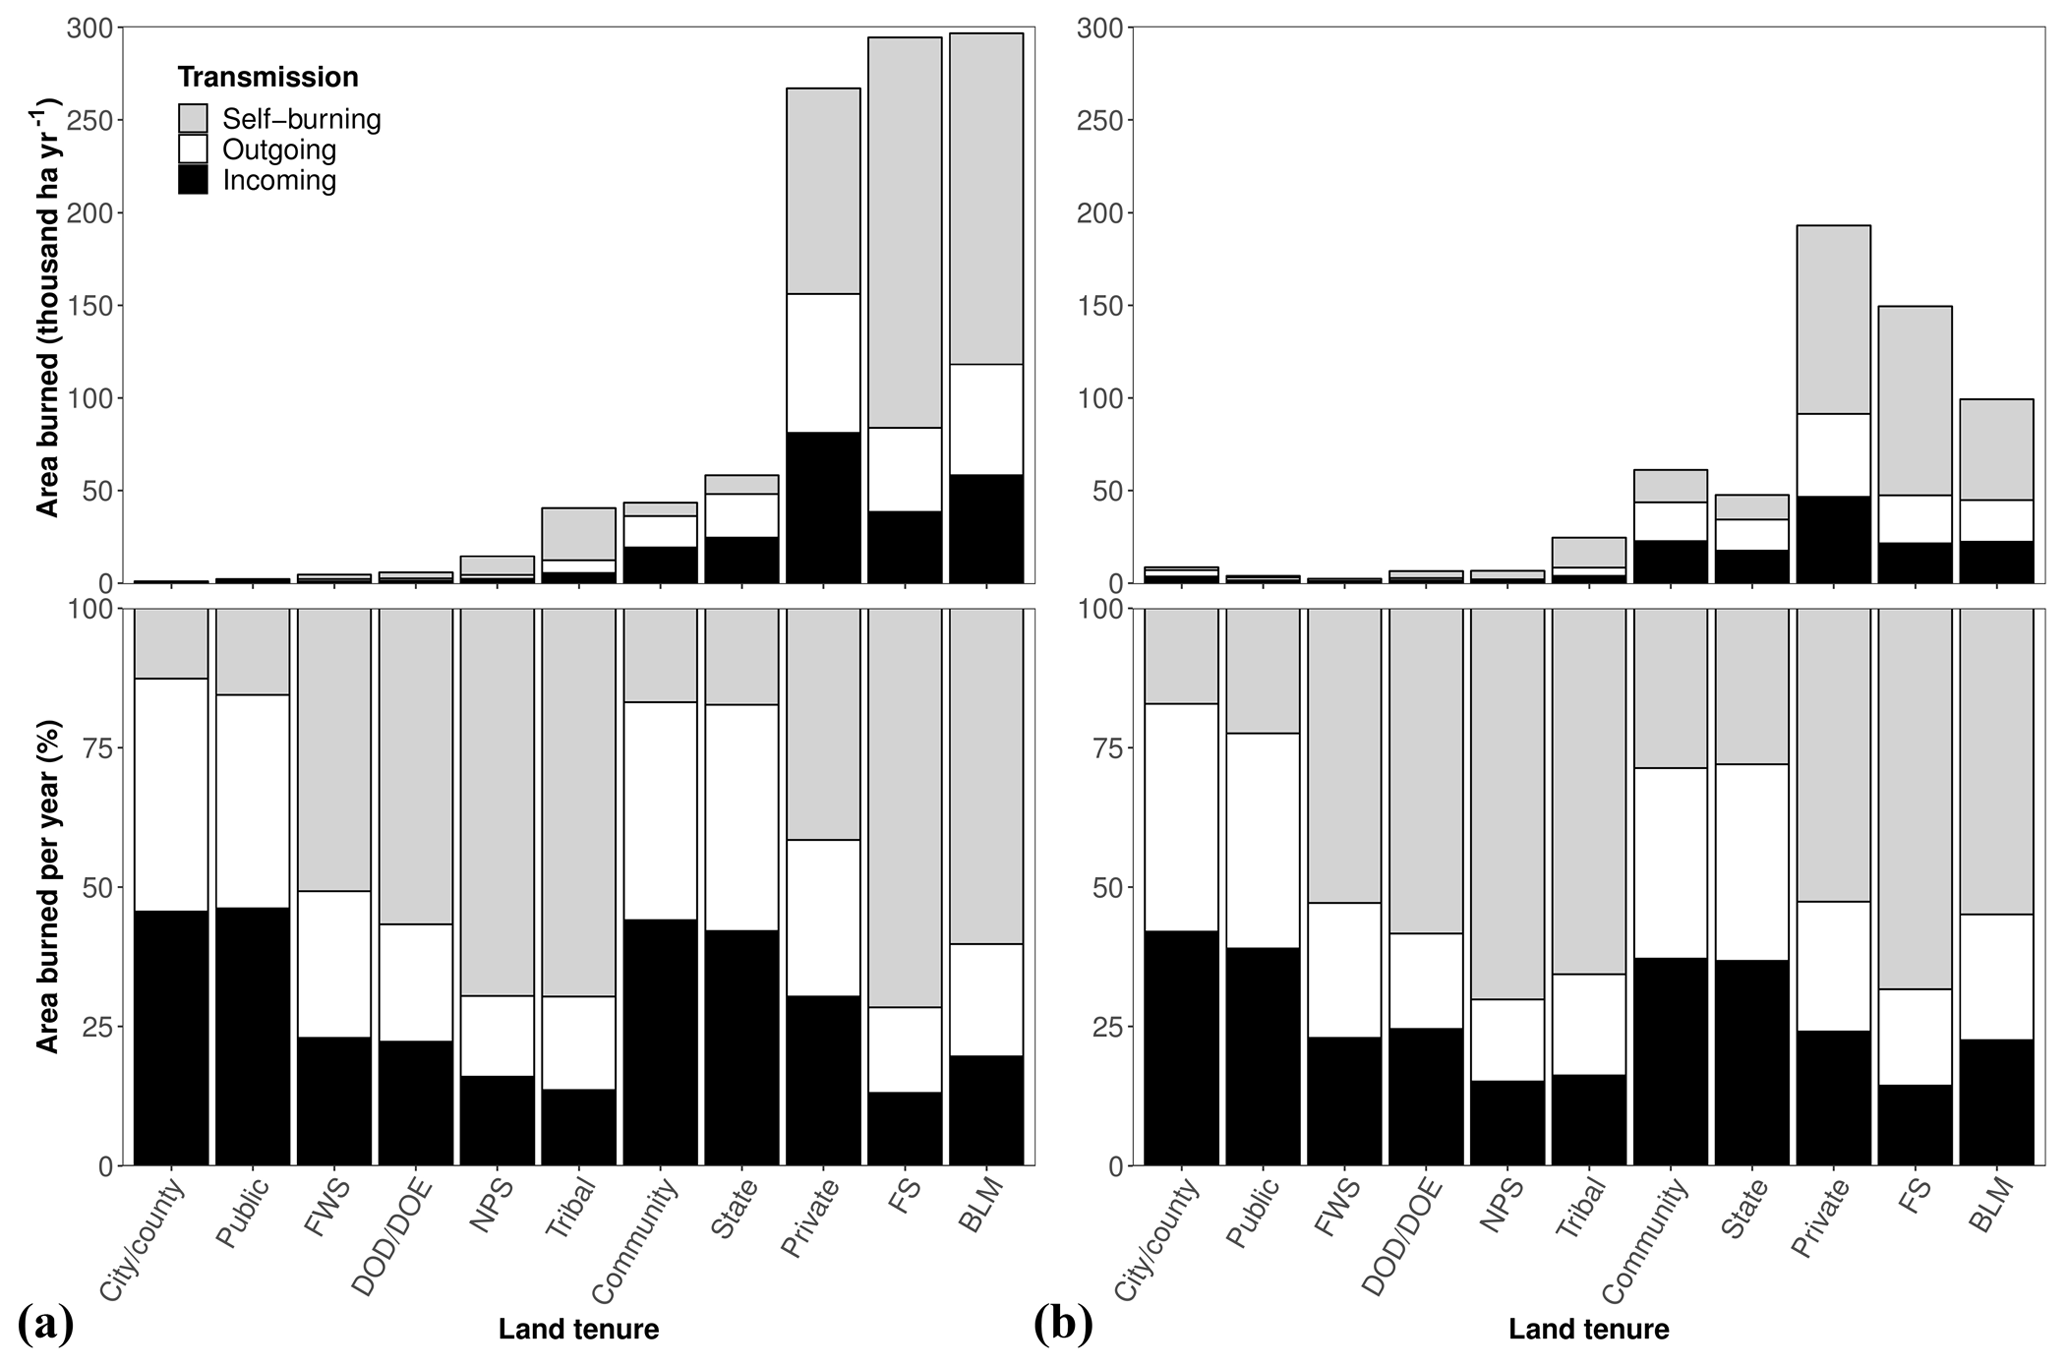
Figure 2Fire exchange for the major land tenures of the 11 western US states estimated for (a) natural ignitions and (b) human ignitions. FS: Forest Service; BLM: Bureau of Land Management; NPS: National Park Service; FWS: Fish & Wildlife Service; DOD: Department of Defense; DOE: Department of Energy; public: other public lands and nongovernment organizations.
2.4 Cross-boundary transmission zones and community exposure
We used wildfire ignitions and associated transmission data to estimate several cross-boundary transmission zones: (1) those zones of cross-boundary transmission between national forests and the three largest land tenures, private, BLM, and state lands, and (2) those zones of wildfire transmitted into communities (i.e., firesheds). We queried ignitions to identify specific cross-boundary transmission events (e.g., all fires that ignited on FS and burned into BLM). For ignitions selected for each cross-boundary transmission pair (e.g., FS ignitions that burned into BLM lands), we estimated the amounts of fire transmitted to the other land tenure (e.g., the outgoing parts of an FS ignition that burned into BLM lands). Using the selected ignitions, we applied a kernel function to fit a smoothly tapered surface representing the magnitude of cross-boundary fire transmission per square kilometer (see Fig. 7).
We used the ignition points of FSim fires where exposure occurred to map the area around communities where fires leading to structure exposure are likely to originate – i.e., the fireshed. Firesheds were generated using the ArcGIS inverse distance weighting tool with the predicted structure exposure from all ignitions. We define the fireshed as those locations surrounding a community where exposure is greater than one structure per year (described in greater detail below). These firesheds were used to classify sources of risk in terms of ownership, wildfire hazard, management capability, and fuel model (see Figs. 8, 9).
We estimated structure exposure based on the intersection of fire perimeters and developed SILVIS WUI polygons. We assumed that structures reported in US Census data for each SILVIS WUI polygon are spatially distributed equally inside the polygon, and therefore the magnitude of structure exposure can be calculated based on the area of the fire–WUI intersection. For each ignition, we summed the predicted structures affected from all intersections, while for each WUI polygon, we summed all predicted structure exposure from all ignitions that intersected it, similar to our previous studies (Ager et al., 2018; Evers et al., 2019). Because FSim simulates potential fire seasons, we report exposure as an annualized value, or the total structure exposure divided by the number of fire seasons simulated.
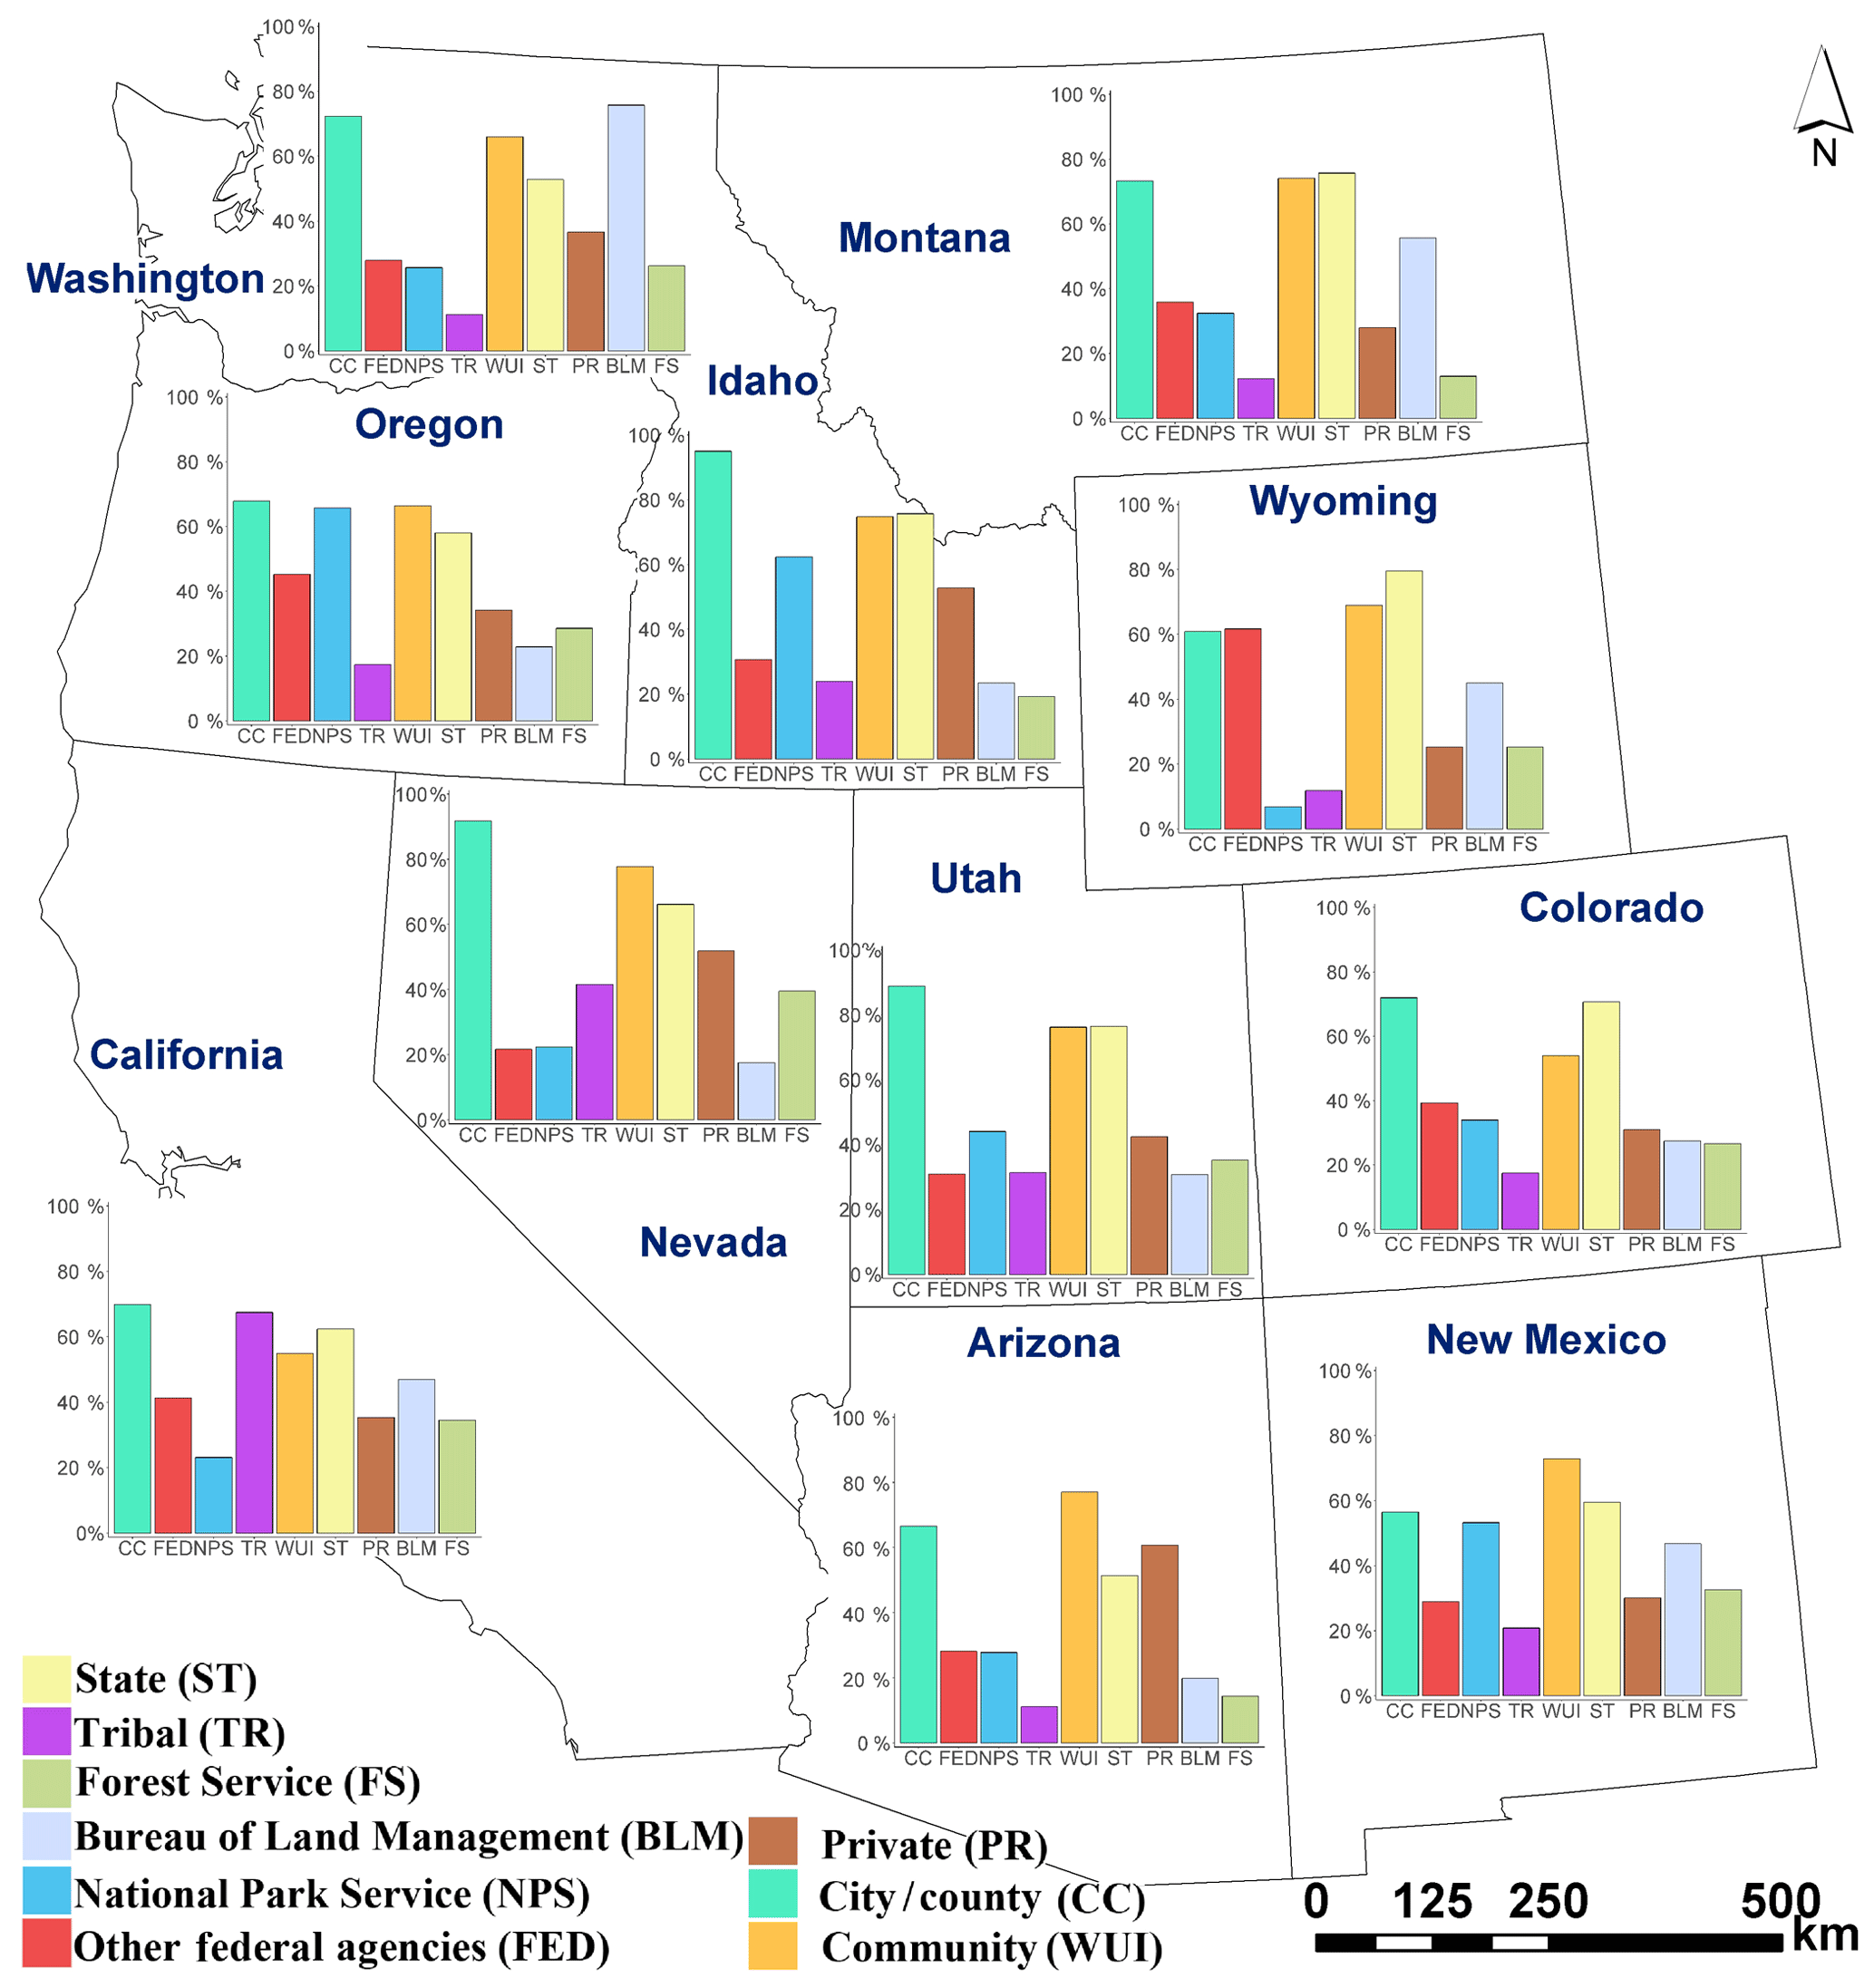
Figure 3Proportion of incoming fire to the total fire (incoming/(incoming + self-burning) ⋅100) for each western US state. The public land tenure was merged with city/county, while all smaller federal land tenures were merged into the other federal agency classes.
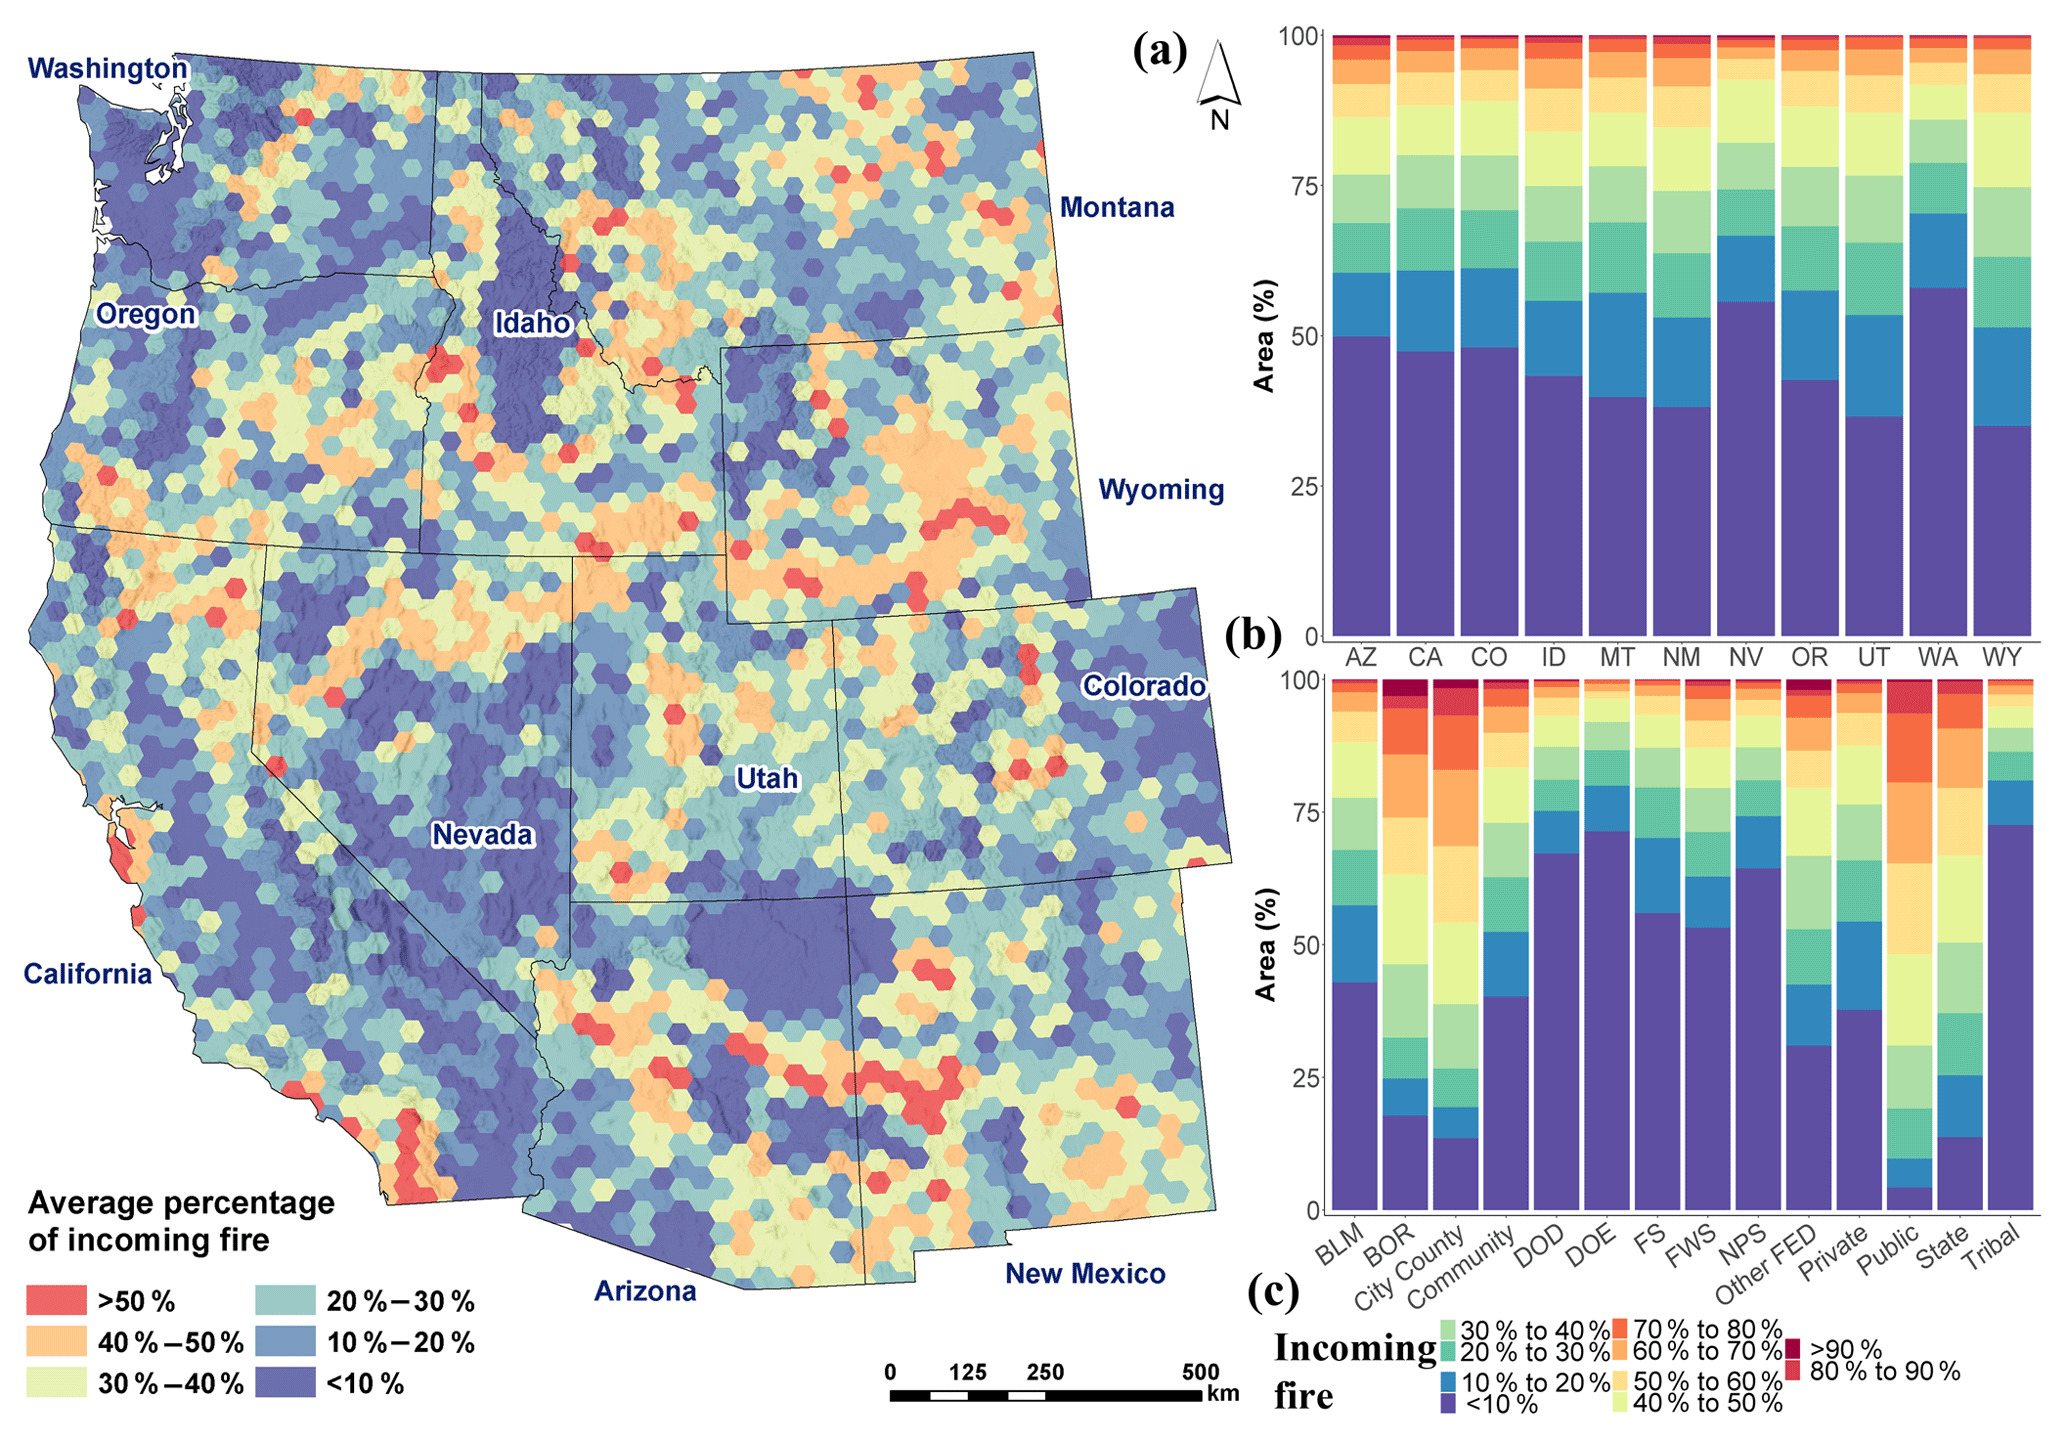
Figure 4(a) Average percentage of incoming fire across the western US; (b) by state, calculated for its entire area and for all land tenures; (c) by land tenure, across all 11 western US states.
3.1 Patterns of fire transmission
Statistical modeling of the ignition cause for simulated fires showed that 63 % of all predicted burned area was generated from natural ignitions (Fig. 2a), mostly originating on FS (31 % of total area burned by natural ignitions on any land tenure), BLM (30 %), private (24 %), and state and tribal lands (4 % each). Human-caused ignitions (37 % of total area burned) were predicted on private (32 %), FS (27 %), BLM (17 %), WUI (9 %), and state lands (7 %) (Fig. 2b). FWS lands were mostly affected by natural ignitions, while city/county lands were mostly affected by human ignitions. For natural ignitions, community, state, and public lands received more incoming compared to self-burning fire, while for human ignitions we observed equal fire exchange. Compared to the 24 years of historical ignitions for 1992–2015 (Short, 2017), most lightning-caused area burned started on FS (38 %), BLM (35 %), private (16 %), and tribal lands (4 %).
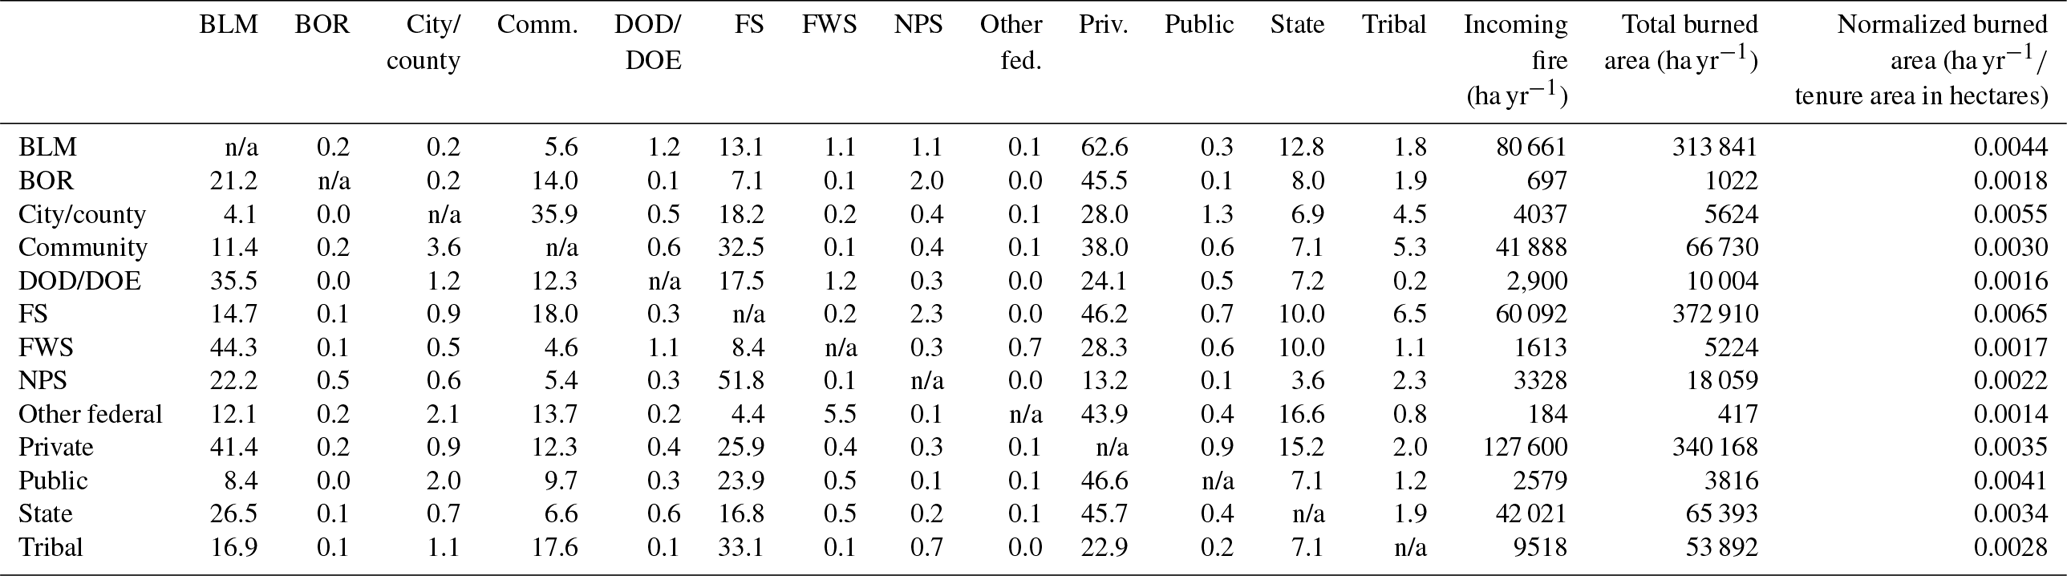
We found that the amount of historical annual burned area across the western US was 1 268 412 ha yr−1, within 1 % of the predicted annual burned area (1 257 182 ha yr−1) from FSim simulations (a per state comparison is provided in Table B2). Across all states, 30 % of predicted burned lands (sum of incoming and self-burning fire) were within national forests, followed by private (27 %), BLM (25 %), and WUI and state lands (5 %). When the predicted burned area was normalized by each land tenure's area (Table 2), FS retains the highest rank followed by city/county, BLM, public, and private lands. The highest predicted ignition rate was recorded for private lands (34 % of all simulated ignitions), followed by BLM (24 %), FS (19 %), and state and WUI (7 % each). When we examined where the major land tenures received most of their incoming fire (Table 2), BLM lands were more exposed to incoming fire ignited on private, FS, and state lands. Exposure to national forests was highest from private (46 % of total FS exposure) and community WUI (18 %), and less from BLM (15 %) and state (10 %) lands. More than half of fire exposure on state lands came from private and WUI lands, a quarter from BLM lands, and 17 % from national forests. A detailed breakdown of the predicted average fire size for each state and land tenure is presented in appendix Table B3. The percentages of incoming fire from the sum of burned areas (incoming + self-burning) inside each land tenure (Fig. 3) revealed how diverse the problem is across the western US, with each state having different amounts and shares of incoming fire for different land tenures. State, city/county lands, and community WUI had more than 50 % of their burned area transmitted from other land tenures. In most cases, the majority of burned area on FS, tribal, and private lands resulted from self-burning fires. More variability across the states was found for National Park Service (NPS), other federal, and BLM lands.
Table 2Percentages of the total incoming fire to each land tenure (rows) from other land tenures (columns). Normalized burned area was estimated by dividing the total burned area in each land tenure (incoming + self-burning) by the total area of a given land tenure. FS: Forest Service; BLM: Bureau of Land Management; BOR: Bureau of Reclamation; NPS: National Park Service; FWS: Fish & Wildlife Service; DOD: Department of Defense; DOE: Department of Energy.
In Fig. 4, we show the location where we expect the largest cross-boundary fire, as well as the amount of incoming fire by each state or land tenure in 10 intervals, from a low of <10 % (colder colors) and a high of >90 % (warmer colors). For mapping clarity, we used a hexnet with a cell size of 162 500 ha with average percentage estimates of incoming fire. The most important areas (warmer colors) were in central AZ and western NM, southern and northern CA, northern NV, southern OR, south-central WY, southern ID, and southwestern MT (Fig. 4a). Lands with large homogenous polygons with one owner, such as northern AZ (tribal lands), central ID (FS), southern NV (BLM), and eastern CO (private), had low amounts (<20 %) of incoming fire. Except for NV and WA, which had more lands with lower incoming fire, all other states had similar trends (Fig. 4b). In addition, city/county, state, public, and Bureau of Reclamation (BOR) land tenures had a larger share of area that received higher amounts of incoming fire compared to DOE, DOD, tribal, FS, and NPS lands (Fig. 4c), indicating a reverse trend of higher incoming fire when the average parcel size and perimeter were reduced.
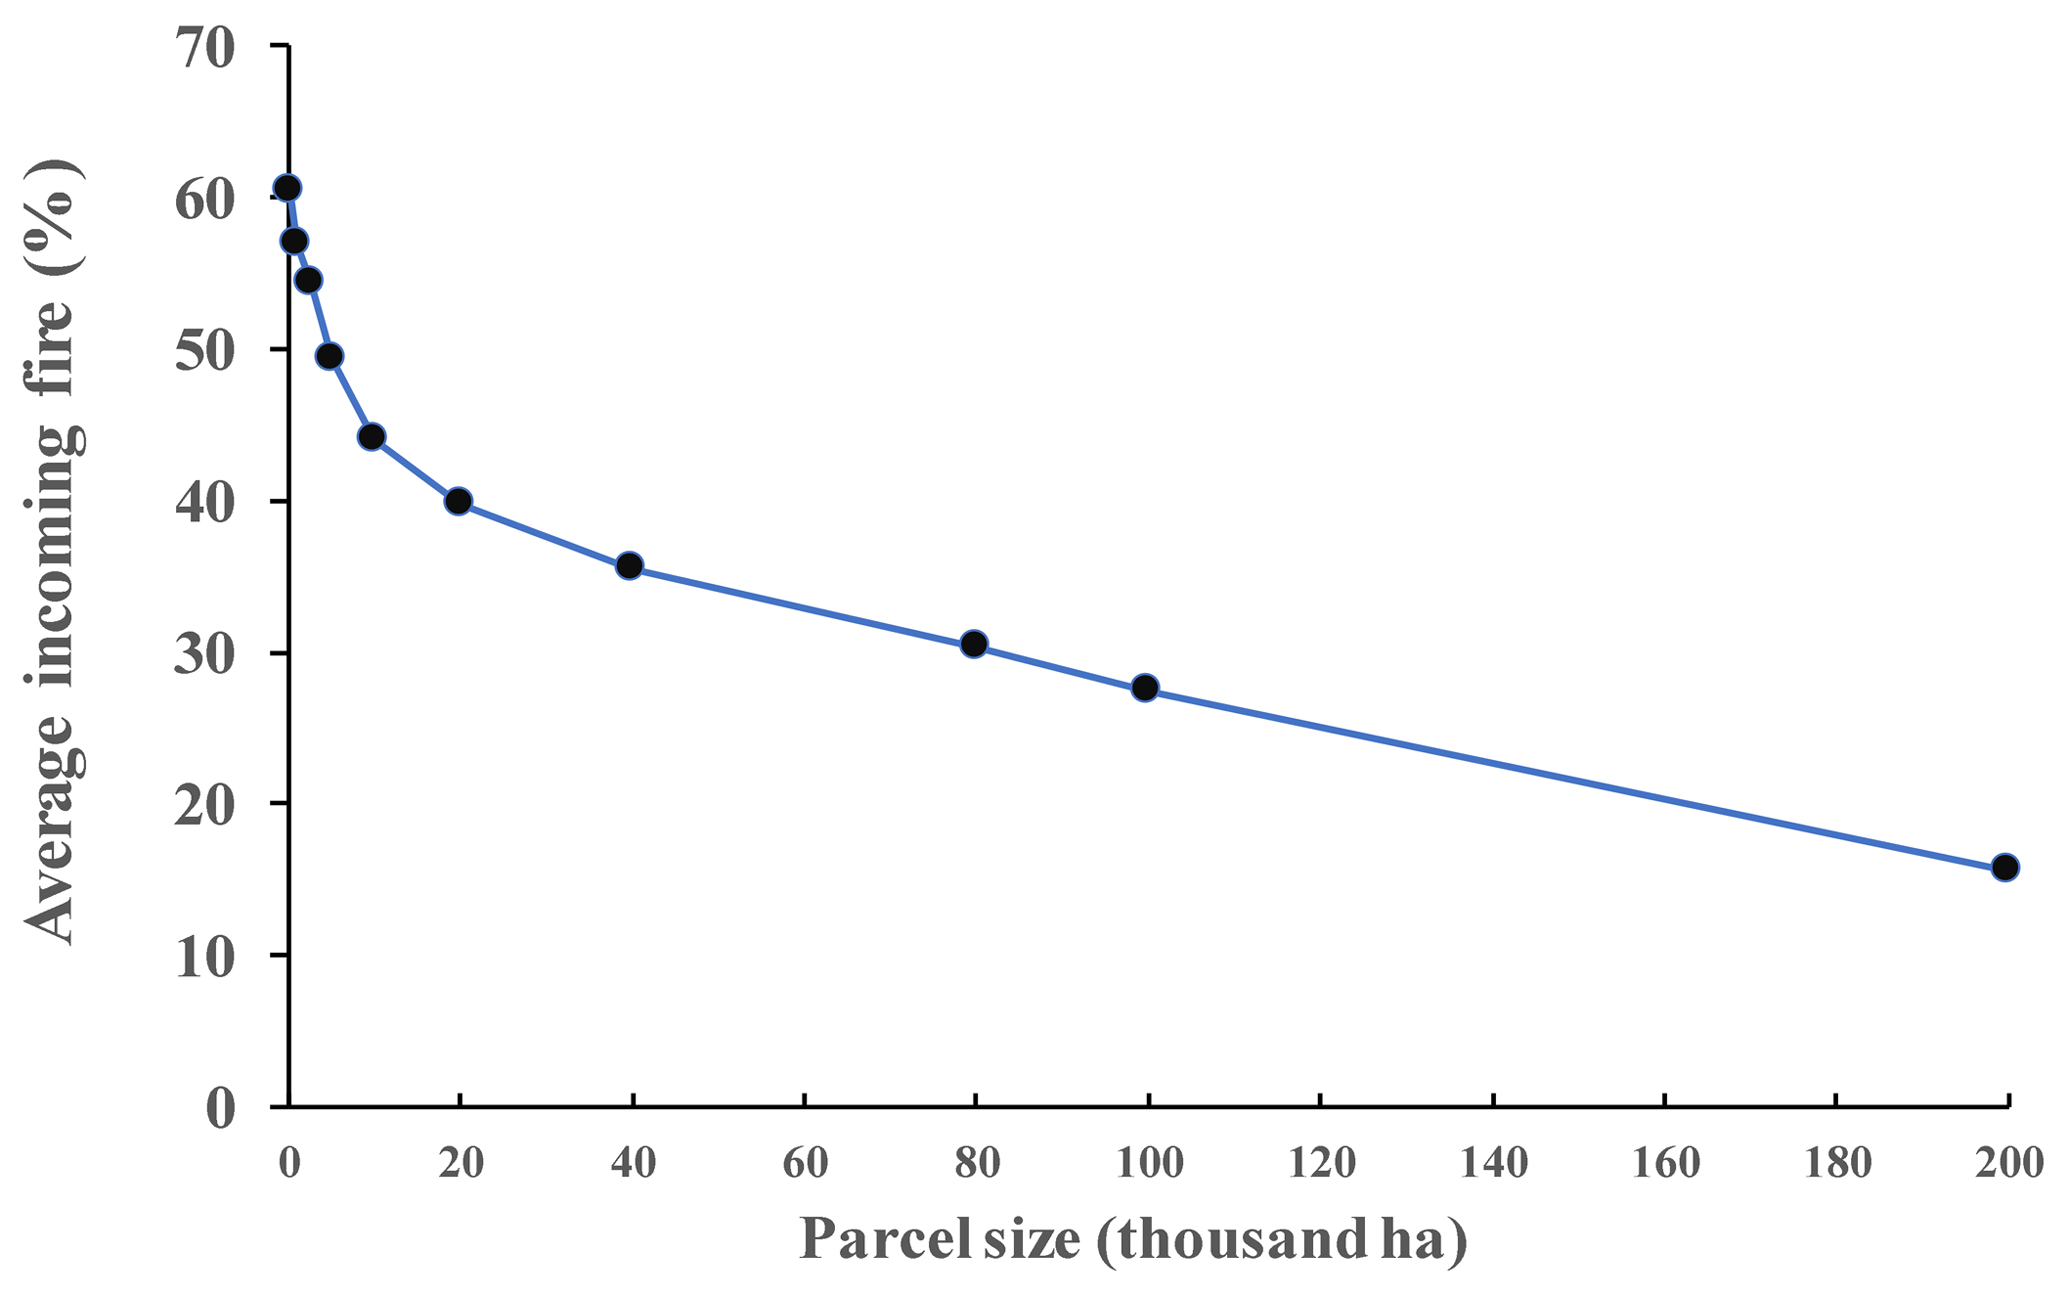
We defined the places where >50 % of area burned is incoming (using SBFI), from ignitions that burned each of the three major land tenures (FS, BLM, and private lands) (Fig. 5). Across most national forests, we noticed that their boundaries received the bulk of the incoming fire (red), with the exception of some enclaves where land tenures were intermixed. Most BLM lands were in proximity to national forests in southern and eastern OR, northern CA, southwestern NM, western CO, NV, and south-central ID. Smaller BLM land parcels away from national forests were exposed in southern AZ, northeastern MT, and UT and WY, from fires ignited in other land tenures. Incoming fire to private lands (orange) was greater across the northern parts of the national forests in central AZ (checkerboard ownerships), on the western parts of the Sierra Nevada in central CA, in northern CA, in south-central OR, in southern ID, and in the northeastern parts of MT. Finally, when we compared the increasing parcel size of all land tenures with the average percentage of incoming fire (Fig. 6), estimated with the SBF index, a decreasing trend is evident (larger parcels – less incoming fire).
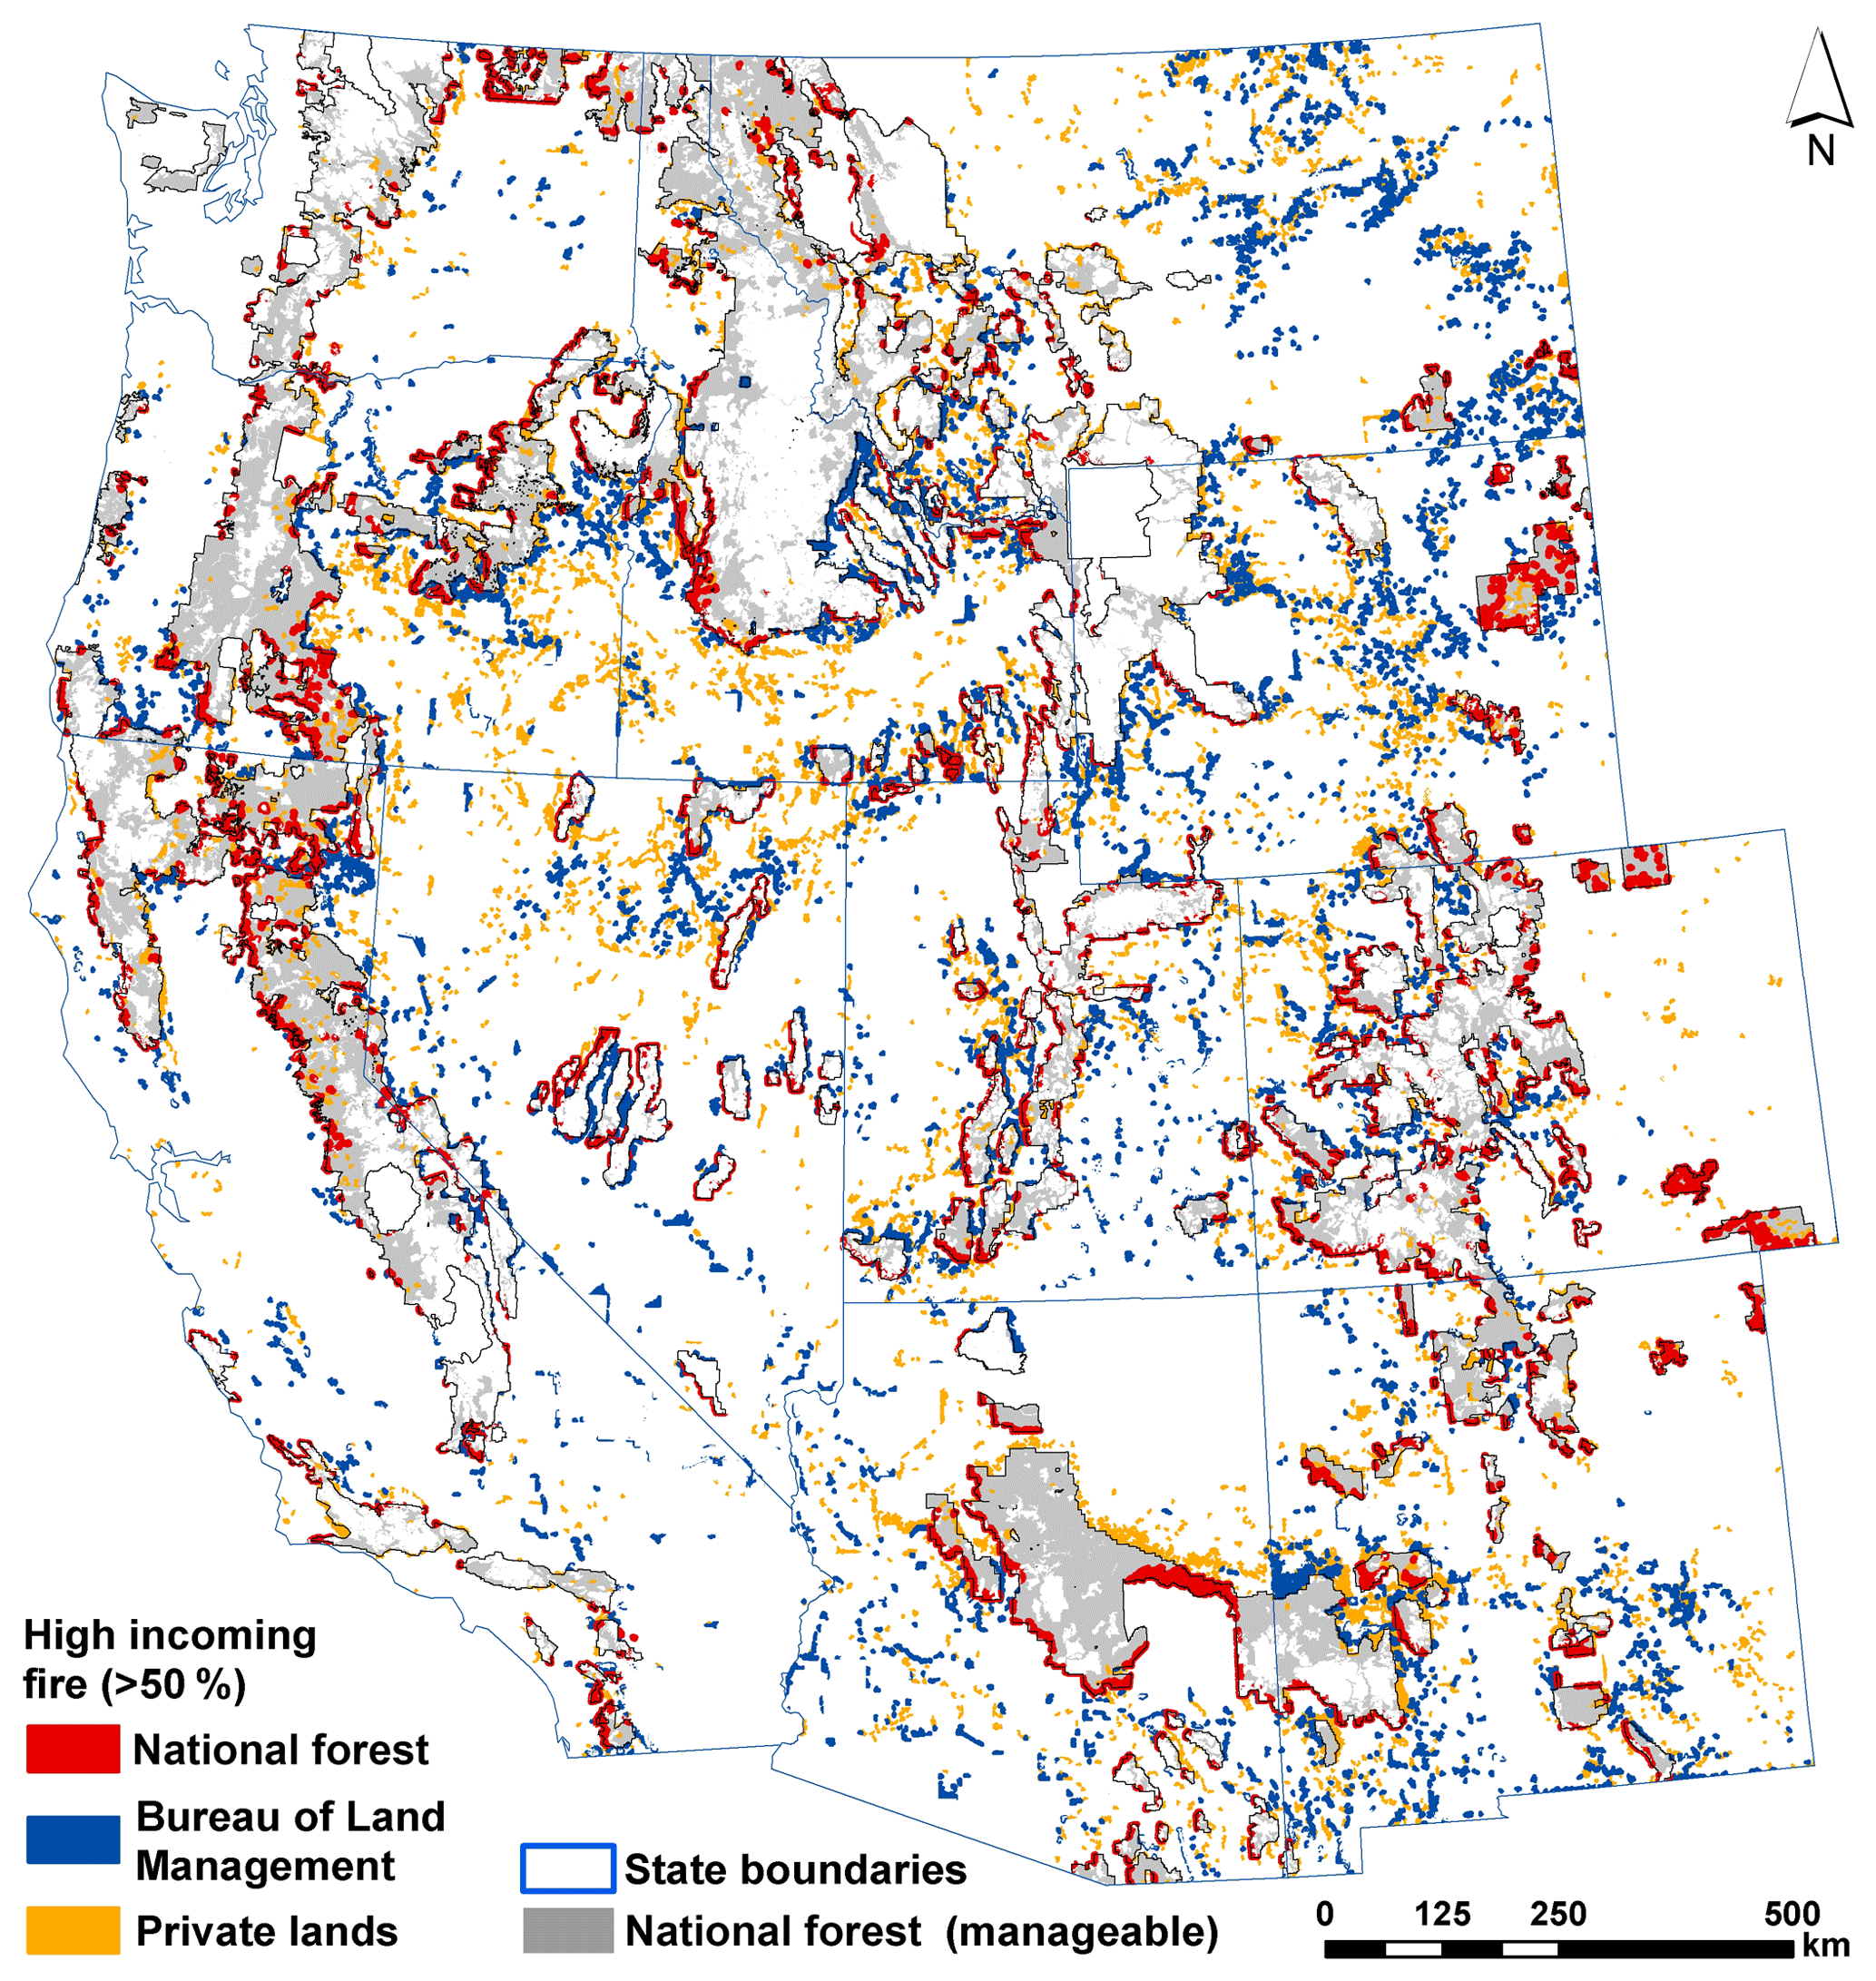
Figure 5Locations where incoming fire exceeds >50 % of the total fire (incoming + self-burning) on the three larger land tenures of the western US.
3.2 Mapping cross-boundary wildfire transmission
We estimated cross-boundary wildfire between national forests and three important stakeholders that already participate in existing, or have the potential to engage in future, shared-stewardship projects: state, private, and BLM. These areas define where predicted fires from national forests burn outside their boundaries, or where fires from ignitions on each of the other three land tenures escape their boundaries and burn onto national forests (Fig. 7). Again, we used the hexnet to estimate the average values of cross-boundary fire for each hexcell and for each pair of land tenures.
Private lands received 46 % (33 000 ha yr−1) of the total outgoing fire from national forests (71 000 ha yr−1), while national forests received 23 % (28 000 ha yr−1) of the total outgoing fire from private lands (120 000 ha yr−1) (Table 3). The estimated fire exchange area between the two land tenures in lands with no management restrictions was 53 million ha, with 23 million ha inside private lands. The national forests with fire transmission to private lands were more expanded compared to BLM and state lands, with large interface areas between them (Fig. 7a). The cross-boundary zones with the highest transmission were in the national forests of the central Sierra Nevada, southern and northwestern CA, eastern OR, north-central WA, and southwestern and southern ID.
Table 3Percentages of the total outgoing fire from each land tenure (rows) to the other land tenures (columns). Normalized outgoing fire was estimated by dividing outgoing fire from each land tenure by the total area of a given land tenure. FS: Forest Service; BLM: Bureau of Land Management; BOR: Bureau of Reclamation; NPS: National Park Service; FWS: Fish & Wildlife Service; DOD: Department of Defense; DOE: Department of Energy.

State lands received 10 % (i.e., 7000 ha yr−1) of the total outgoing fire from national forests, while national forests received 15 % (i.e., 6000 ha yr−1) of the total outgoing fire from state lands (40 000 ha yr−1) (Table 3). The estimated fire exchange area between the two land tenures in lands with no management restrictions (e.g., roadless in national forests or protected in both land tenures) was 19 million ha, with approximately 3 million ha inside state lands. The national forests with the highest fire exchange with state lands (Fig. A2a) were in central AZ and southern NM, in the southwestern parts of CA as well as ID, in western MT and eastern OR, and across the eastern front of north-central WA.
BLM lands received 15 % (10 500 ha yr−1) of the total outgoing fire from national forests, while national forests received 11 % (9000 ha yr−1) of the total outgoing fire from BLM lands (82 000 ha yr−1) (Table 3). The estimated fire exchange area between the two land tenures in lands with no management restrictions was 23 million ha, with 7 million ha inside BLM lands. Although in spatial proximity, BLM lands share small amounts of fire with national forests and state lands, while more than two-thirds of the total BLM area burned were shared with private lands. BLM lands cover 40 % less area than private lands but send 70 % less fire (compared to private lands) to national forests. The highest transmission zones from FS to BLM lands (Fig. A2b) were on the national forests of northern NV, southern and central ID, southwestern NM, southern AZ, central and southwestern UT, and southern and eastern OR.
As an example, Fig. 7b, c, and d focused on the southwestern US (California, Arizona, and New Mexico) where the differences between the three zones were large. Areas with no or low cross-boundary transmission are shown with light grey for national forests and white hillshade for the other land tenures. There were parts of the landscape with high values of fire transmission for all three land tenure pairs, e.g., in southwestern NM, whereas in other parts of the landscape only one out of three pairs had large values. When we merged the overlapping areas across the three land tenure pairs for the western US, about 60 million ha of manageable land could be allocated for potential shared-stewardship projects, including any combination of the four land tenures studied (national forests, private, BLM, and state lands) (one-third of which was national forest land). Approximately 20 million ha was available for shared projects for fire risk reduction in three land tenures (8.5 million ha of which was inside national forests), and approximately 7.5 million ha was available for four land tenures (3.5 million ha of which was inside national forests).
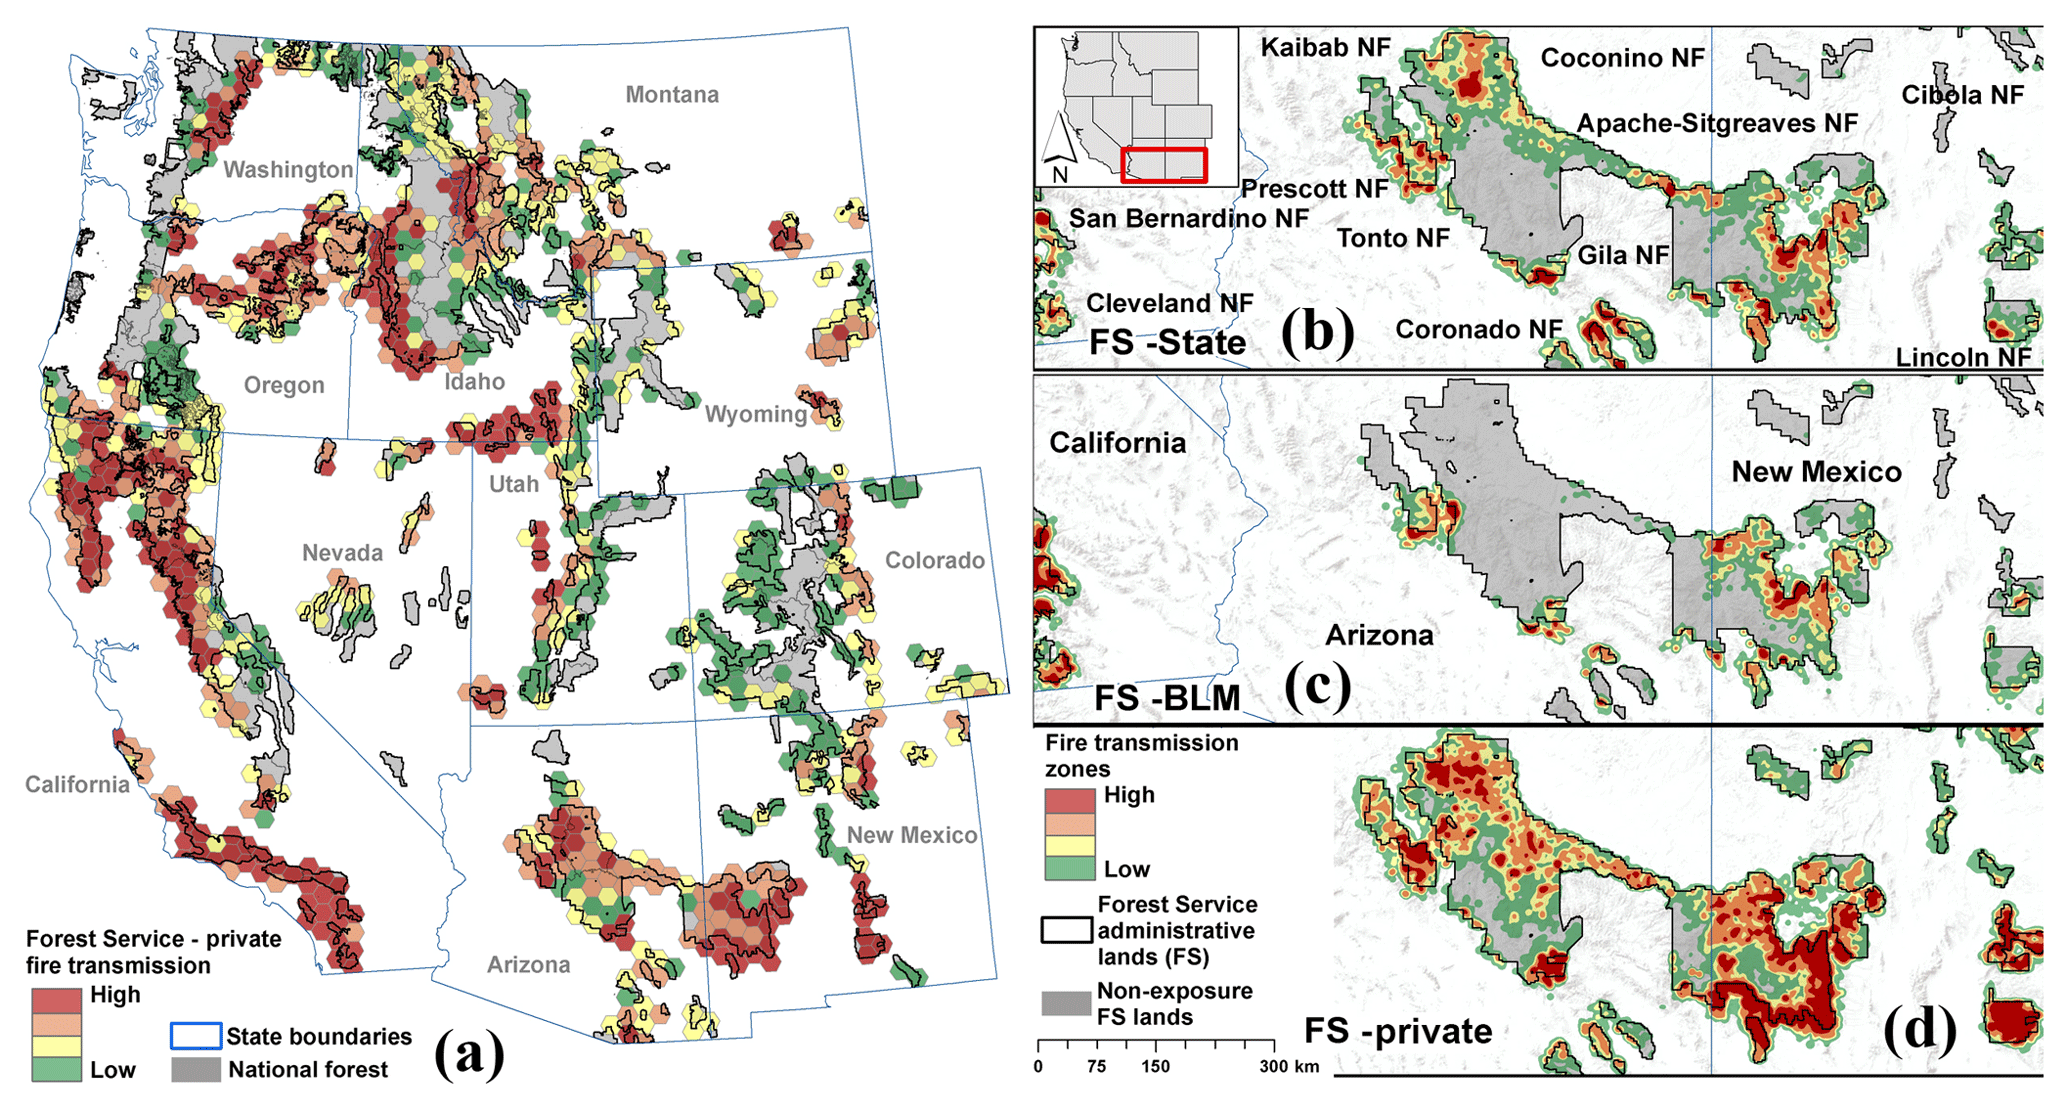
Figure 7Cross-boundary wildfire from Forest Service administrative lands (FS) to private lands (a). Grey areas indicate national forest lands where transmission to other land tenures is very low (high percent of self-burning fire). (b, c, d) Zoom in the southern part of the study area showing the detailed cross-boundary fire transmission zones and highlighting the differences among the three pairs of the largest land tenures of the western US: (b) FS–state; (c) FS–BLM; (d) FS–private.
3.3 Community exposure
The fireshed covered an area of approximately 70 million ha across the western US. For each hexcell we estimated the area burned that each land tenure generated and transmitted to communities, and color coded them with the land tenure producing the highest exposure (Fig. 8a). The southern parts of ID and UT and the northwest AZ and NV were mostly affected by fires ignited on BLM lands, while in northern UT, southwest and northern CA, northern NV, and eastern NM structure exposure fires were mostly a problem caused by private land ignitions. National forest ignitions caused most community exposure in parts of northern and southern CA, central ID, western MT, north-central WA, central AZ, and southwest NM. State land fires were dominant in southern AZ and central UT, while WUI ignitions prevailed in coastal CA and across the Sierra Nevada, in north-central CO, and in northeast and southern WA. Tribal land fires mostly exposed communities in central AZ, with lower influence in MT, WA, and the central parts of OR.

Figure 8(a) Land tenures contributing the highest structure exposure to communities in the western US. (b) Total annual structure exposure by state; (c) percent exposure for each state by the land tenure where the fire was ignited. FS: Forest Service; BLM: Bureau of Land Management; BOR: Bureau of Reclamation; FWS: Fish & Wildlife Service; NPS: National Park Service; DOD: Department of Defense; DOE: Department of Energy.
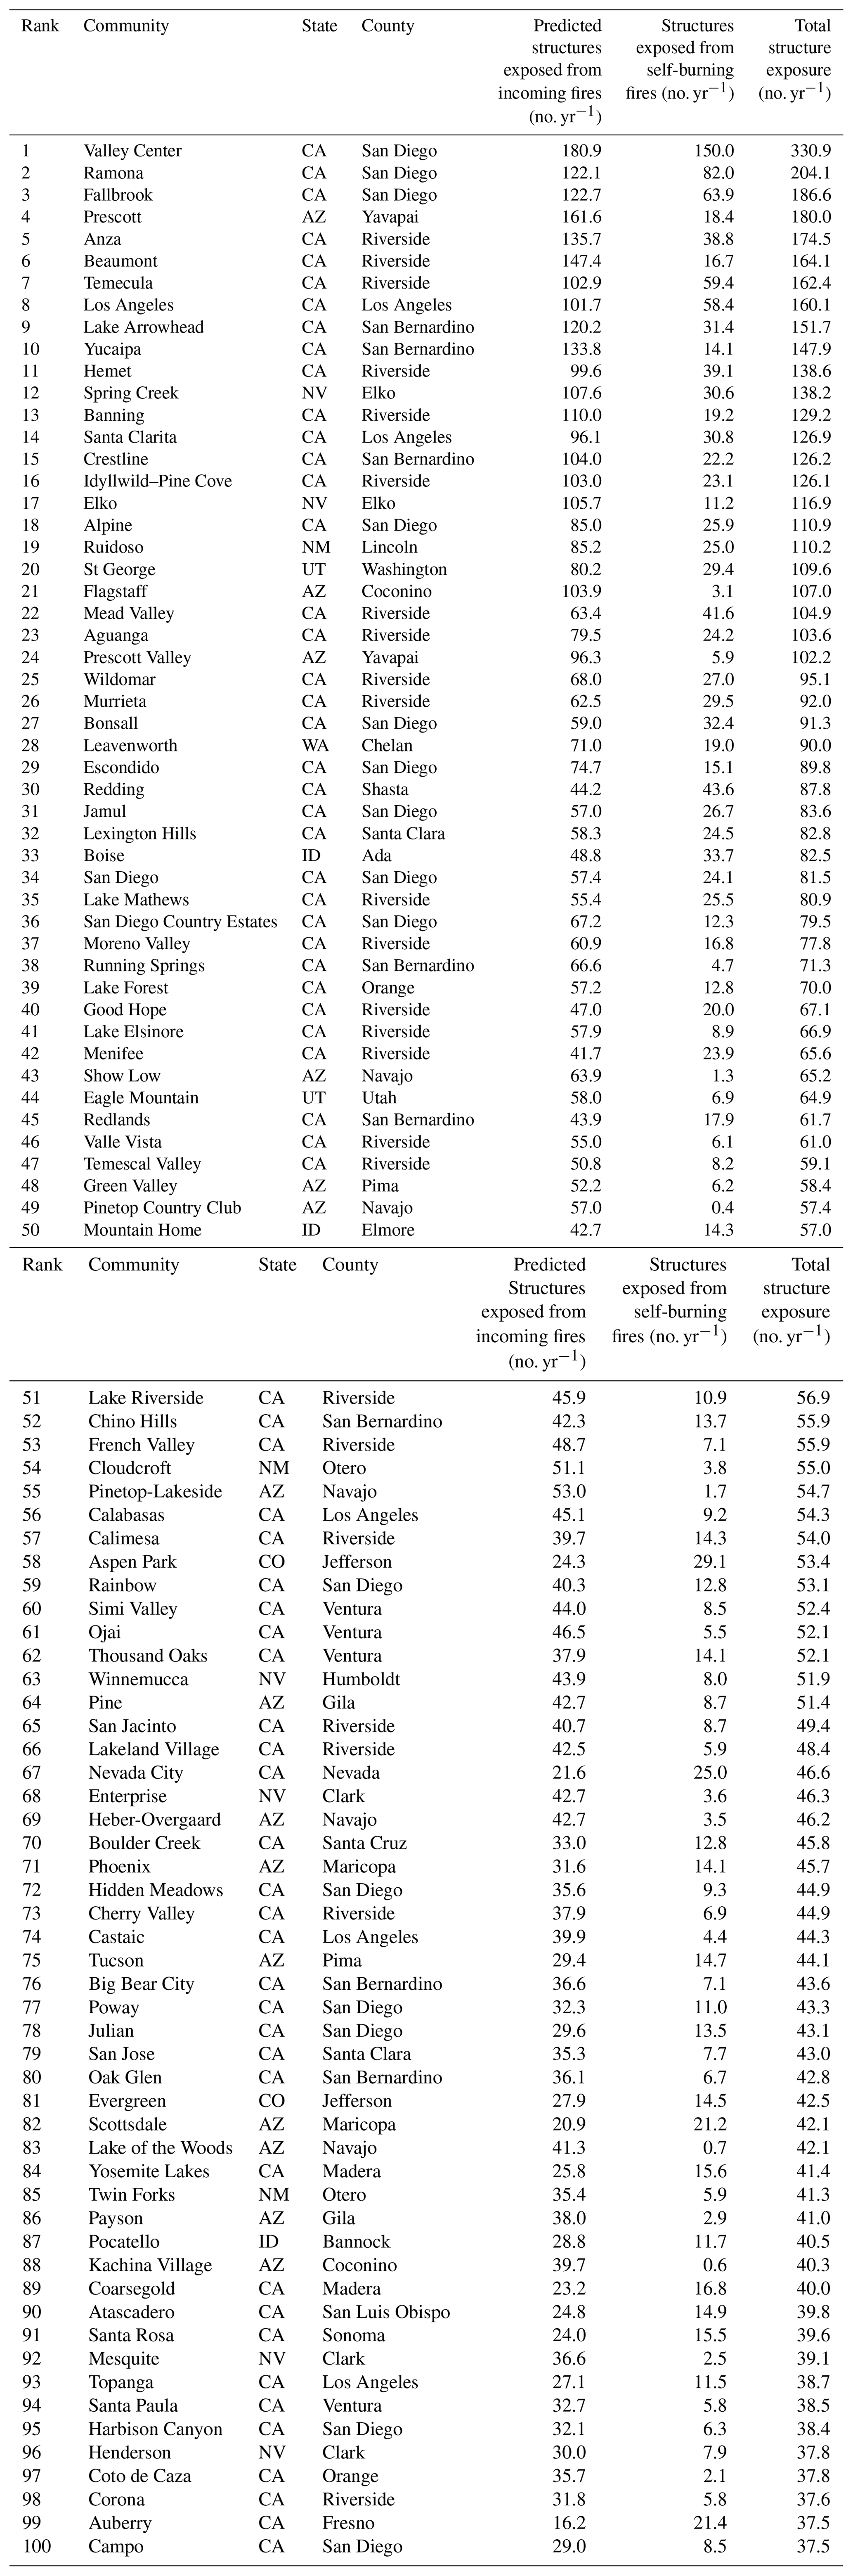
When fire transmission was expressed in terms of annual structure exposure (Fig. 8b), large differences were revealed between CA and AZ with the other states. More than 11 000 structures per year were predicted to be exposed in CA (59 % of total exposed structures) and 2500 in AZ (14 %). Although the total burned area in ID and CA was similar, they had large differences in terms of structure exposure. All other states had fewer than 1000 structures exposed per year, ranging from a low of 150 in WY (1 % of the total structure exposure) and a high of 850 in ID (4.5 %). In conjunction with our previous findings, half of the predicted structure exposure came from ignitions on private and WUI lands, followed by national forests (21.5 %), BLM lands (6 %), state lands (4.5 %), and city/county and tribal lands (3.6 % each) (Fig. 8c). Figure A3 shows the top 10 communities of each state in terms of annual structure exposure. Table B4 shows the list of the top 100 communities, regardless of state, ranked by the total annual structure exposure (sum of incoming and self-burning fires).
Finally, five land tenures own or manage 92 % of fireshed, with private and community together owning half the land base, followed by national forests (25 %), BLM lands (10 %), and state lands (6 %) (Fig. 9a, b). More than half of the fireshed lands were covered with grass or grass/shrub fuel models (Fig. 9c), and when combined with shrub fuels account for three-quarters of the fuel models in some states (NV, AZ, UT, WY, NM, and ID). Forested fuel models (timber understory and timber–litter) had the lowest share in NV (10 %) and the highest in OR and WA (∼50 %), also covering large parts of MT, CO, and CA. Wildfire hazard potential was low on more than 50 % of WY, WA, and CO firesheds (Fig. 9d), while CA, ID, UT, NV, and OR had more than 40 % of their fireshed with high or very high fire hazard.
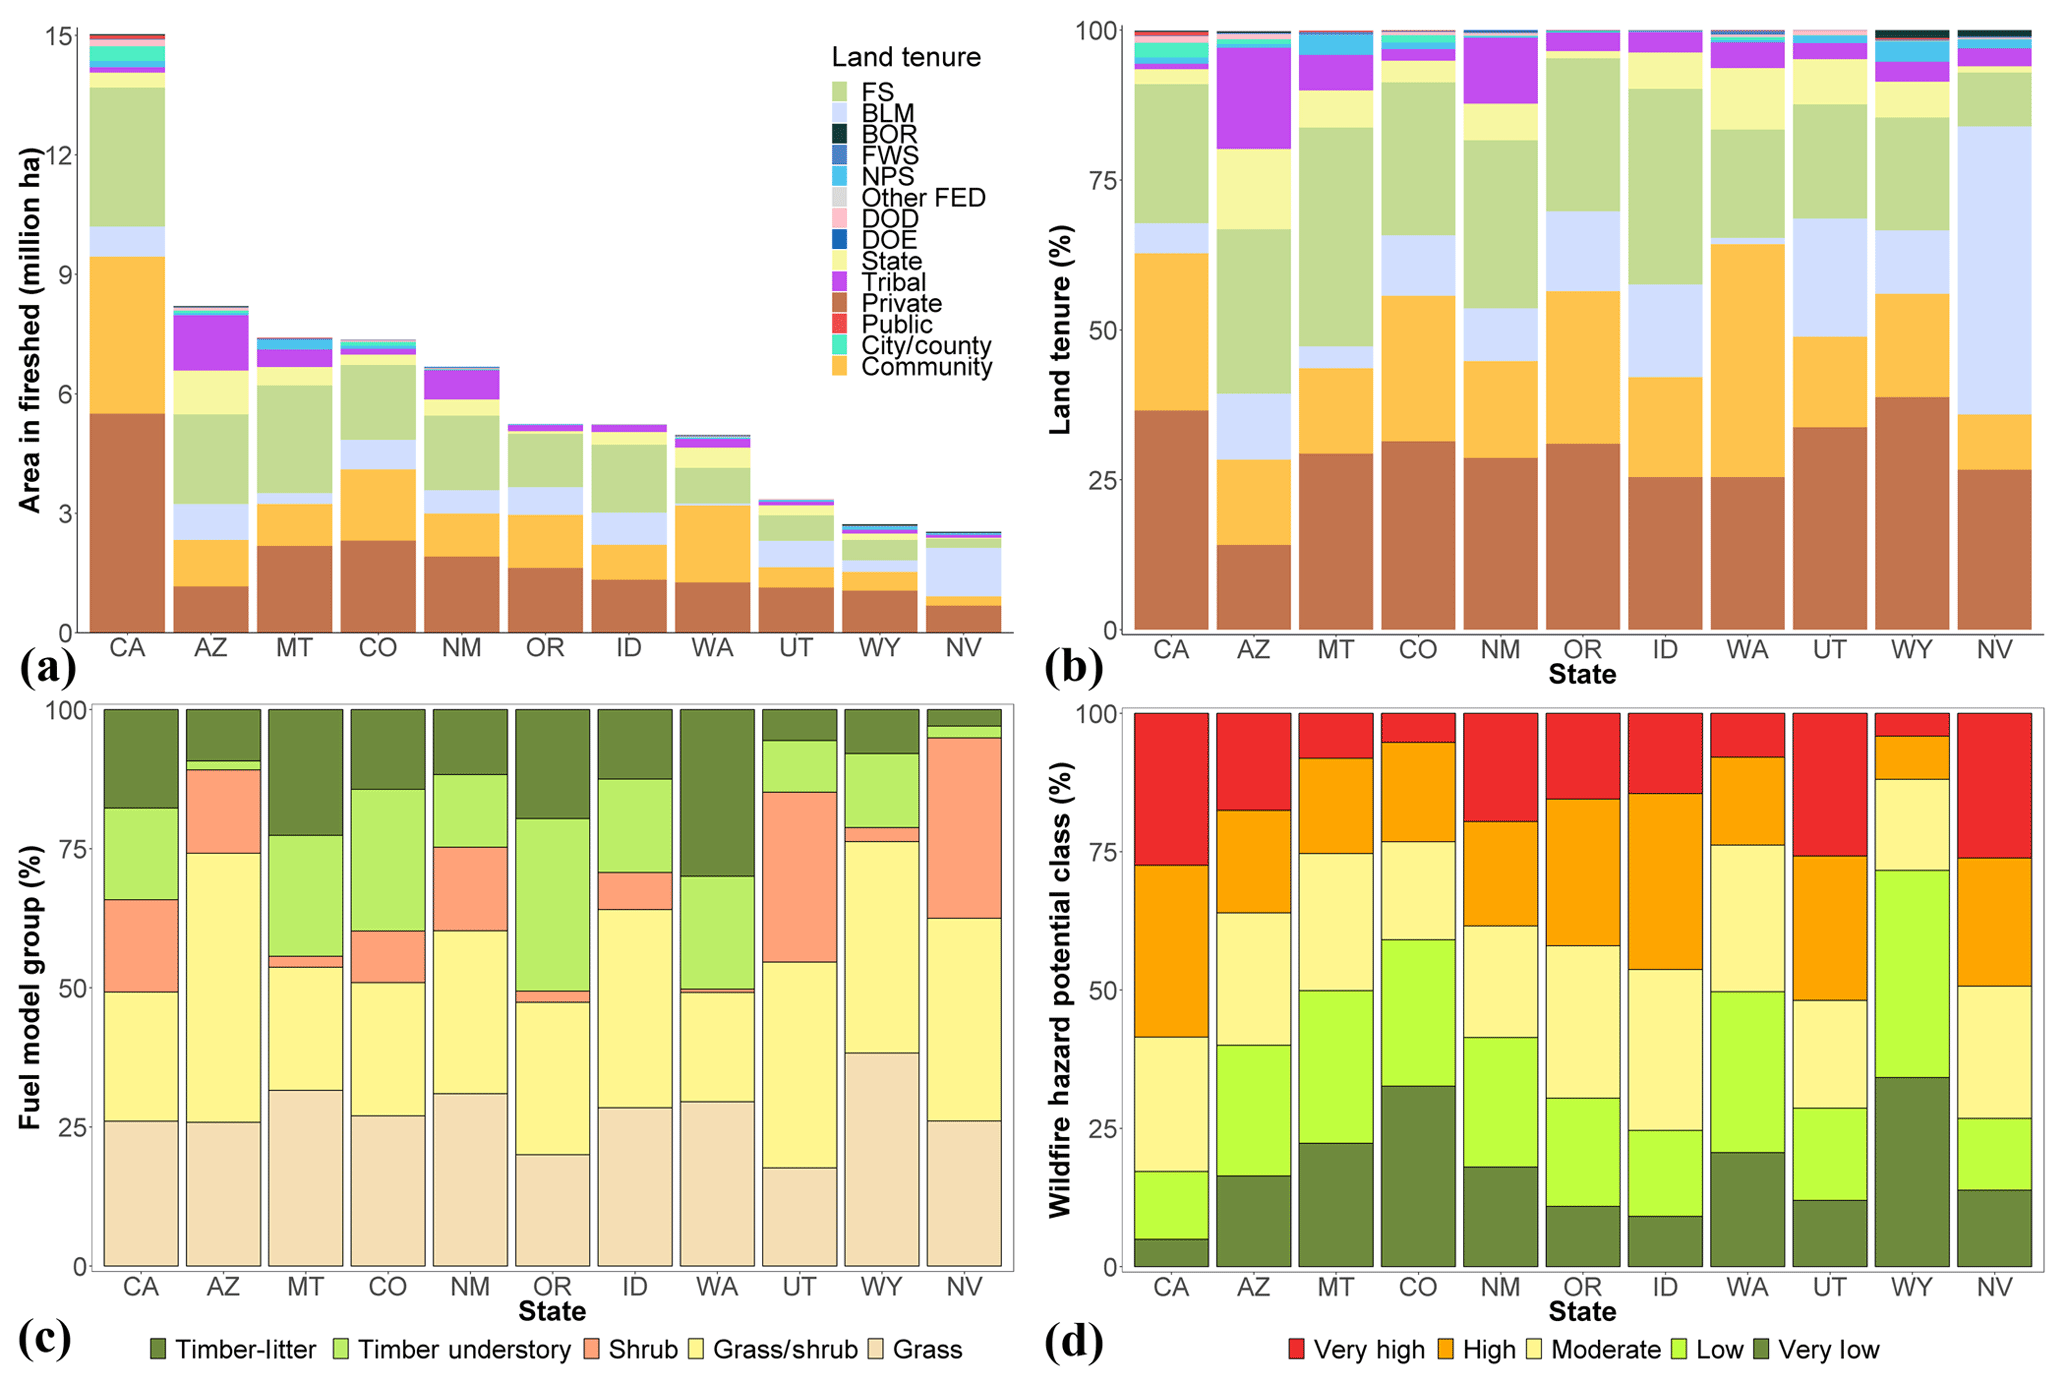
Figure 9Fireshed characteristics of each western US state in terms of (a) land tenure area; (b) land tenure percentage; (c) fuel model percentage (Scott and Burgan, 2005); (d) average wildfire hazard potential class percentage (Dillon et al., 2015). FS: Forest Service; BLM: Bureau of Land Management; BOR: Bureau of Reclamation; FWS: Fish & Wildlife Service; NPS: National Park Service; DOD: Department of Defense; DOE: Department of Energy.
Fire transmission and exchange among land tenures and communities across the western US show complex patterns related to the source of risk and parcel geometry. Previous studies covering the western US assessed fire risk (WWWRA, 2013; Dillon et al., 2015; AMF, 2018; Parks et al., 2018), but did not consider where the fires are coming from and how they are transmitted from one land tenure to another. This work expands the scale of our earlier investigations that assessed cross-boundary fire transmission for individual national forests and the state of Arizona (Ager et al., 2014b, 2017, 2018).
We focused on the four largest land tenures (FS, BLM, private, and state) that generated 85 % of the total outgoing fire. Most predicted ignitions originated on private and BLM lands. Results revealed that US national forests have the highest predicted burned area (sum of incoming and self-burning fires), while the highest outgoing fire originates from private landownerships. When burned area inside each land tenure was normalized by its area, FS was ranked first but city/county and public lands were among the highest ranked land tenures (Table 2). For normalized outgoing fire, city/county and public lands were ranked highest, followed by state and FS lands, a completely different ranking from the raw outgoing fire values; i.e., private, FS, and BLM were ranked higher (Table 3). These findings revealed that smaller land tenures can have increased significance in the fire transmission patterns and were affected by large fire incidents.
Landscape fragmentation needs to be considered in wildfire risk management and planning, whether caused by different vegetation, fuel, or landownerships types, since it creates different scales and complexity of fire transmission, e.g., checkerboard vs. linear interface boundaries. In addition, highly fragmented wildland–urban interface areas among private landowners increase fire suppression complexity and population risk (Busby et al., 2012; Chas-Amil et al., 2013). Previous simulation studies have shown that both size and parcel complexity (perimeter-to-area ratio) affect the proportion of transmitted fire (Ager et al., 2014a). In general, smaller parcels tend to receive higher amounts of incoming fire since their interior is burned more often from incoming fire due to their relatively small distance from the edge. The proportion of incoming fire is a function of the ratio of fire size to parcel size. When the former is very large relative to the latter, the higher the proportion of incoming fire. However, parcel edge complexity can also influence the proportion of incoming fire relative to the total fire transmission. A complex edge reduces the distance to the interior regions of a parcel and thus increases the proportion of incoming fire (Ager et al., 2014a). Effective and cost-efficient cross-boundary fuel management projects could consider the parcel size and the extent of common boundaries, in addition to the sources and the amounts of incoming fire to each land tenure. We found that the large fire exchange between private lands and national forests is due to mixed ownerships inside the national forests' administrative boundary, causing the checkerboard effect of small mixed land parcels. State lands had fire connectivity primarily with private and secondarily with BLM lands, with limited fire exchange zones with national forests. We also found that small landownership parcels tended to receive higher amounts of incoming fire, like public, state, BOR, and city/county lands, while larger parcels (e.g., FS, NPS, DOD) tended to have less transmitted fire.
Estimating the amounts of fire generated by human or natural causes (Balch et al., 2017) can also define where there is potential to let some natural ignitions burn naturally under conditions that are not threatening to communities or other assets (Barnett et al., 2016). The majority of unplanned ignitions in wilderness in the US are still suppressed, despite legislation that allows them to burn, but human-caused fires have to be suppressed (Miller, 2012; Fusco et al., 2016). Human ignitions are largely preventable and occur at times of the year and in locations when and where they historically did not happen (Balch et al., 2017; Nagy et al., 2018). Although we have sufficient data on where historical natural ignitions have occurred since 1992 (Short, 2017), we needed probabilistic estimations of the spatial likelihood for potential natural ignitions to enable the separation of all simulated ignitions into natural and human caused (given an ignition, we are deciding what was the most likely cause of that fire). The statistical model we created allows for modeling the ignition cause of every simulated fire and can be applied to produce ignition-cause probability maps of higher spatial resolution at the scale of the western US. We found that natural ignitions are the major source of fire transmission and caused two-thirds of the total fire activity in terms of burned area. Despite that large difference, communities were more exposed to human-caused ignitions (60 % vs. 40 % from natural ignitions), and the same applied for city/county and public lands.
The implications of our results for community wildfire protection planning are several. We provide for the first time an all-lands community prioritization assessment (see Fig. A3 and Table B4) based on the predicted annual structure exposure of each community from fires both ignited elsewhere and within that community. Community protection planning could benefit from recognizing firesheds. Results revealed that the structure exposure problem in western US communities originated mostly from ignitions on either WUI or private lands, and less from federal lands (national forests and BLM); thus collaboration is required among four major entities (federal, private, state, and tribal lands). California, Arizona, Idaho, and Montana were the states where more than 90 % of the predicted structure exposure occurred. The extent, land tenure, and fuel model composition of the fireshed differed among the western states, although in general they was mostly comprised of a combination of private/community lands, national forests, BLM, and tribal and state lands and characterized by the dominance of shrub and grass fuel models. At the state level, large amounts of burned area did not necessarily mean large numbers of exposed structures, since in cases like Idaho and California with similar amounts of burned area, simulated fires were predicted to expose 90 % fewer structures in Idaho compared to California.
These results can help prioritize fuel treatment projects that consider both the anthropogenic and biophysical context of the wildfire problem, which is increasingly drawing the attention of the research community (Bodin and Tengö, 2012; Evers et al., 2019; Palaiologou et al., 2019; Hamilton et al., 2019). Establishing cross-boundary fuel management projects with other major landowners has become a necessity when land managers want to achieve multiple treatment and ecological objectives (improve forest conditions and reduce wildfire risk to communities) on larger landscapes or for distributing the implementation costs across landowners on areas with limited markets or when the cost of service work exceeds timber value.
Several states, through the development of State Action Plans (SAP), have already set their priority issues (objectives to be achieved) and identified priority areas, like Idaho, Montana, Ohio, and Utah. Since designing cross-boundary projects does not have specific implementation standards and nationally directed tools and documents, there is flexibility on how candidate planning areas can be selected and what types of projects can be applied in each landscape. The State Wildfire Risk Assessment Portals (WWWRA, 2013; Arizona Department of Forestry and Fire Management, 2016) moved towards that direction, but they produced pixel-level outputs that were not at the appropriate scale and could not be considered the ideal spatial units of change since we need large planning areas inside the cross-boundary zones that can reduce fire risk or achieve ecological objectives (e.g., spanning from 5 to 20 thousand ha).
This study is the first comprehensive and systematic approach to estimating cross-boundary wildfire transmission over large areas and for all the major land tenures of a study area, applying an assessment framework that can be implemented across different regions of the world to inform fire management agency decisions on the locations of future fuel management projects. Our methods and concepts were also applied at different scales in Europe (Palaiologou et al., 2018; Salis et al., 2018; Alcasena et al., 2019), but they have not yet been considered in the official wildfire risk assessments at the pan-European level (San-Miguel-Ayanz et al., 2018). We anticipate that our results, which covered an extensive and diverse landscape of the western US, can inform fire management planning and guide how existing wildfire risk assessments can be improved in regions like Mediterranean Europe, Australia, southern Africa, and Russia. This framework can also be used for any combination of land tenures to map and assess the risk to communities and other assets originating from cross-boundary fire transmission zones to achieve various management and restoration goals like WUI protection, timber production, restoration of areas affected by insects and disease, and watershed management. This includes the assessment of both elements of cross-boundary fire risk, i.e., sources (where fires are coming from) and sinks (where fires burn), since effective shared-stewardship projects must deal with both elements to achieve change. Finally, we explored how cross-boundary wildfire transmission relates to communities and the lands surrounding a community where wildfire risk often originates, a critical part of understanding how to mitigate WUI disasters at a time when the western US (California, 2017–2018) and places in Europe (Greece, 2018, Portugal, 2017) have experienced high death tolls, structure loss, and economic costs from recent large wildfires.
Of the total simulated fire activity, one-third was transmitted from a different land tenure while two-thirds was predicted to originate from natural ignitions. Two-thirds of community exposure in the western US originated from privately owned lands, more than two-thirds of which was developed (part of community WUI). Community exposure from federal land varied by state, from less than 20 % (WY) to nearly 50 % (AZ and NV). We expect that this study can help towards improved planning of cross-boundary fuel management projects by providing a better understanding to a wider audience about the wildfire transmission patterns in the western US. We highlighted the importance of collaboration among different landowners to improve community protection and provided an assessment framework that can be used across all lands and all landownerships. Our approach was designed for assessments regarding the current ecological and site conditions, targeting in particular shared-stewardship management activities for the short-term future (1–5 years) on the 60 million ha of manageable lands with potential for shared-stewardship projects. Future work will combine three or more land tenures to identify larger areas with high fuel treatment potential, with private lands being the core node of this shared-stewardship approach since they produce the highest amounts of outgoing fire. In addition, we will create a typology of how each area is receiving fire transmission, grouping similar regions based on common characteristics such as fuel model, fire regime, management history, and land tenure composition.
The data are property of the USDA Forest Service, Rocky Mountain Research Station. These data are available only upon request to Alan A. Ager (alan.ager@usda.gov).
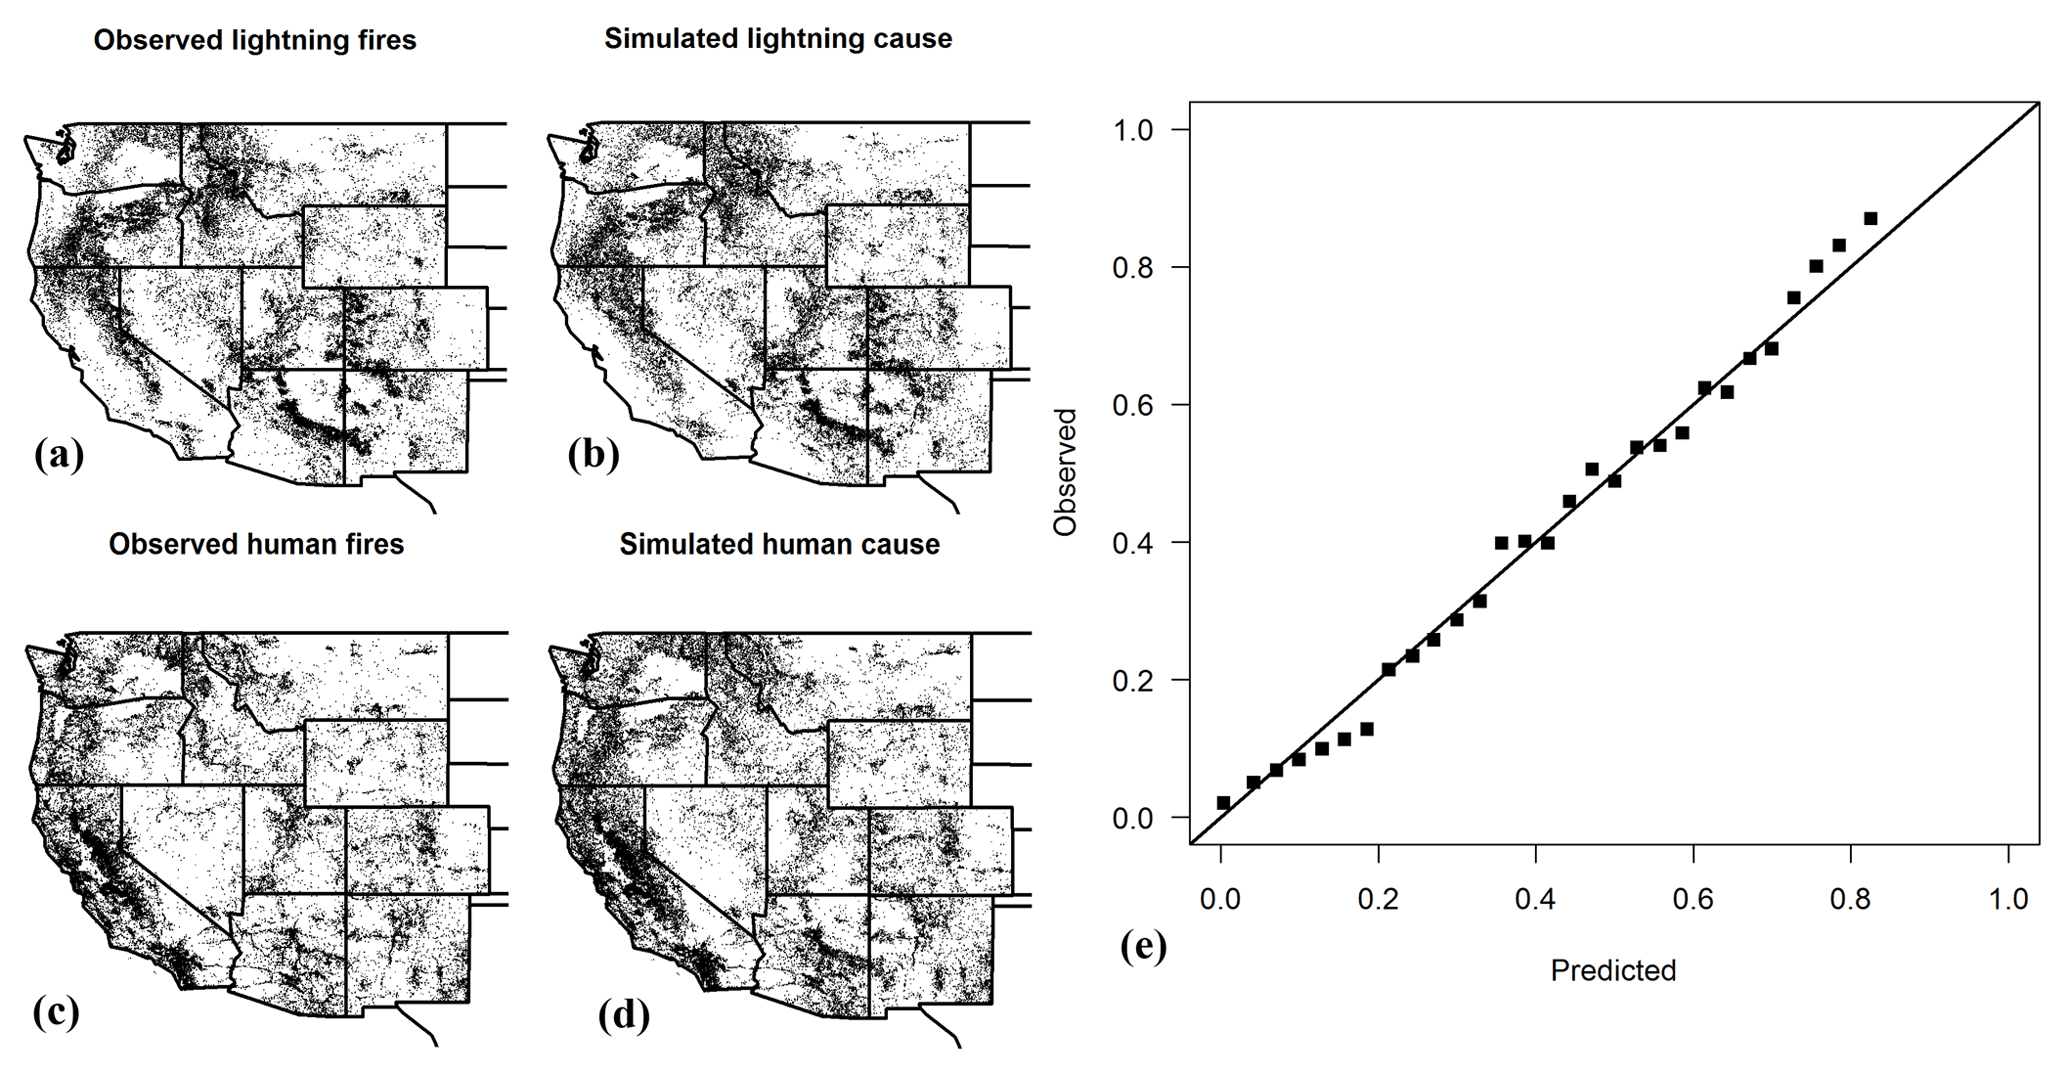
Figure A1Maps show the locations of observed lightning- (a) and human- (c) caused fires from a simulation which assigned a cause to each simulated ignition from our model (b and d). Notice in southern California in the observed human ignitions we see two lines of ignitions in the southeastern part (c). These are the main highways to Arizona and all fires at these locations are human caused, indicating a correct assignment of simulated ignition cause (d). Panel (e) shows the observed relative frequency of naturally caused fires plotted against predicted probabilities, after binning the data into 29 classes according to the predicted values.

Figure A2Cross-boundary wildfire transmission zones from Forest Service administrative lands to (a) state and (b) BLM lands. Grey areas indicate national forest lands where transmission to other land tenures is very low (high percent of self-burning fire).

Figure A3The top 10 communities for each state with the highest predicted fire exposure for structures.
Table B1Percentage of fire-adapted area (fire regimes 1 or 3) (source: LANDFIRE 2014) for each land tenure and state. FS: Forest Service; BLM: Bureau of Land Management; BOR: Bureau of Reclamation; NPS: National Park Service; FWS: Fish & Wildlife Service; DOD: Department of Defense; DOE: Department of Energy.
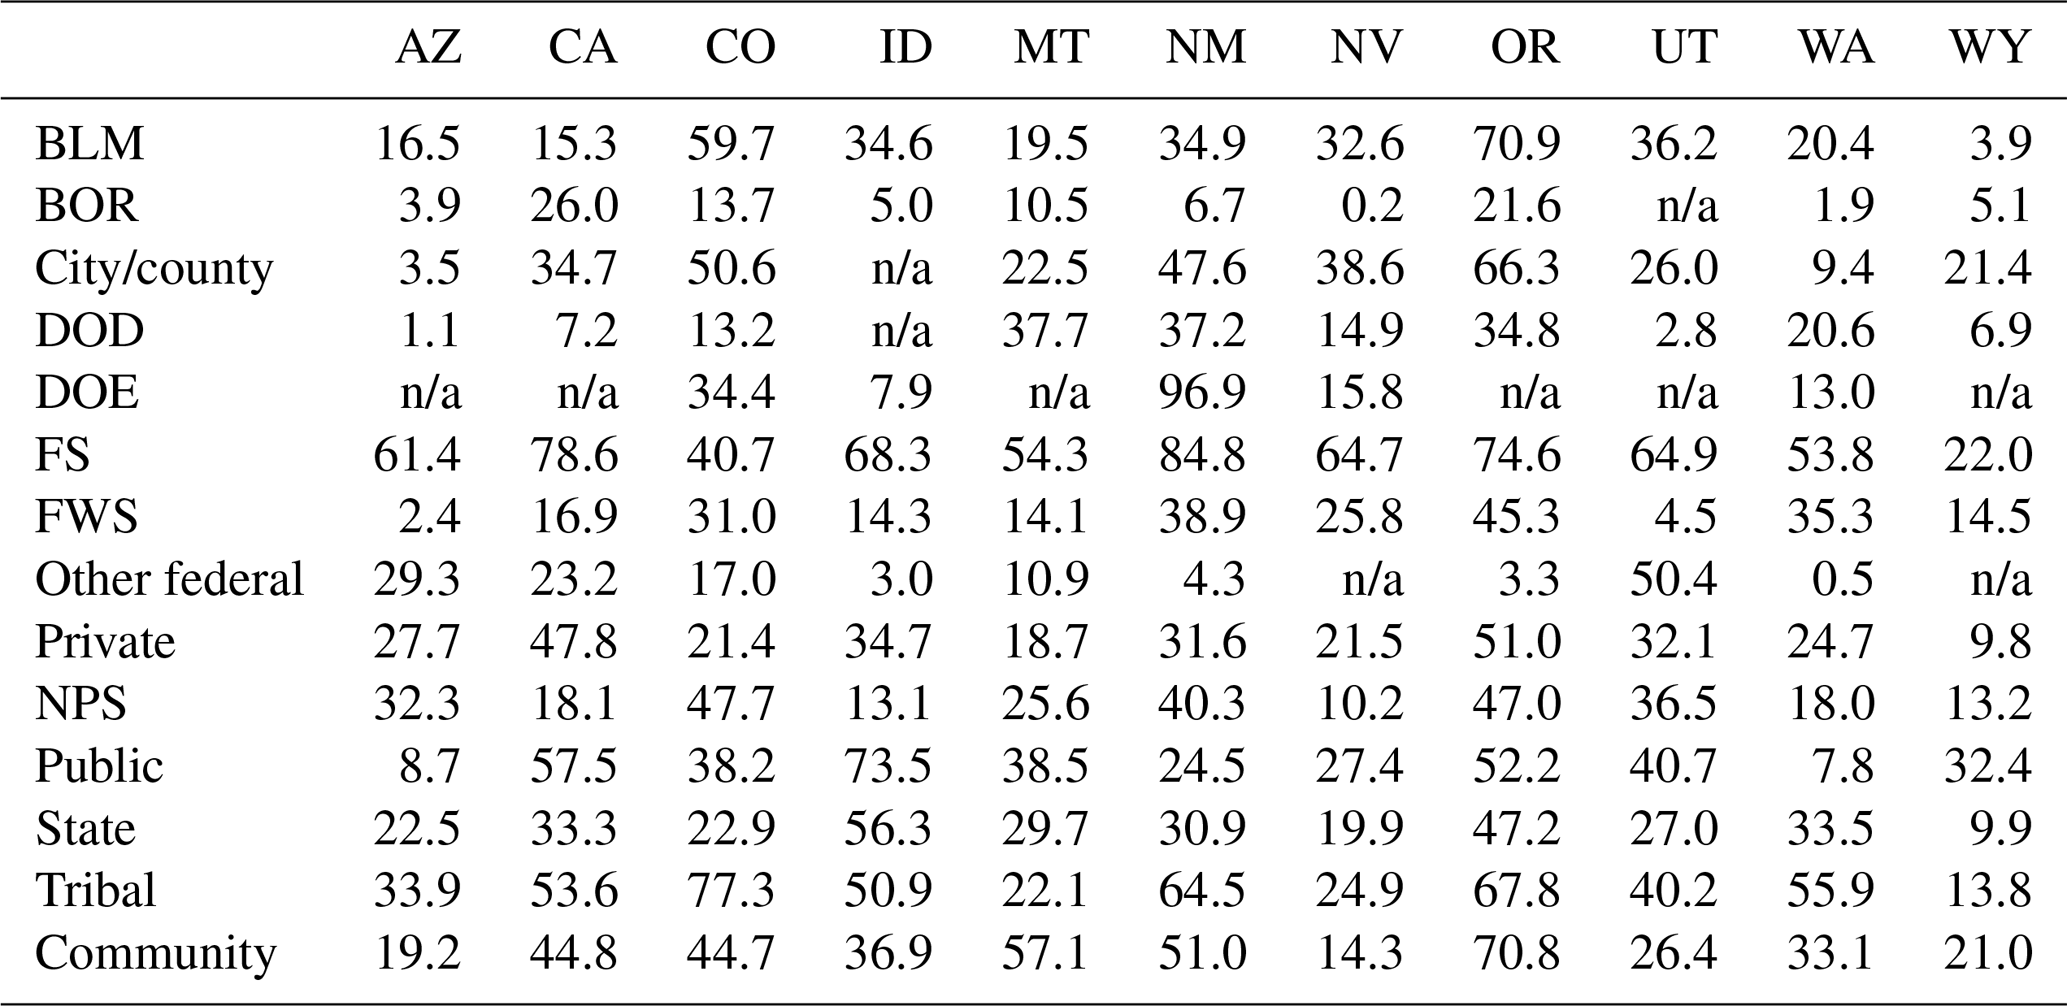
Table B2Per state comparison between historical and predicted annual burned area.

Table B3Predicted average fire size from all the ignitions of each land tenure and state, expressed as hectares burned per year.

Table B4List of the top 100 most exposed communities, ranked by the total amount of annual structure exposure (sum of incoming and self-burning fires).
PP prepared the paper with contributions from all co-authors. PP and AA had leading roles in the research conceptualization. PP, AA, MNP, MD, and CE contributed to the selection and application of methods. MD, AA, CE, and PP reviewed and edited the paper. MD and AA validated the results. HP performed the statistical modeling of fire ignition cause.
The authors declare that they have no conflict of interest.
This article is part of the special issue “Spatial and temporal patterns of wildfires: models, theory, and reality”. It is not associated with a conference.
We thank Ken Bunzel for developing tools that enabled the post processing of fire simulation outputs.
This research has been supported by the USDA Forest Service International Programs (grant no. G-3-10895).
This paper was edited by Ricardo Trigo and reviewed by two anonymous referees.
Abatzoglou, J. T.: Development of gridded surface meteorological data for ecological applications and modelling, Int. J. Climatol., 33, 121–131, 2013.
Abrams, J., Nielsen-Pincus, M., Paveglio, T., and Moseley, C.: Community wildfire protection planning in the American West: homogeneity within diversity?, J. Environ. Plann. Man., 59, 557–572, https://doi.org/10.1080/09640568.2015.1030498, 2016.
Ager, A. A., Vaillant, N. M., and Finney, M. A.: Integrating fire behavior models and geospatial analysis for wildland fire risk assessment and fuel management planning, J. Combust., 2011, 572452, https://doi.org/10.1155/2011/572452, 2011.
Ager, A. A., Day, M. A., Finney, M. A., Vance-Borland, K., and Vaillant, N. M.: Analyzing the transmission of wildfire exposure on a fire-prone landscape in Oregon, USA, Forest Ecol. Manag., 334, 377–390, https://doi.org/10.1016/j.foreco.2014.09.017, 2014a.
Ager, A. A., Day, M. A., McHugh, C. W., Short, K., Gilbertson-Day, J., Finney, M. A., and Calkin, D. E.: Wildfire exposure and fuel management on western US national forests, J. Environ. Manage., 145, 54–70, 2014b.
Ager, A. A., Kline, J., and Fischer, A. P.: Coupling the biophysical and social dimensions of wildfire risk to improve wildfire mitigation planning, Risk Anal., 35, 1393–1406, https://doi.org/10.1111/risa.12373, 2015.
Ager, A. A., Evers, C. R., Day, M. A., Preisler, H. K., Barros, A. M., and Nielsen-Pincus, M.: Network analysis of wildfire transmission and implications for risk governance, PLoS ONE, 12, e0172867, https://doi.org/10.1371/journal.pone.0172867, 2017.
Ager, A. A., Palaiologou, P., Evers, C. R., Day, M. A., and Barros, A. M. G.: Assessing transboundary wildfire exposure in the southwestern United States, Risk Anal., 38, 2105–2127, https://doi.org/10.1111/risa.12999, 2018.
Albini, F. A.: Spot fire distance from burning trees: a predictive model, USDA Forest Service, Intermountain Forest and Range Experiment Station, Ogden, UT, Gen. Tech. Rep., INT-GTR-56, 73 pp., 1979.
Alcasena, F. J., Ager, A. A., Bailey, J. D., Pineda, N., and Vega-Garcia, C.: Towards a comprehensive wildfire management strategy for Mediterranean areas: Framework development and implementation in Catalonia, Spain, J. Environ. Manage., 231, 303–320, https://doi.org/10.1016/j.jenvman.2018.10.027, 2019.
AMF: Western Water Threatened by Wildfire: it's not just a public lands issue, American Forest Foundation, Washington, DC, 2018.
Arizona Department of Forestry and Fire Management: Arizona Wildfire Risk Assessment Portal (WRAP) – Technical Information, available at https://forestryandfire.az.gov/AZWRAP-Support (last access: 28 March 2019, 2016.
Balch, J. K., Bradley, B. A., Abatzoglou, J. T., Nagy, R. C., Fusco, E. J., and Mahood, A. L.: Human-started wildfires expand the fire niche across the United States, P. Natl. Acad. Sci. USA, 114, 2946–2951, 2017.
Bark, R. H., Frisvold, G., and Flessa, K. W.: The role of economics in transboundary restoration water management in the Colorado River Delta, Water Resources and Economics, 8, 43–56, https://doi.org/10.1016/j.wre.2014.10.006, 2014.
Barnett, K., Miller, C., and Venn, T. J.: Using risk analysis to reveal opportunities for the management of unplanned ignitions in wilderness, J. Forest., 114, 610–618, https://doi.org/10.5849/jof.15-111, 2016.
Bodin, Ö. and Tengö, M.: Disentangling intangible social-ecological systems, Global Environ. Chang., 22, 430–439, 2012.
Brack, D.: International trade and the Montreal Protocol, Routledge, London, UK, 2017.
Busby, G. M., Albers, H. J., and Montgomery, C. A.: Wildfire Risk Management in a Landscape with Fragmented Ownership and Spatial Interactions, Land Econ., 88, 496–517, 2012.
Charnley, S., Kelly, E. C., and Wendel, K. L.: All lands approaches to fire management in the Pacific West: A typology, J. Forest., 115, 16–25, 2016.
Chas-Amil, M., Touza, J., and García-Martínez, E.: Forest fires in the wildland–urban interface: a spatial analysis of forest fragmentation and human impacts, Appl. Geogr., 43, 127–137, 2013.
Dillon, G. K., Menakis, J., and Fay, F.: Wildland fire potential: a tool for assessing wildfire risk and fuel management needs, in: Proceedings of the large wildland fires conference, Keane, R. E., Jolly, M., Parsons, R., Riley, K., 19–23 May 2014, Missoula, MT. Proc. RMRS-P-73, USDA, Forest Service, Rocky Mountain Research Station, Fort Collins, CO, 345 pp., 2015.
Evers, C., Ager, A. A., Nielsen-Pincus, M., Palaiologou, P., and Bunzel, K.: Archetypes of community wildfire exposure from national forests in the western US, Landscape Urban Plan., 182, 55–66, https://doi.org/10.1016/j.landurbplan.2018.10.004, 2019.
Finney, M. A.: Fire growth using minimum travel time methods, Can. J. Forest Res., 32, 1420–1424, https://doi.org/10.1139/x02-068, 2002.
Finney, M. A.: An overview of FlamMap fire modeling capabilities, Fuels Management – How to Measure Success, Proceedings RMRS-P-41, Fort Collins, CO, 2006, 213–220, 2006.
Finney, M. A., Grenfell, I. C., McHugh, C. W., Seli, R. C., Trethewey, D., Stratton, R. D., and Brittain, S.: A method for ensemble wildland fire simulation, Environ. Model. Assess., 16, 153–167, 2011a.
Finney, M. A., McHugh, C. W., Grenfell, I. C., Riley, K. L., and Short, K. C.: A simulation of probabilistic wildfire risk components for the continental United States, Stoch. Env. Res. Risk. A, 25, 973–1000, https://doi.org/10.1007/s00477-011-0462-z, 2011b.
Fischer, A. P., Klooster, A., and Cirhigiri, L.: Cross-boundary cooperation for landscape management: Collective action and social exchange among individual private forest landowners, Landscape Urban Plan., 188, 151–162, 2018.
Fusco, E. J., Abatzoglou, J. T., Balch, J. K., Finn, J. T., and Bradley, B. A.: Quantifying the human influence on fire ignition across the western USA, Ecol. Appl., 26, 2390–2401, https://doi.org/10.1002/eap.1395, 2016.
Graham, R. T., Jain, T. B., and Matthews, S.: Fuel management in forests of the Inland West, in: Cumulative watershed effects of fuel management in the western United States, edited by: Elliot, W. J., Miller, I. S., and Audin, L., Gen. Tech. Rep. RMRS-GTR-231, USDA Forest Service, Rocky Mountain Research Station, Fort Collins, CO, 19–68, 2010.
Hall, B., Brown, T., Bradshaw, L., Jolly, W., and Nemani, R. R.: National standardized energy release component (ERC) forecasts, 2nd International Wildland Fire Ecology and Fire Management Congress and 5th Symposium on Fire and Forest Meteorology, Orlando, FL, 2003, 3, 2003.
Hamilton, M., Fischer, A. P., and Ager, A.: A social-ecological network approach for understanding wildfire risk governance, Global Environ. Chang., 54, 113–123, https://doi.org/10.1016/j.gloenvcha.2018.11.007, 2019.
Hills, P., Zhang, L., and Liu, J.: Transboundary Pollution between Guangdong Province and Hong Kong: Threats to Water Quality in the Pearl River Estuary and Their Implications for Environmental Policy and Planning, J. Environ. Plann. Man., 41, 375–396, https://doi.org/10.1080/09640569811641, 1998.
Kenward, A., Sanford, T., and Bronzan, J.: WESTERN WILDFIRES: A Fiery Future, Climate Central, Princeton, NJ, 42, 2016.
LANDFIRE: LANDFIRE Existing Vegetation Type Layer, U.S. Department of the Interior, Geological Survey, Virginia, USA, 2014.
Lara, A. A. C.: Transboundary water conflicts in the Lower Colorado River Basin: Mexicali and the salinity and the all American Canal Lining, El Colegio de la Frontera Norte, Tijuana, Mexico, 2015.
Lidskog, R., Soneryd, L., and Uggla, Y.: Transboundary risk governance, Earthscan, London, 2010.
Lidskog, R., Uggla, Y., and Soneryd, L.: Making transboundary risks governable: Reducing complexity, constructing spatial identity, and ascribing capabilities, Ambio, 40, 111–120, 2011.
Linnerooth-Bayer, J., Löfstedt, R. E., and Sjöstedt, G.: Transboundary risk management, Earthscan Publications Ltd, London, UK, 2001.
Liu, S., Yin, Y., Li, J., Cheng, F., Dong, S., and Zhang, Y.: Using cross-scale landscape connectivity indices to identify key habitat resource patches for Asian elephants in Xishuangbanna, China, Landscape Urban Plan., 171, 80–87, 2017.
Lyons, Y.: Transboundary pollution from offshore oil and gas activities in the seas of Southeast Asia, in: Transboundary Environmental Governance, Routledge, 183–218, London, UK, 2016.
Markus, A., Leavell, D., Bienz, C., Carlsen, K., Davis, E. J., Douglas, M,, Ferguson, D,, Fledderjohann, L., Johnson, K., Livingston, N, Pettigrew, J., Rogers, G., Schreder, M., Shoun, D., and Ann, V. L.: Planning and Implementing Cross-boundary, Landscape-scale Restoration and Wildfire Risk Reduction Projects, A Guide to Achieving the Goals of the National Cohesive Wildland Fire Management Strategy, Oregon State University, University of Idaho, Washington State University, Corvallis, Oregon, 117, 2018.
Miller, C.: The hidden consequences of fire suppression, Park Science, 28, 75–80, 2012.
Mitchell, R. B.: Intentional oil pollution at sea: environmental policy and treaty compliance, MIT Press, Cambridge, Massachusetts, 1994.
Nagy, R., Fusco, E., Bradley, B., Abatzoglou, J. T., and Balch, J.: Human-related ignitions increase the number of large wildfires across U.S. ecoregions, Fire, 1, 4, https://doi.org/10.3390/fire1010004, 2018.
Palaiologou, P., Ager, A. A., Nielsen-Pincus, M., Evers, C., and Kalabokidis, K.: Using transboundary wildfire exposure assessments to improve fire management programs: a case study in Greece, Int. J. Wildland Fire, 27, 501–513, https://doi.org/10.1071/WF17119, 2018.
Palaiologou, P., Ager, A. A., Nielsen-Pincus, M., Evers, C., and Day, M.: Social vulnerability to large wildfires in the western USA, Landscape Urban Plan., 189, 99–116, 2019.
Parks, S. A., Holsinger, L. M., Panunto, M. H., Jolly, W. M., Dobrowski, S. Z., and Dillon, G. K.: High-severity fire: evaluating its key drivers and mapping its probability across western US forests, Environ. Res. Lett., 13, 044037, https://doi.org/10.1088/1748-9326/aab791, 2018.
R Core Team: R: A language and environment for statistical computing, R Foundation for Statistical Computing, Vienna, Austria, 2016.
Radeloff, V. C., Hammer, R. B., Stewart, S. I., Fried, J. S., Holcomb, S. S., and McKeefry, J. F.: The wildland-urban interface in the United States, Ecol. Appl., 15, 799–805, 2005.
Rollins, M. G.: LANDFIRE: a nationally consistent vegetation, wildland fire, and fuel assessment, Int. J. Wildland Fire, 18, 235–249, https://doi.org/10.1071/WF08088, 2009.
Rothermel, R. C.: A mathematical model for predicting fire spread in wildland fuels, USDA Forest Service, Intermountain Forest and Range Experiment Station, Ogden, UT, Res. Pap. INT-115, 40, 1972.
Rothermel, R. C.: Predicting behavior and size of crown fires in the northern Rocky Mountains, USDA Forest Service, Intermountain Rearch Station, Ogden, UT, Res. Pap. INT-438, 46, 1991.
Salis, M., Del Guiudice, L., Arca, B., Ager, A. A., Alcasena, F., Lozano, O., Bacciu, V., Spano, D., and Duce, P.: Modeling the effects of different fuel treatment mosaics on wildfire spread and behavior in a Mediterranean agro-pastoral area, J. Environ. Manage., 212, 490–505, https://doi.org/10.1016/j.jenvman.2018.02.020, 2018.
San-Miguel-Ayanz, J., Costa, H., De Rigo, D., Liberta, G., Artes V, T., Durrant H., T., Nuijten, D., Loffler, P., and Moore, P.: Basic criteria to assess wildfire risk at the pan-European level, Publications Office of the European Union, EUR 29500 EN, Luxembourg, 26, 2018.
Sayles, J. S. and Baggio, J. A.: Social–ecological network analysis of scale mismatches in estuary watershed restoration, P. Natl. Acad. Sci. USA, 114, E1776–E1785, https://doi.org/10.1073/pnas.1604405114, 2017.
Scott, J. H. and Burgan, R. E.: Standard fire behavior fuel models: a comprehensive set for use with Rothermel's surface fire spread model, USDA Forest Service, Rocky Mountain Research Station, Fort Collins, CO, Gen. Tech. Rep. RMRS-GTR-153, 72, 2005.
Scott, J. H., Helmbrecht, D. J., Parks, S. A., and Miller, C.: Quantifying the Threat of Unsuppressed Wildfires Reaching the Adjacent Wildland-Urban Interface on the Bridger-Teton National Forest, Wyoming, USA, Fire Ecol., 8, 125–142, https://doi.org/10.4996/fireecology.0802125, 2012.
Sexton, T.: U.S. Federal fuel management programs: reducing risk to communities and increasing ecosystem resilience and sustainability, Fuels Management – How to Measure Success: Conference Proceedings RMRS-P-41, Portland, OR, 2006, 9–12, 2006.
Short, K. C.: Spatial wildfire occurrence data for the United States, 1992–2013 [FPA_FOD_20150323], 3rd edition, USDA Forest Service, Rocky Mountain Research Station, Fort Collins, CO, USA, 2015.
Short, K. C., Finney, M. A., Scott, J. H., Gilbertson-Day, J. W., and Grenfell, I. C.: Spatial dataset of probabilistic wildfire risk components for the conterminous United States, https://doi.org/10.2737/RDS-2016-0034, 2016.
Short, K. C.: Spatial wildfire occurrence data for the United States, 1992–2015 [FPA_FOD_20170508], 4th Edition, Forest Service Research Data Archive, Fort Collins, CO, USA, 2017.
Thompson, M., Bowden, P., Brough, A., Scott, J., Gilbertson-Day, J., Taylor, A., Anderson, J., and Haas, J.: Application of wildfire risk assessment results to wildfire response planning in the Southern Sierra Nevada, California, USA, Forests, 7, 64, https://doi.org/10.3390/f7030064, 2016.
Uitto, J. I. and Duda, A. M.: Management of Transboundary Water Resources: Lessons from International Cooperation for Conflict Prevention, Geogr. J., 168, 365–378, 2002.
U.S. Congress: Agricultural Act of 2014, Bill: 113-79, 2nd Session, “The 2014 Farm Bill”, available at: https://www.congress.gov/113/bills/hr2642/BILLS-113hr2642enr.pdf (last access: 28 March 2019), 2014.
USDA Forest Service: National Cohesive Wildland Fire Management Strategy, available at: http://www.forestsandrangelands.gov/strategy/index.shtml (last access: 25 March 2019), 2015a.
USDA Forest Service: Collaborative Forest Landscape Restoration Program 5-Year Report, USDA Forest Service, Washington, DCFS-1047, 2015b.
USDA Forest Service: Towards shared stewardship across landscapes: An outcome-based investment strategy, USDA Forest Service, Washington, DCFS-118, 2018.
USGS: Protected Areas Database of the United States (PAD-US), version 1.4 Combined Feature Class, US Geological Survey, Virginia, USA, 2016.
Van Eerd, M. C., Wiering, M. A., and Dieperink, C.: Solidarity in transboundary flood risk management: A view from the Dutch North Rhine–Westphalian catchment area, Clim. Policy, 17, 261–279, 2015.
Van Wagner, C. E.: Conditions for the start and spread of crown fire, Can. J. Forest Res., 7, 23–34, 1977.
Wood, S. N.: Generalized Additive Models: An Introduction with R., Chapman and Hall/CRC, Boca Raton, Florida, USA, 2006.
WWWRA: West Wide Wildfire Risk Assessment – Final Report, Oregon Department of Forestry, Council of Western State Foresters and the Western Forestry Leadership Coalition, Final Report, Oregon, USA, 2013.
Zeitoun, M. and Warner, J.: Hydro-hegemony – a framework for analysis of trans-boundary water conflicts, Water Policy, 8, 435–460, https://doi.org/10.2166/wp.2006.054, 2006.