the Creative Commons Attribution 4.0 License.
the Creative Commons Attribution 4.0 License.
 | 07 Aug 2019
Improving the understanding of flood risk in the Alsatian region by knowledge capitalization: the ORRION participative observatory
Florie Giacona
Brice Martin
Benjamin Furst
Rüdiger Glaser
Nicolas Eckert
Iso Himmelsbach
Charlotte Edelblutte
Despite the strong societal impact of natural hazards, their documentation remains incomplete, with only a few inventories exceeding the past two centuries. Surprisingly enough, this also applies to Europe, a densely populated territory, and to floods, which along with storms are the most common and damage-causing natural hazard in Europe. In addition, existing inventories have often been compiled by scientists and technicians and are used for risk management in a top-down manner, although the participation of all parties concerned has been recognized as a key factor for disaster reduction. To address this double paradox, the present article presents the regional flood risk observatory ORRION for the Alsatian region, north-eastern France, and its very rich data content. Stemming from two successive interdisciplinary and transnational French–German research projects, ORRION was designed as a participative online platform on which information is shared between individuals, stakeholders, engineers, and scientists. This original approach aims at maximizing knowledge capitalization and contributes to building a common knowledge base for flood risk. ORRION is organized by events including all river floods that have likely arisen from a single synoptic situation. For each event, it documents information sources, date of occurrence, causes, and consequences in terms of damage and affected river basins and municipalities. ORRION has contributed toward renewing our knowledge of flood hazard and risk in the target area. Notably, here, long chronicles of floods are derived for 13 rivers, the Rhine and most of its main Alsatian tributaries and for all Alsatian municipalities, most of them since the end of the 15th century but over more than one millennium for the Rhine. Their main characteristics according to various typologies (seasonality, causes, severity, etc.) are analysed. Major developments over the study period related to sources, land use, and/or climate change are identified. The advantages and limitations of the approach are discussed, and the potential to expand both data exploitation and build common flood risk knowledge is outlined.
- Article
(12571 KB) - Full-text XML
- BibTeX
- EndNote


Analyses of long data series are a prerequisite for any effective management of natural hazards. They facilitate our understanding of the spatial and temporal dimensions of natural hazards and the relationship between intensity and frequency and, thus, help in evaluating reference scenarios for the definition of zoning maps or the design of defence structures. Today, the need to capitalize on historical information regarding natural phenomena and related damage over long time periods is therefore a priority among researchers and risk managers (e.g. Stediger and Cohn, 1986; Naulet et al., 2005; Payrastre et al., 2011; Wilhelm et al., 2018). In order to complete instrumental series, generally limited to a few decades, historical analysis is increasingly used to reconstruct chronologies (i.e. temporal distribution of past events) and understand the dynamics of the potentially damage-causing phenomena over several centuries. In practice, however, spatially and temporally comprehensive databases dedicated to natural hazards are relatively rare (e.g. Giacona et al., 2017), even in the case of hydrological risks (e.g. Guzzetti and Tonelli, 2004; Brázdil et al., 2006; Hilker et al., 2009; Martin, 2010; Wetter et al., 2011; Lang et al., 2012; Kjeldsen et al., 2014; Veale et al., 2017).
From a different perspective, the information on natural hazards that is available to the public is generally summed up by researchers and/or managers. Furthermore, it more often than not remains limited to the mapping of hazard-prone areas (e.g. InfoTerre, 2017, Internet portal managed by the French Geological Survey) and to mentions of remarkable and/or severe phenomena (e.g. French historical flood database, BDHI, 2017, http://bdhi.fr/; French avalanche database, Bourova et al., 2016). More rarely, comprehensive records in a given territory are offered (e.g. a historical database of floods in the lower Rhône River catchment, France, HISTRHONE database, 2017, https://histrhone.cerege.fr/; French National Observatory for Natural Risks, Observatoire National des Risques Naturels, http://www.onrn.fr (last access: 20 June 2018) 2015; the British Hydrological Events database, 2019, http://www.cbhe.hydrology.org.uk/index.php). All these databases only partially contribute to detailed knowledge based on the memory of the past. Instead, information is transferred in a one-way top-down manner, from experts to the public, to which “expert knowledge” (Höppner et al., 2012) is exposed without a clear logic of dialogue (Martin, 2006). Very few databases and platforms have been created to date as tools for sharing knowledge with mutual benefit between citizens, stakeholders, technicians, and scientists (e.g. Sangster et al., 2018).
Yet, the importance of public involvement and participation in environmental decision-making is now widely acknowledged and promoted, especially regarding risk management and/or knowledge capitalization (Scarwell and Laganier, 2004; Kenyon, 2007; Koehler and Koontz, 2008; Fournier, 2010; Collombat, 2012; When et al., 2015). Participative knowledge capitalization is particularly relevant in the European context of flood risk management. Indeed, many major floods have occurred in Europe during the past centuries but also since the beginning of the 21st century (Hilker et al., 2009; Glaser et al., 2010; IPCC, 2014). These floods caused an estimated EUR 150 billion of damage between 2002 and 2013 (Collet, 2014), costs that could increase in the near future due to global change (Glaser, 2014). As a consequence, the European Floods Directive of 2007 – Directive 2007/60/EC – jointly established by the European Parliament and the Council of the European Union proposed a paradigm shift (Albrecht, 2016; European Union, 2007). It introduced the need to reduce the consequences of floods using an integrated risk management approach that goes far beyond merely refined risk mapping. Specifically, it is considered essential that the different actors, including the public, work together (European Union, 2007; Challies et al., 2016; Evers et al., 2016).
Fulfilling the wish of the European Floods Directive to establish closer cooperation between the European Union countries on this question, the French–German research programmes ANR-DFG TRANSRISK (2008–2011) and TRANSRISK2 (2014–2017) involved researchers from both the University of Haute-Alsace, Mulhouse (France), and the University of Freiburg im Breisgau (Germany). The interdisciplinary project team included hydrologists, climatologists, geographers, and historians. The TRANSRISK project thus made it possible to create a transnational database of historical floods in the south of the Rhine basin from the end of the 15th century to the present day. The data collected could then be used to address several scientific questions at different spatial and temporal scales. For instance, the data were used as a basis for a quantitative and qualitative analysis of the floods that have affected the major European rivers since the 16th century (Glaser et al., 2010). Also, Himmelsbach et al. (2015) conducted a study of the floods of the Rhine River and of its main French and German tributaries across the study area of the TRANSRISK research programme. These authors presented a statistical summary of the flood chronology, determined the meteorological causes for the occurrence of the floods, and proposed a cartographic representation of some of the major floods. More specific studies proposed a flood classification model valid in the long term, focusing on the specific analysis of the 1910 flood and using geohistorical data to analyse legal hazard mapping procedures and address the change in risk over time and space (Martin et al., 2015a, b; 2017). Despite this broad outlook, however, a detailed analysis of floods that have affected all major rivers in this territory is still lacking.
The TRANSRISK2 project expanded the study area. It also defined as a specific goal the strengthening of the collaboration between local authorities and relevant administrations in terms of flood risk management. More broadly, it aimed at involving all the stakeholders concerned. During the project, the information required to implement the Flood Risk Prevention Plan (PPRI), the Flood Prevention Action Programme (PAPI), and local flood risk management strategies (Directive 2007/60/EC) was provided to the services in charge of these programmes. In return, the latter contributed to the database by providing feedback from their archives or from local populations.
It is in this context that the participative database ORRION (Regional Observatory of Flood Risks) was launched. As a first step, currently, it only considers the French part of the study area (e.g. the Alsace region within its 2015 administrative boundaries). This original initiative was elaborated with the dual objective of (a) making the information collected by the research programmes available to everyone and (b) gathering information from all those involved in the local risk area. Indeed, it is believed that by collecting the different types of knowledge (expert, layperson, administrative, and scientific), one can hope to achieve a global, integrated approach to the risk problem (Decrop, 1997). The TRANSRISK2 research programme aims, in particular, at establishing the risk in its territory through the enhancement and sharing of local knowledge. It must be noted that this process, especially concerning the online and open-access information, takes place in the context of a clear lack of public knowledge regarding flood risk in the Alsace region (Martin et al., 2015a). Indeed, during the national survey on risk perception carried out by the IFEN in 2005, Alsatian inhabitants demonstrated their singularity by declaring that, in their opinion, earthquakes were the risks to which they were the most exposed (Roy, 2005). However, according to the Alsatian public authorities, flood risk (including urban runoff, flash floods, and rising groundwater) is likely to affect more than half of the Alsatian townships, including the major cities of Strasbourg and Mulhouse, even though their city centre has not been flooded since the end of the 19th century (Martin et al., 2017).
The current article presents this original approach, involving both the creation of a database within the framework of a basic research project and the process by which it has been made available to the wider public who can enrich it in return. To address the need for developing long territorialized hazard and risk chronologies, the proposed analysis uses the information gathered, making it possible to highlight the main characteristics of the floods that have affected the Alsace, mostly since the end of the 15th century but even before that period for a few rivers and over more than one millennium for the Rhine River. After providing a brief overview of the territorial context of the study area, special attention is paid to presenting the data entered in ORRION as well as to the structure of the sharing platform. For detailed analyses, two specific classifications are proposed to further distinguish the floods based on the rivers that were affected and the damage reported. Simple statistical methods are then systematically applied to infer the main patterns in flood causes, consequences, spatial extent, temporal distribution, and seasonality, etc. Further analyses at the scale of selected rivers and municipalities are also presented. All these illustrate the potential of ORRION, both for providing useful data to risk managers and for further improving our geophysical and socio-economical understanding of flood risk in the target area. Finally, the main outcomes, advantages, and limits of the work are discussed, and further perspectives are suggested.
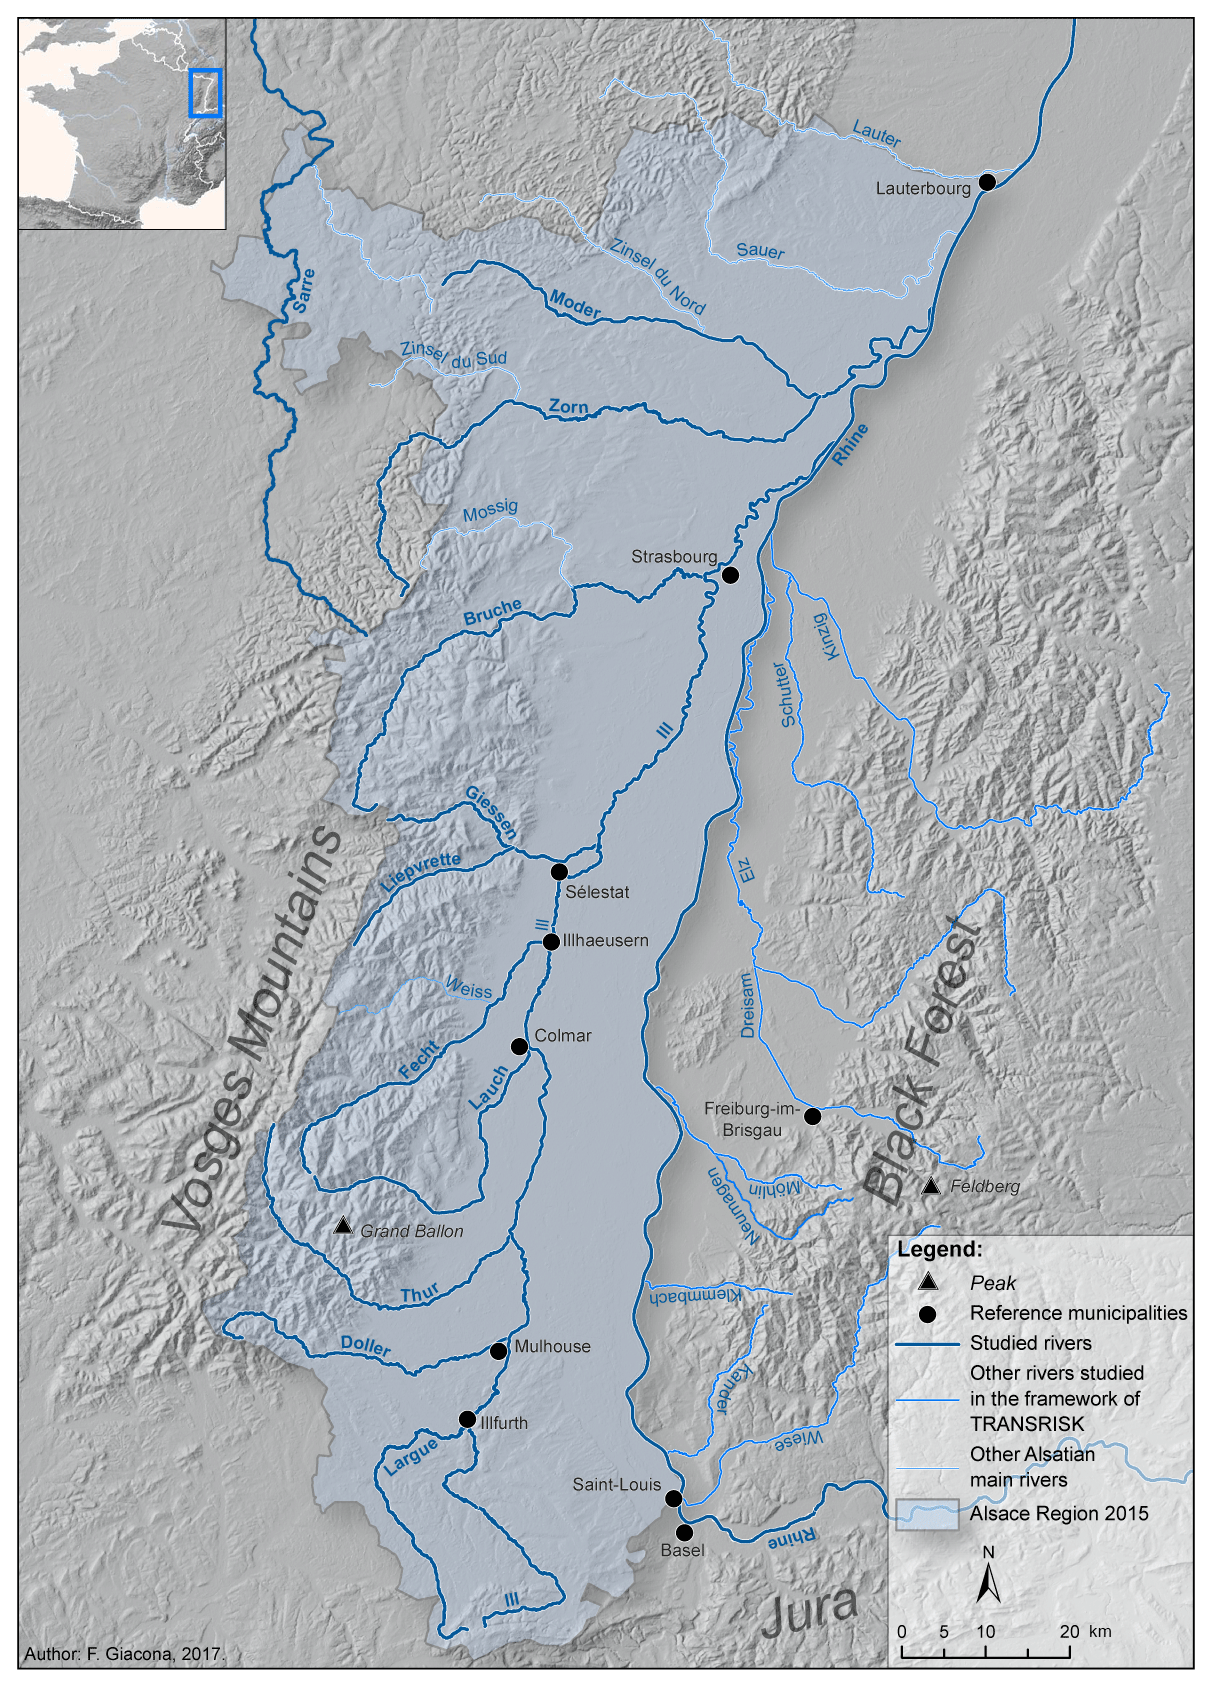
Figure 1Presentation of the studied area.
The study area, the Alsace, is located in north-eastern France, in the French part of the Upper Rhine Valley (Fig. 1). It extends over 200 km between Saint Louis in the south and Lauterbourg in the north, with a width of around 50 km from the Vosges Mountains in the west to the Rhine in the east. The highest mountain is the Grand Ballon (1424 m a.s.l.), and the average elevation of the Alsace plain is around 150 m a.s.l (from 300 m a.s.l. in the south to 110 m a.s.l. in the north), with a slight slope toward the Rhine. The area is under the influence of prevailing westerly winds, and the Alsace Plain is situated in the transition area of maritime to continental climate (Minářová, 2013). Topography has a strong effect on the spatial distribution of precipitation. According to records from meteorological stations available at a daily frequency since ca. 1950 (for some even over a much longer period), the annual precipitation is around 2200 mm a−1 in the south of the Vosges Mountains and less than 550 mm a−1 at Colmar, one of the driest regions in France. Precipitation is also heterogeneous within the Alsatian plain. The southern part of the plain has a high precipitation amount because of the Belfort Gap and the absence of mountain relief. This is the same in the north-western part – the Alsace Bossue – where the Vosges Mountains are lower. Precipitation levels reach a maximum in the spring and summer and a minimum in autumn and winter. Furthermore, the moist western air masses and the prevalent temperature conditions allow for the accumulation of a deep snow cover in the Vosges Mountains in winter, but its seasonal developments are frequently perturbed by temperature oscillations around the freezing level, even at the highest elevations (Giacona et al., 2017). This makes rain-on-snow likely any time during winter and spring.
The Alsace has different soil types: loess and filtering soil (sands, gravels, and limes), among others, forming a mosaic pattern in the hillsides beneath the Vosges Mountains as a result of a complex structural geology with fractures and faults. This leads to a variety of landscapes and land uses: (i) forest in the mountain areas, (ii) vineyards on the hillsides beneath the Vosges Mountains, (iii) grain production (as a result of irrigation) and farming (south and north-western parts) in the plain, and (iv) wetlands due to aquifers along the Rhine and in the “Ried”. Also, the Alsatian hydrographic network is particularly dense. It is composed of two systems (Rhine and Ill rivers), which both flow toward the North. The Ill River flows into the Rhine in the north of Strasbourg. Because of the density of this hydrographic network, the low elevation, and the nature of the ground, the soils in the plain are regularly strained by waterlogging (particularly in the wetlands located between the Rhine and the Ill rivers). Indeed, many rivers are affected by groundwater aquifers, in particular by the Upper Rhine alluvial aquifer (Europe's most important due to its extent, depth, and volume of water stored) and smaller aquifers accompanying some of the major tributaries of the Rhine. Relationships between rivers and aquifers are thus also important. As a result of the diversity in the topography, climate, soil, and land-use conditions, a large number of hydrological process and flood types (localization, spatial extent, origin, duration, etc.) are likely to occur (Himmelsbach et al., 2015).
On the other hand, Alsatian settlements are ancient, population is dense, and urbanization is important in both the plain and the valleys (Alsace is the third highest French region in terms of population density and urbanization), especially along rivers. Indeed, watercourses were already used by proto-industrial activities (sawmill, mill, metallurgy, etc.) and then by industry, especially the textile and chemical industries. The more recent development of commercial and industrial zones in flood-prone areas is also significant, as is the simultaneous expansion of urbanization in areas now protected by dikes. Over a longer time frame, until the 20th century, river correction and flood mitigation measures were specific and focused on main cities only. As an exception, the Rhine River channel has undergone considerable modifications since the middle of the 19th century in order to limit flow divagations. The presence of many stakes along the Rhine River as well as along its Alsatian tributaries makes them prone to more or less regular flooding. This has led to the existence of sources documenting past floods.
3.1 From the TRANSRISK database to ORRION online
A large part of the information currently stored in ORRION comes from the database built during the TRANSRISK project using geohistorical methods. The latter compiles information derived mainly from the analysis of archives (departmental and communal) as well as from scientific publications, local non-scientific literature, and a few newspapers. The research focused on the main rivers of the Alsace in France (Largue, Ill, Doller, Thur, Fecht, and Lauch) and of the Baden region in Germany (Wiese, Klemmbach, Kander, Neumagen/Möhlin, Dreisam, Elz, Schutter, and Kinzig), as well as on the Rhine River. The database contains more than 3000 entries (for each watercourse, each flood counts as one entry) of varied magnitude and extent. Most of these floods occurred between 1480 and 2015, although a few entries refer to even older floods. Details about the data, the sources, and the historical methodology can be found in Himmelsbach et al. (2015). The tambora.org database provides the data for the German part (Riemann et al., 2015; Glaser et al., 2016).
The TRANSRISK database was designed by researchers for academic purposes. In order to facilitate data sharing, it was decided to build a regional observatory for flood risk (ORRION). The ORRION website was launched in 2015 after its conceptual phase and its construction during 2014. The design of ORRION was guided by a SWOT analysis of flood risk databases already existing at that time: the French National Observatory for Natural Risks, the French database on historical floods (BDHI), the database of the French Restauration des Terrains en Montagne services (2017), and the regional risk observatory in the Provence–Alpes–Côte d'Azur region (south-eastern France). The last one, like our study case, is based not on the French national scale but a regional scale. However, all these databases have a complex or unattractive interface and do not meet the essential requirement of our objectives. Indeed, in these examples, the collaborative aspect concerns government services only, de facto excluding citizens. Conversely, the objective of the ORRION database was not only to make raw data on historical floods in Alsace region available to all stakeholders but also to provide a tool allowing all types of actors to actively take part in the compilations of flood risk knowledge in a collective approach. Quality control of the data collected with this participative approach is a crucial part of the database management work. The team of database administrators verifies possible redundancy with pre-existing information, directly interacts with the information providers, checks by itself the provided sources (e.g. pictures, newspaper articles), and, if necessary, goes on the field for further verifications and/or conducts further archival searches. In practice, the likelihood of many testimonies needs to be investigated in detail, and retrieving the exact date and location of the pictures provided is often a huge and time-consuming work.
3.2 Structure of the ORRION website and presentation of the data
The website ORRION was designed in this sense in partnership with the company CYSTEME. To minimize management difficulties, it is not structured along the lines of a “classic” online database but is built on a CMS structure (WordPress type). It is composed of four main parts (Fig. 2). The home page reflects the territorial establishment of ORRION and provides information regarding local flood risk management procedures. A second page, called “overview,” presents the research programme TRANSRISK (objectives and administrators of the website) and the main characteristics of floods that took place in the Alsace. The third section leads to the database itself. A general map localizes all the floods recorded in the area and gives access to detailed information. A contact form is accessible both on the “database” page and directly on the home page. It allows anyone to contribute to ORRION's comprehensiveness by sharing their information and knowledge about floods in the target area. Of course, information provided this way by online contributors is cross-checked by administrators before it is integrated in the database. As the website is intended to inform and to share information in the particular context of a cross-border territory, it has a bilingual presentation (French and German). With the same perspective of sharing, communicating, and informing, ORRION benefits from a link to a Facebook page intended to increase the visibility and the attractiveness of the website, via, for example, the regular publication of photos (especially public contributions) or former postcards illustrating old floods. Finally, as confirmation of its territorial establishment, since 2017, ORRION has provided information on its home page regarding various ongoing local procedures related to flood risk management, information, and prevention.
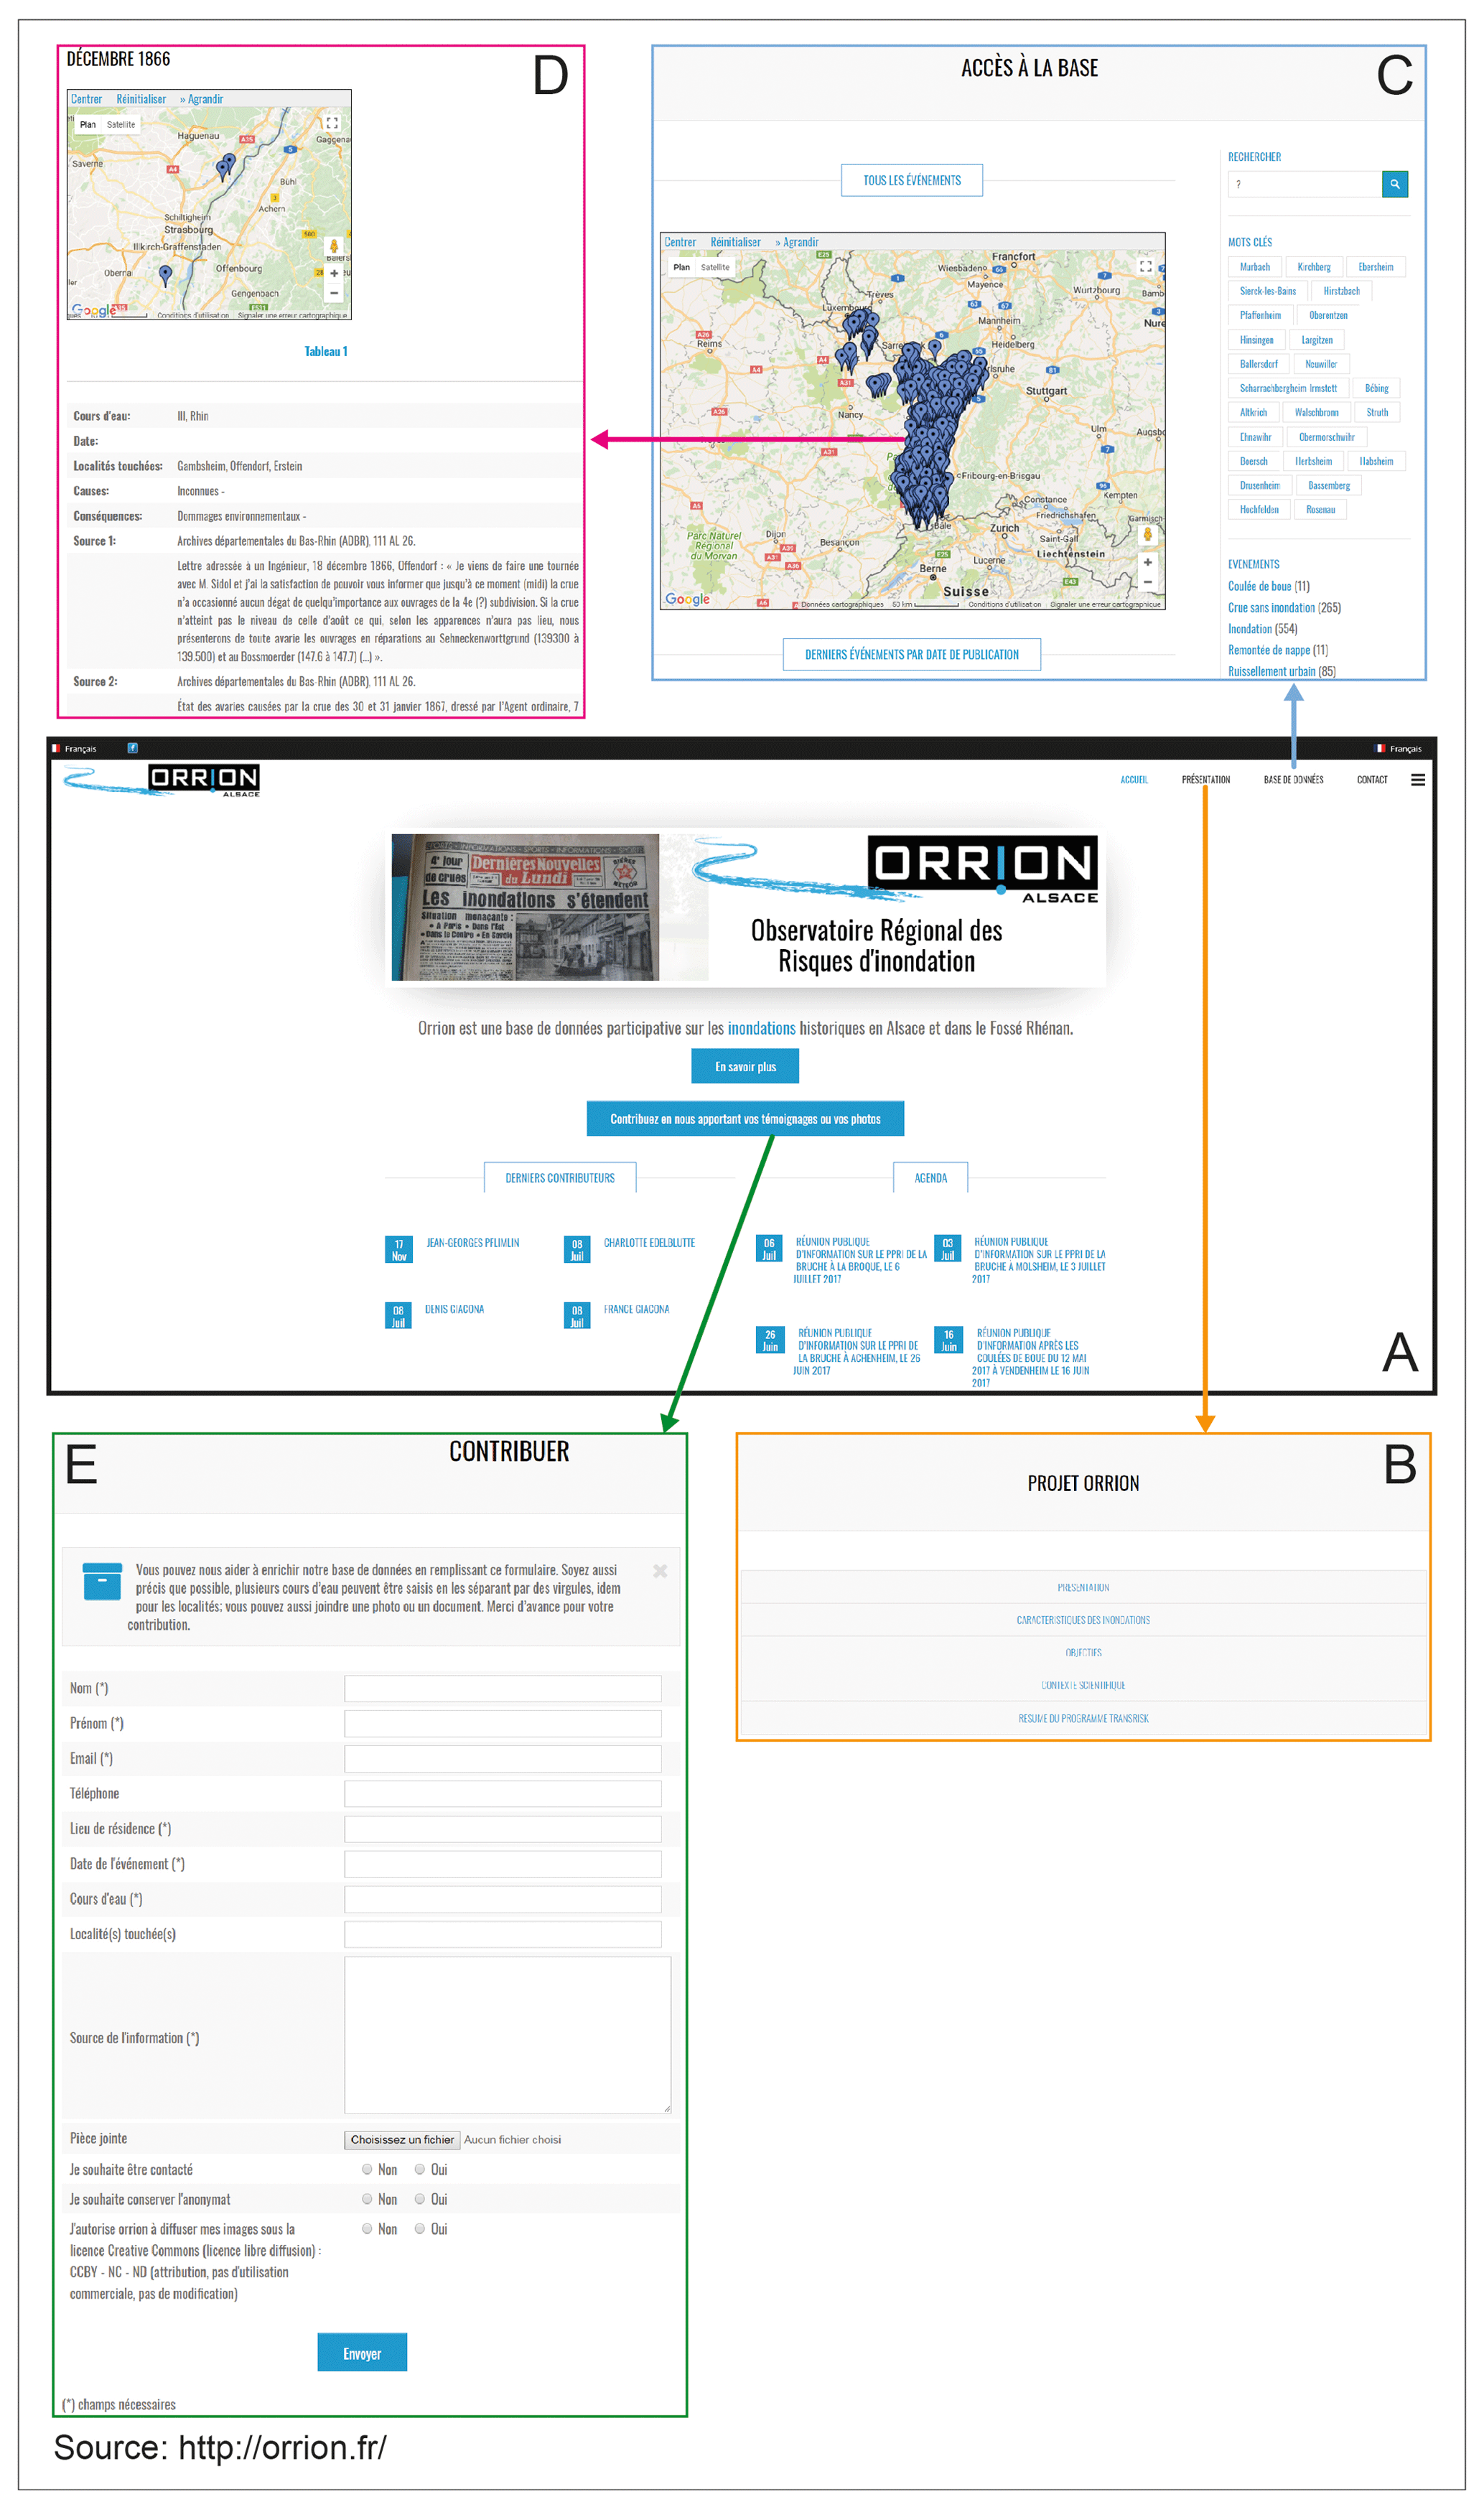
Figure 2ORRION user interface (http://orrion.fr). (a) Home page. (b) Presentation of the project and of the main characteristics of floods in the Alsace region. (c) Database's access page with a general map of all recorded events (© Google Maps). (d) Example of an article corresponding to a specific event (© Google Maps). (e) Contact form to post a participative contribution.
In addition to the participatory nature of the database, three other important factors differentiate the ORRION and TRANSRISK databases. First, the latter deals with the whole Upper Rhine Valley (French and German sides), whereas ORRION focuses only on the French side. Second, supplementary research was carried out for ORRION in the departmental archives of the Bas-Rhin and of the Haut-Rhin, enriching the information on floods that occurred in particular during the 19th and 20th centuries. Third, data are structured by “event” in ORRION: each event on the website corresponds, at the scale of the entire study area, to a set of local floods that likely resulted from the same meteorological drivers (same synoptic situation, similar soil saturation state, etc.). This is why there are far fewer ORRION events than entries in the TRANSRISK database, where each river flood is a single entry. Specifically, each ORRION event includes all rivers where a flood occurred within the same time window of 10 d (the downstream travel time of the flood wave may take several days). As a consequence, an ORRION event may correspond to one river that overflowed in one specific location (or to a more generalized extent) or to a situation in which water overflow has been reported for almost all major Alsatian rivers at the same time and often at several locations along the rivers (Figs. 3–5). Note that, in addition to a variety of river flood types, ORRION also reports on some mass movements due to local storms and on floods by surface runoff or by rising groundwater. Here, however, we focus only on river floods, and thus the latter types of events have not been taken into account.
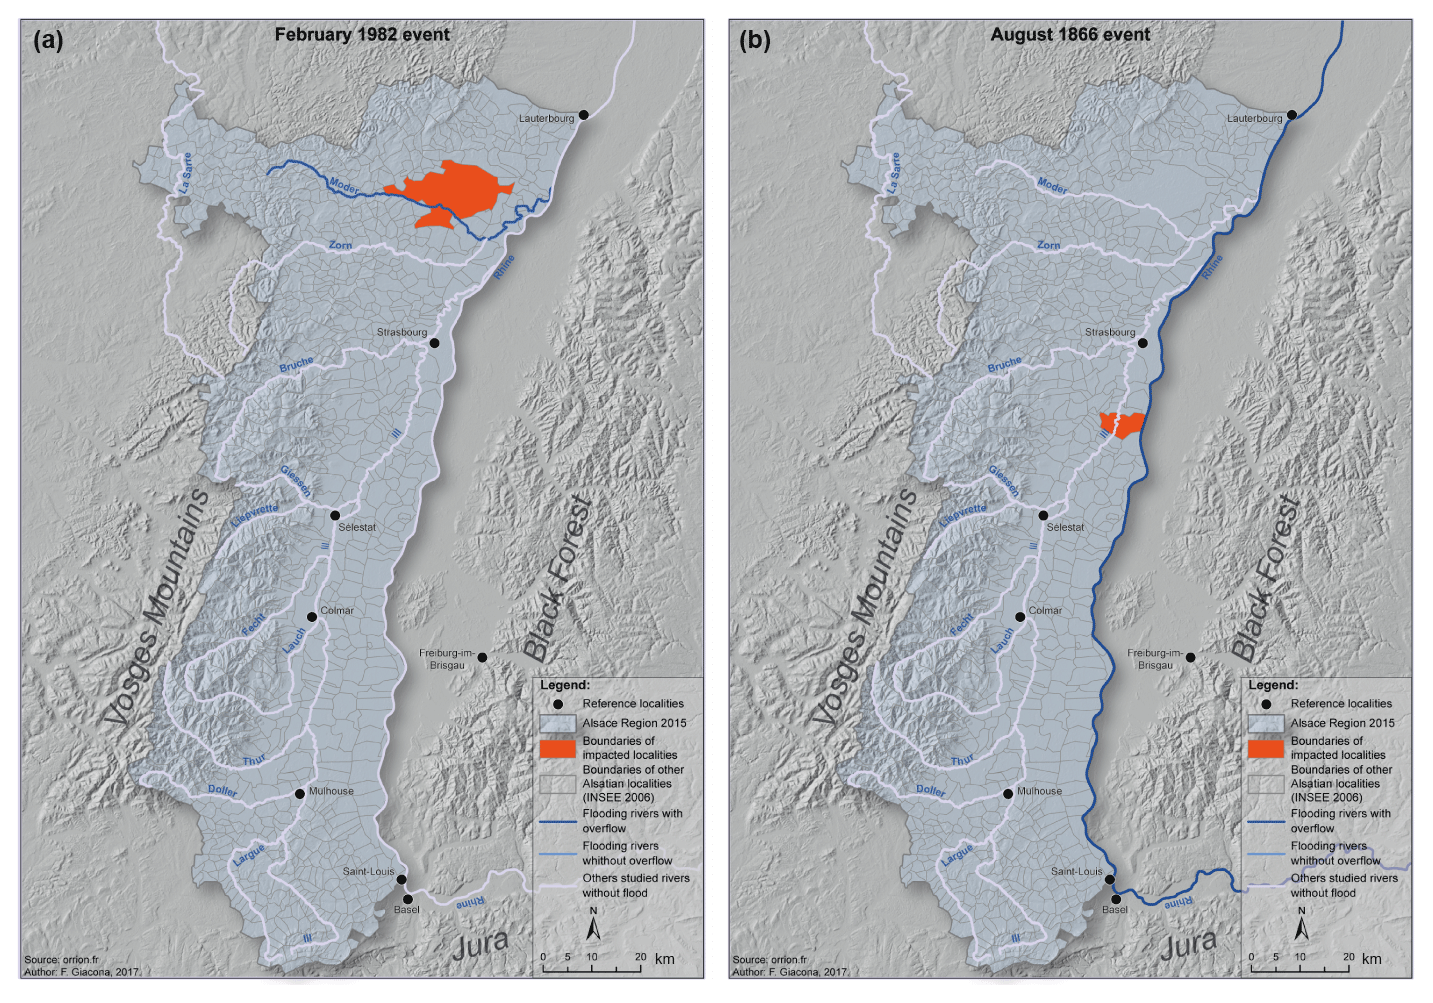
Figure 3Maps of specific class I events. (a) February 1982 event. T configuration (Alsatian tributaries of the Rhine River alone). Extent score: 0. Damage score: 1. Overflowed Moder River caused functional damage and impacted one municipality. This event is attributed to snow melting/thaw and to long-lasting rainfall. It is known from one source. (b) August 1866 event. R configuration (Rhine River alone). Extent score: 0. Damage score: 0. Overflowed Rhine River caused environmental, functional, and material damage and impacted one municipality. This event is attributed to long-lasting rainfall and is known from 43 sources.
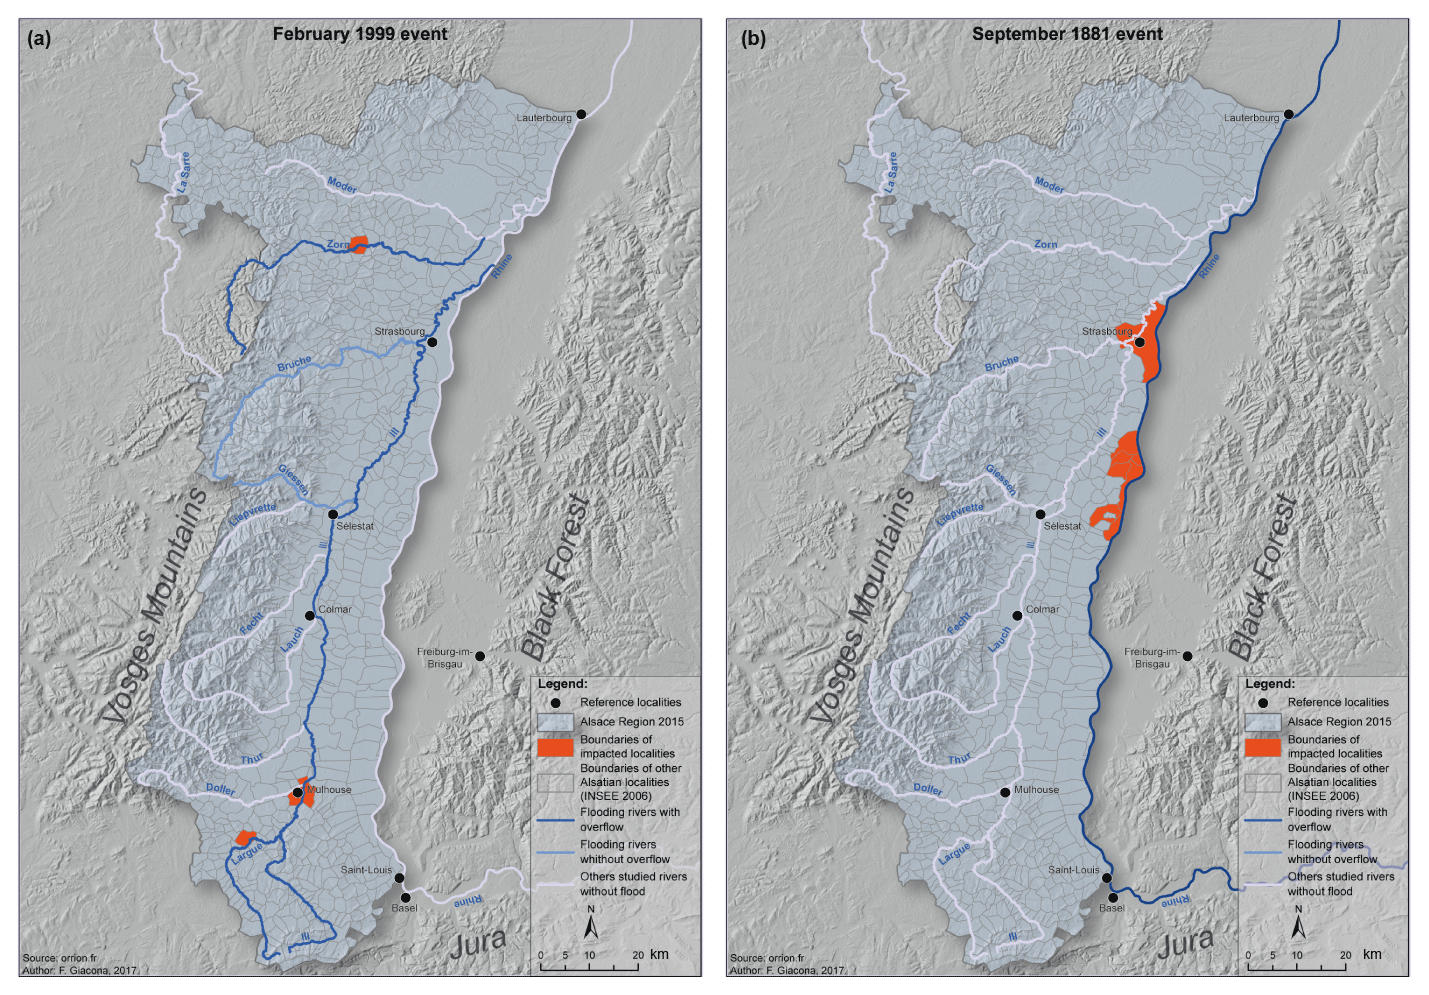
Figure 4Maps of specific class II events. (a) February 1999 event. T configuration (Alsatian tributaries of the Rhine River alone). Extent score: 1. Damage score: 1. Overflowed Largue, Ill, and Zorn rivers caused material damage and impacted three municipalities. Giessen and Bruche rivers were flooded without overflow. This event has unknown causes. It is known from seven sources. (b) September 1881 event. R configuration (Rhine River alone). Extent score: 0. Damage score: 2. Overflowed Rhine River caused environmental, functional, and material damage and impacted eight municipalities. This event is attributed to heavy rainfall and is known from five sources.
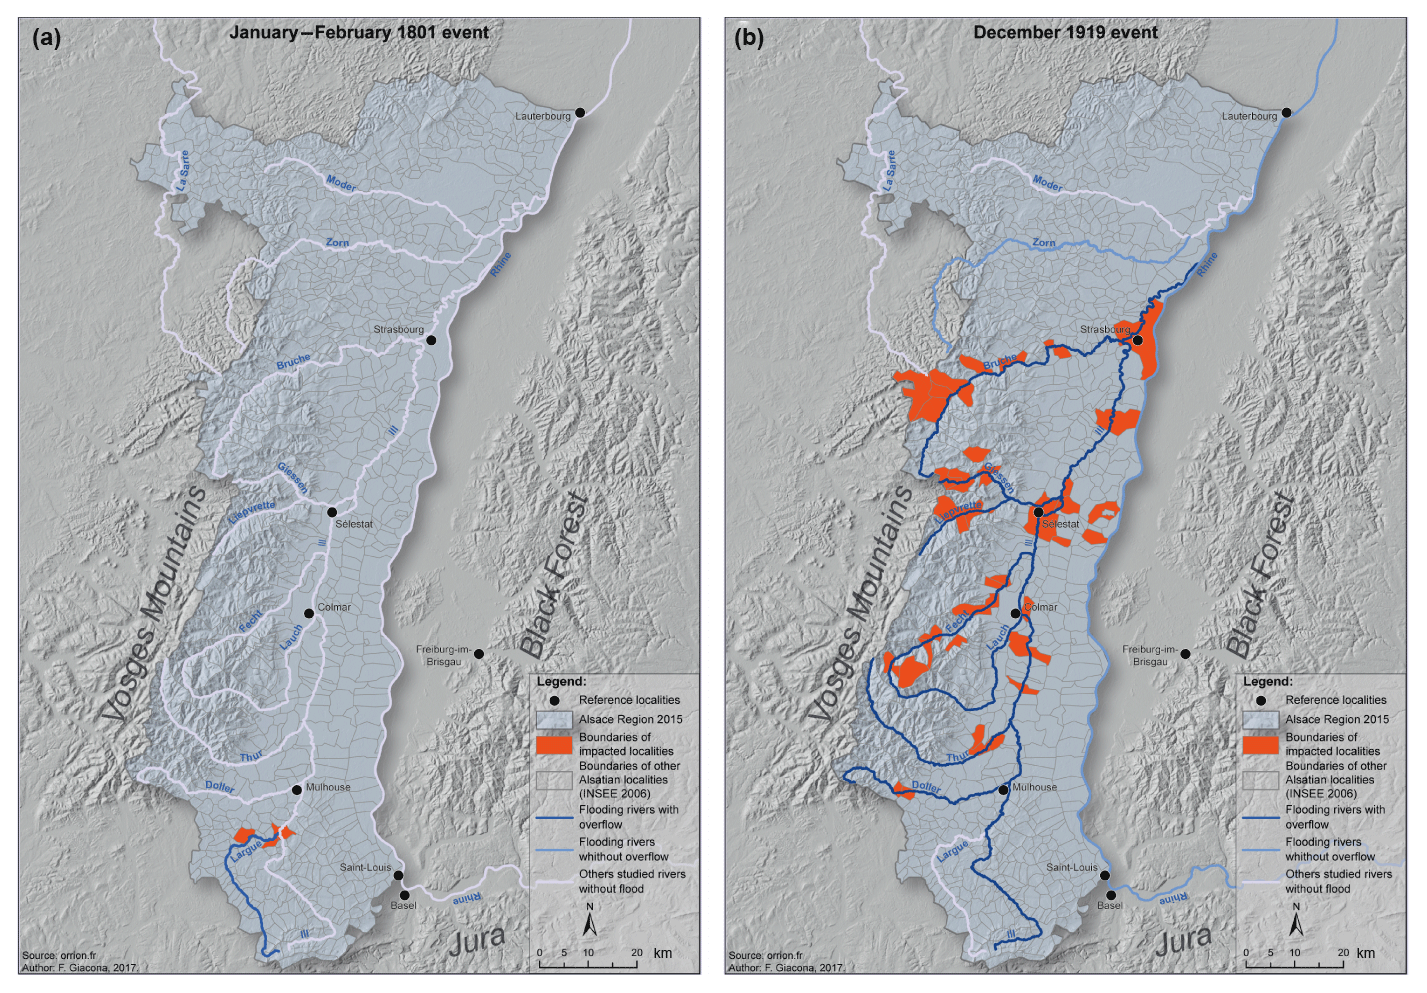
Figure 5Maps of specific class III–IV events. (a) January–February 1801 event. T configuration (Alsatian tributaries of the Rhine River alone). Extent score: 0. Damage score: 2. Class III event. Overflowed Largue River caused environmental damage and impacted five municipalities. This flood is attributed to snow melting/thaw and to heavy rainfall. It is known from one source. (b) December 1919 event. RT configuration (Rhine River and its Alsatian tributaries). Extent score: 2. Damage score: 2. Class IV event. Overflowed Ill, Doller, Thur, Lauch, Fecht, Lièpvrette, Giessen, and Bruche rivers caused human, environmental, functional, and material damage and impacted 45 municipalities. Rhine and Zorn rivers were flooded without overflow. This event is attributed to snow melting/thaw and heavy rainfall and is known from 61 sources.
In ORRION, events were characterized as precisely as possible, taking into account the fact that descriptions in the historical sources are largely heterogeneous, which makes it difficult to produce homogeneous data. Thus, for each event, different fields are filled in when the information is available (Fig. 2d):
-
date of occurrence, i.e. day/month/year, month/year, or year;
-
affected rivers;
-
impacted municipalities;
-
causes, of which one or several causes (if any) can be documented for each event;
-
damage types, which can be human (i.e. with at least one person killed), material, functional, environmental, or unknown and of which zero to four damage types can be documented for each event;
-
number of sources reporting the event;
-
the complete quotes accompanied by their sources.
Moreover, the database structure allows one to include tables and photos via hypertext links (Fig. 2d). The indexing facilitates searches by keywords (years, river names, municipality names, causes, and consequences). According to this aim, lists of terms have been preregistered in order to standardize spellings and denominations and to speed up data entering and browsing. The way of quoting sources has also been harmonized. When the impacted municipalities are known, they are displayed on a map (from © Google) that is attached to each event. This map indicates the global extent of each flood event but not the exact location of the damage that occurred.
3.3 Further filtering and additional event typologies
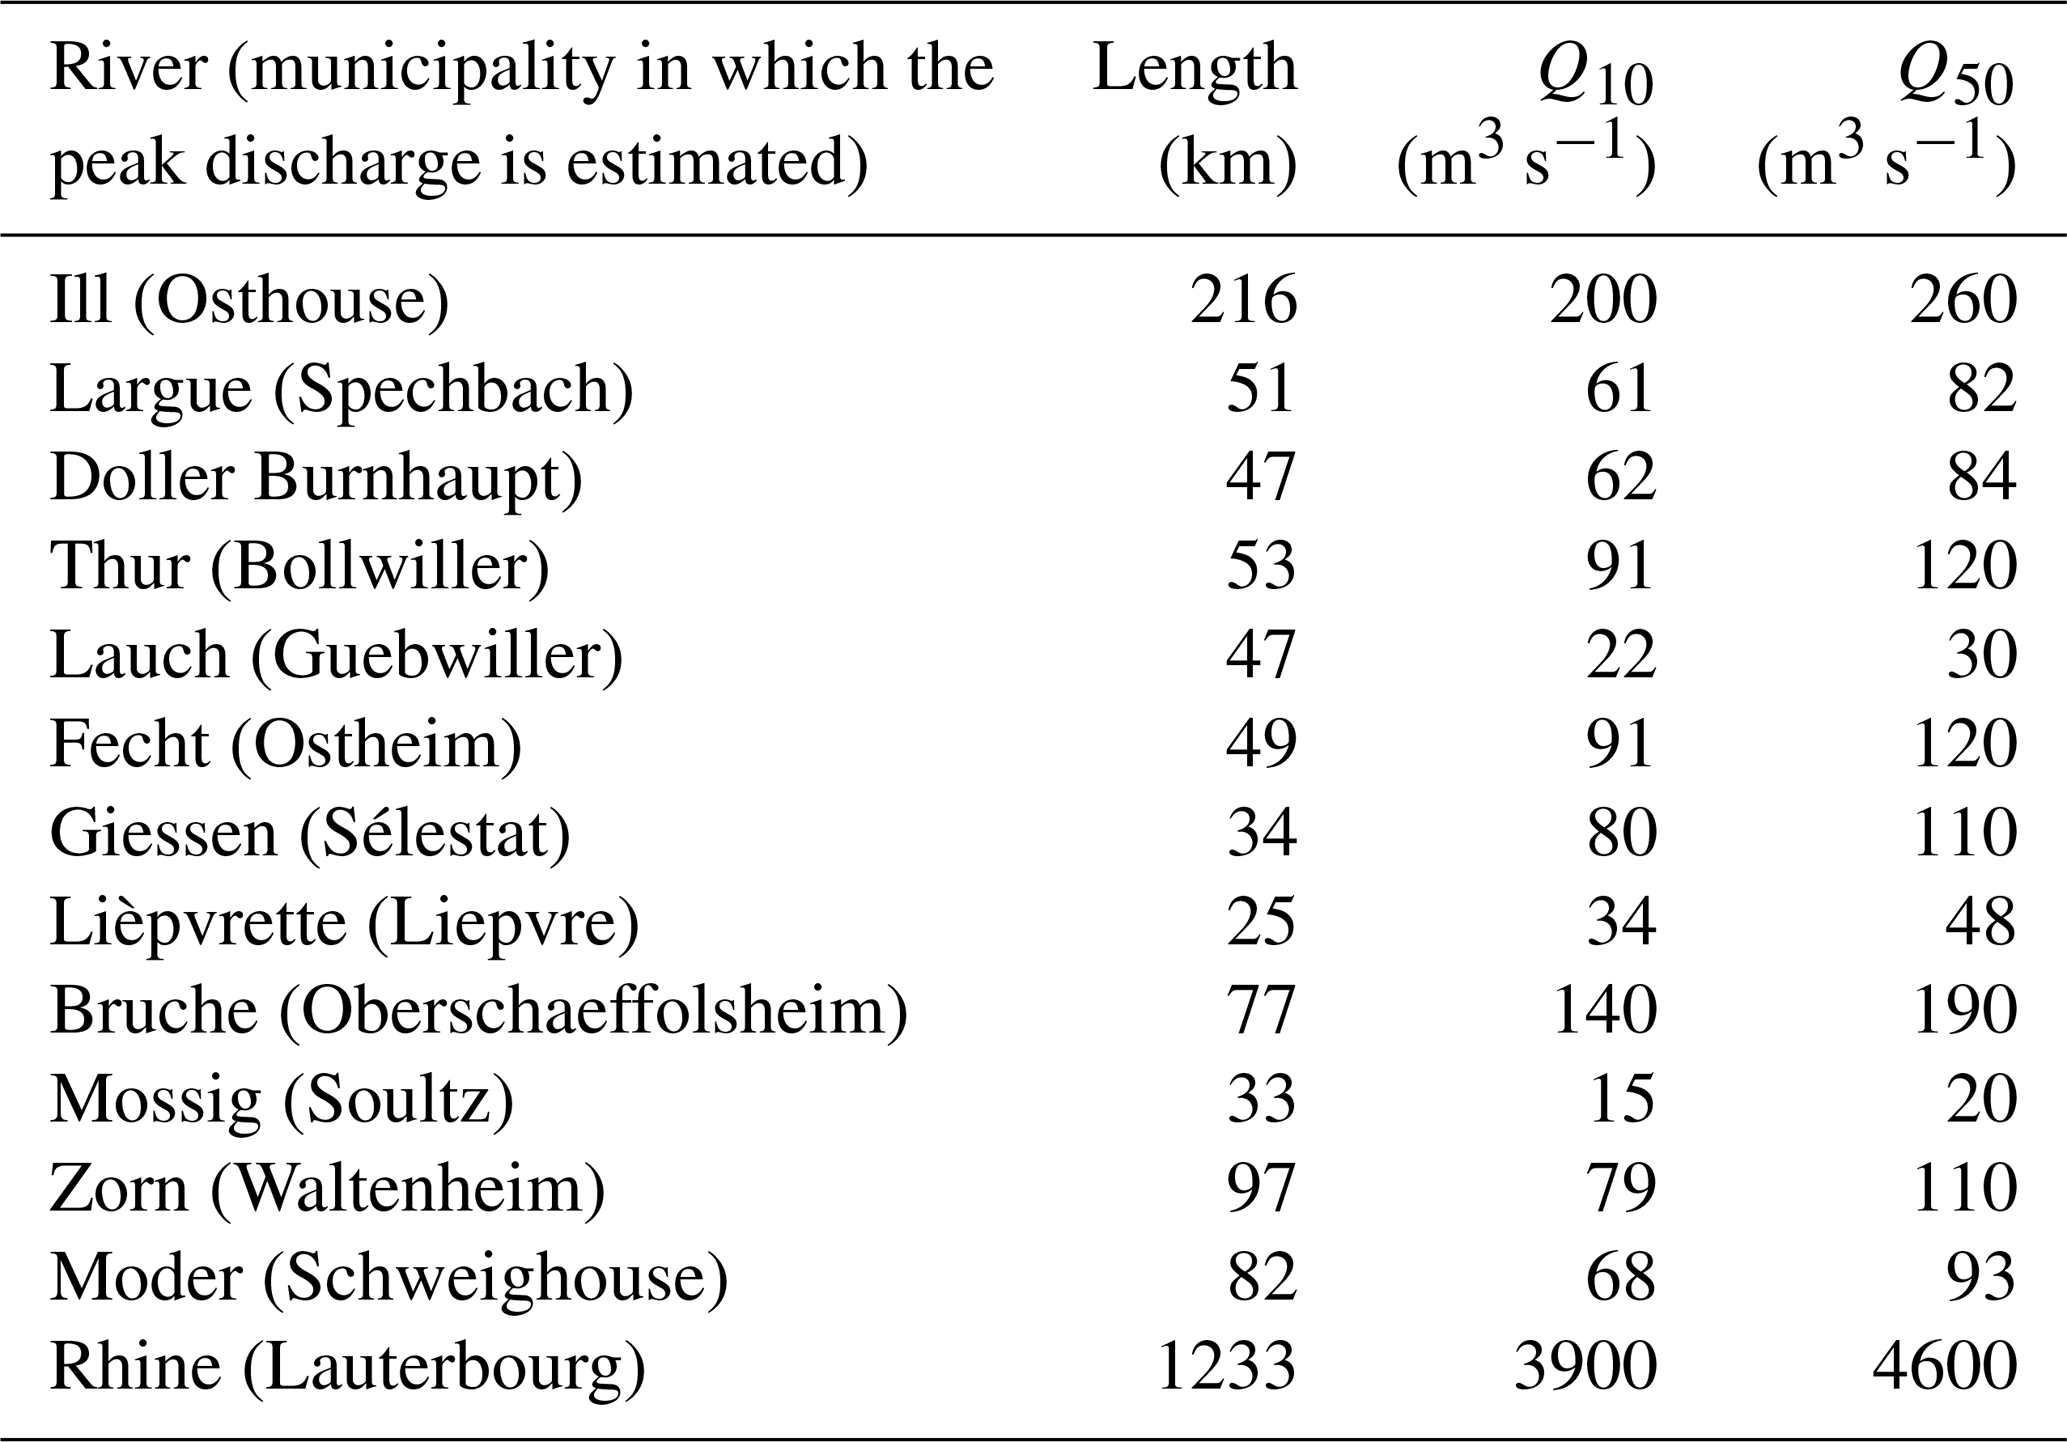
For this specific work, four additional filters were applied for all the ORRION data. First, this article does not consider low-magnitude events during which no river overflowed its banks. Such events were discarded. By contrast, every event during which water overflow occurred for at least one river was retained, as we wanted the most exhaustive overview possible of each event. Hence, for each event, we distinguished between rivers for which flooding without water overflow was described (i.e. simply an “abnormally high” runoff) and rivers with water overflow. Second, this study deals only with floods from overflowing rivers and does not include surface runoff or rising groundwater. As a consequence, from the whole set of flood causes documented in the ORRION database, we retained only heavy rainfall, long-lasting precipitation, snow melting/thaw, ice jams, ice break-up, thunderstorms, and soil saturation. Third, only the municipalities in which water overflow has been explicitly documented are studied. Moreover, these items are defined here according to the list of Alsatian municipalities from the 2006 French National Statistical Institute (INSEE) inventory, knowing that some changes occurred over the long period covered by ORRION such as merging or name changes of a few municipalities. Fourth, the analysis is focused on 13 of the main Alsatian rivers: Sarre, Moder, Zorn, Bruche, Lièpvrette, Giessen, Fecht, Lauch, Thur, Doller, Largue, Ill, and Rhine (Table 1). The Rhine River is a well-known very large European river flowing from Switzerland to the North Sea, the Ill River is one of its important tributaries whose basin encompasses most of the studied area, and the 11 other rivers considered are smaller rivers, most of them being tributaries of the Ill River. To account for ORRION events that do not correspond to these rivers, “other” and “unknown” categories were added. The other category includes two types of rivers:
-
tributaries of the main rivers mentioned earlier;
-
some major rivers for which fewer than 10 floods are known in ORRION and for which a specific analysis would not have been relevant.
In addition, two further classifications of the events were implemented. The first concerns the hydrological configuration of the event: (i) in type R, only the Rhine River is concerned; (ii) in type T, one or several Alsatian tributaries of the Rhine are concerned but not the Rhine itself; (iii) in type RT, both the Rhine and at least one of its Alsatian tributaries are concerned. This leads to one single configuration per event.
Table 1Characteristics of the 13 considered rivers in terms of length and 10- and 50-year return period peak discharge according to local flood prevention plans.
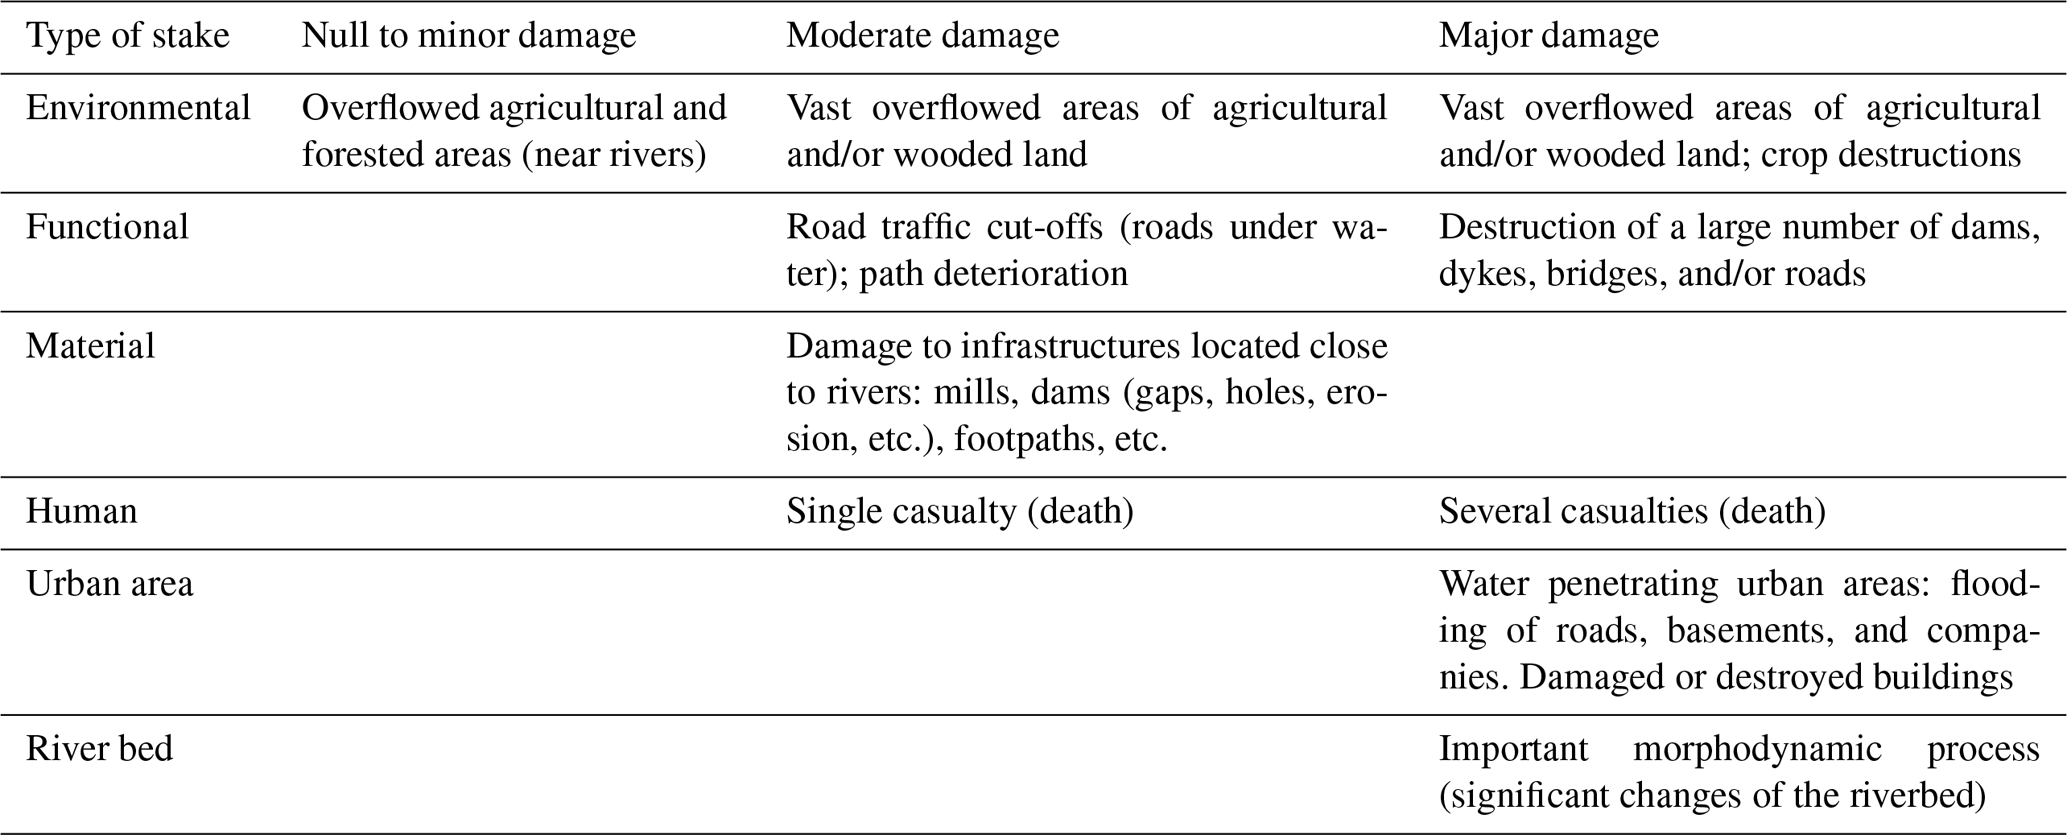
The second classification concerns the severity of the events, taking into account both their spatial extent and the documented damage. Himmelsbach et al. (2015) proposed a classification of flood severity for TRANSRISK events, taking into account the same criteria, plus secondary and tertiary parameters such as the duration of the flood or the mitigation strategies that were implemented. The scale of Himmelsbach et al. (2015) has three levels ranging from “small flood” to “extreme/supra-regional flood.” However, this scale could not be used. For our events, the sources do not often allow the necessary secondary and tertiary criteria to be identified. Indeed, since our study covers a multisecular period, the available data are disparate, both qualitatively and quantitatively. The corpus of events is thus affected by different major types of heterogeneity (Martin et al., 2015a, b): the nature of the sources evolves in time and space, and the mass of documentation tends to increase with time. Moreover, quantitative data are scarce. The classification must therefore be based on qualitative elements easily accessible in the archives over the entire study period. As the sources are essentially related to damage, they generally indicate, in a more or less detailed manner, the consequences of the floods. It is therefore possible to classify past events according to the damage described (Table 2). Taking inspiration from existing approaches (Thema, 2001; Benito et al., 2003; Llasat et al., 2005), we distinguished three classes of damage according to the consequences observed on the natural environment, on infrastructures and on property and people. The level of damage was then coupled with the spatial extent of the floods (local or regional, taking into account both the number of impacted rivers and municipalities).
Table 2Grid used to discriminate observed damage in three levels. Five types of stakes are considered, and for each of them the level of damage is identified (consequences increase from one damage level to another). The retained damage level for the event is the strongest among the different types of stakes.
With this simple multi-criteria approach, we distinguished four classes of event severity (Table 3). Such a classification could be applied to three-quarters of the studied ORRION events. For the other ORRION events studied here, the severity class is considered as being unknown (Table 4). This classification approach is robust because the classification result is the same regardless of whether the spatial extent or the level of damage is considered first.
Table 3Multi-criteria severity scale for flood events. Classification is done according to (1) the level of damage evaluated as detailed in Table 2 and (2) the spatial extent.
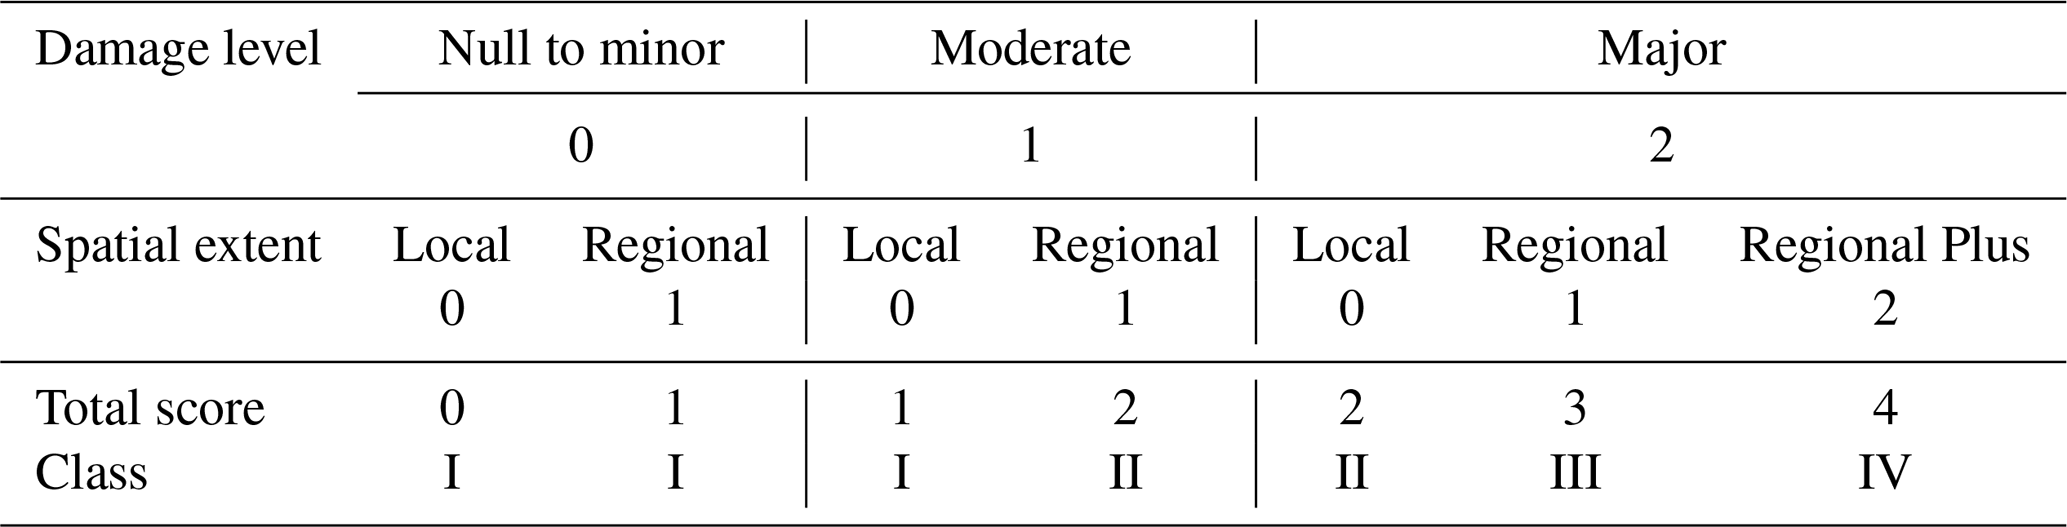
Class I, “small-sized events,” includes floods with a total score of 0 or 1 (Table 3). It corresponds to local events that had no impact to moderate impact and to more regional events that had no or very low impact. Class II, “medium-sized events”, comprises events with a total score of 2. It includes two types of floods: those that caused significant damage but occurred very locally or regionally, and those that caused moderate damage but had a regional extent. Class III, “large-sized events”, brings together the events with a total score of 3 and corresponds to regional floods that have caused extensive damage. Within this third class, we identified a class IV of “extreme-sized events” corresponding to events that impacted at least 20 municipalities (“regional plus” level). Note that it is possible to identify these biggest events only over the last two centuries because the sources are not detailed enough to make comprehensive lists of affected municipalities for older events. Therefore, the fourth class is not set up as an independent class but rather as a product of the third class. Hence, in the following analysis, all class IV events are included in class III, which makes the chronology of class III events a priori more homogeneous in time.
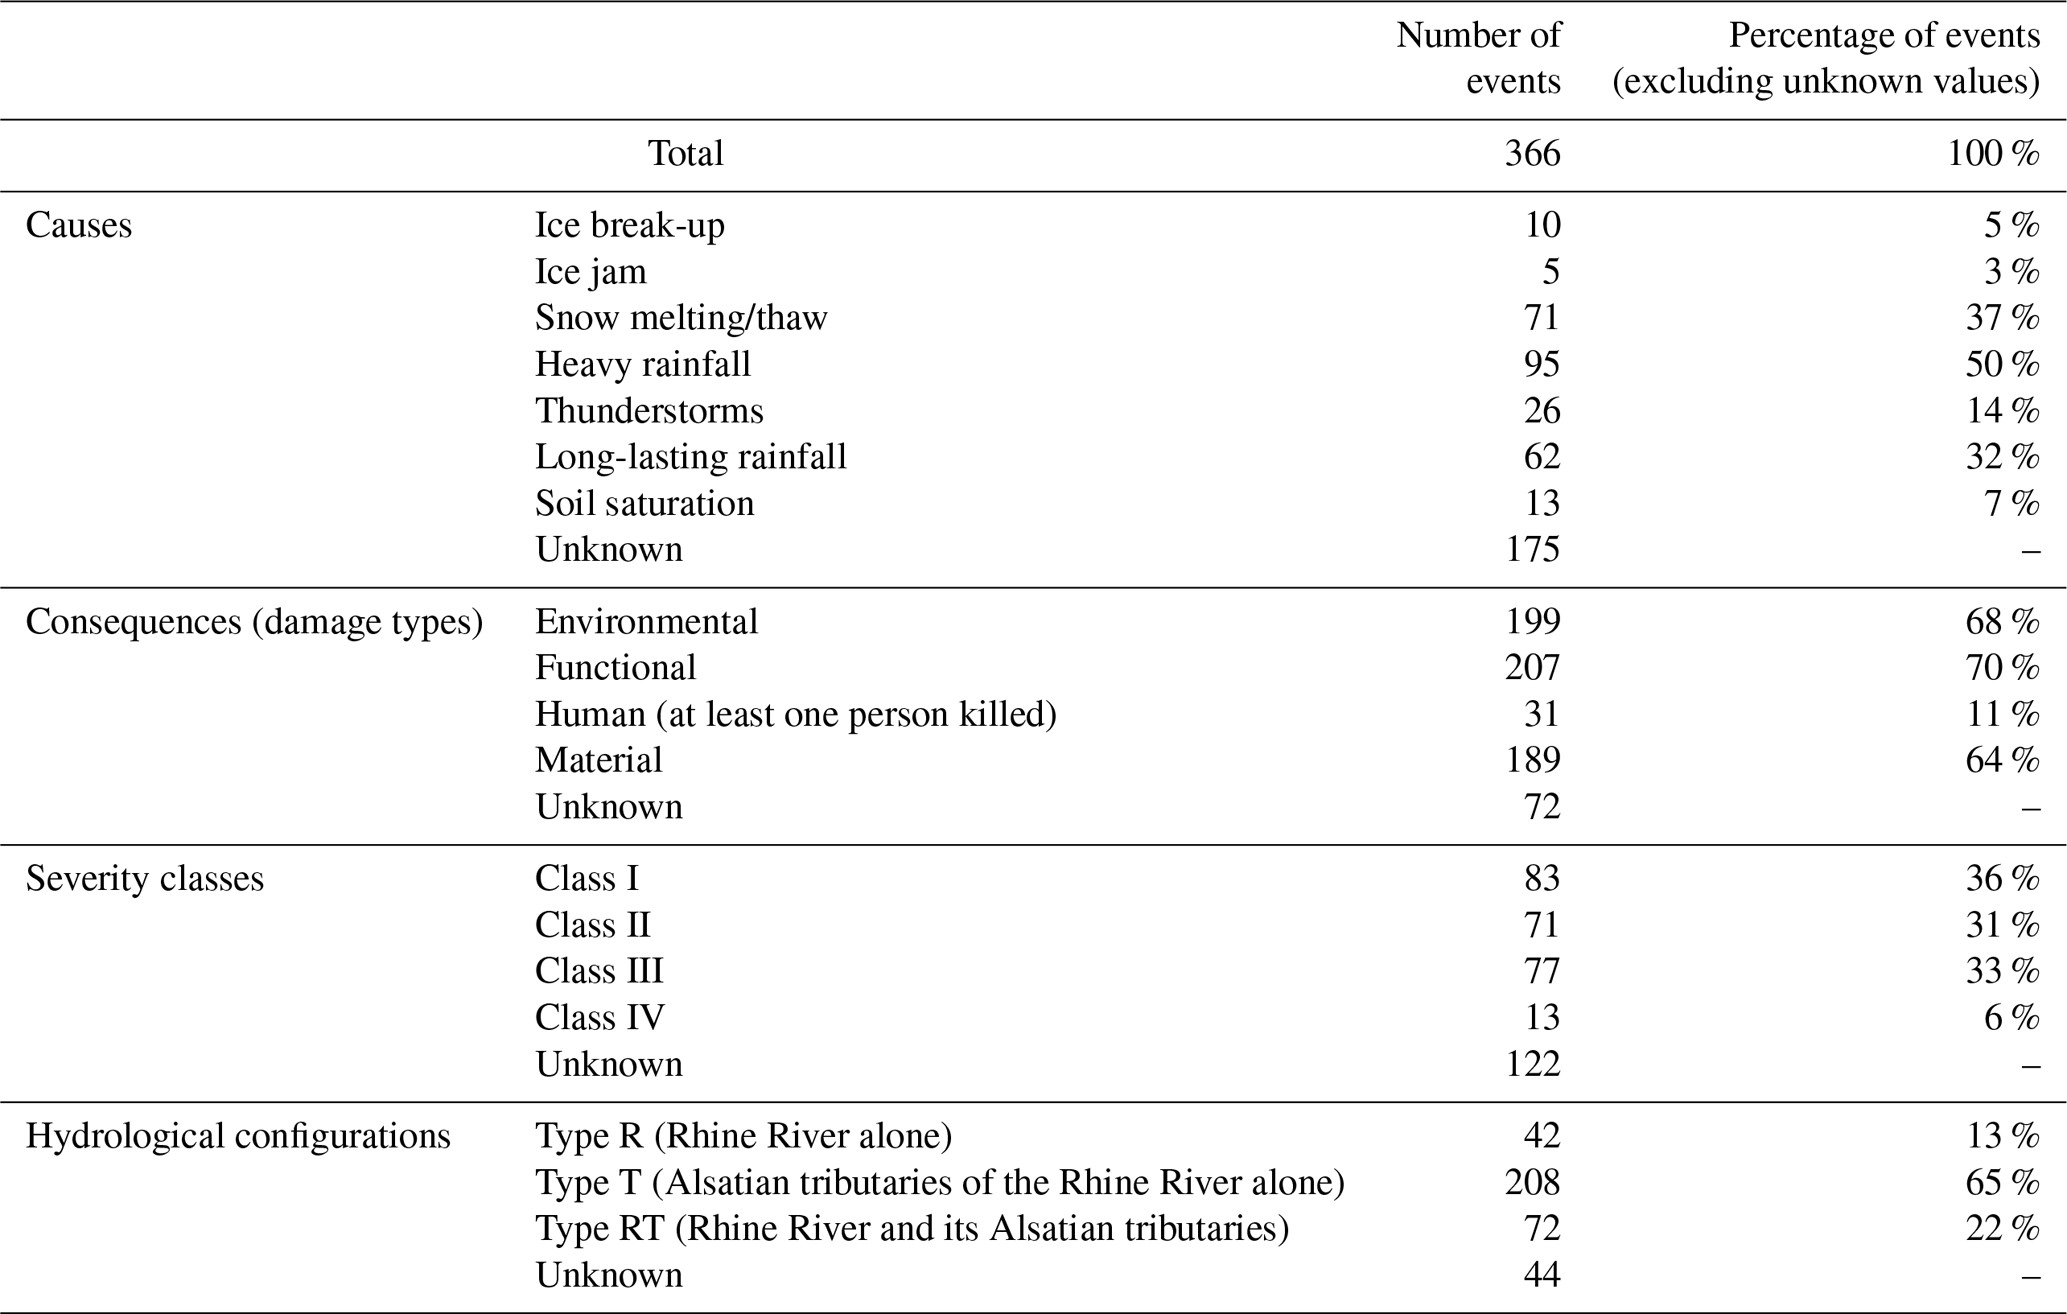
Table 4Characterization of the ORRION events according to their causes, consequences, severity class, and hydrological configuration. Please refer to text and Tables 2–3 for a full definition of the different categories.
3.4 Statistical analyses
The complete data set of studied ORRION events was analysed with a basic statistical approach in order to identify the major spatio-temporal patterns of flood hazard and risk. First, for each event, additional binary variables representing presence and absence were created. This led to a data set from which deriving chronologies for the different types of events, rivers, and municipalities was straightforward. Also, visualization of the spatial characteristics of each event under a GIS environment was possible (Figs. 3–5). Specifically, we transformed the causes, damage types, hydrological configuration, and severity class variables into vectors of presence (1) and absence (0) variables whose lengths depend on the considered group (e.g. 5 for the severity class group: the four classes and the unknown case). Also, presence and absence codes were given for each event in all municipalities (the 2006 Alsatian ones from INSEE). Namely, a municipality got assigned 1 for a given event if it was affected by the event and 0 if not. Finally, for each event, presence and absence codes were given for the 13 rivers we specifically consider plus for a binary variable corresponding to all other rivers specifically known in the target area as well as for a binary variable corresponding to other unknown rivers (if any). Also, for each of these 15 cases (our 13 rivers, other known rivers and unknown rivers), we distinguished events “with overflow”, events “without overflow”, and events “with and without overflow”, leading 45 binary variables per event related to rivers. From these presence and absence sequences, all specific time series (number of events per year with specific severity class, cause, in a specific river or municipality, etc.) were built.
Large timescale variations in the different chronologies were highlighted. For each time series (e.g. number of events per year in the river Rhine as a function of time), we computed 51- and 31-year moving averages. For an easier visual interpretation, rather than superposing the raw counts and these moving averages on the corresponding figures, we rescaled the latter as follows: for each series, the moving average values were multiplied by the ratio between the raw annual count standard deviation and the moving average standard deviation. This gives both the row series and the rescaled moving average series the same variance, i.e. the same range of variability on the plots.
After checking specific cases for which standard variance decompositions and conditional mean evaluations led to similar conclusions (Table 5 and Sect. 4.1), we evaluated association between all of our variable pairs with the classic Pearson cross product-moment coefficient. This was systematically done for all quantitative variables and for presence and absence variables. Also, association between events and between time series were both investigated. The first highlights to which extent couples of variables are related over the complete set of analysed events and the second how the time series of events of given characteristics are related over the study period. Note that, for rivers, for simplicity, only presence and absence variables summing up events with and without overflow were considered at this stage (the association between flood events with overflow only or without overflow only is not considered in what follows). Seasonality was included in the association analysis on the basis of the interannual monthly distribution (percentage of events that have occurred each calendar month). This analysis highlights, for example, to which extent couples or rivers or municipalities tend to be affected by the same flood events, to which extent certain variables tend to be related (e.g. damage and source numbers), and if certain characteristics of the events have markedly evolved through time.
We are aware that, for non-continuous variables, using the Pearson cross product-moment coefficient is sometimes criticized. However, for binary variables, computation of standard alternative metrics such as Spearman's rank correlation or Kendall's tau leads to the same measure of association between the two variables (how they behave together or not). For a couple of variables with one binary and one continuous variable, or with one binary and one discrete unbounded variable, the point-biserial coefficient is the standard choice, but it can also be rewritten at the Pearson cross product-moment coefficient. For a couple of variables with at least one categorical variable taking potentially more than two values, this is no longer true, and one may need to look at other association metrics such as the tetrachronic correlation. This refinement is, however, not required in our case because of our variable definition strategy.
A related tricky point is how to rigorously test the significance of the association. Having one or two binary variables within the Pearson cross product-moment coefficient does not blur the convergence of its estimate on the basis of standard asymptotic likelihood theorems. Since we have rather large samples at hand (366 events, more than 500 years of data), this is therefore not an issue. The problem comes when considering that, for binary variables, the same association measure may be seen, as said before, either through Spearman's rank correlation, Kendall's tau, or the Pearson cross product-moment coefficient. Similarly, with one binary and one continuous variable, the same association measure is either the point-biserial or the Pearson coefficient. These different quantities have different asymptotic distributions for their estimates providing different p values and hence different answers to the same question of stating if the variables are associated or not. In full rigour, one should therefore perform different tests in each case corresponding to the different way of seeing each measure. However, due to the very high number of couples of variables we consider, we only assessed association significance in each case on the basis of the classical Student test. This has the advantage of being applicable in a unified way to all the couples of variables we consider (binary or binary/continuous) and of providing a single yes/no answer in each case. Even if each individual result should therefore be considered with care and may need to be investigated in more detail to definitively answer a specific question (e.g. the linkage between a given cause and a given severity class, or between two local series), this systematic strategy provides a comprehensive first assessment of the main patterns in space and time in the large amount of data at hand. Statistical significance was classically set at 0.05 (5 % level of the t test).
4.1 Overview
The corpus comprises 366 events that occurred between the years 886 and 2014. In total, 382 Alsatian municipalities were impacted at least once (Fig. 6). Of these, 19 experienced at least 10 events, among which four municipalities stand out: Strasbourg with 48 events, Mulhouse with 36 events, Colmar with 29 events, and Illfurth with 24 events (Figs. 6, 7f). Overall, the impacted municipalities are logically mostly located along the Rhine River and its tributaries, the Ill River, and the smaller rivers flowing down from the Vosges Mountains. Also, most of them are located in the south of the study region.
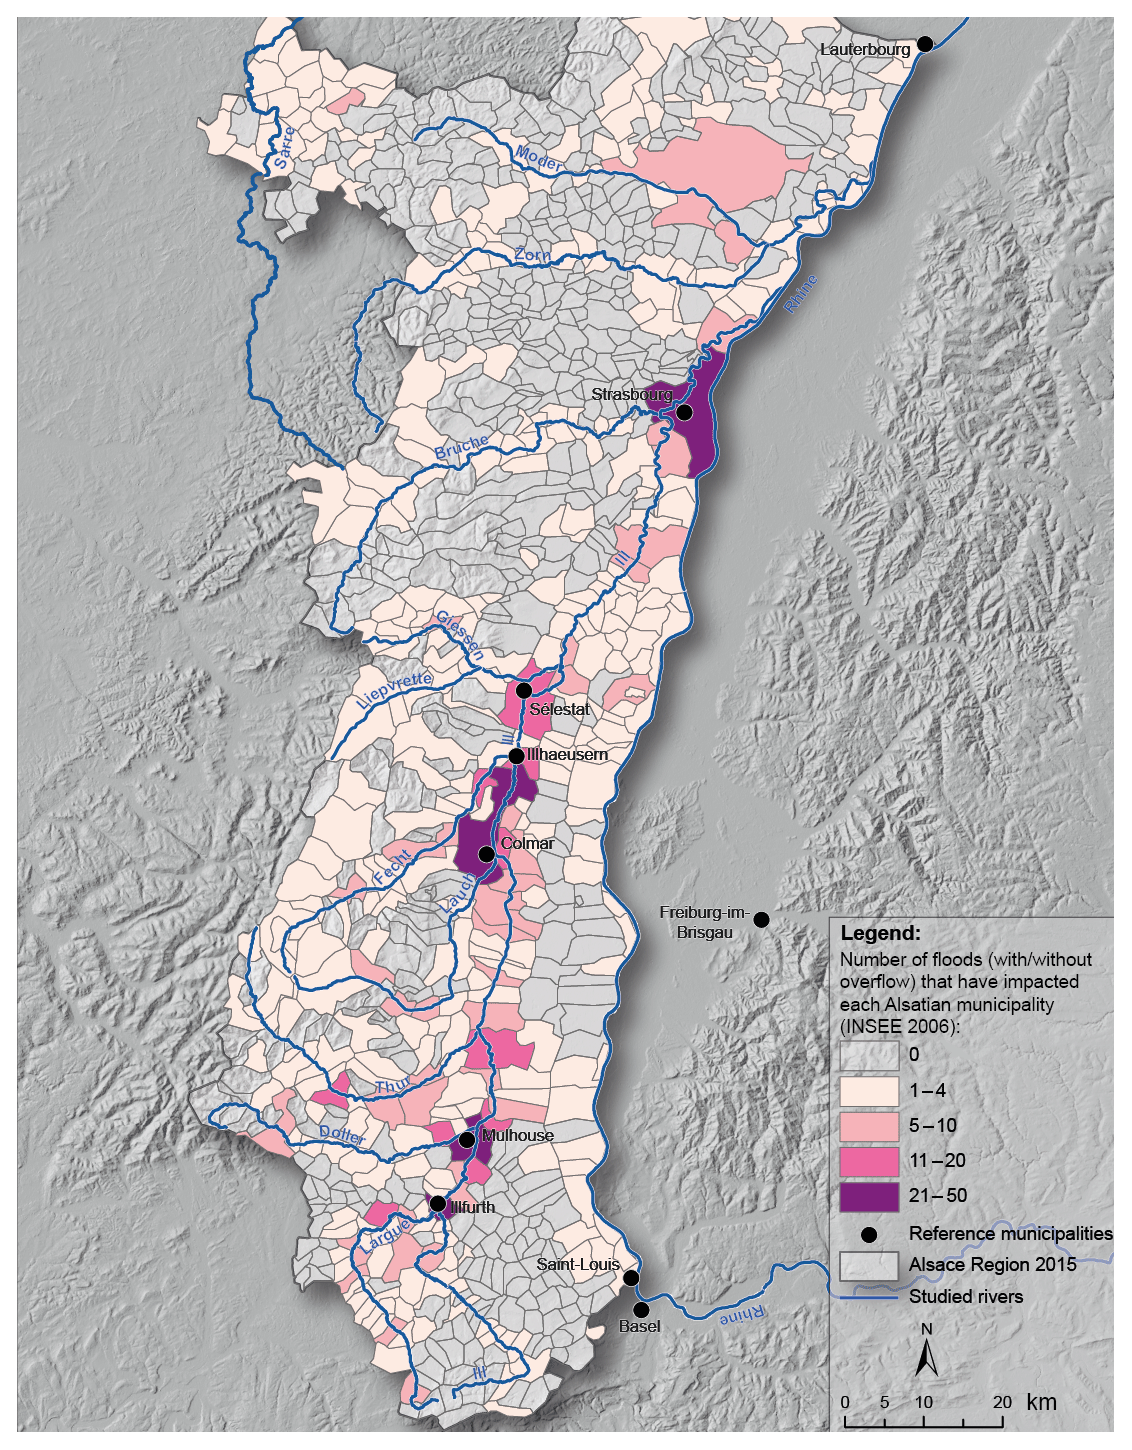
Figure 6Total number of flood events per municipality. For each event, only the municipalities in which water overflow was reported are considered. Most of the overflows concern the 13 rivers specifically studied in this work, but a few correspond to other rivers (smaller rivers and/or rivers with fewer than 10 flood events in the ORRION database).
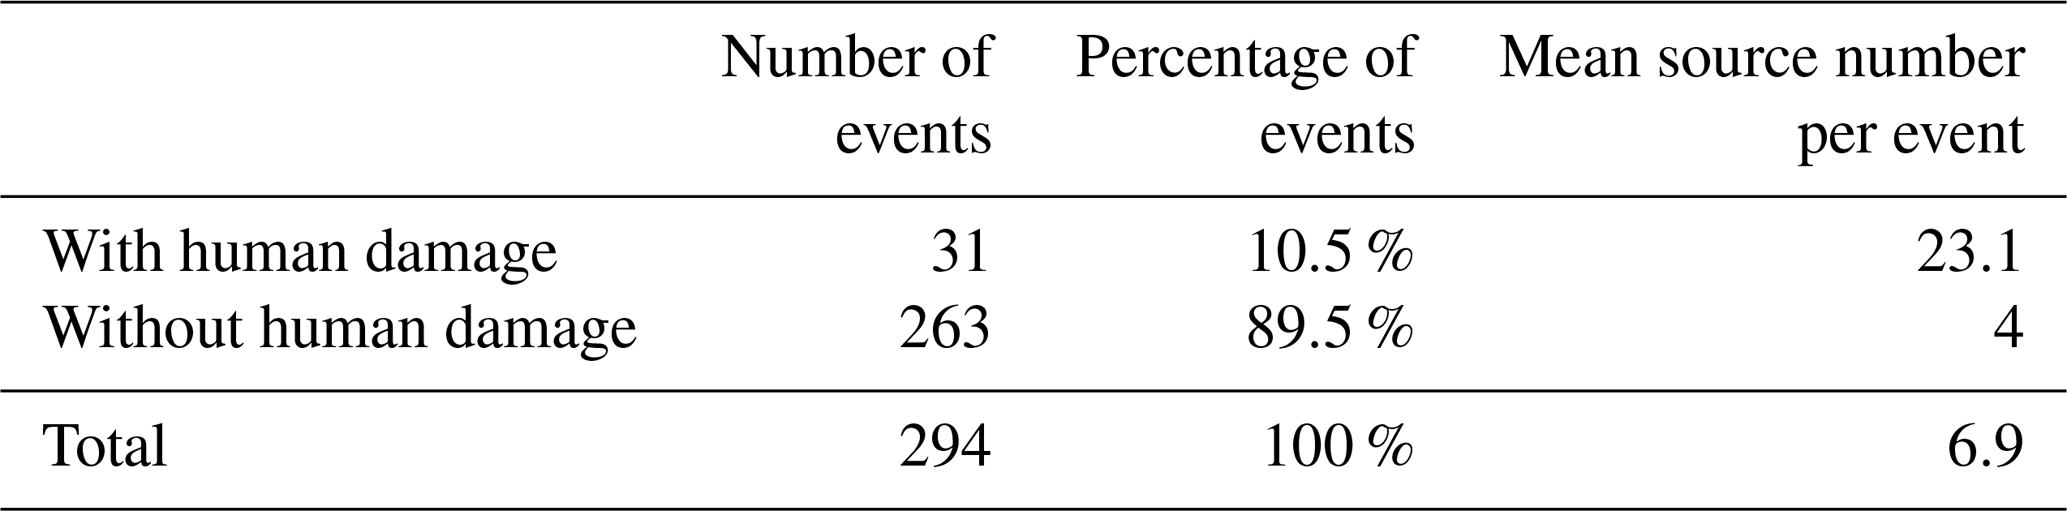
Events are mentioned by 1 to 324 sources (the latter for the September 1852 event). Two-thirds of the events are documented by two or more sources. The events mentioned by a large number of sources are floods that caused damage (especially affecting humans) and that had a large spatial extent. Specifically, source numbers per event are clearly different as a function of the presence and absence of human damage (at least one person killed). Indeed, the one-way analysis of variance (ANOVA) decomposition of the source number per event variable is highly significant (p value of the Fisher test < 10−4), rebutting the assumption of a common population. Similarly, the conditional means of both populations (23.1 sources per event with at least one person killed versus 4 sources per event with no casualties; Table 5) are clearly distinct (p value of the Tukey test < 10−4). Logically, the Pearson cross-product coefficient between the variables' “source number” and “presence of human damage” is +0.26, non-zero at the 0.05 % significance level. According to these converging results, in what follows, association between variables is highlighted on the basis of such significantly positive/negative non-zero coefficient values only. For instance, all damage types are positively associated with the source number variable. There is also a very strong association between the source number variable and the extreme-sized event (Class IV) and large-sized event (Class III) variables (Pearson's coefficient: +0.56 and +0.29, respectively). Finally, it should be noted that the events mentioned by a large number of sources affected both the Rhine and its tributaries in particular (Pearson's coefficient with type RT: +0.27).
Table 5Source number related to each event as a function of the presence and absence of human damage (at least one person killed). Only the events for which both the source number and the human damage presence and absence information are known are considered in the counts and for the evaluation of conditional means.
4.2 Well-identified causes and consequences
Most of the analysed events can be attributed to heavy rainfall (50 % of the known values), snow melting/thaw (37 %), long-lasting rainfall (32 %), and thunderstorms (14 %). Soil saturation, ice break-up, and ice jams were more rarely involved, for 7 %, 5 %, and 3 % of the events, respectively (Table 4). Several causes (up to four) could play a role in a single event. For ca. 20 % of the events, at least two causes could be documented, which represents a little less than a half of the events for which at least one cause could be identified (Fig. 7a).
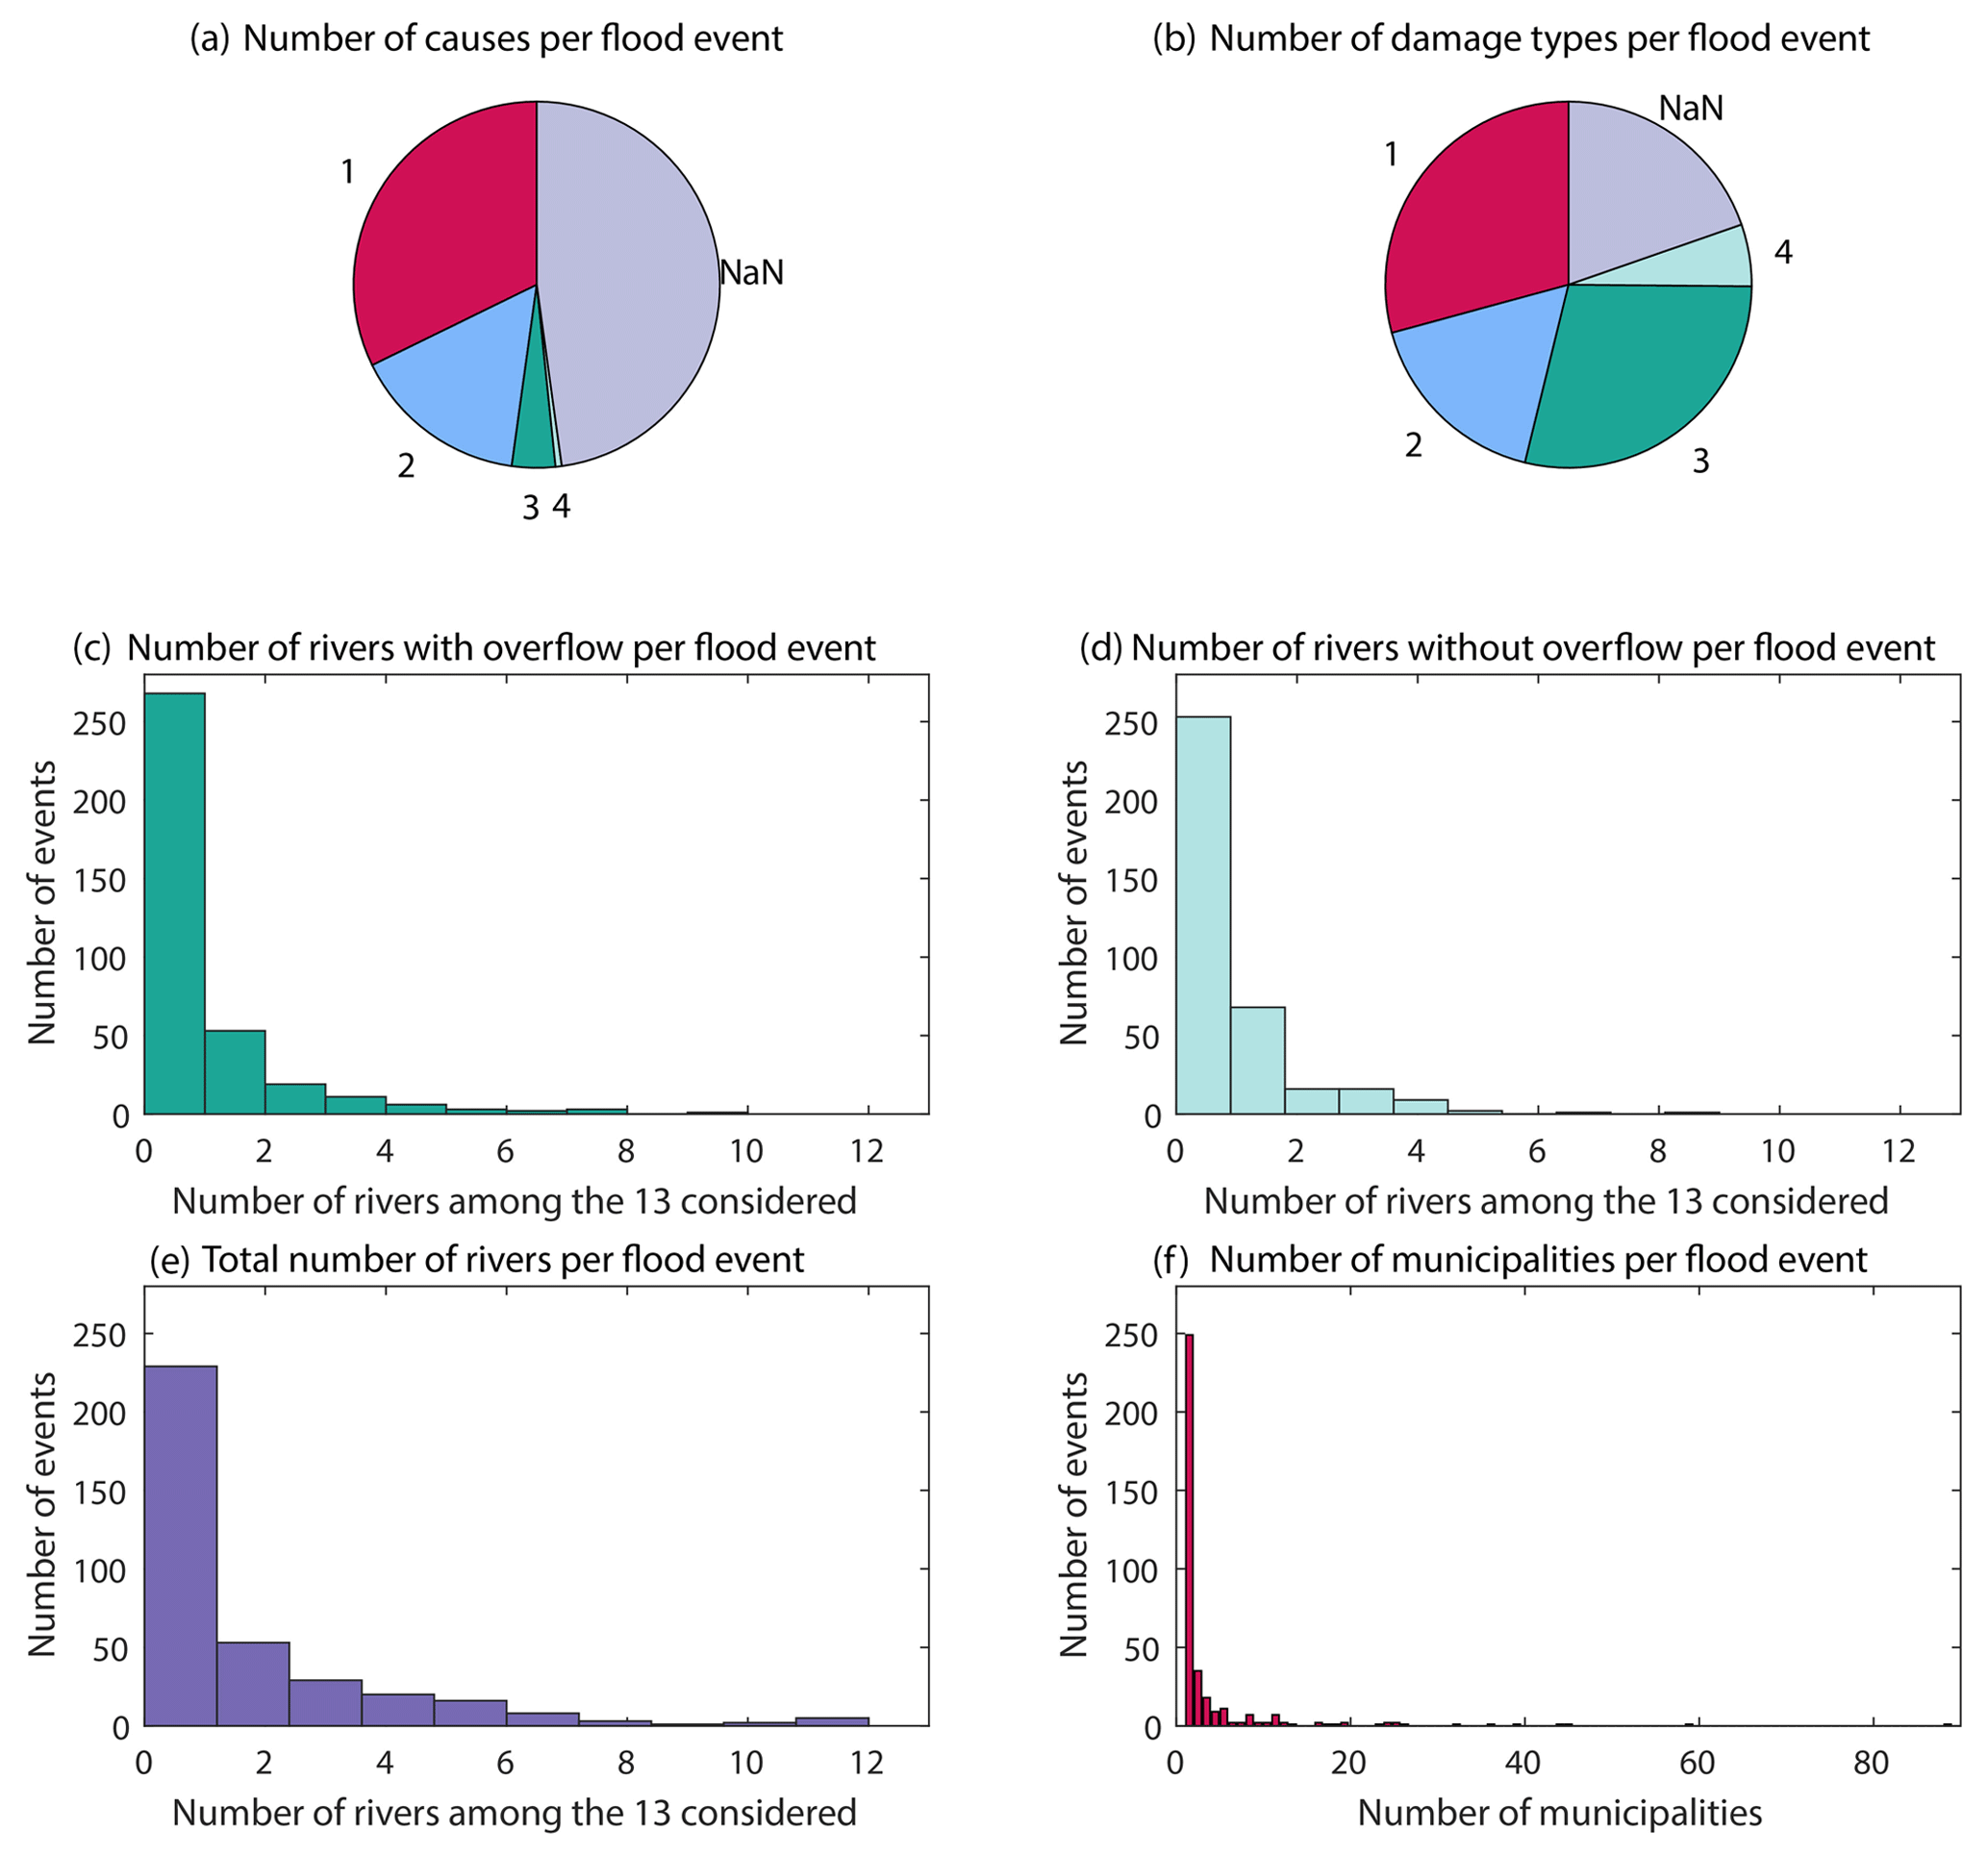
Figure 7Characterization of the interannual distribution of events. (a) Number of documented causes. (b) Number of documented damage types; number of rivers per event among the 13 rivers studied (c) with water overflow, (d) without water overflow, and (e) with and without water overflow. (f) Number of impacted municipalities, whereby only those where water overflow has been reported are considered.
Moreover, the high-severity events (Class III) mainly occurred during specific conditions: snow melting/thaw, heavy rainfall, and soil saturation (Pearson's coefficient: +0.35, +0.29, and +0.24, respectively). Also, the most severe events were due to a combination of unfavourable elements (Pearson's coefficient: +0.51 and +0.29 between the variables class III and class IV and the number of causes, respectively).
Flood events generated all kinds of damage: human, material, functional, and environmental (Table 4). Over the entire study period, 70 % of the events (known values) led to functional damage (mostly road being cut off), 68 % to environmental damage (mostly flooding of agricultural lands and forests), and 64 % to material damage (mostly destruction of buildings and bridges). In total, 11 % of the recorded events killed at least one person; 19.7 % of the events had consequences that were not fully documented. Most of the events (51.1 %) caused several types of damage, and for 5.5 % of the events, all four damage types were documented (Fig. 7b).
4.3 Spatial extent: from local to widespread events
The extent of the events was often local. Indeed, in 44 % of the events only one river among the 13 we specifically studied was affected. In this case, by definition, overflow would have occurred for the river. However, single events sometimes had a much larger extent, with the two largest events affecting up to 12 of our 13 rivers (December 1947 to January 1948 and January 1955). For such events, rivers with and without overflow were distinguished, leading to specific distributions of number of rivers per event with and without overflow (Figs. 7c–e). Regarding the hydrological configuration (Table 4), the recorded events mostly affected only the Alsatian tributaries of the Rhine (type T, 65 % of the events) and, to a lesser extent, both the Rhine and its Alsatian tributaries (type RT, 22 %). The Rhine alone (type R) is documented to have been affected in only 13 % of the events for which this typology could be determined.
In detail, for our 13 main rivers, between 15 and 163 events are known (considering floods with and without overflow; Table 6). The Ill River leads, with 163 events, followed by the Rhine River with 103 events, and the Largue River with 76 events. Extensive research was not carried out for the Sarre and the Lièpvrette rivers. This explains, at least partly, the smaller number of events for these rivers, i.e. 15 and 19, respectively. However, the distinction between floods with and without overflow is important. The proportion of floods without overflow is, for some rivers, very high in comparison with the total number of floods. This is notably the case for the Rhine River, for which around 42 % of the recorded events correspond to floods without overflow and, even more so, for the Bruche River, for which this proportion reaches 73 %.
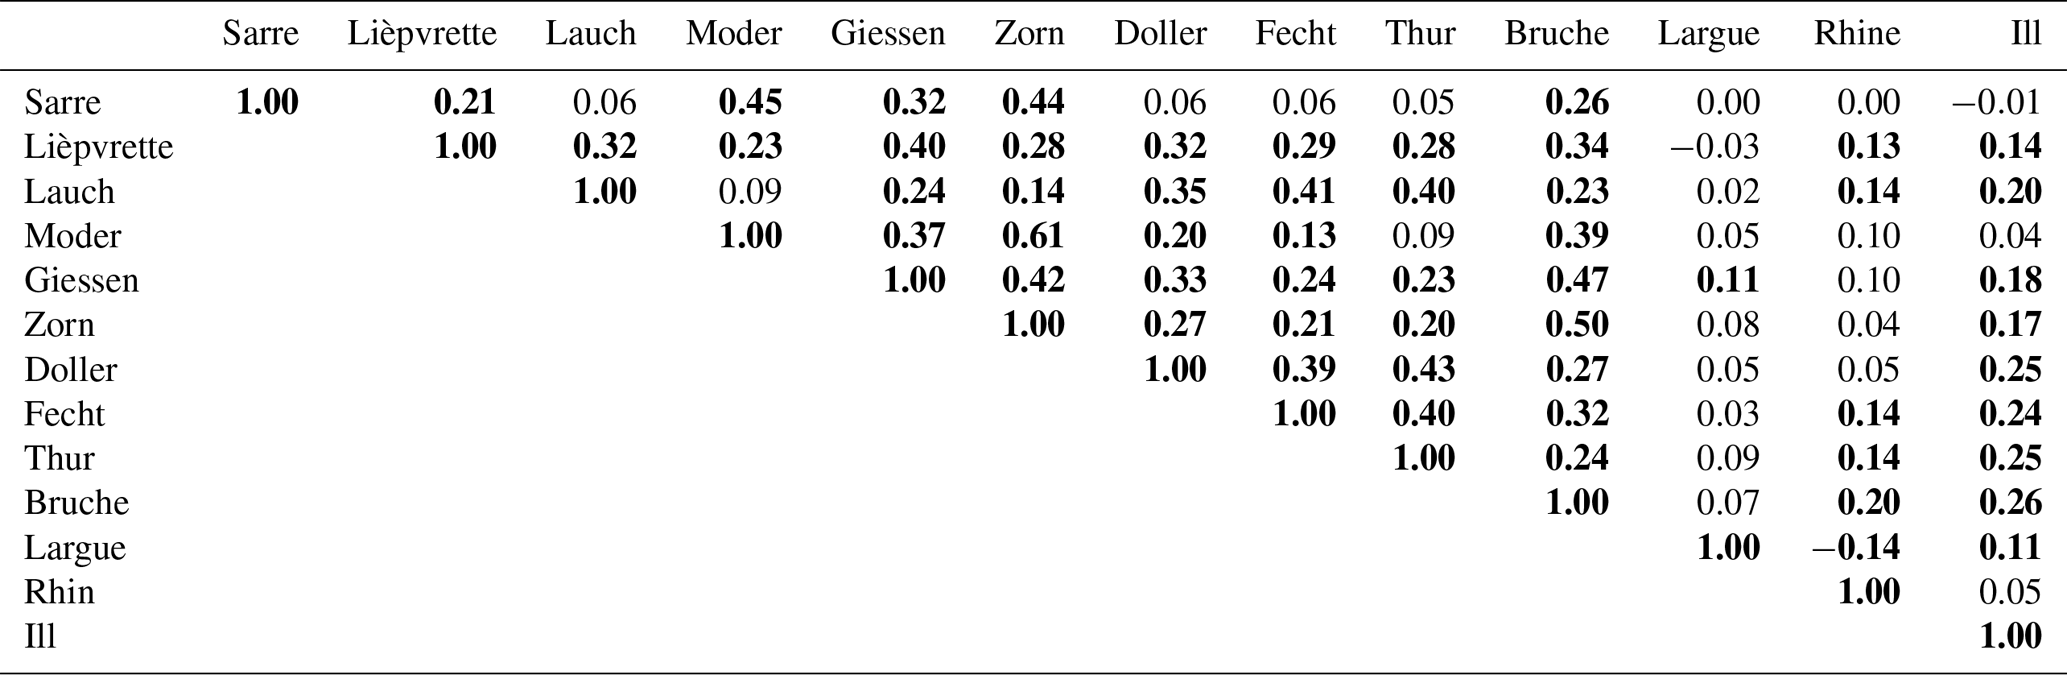
Some rivers tend to flood simultaneously (i.e. during the same events), or, conversely, at distinct times (i.e. during different events). This can be simply assessed by the association between the presence and absence variable sequences (Table 7). Thus, the Sarre River tends to flood simultaneously with the Moder, the Giessen, the Zorn, and the Bruche rivers (Pearson's coefficient: +0.45, +0.32, +0.44, and +0.27, respectively). This makes sense since all these rivers are located in the north of the Alsace (Fig. 1). Conversely, the Rhine and the Largue rivers tend to flood during distinct events (Pearson's coefficient: −0.14).
Even if more than two-thirds (68 %) of the events affected only one municipality, the flood that occurred in February 1958 impacted up to 89 municipalities (Fig. 7f). In all, 31 events (8.5 %) impacted more than 10 municipalities, among which 13 events (8.5 %) affected more than 20 municipalities and 4 (1.1 %) more than 40 municipalities. The latter group of events corresponds to the floods of December 1947–January 1948, 17 September 1852, December 1919 (Fig. 5b), and January 1882. There was a significantly positive association between 16, 11, and 4 municipalities and the variables “material damage”, “functional damage”, and “environmental damage”, respectively, among which the municipality of Illhaeusern (Fig. 1) appears in every case (Pearson's coefficient: +0.16, +0.16, and +0.18, respectively). This identifies the municipalities more prone to the respective damage types and Illhaeusern as the municipality that suffered the highest damage, apart from casualties. The latter point may be related to the fact that Illhaeusern is often affected by floods of the Ill River, which are rather “slow” floods, meaning that people have time to escape and are used to doing so.
Table 6Number of events per river. The 13 rivers for which at least 10 events with water overflow were documented are listed. ORRION also documents flood events (with and without water overflow) that have affected other known rivers, as well as rivers that could not be identified in the available sources.
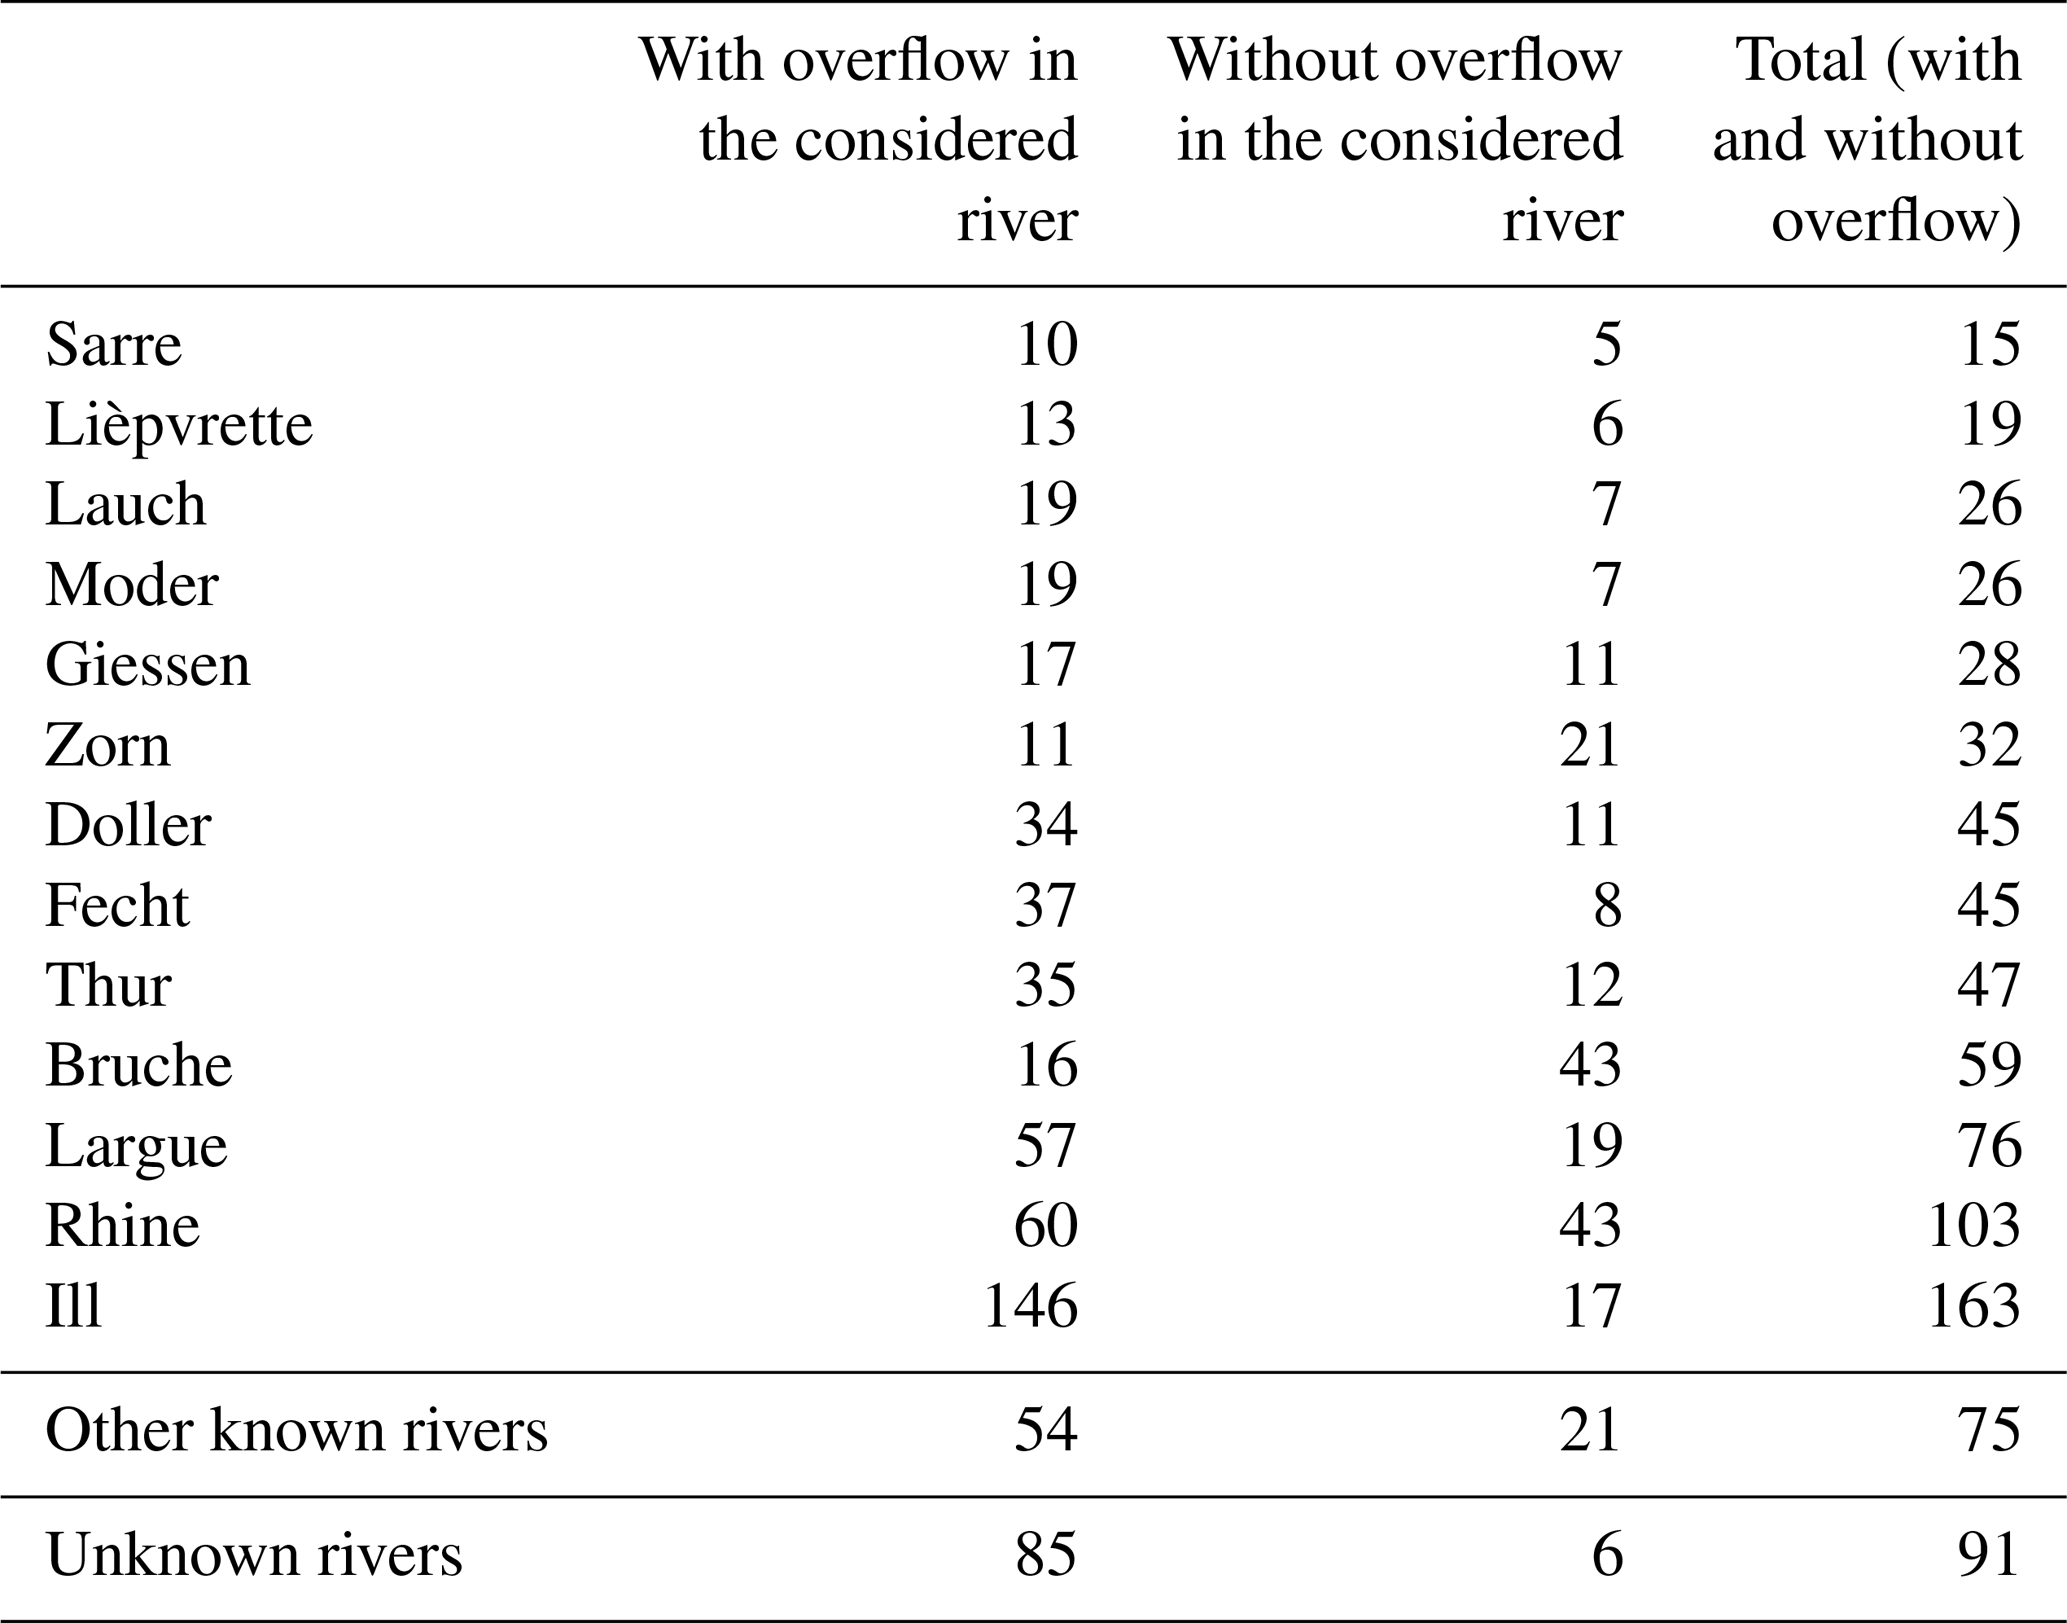
Table 7Pearson's cross moment-product coefficient between individual rivers by event presence and absence sequences. Events with and without water overflow are considered together. Bold values are significantly non-zero at the 0.05 significance level on the basis of a Student test.
4.4 From low to exceptional severity
In all, 231 events (63 %) could be classified according to their severity following our classification approach (Table 4): 36 % (of the known values) in Class I, 31 % in Class II, and 33 % in Class III, among which 6 % are in class IV. Our three main classes are thus more or less balanced. As expected, the 13 events identified as Class IV events (they affected at least 20 municipalities) all occurred after 1801. Specifically, these are December 1801–January 1802, January 1855, May 1856, February 1860, January–February 1862, February 1877, January 1910, February 1958, February 1990, and the four events that affected more than 40 municipalities listed earlier.
High-severity events correspond generally to the RT configuration (the Rhine River and its Alsatian tributaries; Pearson's coefficient with this configuration: +0.43 for Class III and +0.32 for Class IV). Conversely, the association is significantly negative with the R (Rhine River alone; Pearson's coefficient: −0.22) and T (Alsatian tributaries of the Rhine River alone; Pearson's coefficient: −0.23) configurations. Symmetrically, low-severity events are more strongly related to the R configuration than to the RT configuration (Pearson's coefficient: +0.27, and −0.30, respectively). This reflects the contribution of the spatial extent, and especially of the number of affected rivers, to the severity classification.
In addition, the greater the severity of the events, the higher the association with the existence of damage, which is also logical since this is an even more important factor in the classification of severity. Hence, there is a positive association between Class III events and all types of damage (Pearson's coefficient higher than +0.26 for all kinds of damage), which is even stronger for functional and material damage (Pearson's coefficient: +0.32 and +0.42, respectively). The opposite is observed for class I events, for which the association is very significantly negative with functional and material damage (Pearson's coefficient: −0.38 and −0.51, respectively).
4.5 Seasonality
Overall, the analysed events took place throughout the year, but they occurred mainly in winter (from December to March: 45.9 %), especially in December (12.8 %) and January (13.6 %, Fig. 8a). A second peak is found in July (6.5 %). It should be noted, however, that the month of occurrence is not known for 21 % of the event sample. Snow melting/thaw and thunderstorms are physically coherent, well-identified causes for these two winter and summer peaks (Pearson's coefficient: +0.32 and +0.31, respectively).
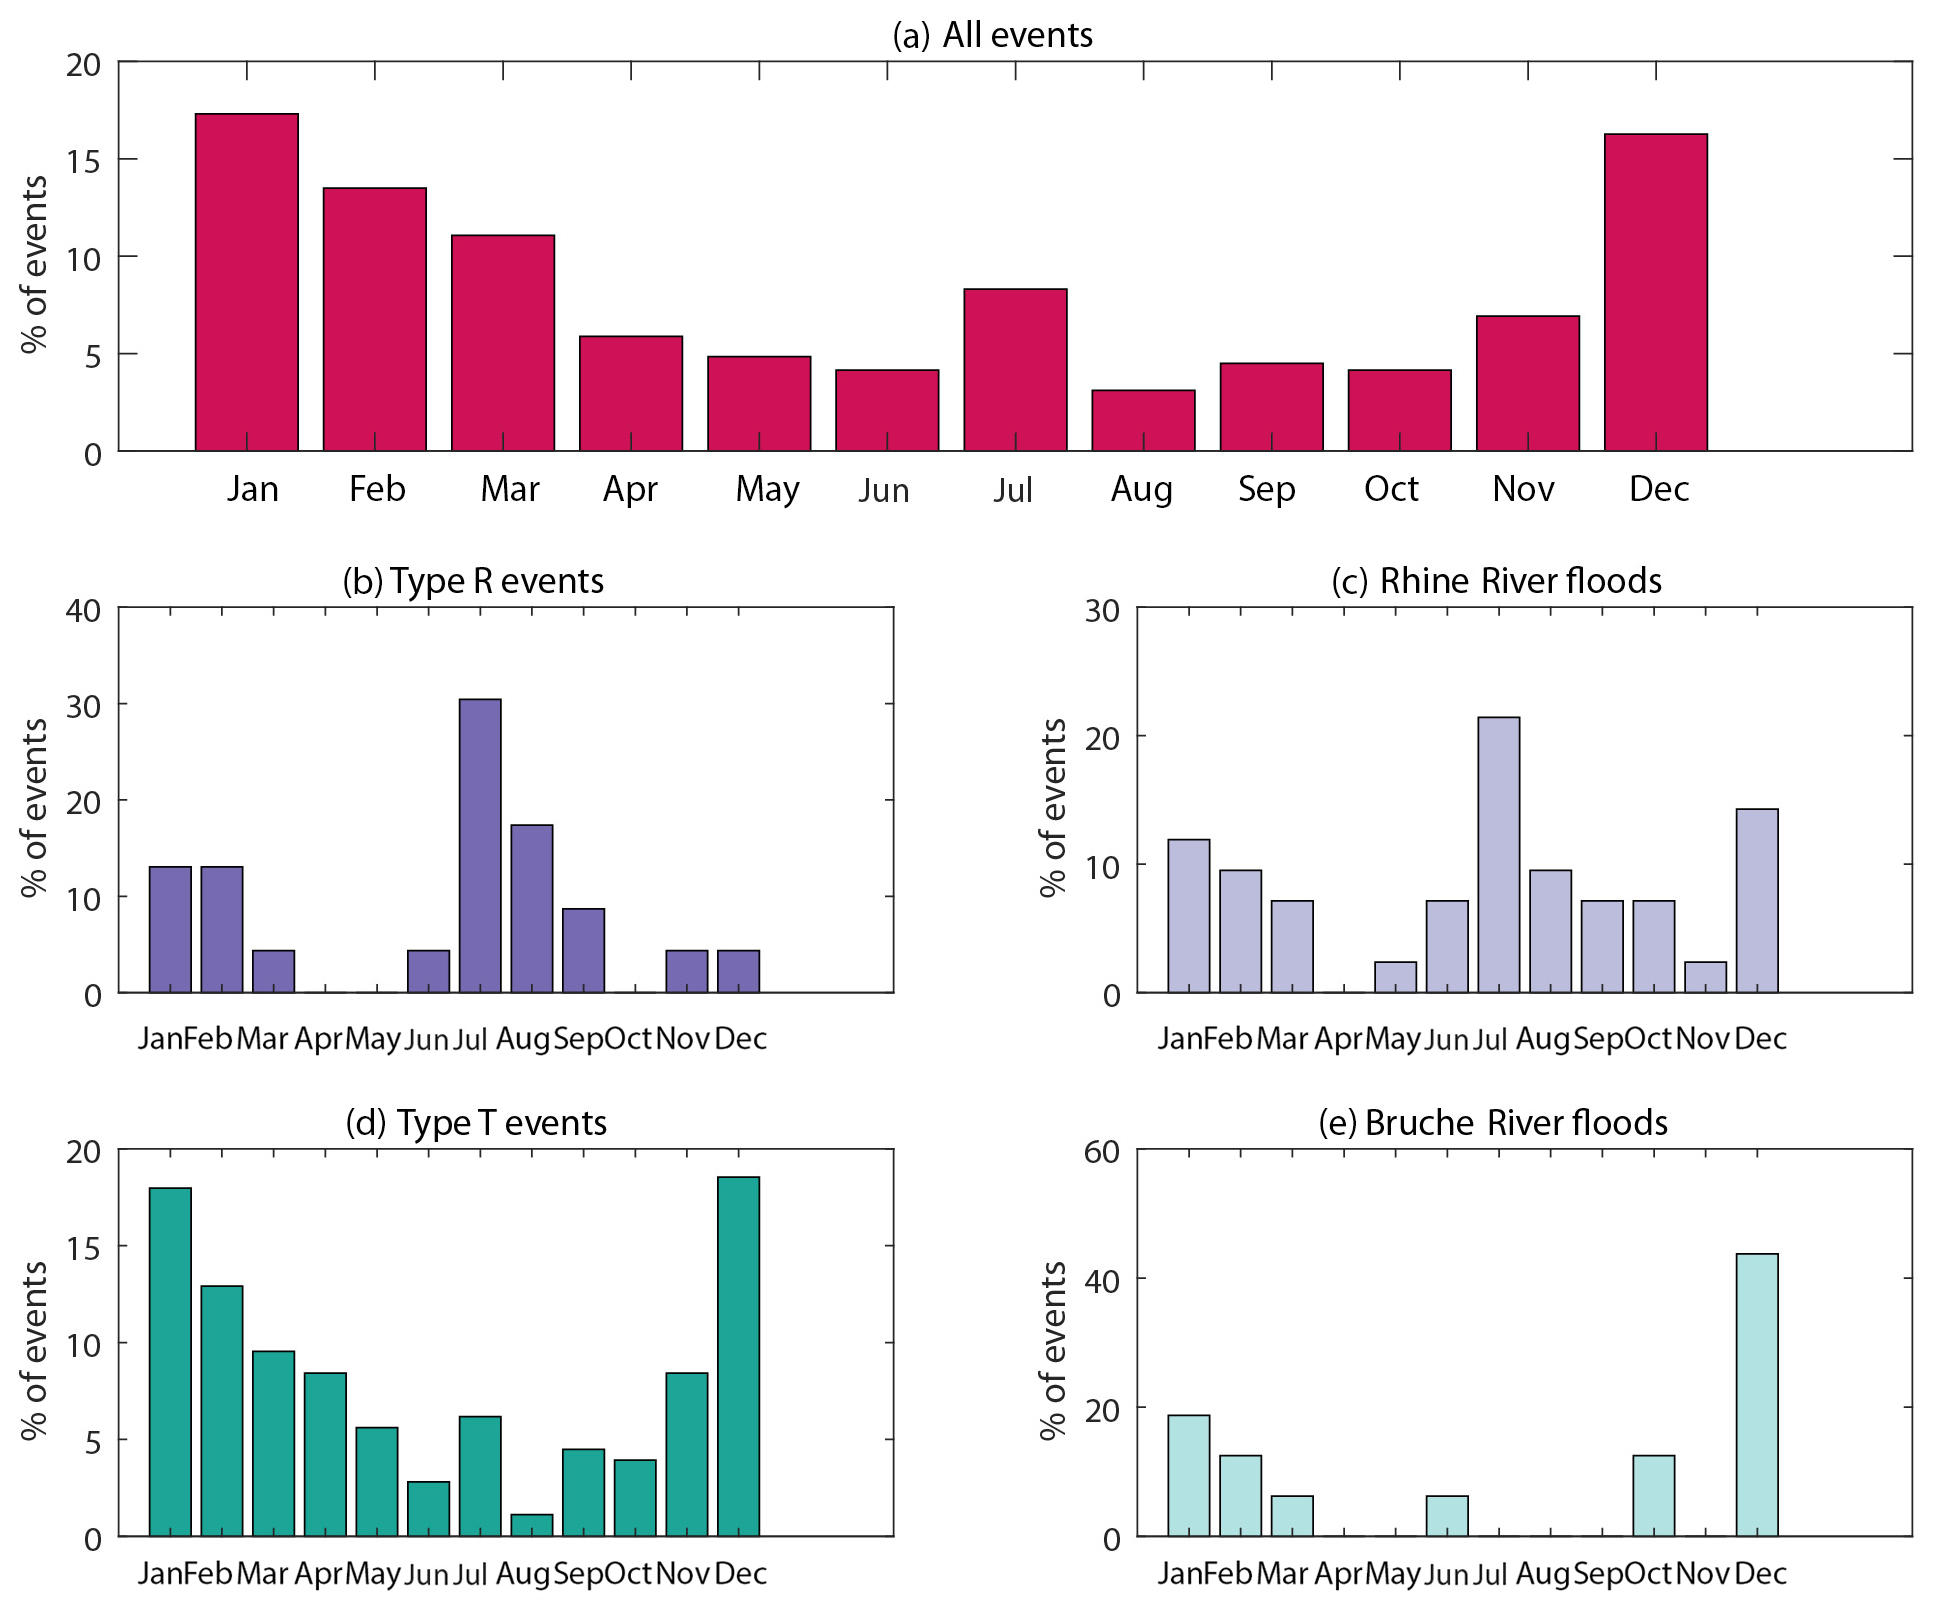
Figure 8Flood event seasonality (monthly distribution) (a) for all events, (b–d) for the R (Rhine River alone) and T (Alsatian tributaries of the Rhine River alone) events, and (c–e) for all events with and without water overflow that have affected the Rhine and the Bruche rivers, respectively. For all events (a), Type R events(b), and Type T events (d), water overflow has been reported in at least one river.
However, this global seasonal distribution of events hides large disparities between the rivers studied. The seasonal distribution of floods affecting only the Alsatian tributaries (T configuration) is comparable to the global distribution (Fig. 8d). This is not surprising since these T events comprise the majority of the total sample. Specifically, the winter months – December, January, and February – are predominant, and a slight summer peak is observable. The Bruche River is an archetypal case of this seasonal behaviour: about four-fifths of all its flood events took place during the three winter months (especially in December, representing almost half of the total; Fig. 8e).
The seasonal distribution is very different for the Rhine River, whose floods occurred in July and August instead. However, this does not prevent the occasional occurrence of significant flooding at other times of the year, as was the case in mid-September 1852. No event occurred in April and October in the R configuration (Fig. 8b). When considering the floods that affected the Rhine River (both the R and RT configurations), the seasonal distribution is a little more noisy, but the seasonal trend remains more or less the same (no flood in April, maximum activity in July; Fig. 8c).
4.6 Temporal distribution of events over the study period
To date, events have been considered independently of their year of occurrence. We now analyse their temporal distribution over the study period by year of occurrence, which could be documented for all events.
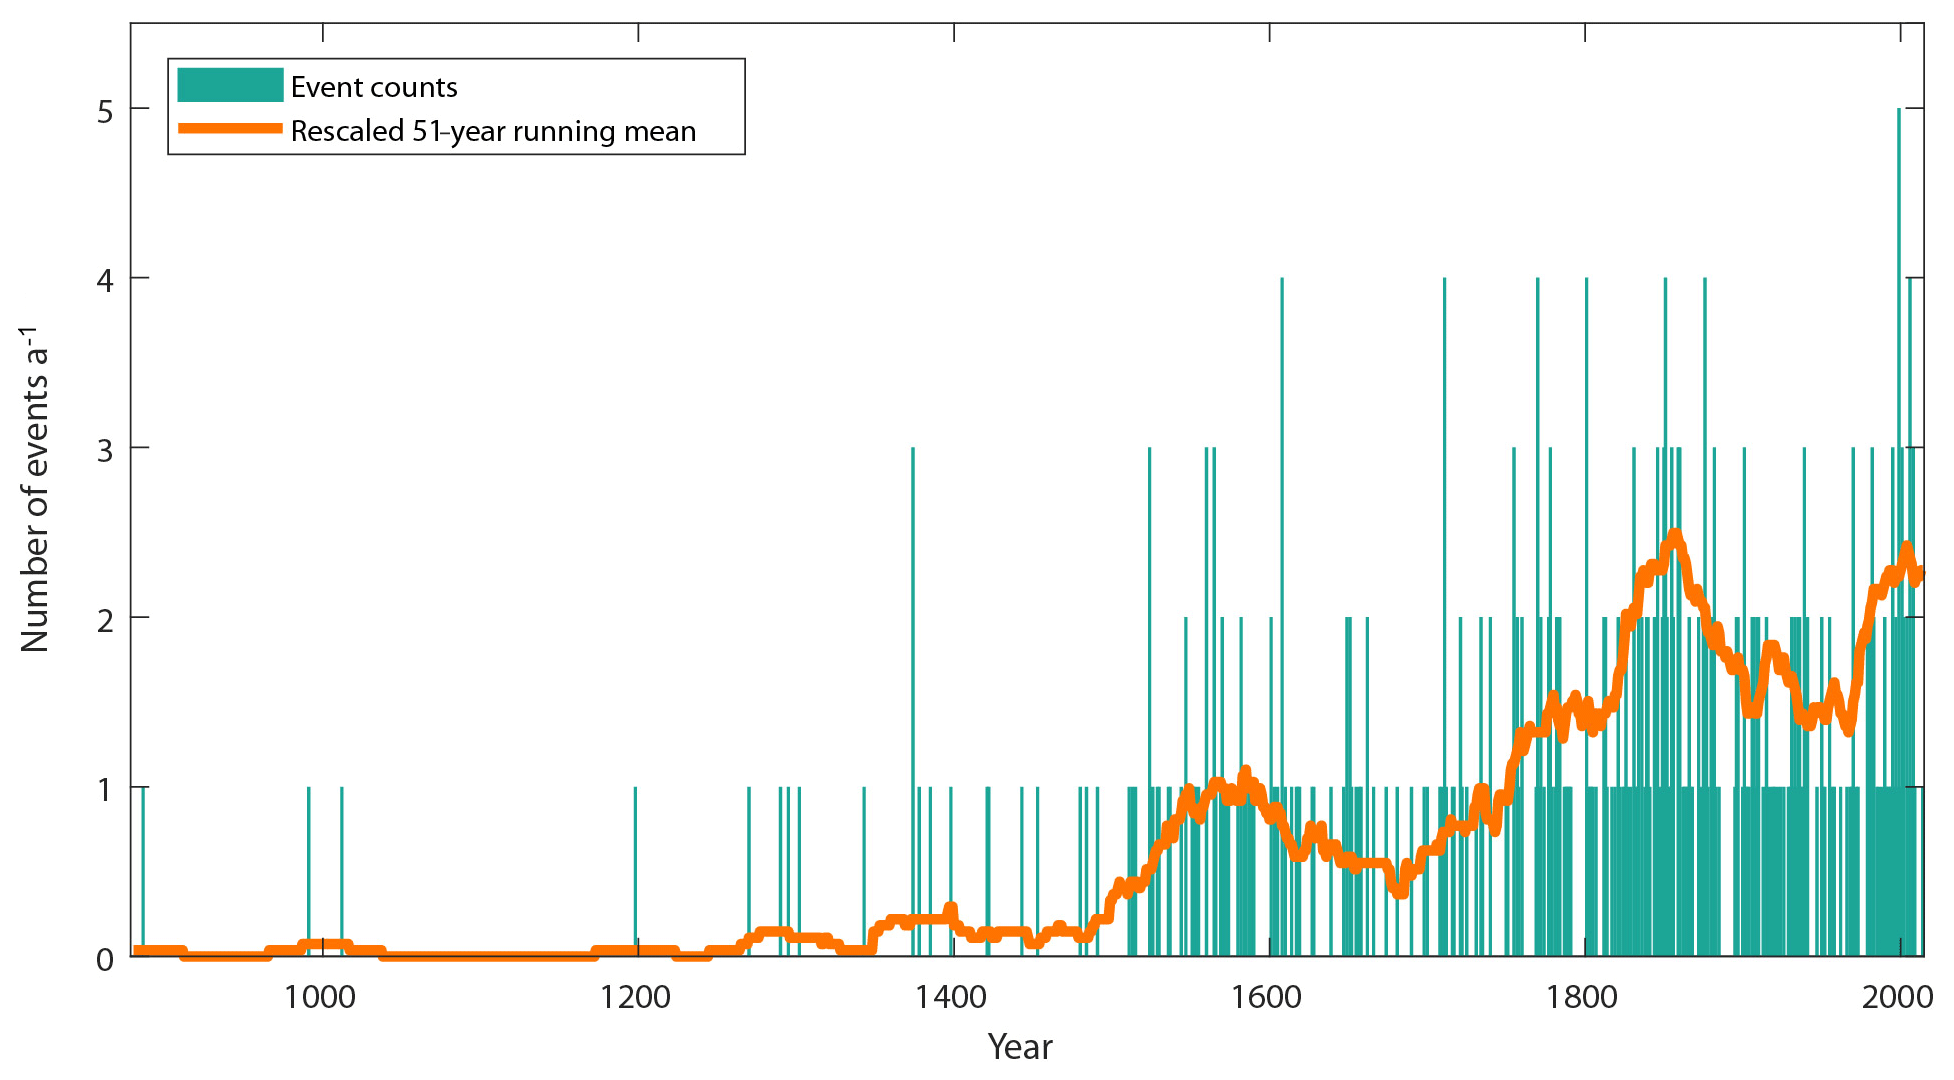
Overall, recorded events are very sporadic until the middle of the 15th century. Before that, only one event per year occurred for a few years, often separated by many years without any events. January–February 1374 stand as an exception, with three events that all concerned the Rhine River. From the middle of the 15th century, there is more regular information about events, and the long-term trends start to emerge, with a first activity peak just before 1600. The long-term trend then shows a significant decrease at around 1700, before a 150-year period of increased continuous and strenuous flood activity occurs, up to a peak in the middle of the 19th century. After this peak, the number of recorded events is significantly lower, but activity remains significant up to the last 20–30 years during which the last flood activity peak occurred (Fig. 9). This global trend, however, contains differentiated temporal patterns such as the function of rivers, municipalities, and events types, which are analysed in the next section.
The typology of the hydrological configuration provides the first level of detail (Fig. 10). The frequency of events affecting the Rhine alone (type R) decreased over the study period (Pearson's coefficient with time: −0.45). Indeed, such events almost disappeared over the second half of the 20th century. Before this period, type R events could be retrieved rather regularly, even in the High Middle Ages (nearly all of the oldest events in the global chronology are type R events). Conversely, the number of events that affected only the tributaries of the Rhine (type T) tends to increase over time (Pearson's coefficient: +0.37). In more detail, regular but sporadic flooding of the Alsatian tributaries was documented between the end of the 15th and the 18th century. Subsequently, the type T record significantly increases, showing a 200-year period of higher activity (1800–2000) and a very pronounced peak over the last 20 years. Finally, the floods that affected both the Rhine and its Alsatian tributaries (type RT) are distributed sporadically between the end of the 15th century and the 2000s but with a very marked event concentration during the 19th century, especially in the second half.
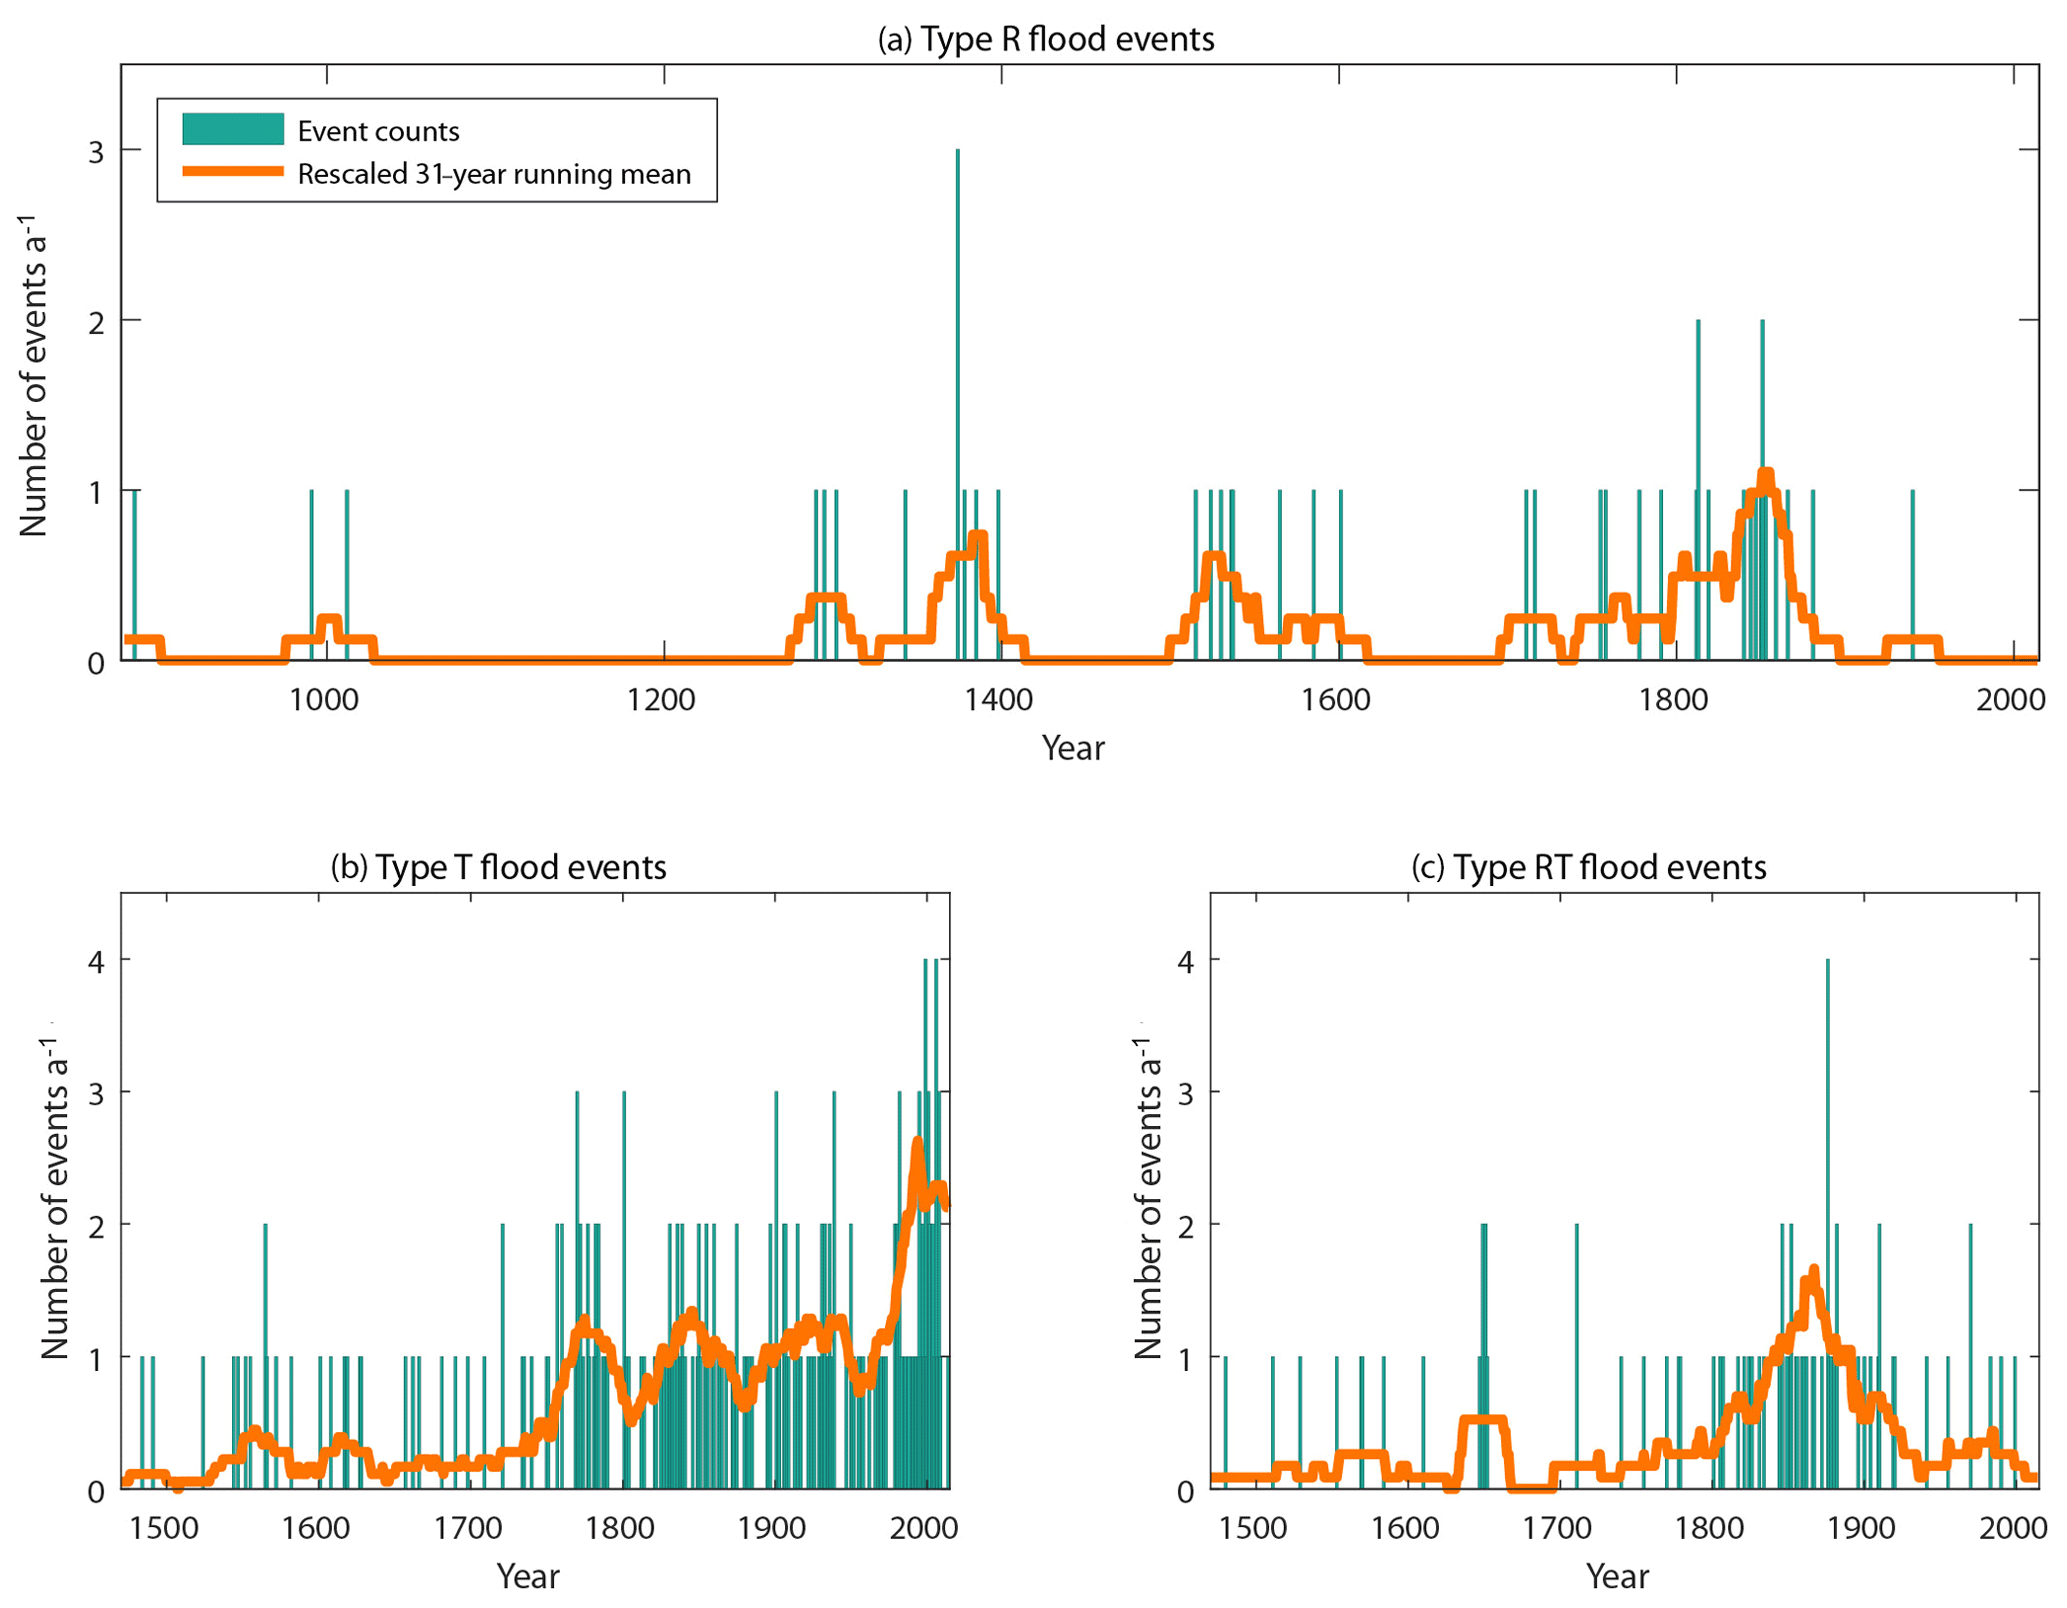
Figure 10Chronologies according to hydrological configuration. Type R events correspond to flood events that have affected the Rhine River alone. Type T events have affected one or several Alsatian tributaries of the Rhine River but not the Rhine River. Type RT events have affected both the Rhine River and at least one of its Alsatian tributaries.
In the second step, we propose to look separately at each of the 13 rivers under study. The temporal distribution of events differs considerably from one river to another, especially if the distinction between floods with and without overflow is included in the analysis (Figs. 11, 12). The Ill and, as mentioned earlier, the Rhine River are those for which the most continuous information is available over the entire study period, whereas for other rivers such as the Sarre, Moder, Zorn, Lièpvrette, and Giessen, the first mentions that could be retrieved go back to the second half of the 18th century. Also, there is usually a maximum of one event per year, except for the Ill and, to a lesser extent, for the Rhine, for which there are regularly two or three records per year. This suggests a higher flood frequency in major rivers with regard to their tributaries. In terms of long-term trends, in addition to the difference between the record starting dates, the major pattern is the high activity phase around the middle of the 19th century already highlighted overall and for the type R–RT chronologies. It is particularly visible, e.g. for the Lièpvrette, Fecht, Thur, Doller, Ill, and Rhine rivers, with some slight delay from one river to another. To a lesser extent, the very recent increase over the last 20–30 years is also visible for different rivers, for example, the Giessen, the Sarre, and, in an even more pronounced way, for the Largue. Concerning floods with and without overflow, it is noticeable that some drastic changes in proportions occurred for some rivers. For instance, during the 20th century there are about 15 events for the Rhine River but no more floods with overflow after 1940. For the Bruche River also, floods without overflow, more numerous in proportion through the recorded period compared with the other studied rivers, are especially numerous over the last decades. For most of the other rivers, however, proportions of floods with and without overflow seem to have remained rather stable over the last centuries.
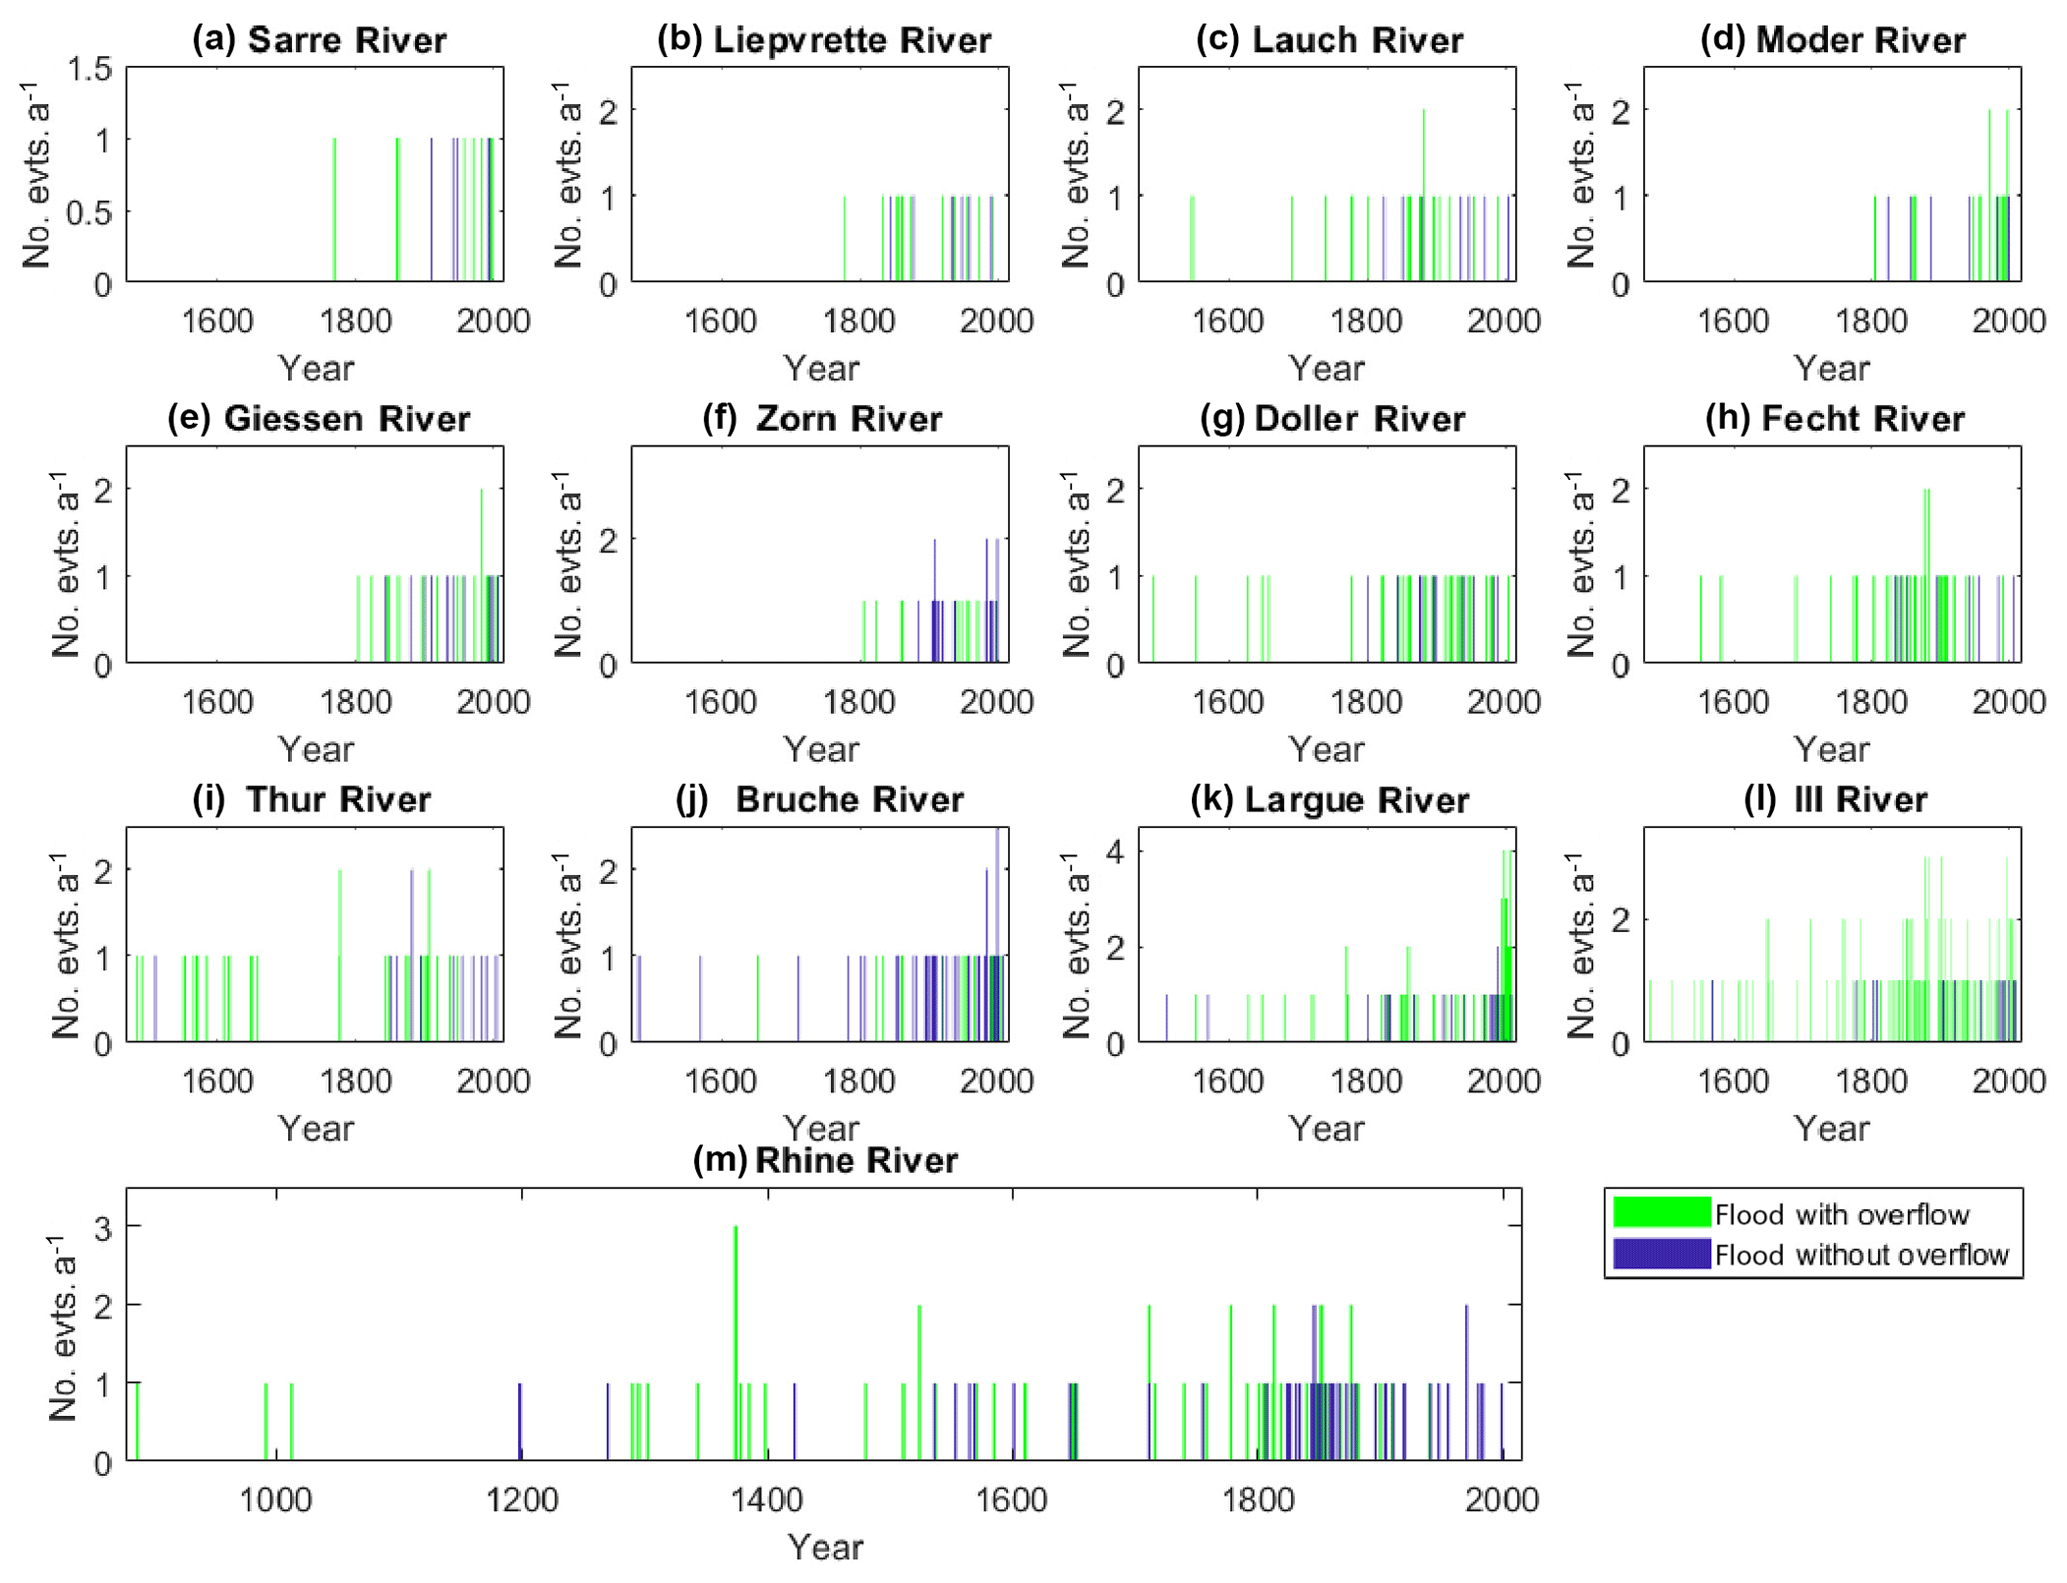
Figure 11Individual chronologies for the 13 studied rivers: events with and without water overflow.
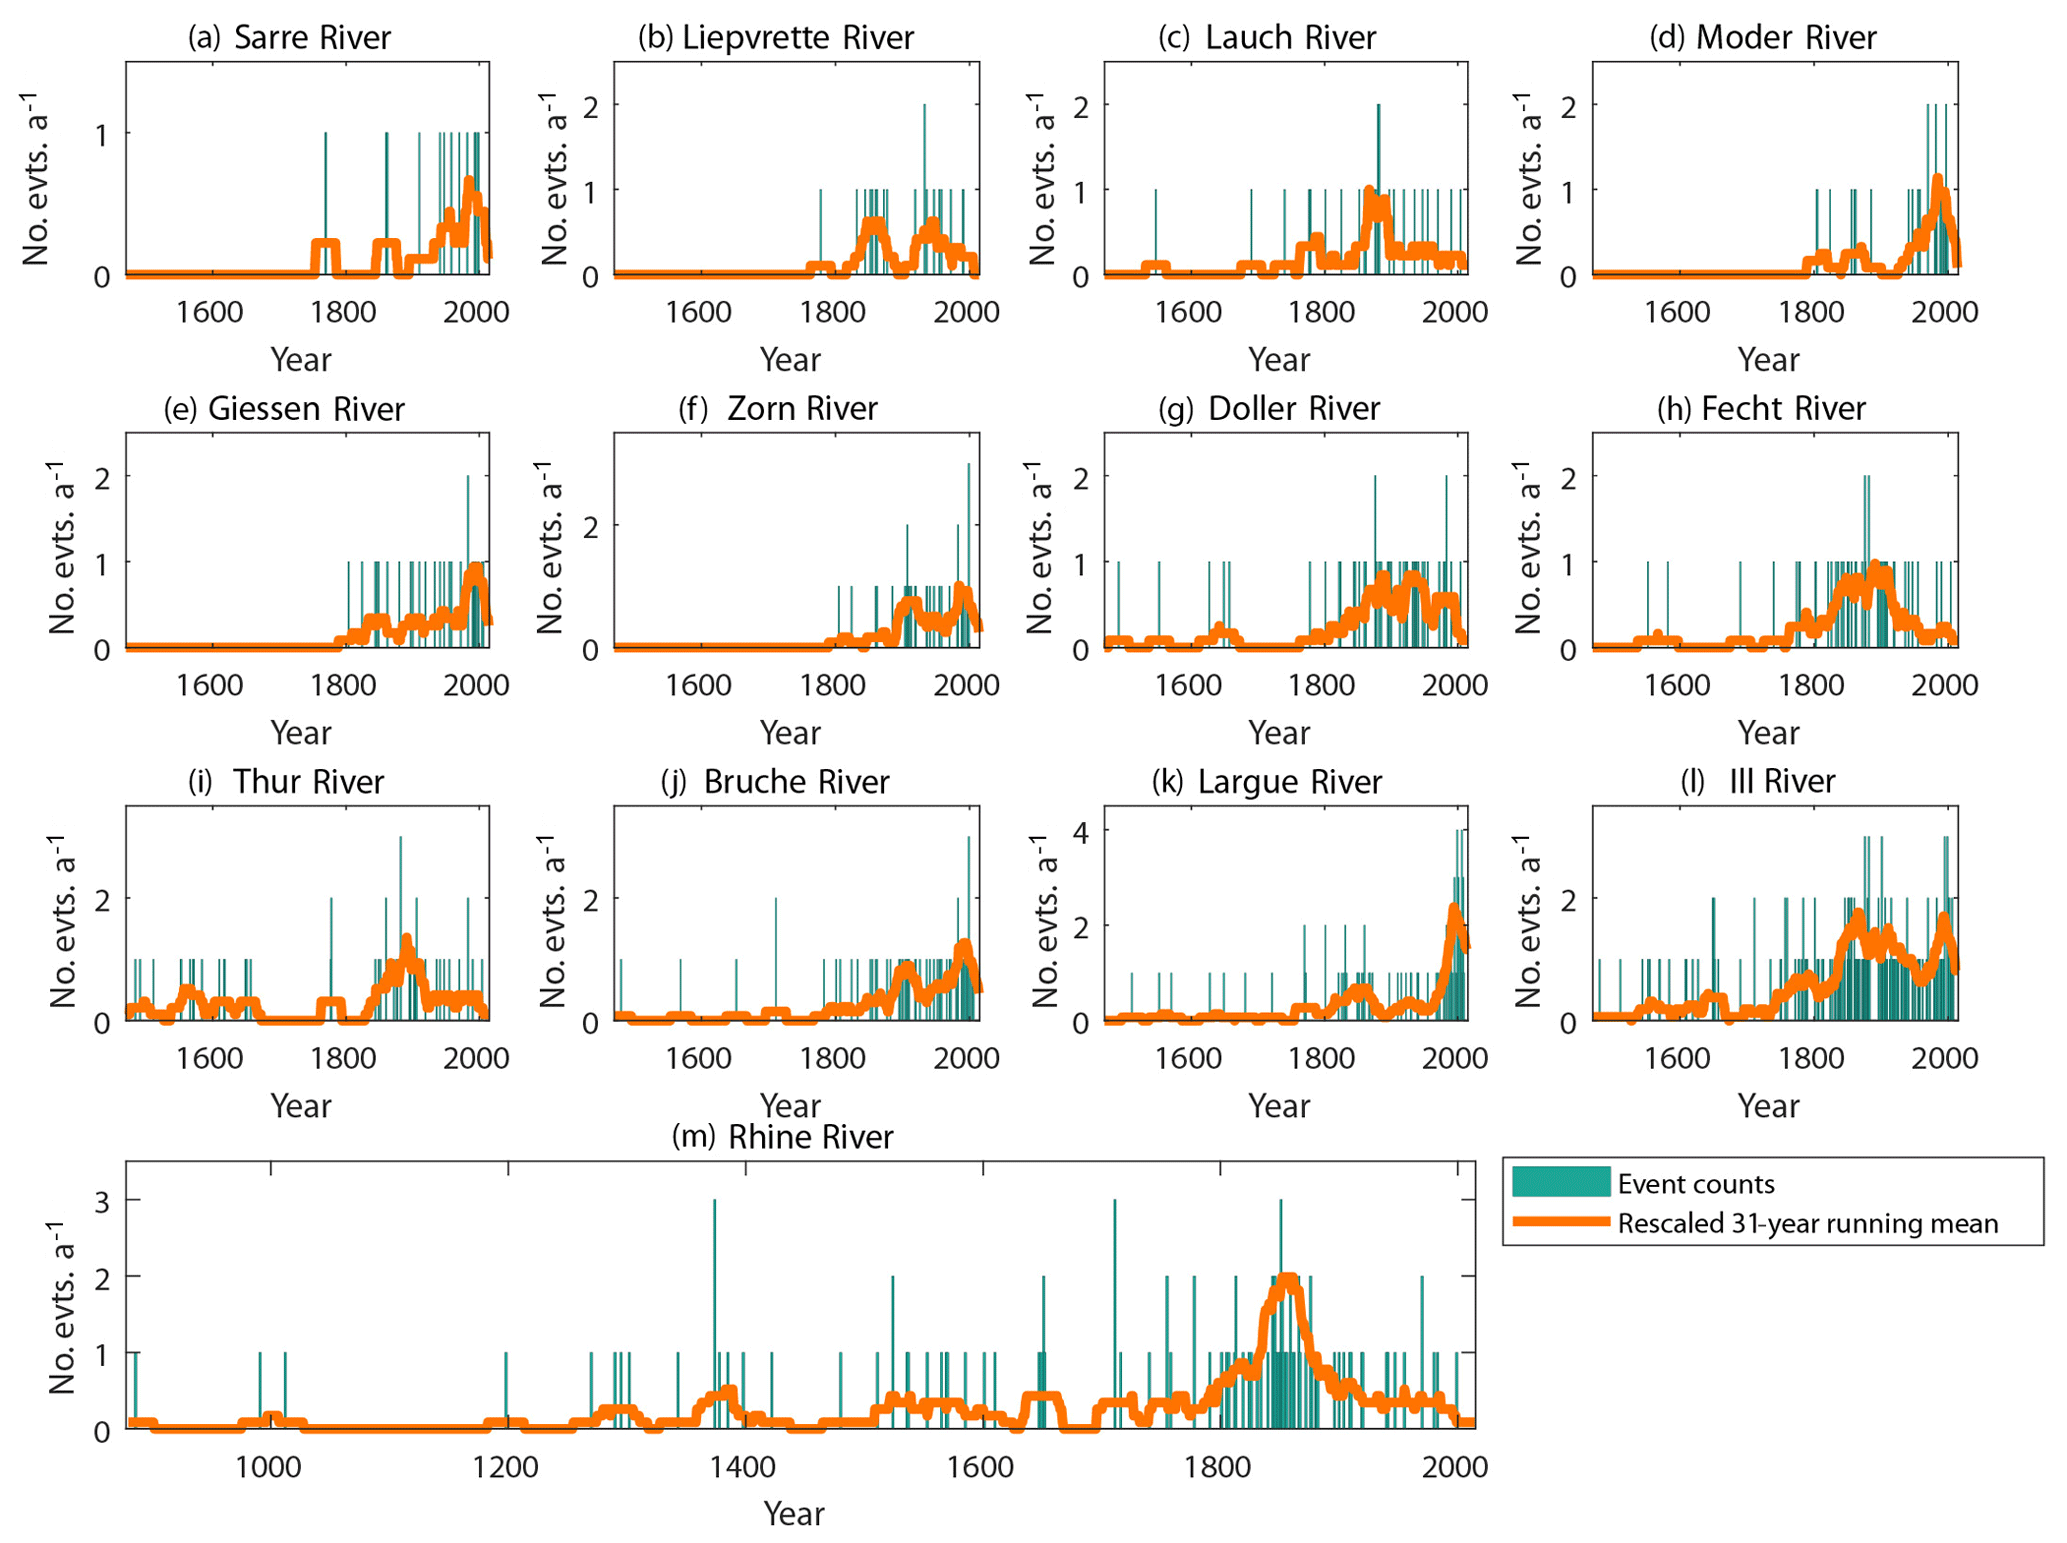
Figure 12Individual chronologies for the 13 studied rivers: all events (with and without overflow) and underlying smooth trend.
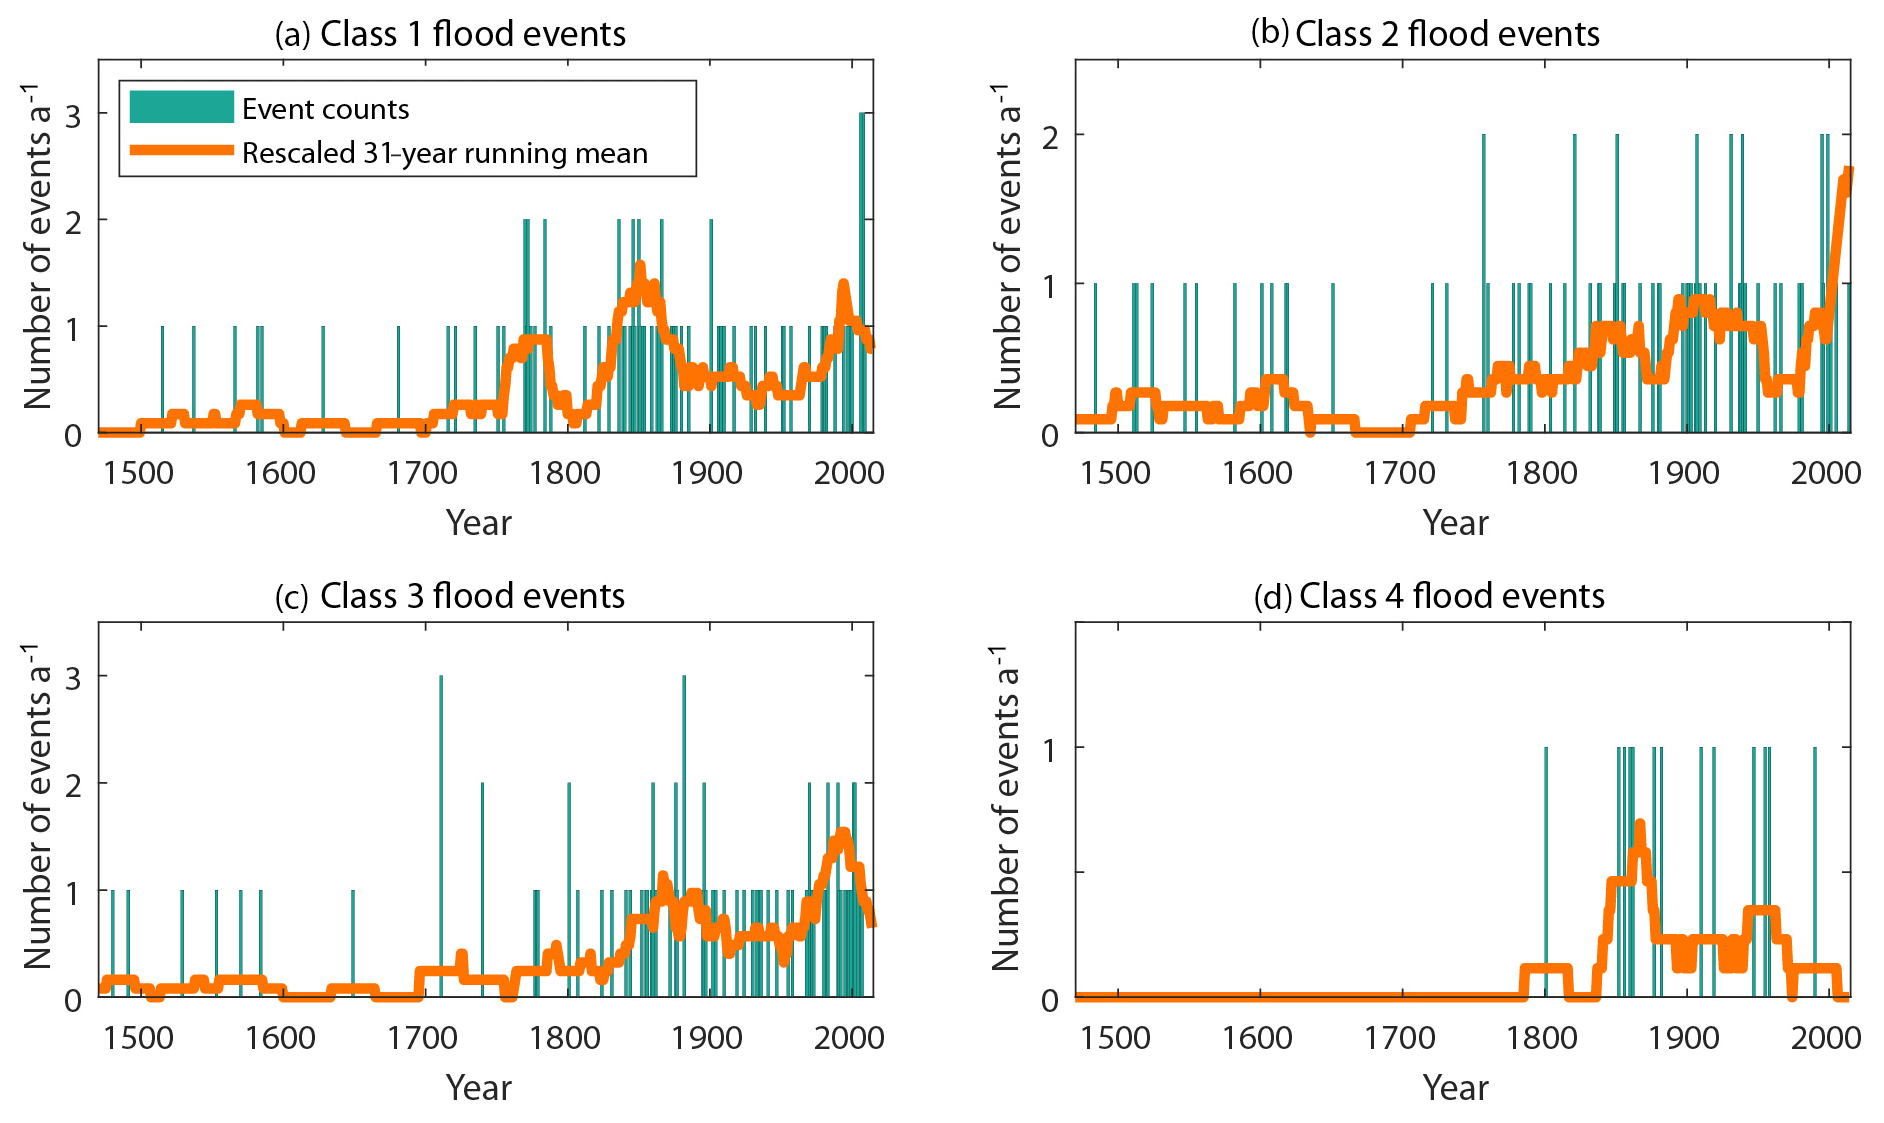
In terms of severity class, the temporal pattern is not very different for classes I–III. One notes that the global increase over the study period is slightly more marked for Class III events (Pearson's coefficient with time: +0.17) than for other classes. In other words, and surprisingly enough, severe floods are not easier to retrieve than milder ones far back in the past. The presence of the high activity peak of the last 20–30 years in all classes I–III, and of the high activity peak around the middle of the 19th century in classes I and IV, is also striking (Fig. 13).
One can also see changes in the cause of events (Fig. 14). For instance, except for one flood in the early 1940s, no event could be attributed to ice break-ups since the 1860s (Pearson's coefficient between ice break-up and time: −0.16). Similarly, the few events related to ice jams all occurred before the beginning of the 19th century. Conversely, heavy precipitation and soil saturation tend to increase from the 18th century and even more so from the 19th century (Pearson's coefficient: +0.16, and +0.30, respectively). Also, over the very recent period, records of events attributed to thunderstorms have increased greatly (Fig. 14e). Hence, significant changes in event-generating conditions may have occurred over the study period and may partially explain the overall shape of the chronology of events and their decline over the different rivers in terms of frequency, severity, and seasonality.
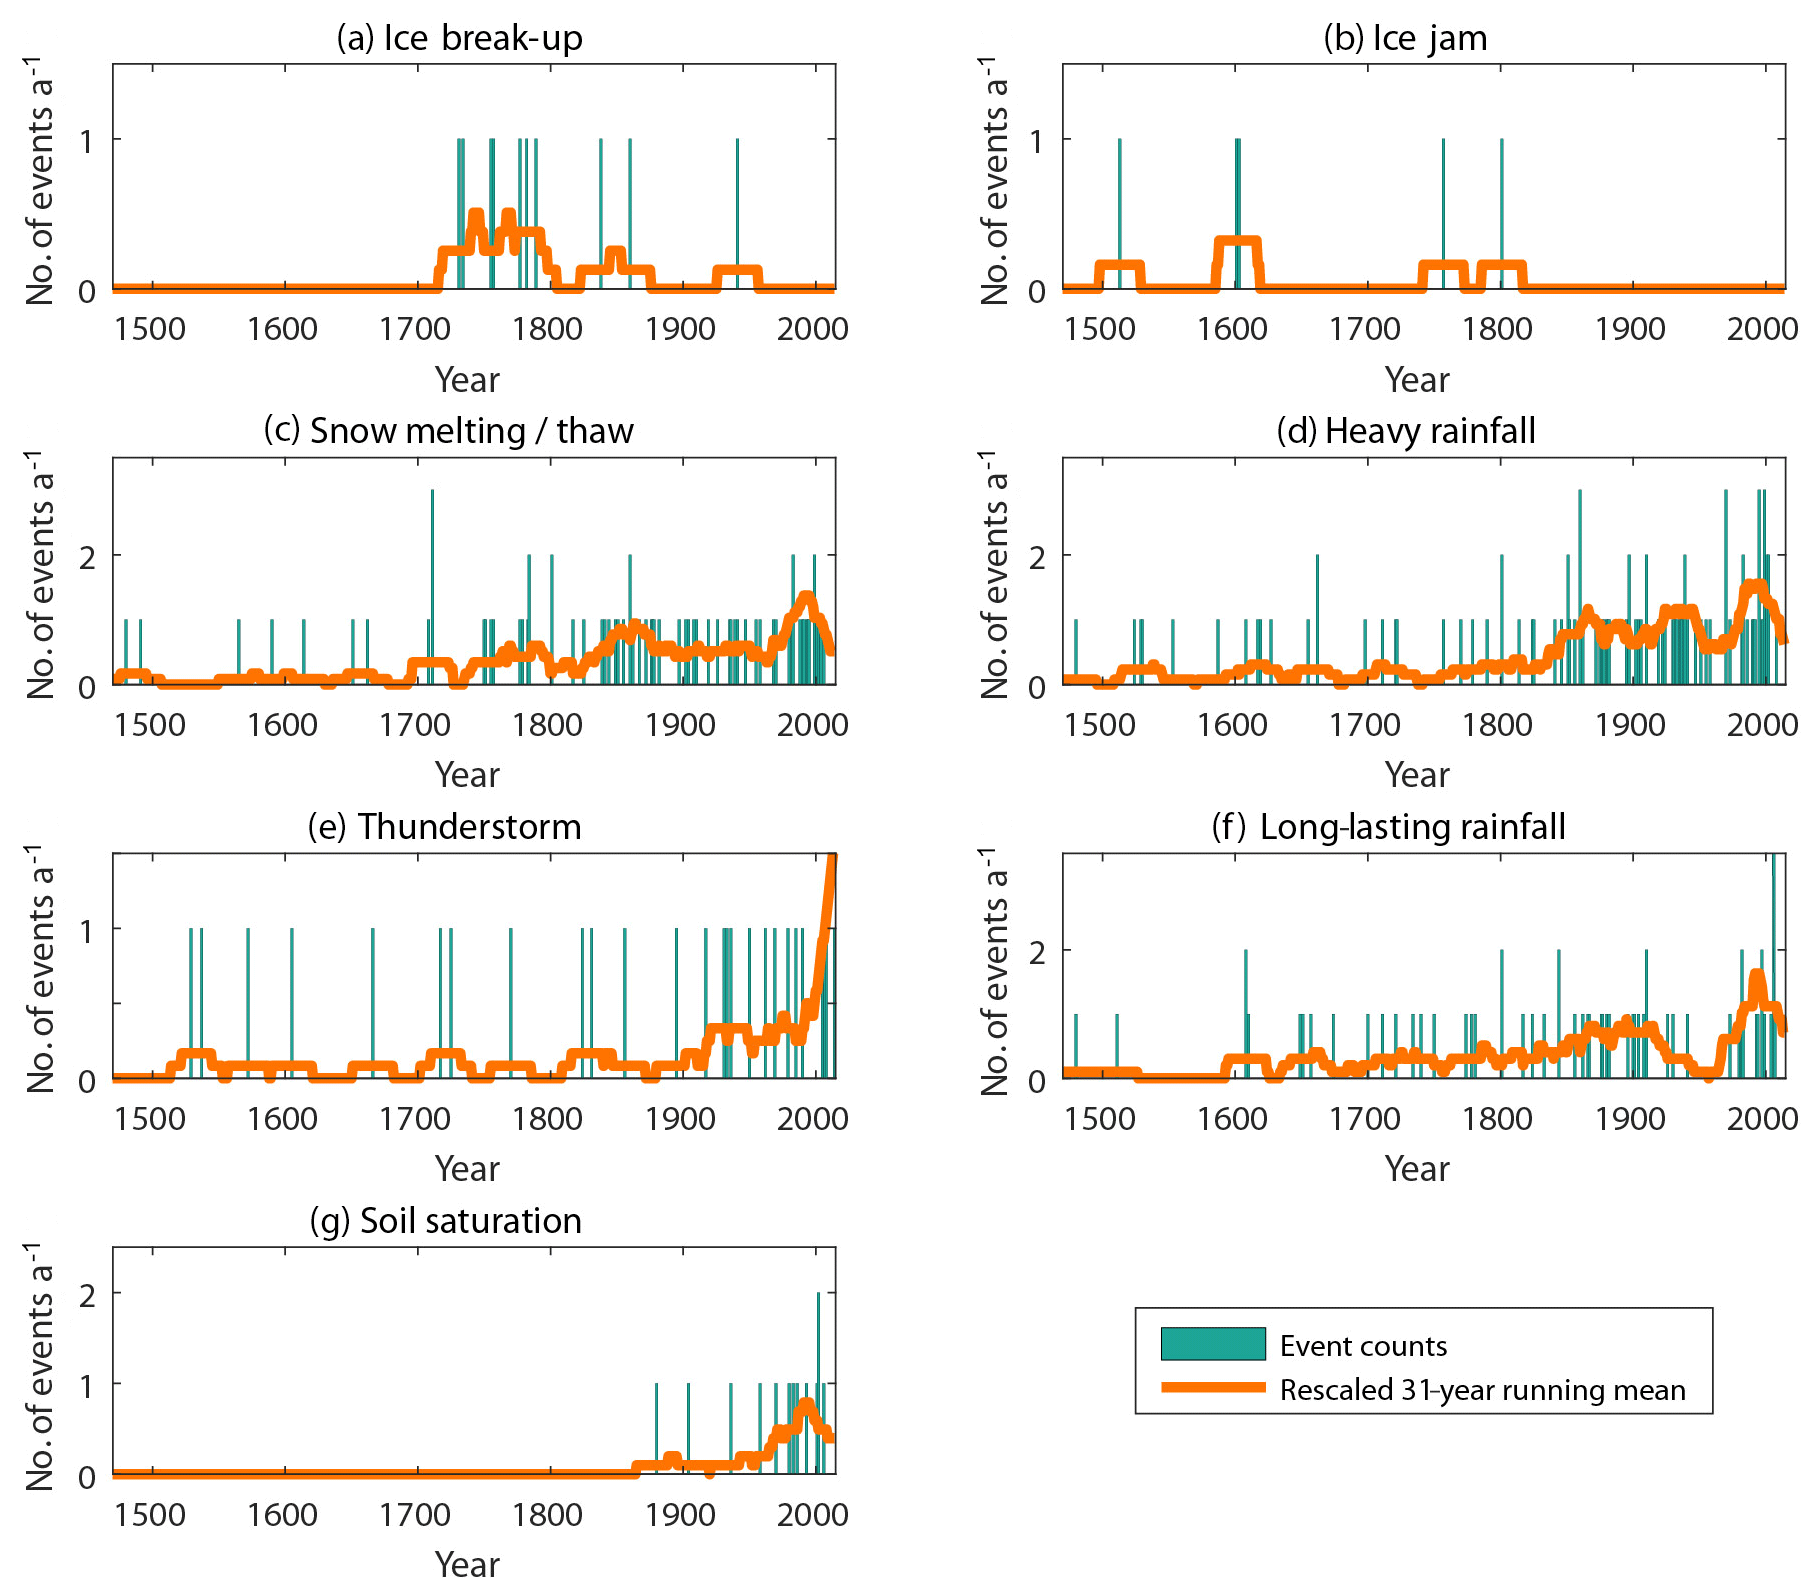
Figure 14Chronologies of events according to their causes. Events for which several causes are documented (Fig. 7a) appear in the different corresponding plots.
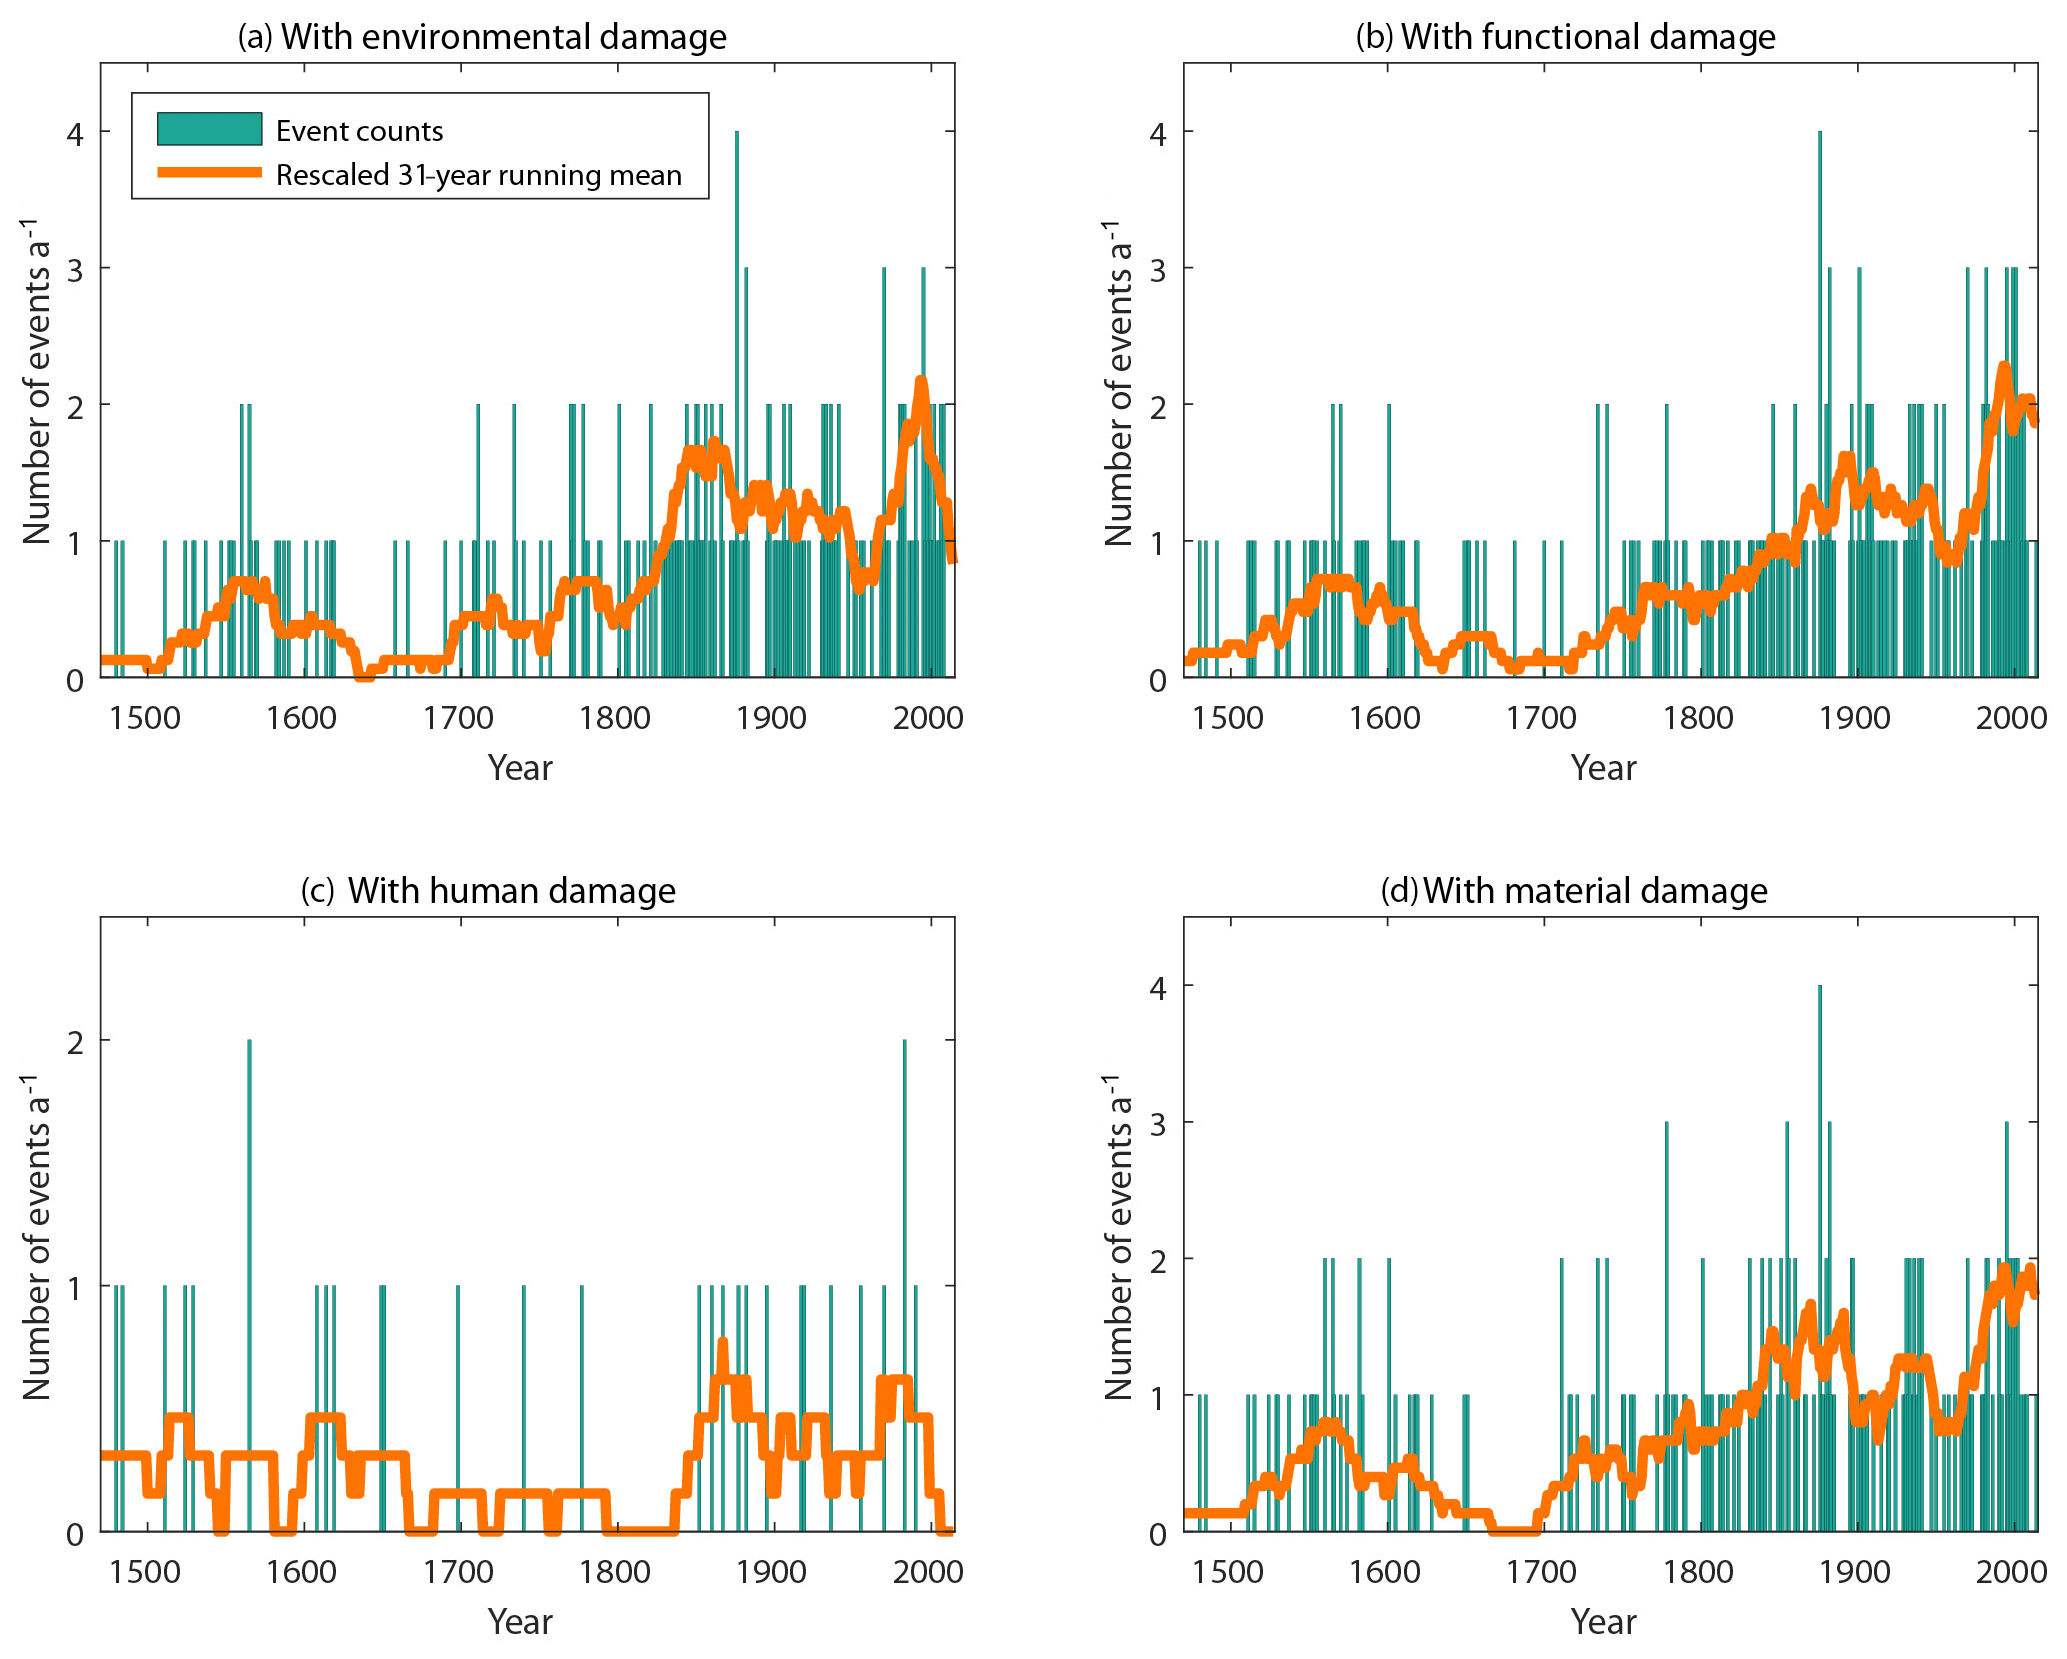
Figure 15Chronologies of events according to their consequences (documented damage types). Human damage corresponds to at least one person killed.
Finally, in terms of damage types (Fig. 15), as we move forward in time, environmental damage and functional damage are proportionally greater (Pearson's coefficient with time: +0.13 and +0.22, respectively), their time trend following the overall trend more or less. Human damage, however, occurred rather regularly throughout the study period. Events that killed at least one person are therefore proportionately lower in number for recent events than for older ones (Pearson's coefficient with time: −0.14).
4.7 Focus on individual rivers
From the large sample of studied events, refined analyses can easily be carried out to better understand the behaviour of individual rivers. Two examples corresponding to two different flood contexts are presented here: the Ill River, which has its source in the Alsatian Jura and extends over a large part of the Alsace, and the Thur River, an affluent of the Ill River flowing down from the Vosges Mountains.
Floods of the Ill usually occur simultaneously with a large number of other rivers (Pearson's coefficient: +0.52 between presence and absence for the Ill River and the total number of rivers per event). Logically, they often occur at the same time as those of its tributaries, especially the Lauch, Fecht, Doller, Thur, and Bruche rivers (Pearson's coefficient: +0.20, +0.24, +0.25, +0.25, and +0.26, respectively). Events have occurred more often in recent times (Pearson's coefficient with time: +0.28) and, with regard to the total sample, are more related to snow melting/thaw and heavy rainfall and less to thunderstorms (Pearson's coefficient: +0.24, +0.18, and −0.14, respectively). Flood events in which the Ill River was included have caused a lot of functional and, to a lesser extent, environmental and material damage (Pearson's coefficient between the presence and absence of the event and of the corresponding damage: +0.37, +0.15, and +0.15, respectively). Finally, it should be noted that Ill floods correspond mainly to high-severity events (Pearson's coefficient with Class III and Class IV: +0.23 and +0.18, respectively). This is because flooding of the Ill often affects large areas of the Alsatian plain, leading to, for example, numerous roads being cut off.
Floods affecting the Thur River generally also affect most of the other rivers (Pearson's coefficient: +0.58 with the total number of rivers per event, +0.43, +0.40, and +0.40 with the Doller, Lauch, and Fecht rivers, respectively). These are also events known from several sources (Pearson's coefficient with the number of sources: +0.30), more related to snow melting/thaw (Pearson's coefficient, +0.22) and causing a lot of damage (Pearson's coefficient with the number of damage per event: +0.37), especially human and functional damage (Pearson's coefficient: +0.31 and +0.23, respectively). Thur floods correspond mostly to severe events, particularly of Class III (Pearson's coefficient: +0.40), that have affected both the Rhine and its tributaries (Pearson's coefficient with RT hydrological configuration: +0.31). Thus, the Thur floods are rather typical of those of the rivers flowing down from the highest part of the Vosges Mountains in terms of generating factors, and they often cause significant losses.
4.8 Focus on individual municipalities
Similarly, a detailed analysis can be conducted at the scale of the Alsatian municipalities.
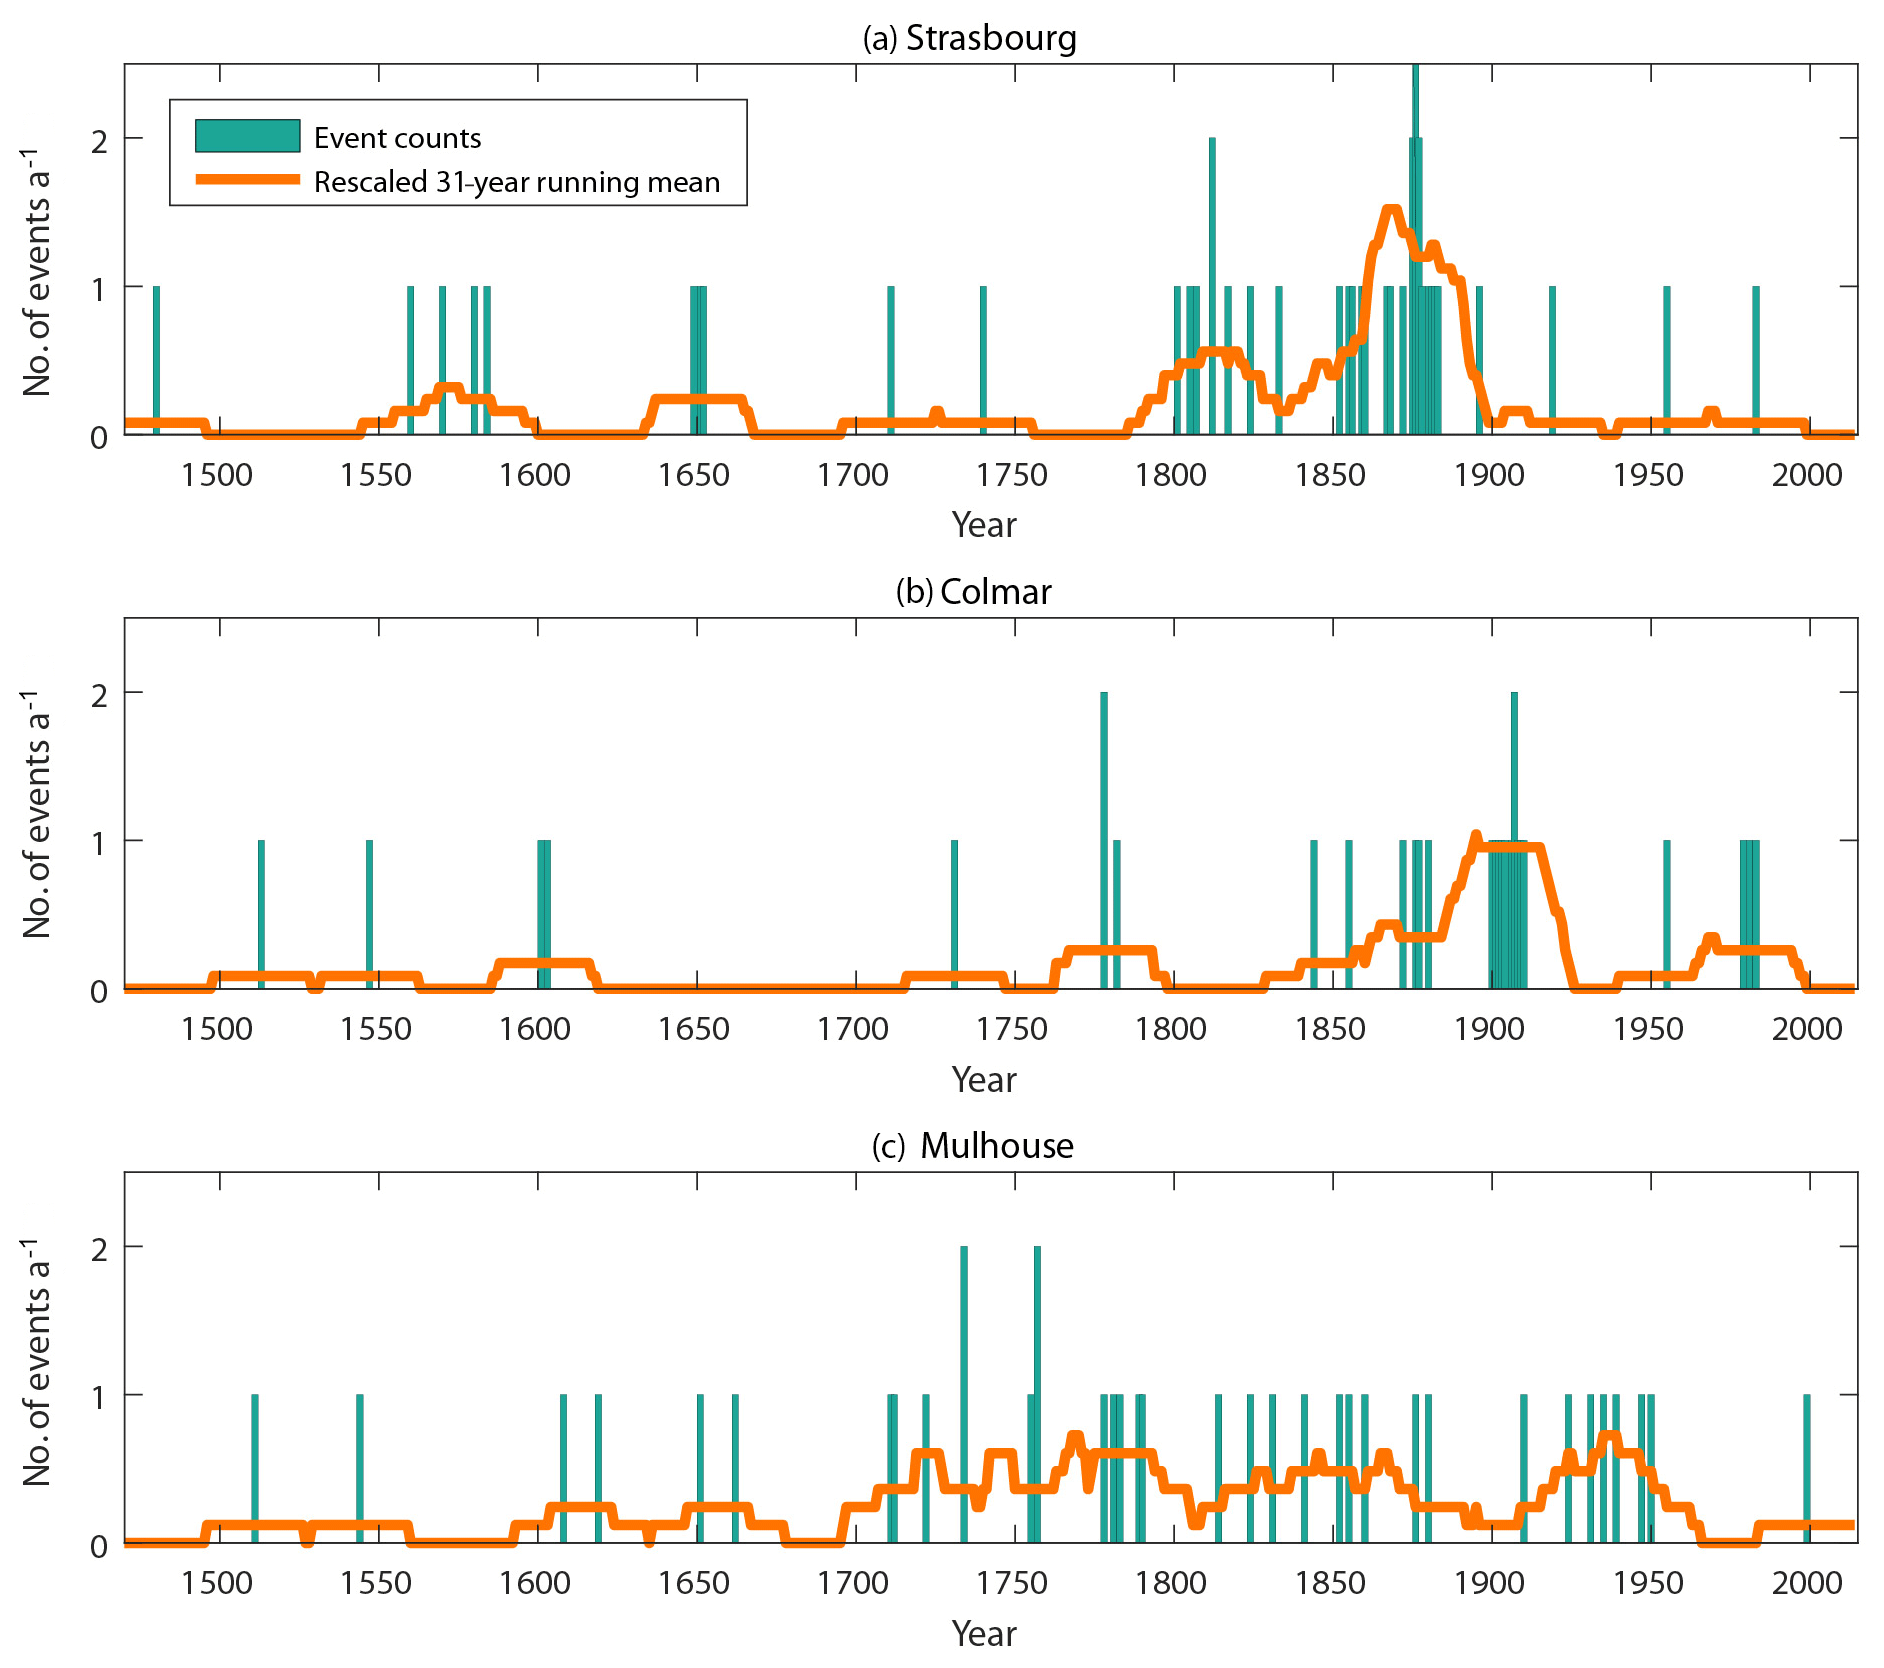
As an example, we focus here on the three major cities of the Alsace, distributed from south to north and representing a variety of situations in terms of flood hazard and risk. Strasbourg is situated along both the Ill and the Rhine rivers, Mulhouse close to the Ill and Doller rivers, and Colmar close to the Lauch and Ill rivers (Fig. 1). The temporal distribution of the events shows a reduction of overflow frequency during the 20th century for the three cities, certainly related to, at least partially, increased mitigation efforts to reduce damage. The overflow frequency reduction is especially outstanding in Strasbourg (only three occurrences since 1900) and took place later in Mulhouse (significant drop after 1950 only). Also, documented floods with overflow activity were particularly high in Strasbourg during the 19th century, whereas the rate has been rather regular in Mulhouse since 1500 and especially over the 1700–1950 period (Fig. 16).
More specifically, the events that affected Mulhouse impacted many other municipalities (Pearson's coefficient with the number of municipalities per event: +0.21), among which are Altkirch, Baldersheim, Brunstatt, Meyenheim, Réguisheim, and Walheim and even more often Sausheim, Logelheim, and Illzach (Pearson's coefficient: +0.20, +0.27, +0.21, +0.22, +0.25, +0.23, +0.30, +0.33, and +0.47, respectively). As expected, the corresponding events are mostly severe ones (especially Class IV, Pearson's coefficient: +0.14), caused significantly more functional and material damage (Pearson's coefficient: +0.17 and +0.20, respectively), and were more often linked to ice jams (Pearson's coefficient: +0.15) than other events were. These significantly positive associations between municipalities simply reflect a common location along the Ill and/or Largue rivers. In addition, Illzach and Sausheim have been put at higher risk by a discharge channel constructed to protect Mulhouse.
Likewise, the events that affected Colmar usually also impacted several neighbouring towns (Pearson's coefficient with the number of municipalities per event: +0.14), including Holtzwihr, Merxheim, Ribeauvillé, and Zimmerbach (Pearson's coefficient: +0.25, +0.25, +0.25, and +0.23, respectively), and even more often Illhaeusern (Pearson's coefficient: +0.40). These flood events were significantly more related to ice jams and long-lasting rainfall than the other events of the analysed sample (Pearson's coefficient: +0.24, and +0.16, respectively), and they caused in particular functional damage (Pearson's coefficient: +0.16). Among the events that affected Colmar, medium-severity events (Pearson's coefficient: +0.21) as well as type RT events (Pearson's coefficient: +0.14) are over-represented, whereas Class I events are under-represented (Pearson's coefficient: −0.25). Stronger positive associations are seen with municipalities situated like Colmar along the Ill and Lauch rivers, or along the Ill and Fecht rivers, which is due to the fact that the hydrological regime of the Lauch and Fecht rivers is rather similar.
Finally, the events that affected Strasbourg also often affected Artolsheim, Benfeld, Boofzheim, Diebolsheim, Friesenheim, Gerstheim, Illhaeusern, Ostheim, Ostwald, Réguisheim, Saasenheim, and Schoenau (Pearson's coefficient: +0.23, +0.23, +0.23, +0.23, +0.23, +0.27, +0.25, +0.22, +0.24, +0.20, +0.23, and +0.23, respectively) during Class III and IV events (Pearson's coefficient: +0.30 and +0.24, respectively) and rarely during Class I events (Pearson's coefficient: −0.18). Strasbourg floods are generally well documented (Pearson's coefficient with the number of sources: +0.26) and often caused different damage types (Pearson's coefficient with the amount of damage: +0.28). They often match the RT typology and hardly ever fit the T typology (Pearson's coefficient: +0.48 and −0.42 respectively). Stronger positive associations between municipalities are seen for those situated either along the Rhine River or along the Ill River.
Owing to its particular hydrological, climatic, and topographic context and to its dense population (roughly two times the mean population density of France), the Alsatian region is very sensitive to flood risk, with large flood-prone areas and potentially disastrous consequences (people killed, buildings and/or crop destroyed, economic losses due to functional damage, etc.) for the most intense events (high return period floods in single rivers and/or widespread events affecting a large number of rivers, up to almost all of the Ill–Rhine tributaries together). For this specific territory, the web platform ORRION documents floods in terms of sources, dates of occurrence, causes, and consequences. Most of the events have occurred since the end of the 15th century, but a few of them occurred earlier for distinct rivers, especially the Rhine, for which the time frame covered extends over more than one millennium.
This article has shown that information accumulated this way and its organization by event is sufficiently rich and convenient to significantly update what was known to date about floods in the greater Alsatian region (Himmelsbach et al., 2015; Martin et al., 2017, and previous work). Specifically, it allows us to complement the results already obtained at the much larger scale of major European rivers (Glaser et al., 2010) and for specific events in the database (Martin et al., 2010). For instance, comprehensive flood occurrence data are now available for many rivers and municipalities with a careful distinction of floods with and without overflow and according to specific typologies regarding the hydrological configuration, causes, and severity of each event. The combination of these data with a simple but systematic statistical analysis allowed us to document the flood hazard and risk for the study territory with unprecedented accuracy and exhaustiveness. For example, significant associations that are generally easy to interpret could be provided between almost all the variables we analysed (causes, consequences, severity class, season of occurrence, damage types, etc.).
In more detail, the Rhine River is known to be largely influenced by the Alps, where it has its source, and therefore has a nivo-glacial hydrological regime, with high water in early summer. This is obviously consistent with the flood seasonality and causes documented by ORRION. Conversely, the Alsatian tributaries are known to have their peak discharge generally in winter, and sometimes in summer, although in Alsace precipitation amounts are at a maximum in spring–summer. Again, this fits our results showing that the floods affecting the Alsatian tributaries have a bimodal seasonal distribution, mostly due to snowmelt in the Vosges Mountains and to continuous precipitation (for winter floods) and to thunderstorms (for summer floods). These differentiated flood causes and seasonal distribution as a function of the hydrological configuration reflect the results obtained by Himmelsbach et al. (2015) with a smaller number of Alsatian rivers. Yet, the richest information in ORRION is related to the time depths of the series, whose outcomes are summarized in the following sections.
5.1 Flood changes over time as a function of social and environmental factors
We indeed highlighted strong non-stationarity in the flood chronologies, at all spatial scales (rivers, municipalities) and for the different event typologies we considered. Explaining in detail all the patterns of changes in all the chronologies is beyond the scope of this paper because the sources (in particular the way archives were created and analysed), land use (including corrective measures for rivers), and climatic factors have undergone major changes over the study period and all played a role (Martin et al., 2017). However, contextualizing the sources and the events is sufficient to understand the main effects underpinning our results.
5.1.1 Changes related to sources and documentation of past events
The way the search is conducted through the archives (systematic or not, etc.) influences the results. Thus, it is not relevant to look at trends before the end of the 15th century. The TRANSRISK research programme began its study at that time. Older records are periodic and generally attributed to indirect sources that have rarely been verified. It should also be noted that the systematic search in the archives focused on the 19th and 20th centuries only, a period that enjoyed certain homogeneity in terms of production and conservation of archives (Lang et al., 2003; Giacona et al., 2017). However, some recent events are missing or incomplete in the ORRION database because documents related to them were not already available in the departmental archives. The floods of April and May 1983 were major floods indeed, but they appear in our chronology as Class III events only (10 impacted municipalities for both floods) because departmental archives are still incomplete for this recent period. Additional searches were conducted in the local press within the framework of TRANSRISK2, generating a huge number of new data currently not integrated into the ORRION database. This is certainly the most important factor explaining flood non-stationarity in our chronologies. For instance, the slight (and counterintuitive) increase in the number of Class III events over time is certainly partly due to the more systematic research conducted over the last two centuries. Moreover, as already mentioned, the appearance of Class IV events at the end of the 17th century constitutes an artefact linked to our typology and to more incomplete and/or less detailed sources for the earlier periods. Hence, increasing patterns in Class III and IV are partially related to an increase in sources simply, meaning that more and more elements at risk were set up along rivers (vulnerability increase). Similarly, the apparently higher exposure to risk of the municipalities situated in the south of the studied region is, at least partly, linked to the fact that more research was done in this sector to retrieve old events than in the rest of the Alsatian region, especially for the Largue, Lauch, Fecht, and Ill rivers.
However, other societal factors also play a role, and our capacity to retrieve past events must be related to the cultural and political context. The study area has, for instance, faced three French–German conflicts between 1870 and 1945. During these 75 years, it changed its sovereignty five times, its administrative system, and its language. Such a history does not benefit the continuity of knowledge on flood risk. In addition to the fact that part of the information included in the archives may have been destroyed or lost, information is sometimes very hard to understand or interpret for the layperson: imprecise classifications, documents, and press in German and in Gothic script, etc. (e.g. Himmelsbach et al., 2015). This especially applies to the German period between 1870 and 1918: although the Alsatian population faced the strongest floods of the last 150 years during that period (i.e. 1876, 1882, 1910, and 1919), these events remain largely unknown by the local French authorities today (Martin et al., 2015a).
More generally, the process that transforms observations into sources depends on the relations between societies and their environment, in particular rivers. Sources are closely related to damage but also to strategic and economic issues. Thus, because of the Rhine's strategic importance as a transport corridor since the 19th century (see below), floods without overflow were systematically documented during part of the 19th and 20th centuries and kept in the archives. This was not the case for the earlier period, during which the Rhine was much less navigated. This explains the sudden increase in records of floods without overflow since the 19th century (Fig. 11m). Moreover, it should be noted that, in many cases, the floods we considered as being without overflow correspond to sources with brief information only. This means that there is often doubt about the exact nature of the flood (with and without overflow). Hence, this information must be considered with extra caution. For instance, the great proportion of floods without overflow of the Bruche River is clearly an artefact directly related to the nature of the sources that could be analysed (a large number of technical reports document each abnormally high runoff for this specific river).
All in all, it should be stressed that ORRION, and, hence, our paper, aims at presenting “raw” flood information avoiding subjective choices as much as possible; therefore no explicit correction of potential biases related to sources has been achieved. By contrast, the information required to conduct a rigorous geohistorical analysis of the event chronologies is provided. Specifically all sources referring to events remain fully available within the database. Also, the evolution of sources with time at the regional scale has been already studied by Himmelsbach et al. (2015), and specific biases have been identified by Martin et al. (2015a). This all should enable the source bias to be, in the future, disentangled from other effects by anyone interested in using the information, for example, in improving risk mitigation or studying the influence of climate on flood occurrences. It should also be recalled at this stage that the proposed record is based on an extensive archival campaign (TRANSRISK project) further complemented by participative data, so as to maximize the amount of information summed up regarding past events and limit the initial source bias as much as possible.
5.1.2 Changes related to land use and risk management
The chronologies that go far back in time are those of the Rhine and the Ill rivers. Those of the smaller tributaries flowing down the Vosges Mountains start much later. Events recorded are also more regular over time for the Rhine and Ill rivers. This can be partly linked to socio-spatial dynamics. Indeed, most of the population of the region for a long time lived in the lowlands along the rivers, where a large number of elements at risk were thus located throughout the study period. On the contrary, the Vosges Mountains have always been less densely populated, thereby explaining the difference in the length and regularity of records.
However, until the 19th century, the Rhine River was characterized by a sinuous course formed of braided and anastomosed channels, with a very wide main bed that changed very often. Massive corrective works were then conducted to channel its course. This allowed for the economic development of the territories bordering the river, which became a major axis of goods' circulation. Furthermore, this probably contributed to the drastic reduction of Rhine River floods at the turn of the 20th century (Tulla correction achieved in 1876, correction of the Swiss Jura rivers carried out between 1868 and 1891) and to their quasi-disappearance since the mid-20th century (construction of the Grand Canal d'Alsace between 1932 and 1959), especially regarding floods with overflow. A similar analysis can also be applied to other smaller rivers to explain certain major breaks that occurred locally at certain times points in the study period and to major cities, where important works were carried out to reduce their vulnerability to flooding. As a striking example, the absence of significant flooding affecting Mulhouse since the beginning of the 20th century may be related to the construction of the Ill River discharge channel completed in 1906, which has proven to be effective (Martin et al., 2015a; Fournier and Holleville, 2016). The same holds true for Strasbourg, protected from any floods of the Ill River since the construction of a discharge channel in 1891. The old town of Strasbourg has not been flooded since 1882. Moreover, even if the flood of 1919 was probably the largest of the 20th century, the damage was extensive in the entire basin but not in Strasbourg.
As already stressed for sources, no attempt was made to correct biases in the record induced by land-use changes, including construction of mitigation measures. This choice was guided by (i) the objective of our work – providing the raw data in a transparent manner – and (ii) the complexity and time required to do this in a realistic way. Indeed, the increase of wealth and infrastructures, for example, can have various consequences on flood risk, direct or indirect, immediate or delayed, positive or negative, local or at larger scale, etc. Also, these consequences can be on the hazard, the stakes and the vulnerability, the perception and the memory of risk, or the production of sources, etc. In short, the whole chain that leads to the data currently in ORRION can be affected, and a very large amount of additional information is required in order to really understand the changes of the whole system at risk through time. In addition to the fine-scale studies mentioned above that demonstrated the impact of the construction of the Ill canal on the flood record in Mulhouse and in Strasbourg, first regional-scale analyses could already be conducted. It appeared, for example, that the spatial distribution of the consequences of the 1910 flood in the Rhine plain can only be understood if one considers the uneven development of river correction works at that time (Martin et al., 2017). However, much work remains to be done to generalize such approaches at the scale of our entire database. According to this aim, rather than disseminating in ORRION “corrected” records and “definite” conclusion”, the idea is to provide as much information as possible. This should allow anyone to conduct their own analysis, so as to determine and weight the different factors that combine to explain the flood record for each river or location. In this perspective, it is planned that further information regarding past engineering activities is documented in ORRION. For instance, historical river profiles, mostly from the Rhine and the Ill rivers, were already searched in the archives and were found useful to, for example, better understand the major floods of 1910 and 1919. These profiles will be included in ORRION. However, so far, such archival searches have not been very successful (apparently many old river profiles have been lost or destroyed); therefore new archival searches at the Services de Navigation (which was inaccessible until very recently) will be undertaken. This should in fine contribute to a better understanding of the spatio-temporal distribution of flood events, distinguishing anthropogenic factors related to sources, vulnerability, and infrastructures, from natural factors related, for example, to climate.
5.1.3 Changes related to climate drivers and consistency with other flood records
Climate factors were indeed clearly not stationary over the study period spanning more than one millennium, and the way they have changed in the study area is now well documented (e.g. Glaser and Riemann, 2009; Zorita et al., 2010; Le Roy Ladurie et al., 2011; Glaser, 2013). How this may explain the changes in flood activity that we document remains difficult to determine. This is especially true for the beginning of the study period, owing to the sparseness of the data at that time and the complexity of the combination of weather factors generating floods. However, the major climate change patterns of the past centuries are clearly visible in most of our chronologies. After the rather warm medieval period, the study area experienced the cold of the Little Ice Age (LIA) up to the second half of the 19th century (Grove, 1988, 2001) and is now affected by the recent anthropogenic warming occurring in the past few decades. The temporal distribution of flood causes reflects these patterns of change: floods attributed to ice break-ups and ice jams have no longer been documented since the mid-19th century (except one event during the 1940s). This may simply result from the end of the LIA that caused a significant increase of winter temperature in the area (Flageolet, 2005; Auer et al., 2007). Also, the recent warming may explain the concomitant drastic increase of floods caused by thunderstorms we report (Fig. 14).
Hence, if one puts aside the more or less continuous increase of sources over the study period, phases of high and low flood activity can roughly be related to the prevalent climate context. For instance, the first activity peak in our event chronology (∼1600) corresponds to the Maunder Minimum (coldest decades) of the LIA. Similarly, the second activity peak in the 19th century corresponds to the Dalton Minimum of the LIA. Notably, many of the most notable floods of the Rhine River we report are concentrated during this short time period corresponding to the LIA termination: 1851, 1852, 1872, 1876, 1876, 1877, 1881, and 1882, and most of the other Alsatian tributaries were also intensively flooded at that time (Figs. 11–12). This is consistent with findings of other studies in areas for which a social explanation for the increase in flood occurrences documented during these decades cannot be given (e.g. Wilhelm et al., 2013). Hence, this high activity pattern appears to be robust, and climate factors may be a plausible explanation for its origin.
To further test the consistency of our record, we compared our most severe events (Class III and IV) to the extreme flood events identified by Glaser et al. (2010) for 12 major rivers of central Europe including the Rhine. Specifically, Glaser et al. (2010) identified 13 major flood events between 1500 and 1900. Among these, two correspond to high (Class III) or extreme (Class IV) events of our record: January–February 1862 (Class IV) and February 1876 (Class III). Another event of Glaser et al.'s inventory is for us a class I event (march 1784), whereas four other events of Glaser et al.'s inventory correspond to events in our record for which we could not determine the severity class (as for 35 % of the studied ORRION events in total). Considering this latter specific difficulty, the comparison appears therefore to be rather probative, with around half of Glaser's years corresponding to ORRION events. This is all the more true when considered that whereas the work of Glaser et al. focuses on major rivers of the length and watershed size corresponding to the ones of the Rhine, ORRION events correspond to a very wide range of flood types in terms of rivers and spatial extent concerned. Especially, a significant part of ORRION events concerns only one or few small Alsatian tributaries flowing down from the Vosges Mountains and corresponds to floods that occurred after a very localized rainfall event such as a thunderstorm. It is therefore not surprising at all that the agreement between Glaser et al.'s and ORRION records is far from perfect. Finally, for the 20th century, correspondence between well-known flood events and our record can also be found. January 1910 was the most intense flood event of the Seine River in Paris over the last centuries. It is also a Class IV event in our record. January 1936, that was the time of an extremely widespread and intense flood episode over the North Atlantic (Ballesteros-Cánovas et al., 2019), is also in our record but corresponds to an event for which we could not determine the severity class. All in all, of course, much more can be done in terms of comparison between ORRION and other records. However, this quick comparison already further suggests that, even if the event chronologies that can be derived from the ORRION database are clearly affected by human factors related to sources, and vulnerability, etc., they also include information related to the physics of flood processes and to their underlying hydro-meteorological causes.
5.2 Pros and cons of the data structure and chosen event typologies
The space and time comprehensiveness of ORRION and the easy browsing of the database allows information that is highly valuable for supporting risk management policies to be easily extracted and used. For instance, its original organization by event facilitates the easy characterization of areas potentially threatened within a single meteorological situation, with a direct measure of the likelihood of different rivers flooding at the same time, a very valuable contribution to operational risk management at the local scale. As a further example of its value, the database has already been mobilized for the positioning of flood marks in the framework of the French PAPIs (flood protection plans). It thus allows local stakeholders, who have forgotten old and severe floods affecting rivers for which they have the risk management responsibility, to increase their knowledge about flood risk.
Yet, to build ORRION and further exploit and summarize the large number of data at hand in this specific study, we had to make stringent working choices and assumptions. For instance, we chose simple but robust classification schemes for the severity and hydrological configuration of events. These were shown to be sufficient to reach meaningful conclusions, but, clearly, they could be refined and reconsidered in further work. Also, our choices must be kept in mind when deriving conclusions from our results. For example, the distinction we made between floods with and without overflow was found to be useful, but, in practice, it raises some questions. Indeed, some floods caused damage without overflow (to a mill in the main channel, for example). Since sources are mainly related to damage, this situation is found rather frequently. For a given event, we chose to define a flood as an overflow (i.e. in order to appear in the analysed sample an event must include an overflow for at least one river). As a result, not all the damage currently in ORRION was taken into account in this study. Damage that occurred during events without known overflow was de facto excluded. Also, for the work done at the scale of municipalities, only overflows were considered. Therefore, not all damage that occurred without overflow in a given municipality appears in the corresponding local statistics. The results we obtained regarding municipalities were thus highly dependent on the implementation of defence structures such as dykes, which (theoretically) make overflow much more difficult. This effect explains in part the temporal changes in the chronology of events for the Rhine River (Fig. 11m) and for the largest Alsatian cities (Fig. 16).
Finally, our severity classification is strongly driven by damage, and the damage score we retain for an event is the one corresponding to the highest registered damage. This has the effect of smoothing potential spatial differences across the study area, especially for events of large extent. However, our severity classification approach was based on pragmatic considerations. We wanted a measure that combines spatial extent and damage level to assess flood severity, which led us to define seven possible combinations (Table 3). This is not that many, but these different combinations are somewhat difficult to rank. (Is a regional flood with slight damage worse or less severe than a local flood that has caused strong damage?) Also, scales usually used in the risk and natural hazard worlds have five levels, not seven, which is a bit too many. We therefore mapped the seven combinations into three or four categories. This is not a huge reduction of the complexity, but it already makes things easier for the analysis. In particular, the severity class obtained is arguably really an increasing function of flood severity (Class II more severe than Class I, etc.). Note that the damage and spatial extent scores we gave to each event (when this was possible) have obviously been kept; therefore they will be usable for further work including specific analyses within the seven more refined categories (e.g. regional damageable events and localized damageable events).
5.3 The participative choice: a long-lasting but rewarding effort
Given the now well-known limits of top-down approaches in the field of risk management, the TRANSRISK2 research programme focused on the implementation of a participatory approach. The ORRION database has been developed in this way, with the double objective of knowledge capitalization and sharing. The participatory dimension of the database remains for the moment somewhat weak, with only a small amount of the information currently in ORRION coming from the public. However, this is not surprising since many studies have already highlighted the low public interest in natural hazard issues and their management. These studies identified different factors influencing the active engagement of the public, such as “the direct experience of flooding”, “education” and “knowledge”, “the technical resources of the public”, and “public perceptions of technical complexity related to hazard mitigation” (Koehler and Koontz, 2008; Kenyon, 2007; Godschalk et al., 2003). It has even been shown that, because the participative dimension is absent from the prevalent culture of flood risk management, a paradigm shift can be problematic in terms of method and/or practical implementation (Evers et al., 2016; Ruiz-Villaverde and García-Rubio, 2017; Hegger et al., 2013; Simonovic and Akter, 2006; Thaler and Levin-Keitel, 2016; When et al., 2015). As a consequence, the participative approach remains uncommon (Jingling et al., 2010; Koehler and Koontz, 2008), and is even sometimes considered as being responsible for generating tension between the actors concerned (Kuhlicke et al., 2016).
Hence, in practice, it is still largely “experts” who define the risk and the answers to be given (e.g. November et al., 2011), thereby inducing a clear distinction between public knowledge and expert knowledge. In practice, often, at best an integration of local authorities and experts into the risk management process is aimed at. Even more simply, it is sometimes deemed sufficient to set up communication strategies to inform the public or raise public awareness of the risks involved (e.g. Kuhlicke et al., 2016) or to help the public accept the management strategies defined by the experts (Hubert and De Vanssay, 2005; Vinet, 2010). Finally, when a participative approach is adopted, it usually consists in summing up oral memory or, more generally, in exploiting information produced by the public in a one-way movement in order to improve the mapping of a phenomenon or crisis management (e.g. Kundu and Kundu, 2011). As an example, the citizens' natural risk observatory of the French Geological Survey aims at collecting information from social media. Thus, few projects conceive the participative choice as a collaborative exchange and decision-making process in which the different stakeholders and public involved fully contribute to the risk management process, from the definition of the problem to the answers to be given (Simonovic and Akter, 2006).
Despite these difficulties and the few successful participative experiences currently underway, the adoption of the ORRION tool by citizens is fundamental given the currently poor documentation of extreme floods in the Alsatian region, and, more generally the weakness of the existing risk awareness schemes. This latter situation is certainly partly due to the particular historical context of the region, as mentioned earlier. Another reason may be that the last major flood occurred in 1990, almost 30 years ago, and therefore its memory has blurred with time. Indeed, things may have been different in the context of more frequent major floods or just after a disaster. For instance, during the June 2013 Pyrenees floods, researchers from the University of Toulouse (France) issued a call for experiences (lived, felt, etc.) and testimonies, including photographs and videos, not only of the current event but also of older episodes. This call for contributions was successful as more than 5000 photographs were collected (Program June 2013 Pyrenees' Flood, 2017; http://cruespyr2013.canalblog.com).
Thus, the participative part of the ORRION is currently not perfect but it represents an encouraging start. The platform is now very well identified by local risk management actors, but some work remains to be done to involve the general public more. According to this aim, communication is clearly necessary to make more people aware of the existence of ORRION, of the reality of flood risk in the Alsatian region, and of the importance for disaster reduction that any information they have is made largely available on the platform. As an example of such actions, the Facebook page devoted to ORRION has helped greatly in increasing visibility among 18–35-year olds (more than 5000 have seen a publication concerning the 1947 flood). Also, after a report in the local newspapers of the major flood of December 1947, 70 years after its occurrence, there was an increase in public contributions to ORRION. In a similar spirit, a commemoration of the 1919–1920 extreme-sized flood event for its centennial anniversary is now planned to remember the destruction the region suffered at that time and to highlight how difficult it would be to deal with a similar event today. Illustrative numerical simulations of the event and of its damage potential using the participative ORRION information as input and with results displayed and explained on the web platform are also envisaged. This would be a step further in the direction of a better sharing of risk knowledge between citizens, stake-holders, technicians, and scientists and may exemplify how exchange between all these groups of people may lead to mutual benefits.
The European Floods Directive has published specific guidelines for disaster reduction. As a response to the expressed need of improving both the documentation of past events and the sharing of information between all parties concerned, this article has presented the regional flood risk observatory ORRION and its very rich data content. Grounded on two multidisciplinary research projects, ORRION has been designed as a participative online platform on which knowledge capitalization and exchange are maximized. Hence, the uniqueness of ORRION is to be a collaboration, communication, and awareness tool with strong potential for both geophysical inference and operational outcomes.
This article has shown that the data and original organization by events attest to the complex and specific historic situation of the Alsatian region that has undergone manifold political changes over the past few centuries. Consequently, the database helps to renew our knowledge of flood hazard and risk in the French Upper Rhine catchment area, providing long spatio-temporal chronicles of floods for 13 rivers, and for all Alsatian municipalities, as well as their main characteristics according to various typologies (seasonality, causes, damage types, severity). It also helps identify the major changes and their social and environmental drivers throughout the study period. However, no attempt of any kind was made to correct the different bias in the records. Instead, in ORRION, the choice was made to provide as much information as possible to allow the records to be meaningfully interpreted by any potential user. Methodological developments now exist to remove the trend due to population increase and source availability (Macdonald and Sangster, 2017). Such an approach could be put to use for ORRION's events, so as to help interpret them in terms of increase and decrease of flood frequency and more generally in terms of changes in hazard and risk through time.
Indeed, in this work, only a simple statistical analysis of the summed up abundant information was performed. This choice was made because it is arguably sufficient to highlight the main characteristics in space and time of the data and to highlight and discuss the factors that explain the spatio-temporal distribution of flood events, namely a combination of anthropogenic factors related to sources, vulnerability, and infrastructures, but also of natural factors related, for example, to climate, both at the scale of the entire database and/or for more specific rivers and locations. Assessing association solely on the basis of the Pearson coefficient may be seen as oversimplified, but it was feasible with our binary, continuous data set and sufficient to identify couples of variables, rivers, and municipalities, etc. that behave similarly over the study area and/or the study period. Also, the data set at hand was very large; we wanted to process it in a unified and systematic way, and we could not find a method with stronger mathematical justifications that would have allowed this at reasonable computational costs. However, further research could clearly be grounded on our preliminary analysis to exploit the preprocessed data in many more specific directions. For example, using logistic regressions would be much more appropriate than what we did to assess linkages between binary and continuous variables, and specific tests could be further implemented to evaluate the significance of simultaneous flooding based on various conditions. More generally, explicit statistical modelling with advanced non-separable spatio-temporal covariance models instead of the rather simple descriptive techniques that were used in this work would be beneficial. Coupled with the diachronic analysis of land use, settlements, and practices, this may facilitate further understanding of the main pattern of change in flood risk, such as the respective weight of climatic and social factors in the dramatic increase in flood activity that was identified in the first half of the 19th century. Doing this systematically for the records at hand and interpreting all related results is clearly beyond the scope of our first analysis, but the door is wide open for many appealing further analyses.
Among possible directions, reconstruction of past peaks discharge is one priority. Indeed, methods making it possible to reconstruct peak discharges more or less precisely from historical sources are now increasingly popular in the flood literature (Benito et al., 2004; Herget and Meurs, 2010). These were already used for the Kinzig River within the German part of the TRANSRISK project. Also, ORRION's information already allowed the historical floods of 1852 and 1860 for the Ill in Mulhouse to be better characterized and the corresponding discharge modelling that has been realized within the framework of the European Floods Directive to be validated. Finally, the study of historical water levels already revealed that the computation of the centennial flood of the Zorn River should be reconsidered (Martin et al, 2018). Hence, we are well aware of the potential of the available information for discharge reconstructions and of the usefulness of doing this for improving operational flood risk management. Preliminary approaches will therefore be expanded and generalized, in order to, in the future, associate discharge information with ORRION events within the database. For instance, the information summed up in ORRION will certainly be used to drive further hydrological and hydraulic simulations in order to provide greater detail on the dynamic characteristics of the flood events themselves (response time of the watersheds, flooded areas and corresponding water depths, efficiency of existing or potentially new countermeasures for the hazard, etc.). This will be a valuable contribution to the improvement of current legal hazard and risk maps and to their necessary adaptation to ongoing climate and societal changes. Hence, as already acknowledged by the concrete examples given above, ORRION should really be seen as a powerful tool to concretely improve flood risk management in the targeted area.
Finally, concerning the data already available, some improvements are also necessary. The available information, although impressive, is certainly not exhaustive. Further browsing of archival documents, local press, and official documents initiated after disaster occurrences and integration of their output into ORRION are envisaged if the funds can be obtained. This would allow for better documentation of the Alsatian rivers that have not been studied so far because the number of flood events involving these rivers has not been regarded as representative enough of the physical reality of flood hazard and risk. In parallel, documentation of certain major events of the past such as the 1910 and 1919 floods could thus be improved, and more contextual information regarding, for example, past engineering work and ancient river profiles will be included in the database. However, the main challenge in terms of data improvement is to promote database enrichment through its participative interface. The advantages and limitations of the participative approach have been discussed, highlighting its potential but also the difficulty of ensuring that the highest number of potential contributors take part. We sincerely hope that, thanks to devoted communication and dissemination actions, it will be possible to intensify this effort in the upcoming years.
All the data supporting this study can be freely accessed and browsed on the ORRION participative platform (http://orrion.fr/). Feedback and contributions are most welcome.
FG, BM, and RG designed the research; FG, BF, IH, and CE built the ORRION database; NE and FG did the statistical analyses; all authors contributed to the analysis and interpretation of the results; and FG and NE wrote the paper based on input from all co-authors.
The authors declare that they have no conflict of interest.
This research has been supported by the French National Research Agency and the German Research Foundation in the framework of the project TRANSRISK2.
This paper was edited by Uwe Ulbrich and reviewed by Neil Macdonald and two anonymous referees.
Albrecht, J.: Legal framework and criteria for effectively coordinating public participation under the Floods Directive and Water Framework Directive: European requirements and German transposition, Environ. Sci. Policy, 55, 368–375, https://doi.org/10.1016/j.envsci.2015.07.019, 2016.
Auer I., Böhm, R., Jurkovic, A., Lipa, W., Orlik, A., Potzmann, R., Schöner, W., Ungersböck, M., Matulla, C., Briffa, K., Jones, P. D., Efthymiadis, D., Brunetti, M., Nanni, T., Maugeri, M., Mercalli, L., Mestre, O., Moisselin, J.-M., Begert, M., Müller-Westermeier, G., Kveton, V., Bochnicek, O., Stastny, P., Lapin, M., Szalai, S., Szentimrey, T., Cegnar, T., Dolinar, M., Gajic-Capka, M., Zaninovic, K., Majstorovic, Z., and Nieplova, E.: HISTALP – Historical instrumental climatological surface time series of the greater Alpine region 1760–2003, Int. J. Climatol., 27, 17–46, 2007.
Ballesteros-Cánovas, J. A., Stoffel, M., Benito, G., Rohrer, M., Barriopedro, D., García-Herrera, R., Beniston, M., and Brönnimann, S.: On the extraordinary winter flood episode over the North Atlantic Basin in 1936, Ann. NY Acad. Sci., 1436, 206–216, 2019.
Benito, G., Díez-Herrero, A., and De Villalta, M. F.: Magnitude and frequency of flooding in the Tagus basin (Central Spain) over the last millennium, Climatic Change, 58, 171–192, 2003.
Benito, G., Thorndycraft, V. R., Enzel, Y., Sheffer, N. A., Rico, M., Sopeña, A., and Sánchez-Moya, Y.: Palaeoflood data collection and analysis. Systematic, Palaeoflood and Historical Data for the Improvement of Flood Risk Estimation, Methodological Guidelines, 15–27, 2004.
Bourova, E., Maldonado, E., Leroy, J.-B., Alouani, R., Eckert, N., Bonnefoy-Demongeot, M., and Deschatres, M.: A new web-based system to improve the monitoring of snow avalanche hazard in France, Nat. Hazards Earth Syst. Sci., 16, 1205–1216, https://doi.org/10.5194/nhess-16-1205-2016, 2016.
Brázdil, R., Kundzewicz, Z. W., and Benito, G.: Historical hydrology for studying flood risk in Europe, Hydrolog. Sci. J., 51, 739–764, https://doi.org/10.1623/hysj.51.5.739, 2006.
British Hydrological Events database: available at: http://www.cbhe.hydrology.org.uk/index.php, last access: 2 May 2019.
Challies, E., Newig, J., Thaler, T., Kochskämper, E., and Levin-Keitel, M.: Participatory and collaborative governance for sustainable flood risk management: An emerging research agenda, Environ. Sci. Policy, 55, 275–280, https://doi.org/10.1016/j.envsci.2015.09.012, 2016.
Collet, P.: Inondation: vers une forte hausse des dommages subis par les 28 états membres de l'UE, Environnement et technique, 335, 14–15, 2014.
Collombat, P.: Se donner les moyens de ses ambitions: les leçons des inondations du Var et du sud-est de la France, report no. 775 (2011–2012) on behalf on the floods' information mission in the Var Region (France), available at: http://www.senat.fr/rap/r11-775/r11-77599.html (last access: 20 June 2018), 2012.
Database of the French Restauration des Terrains en Montagne services: available at: http://rtm-onf.ifn.fr/, last access: 4 December 2017.
Database of the regional risk observatory in the Provence–Alpes–Côte d'Azur region (south-eastern France): available at: http://observatoire-regional-risques-paca.fr/, last access: 4 December 2017.
Decrop, G. and Charlier, C.: De l'expertise scientifique au risque négocié, Le cas du risque en montagne, CEMAGREF, Antony, France, 102 pp., 1997.
European Union: Directive 2007/60/EC of the European Parliament and of the Council on the assessment and management of flood risks of 23 October 2007 on the assessment and managed of flood risks, Official Journal of the European Union, L 288/27, 27–34, 2007.
Evers, M., Jonoski, A., Almoradie, A., and Lange, L.: Collaborative decision making in sustainable flood risk management: A socio-technical approach and tools for participatory governance, Environ. Sci. Policy, 55, 335–344, 2016.
Flageolet, J. C.: Où sont les neiges d'antan? Deux siècles de neige dans le massif vosgien, Nancy, Presses universitaires de Nancy, 220 pp., 2005.
Fournier, M.: Le riverain introuvable! La gestion du risque d'inondation au défi d'une mise en perspective diachronique. Une analyse menée à partir de l'exemple de la Loire, PhD thesis, University of François Rabelais – Tours, France, 431 pp., 2010.
Fournier, M. and Holleville., N.: Le “canal de décharge des eaux d'inondation de l'Ill”: retour sur la construction d'un ouvrage de protection structurant dans l'essor urbain de la ville de Mulhouse, in: Fournier P. et Massard-Guilbaud G., Aménagement et environnement, Perspectives historiques, Presses Universitaires de Rennes, 2016.
French historical flood database “BDHI”: available at: http://bdhi.fr/, last access: 4 December 2017.
Giacona, F., Eckert, N., and Martin, B.: A 240-year history of avalanche risk in the Vosges Mountains based on non-conventional (re)sources, Nat. Hazards Earth Syst. Sci., 17, 887–904, https://doi.org/10.5194/nhess-17-887-2017, 2017.
Glaser, R.: Klimageschichte Mitteleuropas – 1200 Jahre Wetter, Klima, Katastrophen WBG, Darmstadt, 3. Auflage, 2013.
Glaser, R.: Global Change: Das neue Gesicht der Erde, Primus Verlag, 2014.
Glaser, R. and Riemann, D.: A thousand-year record of temperature variations for Germany and Central Europe based on documentary data, J. Quaternary Sci., 24, 437–449, 2009.
Glaser, R., Riemann, D., Schönbein, J., Barriendos, M., Brazdil, R., Bertoli, C., Camuffo, D., Deutsch, M., Dobrovolny, P., van Engelen, A., Enzi S., Halickova, C., König, S., König, O., Limanowka, D., Mackova, J., Sghedoni, M., Martin, B., and Himmelsbach, I.: The variability of European floods since AD 1500, Climatic Change, 101, 235–256, 2010.
Glaser, R., Kahle, M., and Hologa, R.: The tambora.org data series edition.- tambora.org data series, https://doi.org/10.6094/tambora.org/2016/seriesnotes.pdf, 2016.
Godschalk, D. R., Brody, S., and Burby, R.: Public Participation, in Natural Hazard Mitigation Policy Information: Challenges for Comprehensive Planning, J. Environ. Plann. Man., 46, 733–754, 2003.
Grove, J. M.: The little ice age, London and New York, Taylor & Francis, 1–524, 1988.
Grove, J. M.: The Onset of the Little Ice Age, in: History and Climate: Memories of the Future?, edited by: Jones, P. D., Ogilvie, A. E. J., Davies, T. D., and Briffa, K. R., Boston, Springer US, 153–185, 2001.
Guzzetti, F. and Tonelli, G.: Information system on hydrological and geomorphological catastrophes in Italy (SICI): a tool for managing landslide and flood hazards, Nat. Hazards Earth Syst. Sci., 4, 213–232, https://doi.org/10.5194/nhess-4-213-2004, 2004.
Hegger, D., Green, C., Driessen, P., Bakker, M., Dieperink, C., Crabbé, A., Deketelaere, K., Delvaux, B., Suykens, C., Beyers, J.-C., Fournier, M., Larrue, C., Manson, C., van Doorn-Hoekveld, W., van Rijswick., M., Kundzewicz, Z., and Goytia Casermeiro, S.: Flood Risk Management in Europe – similarities and differences between the STAR-FLOOD consortium countries, Open file report (1_D1.1.4_2013_06_11) of the EU 7th Framework Programme (FP7/2007-2013), 24–25, 2013.
Herget, J. and Meurs, H..: Reconstructing peak discharges for historic flood levels in the city of Cologne, Germany, Global Planet. Change, 70, 108–116, 2010.
Hilker, N., Badoux, A., and Hegg, C.: The Swiss flood and landslide damage database 1972–2007, Nat. Hazards Earth Syst. Sci., 9, 913–925, https://doi.org/10.5194/nhess-9-913-2009, 2009.
Himmelsbach, I., Glaser, R., Schoenbein, J., Riemann, D., and Martin, B.: Reconstruction of flood events based on documentary data and transnational flood risk analysis of the Upper Rhine and its French and German tributaries since AD 1480, Hydrol. Earth Syst. Sci., 19, 4149–4164, https://doi.org/10.5194/hess-19-4149-2015, 2015.
HISTRHONE database: available at: https://histrhone.cerege.fr/, last access: 4 December 2017.
Höppner, C., Whittle, R., Bründl, M., and Buchecker, M.: Linking social capacities and risk communication in Europe: a gap between theory and practice?, Nat. Hazards, 64, 1753–1778, https://doi.org/10.1007/s11069-012-0356-5, 2012.
Hubert, G. and De Vanssay, B. (Eds.): Le risque d'inondation et la cartographie réglementaire. Analyse de l'efficacité, des impacts et de l'appropriation locale de la politique de prévention. Programme “Evaluation et Prise en compte des Risques naturels et technologiques”, Ministère de l'Ecologie et du Développement Durable, Paris, France, 188 pp., 2005.
InfoTerre: Internet portal managed by the French Geological Survey, available at: http://infoterre.brgm.fr/, last access: 4 December 2017.
IPCC: Climate Change 2014: Synthesis report, Contribution of Working Groups I, II and III to the Fifth Assessment Report of the Intergovernmental panel on Climate Change, IPCC, Geneva, Switzerland, 151 pp., 2014.
Jingling, L., Yun, L., Liya, S., Zhiguo, C., and Baoqiang, Z.: Public participation in water resources management of Haihe river basin, China: the analysis and evaluation of status quo, Procedia Environ. Sci., 2, 1750–1758, https://doi.org/10.1016/j.proenv.2010.10.187, 2010.
Kenyon, W.: Evaluating flood risk management options in Scotland: A participant-led multi-criteria approach, Ecol. Econ., 64, 70–81, https://doi.org/10.1016/j.ecolecon.2007.06.011, 2007.
Kjeldsen, T. R., Macdonald, N., Lang, M., Mediero, L., Albuquerque, T., Bogdanowicz, E., Brázdil, R., Castellarin, A., David, V., Fleig, A., Gül, G. O, Kriauciuniene, J., Kohnová, S., Merz, B., Nicholson, O., Roald, L.A., Salinas, J.L., Sarauskiene, D., Šraj, M., Strupczewski, W., Szolgay, K., Toumazis, A., Vanneuville, W., Veijalainen, N., and Wilson, D.: Documentary evidence of past floods in Europe and their utility in flood frequency estimation, J. Hydrol., 517, 963–973, 2014.
Koehler, B. and Koontz, T. M.: Citizen Participation in Collaborative Watershed Partnerships, Environ. Manage., 41, 143–154, https://doi.org/10.1007/s00267-007-9040-z, 2008.
Kuhlicke, C., Callsen, I., and Begg, C.: Reputational risks and participation in flood risk management and the public debate about the 2013 flood in Germany, Environ. Sci. Policy, 55, 318–325, 2016.
Kundu, A. and Kundu, S.: Flood Vulnerability Assessment Using Participatory GIS Approach, Journal of Remote Sensing & GIS, 2, 8–22, 2011.
Lang, M., Cœur, D., Brochot, S., and Naudet, R.: Information historique et ingénierie des risques naturels: l'Isère et le torrent du Manival, Cemagref, Lyon, France, 1–180, 2003.
Lang, M., Coeur, D., Bard, A., Bacq, B., Becker, T., Bignon, E., Blanchard, R., Burckmann, L., Delserieys, M., Edelblutte, C., and Merle, C.: Les inondations remarquables en France au XXe siècle: premiers éléments d’analyse issus de l'enquête EPRI 2011, La Houille Blanche, 5, 37–47, https://doi.org/10.1051/lhb/2013041, 2013.
Le Roy Ladurie, E., Rousseau, D., and Vasak, A.: Les fluctuations du climat: de l'an mil à nos jours, Fayard, Paris, France, 321 pp., 2011.
Llasat, M. C., Barriendos, M., Barrera, A., and Rigo, T.: Floods in Catalonia (NE Spain) since the 14th century. Climatological and meteorological asects from historical documentary sources and old instrumental records, J. Hydrol., 313, 32–47, 2005.
Macdonald, N. and Sangster, H.: High-magnitude flooding across Britain since AD 1750, Hydrol. Earth Syst. Sci., 21, 1631–1650, https://doi.org/10.5194/hess-21-1631-2017, 2017.
Martin, B.: Expertise et risques majeurs, le point de vue des géographes, Droit de l'Environnement, 142, 314–322, 2006.
Martin, B.: Une base de données historiques pour gérer les risques de demain, l'exemple de Vars (Hautes-Alpes, France), in Nancy MESCHINET DE RICHEMOND (dir.), Quelles archives aujourd'hui pour mieux gérer les risques demain? Approches géographiques et historiques, Collection Géorisques, no. 3, Montpellier, PULM, 2010.
Martin, B., Guerrouah, O., Vitoux, M.-C., and With, L.: Territorialisation ou déterritorialisation du risque? Analyse comparative et critique de la procédure de réalisation des PPRNP, Riseo: risques études et observations, 1, available at: http://www.riseo.cerdacc.uha.fr/2010-1/ (last access: 20 June 2018), 2010.
Martin, B., Drescher, A., Fournier, M., Gerrouah, O., Giacona, F., Glaser, R., Himmelsbach, I., Holleville, N., Riemann, D., Schonbein, J., Vitoux, M.-C., and With, L.: Les évènements extrêmes dans le fossé rhénan entre 1480 et 2012, Quels apports pour la prévention des inondations?, La Houille Blanche, 2, 82–93, https://doi.org/10.1051/lhb/20150023, 2015a.
Martin, B., Holleville, N., Furst, B., Giacona, F., Glaser, R., Himmelsbach, I., and Schönbein, J.: La géohistoire des inondations au service de l'évaluation critique du zonage du Plan de Prévention des Risques d'Inondation: l'exemple de Thann (Haut-Rhin, France), Belgeo, 1, 16 pp., 2015b.
Martin, B., Holleville, N., Giacona, F., Glaser, R., and Himmelsbach, I.: La variabilité spatio-temporelle des inondations dans le Fossé Rhénan à la lumière de l'évolution de la vulnérabilité, Vertigo, 1, 21 pp., https://doi.org/10.4000/vertigo.18488, 2017.
Minářová, J.: Climatology of precipitation in the Vosges Mountain range area, AUC Geographica, 48, 51–60, 2013.
Naulet, R., Lang, M., Ouarda, T. B., Coeur, D., Bobée, B., Recking, A., and Moussay, D.: Flood frequency analysis on the Ardèche river using French documentary sources from the last two centuries, J. Hydrol., 313, 58–78, https://doi.org/10.1016/j.jhydrol.2005.02.011, 2005.
November, V., Penelas, M., and Viot, P.: Habiter les territoires à risques, PPUR, Lausanne, Switzerland, 264 pp., 2011.
Observatoire national des risques naturels: The National Observatory for natural Risks, available at: http://www.onrn.fr/site/binaries/content/assets/documents/onrn/publications_2015/15-02-11-brochure_onrn_ang.pdf (last access: 15 December 2017), 2015.
Payrastre, O., Gaume, E., and Andrieu, H.: Usefulness of historical information for flood frequency analyses: Developments based on a case study, Water Resour. Res., 47, 15 pp., https://doi.org/10.1029/2010WR009812, 2011.
Program June 2013 Pyrenees' Flood: available at: http://cruespyr2013.canalblog.com, last access: 4 December 2017.
Riemann, D., Glaser, R., Kahle, M., and Vogt, S.: The CRE tambora.org – new data and tools for collaborative research in climate and environmental history, Geosci. Data J., 2, 63–77, 2015.
Roy, A.: La perception sociale des risques naturels, Les données de l'environnement, 99, 4 pp., 2005.
Ruiz–Villaverde, A. and García-Rubio, M. A.: Public participation in European water management: From theory to practice, Water Resour. Manag., 31, 2479–2495, 2017.
Sangster, H., Jones, C., and Macdonald, N.: The co-evolution of historical source materials in the geophysical, hydrological and meteorological sciences: Learning from the past and moving forward, Progress Phys. Geog., 42, 61–82, 2018.
Scarwell, H. J. and Laganier, R.: Risque d'inondation et aménagement durable des territoires 916, Villeneuve d'Ascq, Presses universitaires du Septentrion, 2004.
Simonovic, S. P. and Akter, T.: Participtory floodplain management in the Red River Basin, Canada, Annu. Rev. Control, 30, 183–192, https://doi.org/10.1016/j.arcontrol.2006.05.001, 2006.
Stedinger, J. R. and Cohn, T. A.: Flood frequency-analysis with historical and paleoflood information, Water Resour. Res., 22, 785–793, https://doi.org/10.1029/wr022i005p00785, 1986.
Thaler, T. and Levin-Keitel, M.: Multi-level stakeholder engagement in flood risk management – A question of roles and power: Lessons from England, Environ. Sci. Policy, 55, 292–301, https://doi.org/10.1016/j.envsci.2015.04.007, 2016.
Thema, P. G. M.: Hochwasser in Mitteleuropa seit 1500 und ihre Beziehung zur atmosphärischen Zirkulation, Petermanns Geographische Mitteilungen, 145, 6, 2001.
Veale, L., Endfield, G., Davies, S., Macdonald, N., Naylor, S., Royer, M. J., Bowen, J., Tyler-Jones, R., and Jones, C.: Dealing with the deluge of historical weather data: the example of the TEMPEST database, Geo: Geography and Environment, 4, e00039, https://doi.org/10.1002/geo2.39, 2017.
Vinet, F.: Le Risque inondation. Diagnostic et gestion, Ed. Tec & Doc, Paris, France, 318 pp., 2010.
Wetter, O., Pfister, C., Weingartner, R., Luterbacher, J., Reist, T., Trösch, J.: The largest floods in the high Rhine basin since 1268 assessed from documentary and instrumental evidence, Hydrolog. Sci. J., 56, 733–758, https://doi.org/10.1080/02626667.2011.583613, 2011.
When, U., Rusca, M., Evers, J., and Lanfranchi, V.: Participation in flood risk management and potential of citizen observatories: A governance analysis, Environ. Sci. Policy, 48, 225–236, https://doi.org/10.1016/j.envsci.2014.12.017, 2015.
Wilhelm, B., Arnaud, F., Sabatier, P., Magand, O., Chapron, E., Courp, T., Tachikawa, K., Fanget, B., Malet, E., Pignol, C., Bard, E., and Delannoy, J. J.: Palaeoflood activity and climate change over the last 1400 years recorded by lake sediments in the NW European Alps, J. Quaternary Sci., 28, 189–199, https://doi.org/10.1002/jqs.2609, 2013.
Wilhelm, B., Ballesteros Cánovas, J. A., Macdonald, N., Toonen, V. H., Baker, V., Barriendos, M., Genot, G., Brauer, A., Corella, J. P., Denniston, R., Glaser, R., Ionita, M., Kahle, M., Liu, T., Luetscher, M., Macklin, M., Mudelsee, M., Munoz, S., Schulte, L., George, S. St., Stoffel, M., and Wetter, O.: Interpreting historical, botanical, and geological evidence to aid preparations for future floods, Wiley Interdisciplinary Reviews: Water, 6, e1318, https://doi.org/10.1002/wat2.1318, 2018.
Zorita, E., Moberg, A., Leijonhufvud, L., Wilson, R., Brázdil, R., Dobrovolný, P., Luterbacher, J., Böhm, R., Pfister, C., Riemann, D., Glaser, R., Söderberg, J., and Gonzáles-Rouco, F.: European temperature records of the past five centuries based on documentary/instrumental information compared to climate simulations, Climatic Change, 101, 143–168, https://doi.org/10.1007/s10584-010-9824-7, 2010