the Creative Commons Attribution 4.0 License.
the Creative Commons Attribution 4.0 License.
 | 06 Aug 2019
Impact of the dry-day definition on Mediterranean extreme dry-spell analysis
Pauline Rivoire
Luc Neppel
Elke Hertig
Sergio M. Vicente-Serrano
To define a dry day, the most common approach is to identify a fixed threshold below which precipitation is considered equivalent to zero. This fixed threshold is usually set to account for measurement errors and precipitation losses due to the atmospheric evaporation demand. Yet, this threshold could vary in time according to the seasonal cycle and in the context of long-term trends, such as the increase in temperature due to climate change. In this study, we compare extreme dry spells, defined either with a fixed threshold for a dry day (1 mm) or with a time-varying threshold estimated from reference evapotranspiration (ET0), for a large database of 160 rain gauges covering large parts of the Mediterranean basin. Results indicated positive trends in ET0 during summer months (June, July and August) in particular. However, these trends do not imply longer dry spells since the daily precipitation intensities remain higher than the increase in the evaporative demand. Results also indicated a seasonal behavior: in winter the distribution of extreme dry spells is similar when considering a fixed threshold (1 mm) or a time-varying threshold defined with ET0. However, during summer, the extreme dry-spell durations estimated with a 1 mm threshold are strongly underestimated in comparison to extreme dry spells computed with ET0. We stress the need to account for the atmospheric evaporative demand instead of using fixed thresholds for defining a dry day when analyzing dry spells, with respect to agricultural impacts in particular.
- Article
(3138 KB) - Full-text XML
- BibTeX
- EndNote


The Mediterranean region is affected by severe drought episodes, linked to the strong interannual variability of precipitation patterns (Mariotti and Dell'Aquila, 2012). These droughts can impact agricultural production (Páscoa et al., 2017) and water resources (Lorenzo-Lacruz et al., 2013), when occurring during the (wet) winter season in particular (Raymond et al., 2016). In addition, several studies indicate a tendency toward a warming and drying of the Mediterranean region that could intensify in the future according to climate projections (Hoerling et al., 2012; Hertig and Tramblay, 2017; Naumann et al., 2018).
There are different methods of analyzing droughts, such as by means of drought indices (Mishra and Singh, 2010; Mukherjee et al., 2018) or explicitly modeling the frequency and duration of dry spells (Vicente-Serrano and Beguería-Portugués, 2003). A dry spell is meteorologically defined as a sequence of consecutive dry days with no precipitation or precipitation below a certain threshold. Although dry spells cannot be used to determine drought severity, as a consequence of climatological differences, they are highly useful for assessing spatial differences in the drought hazard probability (Lana et al., 2006) and determining possible trends associated to climate change (Raymond et al., 2016). Moreover, analyses based on dry spells have usually been used for agricultural management purposes in different regions of the world (Sivakumar, 1992; Lana et al., 2006; Mathugama and Peiris, 2011; Raymond et al., 2016).
Several authors analyzed long dry spells, considering different precipitation thresholds (1 to 10 mm d−1) but fixed for the whole observation period (Vicente-Serrano and Beguería-Portugués, 2003; Lana et al., 2006; Serra et al., 2016; Raymond et al., 2016, 2018; Tramblay and Hertig, 2018). For the threshold used to determine a “dry” day, it is usual to use values higher than zero to account for measurement errors or very little amounts of rain that are not available for plants or water resources, due to interception and/or direct evaporation (Douguedroit, 1987; Raymond et al., 2016). In a climate change context it is also used to reduce the typical “drizzle effect” of dynamical models, which results in too many low precipitation amounts compared to observations. The determination of this threshold, denoted as the daily rainfall threshold (DRT), can be a key issue to relate dry-spell risk to impacts in different sectors. Douguedroit (1987) defined a threshold of 1 mm of precipitation in environments with a Mediterranean climate because below this amount the rainfall is generally not absorbed by soils under conditions of high evapotranspiration. It is the most widely used daily rainfall threshold (Polade et al., 2014; Raymond et al., 2016, 2018), even though this arbitrary value has not been supported by any experimental study.
However, fixed thresholds are not representative of real ground conditions, since the evaporation varies throughout the year and for different locations. The atmospheric evaporative demand (AED) can strongly modulate the net precipitation that is available for the plants, affecting water stress levels by plants and crops (Allen et al., 2015; Anderegg et al., 2016; Lobell et al., 2015; Lobell and Field, 2007). It is expected that, based on precipitation records, dry spells of similar duration could be characterized by different water stress as a function of the differences in the AED, as suggested by drought indices using precipitation and the AED for calculations (Beguería et al., 2014; Manning et al., 2018). AED can be calculated using meteorological data from different approaches such as potential evaporation (McMahon et al., 2013) or the reference evapotranspiration (ET0) (Allen et al., 1998), but it can be also measured using evaporation pans. In the Mediterranean region different studies have shown an increase in the AED in recent decades (Vicente-Serrano et al., 2014c), which has increased drought severity (Vicente-Serrano et al., 2014a; Stagge et al., 2017). It is unclear how these trends could affect extreme dry-spell severity.
The goal of the present study is to evaluate the influence of different daily precipitation thresholds for defining a dry day on the estimation of seasonal extreme dry-spell hazard in the Mediterranean. The novelty of the approach proposed herein is the use of the AED to identify dry days prior to the analysis of extreme dry-spell risk. Two thresholds for defining a dry day are compared: 1 mm d−1, the threshold commonly used in most Mediterranean studies, and a daily precipitation threshold defined by the AED, thus seasonally and temporally variable. Two questions are addressed in the present work: (i) are there trends in extreme dry-spell length in Mediterranean region and is the trend detection influenced by the way at which dry days are defined? (ii) Additionally, since in most studies a distinction is made between winter and summer dry spells – due to their different characteristics and impacts (Raymond et al., 2018; Tramblay and Hertig, 2018) – is there a different impact on the estimation of extreme dry spells in winter or summer according to different daily rainfall thresholds?
A network of 160 stations with long daily precipitation records in the Mediterranean region is considered (see Hertig and Tramblay, 2017; Tramblay and Hertig, 2018 for more details about this dataset). Since most stations have almost complete records between 1960 and 2000, it is the period considered in the present analysis to allow a comparison between stations. The years with more than 5 % of days missing have been discarded from subsequent analysis. A preliminary sensitivity analysis considering different missing day ratios has shown that it does not impact the results.
In addition to precipitation data, as a representative and spatially comparable metric of the AED, the reference evapotranspiration (ET0) from the Climate Research Unit (CRU) dataset version 4.2 is considered (Harris et al., 2014). Several studies (McVicar et al., 2012a, b; Todorovic et al., 2013; Vicente-Seranno et al., 2014b; Anabalón and Sharma, 2017) highlighted the need to consider a physically based ET0 calculation, such as the Food and Agriculture Organization (FAO) Penman–Monteith (FAO-PM) equation, to account for possible changes in other variables than temperature in the AED and to have an accurate quantification of the climate change effect on drought (Trenberth et al., 2014). Reference evapotranspiration is defined as the rate of evapotranspiration, only influenced by the atmospheric conditions, from a clipped grass surface that has a 0.12 m height, a bulk surface resistance equal to 70 s m−1, an assumed surface albedo of 0.23 and no moisture stress. In the CRU dataset, the ET0 is computed from a simplified version of the FAO-PM equation (Allen et al., 1998), which uses data of air temperature, sunshine duration, vapor pressure deficit and a climatology for wind speed. The details of the computation are given in Harris et al. (2014). By comparison, potential evapotranspiration (PET) is the evapotranspiration from a given crop surface, requiring the use of crop coefficients that can vary in time due to the development stage of the vegetation. The use of ET0 allows comparison between stations and does not require estimating local crop coefficients.
Two different definitions for a dry spell are used in the present work. The first one considers a dry spell as consecutive days with precipitation below 1 mm. For the second one, the ET0 is considered a threshold to define a dry day when P − ET. In addition, to provide a measure of rainfall intensity we computed the Simple Precipitation Intensity Index (SDII) from daily precipitation, defined as the monthly sum of precipitation during wet days divided by the number of wet days in the month (expressed as mm d−1). It is an interesting metric for the present dry-spell analysis, since the SDII can provide a measure of rainfall intensity that can be compared with the threshold used to define a dry day during a dry spell.
3.1 Statistical tests
To test the presence of trends in the different station time series, the nonparametric Mann–Kendall (Mann, 1945) test was used. Since the presence of autocorrelation in the data could lead to an increased number of type I errors (Serinaldi et al., 2018), we used the trend-free pre-whitening method introduced by Yue and Wang (2002) and modified according to Serinaldi and Kilsby (2015). In addition, since the tests are repeated on a large ensemble of stations (160), we also implemented the false discovery rate (FDR) method of Benjamini and Hochberg (1995) to distinguish between on-site and regionally significant trends (Wilks, 2016).
To compare the different extreme dry-spell distributions, computed with different definitions of a dry day, the Anderson–Darling test (Scholz and Stephens, 1987; Viglione et al., 2007) is considered. The test verifies the hypothesis that two independent samples belong to the same population without specifying their common distribution function. The test statistic measures the distance between the empirical cumulative distribution functions and places more weight towards the tail of the distributions, hence making it adapted to the analysis of extreme values.
3.2 Distribution fitting
To compute the return levels for different extreme dry-spell durations, there is the need to fit a distribution to the samples. No single distribution is commonly applied to extreme dry-spell lengths and we also define dry spells differently to previous studies (Vicente-Serrano and Beguería-Portugués, 2003; Lana et al., 2006; Serra et al., 2016). Thus, the Generalized Extreme Value (GEV), gamma and lognormal distributions are first compared to represent extreme dry spells, using the maximum likelihood estimation method. A split-sample procedure has been implemented to validate the choice of the distribution. The same procedure as described in Zkhiri et al. (2017) and Renard et al. (2013) is retained based on a bootstrap cross-validation. The relative average root-mean-square error (RMSE) for the validation samples is used as an evaluation metric to select the best distribution. The best distribution retained is then used to compute extreme dry-spell quantiles computed with different precipitation thresholds for a dry day.
3.3 Definition of the seasons
The Mediterranean regions are classified as Csa and Csb climate types in the Köppen classification (Peel et al., 2007), defined as climates with a precipitation deficit during summer months (when the subtropical high-pressure belt moves northward and prevents moisture advection from westerlies). The Mediterranean climate is then characterized by two contrasted seasons: a summer (dry) season from around April to September and an extended winter season (wet) from October to March, with most of the precipitation occurring during this period. Yet the transitional months could vary depending on the location and one single definition of the Mediterranean seasons is probably not appropriate due to strong north–south and west–east variations on the beginning and finishing dates for the season of precipitation deficit. This has been highlighted by the recent study of Raymond et al. (2018). Reiser and Kutiel (2009) previously observed different lengths for the wet season (of 40 stations), with less than 6 months in the south and up to 10 months in the north. Thus, in the present study we choose to define the season lengths for each station according to an objective criterion, the precipitation deficit in summer (i.e., the months when P − ET0=0 are defined as the summer season). Then a clustering approach (Ward, 1963) is used to group stations with a similar seasonality. The optimal number of clusters is estimated with the gap statistic (Tibshirani et al., 2001) and silhouette plot (Kaufman and Rousseeuw, 1990).
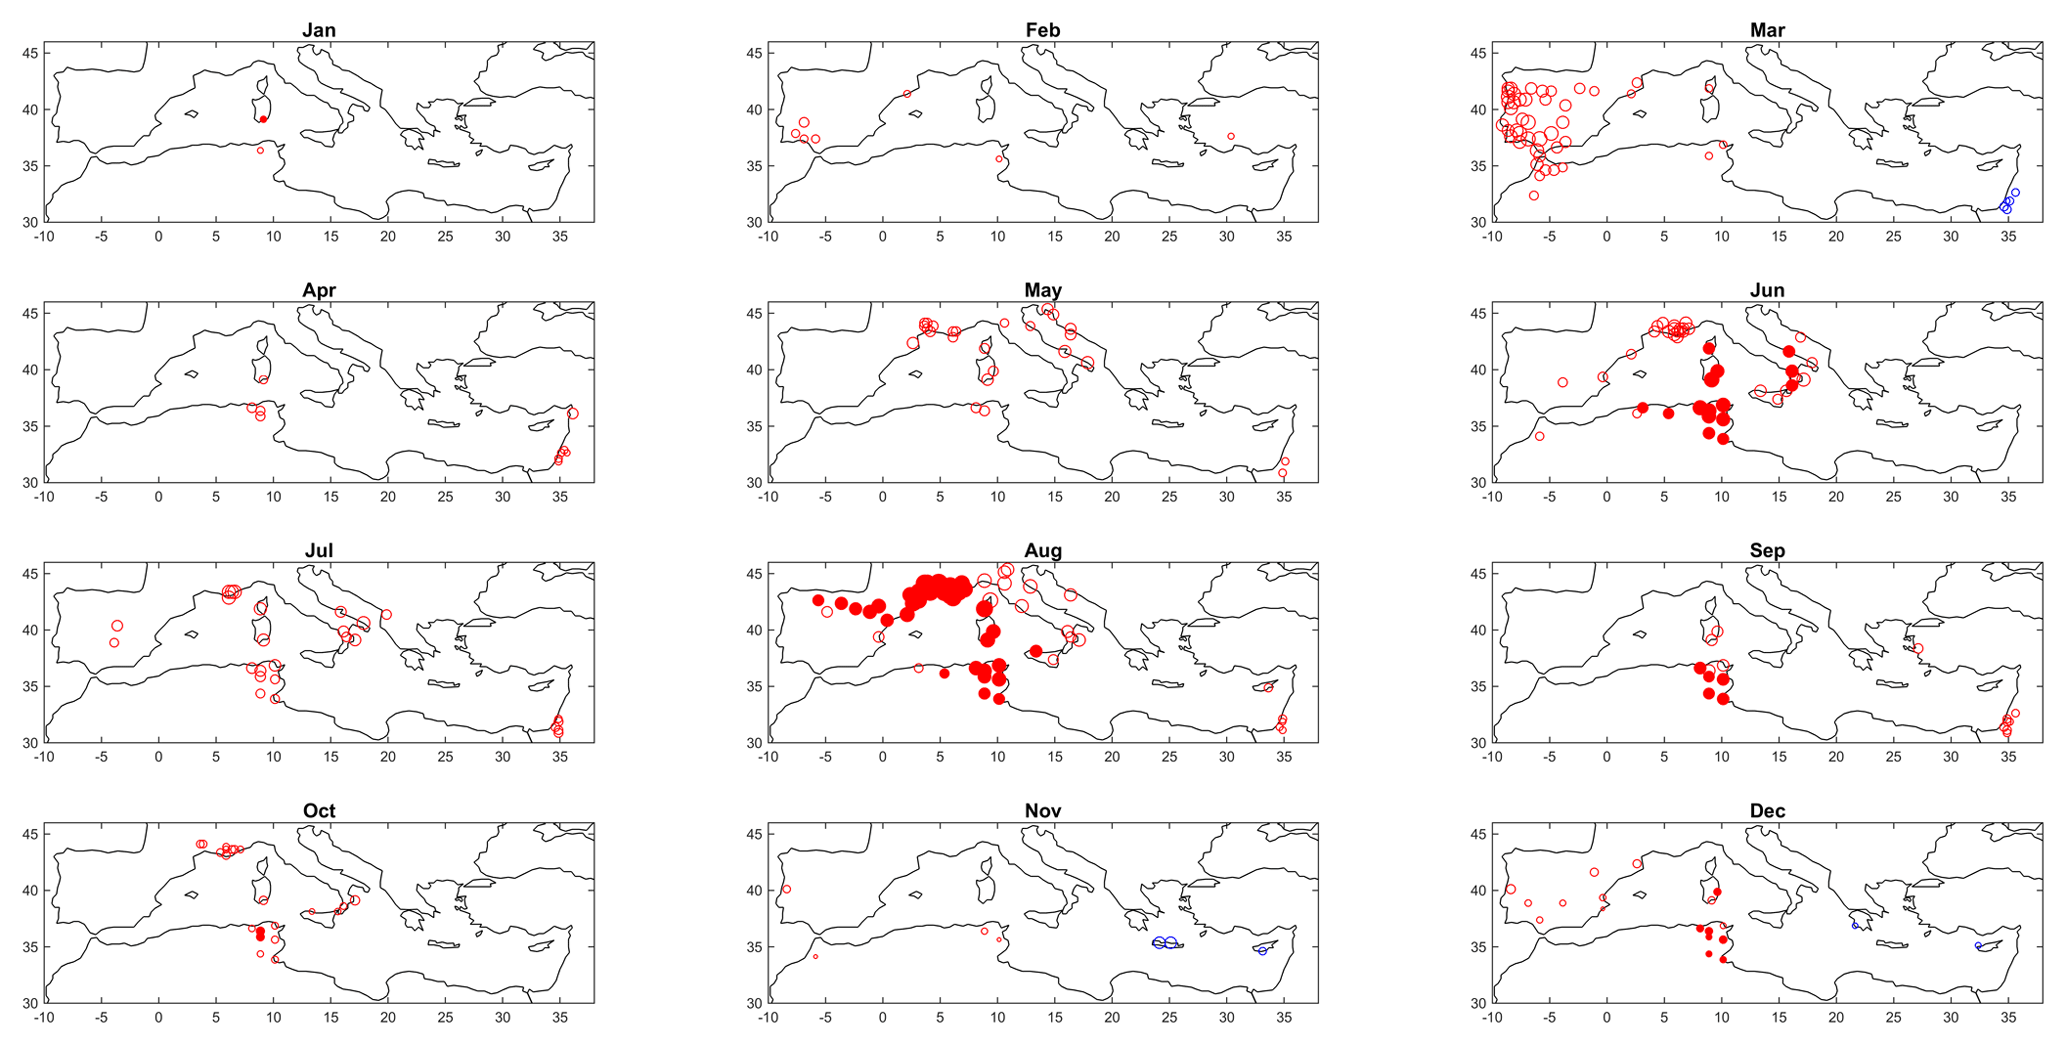
Figure 1Significant trends (5 % level) in monthly ET0. The size of the circles indicates the magnitude of the trends (red being increasing and blue being decreasing) and the filled circles denote regionally significant trends.
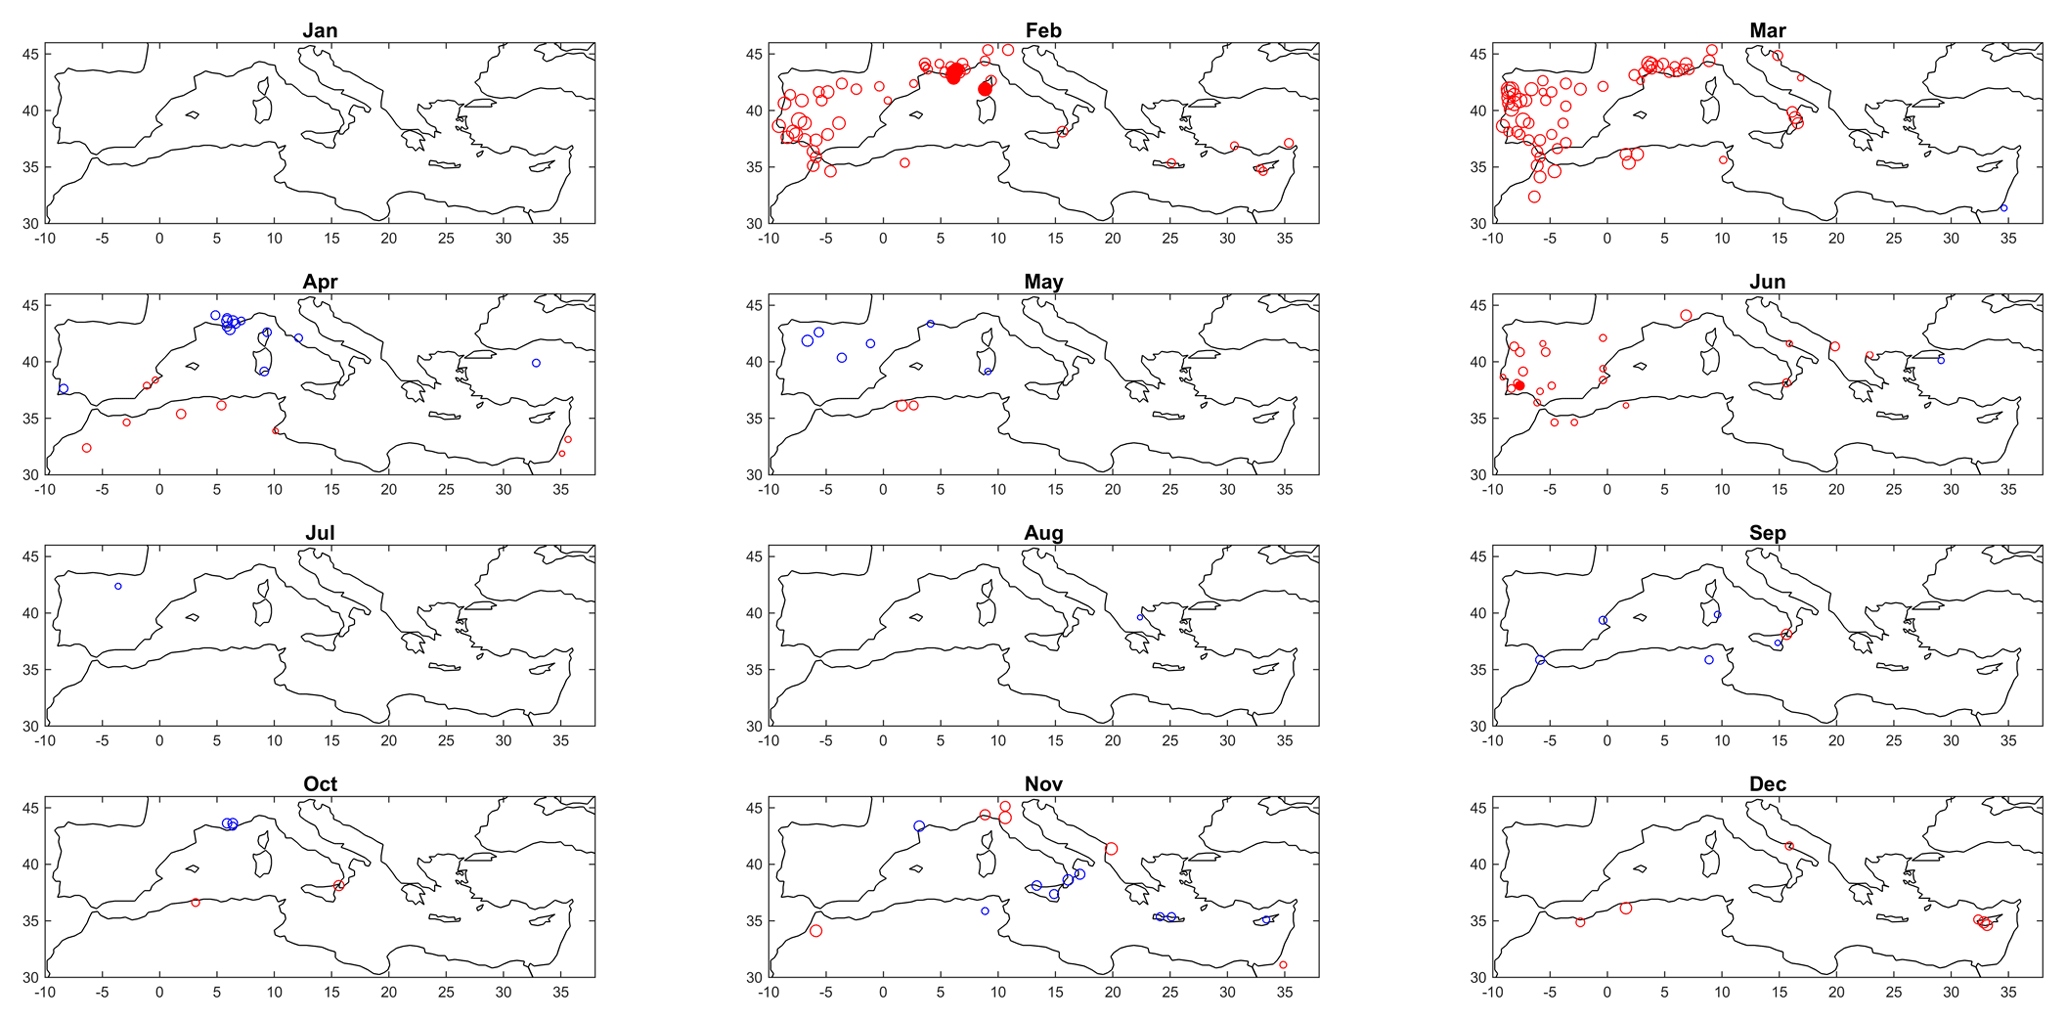
Figure 2Significant trends (5 % level) in the frequency of dry days when using the 1 mm threshold to define a dry day. The method for displaying the information is the same as Fig. 1.
4.1 Climatic trends
There are increasing trends in ET0 at western and central Mediterranean stations, mostly during summer months and, to a lesser extent, in March for the Iberian Peninsula (Fig. 1). These monthly trends imply an increase in ET0 at the annual scale for these stations (Spain, southern France, Italy, eastern Algeria and Tunisia). When tested on the annual total ET0, the trends are regionally significant at 67 stations, located in southern France, Spain, Middle East, Tunisia and Algeria, and Italy and the Adriatic. Using both thresholds, 1 mm and Et0, to define a dry day (hereafter named S1 and SET0, respectively), there is an increase in the frequency of dry days in February and March, centered on the stations in Spain, Portugal and southern France (Figs. 2 and 3). The spatial patterns of detected trends are similar to the two thresholds, but the increase is more pronounced, with more regionally significant trends, when using ET0 as threshold for dry days. Yet, the increase in ET0 during summer months does not imply an increase in the frequency of dry days during this season when considering ET0 to define a dry day. On the contrary, in March the increase in ET0 in the western Mediterranean is accompanied by an increased frequency of dry days. The monthly ET0 during winter months lies in the interval of 0.5 to 2 mm for all stations, whereas for the summer daily ET0 ranges between 3 and 7 mm d−1.
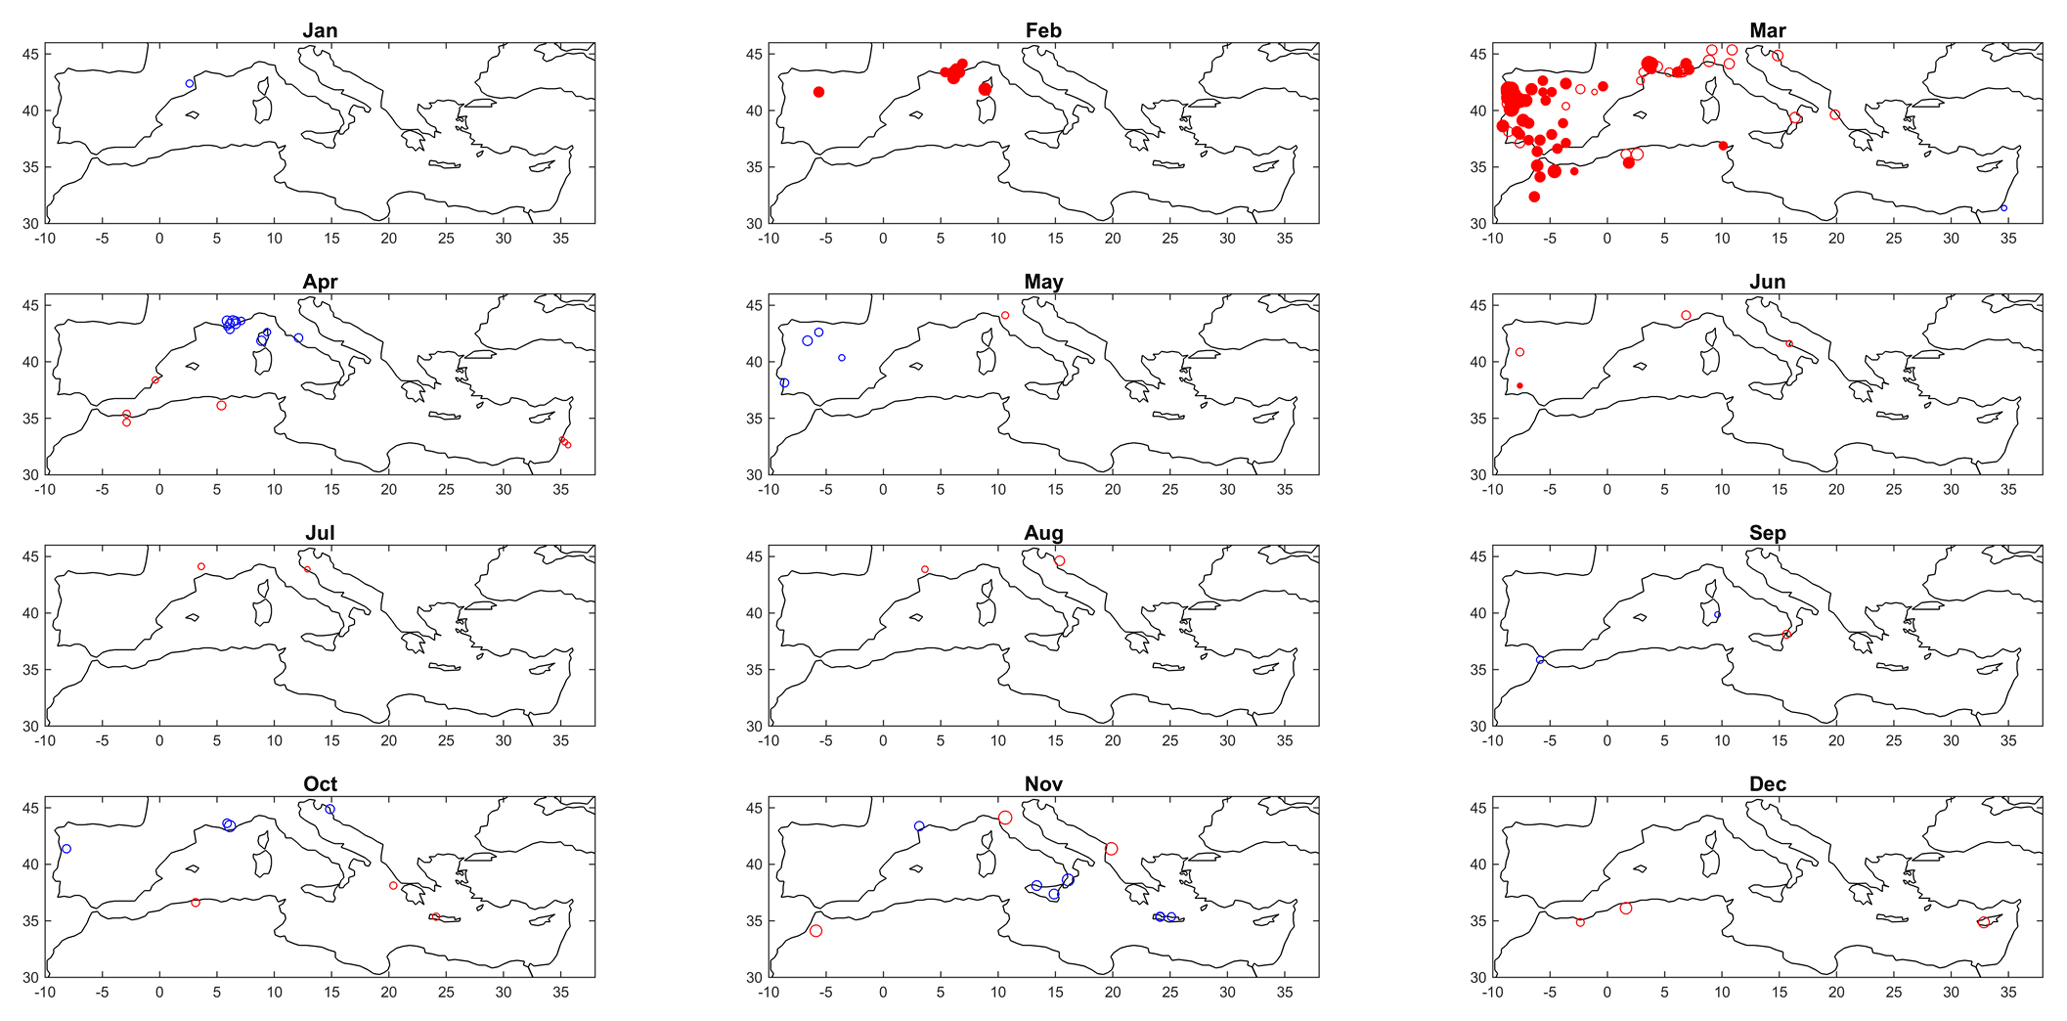
Figure 3Significant trends (5 % level) in the frequency of dry days, considering P − ET0=0 a dry day. The method for displaying the information is the same as Fig. 1.
Additionally, we tested the trends for the Simple Daily Intensity Index (SDII). The results indicate a decrease in SDII for a few stations, in February in southern France in particular, but overall these trends are not regionally significant. An interesting feature is illustrated in Figs. 4 and 5: the ratio between ET0 and the SDII during June, July and August show a remarkable north–south difference: in the south the average precipitation amounts during summer stay below evapotranspiration during rainfall events. During the summer months there is also a large variability and the ratio often exceeds 1. This implies that, on average, precipitation events will not be able to end a succession of dry days and this characteristic favors very long dry spells during summer. In contrast, in the north the average precipitation during an event stays above ET0.

Figure 4Box plot of the monthly ratios between ET0 and SDII. On each box, the central mark is the median, the edges of the box are the 25th and 75th percentiles, and the whiskers extend to ±1.5 interquartile range.
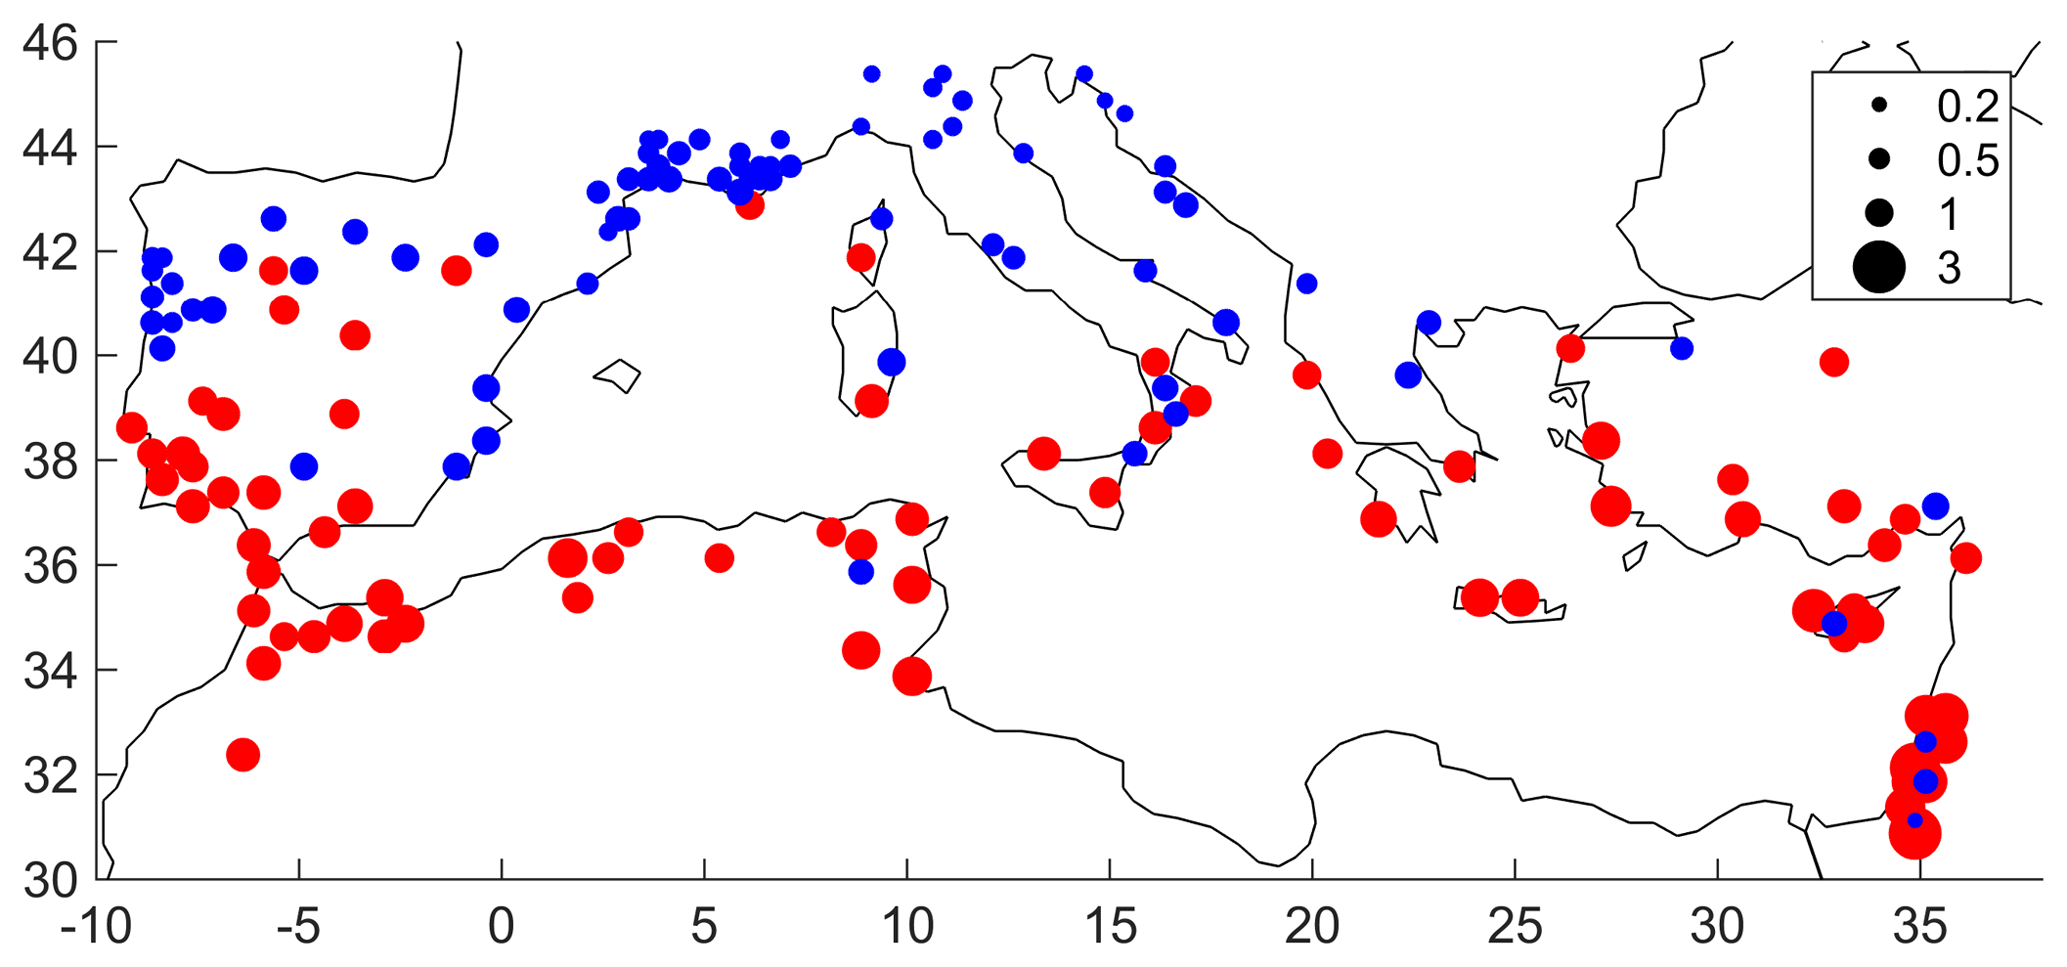
Figure 5Ratio between ET0 and SDII for June–August. The stations where the ratio is lower than 1 are marked in blue (SDII > ET0) and the stations where the ratio is over 1 are marked in red (SDII < ET0).
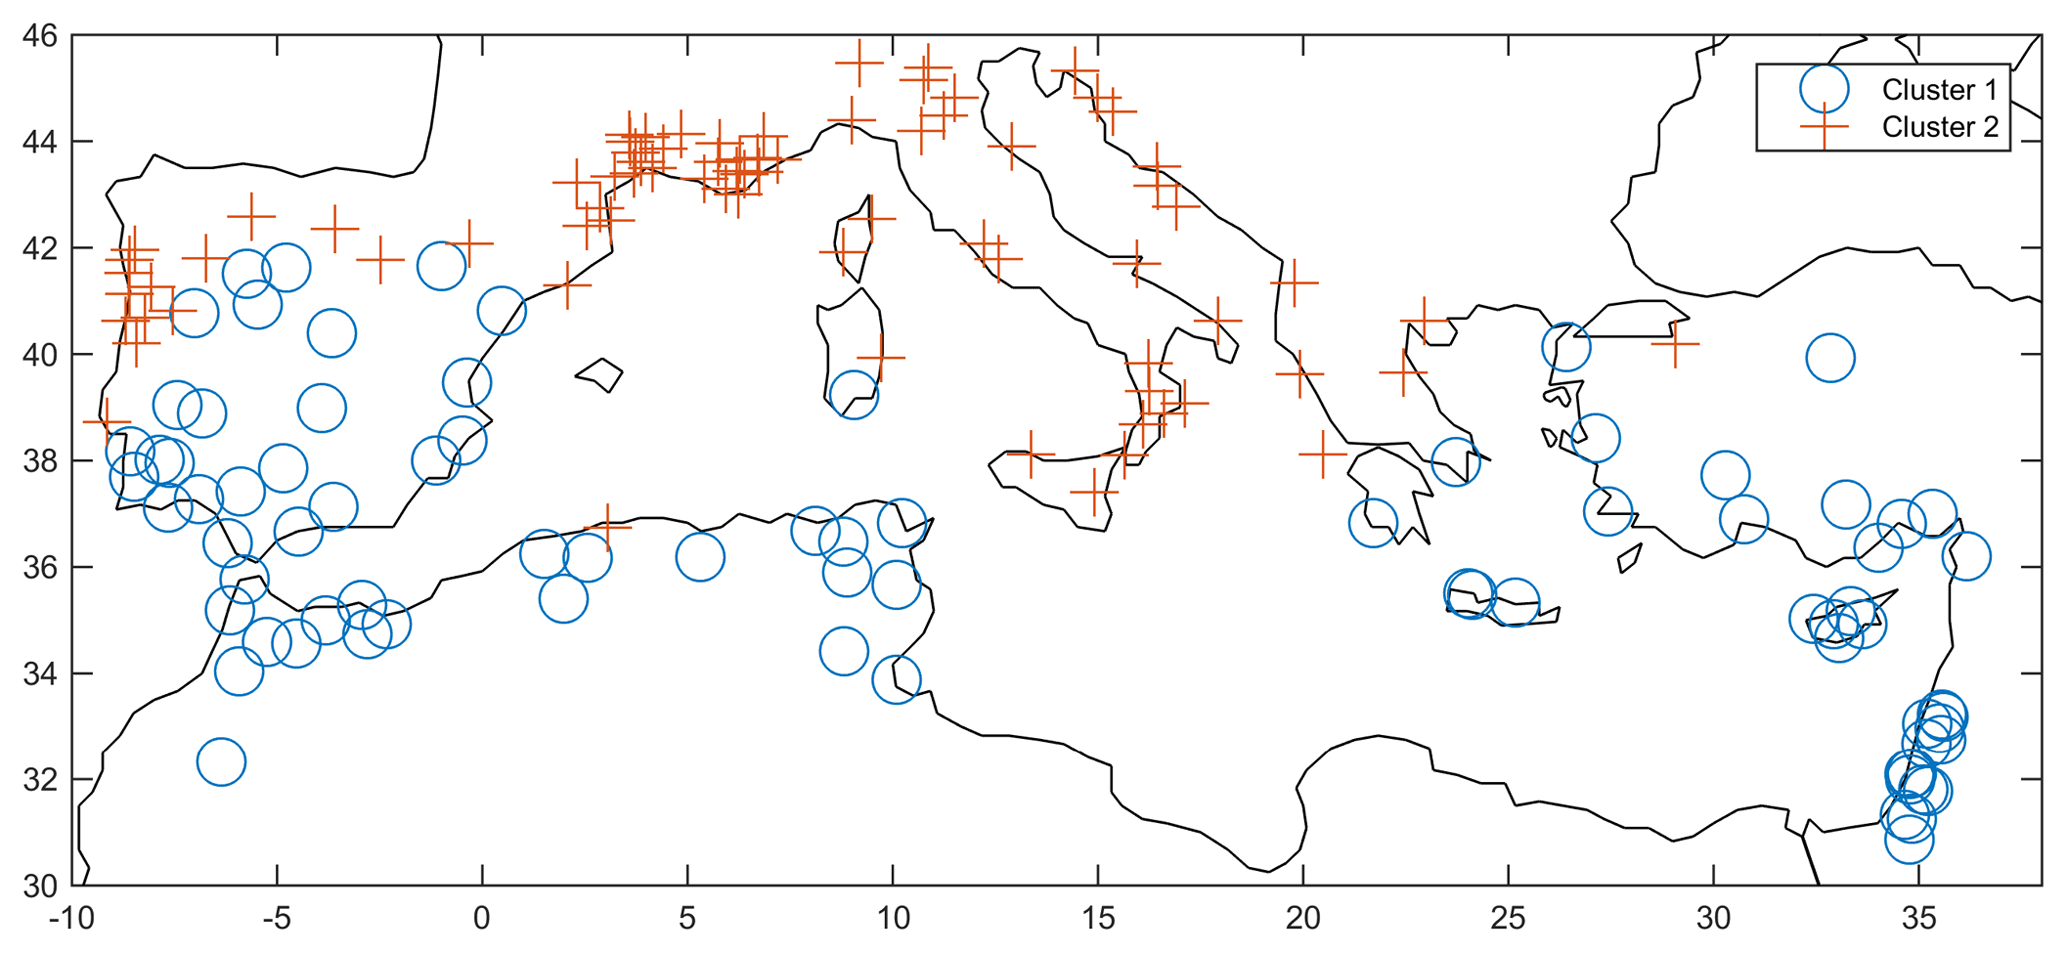
Figure 6Clustering result of monthly net precipitation (P − ET0).
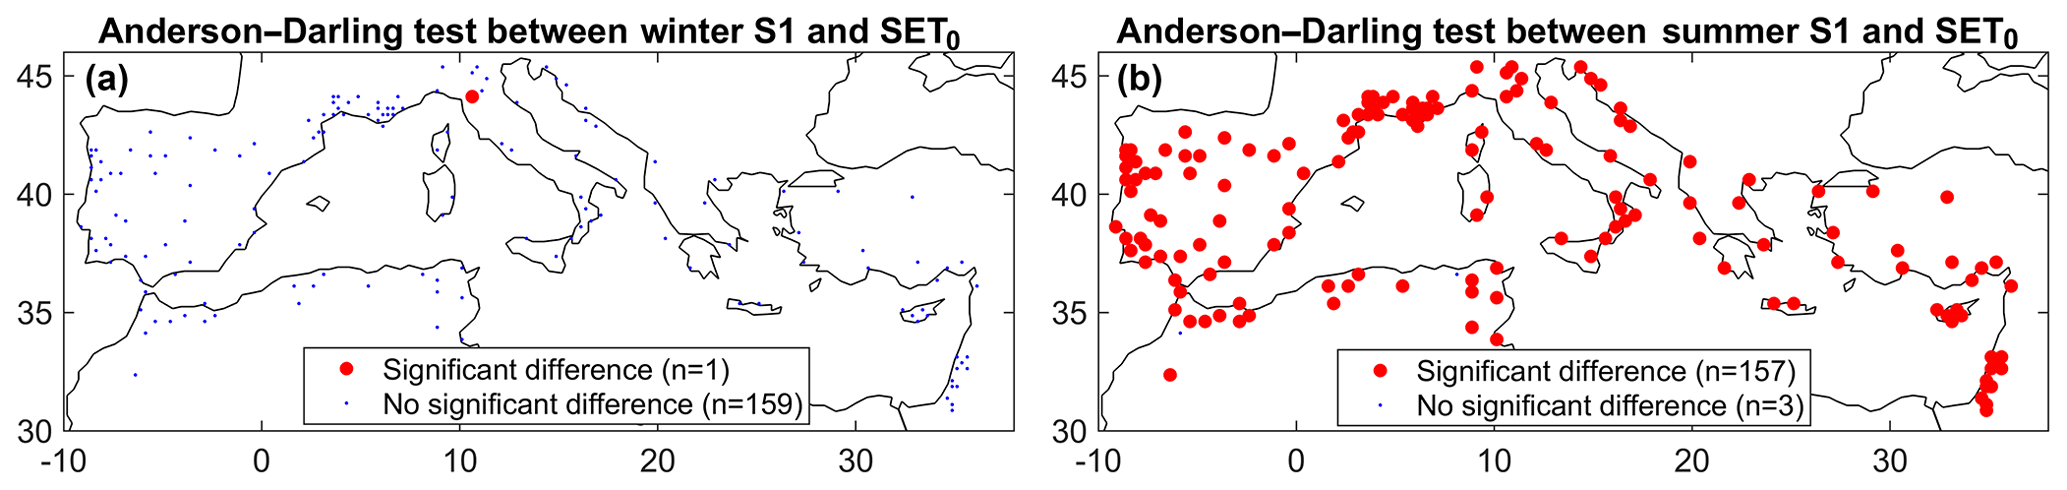
Figure 7Anderson–Darling test results between winter extreme dry spells defined using S1 or SET0 (a) and summer extreme dry spells defined using S1 or SET0 (b).
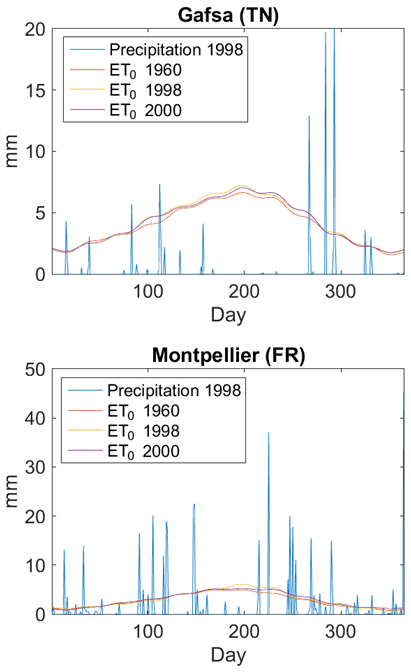
Figure 8Daily precipitation for the year 1998 plotted with ET0 in 1960, 1998 and 2000 for two stations, Gafsa in Tunisia and Montpellier in France.
4.2 Seasonal comparison of extreme dry spells
As mentioned in the previous section and in Sect. 3.3, there is a different seasonal behavior of dry spells between winter and summer months. In addition, several studies have shown that long dry spells during the winter season may have more severe consequences than those occurring during summer. This justifies a seasonal analysis of the extreme dry spells defined according to different dry day definitions. Nevertheless, prior to a seasonal comparison, a classification of stations according to monthly net precipitation (P − ET0) has been performed, as explained in Sect. 3.3. The classification shows a marked distinction between two clusters, as shown in Fig. 6, very similar to the spatial patterns of Fig. 5, with northern stations (approximately north of 40∘ N) having a precipitation deficit from April to September and southern stations having a precipitation deficit from March to October.
Then, for each season and each year, the maximum dry-spell lengths have been extracted at the different stations according to two thresholds for a dry day: 1 mm and ET0 (hereafter the extreme dry spells derived from the two thresholds are noted as S1 and SET0, respectively). Then, the Anderson–Darling test has been applied between summer and winter maxima. For S1, the test rejects the null hypothesis at the 5 % significance level for 135 stations. The remaining 25 stations where the winter and summer distributions are found to be similar are located in northern Mediterranean countries such as France (including Perpignan, Nîmes, Orange), Spain (Huesca, Valencia, Soria, Valladolid), Italy (Ferrara, Genoa) and Croatia (Gospić, Zavižan). For SET0, the test rejects the null hypothesis for 155 stations (except Mantua, Verona, Reijka, Milan, Mons). This indicates that the majority of stations the winter and summer distributions of extreme dry spells are different regardless of the threshold considered for a dry day. Indeed, the extreme dry spells tend to be longer in summer than in winter for all stations and this feature is accentuated by increased aridity. This result justifies the need to perform a seasonal analysis when considering extreme dry-spell risk.
Finally, the same Anderson–Darling test has been applied for a given season between extreme dry spells computed with the threshold 1 mm (S1) and extreme dry spells computed with ET0 (SET0). As shown in Fig. 7, there are strong differences in summer when extreme dry spells are computed with the dry day threshold 1 mm or ET0. For most stations, the two distributions are significantly different at the 5 % level. In contrast, for winter it can be assumed that extreme dry spells computed with 1 mm or the ET0 stem from the same distribution. This is due to the fact that during winter the AED is low and close to the value 1 mm.
4.3 Return levels of extreme dry spells
Prior to the fitting of statistical distributions, there is the need to verify the hypothesis of stationarity. Overall, there are no significant trends in extreme dry-spell duration, for either winter or summer, using the threshold 1 mm or ET0 to define dry days. This finding is quite surprising since there is an increase in ET0 in summer and one would expect an increase in dry spells when considering ET0 as the daily rainfall threshold. As elements of explanations, it was shown before that the increase in ET0 is focused only in the months of June–August (see Fig. 1). Furthermore, two extreme cases are exemplified here, Montpellier in the north (783 mm yr−1 on average) and Gafsa in the south (168 mm yr−1). In Fig. 8, the daily rainfall for a random year (1998) is plotted together with ET0 at the beginning of the time period (1960), in 1998 and for the end of the time period (2000). At Gafsa or Montpellier, the increase in ET0 in summer is not high enough to exceed daily events of intense precipitation (often thunderstorms). In the south, the ET0 is already higher than most of precipitation events (e.g., Fig. 5), except for a few high-intensity events above ET0. Still, the increase in ET0 does not impact the longest dry-spell sequences, as indicated by the trend analysis.

Figure 9Validation results of the fitting of the GEV, gamma (GAM) and lognormal (LN) distributions in terms of relative root-mean-square error (RRMSE) for 10 representative stations. Station numbers: 1 – Athens (GR), 2 – Tel Aviv (IS), 3 – Mantua (IT), 4 – Lisbon (PT), 5 – Madrid (ES), 6 – Montpellier (FR), 7 – Rome (IT), 8 – Beni Mellal (MA), 9 – Tunis (TN), 10 – Capo Bellavista (IT).
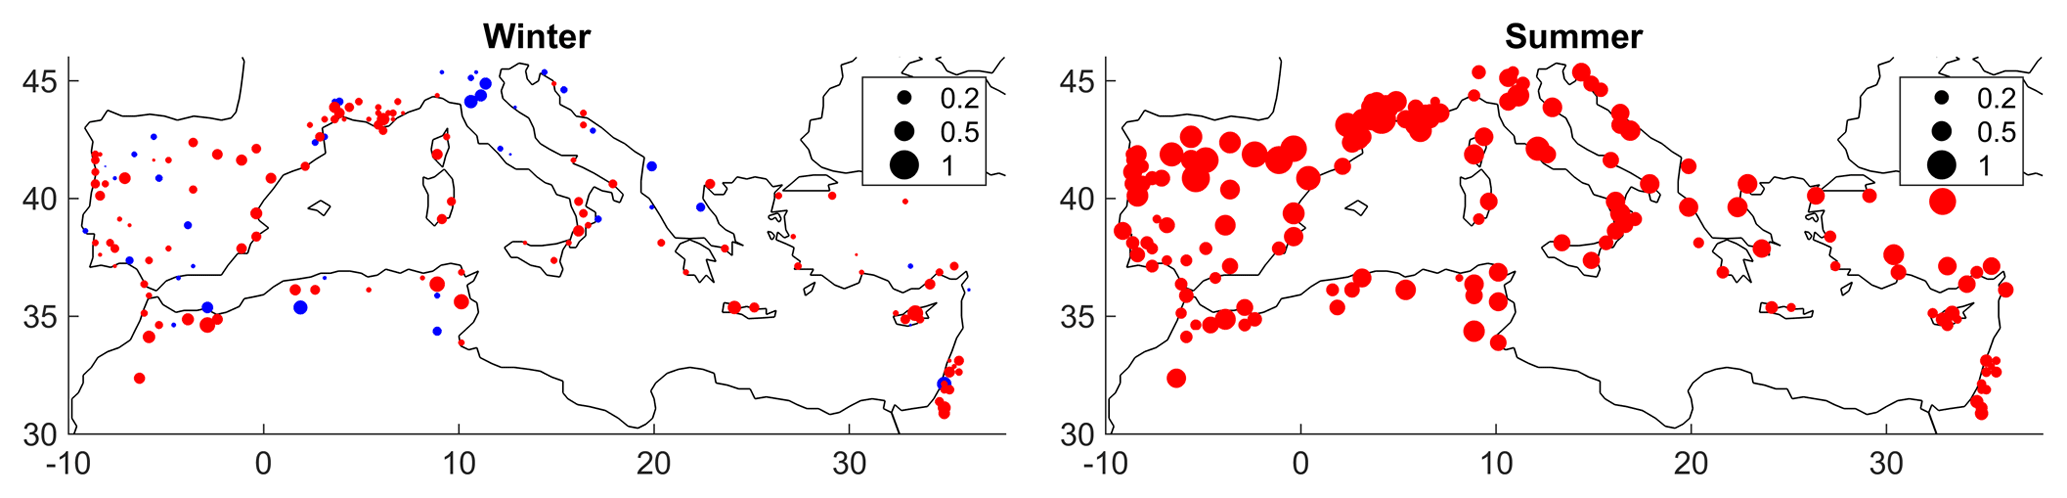
Figure 10Relative difference of the 20-year quantile of extreme dry spells computed with SET0 compared to S1. Red (blue) dots indicate that SET0 20-year quantiles are larger (smaller) than those obtained with S1. The larger the bubble, the larger the difference between S1 and SET0 (in the legend, 1=100 % overestimation).
The GEV, lognormal and gamma distributions have been compared to fit extreme dry spells. The results are illustrated in Fig. 9 for 10 stations located in different regions that have long records and very little or no missing data over their full record. For both S1 and SET0, the gamma distribution outperforms the GEV or lognormal since it provides lower mean relative RMSE (RRMSE) values in validation results on independent samples. Quantiles corresponding to a 20-year return period have been computed from a gamma distribution for each station and each season, according to the two different thresholds for dry days. A relative difference between the two quantiles has been computed, taking the S1 quantile as reference, since it is, at time of writing, the most widely used approach for estimating dry-spell durations. Results, shown in Fig. 10, indicate a strong underestimation of extreme dry spells during summer when using the fixed threshold of 1 mm. This underestimation is on average −29 % but only 4 % in winter. This result questions the use of a fixed threshold of 1 mm during summer, since it is not representative of the real amount of water available on the ground due to evaporation. On the contrary, focusing on winter only with a fixed threshold 1 mm does not induce strong uncertainties due to the low AED during this season.
The results obtained in the present work indicate the need for consideration of AED to define a dry day during summer months in particular, which is probably more realistic than with a fixed threshold of 1 mm. In more arid environments than the Mediterranean region, such as the Middle East and North African regions, it would mean that the analysis of dry spells could be strongly impacted, depending on whether the AED is taken into account or not. It implies that it is necessary to redefine appropriate thresholds for defining dry days according to different regions. By comparison with other drought indices, such as the Standardized Precipitation Index (SPI) or Standardized Precipitation–Evapotranspiration Index (SPEI), which are averaged on a monthly basis for different time horizons (Mukherjee et al., 2018), the explicit consideration of extreme dry spells could be an interesting way of relating dry spells to impacts. Indeed, dry-spell durations computed with dry day thresholds representative of real climate conditions could be directly related to plant phenology to study drought impacts on different agricultural productions. This new definition of dry spells, considering a time-varying threshold based on AED, is a departure from the classical viewpoint of a meteorological drought index since it tries to relate the atmospheric and ground conditions to assess the amount of water that is actually available for plants or water use. In that sense, it relates to the SPEI but is tailored to the scale of individual dry-spell events.
The results of the present study rely on the estimation of AED using reference evapotranspiration. Despite being more reliable than ET0 estimates from temperature only, the FAO-PM equation may not be fully representative of the AED at the different locations considered. McMahon et al. (2013) provided a synthesis of the uncertainties related to the estimation of the AED: data limitations, such as wind or humidity, which are not always available for all gauging stations, but also the fact that reference evapotranspiration relies on a hypothetical grass surface that may not be representative of the real land cover at the different stations during the different seasons of the year. Indeed, it is possible to derive the potential evapotranspiration from reference evapotranspiration using crop coefficients that are representative of the real ground conditions. These changes in land cover could modulate the AED between different locations. As an alternative, it could be possible to use actual evapotranspiration, but since it cannot be measured (at least for large areas) this would require the use of land surface modeling. However, there are differences in actual evapotranspiration computed from different land surface models, due to different parametrization, climate forcing and representation of the semiarid surface processes (Quintana-Seguí et al., 2019). Finally, it must be stressed that the estimation of AED in the Mediterranean for a long-term perspective and climate change impact studies must face several sources of uncertainties, such as land cover changes, forest fires that could induce drastic changes in surface processes, and water soil conditions influenced by human activity and irrigation, among others.
In this study, extreme dry spells, defined either with a fixed dry-day threshold (1 mm d−1) or with a time-varying threshold estimated from reference evapotranspiration (ET0), have been compared for a large database of 160 rain gauges covering the whole Mediterranean basin. An increase in ET0 is found for summer months (JJA) mainly in the central and western parts of the Mediterranean basin. The reported trends for summer are consistent with previous studies in Spain, driven by a decrease in relative humidity and an increase in maximum temperature (Vicente-Serrano et al., 2014a, b). Also, increases in the number of dry days are found for February and March at a large number of stations, either using 1 mm or ET0 to define a dry day. However, no trends are detected for extreme dry-spell lengths when using both thresholds to define a dry day. The distributions of extreme dry spells have been found to be different for winter and summer, with much longer extreme dry spells during summer. Also, for many locations a stronger variability in winter extreme dry spells became apparent. These results highlight the need of a seasonal analysis to avoid the misestimation of the extreme dry-spell risk. Despite the climatic trends of precipitation and evapotranspiration, there are no significant trends in seasonal extreme dry-spell risk in most areas. The frequency analysis of seasonal extreme dry spells reveals that using a fixed threshold set to 1 mm implies an underestimation of extreme dry-spell risk in comparison to a time-varying threshold representing evapotranspiration during the extended summer season. The time-varying thresholds appear to be a more relevant choice representative of real atmospheric conditions but this needs to be further confirmed by relating extreme dry spells computed with this new approach to drought impacts in different sectors (agriculture, vegetation, etc.). As a conclusion, we stress the need to account for the atmospheric water demand when analyzing dry spells, particularly if the goal is to relate them with agricultural impacts.
The data processed in the present study are made available to researchers upon request to the corresponding author.
YT and LN designed the analysis, PR produced the results, YT wrote the paper, and EH and SV-S provided data and contributed to the writing of the manuscript.
The authors declare that they have no conflict of interest.
This article is part of the special issue “Hydrological cycle in the Mediterranean (ACP/AMT/GMD/HESS/NHESS/OS inter-journal SI)”. It is not associated with a conference.
This work is a contribution to the HYdrological cycle in The Mediterranean EXperiment (HyMeX) program, through INSU-MISTRALS support for the studentship of Pauline Rivoire. The results have been obtained using the following R packages: extRemes, MASS, kSamples, randtests, stats and zyp.
This paper was edited by Eric Martin and reviewed by Albin Ullmann and one anonymous referee.
Allen, R. G., Pereira, L. S., Raes, D, and Smith, M.: Crop evapotranspiration, guidelines for computing crop water requirements, in: Irrigation and drain, Paper No. 56, FAO, Rome, 300 pp., 1998.
Allen, C. D., Breshears, D. D., and McDowell, N. G.: On underestimation of global vulnerability to tree mortality and forest die-off from hotter drought in the Anthropocene, Ecosphere, 6, 126, https://doi.org/10.1890/ES15-00203.1, 2015.
Anabalón, A. and Sharma, A.: On the divergence of potential and actual evapotranspiration trends: An assessment across alternate global datasets, Earth's Future, 5, 905–917, https://doi.org/10.1002/2016EF000499, 2017.
Anderegg, W. R. L., Klein, T., Bartlett, M., Sack, L., Pellegrini, A. F. A., Choat, B., and Jansen, S.: Meta-analysis reveals that hydraulic traits explain cross-species patterns of drought-induced tree mortality across the globe, P. Natl. Acad. Sci. USA, 113, 5024–5029, https://doi.org/10.1073/pnas.1525678113, 2016.
Beguería, S., Vicente-Serrano, S. M., Reig, F., and Latorre, B.: Standardized precipitation evapotranspiration index (SPEI) revisited: parameter fitting, evapotranspiration models, tools, datasets and drought monitoring, Int. J. Climatol., 34, 3001–3023, 2014.
Benjamini, Y. and Hochberg, Y.: Controlling the false discovery rate: A practical and powerful approach to multiple testing, J. Roy. Stat. Soc. B, 57, 289–300, 1995.
Douguedroit, A.: The variations of dry spells in marseilles from 1865 to 1984, Int. J. Climatol., 7, 541–551, 1987.
Harris, I., Jones, P., Osborn, T., and Lister, D.: Updated high-resolution grids of monthly climatic observations – the CRU TS3.10 Dataset, Int. J. Climatol., 34, 623–642, https://doi.org/10.1002/joc.3711, 2014.
Hertig, E. and Tramblay, Y.: Regional downscaling of Mediterranean droughts under past and future climatic conditions, Global Planet. Change, 151, 36–48, 2017.
Hoerling, M., Eischeid, J., Perlwitz, J., Quan, X., Zhang, T., and Pegion, P.: On the increased frequency of Mediterranean drought, J. Climate, 25, 2146–2161, 2012.
Kaufman, L. and Rousseeuw, P. J.: Finding Groups in Data: An Introduction to Cluster Analysis, John Wiley & Sons, New York, Hoboken, NJ, 1990.
Lana, X., Martínez, M. D., Burgueño, A., Serra, C., Martín-Vide, J., and Gómez, L.: Distributions of long dry spells in the iberian peninsula, years 1951–1990, Int. J. Climatol., 26, 1999–2021, https://doi.org/10.1002/joc.1354, 2006.
Lobell, D. B. and Field, C. B.: Global scale climate–crop yield relationships and the impacts of recent warming, Environ. Res. Lett., 2, 014002, https://doi.org/10.1088/1748-9326/2/1/014002, 2007.
Lobell, D. B., Hammer, G. L., Chenu, K., Zheng, B., Mclean, G., and Chapman, S. C.: The shifting influence of drought and heat stress for crops in northeast Australia, Global Change Biol., 21, 4115–4127, https://doi.org/10.1111/gcb.13022, 2015.
Lorenzo-Lacruz, J., Vicente-Serrano, S. M., González-Hidalgo, J. C., López-Moreno, J. I., and Cortesi, N.: Hydrological drought response to meteorological drought in the Iberian Peninsula, Clim. Res., 58, 117–131, https://doi.org/10.3354/cr01177, 2013.
Naumann, G., Alfieri, L., Wyser, K., Mentaschi, L., Betts, R. A., Carrao, H., Spinoni, J., Vogt, J., and Feyen, L.: Global changes in drought conditions under different levels of warming, Geophys. Res. Lett., 45, 3285–3296, https://doi.org/10.1002/2017GL076521, 2018.
Mann, H. B.: Nonparametric tests against trend, Econometrica, 13, 245–259, 1945.
Manning, C., Widmann, M., Bevacqua, E., Van Loon, A. F., Maraun, D., and Vrac, M.: Soil Moisture Drought in Europe: A Compound Event of Precipitation and Potential Evapotranspiration on Multiple Time Scales, J. Hydrometeorol., 19, 1255–1271, 2018.
Mariotti, A. and Dell'Aquila, A.: Decadal climate variability in the Mediterranean region: roles of large-scale forcings and regional processes, Clim. Dynam., 38, 1129–1145, 2012.
Mathugama, S. C. and Peiris, T. S. G.: Critical Evaluation of Dry Spell Research, Int. J. Basic Appl. Sci., 11, 153–160, 2011.
McMahon, T. A., Peel, M. C., Lowe, L., Srikanthan, R., and McVicar, T. R.: Estimating actual, potential, reference crop and pan evaporation using standard meteorological data: a pragmatic synthesis, Hydrol. Earth Syst. Sci., 17, 1331-1363, https://doi.org/10.5194/hess-17-1331-2013, 2013.
McVicar, T. R., Roderick, M. L., Donohue, R. J., Li, L.T., VanNiel, T. G., Thomas, A., Grieser, J., Jhajharia, D., Himri, Y., Mahowald, N. M., Mescherskaya, A. V., Kruger, A. C., Rehman, S., and Dinpashoh, Y.: Global review and synthesis of trends in observed terrestrial near-surface wind speeds: Implications for evaporation, J. Hydrol., 416–417, 182–205, 2012a.
McVicar, T. R., Roderick, M. L., Donohue, R. J., and Van Niel, T. G.: Less bluster ahead? Overlooked ecohydrological implications of global trends of terrestrial near-surface wind speeds, Ecohydrology, 5, 381–388, 2012b.
Mishra, A. K. and Singh, V. P.: A review of drought concepts, J. Hydrol., 391, 202–216, 2010.
Mukherjee, S., Mishra, A., and Trenberth, K. E.: Climate Change and Drought: a Perspective on Drought Indices, Curr. Clim. Change Rep., 4, 145–163, https://doi.org/10.1007/s40641-018-0098-x, 2018.
Páscoa, P., Gouveia, C. M., Russo, A., and Trigo, R. M.: The role of drought on wheat yield interannual variability in the Iberian Peninsula from 1929 to 2012, Int. J. Biometeorol., 61, 439–451, https://doi.org/10.1007/s00484-016-1224-x, 2017.
Peel, M. C., Finlayson, B. L., and McMahon, T. A.: Updated world map of the Köppen–Geiger climate classification, Hydrol. Earth Syst. Sci., 11, 1633–1644, https://doi.org/10.5194/hess-11-1633-2007, 2007.
Polade, S. D., Pierce, D. W., Cayan, D. R., Gershunov, A., and Dettinger, M. D.: The key role of dry days in changing regional climate and precipitation regimes, Scient. Rep., 4, 4364, https://doi.org/10.1038/srep04364, 2014.
Quintana-Seguí, P., Barella-Ortiz, A., Regueiro-Sanfiz, S., and Miguez-Macho, G.: The Utility of Land-Surface Model Simulations to Provide Drought Information in a Water Management Context Using Global and Local Forcing Datasets, Water Resour. Manage., https://doi.org/10.1007/s11269-018-2160-9, in press, 2019.
Raymond, F., Ullmann, A., Camberlin, P., Drobinski, P., and Chateau Smith, C.: Extreme dry spell detection and climatology over the Mediterranean Basin during the wet season, Geophys. Res. Lett., 43, 7196–7204, https://doi.org/10.1002/2016GL069758, 2016.
Raymond, F., Ullmann, A., Camberlin, P., Oueslati, B., and Drobinsky, P.: Atmospheric conditions and weather regimes associated with extreme winter dry spells over the Mediterranean basin, Clim. Dynam., 50, 4437–4453, https://doi.org/10.1007/s00382-017-3884-6, 2018.
Reiser, H. and Kutiel, H.: Rainfall uncertainty in the Mediterranean: definition of the daily rainfall threshold (DRT) and the rainy season length (RSL), Theor. Appl. Climatol., 97, 151–162, 2009.
Renard, B., Kochanek, K., Lang, M., Garavaglia, F., Paquet, E., Neppel, L., Najib, K., Carreau, J., Arnaud, P., Aubert, Y., Borchi, F., Soubeyroux, J. M., Jourdain, S., Veysseire, J. M., Sauquet, E., Cipriani, T., and Auffray, A.: Data-based comparison of frequency analysis methods: a general framework, Water Resour. Res., 49, 825–843, 2013.
Scholz, F. W. and Stephens, M. A.: K-Sample Anderson–Darling Tests, J. of Am. Stat. Assocl, 82, 918–924, 1987.
Serinaldi, F. and Kilsby, C. G.: The importance of prewhiteningin change point analysis under persistence, Stoch. Environ. Res. Risk A., 30, 763–777, https://doi.org/10.1007/s00477-015-1041-5, 2015.
Serinaldi, F., Kilsby, C. G., and Lombardo, F.: Untenable non-stationarity: An assessment of the fitness for purpose of trend tests in hydrology, Adv. Water Resour., 111, 132–155, https://doi.org/10.1016/j.advwatres.2017.10.015, 2018.
Serra, C., Lana, X., Burgueno, A., and Martinez, M. D.: Partial duration series distributions of the European dry spell lengths for the second half of the twentieth century, Theor. Appl. Climatol., 123, 63–81, 2016.
Sivakumar, M. V. K.: Empirical analysis of dry spells for agricultural applications in West Africa, J. Climate, 5, 532–540, 1992.
Stagge, J. H., Kingston, L. M., Tallaksen, L., and Hannah, D. M.: Observed drought indices show increasing divergence across Europe, Sci. Rep., 7, 4045, https://doi.org/10.1038/s41598-017-14283-2, 2017.
Tibshirani, R., Walther, G., and Hastie, T.: Estimating the number of clusters in a data set via the gap statistic, J. Roy. Stat. Soc. B, 63, 411–423, 2001.
Todorovic, M., Karic, B., and Pereira, L. S.: Reference evapotranspiration estimate with limited weather data across a range of Mediterranean climates, J. Hydrol., 481, 166–176, 2013.
Tramblay, Y. and Hertig, E.: Modelling extreme dry spells in the Mediterranean region in connection with atmospheric circulation, Atmos. Res., 202, 40–48, 2018.
Trenberth, K. E., Dai, A., van der Schrier, G., Jones, P. D., Barichivich, J., Briffa, K. R., and Sheffield, J.: Global warming and changes in drought, Nat. Clim. Change, 4, 17, https://doi.org/10.1038/nclimate2067, 2014.
Vicente-Serrano, S. M. and Beguería-Portugués, S.: Estimating extreme dry-spell risk in the middle Ebro valley (northeastern Spain): a comparative analysis of partial duration series with a general Pareto distribution and annual maxima series with a Gumbel distribution, Int. J. Climatol., 23, 1103–1118, 2003.
Vicente-Serrano, S. M., Azorin-Molina, C., Sanchez-Lorenzo, A., Revuelto, J., Morán-Tejeda, E., López-Moreno, J. I., and Espejo, F.: Sensitivity of reference evapotranspiration to changes in meteorological parameters in Spain (1961–2011), Water Resour. Res., 50, 8458–8480, https://doi.org/10.1002/2014WR015427, 2014a.
Vicente-Serrano, S. M., Azorin-Molina, C., Sanchez-Lorenzo, A., Revuelto, J., López-Moreno, J. I., González-Hidalgo, J. C., and Espejo, F.: Reference evapotranspiration variability and trends in Spain, 1961–2011. Global Planet. Change, 121, 26–40, 2014b.
Vicente-Serrano, S. M., Lopez-Moreno, J. I., Beguería, S., Lorenzo-Lacruz, J., Sanchez-Lorenzo, A., García-Ruiz, J. M., Azorin-Molina, C., Tejeda-Moran, E., Revuelto, J., Trigo, R., Coelho, F., and Espejo, F.: Evidence of increasing drought severity caused by temperature rise in Southern Europe, Environ. Res. Lett., 9, 044001, https://doi.org/10.1088/1748-9326/9/4/044001, 2014c.
Viglione, A., Laio, F., and Claps, P.: A comparison of homogeneity tests for regional frequency analysis, Water Resour. Res., 43, W03428, https://doi.org/10.1029/2006WR005095, 2007.
Ward, J. H.: Hierarchical Grouping to Optimize an Objective Function, J. Am. Stat. Assoc., 58, 236–244, 1963.
Wilks, D. S.: The Stippling Shows Statistically Significant Grid Points: How Research Results are Routinely Overstated and Overinterpreted, and What to Do about It, B. Am. Meteoro. Soc., 97, 2263–2273, 2016.
Yue, S. and Wang, C.: Applicability of prewhitening to eliminate the influence of serial correlation on the Mann–Kendall test, Water Resour. Res., 38, 41–47, 2002.
Zkhiri, W., Tramblay, Y., Hanich, L., and Berjamy, B.: Regional flood frequency analysis in the high-atlas mountainous catchments of Morocco, Nat. Hazards, 86, 953–967, https://doi.org/10.1007/s11069-016-2723-0, 2017.