the Creative Commons Attribution 4.0 License.
the Creative Commons Attribution 4.0 License.
 | 31 Jul 2019
Revised earthquake sources along Manila trench for tsunami hazard assessment in the South China Sea
Qiang Qiu
Ya-Ju Hsu
Yu Wang
Chung-Han Chan
Adam D. Switzer
Seismogenic tsunami hazard assessments are highly dependent on the reliability of earthquake source models. Here in a study of the Manila subduction zone (MSZ) system, we combine the geological characteristics of the subducting plate, geometry, and coupling state of the subduction interface to propose a series of fault rupture scenarios. We divide the subduction zone into three rupture segments: 14–16, 16–19, and 19–21.7∘ N inferred from geological structures associated with the down-going Sunda plate. Each of these segments is capable of generating earthquakes of a magnitude between and , assuming a 1000-year seismic return period as suggested by previous studies. The most poorly constrained segment of the MSZ lies between 19 and 21.7∘ N, and here we use both local geological structures and characteristics of other subduction zone earthquakes around the world, to investigate the potential rupture characteristics of this segment. We consider multiple rupture modes for tsunamigenic earthquake and megathrust-splay fault earthquakes. These rupture models facilitate an improved understanding of the potential tsunami hazard in the South China Sea (SCS). Hydrodynamic simulations demonstrate that coastlines surrounding the SCS could be devastated by tsunami waves up to 10 m if large megathrust earthquakes occur in these segments. The regions most prone to these hazards include west Luzon of Philippines, southern Taiwan, southeastern China, central Vietnam, and Palawan Island.
- Article
(16702 KB) - Full-text XML
-
Supplement
(40187 KB) - BibTeX
- EndNote


Large and damaging tsunamis are commonly triggered by megathrust ruptures that occur along convergent plate boundaries (i.e., subduction zones). Since 1900, many megathrust ruptures have triggered numerous devastating near- and far-field tsunamis including the 1952 Mw=8.8–9.0 Kamchatka event (e.g., Johnson and Satake, 1999; Kanamori, 1976), the 1960 Mw=9.5 event in the Chile subduction zones (e.g., Cifuentes, 1989; Moreno et al., 2009), the 1964 Mw=9.2 Alaska earthquake (e.g., Plafker, 1965), the 2004 Mw=9.2 Sumatra–Andaman earthquake along the northern Sunda Trench (e.g., Vigny et al., 2005; Banerjee et al., 2007; Chlieh et al., 2007), and the more recent 2010 Mw=8.8 Maule event in Chile (e.g., Vigny et al., 2011; Pollitz et al., 2011) and 2011 Mw=9.0 Tohoku-Oki earthquake along the northwest border of the Pacific Ocean (e.g., Koketsu et al., 2011; Wei et al., 2012). These earthquakes and their associated subduction zones have been intensively studied from different perspectives, including their tectonic settings and long-term evolution, seismic activities, and geodetic and geophysical features. In contrast, the Manila subduction zone (MSZ), which extends from southern Taiwan to the southern tip of Luzon Island in the Philippines along the eastern margin of the South China Sea (SCS) (Fig. 1), receives less attention, even though it shares many similarities with megathrust systems where large tsunamigenic earthquakes have occurred (Hsu et al., 2012, 2016).
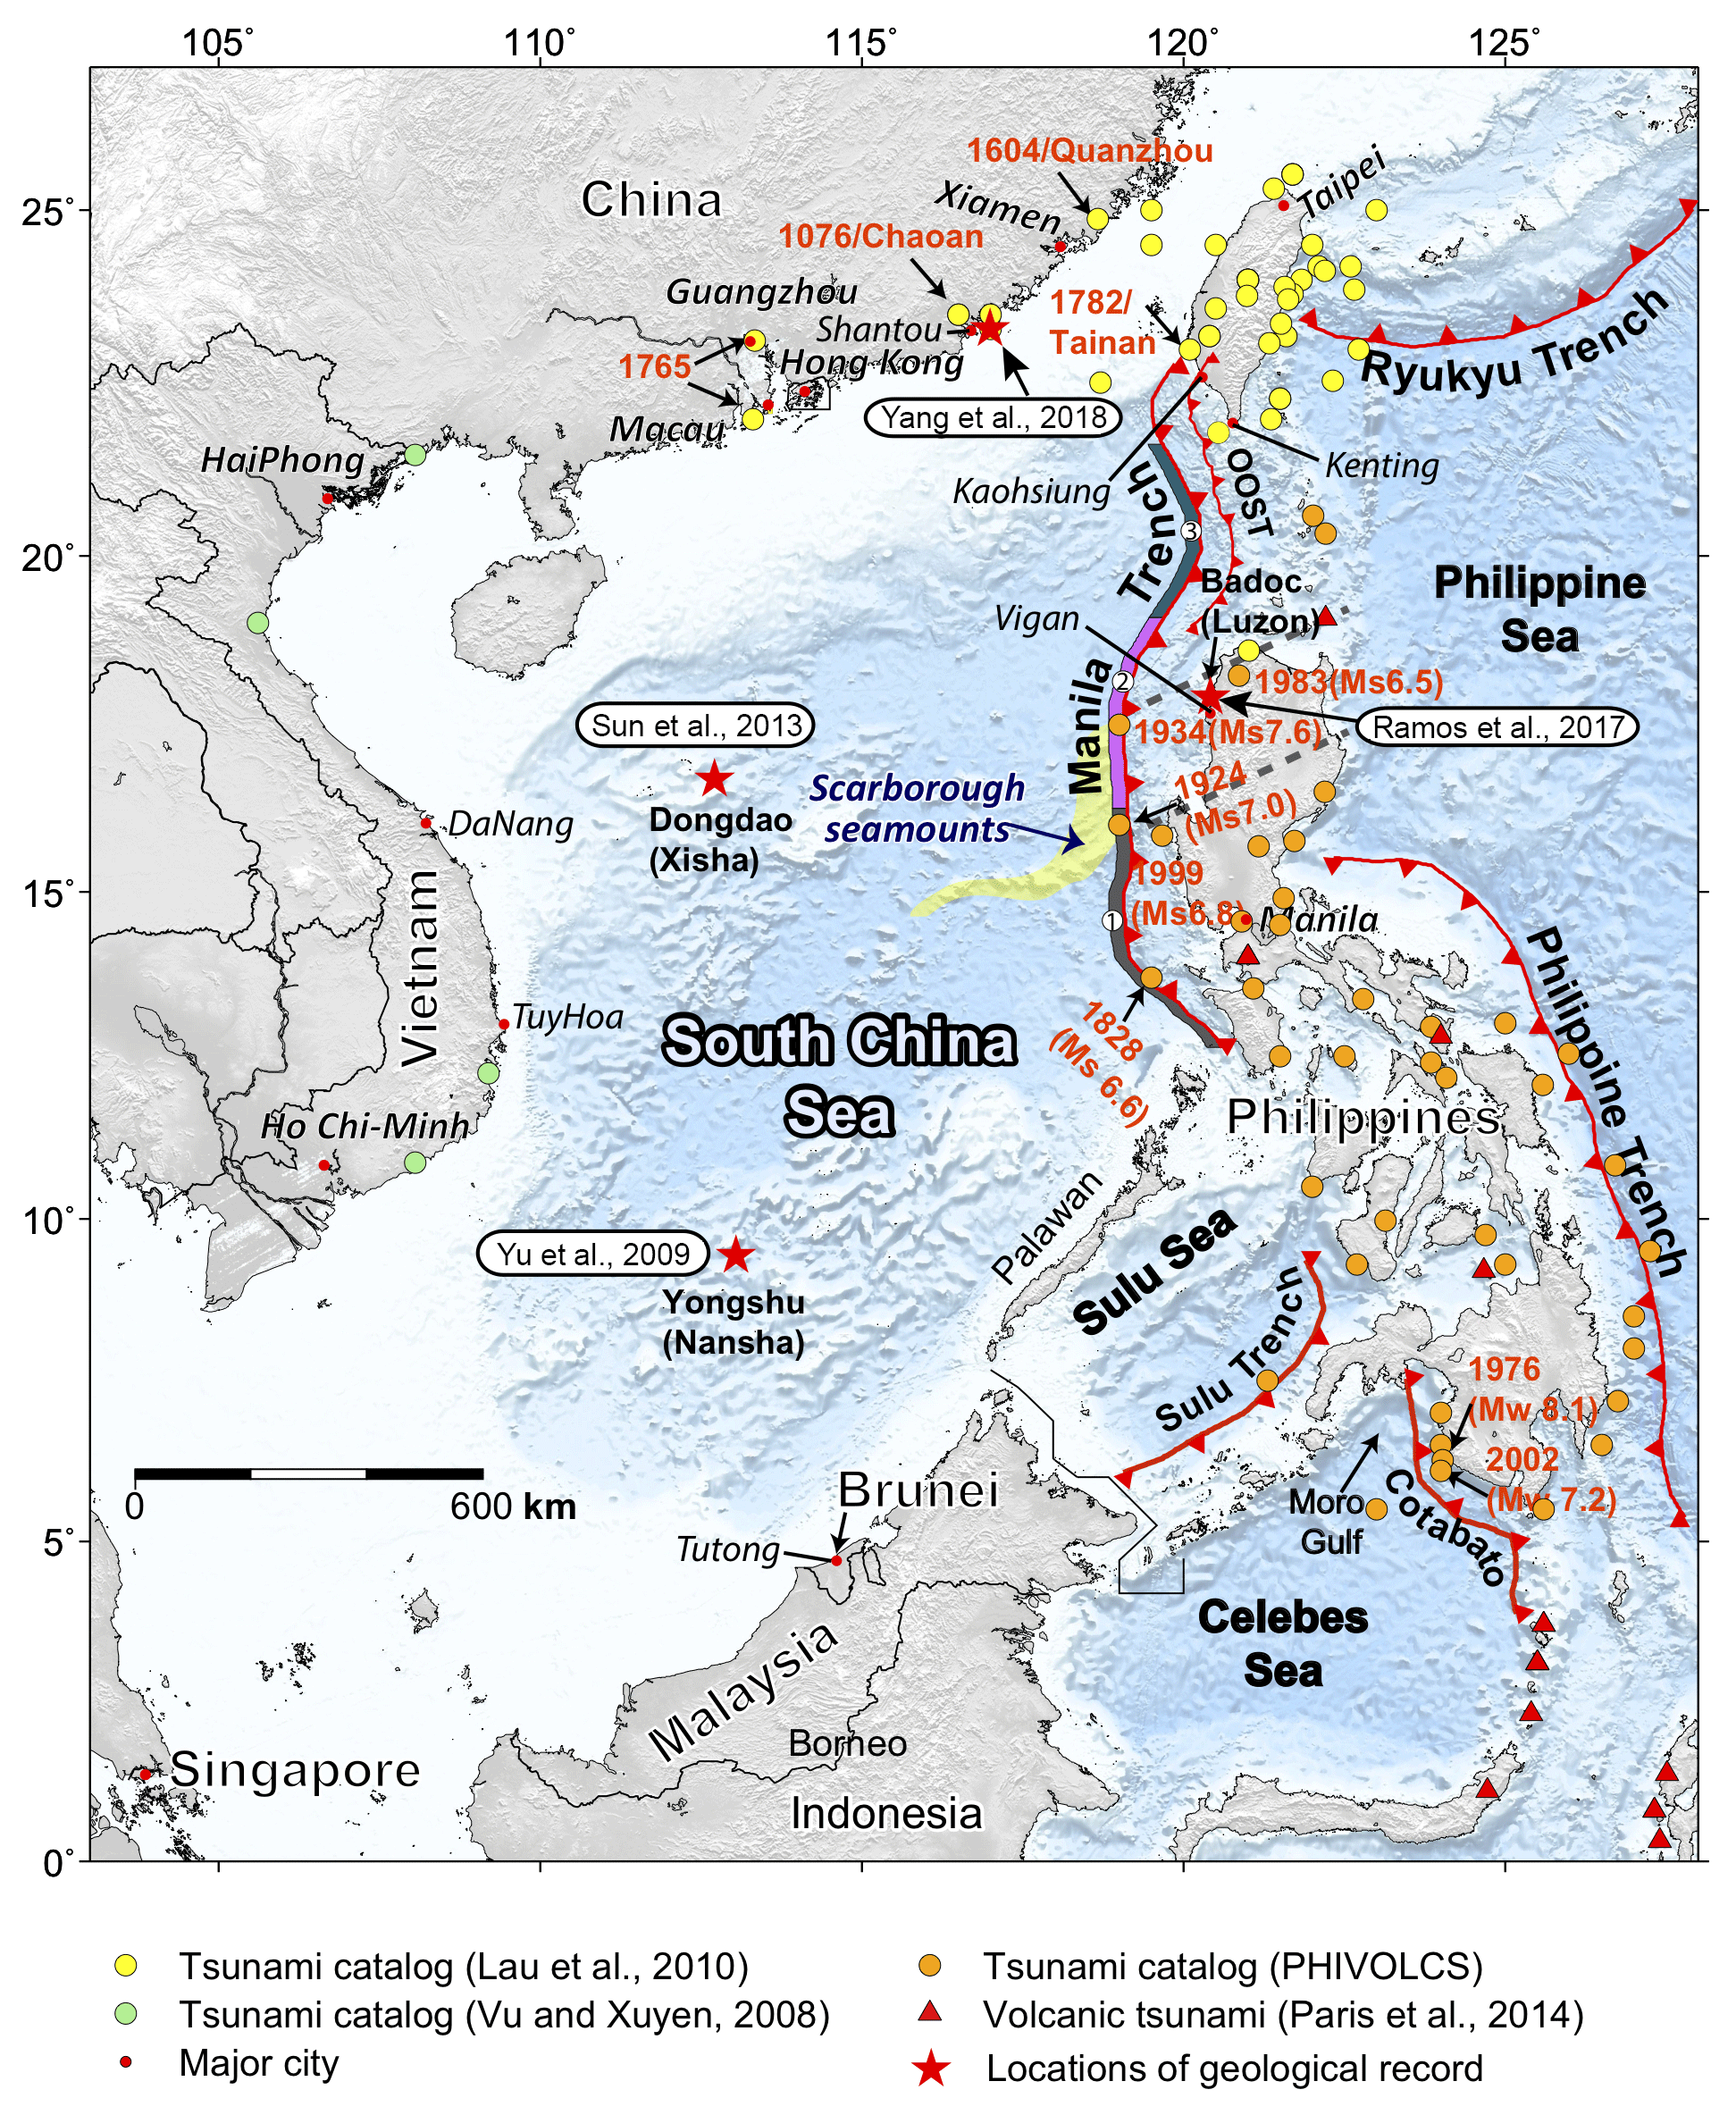
Figure 1Tectonic setting and historical tsunami catalogs in the South China Sea region. Colored circles indicate published tsunami catalogs and are labeled in the legend. Red triangles represent historical tsunamis related to volcanic activities. Red barbed curves show the megathrusts in this region. Geological tsunami records are marked with red stars (Ramos et al., 2017; Sun et al., 2013; Yang et al., 2018; Yu et al., 2009). The megacities are labeled in the legend and the seafloor subducting features are highlighted in the map. The historical earthquakes with Mw>6.5 in the Philippines are labeled. The likely tsunami events reported in the megacities are also labeled in the map. The two dashed lines represent the possible trace of the subducted Scarborough seamounts underneath the overriding plate as imaged from the tomography study (Wu et al., 2016). The rupture zones are denoted by the colored–shaded curves.
Over the past decade, attempts to study megathrust earthquakes and tsunamis from the Manila subduction zone have started to gain momentum. A number of rupture models have been used to assess potential tsunami hazard in the SCS (e.g., Hong Nguyen et al., 2014; Liu et al., 2009; Megawati et al., 2009; Okal et al., 2011; Wu and Huang, 2009), and yet the simulated tsunami wave heights and the subsequent hazard assessments differ greatly among studies (Hong Nguyen et al., 2014; Liu et al., 2009; Megawati et al., 2009; Okal et al., 2011; Wu and Huang, 2009; Xie et al., 2019). The difference often lies in the proposed fault-slip magnitudes of these models, and also the fault geometries used. Large variability in the results produced by these models underscores the fact that the seismogenic behaviors of the MSZ are still poorly understood. Some of the challenges which stand out and need to be resolved include assessing whether the MSZ is capable of hosting earthquakes, investigating the amount of tectonic strain it has accumulated and its style of strain accumulation, and constraining how that strain is likely to be released in future.
Several lines of evidence suggest that the Manila trench has the potential to host a giant rupture capable of generating a basin-wide tsunami. Firstly, both historical earthquake records and modern seismicity databases (Hsu et al., 2012, 2016) indicate an absence of earthquakes larger than Mw=7.6 since Spanish colonization of Luzon in the 1560s (Bautista et al., 2012; Megawati et al., 2009; Ramos et al., 2017; Terry et al., 2017). The lack of significant megathrust-related earthquakes in modern records implies either a predominately aseismic megathrust or a highly coupled interseismic megathrust with the potential for a large () rupture (e.g., Hsu et al., 2012). Several recent studies favor the high interseismic coupling model since both the analysis of earthquake focal mechanisms and geodetic monitoring results demonstrate that the upper plate is under shortening, which suggests that the megathrust, at least since the 1960s, shows minimal creeping (Bautista et al., 2001; Hsu et al., 2012, 2016). Secondly, the rate of plate convergence across the Manila trench is up to 90–100 mm yr−1 – faster than the convergence rate of the Sumatra, Japan, and Nankai subduction zones, all of which have hosted giant earthquakes in the past few decades (McCaffrey, 2008; Megawati et al., 2009; Hsu et al., 2016, 2012;). Since the MSZ did not produce any significant events in the past 4 centuries, >30m of slip deficit is estimated to have been accumulated on the subducting interface (Megawati et al., 2009; Hsu et al., 2016). Thirdly, historical documents together with a few geological records across the SCS basin have reported nearly 130 tsunami events with different generation mechanisms (i.e., earthquakes, submarine landslides, volcanic eruptions). Although the credibility levels of these records varies (Bautista et al., 2012; Lau et al., 2010; Paris et al., 2014) and the geologically based interpretation suffers from the challenges of distinguishing tsunami waves from extreme storm surges, a series of records stand out with a similar range of event ages. Notably, four independent geological and geomorphological studies (Ramos et al., 2017; Sun et al., 2013; Yang et al., 2018; Yu et al., 2009) (Fig. 1) have purported evidence from coastal deposits, which they have inferred to be the result of a large tsunami event in SCS around 1000 to 1064 CE, which is nearly coincident with a large historical wave event recorded in Chao'an, Guangdong, in November, 1076 CE (Lau et al., 2010). The four independent sites of geological evidence are located at Dongdao island (Sun et al., 2013), Yongshu island (Yu et al., 2009), Badoc island near Luzon (Ramos et al., 2017), and Nan'ao Dao on the southern Chinese coastline (Yang et al., 2018) (Fig. 1). Since these studies identified only one event and if it were indeed generated by one tsunami, then we can conclude that the event was likely to be basin-wide and triggered by a very large MSZ event. Such an event would be a megathrust earthquake with sufficiently large rupture up to 1000 km long. Such a long and persistent rupture is comparable to the rupture length of the 2004 Sumatra–Andaman earthquake (e.g., Megawati et al., 2009). With the aforementioned evidence, there is no reason to rule out the possibility that the Manila trench could rupture as an Mw=9 earthquake (i.e., Megawati et al., 2009; Hsu et al., 2016). The current status of the Manila subduction zone could be an analog of the Sumatran subduction zone before the 2004 Mw=9.2 Sumatra–Andaman event between Myanmar and Aceh where a paucity of earthquakes > Mw=8 precede the 2004 event (Chlieh et al., 2008; Hsu et al., 2012), despite the very different geological settings (i.e., age, buoyancy, fault geometry) between these two subduction zones.
The SCS region is vulnerable to potential tsunami hazard. It covers an area of ca. 3.5 million km2 (Terry et al., 2017), and is encircled by the coastlines of southeastern China, southern Taiwan, the western Philippines, eastern Vietnam, northern Borneo, and eastern Malaysia, forming a semi-enclosed basin (Fig. 1). The SCS coastline is one of the world's most densely populated with more than 80 million people living in the surrounding coastal cities (Terry et al., 2017). Many of these coastal cities serve as the economic centers and play pivotal roles in their respective countries' economic development. The coastline also hosts a very high density of major infrastructure (i.e., nuclear power plants, ports, airports). Data from the World Nuclear Association show that more than 10 nuclear power plants are currently in operation or about to start construction on the SCS coastline (http://www.world-nuclear.org/information-library, last access: 9 April 2019). Thus, if a large megathrust earthquake (e.g., Mw>9) were to occur within the SCS basin (Li et al., 2018), the impact would be amplified and much more devastating as the SCS is only about 1∕20 the size of the Indian Ocean. It is therefore crucial to provide physically based earthquake rupture models for a more realistic tsunami hazard assessment in the SCS region.
This study differs from previous studies (e.g., Hong Nguyen et al., 2014; Liu et al., 2009; Megawati et al., 2009; Okal et al., 2011; Wu and Huang, 2009) because we utilize a geodetic coupling model constrained by 17 years of GPS velocity measurements (Hsu et al., 2016) to propose a suite of better constrained physically based earthquake rupture scenarios. We also consider rupture segmentations constrained by the geological characteristics and the relief of the subducting Sunda plate. Scenario-based rupture models are different with the probabilistically based tsunami hazard assessments within which hundreds and thousands are implemented for rupture uncertainty estimates. Therefore, the probabilistic approaches (e.g., Li et al., 2016; Grezio et al., 2017) are often more complex to understand and implement than the scenario-based approaches. Here the proposed rupture models afford a physically based understanding of the tsunami hazard in the SCS. As a demonstration, we implement the rupture models to conduct hydrodynamic simulations to assess the tsunami characteristics along the coastlines of the SCS.
Forecasting the extent and the slip distribution of earthquake ruptures is a challenging task. Before the 2004 Mw=9.2 Sumatra–Andaman earthquake (Chlieh et al., 2008), a Mw=9 earthquake had never been anticipated along the Sunda Trench, due to its oblique convergence orientation and seismically inactive feature (Satake and Atwater, 2007). Globally, the eventual ruptures of some unexpected fault locations keep surprising scientists (Bilek and Lay, 2018). We have seen partial ruptures of fully locked megathrusts (Konca et al., 2008; Qiu et al., 2016; Ruiz et al., 2014; Schurr et al., 2014), and piecemeal breaks in the center of perceived seismic gaps (e.g., Salman et al., 2017). Even with improved observations, it remains difficult to constrain the magnitude of a potential earthquake in the first order, and even more difficult to define the rupture pattern (e.g., Lay, 2018). A recent example comes from Japan where Loveless and Meade (2010) used a number of inland GPS stations to estimate the coupling state of the Japan megathrust before the 2011 Tohoku-Oki earthquake. They indicated the spatial extent of a possible future rupture. Notably, the rupture models constrained by multiple geodetic data sets after the 2011 earthquake (Koketsu et al., 2011; Loveless and Meade, 2011; Wei et al., 2012) are significantly different to the coupling map of Loveless and Meade (2010). The discrepancy between a coupling map and actual rupture estimates has also been observed at other subduction zones (e.g., Ruiz et al., 2014; Schurr et al., 2014) and for the collision zone between the Indian and Eurasian plates (Avouac et al., 2015; Qiu et al., 2016; Stevens and Avouac, 2015). Clearly, our current knowledge of the seismogenic characteristics of giant earthquakes remains deficient.
Great efforts have been made to investigate the physical parameters that characterize subduction zones with regard to the geometry, geology, and dynamics (Schellart and Rawlinson, 2013). Systematic analysis of collections of great earthquakes globally indeed suggests that some of the physical parameters do play key roles in controlling the rupture characteristics (Bilek and Lay, 2018; Bletery et al., 2016; Schellart and Rawlinson, 2013), although limitations in the historical earthquake records inevitably make it difficult to have high confidence on such relationships. Taking into account the geometrical effects, previous studies have divided the entire Manila subduction zone into three segments (i.e., Zhu et al., 2013; Li et al., 2016; Gao et al., 2018). Here we follow the segments proposed by Li et al. (2016), and we provide new constraints on earthquake and tsunami potentials by combining geological information and the geodetic constrained coupling map to adjust these segments accordingly. The modulated three segments are 14–16, 16–19, and 19–22∘ N. Their significance is detailed in subsequent sections.
2.1 Rupture segment 1 (zone 1, 14–16∘ N)
The Manila trench primarily starts from ca. 13∘ N west of Mindoro and ends at ca. 22∘ N southwest of Taiwan, and beyond these bounds the Manila trench gradually transforms into a collision and accretionary belt in the north and south (Fig. 1). At the southernmost area of the Manila trench, the strike direction of the trench bends to the southeast offshore of Mindoro Island (ca. 13∘ N) before it further collides with Panay (ca. 11∘ N). Within this region (ca. 13 to 11∘ N) the relocated seismicity suggests the subducting slab dips almost vertically, with an absence of the deep seismicity (Bautista et al., 2001). Based on these features, Bautista et al. (2001) suggest the subducting slab may have been heated up and assimilated into the mantle. We, therefore, interpret that the great megathrust earthquake is less likely south of 13∘ N. Li et al. (2016) placed the southern boundary of the first segment at ca. 12.5∘ N. In contrast, Bautista et al. (2001) proposed a slab tear at ca. 14∘ N, which is the result of the collision of a micro-continental plate with Mindoro and Panay islands and as evidenced by the narrow seismicity gap north of 14∘ N that trends northeastward (Fig. 2). Based on these geological characteristics and geodetic measurements, together with the fact that the spatial coverage of GPS measurements in this region only allows us to estimate the coupling status starting at 14∘ N to the north (Hsu et al. 2016), we move the southern boundary of the first segment from ca. 12.5∘ N proposed by Li et al. (2016) to 14∘ N, but we do not rule out the possibility of ruptures that propagate across 14 to 13∘ N or even beyond.
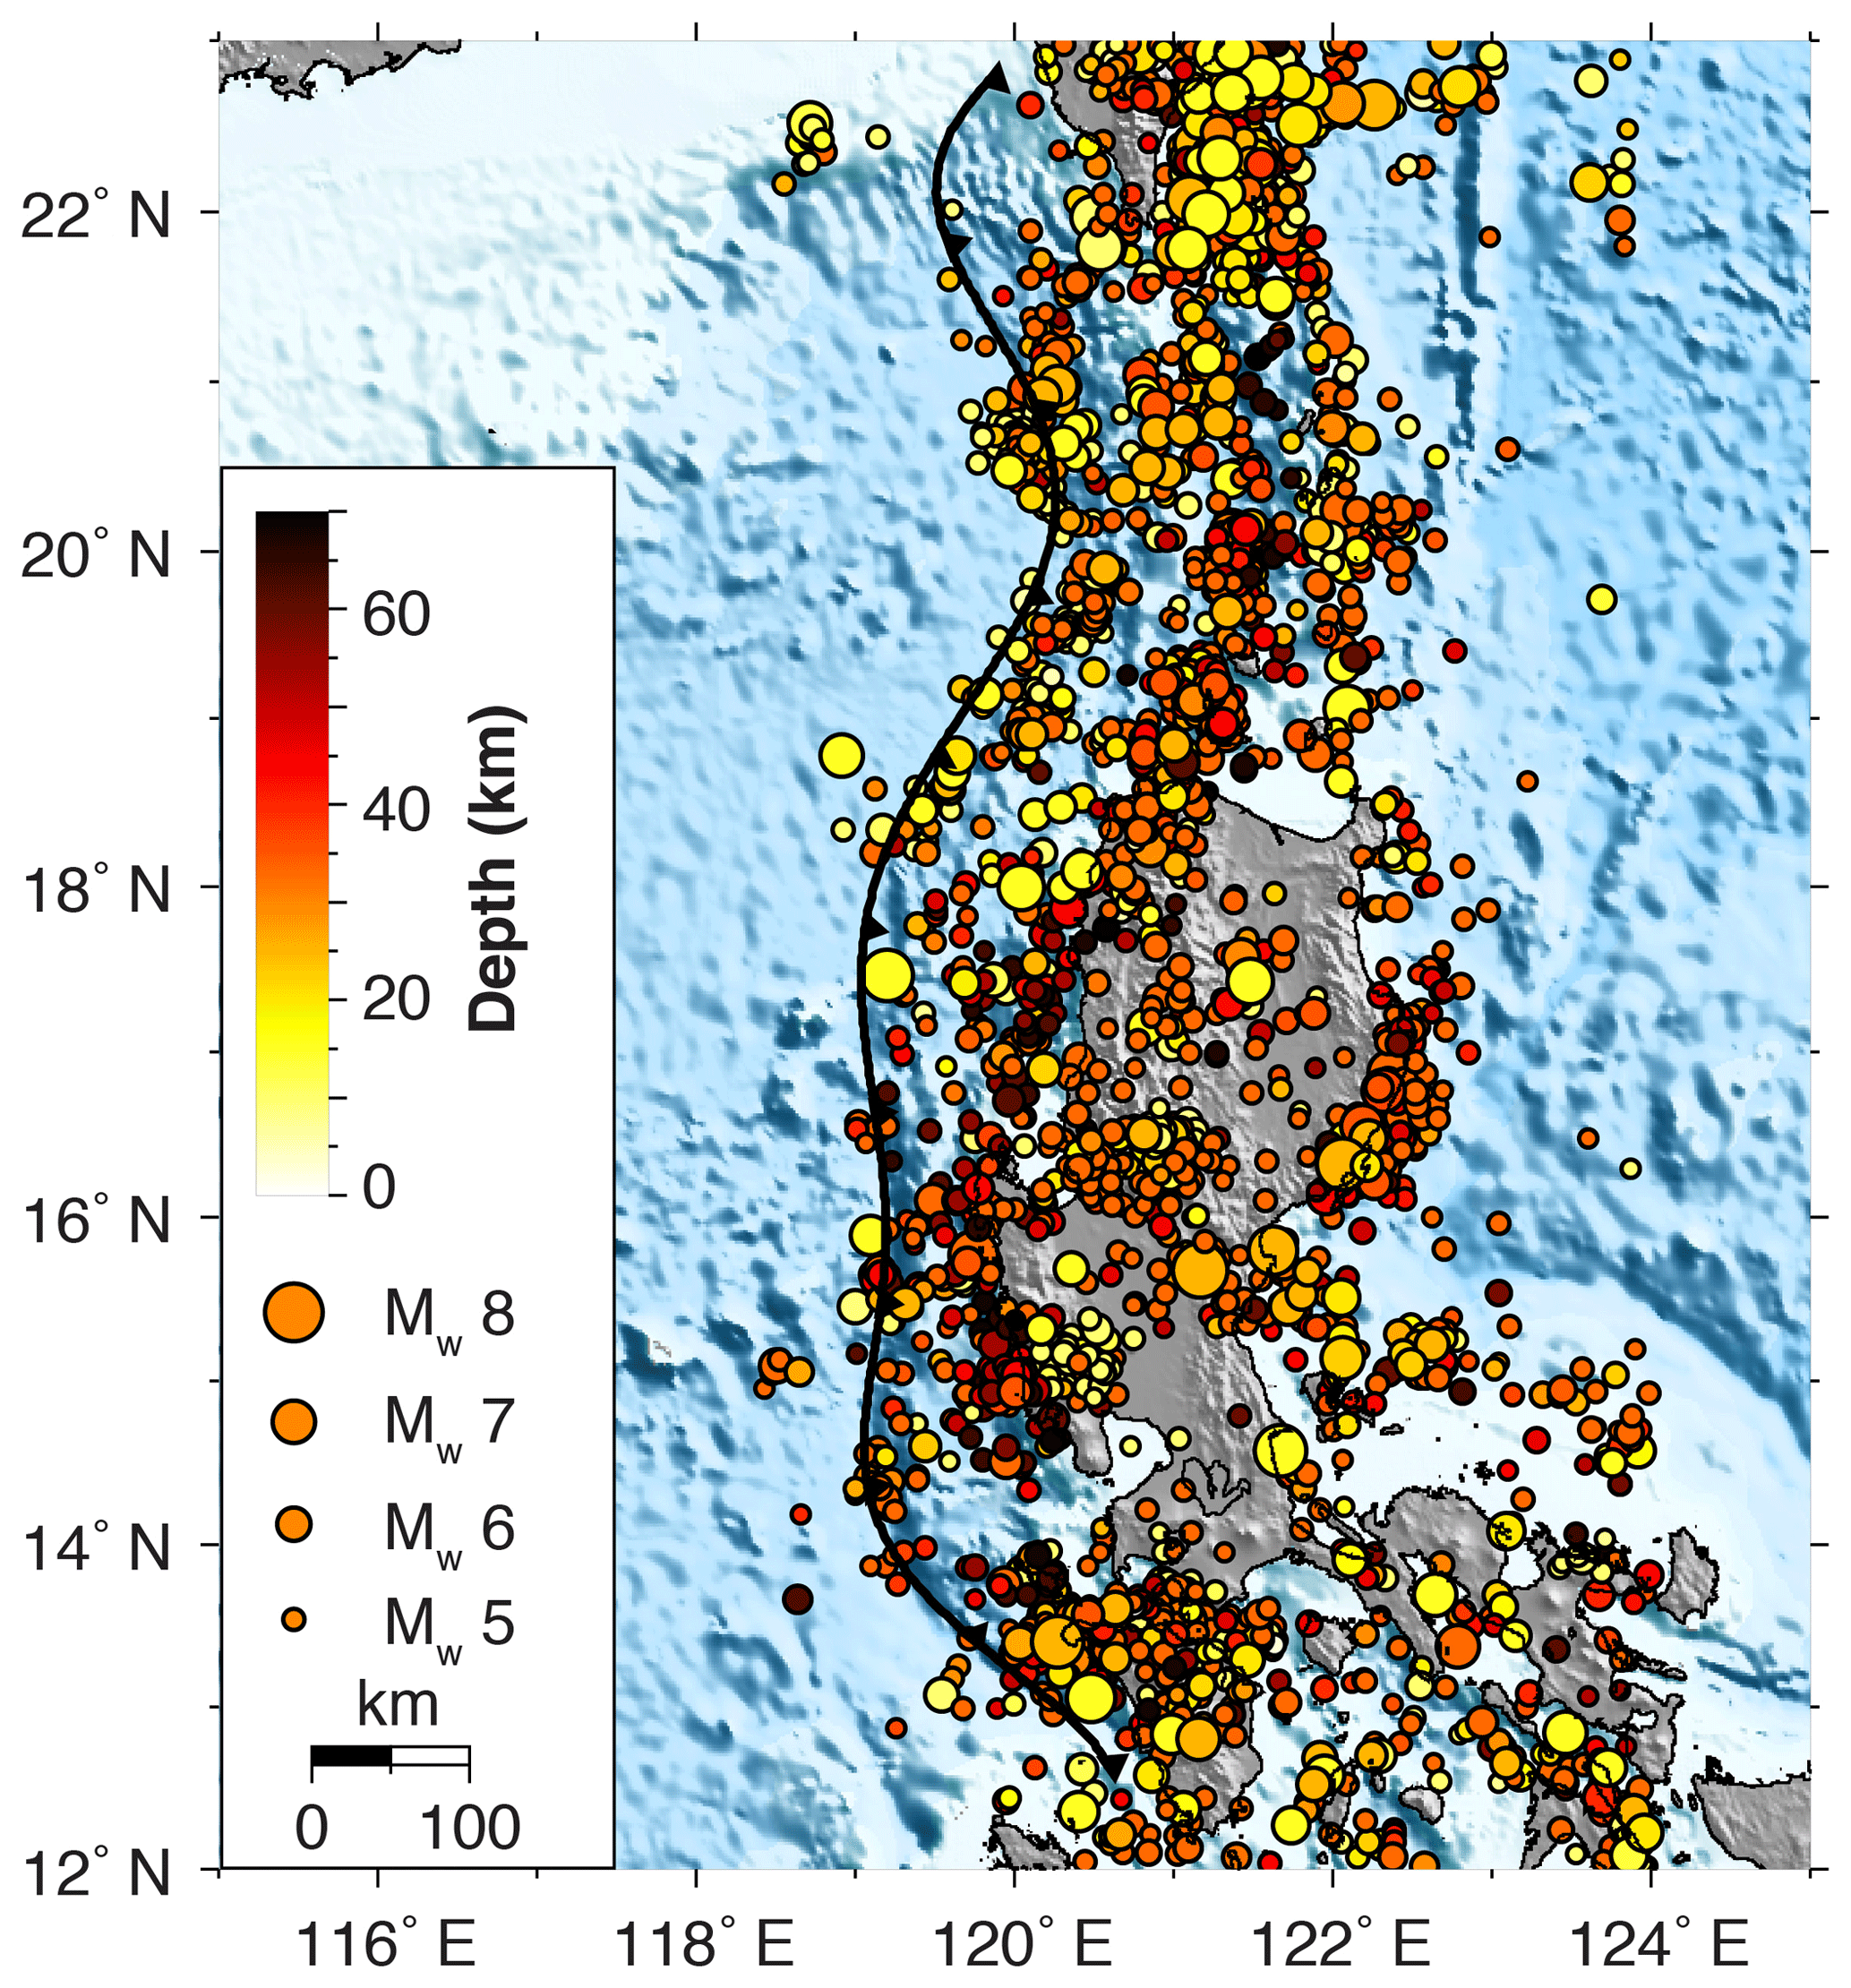
Figure 2Seismicity (Mw>4.5) in the Manila subduction zone between 1900 and 2018. This data set is downloaded from the USGS catalog. Color represents the depth and size scales of the seismic moment magnitude indicated in the legend.
Moving to the north, between 16 and ca. 17.5∘ N, a bathymetric high called the Scarborough seamount chain is subducting beneath the Philippine plate. The Scarborough seamount can be traced between ca. 12 and 18∘ N from the subducting Sunda plate and between ca. 16 and 19∘ N (Fig. 1) after subducting beneath the Philippine plate from the regional tomography model (Wu et al., 2016). This seamount chain has been interpreted as part of an extinct middle ocean ridge (MOR) that is either presently being accreted or subducted under the trench at 16 ∘N (Ludwig, 1970; Pautot and Rangin, 1989). A slab tear was proposed at 16∘ N based on seismic-related strain energy release of intermediate depth and shape changes in the dip angle of the slab (Bautista et al., 2001). Although great earthquakes can rupture across the seamounts or morphological bounds occasionally (e.g., Bell et al., 2014; Duan, 2012; Kumagai et al., 2012), global observations suggest that in many cases seamounts or barriers impede (Singh et al., 2011; Wang and Bilek, 2011) or confine rupture propagations (Qiu et al., 2016). Further, we note that slab tears at 14 and 16∘ N bound the southern and northern tips of the highly coupled west Luzon trough (Hsu et al., 2012, 2016) coincidently, and these tears may act as morphological barriers to limit the rupture propagation similar to that noted from the 2015 Mw=7.8 Nepal event (Qiu et al., 2016). We, therefore, define the region between 14 and 16∘ N as segment 1 (zone 1) (Fig. 3a and d).
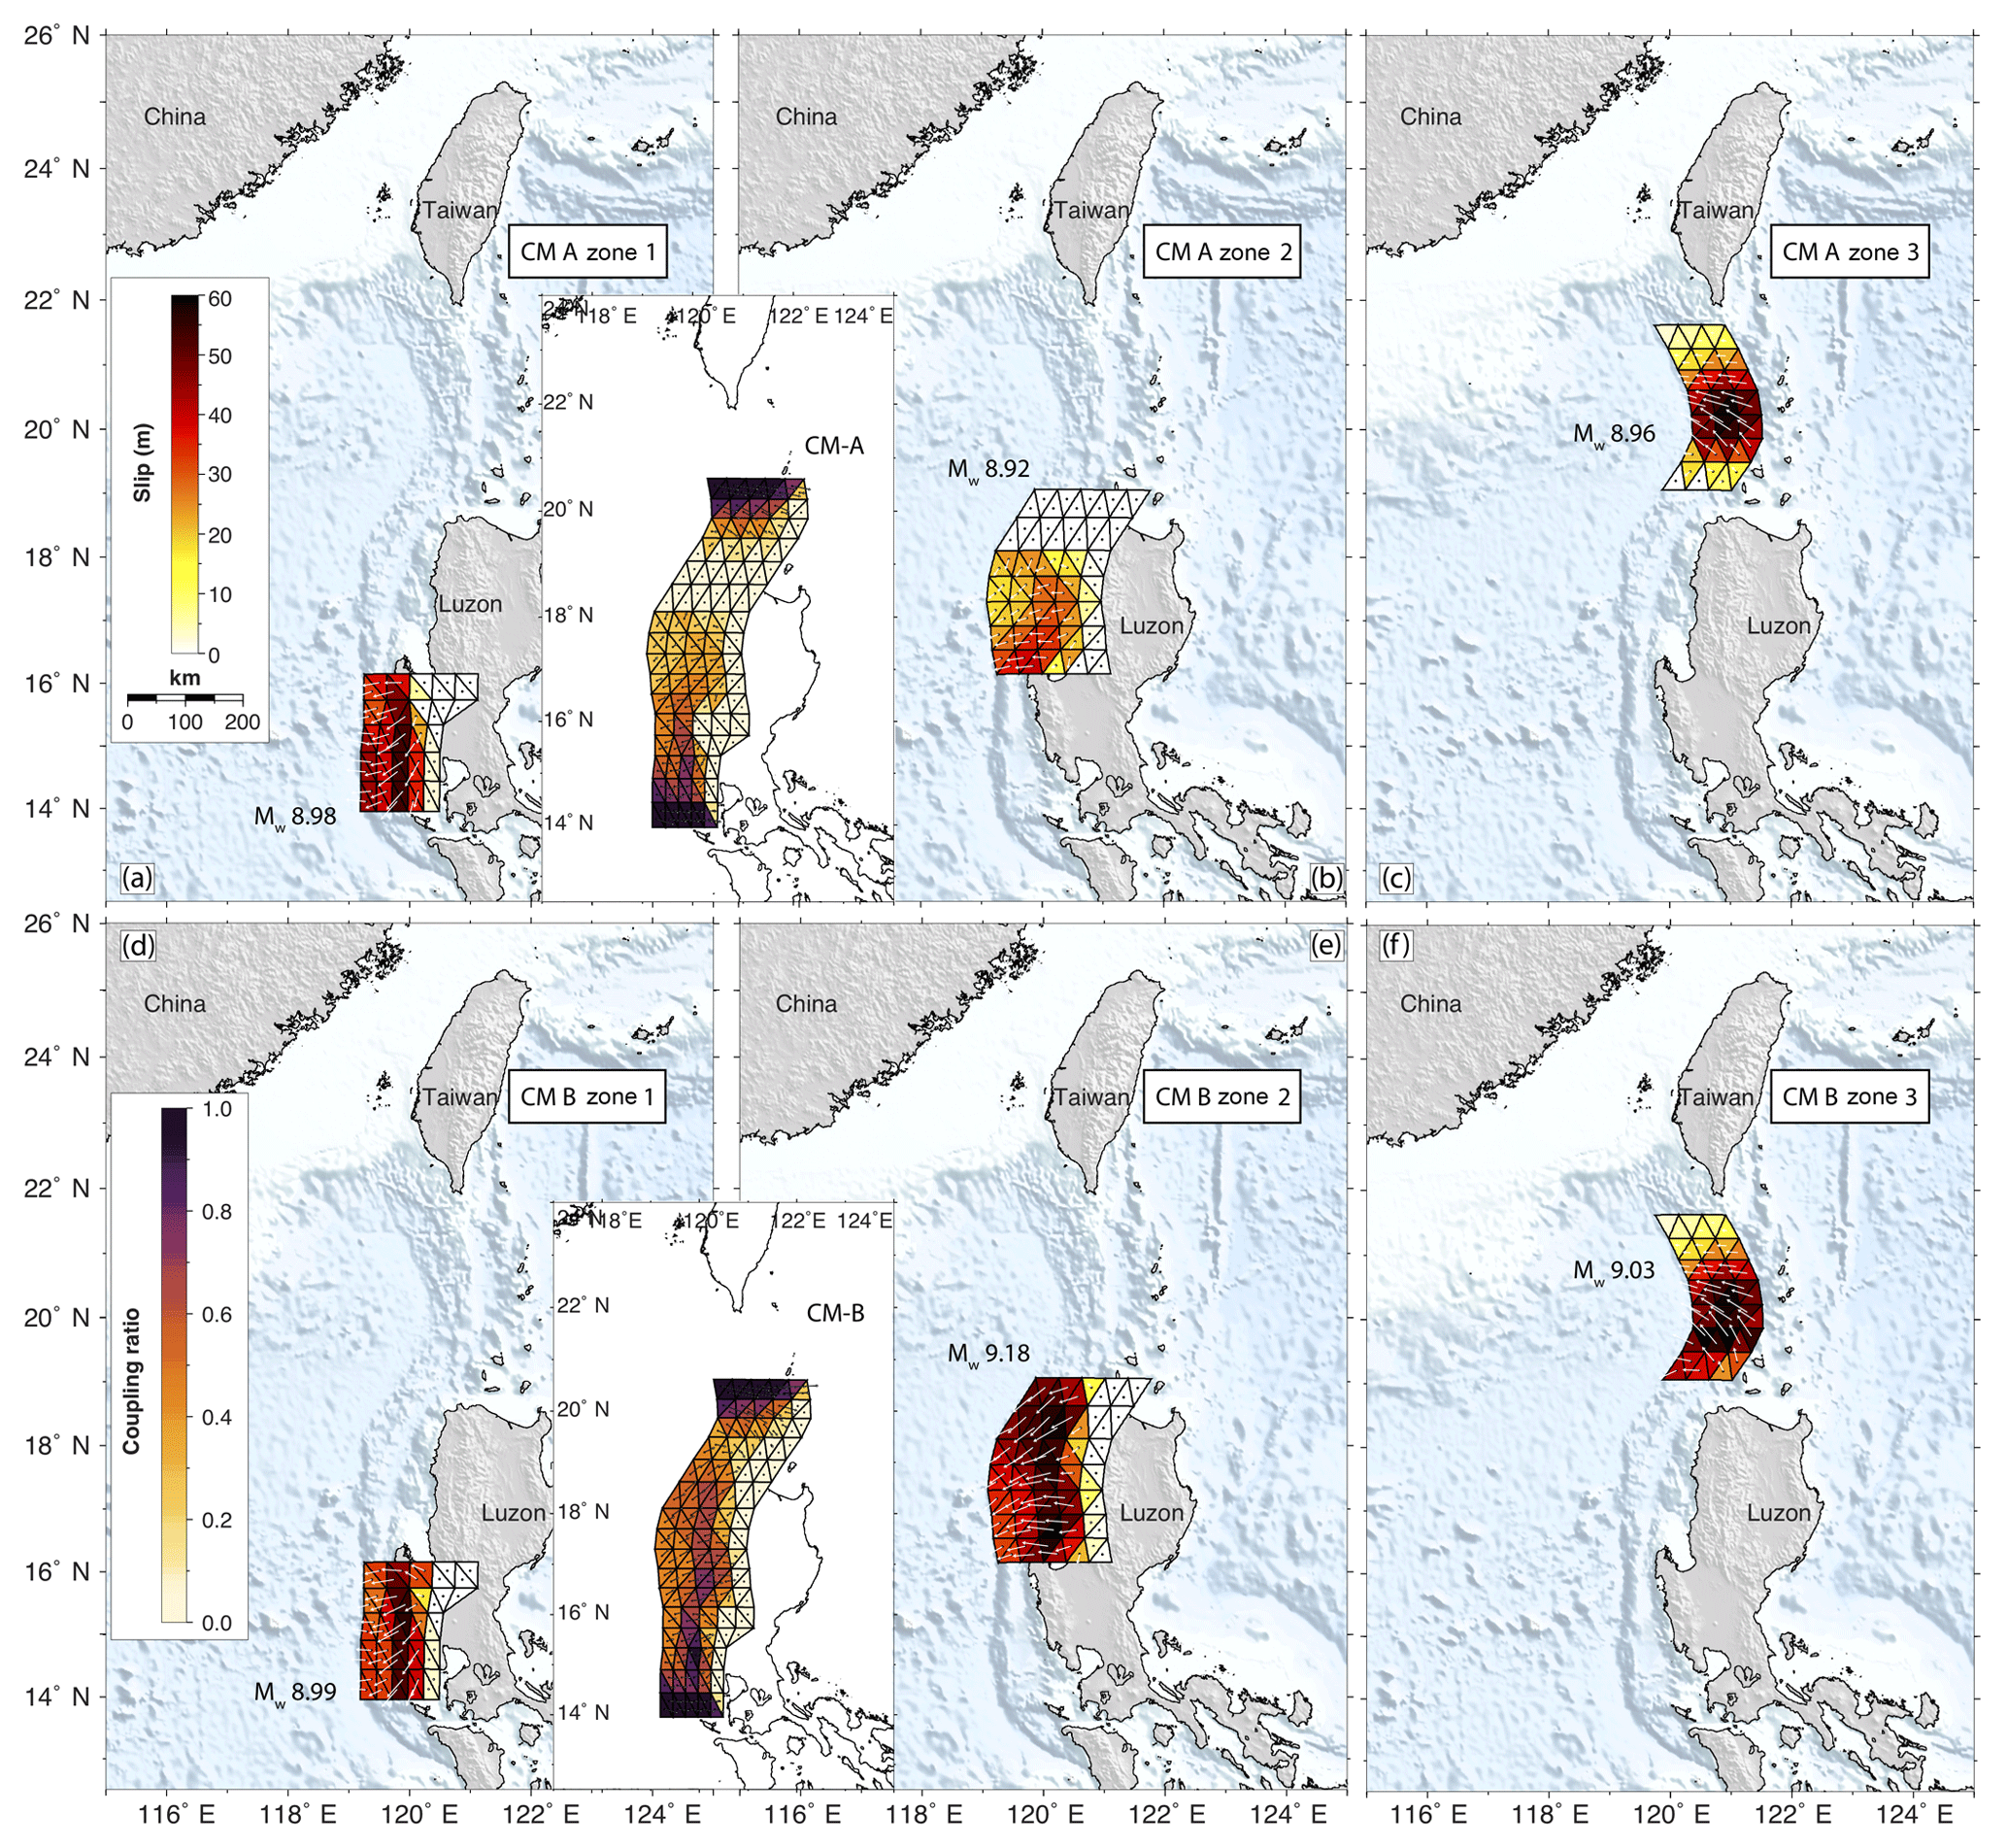
Figure 3Proposed rupture slip models based on coupling models from Hsu et al. (2016) assuming a 1000-year seismic return time period. Panels (a) and (b) show the slip models from coupling model A (Hsu et al., 2016) in zones 1 and 2, respectively. Panel (c) shows a proposed hybrid model based on coupling model A (19 to 20∘ N) and a Gaussian shape of slip distribution (20 to 21.7∘ N) with a 50 % coupling ratio in zone 3. Panels (d–f) represent the same slip models as (a–c) but based on coupling model B (Hsu et al., 2016). CM refers to coupling model. Coupling models A and B are from Hsu et al. (2016) that are shown in the inset map. White arrows show the possible slip directions during an earthquake. Vectors in the coupling maps show the slip deficit direction that is accumulated for future release in earthquakes. The estimated seismic moments of each model are labeled in each subplot with rigidity of 30 GPa. The slip magnitude and coupling ratio are shown by its corresponding color scales.
2.2 Rupture segment 2 (zone 2, 16–19∘ N)
As noted in Sect. 2.1, the Scarborough seamount chain is located between ca. 16 and 17.5∘ N where the subducting Sunda plate meets with the Philippine plate (Fig. 1). A regional tomography model also suggests that the subducted seamount chain can be traced between ca. 16 and 19∘ N (Wu et al., 2016). In this subducted seamount region, the absence of seismicity and seismic-related strain energy release at intermediate depths suggest the possible trajectory of the MOR that is interpreted to be still hot and deforming plastically (Bautista et al., 2001). Globally studies of subducting seamount systems suggest that large fracture zones are formed surrounding the seamount, and the highly fractured region can act as barriers to hinder the rupture propagation (e.g., Wang and Bilek, 2011). Because the stress concentration in and around the fracture zones is high and may easily reach failure criteria, the seamount can trigger (e.g., Kumagai et al., 2012; Koyama et al., 2013) the failure of highly stressed asperities in the neighborhood, nucleating as a great earthquake (e.g., Kumagai et al., 2012; Koyama et al., 2013). Previous studies also suggest that seamounts cause persistent fault creep (e.g., Singh et al., 2011) or rupture as small earthquakes due to localized areas of high fracture and associated regional stress anomalies (e.g., Wang and Bilek, 2011). Thus, fault creep and the rupture of single or multiple asperities are all possible in this region.
The Geodetic coupling map constrained by long-term GPS velocity measurements indicates that the seamount chain region (i.e., ca. 16 to 19∘ N) is less coupled (Fig. 3, coupling models A and B), partially due to the fault creep caused by the seamounts or poor constraints by paucity of the offshore observations (Hsu et al., 2012, 2016). The weak coupling extends further north to 19∘ N, in the area of the southern tip of the North Luzon Trough and west of the northern tip of Luzon Island. This area is likely creeping or weakly coupled (Fig. 3, coupling mode A and B). Additionally a trench-parallel gravity anomaly (TPGA) has been interpreted with great subduction earthquakes occurring predominately in areas characterized by strongly negative TPGA, while regions with strongly positive TPGA are relatively aseismic (Song and Simons, 2003). We note that positive TPGA covers from ca. 16 to 19∘ N (Hsu et al., 2012), coinciding with the geodetically determined weakly coupled and creep regions. Considering all these factors mentioned above, we redefine segment 2 (zone 2) as the region between 16 and 19∘ N as (Fig. 3b and e) slightly extends further north when compared with the same segment of Li et al. (2016).
2.3 Rupture segment 3 (zone 3, 19–22∘ N)
The area of the megathrust bounded between the southern tip of Taiwan and northern Luzon (between 19 and 22∘ N) (Fig. 1) is poorly understood, as the current available geodetic measurements are sparse and primarily deployed in the volcanic islands to the east which are far away from the Manila trench (Hsu et al., 2012, 2016). In this region, the Manila trench bends sharply at 20∘ N (Fig. 1). Geologically the bending has been interpreted as the result of the subduction of a high-relief bathymetrical plateau that is sufficient buoyant to impede subduction (Bautista et al., 2001; Suppe, 1988) or may due to thick sediments (Lin et al., 2009). Additionally, here regional block faulting stretches the continental crust, resulting in numerous micro-continental fragments. Further, the 1980s geophysical studies (Taylor and Hayes, 2013) have recovered a magnetic quiet zone characterized to the continental-to-oceanic boundary (Bautista et al., 2001), and this zone was further interpreted with a transition zone between a continental and oceanic lithosphere (Taylor and Hayes, 2013). If these numerous fragments are indeed subducting beneath the Philippine Sea Plate, then they would have to be buoyant enough to resist the subducting process at 20∘ N with fast subducting of the neighboring portions of the trench that may extending south to 19∘ N. Such a situation would result a complex stress field in the upper plates that were mirrored by diverse and complicated focal mechanism solutions (Bautista et al., 2001).
As more marine geophysical data becomes available, there is an increased understanding of the geological structure and potential seismogenic faults (Lin et al., 2009). Detailed analysis of seismic reflection data (i.e., line 973 in Lin et al., 2009) reveals prominent seismogenic structures in the region, which include frontal decollement beneath the lower-slip domain and out-of-sequence thrusts (OOSTs) in lower- and upper-slope domains (Lin et al., 2009; Zhu et al., 2013). Evidence from the thermal regime of these structures suggests that the megathrust and part of the frontal decollement are seismogenic (Lin et al., 2009). These seismogenic structures are found to be analogous to that observed in the Nankai prism of the Nankai Trough, Japan, posing potential for generating great earthquakes and tsunamis as they did in Nankai (Lin et al., 2009; Yokota et al., 2016).
Fan et al. (2016) revealed a low-velocity zone that spans from shallow to deep depths of 20–200 km beneath the prism, suggesting that the collision develops northward and the subducting process may stop at 22∘ N. Coincidently, at a similar latitude (21.5∘ N), Lin et al. (2009) interpret that south of 21.5∘ N, the subducting is active while north of this latitude the plate convergence is accommodated by intense compressional deformation of the crust due to the buoyance of the Eurasian plate that resists subduction. Consequently, in light of the geological evidence noted above, we slightly shorten the northern boundary of segment 3 from Li et al. (2016), and we define the region between 19 and 21.7∘ N as segment 3 (zone 3) (Fig. 3c and f).
Using geodetic surface measurements, a velocity value can be derived and used to constrain the elastic strain accumulation rate between the subduction plate interfaces, the so-called interseismic coupling model (Chlieh et al., 2008; Hsu et al., 2012, 2016; Loveless and Meade, 2010; Megawati et al., 2009). This model reveals strain accumulation within seismic cycles that can potentially be released during great earthquakes, although the final rupture extent is commonly not exactly the same as forecasted by the coupling maps (Konca et al., 2008; Ruiz et al., 2014) and in some cases uncoupled parts of the megathrust may regularly produce tsunamis (Witter et al., 2016). However to move towards an associated tsunami hazard assessment from such potential ruptures, the coupling map, although not perfect, is often the necessary choice (e.g., Power et al., 2012; Megawati et al., 2009).
Using decades-long GPS velocity measurements, Hsu et al. (2016) proposed two coupling models (A and B) that best explain the plate movements and coupling state on the Manila megathrust and other faults on Luzon Island. With this coupling or slip deficit rate estimates and the possible seismic return time period, we can forecast the likely slip distributions that may fail in future earthquakes. For seismic return time period, given the short duration of historical records relative to the return periods of large-magnitude events of interest, and limitations in our capacity to infer earthquake return periods from first-principle physics, it is unrealistic to expect to develop a comprehensive understanding of seismic return periods. We thus have to rely on the observations. The modern seismic records for the Manila trench only trace back to ∼1900 and provide constraints on the natural frequency of earthquakes with its corresponding magnitude assuming the Gutenberg–Richter (G–R) earthquake relations, and thus are often implemented for tsunami hazard assessment (Li et al., 2016; Power et al., 2012). Historical records since the 1560s suggest that there is no recorded earthquake with Mw>7.6 in the Manila subduction zone, implying that the determined return time period for a great earthquake from the G–R relation will likely be poorly constrained (Hsu et al., 2016). However geological evidence from purported tsunami deposits may provide evidence of tsunamis at four locations in the SCS (i.e., Fig. 1, Ramos et al., 2017; Sun et al., 2013; Yu et al., 2009; Yang et al., 2018). Some studies suggest that a giant tsunami event might have occurred ca. 1000–1064 CE (Ramos et al., 2017; Yang et al., 2018). With an assumption of a 1000-year return period, the magnitude can reach from geodetic analysis (Hsu et al., 2016). Here we choose to model scenarios that release 1000 years of accumulated strain because these represent large, rare, and yet plausible events, which are of interest for hazard assessment purposes, and paleogeologic data indicate that large events may have occurred about 1000 years ago.
Based on coupling models A and B of Hsu et al. (2016) in which the spatial distribution of slip rate and coupling rate is available, we use a return period of 1000 years to calculate the slip deficit of great earthquakes assuming each event releases 1000 years of strain accumulation while ignoring the possible portion of strain released by smaller events. For the predefined zones 1 to 3 (see Sect. 2.1–2.3), different approaches are used. For zones 1 and 2 where the coupling ratios and slip rate are relatively better constrained than zone 3, we calculate the slip deficit by multiplying the slip deficit rate at each triangle node (Fig. 3a, b, d, and e) with 1000 years. The slip deficit models in zone 1 for models A and B (Fig. 3a and d) are similar with the maximum slip > 50 m occurring at ca. 20–30 km seismogenic depth due to the high coupling ratio. For zone 2, the slip model based on A has a compact area and less slip compared with the slip model based on B (Fig. 3b and e). This is because the extra North Luzon Trough fault was introduced in model B, resulting in larger spatial extent and higher coupling while equally explaining the GPS velocity measurements (Hsu et al., 2016).
Due to paucity of observations in zone 3, no coupling ratios were resolved. Geologically this zone is much more complicated than zones 1 and 2 (Lin et al., 2009). Multiple OOSTs are revealed from seismic reflection profiles (Lin et al., 2009; Zhu et al., 2013). Failure of these OOST (also called megasplay) faults with high dip angle contributes to generating devastating waves as evidenced by historic tsunami events in other subduction zones (Moore et al., 2007; Park et al., 2002). It is, therefore, crucial but difficult to precisely quantify the individual role of the OOSTs and megathrust in tsunami generation.
We propose two end-member scenarios, considering different rupture modes in zone 3 with two steps. We first calculate the slip deficit from the slip deficit rate of models A and B between 19 and 20∘ N. We then consider two end-member scenarios in the region from 2 to 21.7∘ N. The first member is the seismogenic events with rupture depths determined from a collection of global centroid moment tensor (GCMT) solutions of the world megathrust earthquakes (Fig. 4). We assume the fault slip pattern follows a Gaussian distribution centered at 25 km of the mean depth from the global great earthquakes. We cut off slip deeper than 50 km as the rock properties at this depth and beyond induce semi-brittle and ductile flow (Hippchen and Hyndman, 2008; Hyndman and Wang, 1993; Wang, 2007). This can capture to first order the potential slip extent (Fig. 3c and f), with a depth range of slip consistent with observations from global megathrust great earthquakes (e.g., Chlieh et al., 2007; Pollitz et al., 2011; Ruiz et al., 2014; Salman et al., 2017; Wei et al., 2012). For the second mode, we consider tsunamigenic events similar to the 2011 Mw=9.0 Japan earthquake in which the earthquake can rupture all the way to the trench. We estimate the plate convergence rate in the fore-arc in zone 3 to be 67 mm yr−1 (Hsu et al., 2009) with a 24.5 mm yr−1 shortening under the 91.5 mm yr−1 plate convergence rate with respect to the Sunda plate (Hsu et al., 2016; Sella et al., 2002). We assume 67 mm yr−1 convergence was fully accommodated by the megathrust and implement it as the amplitude of the Gaussian distribution, allowing the maximum slip occurring at the trench (Fig. 5a and b). For each rupture mode, we have two slip models corresponding to coupling model A and B, and assume half of plate convergence rate is accommodated by the megathrust (Fig. 5a and b, with 80 % coupling ratio shown in Fig. 6c and d). For the second-member model, we implement rupture on both the megasplay fault and the megathrust assuming each of them to accommodate half of the fore-arc plate convergence and a uniform slip on the splay fault as a simple case (Fig. 5c and d). We implement this splay fault only with seismogenic rupture events as we think this case is easier due to the splay fault's bottom cut to the megathrust at seismogenic depth (Lin et al., 2009). We consider a 50 % coupling ratio for both the megathrust and splay fault (Fig. 5c and d, with 80 % coupling shown in Fig. 6a and b). Details about these proposed rupture scenarios are given in the summary Table S1 in the Supplement.
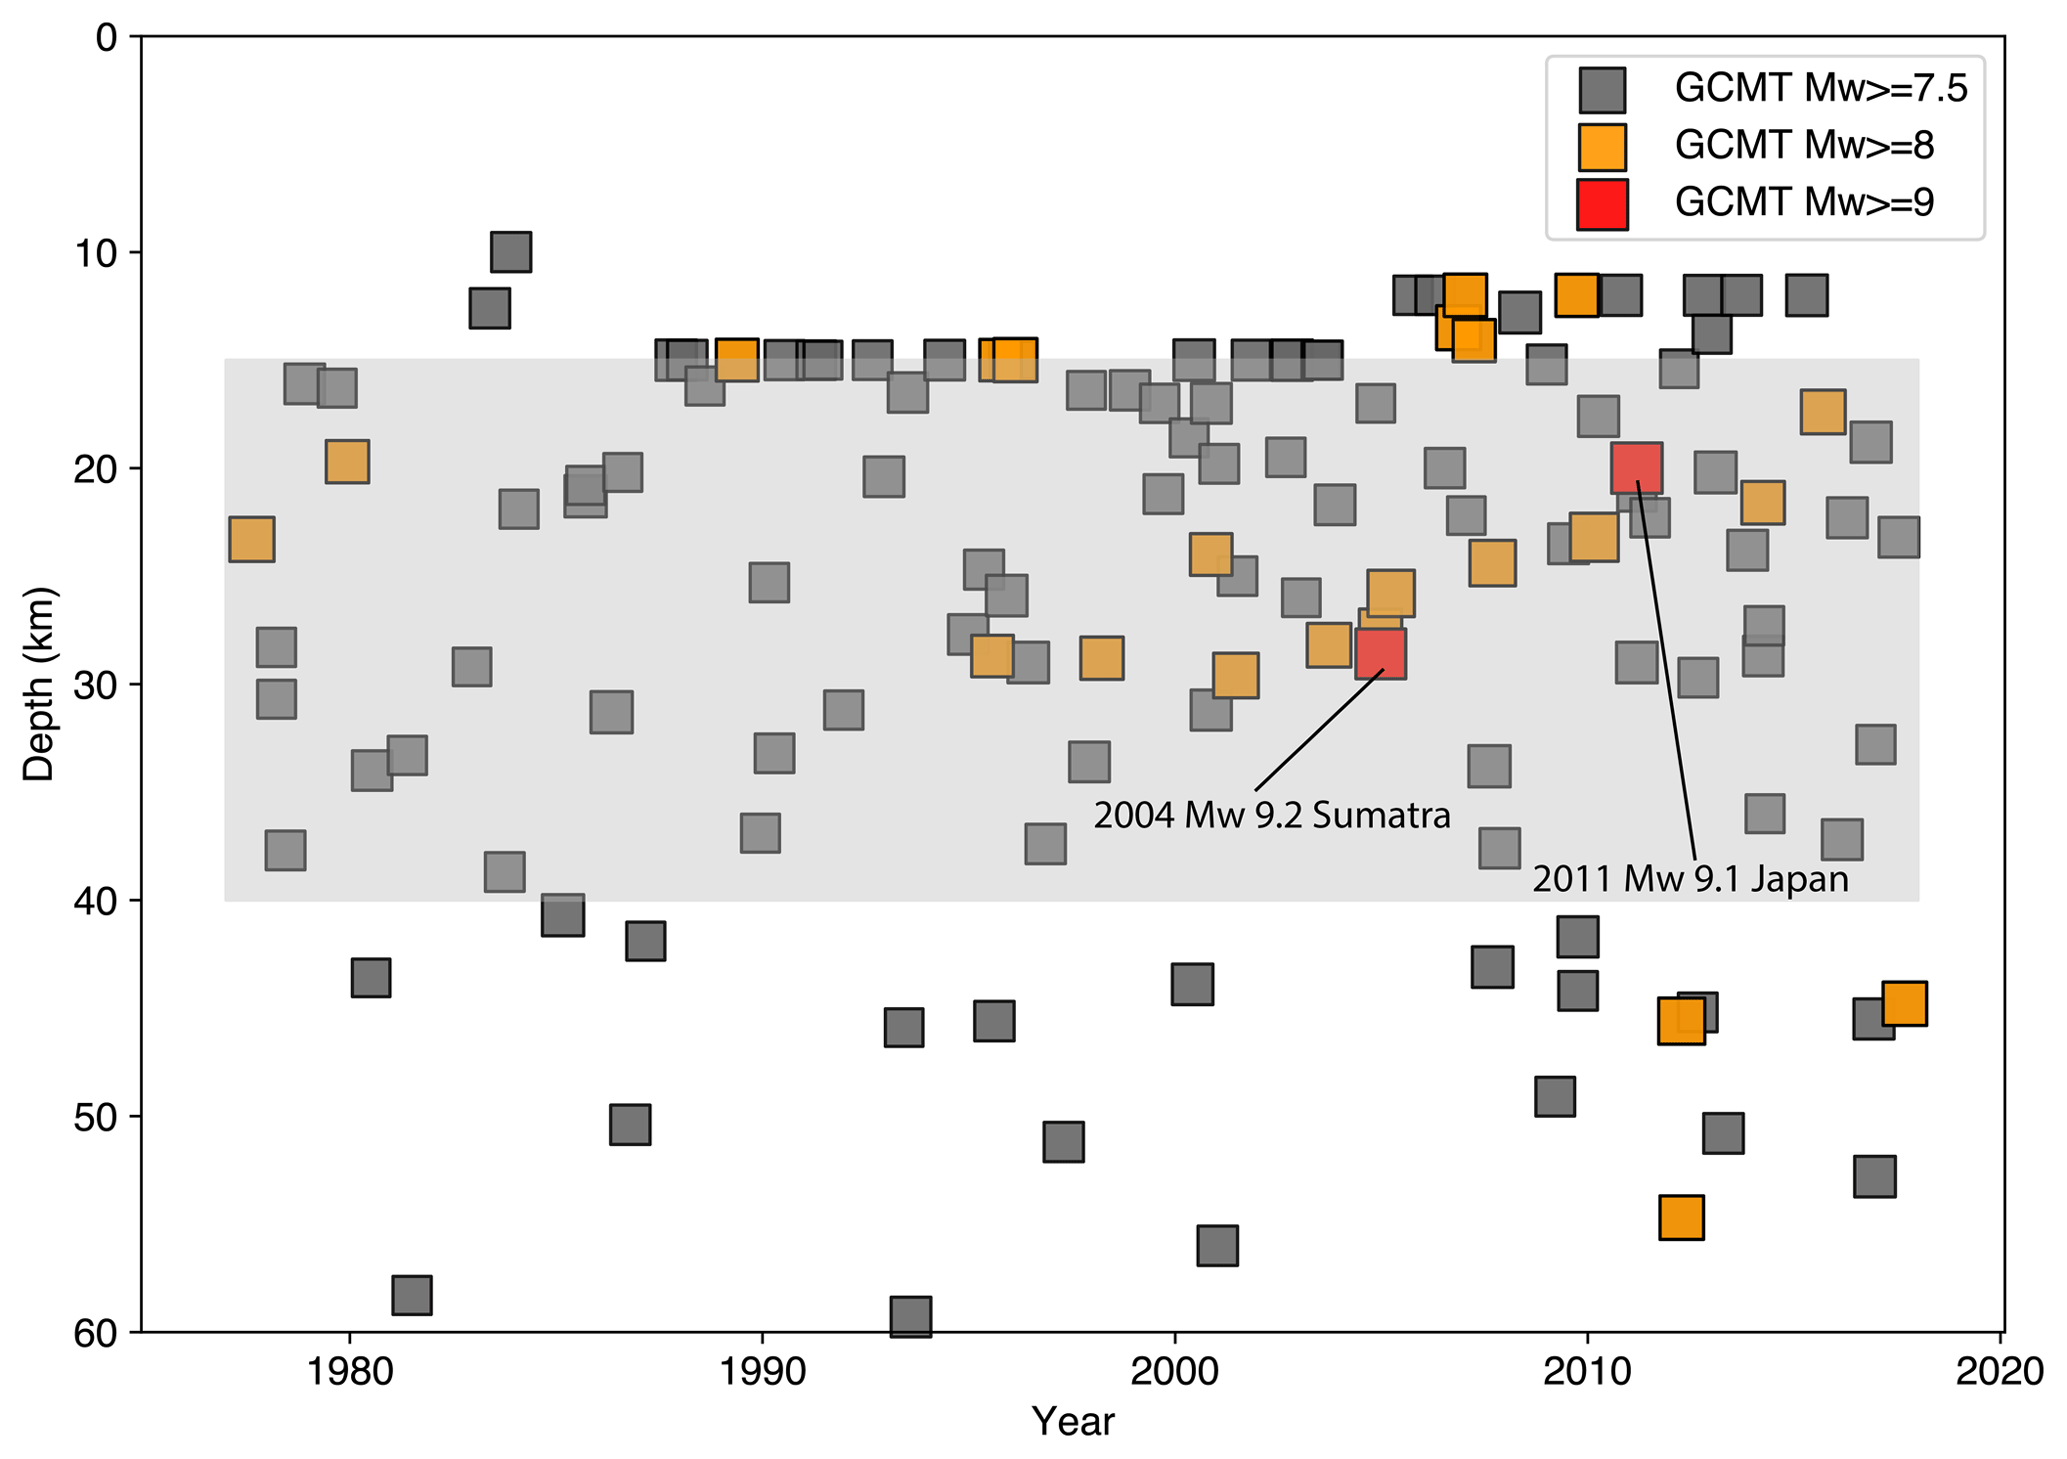
Figure 4Depth distribution of the seismicity in the Manila subduction zone between 1970 and 2018. This data set is downloaded from the GCMT catalog. Colors represent the seismic moment magnitude. The giant 2004 Sumatra and 2011 Japan earthquakes are highlighted in the map.
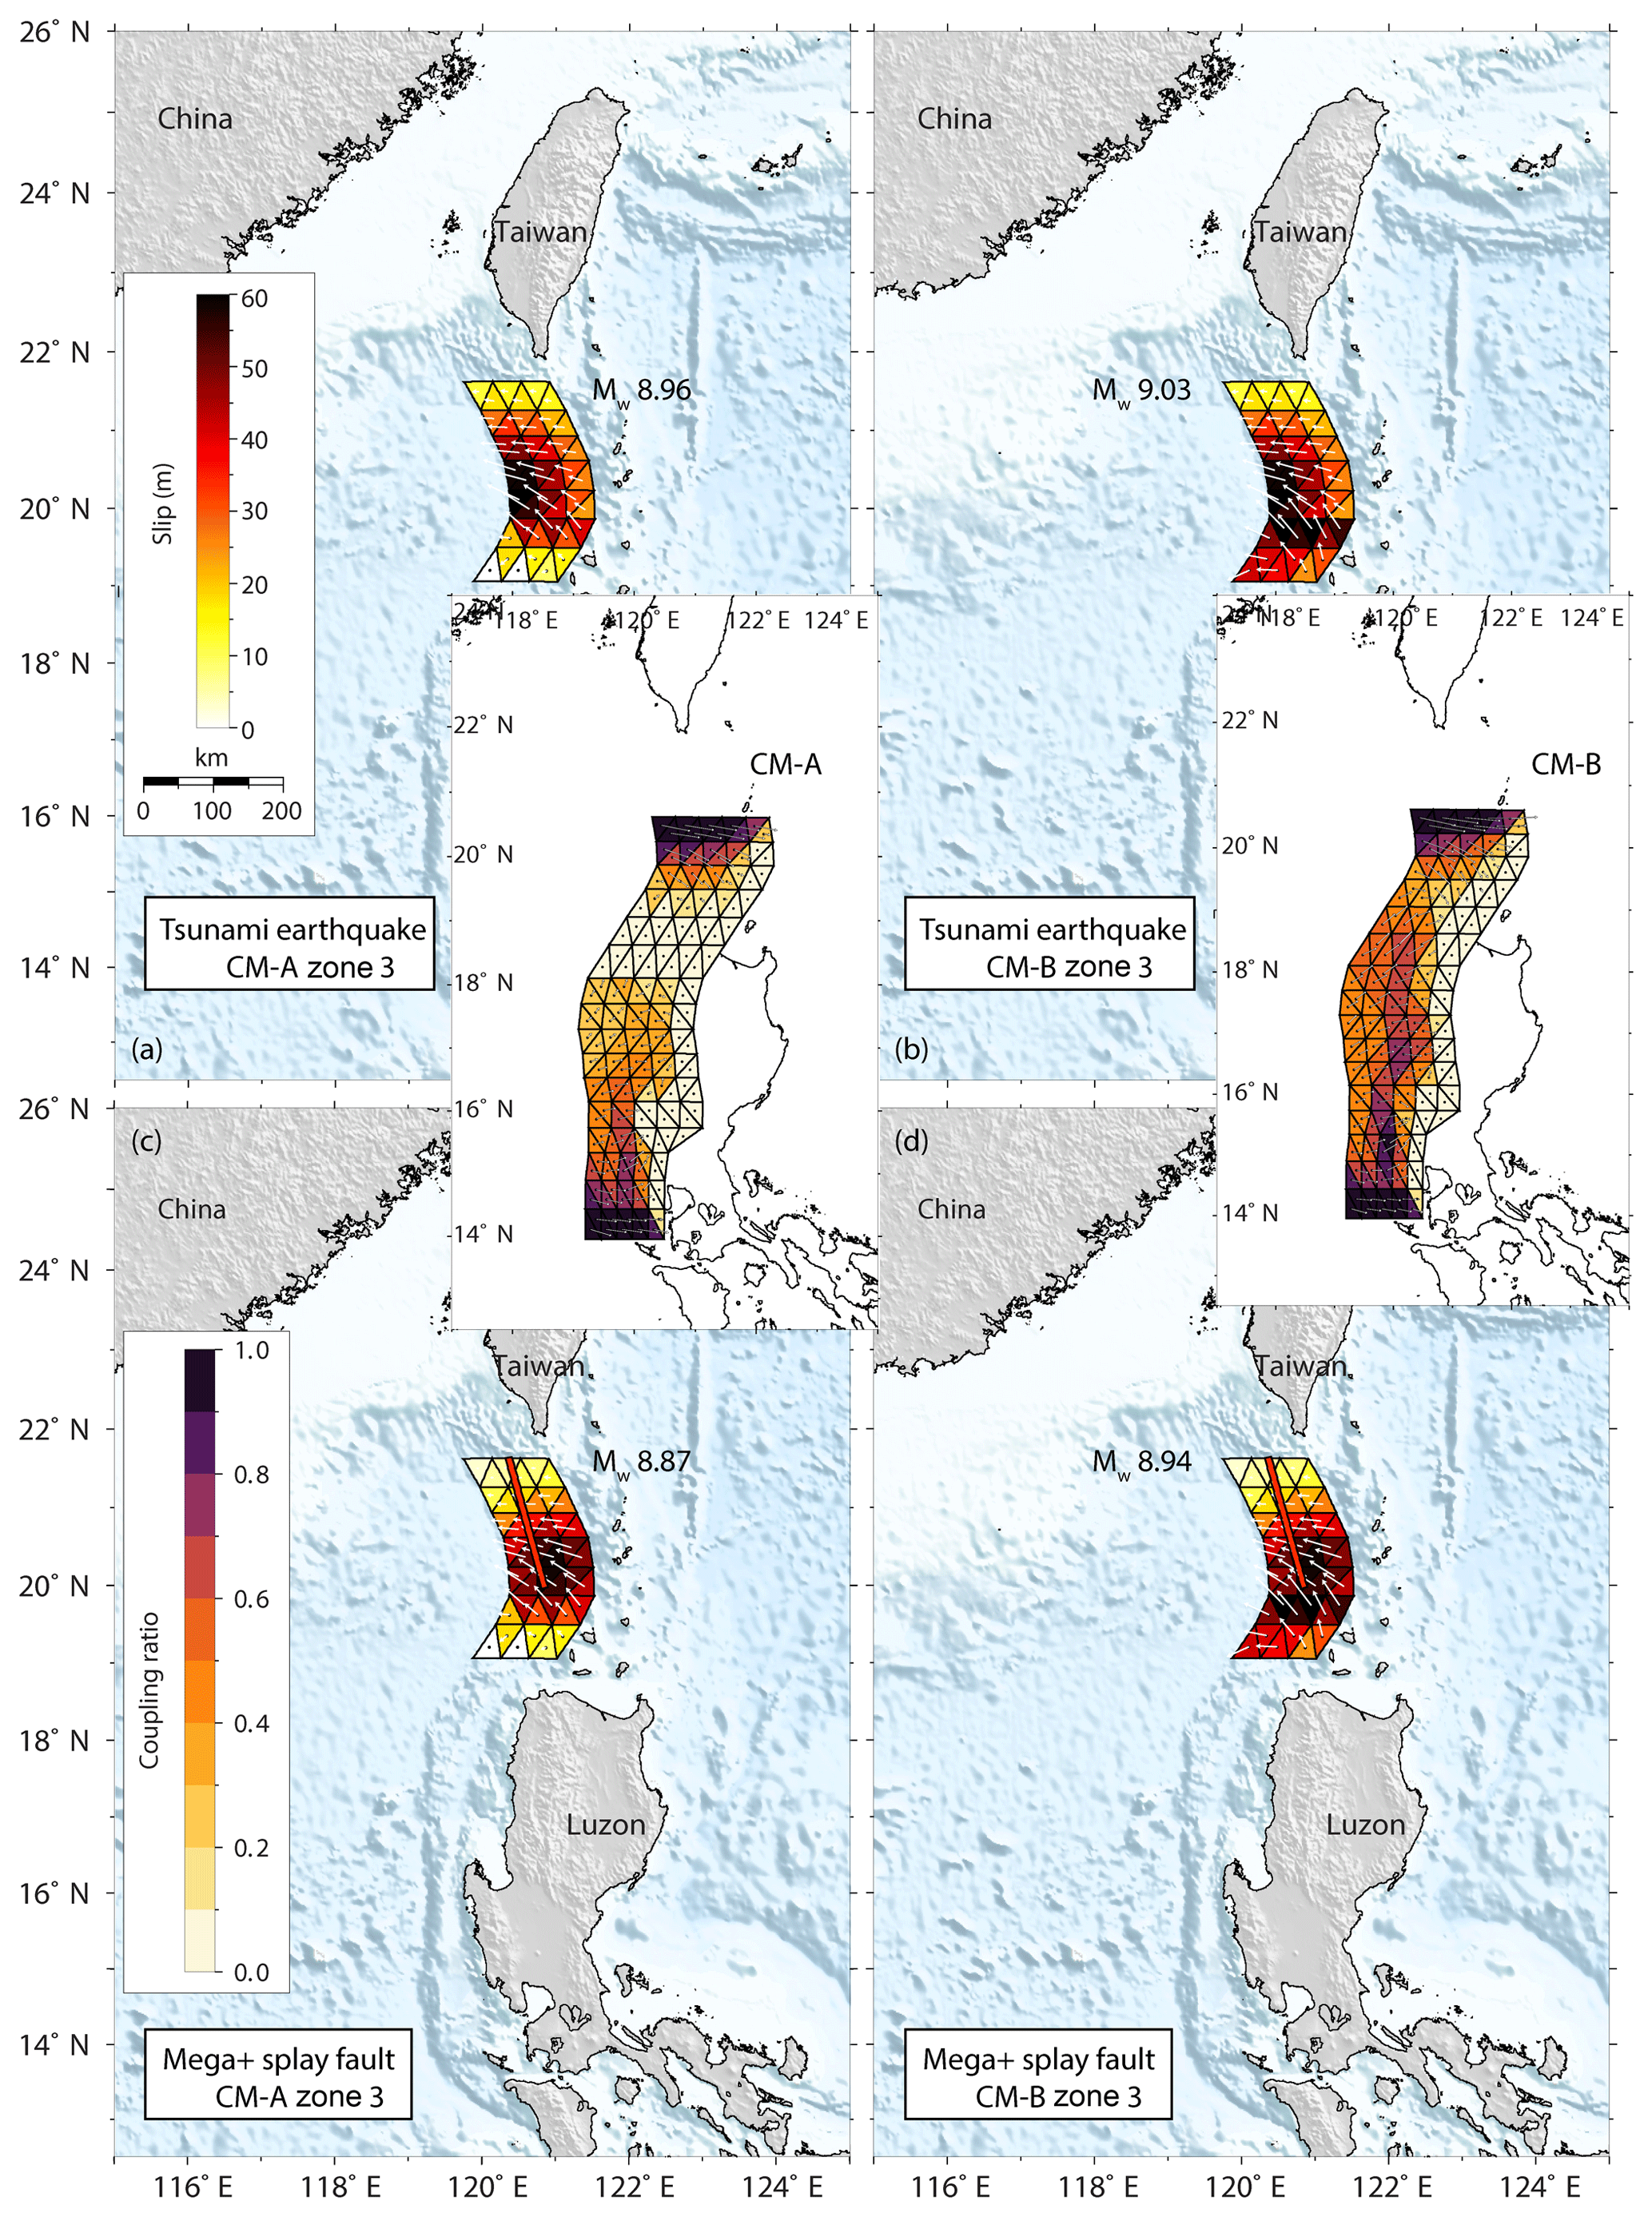
Figure 5Proposed slip models in zone 3. Panels (a, b) show the shallow rupture type of slip models (e.g., Tohoku-Oki) based on coupling models A and B (Hsu et al., 2016), respectively. Panels (c, d) represent megathrust (Fig. 3c and f) rupture and the out-of-sequence megasplay type of slip models, respectively. We assume 50 % coupling for the megathrust and the megasplay faults. CM refers to the coupling model shown in the inset map. White arrows show the possible slip directions during earthquakes. Vectors in the coupling maps show the slip deficit direction that is accumulated for future release in earthquakes.

Figure 6(a) Seismogenic megathrust rupture together with megasplay rupture scenario with 80 % coupling ratio for each of them from model A of Hsu et al. (2016). Panel (b) same as (a) but from model B of Hsu et al. (2016). (c) Shallow rupture (e.g., Tohoku-Oki rupture) the same as Fig. 3a but with 80 % coupling ratio on the megathrust. (d) Shallow rupture (e.g., Tohoku-Oki rupture) same as Fig. 3b but with 80 % coupling ratio on the megathrust. A 1000-year seismic return period was assumed in the slip calculation.
The geometry of the OOST is derived from Lin et al. (2009) and covers the area from 20 to ca. 22.2∘ N, as we ignored the bending portions of the OOST in the north and south although they still can rupture with a low probability. The fault is ca. 260 km long and ca. 16 km wide and it strikes 345∘ to the north and dips 50∘ to the east (Figs. 1, 5, and 6).
4.1 Tsunami simulation setup
We use the Cornel Multi-grid Coupled Tsunami (COMCOT) model to simulate the hydrodynamic process of the tsunami waves (e.g., Wang et al., 2008; Philip, 1994; Li et al., 2016, 2018) produced by those proposed earthquake ruptures. The initial surface elevations generated by all the proposed rupture models can be found in the Supplement. To account for the nonlinear effect in the nearshore region, the simulation solves the nonlinear shallow water equations in spherical coordinates for the entire SCS region with a bottom Manning friction coefficient of 0.013 (Li et al., 2018). We used the 1 arcmin grid of General Bathymetric Chart of the Oceans (GEBCO) data for the modeling. A uniform grid was used because we do not focus on near- and onshore processes where high-resolution topographical data and good understanding of the bottom friction effect are required. Synthetic gauges along the 20 m isobaths are specified to record the tsunami waveforms. For the initial tsunami waves, we assume the rupture occurs instantaneously and the vertical seafloor deformation produced by the ruptures is equal to the initial ocean surface deformation (e.g., Li et al., 2016, 2018; Liu et al., 2009).
4.2 Maximum tsunami wave height
For all the simulated scenarios, the resulting wave height in the near-source regions mainly depends on the rupture location and earthquake magnitude. While in the relatively far field, the tsunami wave directivity effects and bathymetry effects also play important roles (Figs. 7 and 8). We describe the tsunami impact of each pair of source models from south (zone 1) to north (zone 3). Slip models in zone 1 generate the largest tsunami waves (>10 m) in western Luzon (Fig. 7a and b). Central Vietnam experiences a similar tsunami height (4–8 m) to the intermediate far-field area, western Palawan. Southeastern China and southern Taiwan could be hit by up to 5 m tsunami waves (Fig. 7a and b). Moving to zone 2, the slip models show the significant difference in terms of both magnitude and slip distribution between models A and B (Fig. 3b and e). Consequently, the tsunami impact caused by model B is much larger than that caused by model A in both near-source (e.g., western Luzon and southern Taiwan) and far-field regions (e.g., southeastern China and central Vietnam). Compared with the region most affected by slip models in zone 1, the worst-hit region also moves northward with the rupture location. Similarly, when the earthquakes rupture the megathrust in zone 3, the hardest-hit regions move further to the northern part of the SCS and concentrate in northern Luzon, southern Taiwan, and southeastern China (Fig. 7e and f). Further, Fig. 8 shows the diverse tsunami impacts generated by rupture scenarios in zone 3. Not surprisingly, the results suggest rupture models with higher coupling cases (Fig. 8a and b) result in larger tsunami wave heights in regions located in the northeast SCS despite the tsunami generation efficacy of shallow slip earthquakes (Fig. 8c and d). One interesting phenomenon worthy of mention is the high tsunami hazard of southeastern China regardless of the rupture locations. This is likely explained by the combined effect of tsunami wave directivity and bathymetry (Figs. 7 and 8). Tsunami waves refract significantly on the southern Chinese coast due to the shape and gradient of the continental slope, leaving southeastern China (including coastlines of Guangdong, Hong Kong, and Macau) in the direct tsunami path.
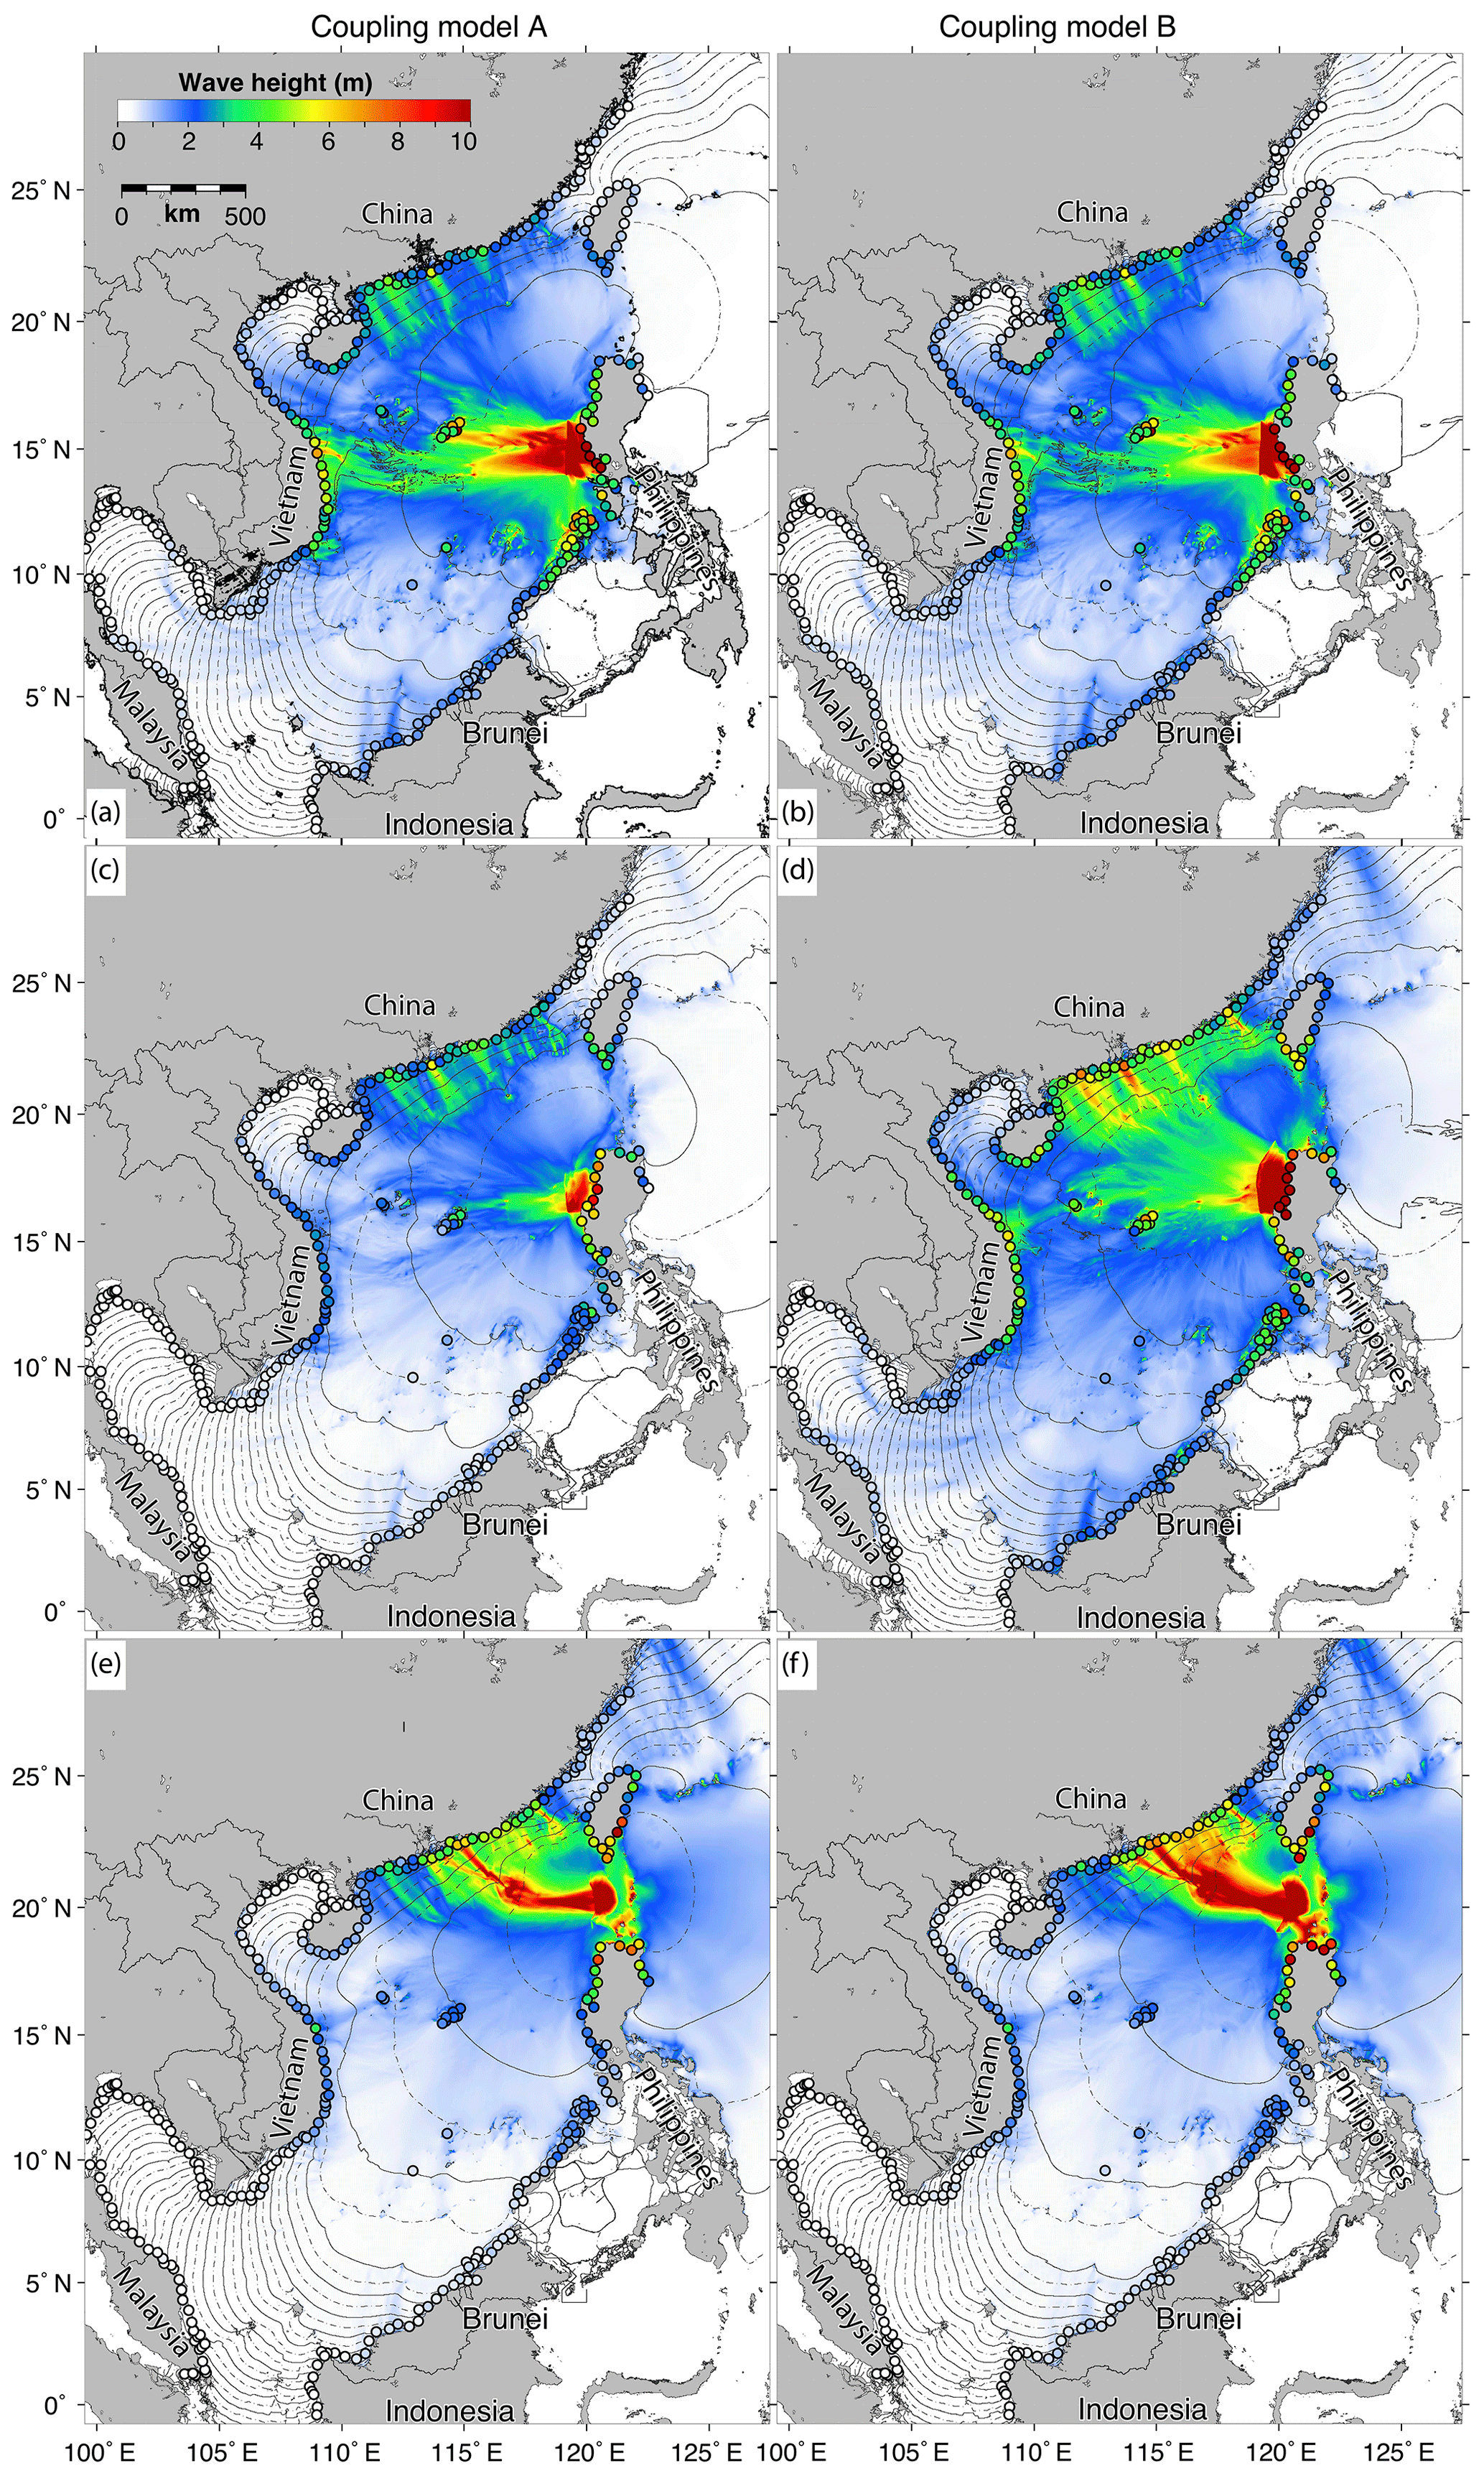
Figure 7Modeled maximum tsunami wave heights and arrival time contours in the SCS. Panels (a, c, e) show the maximum tsunami wave heights generated from rupture zones 1–3 based on slip models calculated from coupling model A (Hsu et al., 2016), respectively. Panels (b, d, f) show the same maximum tsunami wave heights but with slip models calculated from coupling model B (Hsu et al., 2016). In zone 3, we show Gaussian slip distribution with a 50 % coupling ratio scenario with other example scenarios shown in Fig. 8. The solid black contours show hourly tsunami arrival time with half-hour increments (dashed contours). The colored dots show the subsampled location at 20 m water depth, with color showing the maximum wave heights.
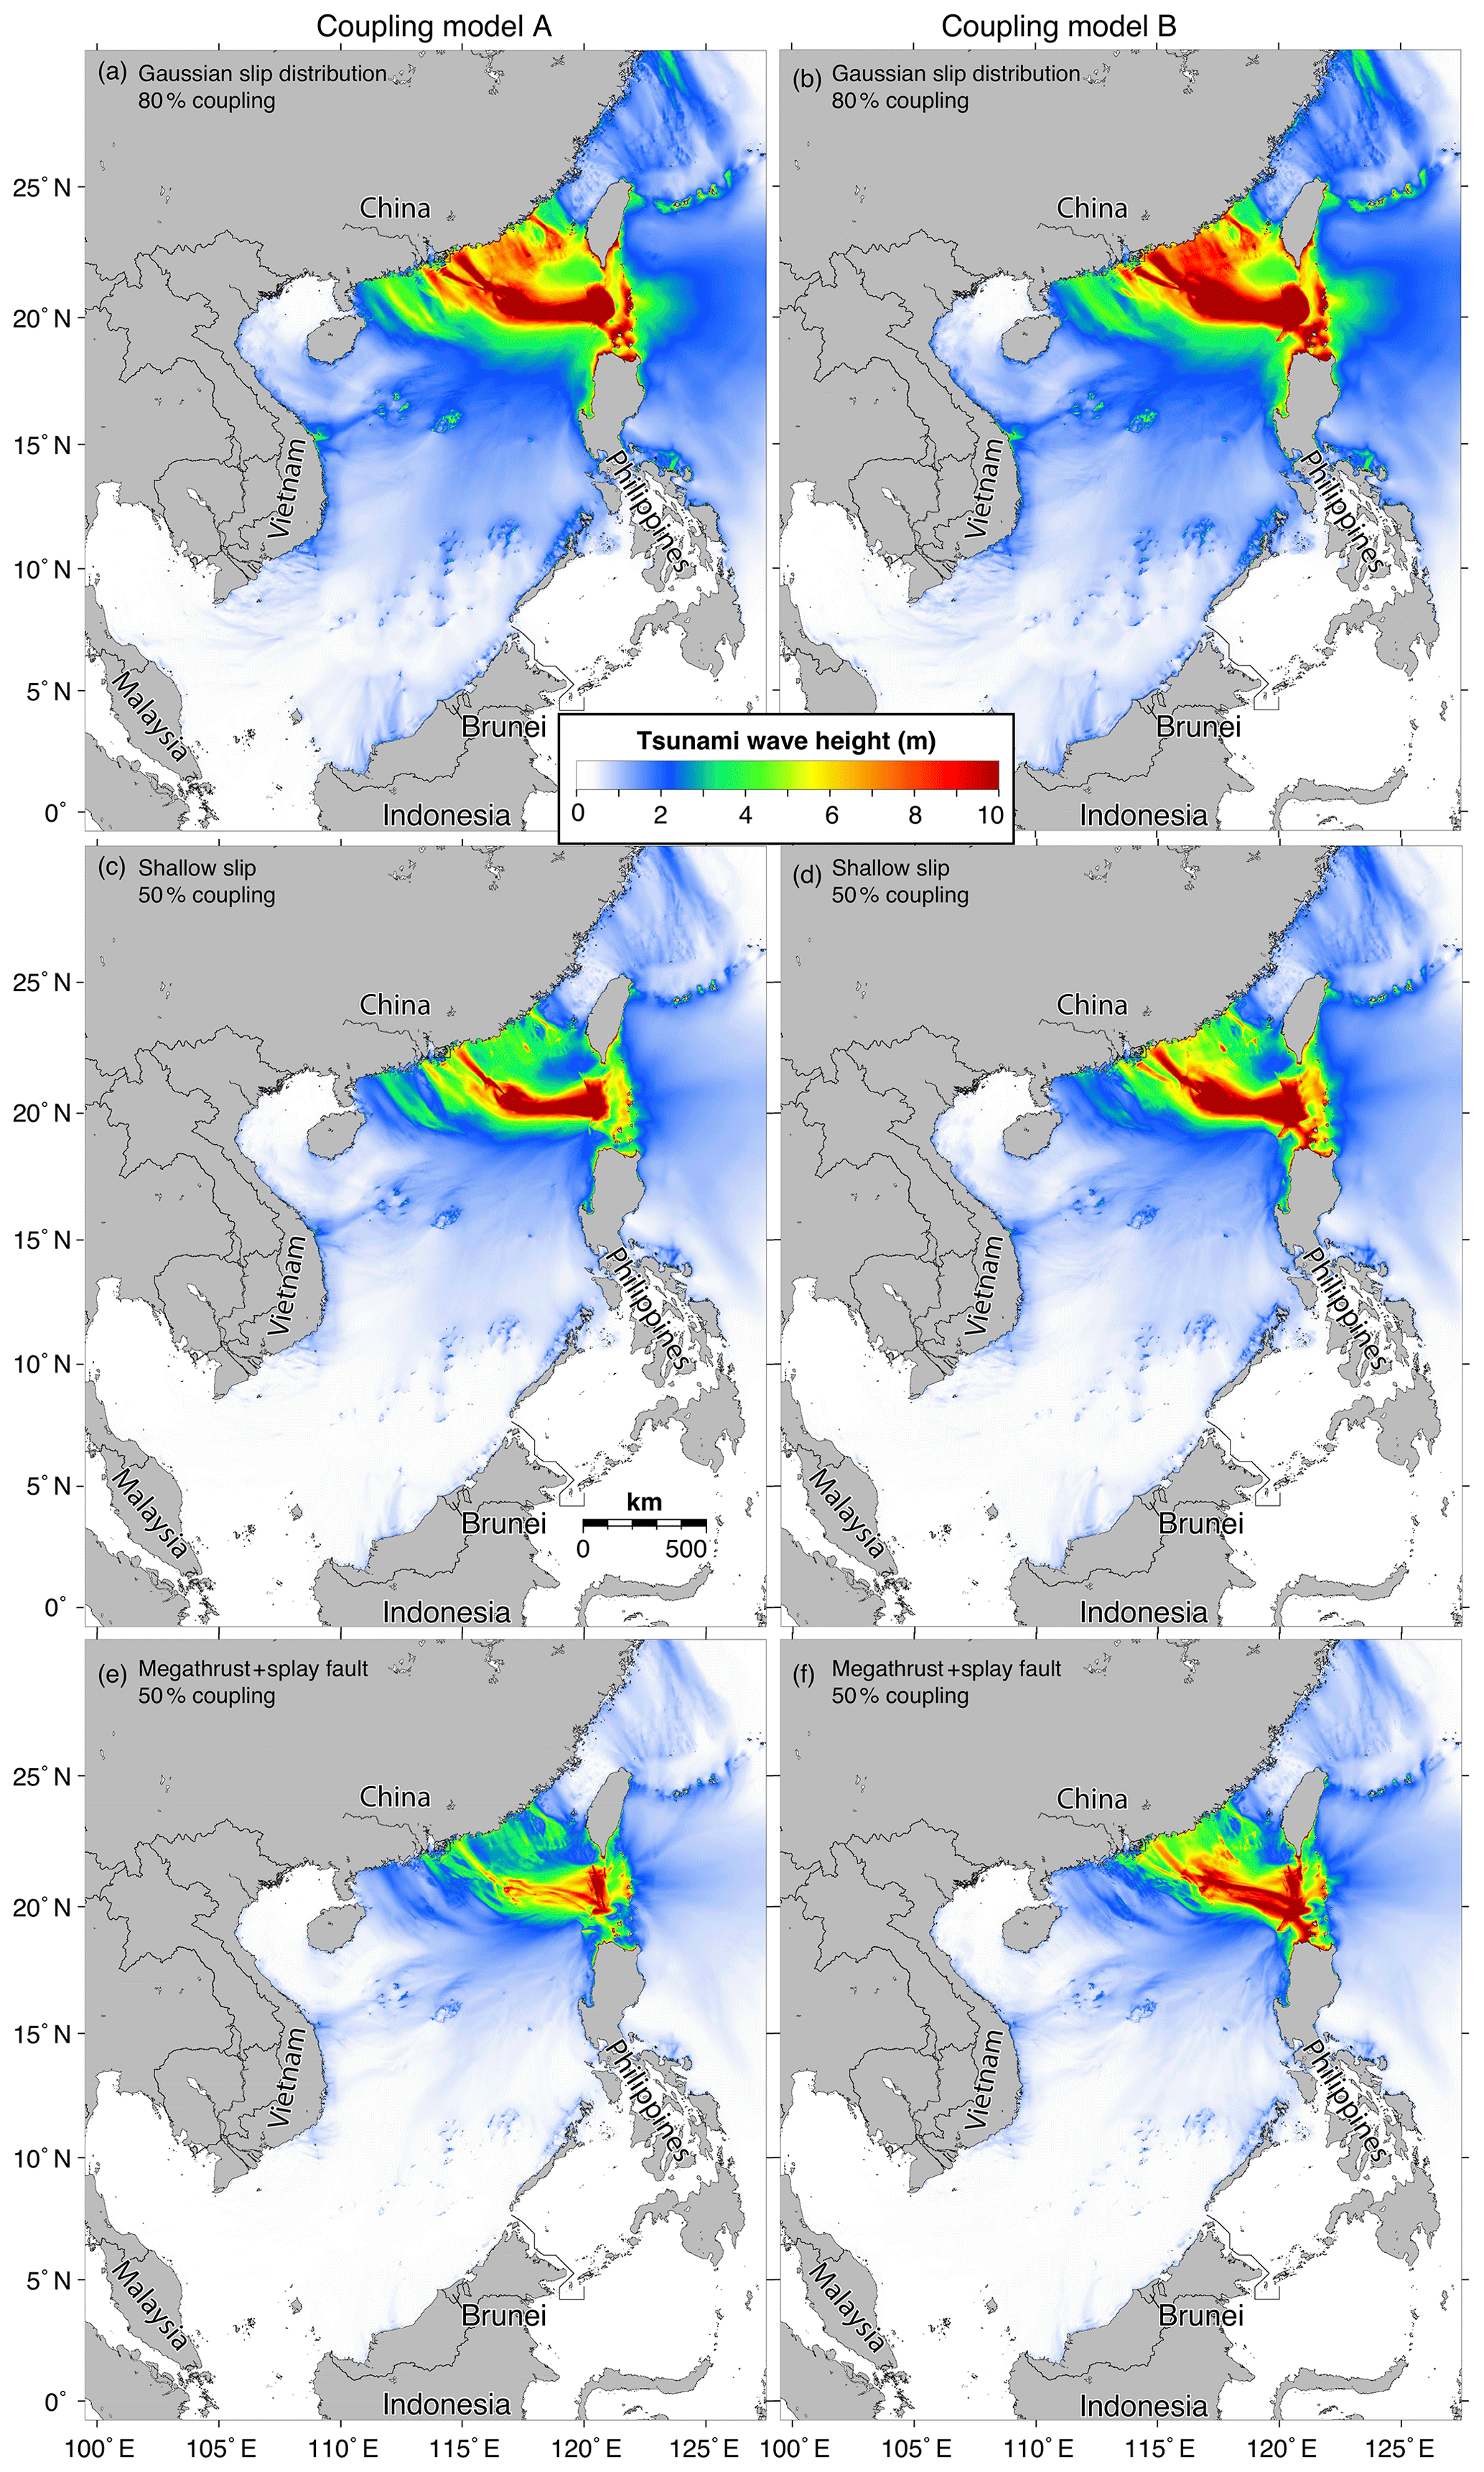
Figure 8Maximum tsunami wave heights from different rupture characteristics in zone 3 with hybrid coupling models. Panels (a, c, e) show the maximum tsunami wave heights based on coupling model A (Hsu et al., 2016). Panels (b, d, f) show the same maximum tsunami wave heights but with slip models based on coupling model B (Hsu et al., 2016).
To summarize, the near-source regions including western Luzon, northern Luzon, and southern Taiwan face the greatest tsunami hazard. The second most threatened areas are southeastern China, central Vietnam, and western Palawan. Archipelagos inside the SCS including Dongsha, Zhongsha, and Xisha also suffer severe tsunamis (up to 6–8 m tsunami wave height) when large earthquakes occur in zones 2 and 3. Coastal regions of northern Borneo, eastern Malaysia, eastern Thailand, and southern Cambodia are significantly less affected.
4.3 Tsunami travel time
The tsunami travel time is key information in tsunami evacuation planning. Similar to the other subduction zones, the near-source areas including the coast of Luzon and southern Taiwan suffer the highest tsunami waves with least evacuation time (Figs. 7 and 8). We plot the time series of tsunami waves generated by all the source models in selected synthetic gauges near nine major coastal cities in Fig. 9. Depending on the rupture locations, the tsunami arrival time is in minutes or less than half an hour for near-source cities, like Vigan, Kenting, and Kaohsiung (Fig. 9), posing great challenges to the early-warning system and subsequent evacuation process. In other areas tsunami wave travel time is relatively longer for Vietnam and southeastern China. The arrival time is commonly between 2 and 3 h after the earthquake for central Vietnam and 3–4 h for southern China. For the archipelagos inside the SCS, the tsunami waves arrive much earlier than they do on the mainland in Vietnam and China, typically ∼1 h earlier. The earlier arrival time in archipelagos make them ideal locations for installing tsunami monitoring instruments (e.g., tide gauges or GPS; see Peng et al., 2019). Such measurements may provide timely constraints on wave height for the evacuations in far-field areas. Detailed inundation maps of the main coastal cities in this region are highly recommended for designing evacuation routes.
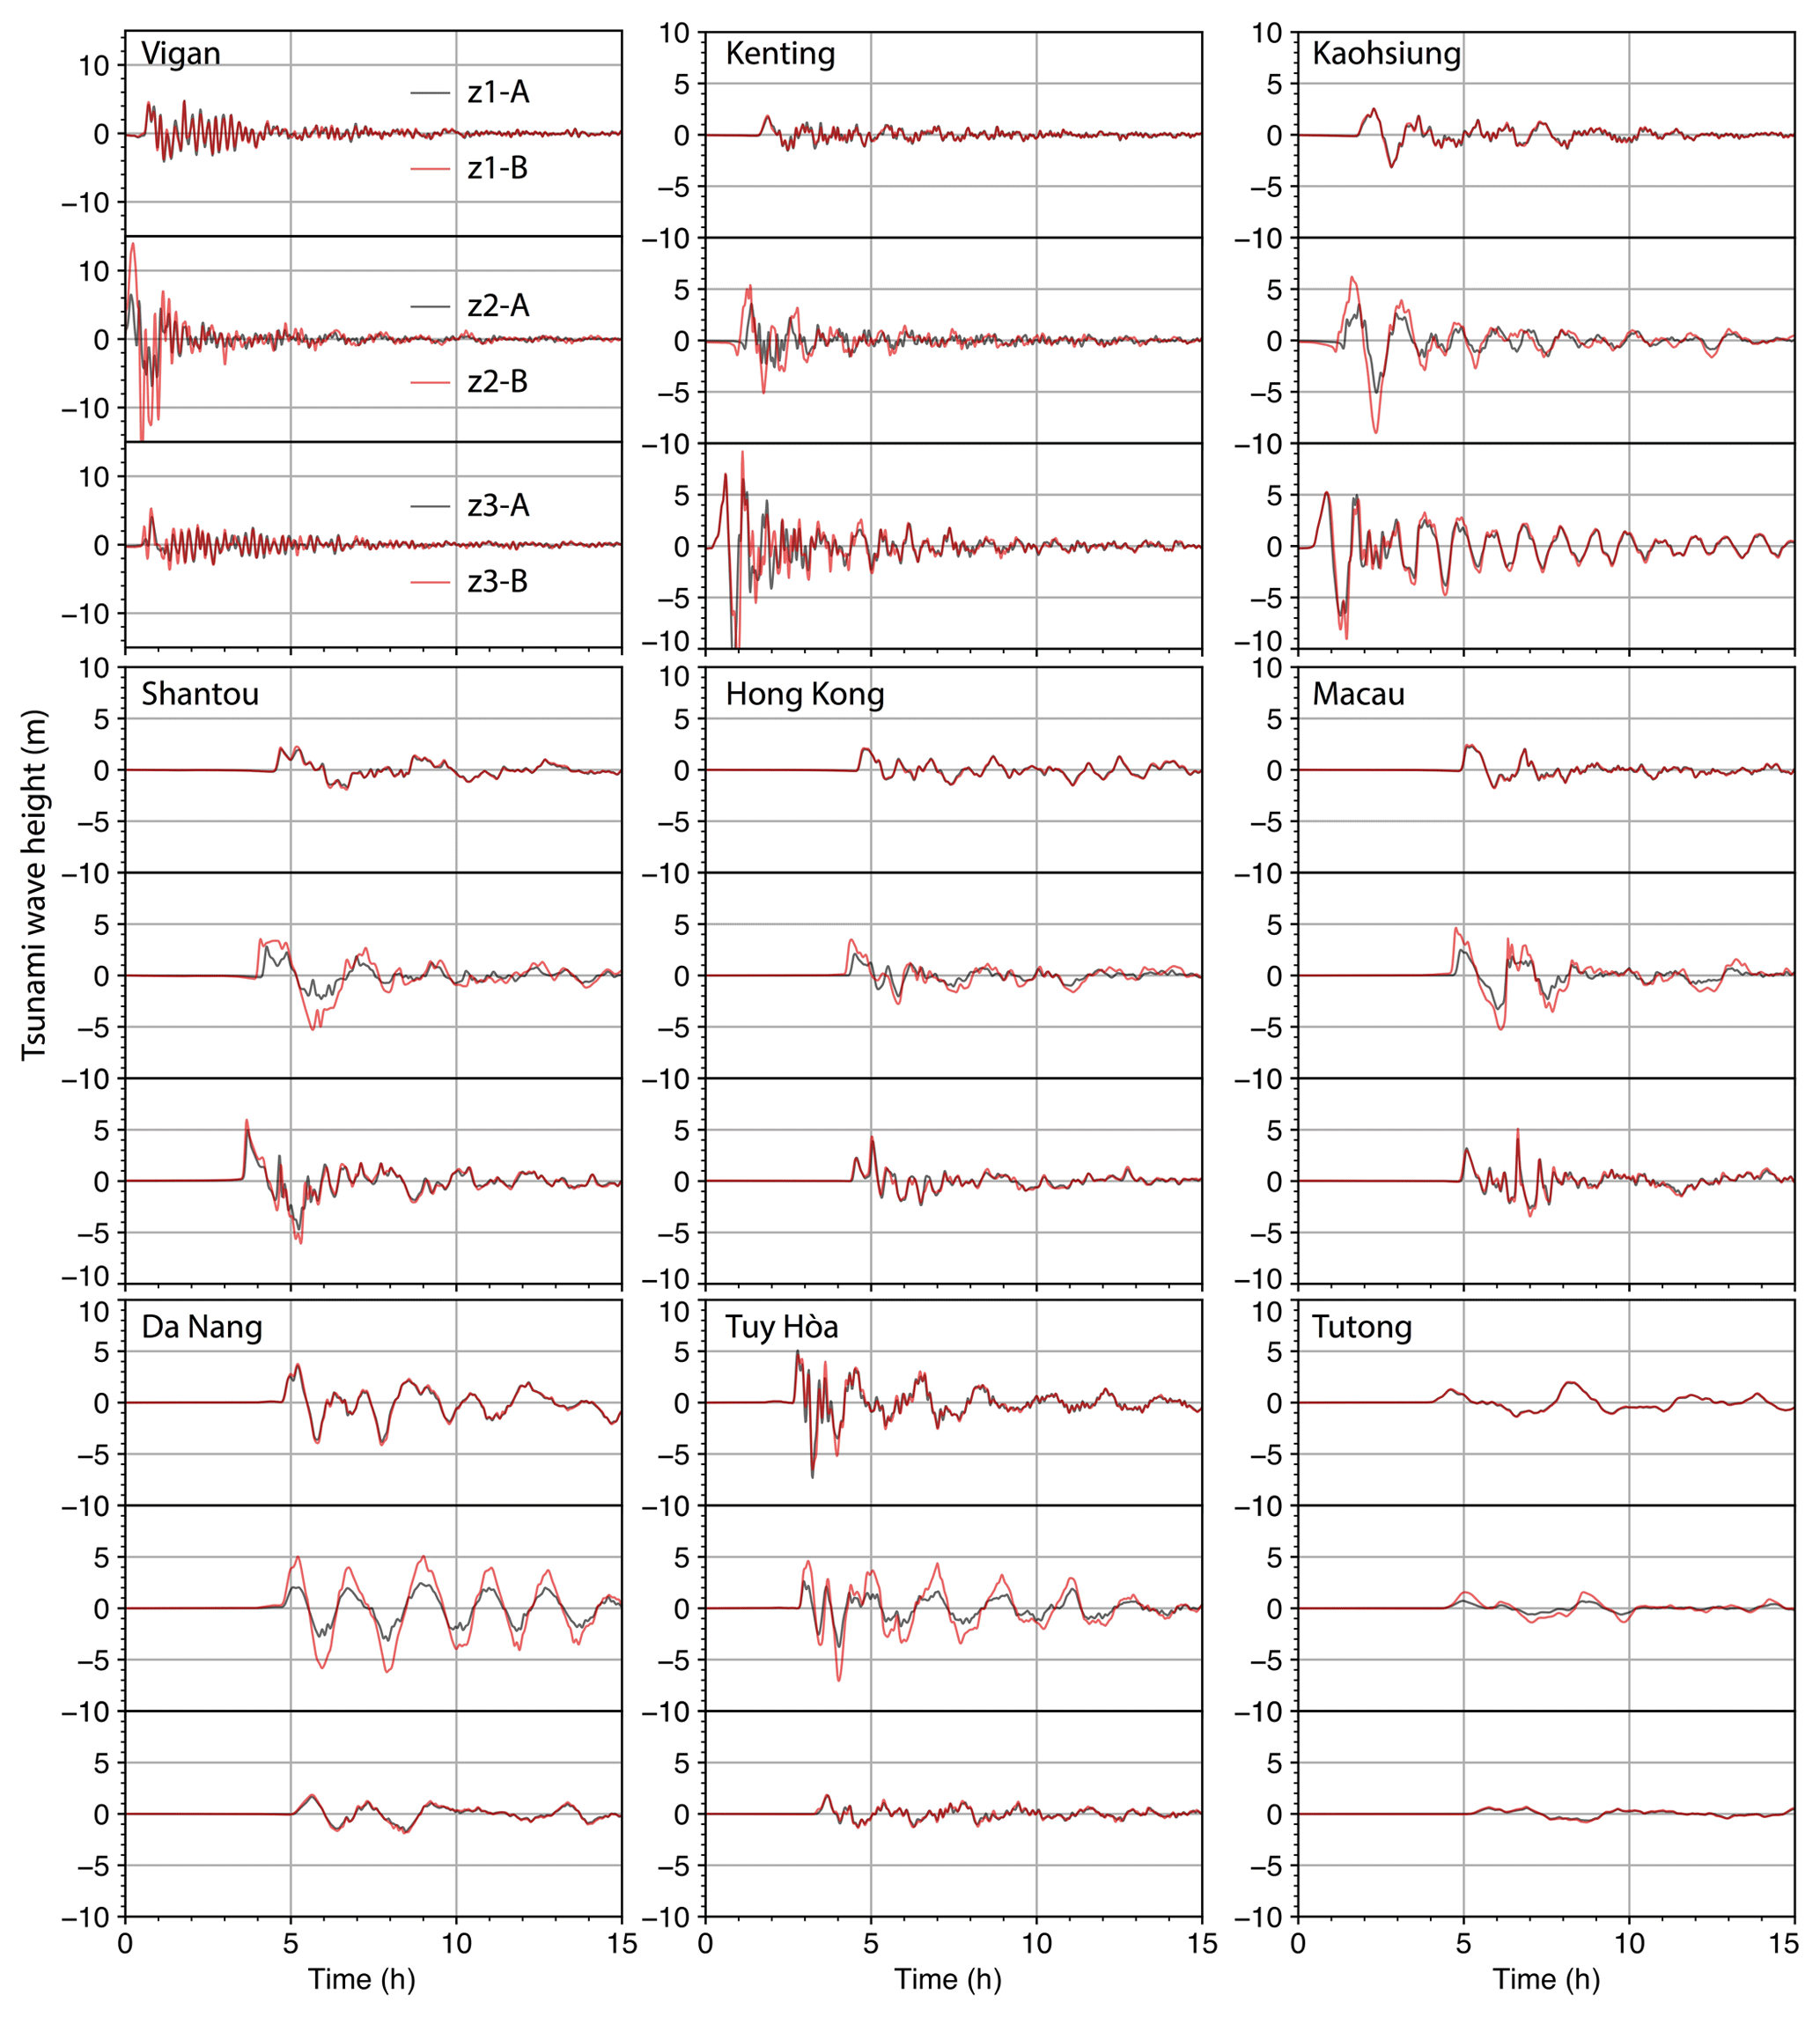
Figure 9Simulated tsunami wave time histories at example coastal cities in the SCS region. Top, middle, and bottom of each subpanel show simulated waves from ruptures in zones 1–3, respectively. A and B represent coupling models A and B from Hsu et al. (2016). For rupture zone 3, we show the Gaussian slip distribution with 50 % coupling ratio cases (Fig. 3c and f) as examples.
How and where earthquake rupture will occur on a plate boundary is challenging to forecast (Bilek and Lay, 2018; Satake and Atwater, 2007). A comprehensive understanding of a single megathrust behavior may be impractical since the seismic cycle is typically on the order of hundreds and thousands of years, much longer than instrumental records. Conversely, understanding megathrust behaviors over different subduction zones at different time stages of their cycle offers insights into rupture style and characteristics. Previous studies have intensively investigated giant subduction zone earthquakes, gaining useful insights into physical parameters that are related to developing giant ruptures. Such physical parameters include the subducting plate age, rate, and buoyance of the slab (Kanamori, 2006; Nishikawa and Ide, 2014; Ruff and Kanamori, 1980, 1983); the forearc structures (Song and Simons, 2003; Wells et al., 2003); upper plate characteristics including plate motion (Schellart and Rawlinson, 2013); trench characteristics of the long-term migration (Schellart and Rawlinson, 2013) and sediment thickness (Heuret et al., 2012); and the width of seismogenic zones (Hayes et al., 2012; Schellart and Rawlinson, 2013). As more data become available, we understand that the convergence rate does not play a significant role in generating giant earthquakes (McCaffrey, 1994; Stein and Okal, 2007; Nishikawa and Ide, 2014). The maximum moment magnitude of a potential earthquake is often determined from seismic catalogue data, alternatively determined from basic moment conservation principles and catalog data (Rong et al., 2014; Kagan and Jackson, 2013). Overall, with current short observation time span compared with multi-century seismic return period, it is improper to make a determination on the relationship between these physical parameters and how big or how often a giant earthquake can occur in any subduction zone (McCaffrey, 2008). Clearly, long-term and complete observations within seismic cycles are required for a better understanding of subduction zone rupture behaviors.
Recently a summary study based on global subduction zone observations concluded that megaseismic events preferentially rupture flat, gently dipping interfaces (Bletery et al., 2016). In the Manila trench, the dip is gentle and progressively increases from north to south (Bautista et al., 2001). In zone 3, the presence of subducting plateau of the continental fragments results in a gently dipping, near-flat interface that potentially favors the development of giant earthquakes (Figs. 1 and 2). The dipping degree is in a similar range as those found in other subduction zones, e.g., Japan–Kuril–Kamchatka, Alaska–Aleutians, Sumatra–Java, South America, and Cascadia, which are known to produce Mw>9.0 earthquakes (Bletery et al., 2016).
Morphological barriers have been found to have a predominant role in controlling rupture propagation and style. The barriers can confine and arrest rupture propagation (Qiu et al., 2016), and act as a persistent fence to stop rupture (Meltzner et al., 2012; Morgan et al., 2017). Fault bends can also hinder rupture overstep at bending points (Wesnousky, 1988, 2006). In the case of the Manila subduction zone, the presence of the Scarborough seamount chain in zone 2 and slab tear in zone 1 indicates that a giant rupture propagation through zones 3 to 1 is less likely, although we do acknowledge that a rupture-across-zone earthquake is possible with very low probability, like the 2007 Mw=8.1 earthquake that ruptured a triple junction (Furlong et al., 2009; Taylor et al., 2008). Dynamic simulations do show possible scenarios that involve multiple portions of the Manila trench rupturing as a single giant earthquake (Yu et al., 2018). However, the details of the slab tear in zone 1 and the seamount chain in zone 2 were smoothed out in the simulation, due to the challenges of the numerical calculation (Yu et al., 2018).
Regarding the potential source of the geological records, the tsunami simulations suggest the difficulty of creating a scenario which could affect all four tsunami deposit locations with sufficiently high tsunami waves, especially for the record located on Yongshu island (Yu et al., 2009). Assuming all four records are indeed tsunami deposits, the spatial distribution demands the whole trench to rupture at once and the southern segment needs to extend further to 13∘ in order to generate tsunami wave propagation in the southwest direction towards Yongshu. Another alternative explanation could be that the deposits on Yongshu island were generated by a large storm event instead of a tsunami event.
In summary, our definition of the rupture zones 1–3 are derived by taking into account the bathymetry features of the subduction Eurasian plate, earthquake focal mechanism distributions, structure-controlled TPGA, and more than 20-year-long GPS measurements. The refined coupling models (Hsu et al., 2016) offer more detailed images that reflect the likely motions on the plate interface. Combination of the coupling models and morphological bounds' constrained zone definitions provides more realistic rupture scenarios than planar fault with assumed uniform slip rupture cases. We have seen that finite rupture models of historical earthquakes indicate that slip is heterogeneous, and this is represented by our scenarios. Further detailed tsunami hazard assessment in the SCS demonstrates that uniform slip models underpredict tsunami hazards compared to a heterogeneous slip model (Li et al., 2016). Therefore, our refined earthquake rupture scenarios in zones 1 and 2 provide new insights into tsunami hazard assessment in the SCS. For zone 3, the scarcity of measurements and the presence of complicated geological structures result in a poor understanding of the seismogenic characteristics, although the tsunami-genic potential remains high (Lin et al., 2009). The possible ruptures provided in this study can be a first-order approximation of the earthquake scenarios in the region. Subsequent measurements collected in coming years can help us to refine our understanding in this region.
We have proposed updated earthquake rupture scenarios along the Manila trench based on new geological earthquake focal mechanism information and geodetic observations. These rupture models enable tsunami assessment in the SCS and subsequent detailed examination of inundation processes for megacities along the coastlines of the SCS.
Tsunami simulations based on these rupture scenarios indicate that the coastlines of the SCS region are under the risk of devastating tsunami waves, specifically for western Luzon of the Philippines, southern Taiwan, southeastern China, central Vietnam, and Palawan Island. In addition to the near-source region, southeastern China will also be attacked severely due to the bathymetry focusing effect no matter which portion of the Manila thrust breaks. Southern Taiwan is affected by ruptures in zones 2 and 3, with west Luzon affected by all earthquake scenarios. Central Vietnam and Palawan Island are mostly affected by ruptures in zones 1 and 2. In all cases, the waves sweep these coastlines within ca. 3 h. Our results highlight that it is necessary to conduct further detailed inundation investigations at these severely affected coastal regions, for future preparation on hazard mitigation plans. Our findings also provide useful information that could be used to find possible archived geological recordings of historical tsunami deposits, and call for subsequent paleo-sedimentology studies in the SCS basin.
The GEBCO data used in this study were downloaded from https://www.gebco.net/data_and_products/gridded_bathymetry_data/ (Weatherall, 2015) in October 2014 and readers can also currently access the data from this link. All data needed to evaluate the conclusions in the paper are present in the paper and/or the Supplement. We provide files of initial surface elevations generated by the proposed fault models in the Supplement. Readers can download these files for tsunami simulation. Additional data related to this paper can be requested from the authors through email.
The supplement related to this article is available online at: https://doi.org/10.5194/nhess-19-1565-2019-supplement.
QQ, LL, YH, and YW developed the method of calculating the fault parameters. QQ performed the tsunami simulations. QQ and LL prepared the paper with contributions from all co-authors.
The authors declare that they have no conflict of interest.
This study is supported by Guangdong Province Introduced Innovative R & D Team of Geological Processes and Natural Disasters around the South China Sea (2016ZT06N331) and National Natural Science Foundation of China (41774049, 41590861). This study is also supported by a joint project “Probabilistic tsunami hazard assessment in South China Sea region” between the National University of Singapore and Shanghai Jiao Tong University. This project is funded by the Singapore National Research Fund and National Natural Science Foundation of China. Adam D. Switzer thanks the support of Scor RE through a donation. This research is also supported by the National Research Foundation Singapore and the Singapore Ministry of Education under the Research Centres of Excellence initiative. We thank Constance T. Chua for the English proofreading of a previous version of the paper.
This research has been supported by the Guangdong Province Introduced Innovative R & D Team of Geological Processes and Natural Disasters around the South China Sea (grant no. 2016ZT06N331), the National Natural Science Foundation of China (grant nos. 41774049 and 41590861), and the Singapore NRF-NSFC (Probabilistic tsunami hazard assessment in South China Sea region).
This paper was edited by Maria Ana Baptista and reviewed by two anonymous referees.
Avouac, J.-P., Meng, L., Wei, S., Wang, T., and Ampuero, J.-P.: Lower edge of locked Main Himalayan Thrust unzipped by the 2015 Gorkha earthquake, Nat. Geosci., 8, 708–711, https://doi.org/10.1038/ngeo2518, 2015.
Banerjee, P., Pollitz, F., Nagarajan, B., and Bürgmann, R.: Coseismic Slip Distributions of the 26 December 2004 Sumatra-Andaman and 28 March 2005 Nias Earthquakes from gps Static Offsets, B. Seismol. Soc. Am., 97, S86–S102, https://doi.org/10.1785/0120050609, 2007.
Bautista, B. C., Bautista, M. L. P., Oike, K., Wu, F. T., and Punongbayan, R. S.: A new insight on the geometry of subducting slabs in Northern Luzon, Philippines, Tectonophysics, 339, 279–310, https://doi.org/10.1016/S0040-1951(01)00120-2, 2001.
Bautista, M. L. P. of Volcanology, P. I. and Seismology: Philippine Tsunamis and Seiches, 1589 to 2012, Department of Science and Technology, Philippine Institute of Volcanology and Seismology, available at: https://books.google.com.sg/books?id=OHibnQAACAAJ (last access: 9 April 2019), 2012.
Bell, R., Holden, C., Power, W., Wang, X., and Downes, G.: Hikurangi margin tsunami earthquake generated by slow seismic rupture over a subducted seamount, Earth Planet. Sc. Lett., 397, 1–9, https://doi.org/10.1016/j.epsl.2014.04.005, 2014.
Bilek, S. L. and Lay, T.: Subduction zone megathrust earthquakes, Geosphere, 14, 1468–1500, https://doi.org/10.1130/GES01608.1, 2018.
Bletery, Q., Thomas, A. M., Rempel, A. W., Karlstrom, L., Sladen, A., and De Barros, L.: Mega-earthquakes rupture flat megathrusts, Science, 354, 1027–1031, https://doi.org/10.1126/science.aag0482, 2016.
Chlieh, M., Avouac, J. P., Hjorleifsdottir, V., Song, T. R. A., Ji, C., Sieh, K., Sladen, A., Hebert, H., Prawirodirdjo, L., Bock, Y., and Galetzka, J.: Coseismic slip and afterslip of the great Mw 9.15 Sumatra-Andaman earthquake of 2004, B. Seismol. Soc. Am., 97, S152–S173, https://doi.org/10.1785/0120050631, 2007.
Chlieh, M., Avouac, J. P., Sieh, K., Natawidjaja, D. H., and Galetzka, J.: Heterogeneous coupling of the Sumatran megathrust constrained by geodetic and paleogeodetic measurements, J. Geophys. Res., 113, 1–31, https://doi.org/10.1029/2007JB004981, 2008.
Cifuentes, I. L.: The 1960 Chilean earthquakes, J. Geophys. Res.-Solid, 94, 665–680, https://doi.org/10.1029/JB094iB01p00665, 1989.
Duan, B.: Dynamic rupture of the 2011 Mw 9.0 Tohoku-Oki earthquake: Roles of a possible subducting seamount, J. Geophys. Res.-Solid, 117, B05311, https://doi.org/10.1029/2011JB009124, 2012.
Fan, J., Zhao, D., and Dong, D.: Subduction of a buoyant plateau at the Manila Trench: Tomographic evidence and geodynamic implications, Geochem. Geophy. Geosy., 17, 571–586, https://doi.org/10.1002/2015GC006201, 2016.
Furlong, K. P., Lay, T., and Ammon, C. J.: A Great Earthquake Rupture Across a Rapidly Evolving Three-Plate Boundary, Science, 324, 226–229, https://doi.org/10.1126/science.1167476, 2009.
Gao, J., Wu, S., yao, Y., Chen, C., Song, T., Wang, J., Sun, J., Zhang, H., Ma, B., and Yangbing, X.: Tectonic deformation and fine structure of the frontal accretionary wedge,northern Manila subduction zone, Chinese J. Geophys. Chinese Ed., 61, 2845–2858, https://doi.org/10.6038/cjg2018L0461, 2018.
Grezio, A., Babeyko, A., Baptista, M. A., Behrens, J., Costa, A., Davies, G., Geist, E. L., Glimsdal, S., González, F. I., Griffin, J., Harbitz, C. B., LeVeque, R. J., Lorito, S., Løvholt, F., Omira, R., Mueller, C., Paris, R., Parsons, T., Polet, J., Power, W., Selva, J., Sørensen, M. B., and Thio, H. K.: Probabilistic Tsunami Hazard Analysis: Multiple Sources and Global Applications, Rev. Geophys., 55, 1158–1198, https://doi.org/10.1002/2017RG000579, 2017.
Hayes, G. P., Wald, D. J., and Johnson, R. L.: Slab1.0: A three-dimensional model of global subduction zone geometries, J. Geophys. Res.-Solid, 117, B01302, https://doi.org/10.1029/2011JB008524, 2012.
Heuret, A., Conrad, C. P., Funiciello, F., Lallemand, S., and Sandri, L.: Relation between subduction megathrust earthquakes, trench sediment thickness and upper plate strain, Geophys. Res. Lett., 39, L05304, https://doi.org/10.1029/2011GL050712, 2012.
Hippchen, S. and Hyndman, R. D.: Thermal and structural models of the Sumatra subduction zone: Implications for the megathrust seismogenic zone, J. Geophys. Res.-Solid, 113, B12103, https://doi.org/10.1029/2008JB005698, 2008.
Hong Nguyen, P., Cong Bui, Q., Ha Vu, P., and The Pham, T.: Scenario-based tsunami hazard assessment for the coast of Vietnam from the Manila Trench source, Phys. Earth Planet. Inter., 236, 95–108, https://doi.org/10.1016/j.pepi.2014.07.003, 2014.
Hsu, Y.-J., Yu, S.-B., Simons, M., Kuo, L.-C., and Chen, H.-Y.: Interseismic crustal deformation in the Taiwan plate boundary zone revealed by GPS observations, seismicity, and earthquake focal mechanisms, Tectonophysics, 479, 4–18, https://doi.org/10.1016/j.tecto.2008.11.016, 2009.
Hsu, Y.-J., Yu, S.-B., Song, T.-R. A., and Bacolcol, T.: Plate coupling along the Manila subduction zone between Taiwan and northern Luzon, J. Asian Earth Sci., 51, 98–108, https://doi.org/10.1016/j.jseaes.2012.01.005, 2012.
Hsu, Y.-J., Yu, S.-B., Loveless, J. P., Bacolcol, T., Solidum, R., Luis Jr., A., Pelicano, A., and Woessner, J.: Interseismic deformation and moment deficit along the Manila subduction zone and the Philippine Fault system, J. Geophys. Res.-Solid, 121, 7639–7665, https://doi.org/10.1002/2016JB013082, 2016.
Hyndman, R. D. and Wang, K.: Thermal constraints on the zone of major thrust earthquake failure: the Cascadia Subduction Zone, J. Geophys. Res., 98, 2039–2060, https://doi.org/10.1029/92JB02279, 1993.
Johnson, J. M. and Satake, K.: Asperity Distribution of the 1952 Great Kamchatka Earthquake and its Relation to Future Earthquake Potential in Kamchatka, in: Seismogenic and Tsunamigenic Processes in Shallow Subduction Zones, edited by: Sauber, J. and Dmowska, R., Birkhäuser, Basel, 541–553, 1999.
Kagan, Y. Y. and Jackson, D. D.: Tohoku Earthquake: A Surprise? Tohoku Earthquake: A Surprise?, B. Seismol. Soc. Am., 103, 1181–1194, https://doi.org/10.1785/0120120110, 2013.
Kanamori, H.: Re-examination of the earth's free oxcillations excited by the Kamchatka earthquake of November 4, 1952, Phys. Earth Planet. Inter., 11, 216–226, 1976.
Kanamori, H.: Lessons from the 2004 Sumatra-Andaman earthquake, Philos. T. Roy. Soc. A, 364, 1927–1945, https://doi.org/10.1098/rsta.2006.1806, 2006.
Koketsu, K., Yokota, Y., Nishimura, N., Yagi, Y., Miyazaki, S., Satake, K., Fujii, Y., Miyake, H., Sakai, S., Yamanaka, Y., and Okada, T.: A unified source model for the 2011 Tohoku earthquake, Earth Planet. Sc. Lett., 310, 480–487, https://doi.org/10.1016/j.epsl.2011.09.009, 2011.
Konca, A. O., Avouac, J.-P., Sladen, A., Meltzner, A. J., Sieh, K., Fang, P., Li, Z., Galetzka, J., Genrich, J., Chlieh, M., Natawidjaja, D. H., Bock, Y., Fielding, E. J., Ji, C., and Helmberger, D. V: Partial rupture of a locked patch of the Sumatra megathrust during the 2007 earthquake sequence, Nature, 456, 631–635, https://doi.org/10.1038/nature07572, 2008.
Koyama, J., Yoshizawa, K., Yomogida, K., and Tsuzuki, M.: Variability of megathrust earthquakes in the world revealed by the 2011 Tohoku-oki Earthquake, Earth Planets Space, 64, 129–146, https://doi.org/10.5047/eps.2012.04.011, 2013.
Kumagai, H., Pulido, N., Fukuyama, E., and Aoi, S.: Strong localized asperity of the 2011 Tohoku-Oki earthquake, Japan, Earth Planets Space, 64, 649–654, https://doi.org/10.5047/eps.2012.01.004, 2012.
Lau, A. Y. A., Switzer, A. D., DomineyHowes, D., Aitchison, J. C., and Zong, Y.: Written records of historical tsunamis in the northeastern South China Sea-challenges associated with developing a new integrated database, Nat. Hazards Earth Syst. Sci., 10, 1793–1806, https://doi.org/10.5194/nhess-10-1793-2010, 2010.
Lay, T.: A review of the rupture characteristics of the 2011 Tohoku-oki Mw 9.1 earthquake, Tectonophysics, 733, 4–36, https://doi.org/10.1016/j.tecto.2017.09.022, 2018.
Li, L., Switzer, A. D., Chan, C. H., Wang, Y., Weiss, R., and Qiu, Q.: How heterogeneous coseismic slip affects regional probabilistic tsunami hazard assessment: A case study in the South China Sea, J. Geophys. Res.-Solid, 121, 6250–6272, https://doi.org/10.1002/2016JB013111, 2016.
Li, L., Switzer, A. D., Wang, Y., Chan, C.-H., Qiu, Q., and Weiss, R.: A modest 0.5-m rise in sea level will double the tsunami hazard in Macau, Sci. Adv., 4, eaat1180, https://doi.org/10.1126/sciadv.aat1180, 2018.
Lin, A. T., Yao, B., Hsu, S.-K., Liu, C.-S., and Huang, C.-Y.: Tectonic features of the incipient arc-continent collision zone of Taiwan: Implications for seismicity, Tectonophysics, 479, 28–42, https://doi.org/10.1016/j.tecto.2008.11.004, 2009.
Liu, P. L. F., Wang, X., and Salisbury, A. J.: Tsunami hazard and early warning system in South China Sea, J. Asian Earth Sci., 36, 2–12, https://doi.org/10.1016/j.jseaes.2008.12.010, 2009.
Loveless, J. P. and Meade, B. J.: Geodetic imaging of plate motions, slip rates, and partitioning of deformation in Japan, J. Geophys. Res., 115, B02410, https://doi.org/10.1029/2008JB006248, 2010.
Loveless, J. P. and Meade, B. J.: Spatial correlation of interseismic coupling and coseismic rupture extent of the 2011 MW = 9.0 Tohoku-oki earthquake, Geophys. Res. Lett., 38, L17306, https://doi.org/10.1029/2011GL048561, 2011.
Ludwig, W. J.: The Manila Trench and West Luzon Trough – III. Seismic-refraction measurements, Deep-Sea Res. Oceanogr. Abstr., 17, 553–571, https://doi.org/10.1016/0011-7471(70)90067-7, 1970.
McCaffrey, R.: Dependence of earthquake size distributions on convergence rates at subduction zones, Geophys. Res. Lett., 21, 2327–2330, https://doi.org/10.1029/94GL02153, 1994.
McCaffrey, R.: Global frequency of magnitude 9 earthquakes, Geology, 36, 2630–266, https://doi.org/10.1130/g24402a.1, 2008.
Megawati, K., Shaw, F., Sieh, K., Huang, Z., Wu, T. R., Lin, Y., Tan, S. K., and Pan, T. C.: Tsunami hazard from the subduction megathrust of the South China Sea: Part I. Source characterization and the resulting tsunami, J. Asian Earth Sci., 36, 13–20, https://doi.org/10.1016/j.jseaes.2008.11.012, 2009.
Meltzner, A. J., Sieh, K., Chiang, H.-W., Shen, C.-C., Suwargadi, B. W., Natawidjaja, D. H., Philibosian, B., and Briggs, R. W.: Persistent termini of 2004- and 2005-like ruptures of the Sunda megathrust, J. Geophys. Res., 117, B04405, https://doi.org/10.1029/2011JB008888, 2012.
Moore, G. F., Bangs, N. L., Taira, A., Kuramoto, S., Pangborn, E. and Tobin, H. J.: Three-Dimensional Splay Fault Geometry and Implications for Tsunami Generation, Science, 80, 1128–1131, https://doi.org/10.1126/science.1147195, 2007.
Moreno, M. S., Bolte, J., Klotz, J., and Melnick, D.: Impact of megathrust geometry on inversion of coseismic slip from geodetic data: Application to the 1960 Chile earthquake, Geophys. Res. Lett., 36, L16310, https://doi.org/10.1029/2009GL039276, 2009.
Morgan, P. M., Feng, L., Meltzner, A. J., Lindsey, E. O., Tsang, L. L. H., and Hill, E. M.: Sibling earthquakes generated within a persistent rupture barrier on the Sunda megathrust under Simeulue Island, Geophys. Res. Lett., 44, 2159–2166, https://doi.org/10.1002/2016GL071901, 2017.
Nishikawa, T. and Ide, S.: Earthquake size distribution in subduction zones linked to slab buoyancy, Nat. Geosci., 7, 904–908, https://doi.org/10.1038/ngeo2279, 2014.
Okal, E. A., Synolakis, C. E., and Kalligeris, N.: Tsunami simulations for regional sources in the South China and adjoining seas, Pure Appl. Geophys., 168, 1153–1173, 2011.
Paris, R., Switzer, A. D., Belousova, M., Belousov, A., Ontowirjo, B., Whelley, P. L., and Ulvrova, M.: Volcanic tsunami: a review of source mechanisms, past events and hazards in Southeast Asia (Indonesia, Philippines, Papua New Guinea), Nat. Hazards, 70, 447–470, https://doi.org/10.1007/s11069-013-0822-8, 2014.
Park, J.-O., Tsuru, T., Kodaira, S., Cummins, P. R., and Kaneda, Y.: Splay Fault Branching Along the Nankai Subduction Zone, Science, 297, 1157–1160, https://doi.org/10.1126/science.1074111, 2002.
Pautot, G. and Rangin, C.: Subduction of the South China Sea axial ridge below Luzon (Philippines), Earth Planet. Sc. Lett., 92, 57–69, https://doi.org/10.1016/0012-821X(89)90020-4, 1989.
Peng, D., Hill, E. M., Li, L., Switzer, A. D., and Larson, K. M.: Application of GNSS interferometric reflectometry for detecting storm surges, GPS Solut., 23, 47, https://doi.org/10.1007/s10291-019-0838-y, 2019.
Philip, L.-F.: Numerical solutions of three-dimensional run-up on a circular island, Int. Symp. waves-physical Numer. Model. Univ. Br. Columbia, Vancouver Canada, 1994, available at: https://ci.nii.ac.jp/naid/10016695852/en/ (last access: 9 April 2019), 1994.
Plafker, G.: Tectonic Deformation Associated with the 1964 Alaska Earthquake, Science 80, 1675–1687, https://doi.org/10.1126/science.148.3678.1675, 1965.
Pollitz, F. F., Brooks, B., Tong, X., Bevis, M. G., Foster, J. H., Bürgmann, R., Smalley Jr., R., Vigny, C., Socquet, A., Ruegg, J.-C., Campos, J., Barrientos, S., Parra, H., Soto, J. C. B., Cimbaro, S., and Blanco, M.: Coseismic slip distribution of the February 27, 2010 Mw 8.8 Maule, Chile earthquake, Geophys. Res. Lett., 38, L09309, https://doi.org/10.1029/2011GL047065, 2011.
Power, W., Wallace, L., Wang, X., and Reyners, M.: Tsunami Hazard Posed to New Zealand by the Kermadec and Southern New Hebrides Subduction Margins: An Assessment Based on Plate Boundary Kinematics, Interseismic Coupling, and Historical Seismicity, Pure Appl. Geophys., 169, 1–36, https://doi.org/10.1007/s00024-011-0299-x, 2012.
Qiu, Q., Hill, E. M., Barbot, S., Hubbard, J., Feng, W., Lindsey, E. O., Feng, L., Dai, K., Samsonov, S. V., and Tapponnier, P.: The mechanism of partial rupture of a locked megathrust: The role of fault morphology, Geology, 44, 875–878, https://doi.org/10.1130/G38178.1, 2016.
Ramos, N. T., Maxwell, K. V., Tsutsumi, H., Chou, Y. C., Duan, F., Shen, C. C., and Satake, K.: Occurrence of 1 ka-old corals on an uplifted reef terrace in west Luzon, Philippines: Implications for a prehistoric extreme wave event in the South China Sea region, Geosci. Lett., 4, 12, https://doi.org/10.1186/s40562-017-0078-3, 2017.
Rong, Y., Jackson, D. D., Magistrale, H., and Goldfinger, C.: Magnitude Limits of Subduction Zone EarthquakesMagnitude Limits of Subduction Zone Earthquakes, B. Seismol. Soc. America, 104, 2359–2377, https://doi.org/10.1785/0120130287, 2014.
Ruff, L. and Kanamori, H.: Seismicity and the subduction process, Phys. Earth Planet. Inter., 23, 240–252, https://doi.org/10.1016/0031-9201(80)90117-X, 1980.
Ruff, L. and Kanamori, H.: Seismic coupling and uncoupling at subduction zones, Tectonophysics, 99, 99–117, https://doi.org/10.1016/0040-1951(83)90097-5, 1983.
Ruiz, S., Metois, M., Fuenzalida, A., Ruiz, J., Leyton, F., Grandin, R., Vigny, C., Madariaga, R., and Campos, J.: Intense foreshocks and a slow slip event preceded the 2014 Iquique Mw 8.1 earthquake, Science, 345, 1165–1169, https://doi.org/10.1126/science.1256074, 2014.
Salman, R., Hill, E. M., Feng, L., Lindsey, E. O., Mele veedu, D., Barbot, S., Banerjee, P., Hermawan, I., and Natawidjaja, D. H.: Piecemeal Rupture of the Mentawai Patch, Sumatra: The 2008 Mw7.2 North Pagai Earthquake Sequence, J. Geophys. Res.-Solid, 122, 9404–9419, https://doi.org/10.1002/2017JB014341, 2017.
Satake, K. and Atwater, B. F.: Long-Term Perspectives on Giant Earthquakes and Tsunamis at Subduction Zones, Annu. Rev. Earth Planet. Sci., 35, 349–374, https://doi.org/10.1146/annurev.earth.35.031306.140302, 2007.
Schellart, W. P. and Rawlinson, N.: Global correlations between maximum magnitudes of subduction zone interface thrust earthquakes and physical parameters of subduction zones, Phys. Earth Planet. Inter., 512, 299–302, https://doi.org/10.1016/j.pepi.2013.10.001, 2013.
Schurr, B., Asch, G., Hainzl, S., Bedford, J., Hoechner, A., Palo, M., Wang, R., Moreno, M., Bartsch, M., Zhang, Y., Oncken, O., Tilmann, F., Dahm, T., Victor, P., Barrientos, S., and Vilotte, J.-P.: Gradual unlocking of plate boundary controlled initiation of the 2014 Iquique earthquake, Nature, 512, 299–302, https://doi.org/10.1038/nature13681, 2014.
Sella, G. F., Dixon, T. H., and Mao, A.: REVEL: A model for Recent plate velocities from space geodesy, J. Geophys. Res.-Solid, 107, ETG 11-1–ETG 11-30, https://doi.org/10.1029/2000JB000033, 2002.
Singh, S. C., Hananto, N., Mukti, M., Robinson, D. P., Das, S., Chauhan, A., Carton, H., Gratacos, B., Midnet, S., Djajadihardja, Y., and Harjono, H.: Aseismic zone and earthquake segmentation associated with a deep subducted seamount in Sumatra, Nat. Geosci., 4, 308–311, 2011.
Song, T. R. A. and Simons, M.: Large trench-parallel gravity variations predict seismogenic behavior in subduction zones, Science, 301, 630–633, https://doi.org/10.1126/science.1085557, 2003.
Stein, S., and Okal, E. A.: Ultralong Period Seismic Study of the December 2004 Indian Ocean Earthquake and Implications for Regional Tectonics and the Subduction Process, B. Seismol. Soc. Am., 97, S279–S295, https://doi.org/10.1785/0120050617, 2007.
Stevens, V. L. and Avouac, J.: Interseismic Coupling on the Main Himalayan Thrust, Geophys. Res. Lett., 42, 5828–5837, https://doi.org/10.1002/2015GL064845, 2015.
Sun, L., Zhou, X., Huang, W., Liu, X., Yan, H., Xie, Z., Wu, Z., Zhao, S., Shao, D., and Yang, W.: Preliminary evidence for a 1000-year-old tsunami in the South China Sea, Sci. Rep., 3, 1655, https://doi.org/10.1038/srep01655, 2013.
Suppe, J.: Tectonics of arc-continent collision on both sides of the South China Sea: Taiwan and Mindoro, Acta Geol. Taiwanica, 26, 1–18, 1988.
Taylor, F. W., Briggs, R. W., Frohlich, C., Brown, A., Hornbach, M., Papabatu, A. K., Meltzner, A. J., and Billy, D.: Rupture across arc segment and plate boundaries in the 1 April 2007 Solomons earthquake, Nat. Geosci., 1, 253, https://doi.org/10.1038/ngeo159, 2008.
Taylor, B. and Hayes, D. E.: The Tectonic Evolution of the South China Basin, in The Tectonic and Geologic Evolution of Southeast Asian Seas and Islands, American Geophysical Union (AGU), 89–104, 2013.
Terry, J. P., Winspear, N., Goff, J., and Tan, P. H. H.: Past and potential tsunami sources in the South China Sea: A brief synthesis, Earth-Sci. Rev., 167, 47–61, https://doi.org/10.1016/j.earscirev.2017.02.007, 2017.
Vigny, C., Simons, W. J. F., Abu, S., Bamphenyu, R., Satirapod, C., Choosakul, N., Subarya, C., Socquet, a, Omar, K., Abidin, H. Z., and Ambrosius, B. A. C.: Insight into the 2004 Sumatra-Andaman earthquake from GPS measurements in southeast Asia, Nature, 436, 201–206, https://doi.org/10.1038/nature03937, 2005.
Vigny, C., Socquet, A., Peyrat, S., Ruegg, J.-C., Métois, M., Madariaga, R., Morvan, S., Lancieri, M., Lacassin, R., Campos, J., Carrizo, D., Bejar-Pizarro, M., Barrientos, S., Armijo, R., Aranda, C., Valderas-Bermejo, M.-C., Ortega, I., Bondoux, F., Baize, S., Lyon-Caen, H., Pavez, A., Vilotte, J. P., Bevis, M., Brooks, B., Smalley, R., Parra, H., Baez, J.-C., Blanco, M., Cimbaro, S., and Kendrick, E.: The 2010 Mw 8.8 Maule Megathrust Earthquake of Central Chile, Monitored by GPS, Science, 332, 1417–1421, https://doi.org/10.1126/science.1204132, 2011.
Wang, K.: Elastic and viscoelastic models of crustal deformation in subduction earthquake cycles, in: Seism. Zo. subduction thrust faults, Columbia Univ. Press, New York, 540–575, 2007.
Wang, K. and Bilek, S. L.: Do subducting seamounts generate or stop large earthquakes?, Geology, 39, 819–822, https://doi.org/10.1130/G31856.1, 2011.
Wang, X., Liu, P. L.-F., and Orfila, A.: Numerical simulations of tsunami runup onto a three-dimensional beach with shallow water equations, in: Advanced Numerical Models for Simulating Tsunami Waves and Runup, World Scientific, 2008, 249–253, 2008.
Wei, S., Graves, R., Helmberger, D., Avouac, J.-P., and Jiang, J.: Sources of shaking and flooding during the Tohoku-Oki earthquake: A mixture of rupture styles, Earth Planet. Sc. Lett., 333–334, 91–100, https://doi.org/10.1016/j.epsl.2012.04.006, 2012.
Wells, R. E., Blakely, R. J., Sugiyama, Y., Scholl, D. W., and Dinterman, P. A.: Basin-centered asperities in great subduction zone earthquakes: A link between slip, subsidence, and subduction erosion?, J. Geophys. Res.-Solid, 108, B102507, https://doi.org/10.1029/2002JB002072, 2003.
Wesnousky, S. G.: Seismological and structural evolution of strike-slip faults, Nature, 335, 340–343, https://doi.org/10.1038/335340a0, 1988.
Wesnousky, S. G.: Predicting the endpoints of earthquake ruptures, Nature, 444, 358–360, https://doi.org/10.1038/nature05275, 2006.
Witter, R. C., Carver, G. A., Briggs, R. W., Gelfenbaum, G., Koehler, R. D., La Selle, S., Bender, A. M., Engelhart, S. E., Hemphill-Haley, E., and Hill, T. D.: Unusually large tsunamis frequent a currently creeping part of the Aleutian megathrust, Geophys. Res. Lett., 43, 76–84, https://doi.org/10.1002/2015GL066083, 2016.
Wu, J., Suppe, J., Lu, R., and Kanda, R.: Philippine Sea and East Asian plate tectonics since 52 Ma constrained by new subducted slab reconstruction methods, J. Geophys. Res.-Solid, 121, 4670–4741, https://doi.org/10.1002/2016JB012923, 2016.
Wu, T.-R. and Huang, H.-C.: Modeling tsunami hazards from Manila trench to Taiwan, J. Asian Earth Sci., 36, 21–28, https://doi.org/10.1016/j.jseaes.2008.12.006, 2009.
Xie, X., Chen, C., Li, L., Wu, S., Yuen, D. A., and Wang, D.: Tsunami hazard assessment for atoll islands inside the South China Sea: A case study of the Xisha Archipelago, Phys. Earth Planet. Inter., 290, 20–35, https://doi.org/10.1016/j.pepi.2019.03.003, 2019.
Yang, W., Sun, L., Yang, Z., Gao, S., Gao, Y., Shao, D., Mei, Y., Zang, J., Wang, Y., and Xie, Z.: Nan'ao, an archaeological site of Song dynasty destroyed by tsunami, Chinese Sci. Bull., 64, 107–120, 2018.
Yokota, Y., Ishikawa, T., Watanabe, S., Tashiro, T., and Asada, A.: Seafloor geodetic constraints on interplate coupling of the Nankai Trough megathrust zone, Nature, 534, 374–377, https://doi.org/10.1038/nature17632, 2016.
Yu, H., Liu, Y., Yang, H., and Ning, J.: Modeling earthquake sequences along the Manila subduction zone: Effects of three-dimensional fault geometry, Tectonophysics, 733, 73–84, https://doi.org/10.1016/j.tecto.2018.01.025, 2018.
Yu, K.-F., Zhao, J.-X., Shi, Q., and Meng, Q.-S.: Reconstruction of storm/tsunami records over the last 4000 years using transported coral blocks and lagoon sediments in the southern South China Sea, Quatern. Int., 195, 128–137, https://doi.org/10.1016/j.quaint.2008.05.004, 2009.
Zhu, J., Sun, Z., Kopp, H., Qiu, X., Xu, H., Li, S., and Zhan, W.: Segmentation of the Manila subduction system from migrated multichannel seismics and wedge taper analysis, Mar. Geophys. Res., 34, 379–391, https://doi.org/10.1007/s11001-013-9175-7, 2013.