the Creative Commons Attribution 4.0 License.
the Creative Commons Attribution 4.0 License.
Global detection of rainfall-triggered landslide clusters
Philipp Blum
An increasing awareness of the cost of landslides on the global economy and of the associated loss of human life has led to the development of various global landslide databases. However, these databases typically report landslide events instead of individual landslides, i.e., a group of landslides with a common trigger and reported by media, citizens and/or government officials as a single unit. The latter results in significant cataloging and reporting biases. To counteract these biases, this study aims to identify clusters of landslide events that were triggered by the same rainfall event. An algorithm is developed that finds a series of landslide events that (a) is continuous with no more than 2 d between individual events and where (b) precipitation at the location of an individual event correlates with precipitation of at least one other event. The developed algorithm is applied to the Global Landslide Catalog (GLC) maintained by NASA. The results show that more than 40 % of all landslide events are connected to at least one other event and that 14 % of all studied landslide events are actually part of a landslide cluster consisting of at least 10 events and up to 108 events in 1 d. Duration of the detected clusters also varies greatly from 1 to 24 d. Our study intends to enhance our understanding of landslide clustering and thus will assist in the development of improved, internationally streamlined mitigation strategies for rainfall-related landslide clusters.
- Article
(4966 KB) - Full-text XML
-
Supplement
(2730 KB) - BibTeX
- EndNote
The fatal and catastrophic nature of landslides has led to the development and maintenance of various global databases, such as the NASA Global Landslide Catalog (GLC; e.g. Kirschbaum et al., 2015) and recently the Global Fatal Landslide Database (GFLD) by Froude and Petley (2018). Typically, these databases have a distinct focus. For example, the GLC operated by NASA focuses on rainfall-triggered landslides (Kirschbaum et al., 2010, 2015), whereas the Global Fatal Landslide Database records fatal landslides (Froude and Petley, 2018; Petley, 2012). Through these databases we are able to provide first estimates on the number of recorded fatalities, which were more than 55 000 between 2004 and 2016 (Froude and Petley, 2018) and map near real-time risk for landslides almost on a global scale (Kirschbaum and Stanley, 2018). Still, while they play a key role in understanding the effects of landslides on our society, it is important to note that they are primarily based on news and government reports. These databases therefore do not count landslides but instead count landslide events, which contain either a single or a multitude of landslides within an area that are assumed to be triggered by the same event (Malamud et al., 2004). The exact number of slope failures in each event is often unknown and depends on the quality of the reporting. For some databases this number is included in a parameter of intensity or size of each event. Typically, for large databases, however, this is merely qualitative and describes not only the number of individual landslides but also impacts such as economic or human losses. This classification is commonly based on press releases and is therefore heavily biased depending on the news outlet reporting each event (e.g. Carrara et al., 2003).
Landslides triggered by catastrophic events, such as earthquakes or major storms, are often counted as one event containing thousands of individual landslides (Kirschbaum et al., 2015). In contrast, landslides caused by non-catastrophic events such as reasonable rainfall are commonly counted as individual events, disregarding their shared trigger. Consequently, the overall extent of clustering in landslides is often unknown. Once we better understand the extent of clustering between individual landslide events, we will be able to understand the patterns they occur in and have the chance to utilize these patterns to improve our forecast models (e.g. Martelloni et al., 2012).
Until now, few studies have focused on rainfall-triggered landslide clusters and primarily on temporal clusters over a long time period within a confined region (e.g. Samia et al., 2017; Witt et al., 2010). Biasutti et al. (2016) investigated the spatiotemporal clustering due to rainfall events for three selected urban areas of the US west coast: Seattle, San Francisco and Los Angeles. Over the 9-year study period, they found approximately 20 d within each city with multiple (up to eight) landslide events. Additionally, they could identify close to 40 landslide events that were followed by another event within the next week. However, with a focus on only selected study areas, they did not show the overall extent of these clusters.
The objective of this study is therefore to develop an algorithm, which is able to identify such clusters on a global scale. By applying the algorithm to the GLC, the overall degree of clustering in the database is shown and spatial patterns of clusters with at least 10 landslide events are described. Additionally, landslide events and rainfall patterns of the most intense and longest clusters are comprehensively discussed. In contrast to previous studies, such as by Biasutti et al. (2016), clusters here are not constricted by a maximum spatial extent, instead they are grouped by analyzing and comparing rainfall prior to the event at the event locations.
2.1 Landslide data
All landslide events within this study are part of the GLC operated by NASA and introduced in Kirschbaum et al. (2010, 2015). Data within the catalog is based on online news articles that are found through search engine options such as Google Alerts. In the presented study, only events with a location accuracy ≤25 km are considered. As the rainfall data used is only available within Latitude, landslide events outside of this range are not considered. Overall, a total of 9279 landslide events, ranging from 1988 to 2018, are analyzed (Fig. 1). However, only 45 of these events occurred before 2007, when the GLC was established.
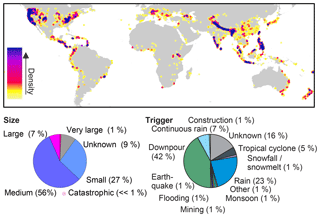
Figure 1Heat map of all landslide events analyzed in this study and their size and apparent trigger. Overall, a total of 9279 events were tested for clustering.
For each event, the GLC provides a landslide type, e.g. landslide or mudslide, and a landslide trigger, e.g. rainfall, downpour, earthquakes, or construction work. Detailed descriptions of these classifications can be found in Kirschbaum et al. (2010, 2015). Furthermore, within the GLC the intensity, impact, and number of landslides per event is expressed in a variable called “size”. While events classified as small in the database are only a single landslide, medium or larger landslide events may consist of multiple landslides within an unspecified range. About 64 % of the studied events are classified as medium or larger in size. However, a precise count of the number of landslides contained within these events does not exist in this database nor in any other of the global-scale databases currently available. Within the GLC, most of the small events that contain only a single landslide are located within the United States (Fig. 1).
2.2 Rainfall data
For the rainfall analysis, the Climate Hazards Group InfraRed Precipitation with Station data (CHIRPS) (Climate Hazards Group, 2015) are used, which have a resolution of and daily time steps. For each landslide event location, precipitation data were downloaded for 10 years preceding the event and up to 2 d after the event using Google Earth Engine (Gorelick et al., 2017).
2.3 Detection of landslide clusters
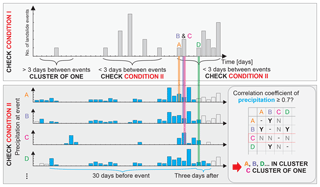
The main objective of this study is to identify clusters of landslide events that occurred during, and are likely triggered by, the same rainfall event. To determine if two events, A and B, occurred during the same rainfall event, two conditions have to be fulfilled: (i) A and B occurred within 3 d of each other and (ii) the Spearman correlation between daily precipitation at A and at B is greater 0.7 and has a p value less than 0.05 for the 30 d preceding the later of the two events. Other landslide events that fulfill these conditions with either A or B are considered to be part of the cluster. A schematic drawing of this algorithm is provided in Fig. 2, and a more detailed flowchart is given in Fig. S1 in the Supplement. The threshold value of 3 d maximum between two events was used following Biasutti et al. (2016), who found it unlikely that landslide events occurring more than 3 d apart occurred during the same rainfall event. However, it is important to note that their study was set in three metropolitan areas on the west coast of the US and might not be applicable everywhere.
The threshold value of the Spearman correlation coefficient was determined by testing the robustness of the identified clusters for different threshold values between zero and one (Fig. S2). Our results indicate that mean duration, area, and number of landslides per cluster are comparably robust to changes of the Spearman correlation coefficient. In contrast maximum duration, area, and number of landslides per cluster change drastically for different threshold values. From a correlation coefficient threshold of 0.35 to 0.7, maximum number of landslide events per cluster decreases from close to 500 to slightly above 100, maximum duration decreases from more than 80 d to approximately 25, and area decreases from 60 000 000 km2 (approximately one-third of the planet's surface area) to 200 000 km2. For threshold values greater 0.7, only minor changes are observed. Hence, the latter was set as the correlation threshold value for this study (Fig. S2).
Additionally, we tested the robustness of the method to the time period of precipitation for which the correlation coefficient was determined (Fig. S3). It appears that the number of days is much less influential than the set correlation coefficient threshold (Fig. S2). Again, maximum number of landslides, area, and duration are impacted most but remain stable for time periods longer than 30 d prior to the second event.
It is important to note that the introduced method does not limit the spatial extent of the found landslide clusters. While this ensures that previously undetected, large-scale connections between individual landslide events are found, it is also susceptible to linking landslides occurring in different parts of the world, where rainfall coincidentally correlates. Hence, when applying the method to another dataset, the robustness of the threshold values for correlation coefficient and time analyzed needs to be rechecked.
The introduced algorithm is independent of subsoil topography and relief parameters. While these impact the precipitation intensity–duration threshold that is commonly expected to trigger landslides, locations with different thresholds might still experience landslides triggered by the same rainfall event.
2.4 Rainfall analysis
In order to compare rainfall during a landslide event to overall rainfall at the location, the 95th percentile of precipitation excluding non-rainy days was determined for 10 years prior to the event. This comparison was also previously used by Kirschbaum et al. (2015) to identify rainfall-triggered landslide events. However, in their case, rainfall data from the Tropical Rainfall Measuring Mission (TRMM) was used for the time period 2000–2013, independent of the date of the landslide event. Due to its higher spatial resolution, CHIRPS data were used here instead.
In addition to the 95th percentile of rainfall, the global rainfall threshold by Guzzetti et al. (2008) was also utilized to determine the likelihood of the individual landslide events being triggered by rainfall. In their study 2626 rainfall events that have resulted in shallow landslides and debris flows were analyzed in order to determine the following global rainfall intensity–duration threshold (http://rainfallthresholds.irpi.cnr.it, last access: 26 June 2019):
Here the threshold intensity (I) was determined for each 24 h starting with a duration (D) of 12 h. This results in an average precipitation of 0.73 mm h−1 for D=12 h, 0.45 mm h−1 for D=36 h, and 0.35 mm h−1 for D=60 h. The rainfall threshold was then compared to the cumulative mean precipitation of the rainfall event preceding each landslide event.
3.1 Clustering characteristics
The presented algorithm divided the 9279 landslide events of the GLC into 6474 clusters of events connected through precipitation. However, 85 % of these clusters consist of only a single landslide event, containing in total 59 % of all recorded landslide events. This implies that a large number of landslide events are in fact isolated events with no association to other events. Nevertheless, 67 % of these “single landslide event” – clusters are categorized as medium or larger and might contain more that one landslide (in comparison 58 % of the landslide events in clusters ≥ one landslide event are categorized as medium or larger). Hence, the number of isolated landslides is likely to be significantly smaller than the number of isolated landslide events.
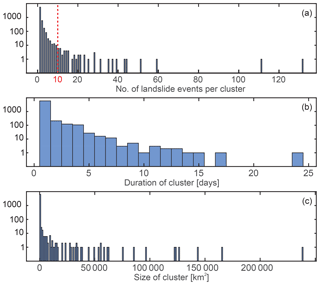
Figure 3Histogram of the number of events per cluster, duration of clusters, and area of the convex hull of each cluster. Clusters with only a single landslide event were appointed an area of zero. Within this study, all clusters with at least 10 landslide events were analyzed more closely.
In the GLC only 3 % of the analyzed landslide events are linked to triggers unrelated to rainfall such as construction, volcanos, or earthquakes. This number is reduced to 1.5 % for landslides in a cluster of more than one event. Due to the low number of events in this category, future research is necessary to test and thoroughly validate these findings as well as to assess possible reasons and implications of this phenomenon. For now, we assume that this is mainly caused by biased reporting and cataloging of landslide events, where events linked to larger disasters such as earthquakes might be reported as one large landslide event, whereas landslides linked to rainfall might be individually reported. Similar observations were previously made by Kirschbaum et al. (2015) for events in the GLC that are linked to major storms. An example of this is the catastrophic magnitude 7.8 Gorkha earthquake in Nepal in 2015. While more than 25 000 landslides occurred during the earthquake and its aftershock sequence (e.g. Roback et al., 2018), they are only reported as 13 landslide events in the excerpt from the GLC analyzed here. In it, they are described as ranging in size from small to large and their trigger is given as “unknown”, “earthquake” and in one case “snowmelt”. Our algorithm sorts these events into eight clusters of up to three events.
Figure 3 provides histograms of the landslide events per cluster, duration of clusters, and area covered by clusters (convex hull). As expected, for all three aspects frequency reduces drastically for larger numbers. In the following section all 50 clusters with at least 10 events (marked in red in Fig. 3) are evaluated more closely.
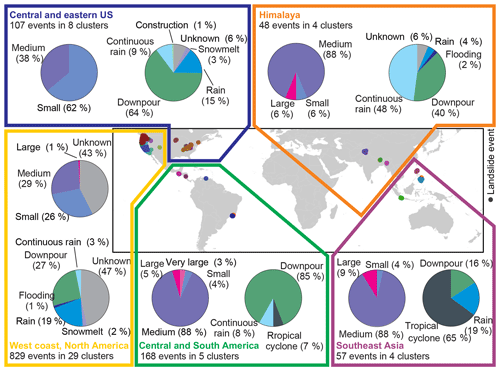
Figure 4Location of all landslide events within clusters ≥10 events (different colors indicate different clusters). Overall, clusters in five distinct regions could be identified in the GLC (see Table S1 in the Supplement for more detail). Size and trigger (GLC categorization) of the associated landslide events are also shown (also see Tables S2 and S3).
3.2 Clusters with more than 10 landslide events
3.2.1 Global analysis
Table S1 in the Supplement gives more detail on the 50 clusters with at least 10 events. In total, 13 % of all landslide events are associated with one of these clusters (Table 1). As the database is most likely incomplete, the true number is expected to be higher. Overall the algorithm detects clusters in five distinct regions: (1) the west coast of North America, (2) central and eastern US, (3) Central and South America, (4) the Himalayan region and (5) Southeast Asia (Fig. 4). However, close to three quarters of all clusters ≥10 events are found within the US mostly due to a bias in the GLC database (Kirschbaum et al., 2015) (Fig. 1). This is also shown in the size of recorded landslide events (Fig. 4 and Table S2).
In North America events are often classified as small in size, while clusters in the other regions contain mainly medium events. This might be due to English-speaking media, on which the GLC is based, only picking up on large international events that consist of multiple landslides within an area and smaller ones are under or not reported at all.
The median clusters with at least 10 events last 6 d, consist of 15 events, and span over an area of 15 000 km2 (Fig. 5). As expected, there is a positive correlation between cluster duration and area (Spearman correlation coefficient of 0.70, p value: 0.001). However, this cannot be observed for cluster duration and number of landslide events within the cluster (Spearman correlation coefficient of 0.44 and p value of 0.001). When comparing the different regions, clusters located on the west coast of North America are on average the longest and cover the largest area. In contrast, clusters in South America are shortest and smallest; nevertheless, they have the highest number of events per day (Table 1).
On a global scale, no significant trend over time can be observed and clusters with ≥10 events occur around the year (Fig. S4). Similarly, the total number of reported landslide shows no significant increase in the GLC (Kirschbaum et al., 2015), as well as in other global databases such as the Global Fatal Landslide Database (Froude and Petley, 2018). More regional observations show seasonal variation and are described more closely in the following chapters. However, for three out of the five regions, there are only five clusters or even fewer.
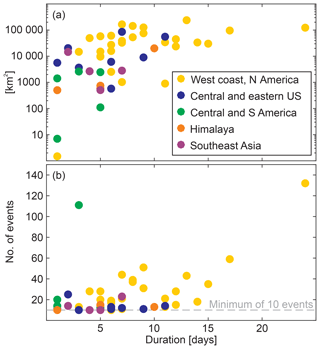
Figure 5Link between the duration of the individual clusters ≥10 events and (a) the covered area and (b) the number of landslide events per cluster. The color of the scatter plots indicates the region in which each cluster occurred.
3.2.2 West coast of N orth America
Landslides in the west of North America have been intensively investigated, mainly in the form of case studies that discuss landslides along the Pacific coast in the states of California (Collins and Sitar, 2008; Wieczorek, 1988), Oregon (Benda, 1990; Miller and Burnett, 2008) and Washington (LaHusen et al., 2016; Perkins et al., 2017). This region is also one of the few where the clustering of rainfall-triggered landslide events was previously investigated, showing qualitatively that there are many instances in which landslides occur on consecutive days (Biasutti et al., 2016).
About 31 % of all landslide events recorded in this area belong to a cluster of at least 10 events. This is the highest number compared to the other regions of the world (Table 1). However, this effect might be amplified by the high number of reported landslides. The large number of events and clusters is mainly due to geologic, topographic, climatic conditions, and construction practices. For example, in Oregon, steep slopes and heavy rainfall, as well as poor construction practices, result in high economic losses (Wang et al., 2002). Burns et al. (2017) estimated an average annual loss of USD 15.4 million due to landslides in Oregon alone. In years with heavy storms, such as 1996, this can accumulate to more than USD 100 million (Wang et al., 2002).
The observed clusters in this area are among the longest and have the largest areas of all regions (Table 1). While the size of landslide events (as given by the GLC) in the west of North America are small compared to most other regions, there is also a considerable amount of events, where the size is unknown (43 %, Fig. 4, Table S2). While about half of the landslide events within clusters ≥10 events are classified as “trigger unknown” (47 %), landslide events with a known cause are mainly triggered by downpour (27 %) or rain (19 %) (Fig. 4, Table S3). However, when looking at satellite-based rainfall data preceding the clusters, rainfall cannot always be identified as a trigger (Fig. S5). While it generally exceeds the global rainfall threshold (Guzzetti et al., 2008), the 95th percentile of precipitation on rainy days is not reached for the majority of the clusters. Although several studies linked landslides within California to earthquakes (e.g. Harp and Jibson, 1996; Keefer, 2000), they occurred before 2007 and are not registered in the GLC.
While there appears to be no significant change in the number of clusters over time (Fig. S4), most clusters occur during the rainy season (November to March), when most landslide events occur. Within the west of North America this time period is therefore often referred to as the “landslide season” (e.g. Mirus et al., 2018). Only one cluster in this region appears in June (Cluster ID 21, Table S1). However, the center of this cluster is located more inland (in San Miguel County, Colorado) and is also the shortest cluster (only 1 d) within the region as well as the most local of all clusters in this study, covering only 1 km2. While this cluster is triggered by downpour according to the GLC, this is not apparent from satellite-derived precipitation (Fig. S5). The small size of the cluster might be the reason, why low-resolution satellite-derived precipitation does not record any anomalies here.
3.3 Central and eastern US
While most of the clusters with ≥10 landslides events of this region are located in the Appalachian Plateau (Ohio, West Virginia, and Kentucky), one cluster can be found in Minnesota (ID 34 in Table S1 and Fig. S6). While it is considerably smaller (580 km2 compared to more than 9000 km2), it is comparable to the Appalachians cluster in its number of landslide events and duration. The Appalachian Plateau is well known for its landslides and the annual direct cost in Kentucky exceeds USD 10 million (Crawford and Bryson, 2017).
Like the landslide clusters observed in the west of North America, clusters here consist mainly of small landslides, which is most likely linked to the news alerts on which the GLC is based. Checking sources in the GLC, they are mainly reported within smaller, more local news outlets compared to landslide events outside of the US. To our knowledge the individual events grouped by our algorithm into clusters have never been linked before. Clusters in this region occur predominantly in spring (February to June), when rainfall is highest, slightly later than events on the west coast (Fig. S4). According to GLC they are predominantly triggered by downpours (64 %, Fig. 4, Table S3). However, extreme rainfall is not always visible in satellite-derived precipitation (Fig. S6). For most clusters, it is below the 95th percentile but above the global threshold. It is worth noting that one cluster located in West Virginia (Cluster ID 35) shows no rainfall on the satellite before day 3 of the cluster. Following the GLC, early landslide events within this cluster are linked to snowmelt.
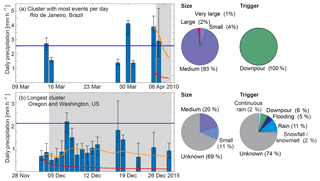
Figure 6Daily precipitation for 30 d preceding the last landslide event of the cluster showing the size of the associated landslide events and their trigger according to the GLC. Shown is the median precipitation for all landslide locations with the inner quartiles as an error bar. The 95th percentile of daily rainfall (rainy days only) in the 10 years preceding the event is given in blue, the global rainfall threshold ID in red (Guzzetti et al., 2008), and the cumulative mean for the rainfall event preceding the cluster in orange. (a) The cluster with the most events per day (ID 43) and (b) the longest-running cluster (ID 22).
3.3.1 Central and South America
In contrast to the clusters in North America, more than 95 % of landslide events within clusters of this region are medium in size or larger and might consist of several landslides themselves (Fig. 4). Thus, the number of landslides per cluster and per day is likely to be significantly higher than the number of events per cluster and per day. Still, clusters in this area are on average only 2.5 d in length, covering an area of slightly over 1500 km2, and they are the smallest and shortest of all regions (Fig. 5, Table 1). It is important to note that this region covers the largest area, reaching from Rio de Janeiro in Brazil to Guatemala in Central America. From the few clusters we could identify, it appears that there are dissimilarities between the clusters in Central America and South America. The two clusters in Nicaragua (ID 42) and Guatemala (ID 39) are triggered by continuous rain and a tropical cyclone, respectively. In contrast, all events located in South America (IDs 38, 40, and 41) are triggered by downpour (Table S1 and Fig. S7).
3.3.2 Himalayas
Like in South America, most landslide events (94 %) associated with clusters with ≥10 events in the Himalayan region are categorized as medium and larger. Thus, the number of landslides per cluster is again expected to be significantly higher than the number of landslide events per cluster. However, there may be differences between regions. Event ID 44, located in India and Pakistan around Jammu and Kashmir, is classified as medium to small, much longer (10 d), and covers an area more than 10 times larger than the other clusters. All of them are classified as medium or large and are located in the east of India, with some events in Nepal (Table S1). In both regions, clusters are triggered by continuous rain or downpour. For all clusters, satellite-based rainfall data exceed the global threshold and, in most cases, the 95th percentile of rainfall on rainy days (Fig. S8). It is important to note that while earthquake-triggered landslides are common in the region (e.g. Parkash, 2013; Roback et al., 2018), the presented algorithm is by design only able to pick up clusters that are linked by rainfall.
3.3.3 Southeast Asia
As only four clusters are identified in this region, a detailed analysis is impossible. Again, 96 % of the events associated are categorized as medium or larger and the main triggers are tropical cyclones (Cluster IDs 47 and 48), downpour (Cluster ID 49), and rain (ID 50) (Table S1). Here, satellite-based rainfall data before clusters are both above the global rainfall threshold and in most cases above the 95th percentile (Fig. S9). While only one of the four clusters (ID 50) is recorded outside of the Philippines (in Indonesia), there is no apparent difference between both countries (Table 1).
3.4 Most intense cluster
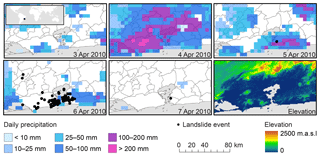
The cluster with the most events in 1 d, i.e., the most intense cluster, happened in Rio de Janeiro, Brazil, as well as neighboring cities Niterói and Sao Gõnçalo in 2010. In an area of approximately 2800 km2, 111 landslide events were recorded within only 3 d, predominantly on 6 April 2010 (Table S1, ID 38). This is almost 4 times as many landslide events in a single day than the second most intense clusters (IDs 1 and 3) located in Washington and Oregon, US. Both recorded 29 events in 1 d.
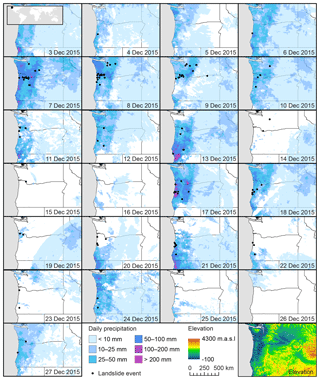
Figure 8Location and time series of the longest cluster, located mainly in Oregon, US. Also shown are daily rainfall and elevation. Elevation data are available from the US Geological Survey (GTOPO30).
Most of the 111 events associated with the cluster in Rio de Janeiro were recorded as medium in size, all of which were triggered by downpour (Fig. 6a). This is confirmed by satellite-derived precipitation. Heavy rainfalls (Figs. 6a, 7) occurred on 4 and 5 April of up to 210 mm per day. In comparison, the 95th percentile in the 10 years preceding this cluster is on average only 62 mm d−1 (rainfall for each individual location shown in Fig. S10). While the rainfall covered a large area, landslide events were primarily reported for steep slopes just outside the densely populated city center. Due to its location close to and inside the urban area of Rio de Janeiro, the cluster caused approximately 200 fatalities according to CNN news reports (http://www.cnn.com/2010/WORLD/americas/04/12/brazil.flooding.mudslides/, last access: 27 June 2019).
The location in the city might also be the reason for the large number of events being reported, as we can expect more individual landslides being reported here compared to the countryside.
While studies not based on English-speaking news alerts report a large number of landslides within and around Rio de Janeiro (Calvello et al., 2015; Sandholz et al., 2018), only nine additional landslide events inside the area of this cluster were reported in the GLC between 2009 and 2018. Additionally, just northwest of the cluster, another cluster occurred in January 2011 (ID 41 in Table S1, Fig. S7). Although this cluster only counts 20 individual landslide events within the GLC, it is being reported as thousands of individual landslides (Coelho Netto et al., 2013).
3.5 Longest cluster
The longest-running cluster identified in this study occurred in Oregon and Washington, US, from 4 to 27 December 2015 for a total of 24 d with 132 landslide events (Cluster ID 18, Table S1). The second longest cluster lasted 17 d over January and February in 2012 and was also located in Oregon and Washington, US (Cluster ID 7). Overall, most events within the longest cluster are unknown in size (69 %) and trigger (74 %) (Fig. 6b). However, inspecting satellite-based rainfall data, continuous rainfall appears to be the main trigger (Figs. 6b, 8 and S11 for rainfall at the individual event locations). While daily rainfall is mainly below the 95th percentile, cumulative mean rainfall is continuously above the global rainfall threshold. Although heavy rainfall is common in this area during winter, for this cluster it lasted longer than usual and was followed by shorter rain events in short succession (Fig. 8). Thus, the series of landslides did not halt, resulting in the longest cluster in the GLC. Following the information on sources within the GLC, it appears that local media reported about the individual landslide events, but did not detect the extreme length of the continuous series of landslide events at this point in time (e.g., https://kval.com/news/local/landslide-blocks-i-5-in-sw-washington; https://q13fox.com/2015/12/09/landslide-above-puget-sound-damages-several-homes-at-least-one-vehicle/, last access: 27 June 2019). As landslide events are such a common occurrence in this region and due to the large area covered by this cluster, there is currently little to no emphasis on the longevity of this specific series of landslide events in media and scientific studies.
In this study an algorithm is presented that detects clusters of landslide events that occur during and are likely triggered by the same rainfall events. Here this algorithm is applied to the Global Landslide Catalog (GLC), where it detects that more than 40 % of all recorded events can be linked to at least one other event. The global analysis shows that 14 % of all landslide events are part of a cluster ≥10 events. However, this percentage varies dramatically by the region, ranging from 30 % on the west coast of North America to 3 % in the Himalayas. Part of this is caused by sampling and reporting bias. As the GLC is based on English-speaking media, events in the US are reported and cataloged in much greater detail than events abroad. Nevertheless, within the GLC we could detect clusters ≥10 landslide events in five distinct regions: (1) the west coast of North America, (2) central and eastern US, (3) Central and South America, (4) the Himalayan region, and (5) Southeast Asia. In South America, the studied clusters are the shortest but contain the most events per day. However, this is mainly due to a cluster in Rio de Janeiro, where 108 of events were recorded on 6 April 2010. As most of these events are classified as medium or larger, the absolute number of landslides is expected to be significantly higher. In contrast, the longest and largest clusters are observed on the west coast of North America. On average, clusters here last 9 d and cover an area of more than 50 000 km2. The steep slopes and continuous rainfall present in the area, combined with the above-average reporting of landslide events, makes a more detailed analysis of rainfall-related landslide clusters possible. The longest of all detected clusters ≥10 landslide events is also located in this region: in December 2015, 132 landslide events were recorded over a time period of 24 d spanning more than 120 000 km2, which were all triggered by the same rainfall event. Detection of large-scale clusters such as this one can not only help to improve our understanding of the link between individual events but also be used in our mitigation strategies. Only once we improve our understanding of the relation between individual landslide events, we will be able to predict their behavior and forecast their economic losses and fatalities. While our study does not replace case-specific and small-scale studies, as well as the identification of threshold values, it can provide an improved understanding for managing landslide mitigation on a larger scale. Within the area covered by individual clusters, the same mitigation strategies, including early warning systems (EWS) based on weather forecast simulations, can be developed and validated. For future research we recommend using the presented algorithm not only for the correlation with precipitation data but also to include the geometry of atmospheric rivers during cluster detection. Finally, the algorithm could be applied to more regional and other global landslide databases thereby improving our understanding of the spatial and temporal occurrence of landslide clusters.
The Global Landslide Catalog is available through NASA's Open Data Portal with the permalink https://data.nasa.gov/Earth-Science/Global-Landslide-Catalog/h9d8-neg4 (last access: 3 May 2018) (GLC, 2018);
CHIRPS precipitation data were acquired through Google Earth Engine. Our script can be accessed from https://code.earthengine.google.com/a6855bd24aae16adf5f62ad72abad9b7.
The algorithm for detecting clusters is written for MATLAB. We ask interested researchers to please contact the authors of this article.
The supplement related to this article is available online at: https://doi.org/10.5194/nhess-19-1433-2019-supplement.
SB developed the algorithm, performed the analysis and wrote the majority of the manuscript. Both authors discussed the results and contributed to the final paper.
The authors declare that they have no conflict of interest.
We would like to thank the two anonymous reviewers for their helpful comments and acknowledge support from the KIT publication fund of the Karlsruhe Institute of Technology.
The article processing charges for this open-access publication were covered by a Research Centre of the
Helmholtz Association.
This paper was edited by Mario Parise and reviewed by two anonymous referees.
Benda, L.: The influence of debris flows on channels and valley floors in the Oregon Coast Range, U.S.A., Earth Surf. Proc. Land., 15, 457–466, https://doi.org/10.1002/esp.3290150508, 1990.
Biasutti, M., Seager, R., and Kirschbaum, D. B.: Landslides in West Coast metropolitan areas: The role of extreme weather events, Weather and Climate Extremes, 14, 67–79, https://doi.org/10.1016/j.wace.2016.11.004, 2016.
Burns, W., Calhoun, N., Franczyk, J., Koss, E., Bordal, M.: Estimating Losses from Landslides in Oregon, 3rd North American Symposium on Landslides, Roanoke, VA, 473–482, 2017.
Calvello, M., d'Orsi, R. N., Piciullo, L., Paes, N., Magalhaes, M., and Lacerda, W. A.: The Rio de Janeiro early warning system for rainfall-induced landslides: Analysis of performance for the years 2010–2013, Int. J. Disast. Risk Re., 12, 3–15, https://doi.org/10.1016/j.ijdrr.2014.10.005, 2015.
Carrara, A., Crosta, G., and Frattini, P.: Geomorphological and historical data in assessing landslide hazard, Earth Surf. Proc. Land., 28, 1125–1142, https://doi.org/10.1002/esp.545, 2003.
Climate Hazards Group: CHIRPSv2.0, https://doi.org/10.15780/G2RP4Q, 2015.
Coelho Netto, A. L., Sato, A. M., de Souza Avelar, A., Vianna, L. G. G., Araújo, I. S., Ferreira, D. L. C., Lima, P. H., Silva, A. P. A., and Silva, R. P.: January 2011: The Extreme Landslide Disaster in Brazil, in: Landslide Science and Practice, edited by: Margottini, C., Canuti, P., and Sassa, K., Springer Berlin Heidelberg, Berlin, Heidelberg, 377–384, 2013.
Collins, B. D. and Sitar, N.: Processes of coastal bluff erosion in weakly lithified sands, Pacifica, California, USA, Geomorphology, 97, 483–501, https://doi.org/10.1016/j.geomorph.2007.09.004, 2008.
Crawford, M. and Bryson, L.: Field Investigation of an Active Landslide In Kentucky: A Framework to Correlate Electrical Data and Shear Strength, Kentucky Geological Survey Report of Investigations, 4, https://doi.org/10.13023/kgs.ri01.13, 2017.
Froude, M. J. and Petley, D. N.: Global fatal landslide occurrence from 2004 to 2016, Nat. Hazards Earth Syst. Sci., 18, 2161–2181, https://doi.org/10.5194/nhess-18-2161-2018, 2018.
GLC: Global Landslide Catalog, NASA's Open Data Portal, available at: https://data.nasa.gov/Earth-Science/Global-Landslide-Catalog/h9d8-neg4?category=Earth-Science&view_name=Global-Landslide-Catalog last access: 3 May 2018.
Gorelick, N., Hancher, M., Dixon, M., Ilyushchenko, S., Thau, D., and Moore, R.: Google Earth Engine: Planetary-scale geospatial analysis for everyone, Remote Sens. Environ., 202, 18–27, https://doi.org/10.1016/j.rse.2017.06.031, 2017.
Guzzetti, F., Peruccacci, S., Rossi, M., and Stark, C. P.: The rainfall intensity – duration control of shallow landslides and debris flows: an update, Landslides, 5, 3–17, https://doi.org/10.1007/s10346-007-0112-1, 2008.
Guha, S., Below, R., and Hoyois, P.: EM-DAT: International Disaster Database, available at: https://www.emdat.be/ (last access: 27 June 2019), Université Catholique de Louvain, Brussels, Belgium, 2015.
Harp, E. L. and Jibson, R. W.: Landslides triggered by the 1994 Northridge, California, earthquake, B. Seismol. Soc. Am., 86, 319–332, 1996.
Keefer, D. K.: Statistical analysis of an earthquake-induced landslide distribution – the 1989 Loma Prieta, California event, Eng. Geol., 58, 231–249, https://doi.org/10.1016/S0013-7952(00)00037-5, 2000.
Kirschbaum, D. B. and Stanley, T.: Satellite-Based Assessment of Rainfall-Triggered Landslide Hazard for Situational Awareness, Earth's Future, 6, 505–523, https://doi.org/10.1002/2017EF000715, 2018.
Kirschbaum, D. B., Adler, R., Hong, Y., Hill, S., and Lerner-Lam, A.: A global landslide catalog for hazard applications: method, results, and limitations, Nat. Hazards, 52, 561–575, https://doi.org/10.1007/s11069-009-9401-4, 2010.
Kirschbaum, D. B., Stanley, T., and Zhou, Y.: Spatial and temporal analysis of a global landslide catalog, Geomorphology, 249, 4–15, https://doi.org/10.1016/j.geomorph.2015.03.016, 2015.
LaHusen, S. R., Duvall, A. R., Booth, A. M., and Montgomery, D. R.: Surface roughness dating of long-runout landslides near Oso, Washington (USA), reveals persistent postglacial hillslope instability, Geology, 44, 111–114, https://doi.org/10.1130/G37267.1, 2016.
Malamud, B. D., Turcotte, D. L., Guzzetti, F., and Reichenbach, P.: Landslide inventories and their statistical properties, Earth Surf. Proc. Land., 29, 687–711, https://doi.org/10.1002/esp.1064, 2004.
Martelloni, G., Segoni, S., Fanti, R., and Catani, F.: Rainfall thresholds for the forecasting of landslide occurrence at regional scale, Landslides, 9, 485-495, https://doi.org/10.1007/s10346-011-0308-2, 2012.
Miller, D. J. and Burnett, K. M.: A probabilistic model of debris-flow delivery to stream channels, demonstrated for the Coast Range of Oregon, USA, Geomorphology, 94, 184–205, https://doi.org/10.1016/j.geomorph.2007.05.009, 2008.
Mirus, B., Morphew, M., and Smith, J.: Developing Hydro-Meteorological Thresholds for Shallow Landslide Initiation and Early Warning, Water, 10, 1274, https://doi.org/10.3390/w10091274, 2018.
Parkash, S.: Earthquake Related Landslides in the Indian Himalaya: Experiences from the Past and Implications for the Future, in: Landslide Science and Practice: Volume 5: Complex Environment, edited by: Margottini, C., Canuti, P., and Sassa, K., Springer Berlin Heidelberg, Berlin, Heidelberg, 327–334, 2013.
Perkins, J. P., Reid, M. E., and Schmidt, K. M.: Control of landslide volume and hazard by glacial stratigraphic architecture, northwest Washington State, USA, Geology, 45, 1139–1142, https://doi.org/10.1130/G39691.1, 2017.
Petley, D.: Global patterns of loss of life from landslides, Geology, 40, 927–930, https://doi.org/10.1130/G33217.1, 2012.
Roback, K., Clark, M. K., West, A. J., Zekkos, D., Li, G., Gallen, S. F., Chamlagain, D., and Godt, J. W.: The size, distribution, and mobility of landslides caused by the 2015 M w 7.8 Gorkha earthquake, Nepal, Geomorphology, 301, 121–138, https://doi.org/10.1016/j.geomorph.2017.01.030, 2018.
Samia, J., Temme, A., Bregt, A., Wallinga, J., Guzzetti, F., Ardizzone, F., and Rossi, M.: Do landslides follow landslides?, Insights in path dependency from a multi-temporal landslide inventory, Landslides, 14, 547–558, https://doi.org/10.1007/s10346-016-0739-x, 2017.
Sandholz, S., Lange, W., and Nehren, U.: Governing green change: Ecosystem-based measures for reducing landslide risk in Rio de Janeiro, Int. J. Disast. Risk Re., 32, 75–86, https://doi.org/10.1016/j.ijdrr.2018.01.020, 2018.
Wang, Y., Summers, R. D., and Hofmeister, R. J.: Landslide loss estimation – Pilot project in Oregon, Oregon Department of Geology and Mineral Industries (DOGAMI), 47 pp., 2002.
Wieczorek, G. F.: Landslides, Floods, and Marine Effects of the Storm of 3–5 January 1982, in the San Francisco Bay Region, California, USGS Numbered Series, Geological Survey (U.S.), available at: http://pubs.er.usgs.gov/publication/pp1434 (last access: 6 November 2018), 1988.
Witt, A., Malamud, B. D., Rossi, M., Guzzetti, F., and Peruccacci, S.: Temporal correlations and clustering of landslides, Earth Surf. Proc. Land., 35, 1138–1156, https://doi.org/10.1002/esp.1998, 2010.


