the Creative Commons Attribution 4.0 License.
the Creative Commons Attribution 4.0 License.
 | 02 Mar 2018
Sediment traps with guiding channel and hybrid check dams improve controlled sediment retention
Sebastian Schwindt
Mário J. Franca
Alessandro Reffo
Anton J. Schleiss
Sediment traps with partially open check dams are crucial elements for flood protection in alpine regions. The trapping of sediment is necessary when intense sediment transport occurs during floods that may endanger urban areas at downstream river reaches. In turn, the unwanted permanent trapping of sediment during small, non-hazardous floods can result in the ecological and morphological degradation of downstream reaches. This study experimentally analyses a novel concept for permeable sediment traps. For ensuring the sediment transfer up to small floods, a guiding channel implemented in the deposition area of a sediment trap was systematically studied. The bankfull discharge of the guiding channel corresponds to a dominant morphological discharge. At the downstream end of the guiding channel, a permeable barrier (check dam) triggers sediment retention and deposition. The permeable barrier consists of a bar screen for mechanical deposition control, superposed to a flow constriction for the hydraulic control. The barrier obstructs hazardous sediment transport for discharges that are higher than the bankfull discharge of the guiding channel without the risk of unwanted sediment flushing (massive self-cleaning).
- Article
(11103 KB) - Full-text XML
-
Supplement
(766 KB) - BibTeX
- EndNote


The sediment supply of mountain rivers is a substantial source for the dynamics of river ecosystems. Artificial barriers, such as dams, can affect the natural flow regime variability with direct impacts on the eco-morphological state of rivers (Allan and Castillo, 2007; Sponseller et al., 2013). Maintaining the natural conditions of rivers is a multidisciplinary concern and artificial interventions require the consideration of ecological and morphological site evaluations (Bain et al., 1999).
The morphological processes in mountain rivers depend on and interact with the transport of sediment (Buffington and Montgomery, 1999; Hassan et al., 2005; Recking et al., 2016). The sediment supplied by the headwaters is also essential for the ecological diversity of downstream river reaches (Milhous, 1998; Gomi et al., 2002; Denic and Geist, 2015). Therefore, sediment transport-related criteria can also be designated as “eco-morphological” river characteristics (Moyle and Mount, 2007). These characteristics can often be attributed to a certain discharge which alters and rearranges the channel bed morphology, which may be assessed by morphologically effective (dominant) discharge (Wolman and Leopold, 1957a, b; Wolman and Miller, 1960).
For estimating the transport capacity of the headwaters, many (semi-)empirical formulae have been developed (Meyer-Peter and Müller, 1948; Smart and Jaeggi, 1983; Wilcock, 2008; Recking, 2013). However, the sediment transport in such streams is often driven by the sediment supply from bed-external sources, as long as armour breaking does not occur. In such co- or non-alluvial channels, the fluvial sediment transport can be assessed in terms of the finer “travelling bed load” (Yu et al., 2009; Piton and Recking, 2017). The characteristic grain size of the travelling bed load can be estimated by the grain size of sediment bars along the channel banks upstream. These bars are silent witnesses of earlier flood events and contain information about sediment transport during past floods (Kaitna and Hübl, 2013). The application of the grain size of the travelling bed load to bed load transport formulae can be used for establishing sediment rating curves, as a computation basis for the dominant discharge. The D84, i.e. the grain size of which 84 % of the mixture are finer, of the channel bed provides a good estimate for the roughness (e.g. Zimmermann, 2010; Rickenmann and Recking, 2011), while the mean grain diameter of overbank channel deposits represents an accurate estimate to assess the sediment volume flux (Guillaume Piton, personal communication, 2015).
The sediment transport in headwaters can be disturbed by hydraulic structures for water use as, for instance, hydropower, drinking water, or flood protection (Williams and Wolman, 1984; Kondolf, 1997; Lane et al., 2014). This may cause sediment deficits in downstream reaches resulting in bed incision as well as the erosion of channel banks and floodplains (Pasternack and Wyrick, 2017).
Check dams represent particular man-made interventions in a rivers sediment budget. The historical purpose of check dams was soil conservation through the creation of artificial fix points in the longitudinal profile of a channel (Piton et al., 2017). Sediment retention, especially the retention of bed load, is required for exceptional floods that potentially endanger downstream riparian urban areas. Open check dams, a particular subcategory of check dams, aim at partial sediment transfer under normal flow conditions and they are the centrepiece of sediment traps. Sediment traps conceptually trigger sediment retention when the open check dam becomes obstructed during floods for storing potentially hazardous sediment in an upstream retention area (e.g. Wang, 1903; Hampel, 1968; Kronfellner-Krauss, 1972; Hübl et al., 2005; Mizuyama, 2008; Piton and Recking, 2016a).
Drawbacks in the typical concept of sediment traps are the excessive, unnecessary retention of sediment or unwanted sediment flushing. Sediment that is retained but not hazardous to downstream dwellers becomes lacking in downstream reaches of mountain rivers and causes their eco-morphological degradation (Comiti, 2012). Schwindt et al. (2017a) examined a new concept for open check dams with a hybrid control to prevent unwanted sediment flushing and to improve sediment permeability during normal flow conditions. This previous study used a laboratory flume that is extended in this study to a retention area and the hybrid control barrier is applied on an improved concept of sediment traps. Moreover, this experimental and praxis-oriented research systematically investigates a guiding channel across the retention area as a novel design element. This enhanced concept for sediment traps aims at reducing the maintenance costs as well as the morphological degradation of downstream reaches by improving the sediment transport continuity through check dams, unless hazardous floods occur. A simultaneous objective is an increased safety of sediment traps against functional failure in the shape of unwanted sediment flushing. The experiments address fluvial bed load transport rather than debris flow.
2.1 Design approach for permeable sediment traps
The objective of the type of sediment traps considered here is the retention of only bed load that potentially causes channel obstructions in populated downstream reaches. Under normal flow conditions, the river discharge passes the sediment trap undisturbed, while the principal elements of a sediment trap constitute a deposition area and a check dam with opening(s). The latter triggers bed load retention when either the discharge exceeds a case-variable threshold value or the transported material exceeds a hazardous diameter, corresponding to the principles of hydraulically or mechanically controlled sediment retention (Piton and Recking, 2016a).
In detail, Fig. 1 shows the typical elements of a sediment trap: (1) a barrier with an opening (open check dam) having an open or closed crest and (2) downstream abutments with a counter sill for scour protection; (3) a retention basin, i.e. deposition area; (4) lateral dykes for limiting the deposition area; (5) a maintenance access; and (6) an inlet sill with scour protection.
This study uses barriers similar to check dams, and therefore check dams are subsequently referred to as barriers in the laboratory flume.
In the context of river continuity, inlet structures (Fig. 1) in the form of sills are, besides the barrier itself, an additional obstacle regarding the longitudinal river connectivity. Such sills can cause downstream scour or dead storage volume (Zollinger, 1983). Therefore, inlet structures are avoided when possible in practice (Piton and Recking, 2016a), and consequently, they are not considered in the present study.
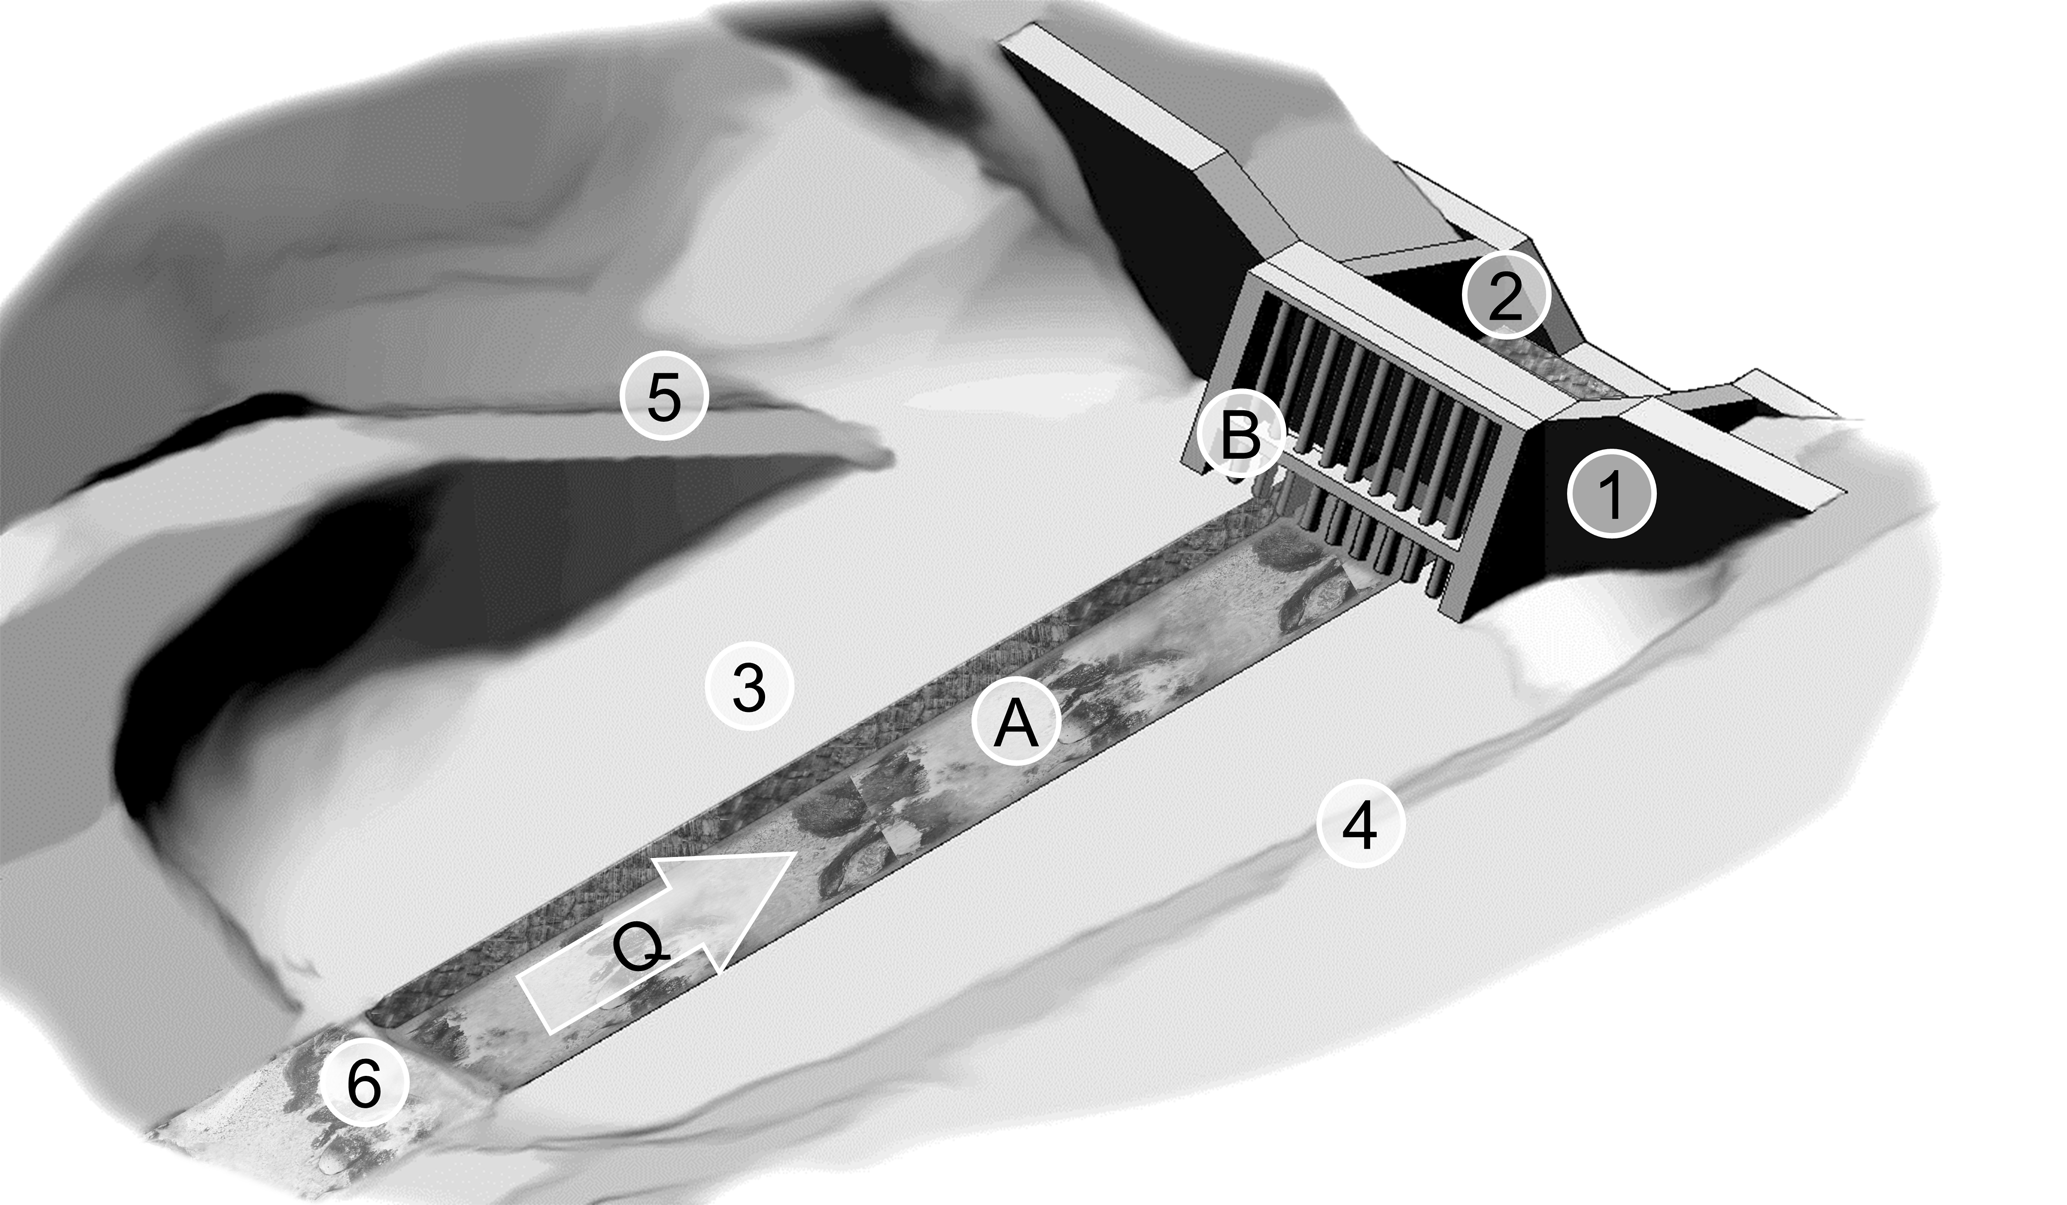
Figure 1Concept of a permeable sediment trap consisting of (1) an open barrier (open sediment check dam) with overflow crest for flood release, followed by (2) downstream abutments with counter dam (sill); (3) a reservoir or deposition area, limited by (4) lateral dykes; (5) a maintenance access; and (6) an inlet structure with scour protection (adapted from Piton and Recking, 2016a; Zollinger, 1983). For permeable sediment traps, the novel element of (A) a guiding channel is introduced with (B) a barrier consisting of a bar screen for mechanical control and a barrier with an opening for the hydraulic control of bed load retention (Schwindt et al., 2017a).
Previous studies have shown that the retention of bed load is hydraulically initiated as soon as the check dam causes a hydraulic jump upstream underlying generally supercritical flow conditions (Schwindt et al., 2017a, b). Supercritical flow occurs at high discharge in steep channels unless the streambed is mobile (Grant, 1997) and it is limited to specific morphologic units in nature (Comiti et al., 2007; Heyman et al., 2016). This study is restricted to supercritical flow conditions over a fixed bed, where the Froude number in the non-constricted (barrier-free) channel is generally larger than the total (similar to floods with high depth to grain size ratios). In this case, a single opening in the barrier acts like a vertical or lateral flow constriction that causes backwater in the deposition area during floods. Therefore, the free surface flow capacity of the barrier opening(s) without backwater should be in practice smaller than that of the sediment-laden flood discharge that potentially endangers urbanised downstream regions.
Mechanically caused sediment retention occurs when the size of the transported sediment is too large to pass the openings. In practice, the mechanical sediment retention is typically achieved by screen or net structures (Piton and Recking, 2016a).
Small clearance heights or narrow clearance widths of the opening(s) in the barrier may interrupt the river connectivity with negative effects on the downstream eco-morphological river state (Kondolf, 1997; Brandt, 2000; Castillo et al., 2014).
The combination of both mechanical and hydraulic control mechanisms can be obtained by installing a bar screen in front of an opening of a barrier (open check dam). This combination has been shown to be advantageous to avoid the unwanted flushing of formerly deposited sediment in the deposition area (Schwindt et al., 2017a). In addition to the previous experiments, the hybrid control barrier consisting of a bar screen for the mechanical control and a flow constriction for the hydraulic control (B in Fig. 1) is analysed here with a widened deposition area. The design of the bar screen refers to criteria from the literature (Watanabe et al., 1980; Uchiogi et al., 1996; Piton and Recking, 2016a).
Check dams and barriers in mountain rivers with single or multiple openings and various open geometries can be found in the terrain. However, the variety of openings can be reduced to the two triggering mechanisms of sediment retention, i.e. check dams that cause sediment deposition either through hydraulic or mechanical control. Hübl et al. (2003, 2005) provide a comprehensive review on existing designs of check dams, which can also be found in Piton and Recking (2016a) or Schwindt (2017).
As an important novel feature, a guiding channel (A in Fig. 1) across the deposition area is subsequently introduced. The guiding channel has the purpose of ensuring sediment transfer up to its bankfull discharge. Similarly, Hübl et al. (2012) tested a sorting channel without a regular cross section in a physical model. Empiric implementations of guiding channel-like structures were observed by the authors, e.g. at “La Croisette” (Bex, Canton of Vaud, Switzerland), but the conceptual introduction and systematic study of a guiding channel is novel. This study applies to systematic experiments that refer to a theoretical bankfull discharge of the guiding channel, corresponding to the dominant, morphologically effective discharge. The use and performance of the guiding channel is considered in combination with barriers for the hydraulic and mechanical deposition controls (B in Fig. 1 and Schwindt et al., 2017a).
The new concept of a permeable sediment trap (Fig. 1) is tested with a standardised hydrograph, corresponding to typical hydrological characteristics of mountain rivers. Special attention is drawn in supplementary experimental runs on the possibility of flushing of sediments.
2.2 Sediment deposition processes and pattern
Independent of the deposition control mechanism, the barrier alone can cause backwater, when sediment deposition occurs due to the deceleration of the flow with a consequent reduction in the energy slope (Leys, 1976; Zollinger, 1984; Armanini et al., 1991; Armanini and Larcher, 2001; Mizuyama, 2008). However, the patterns of sediment deposits in the deposition area differ for both obstruction mechanisms, as shown in Fig. 2 (Lange and Bezzola, 2006; Piton and Recking, 2016a). In the case of hydraulic control, the bed load settles in the backwater immediately downstream of the hydraulic jump, and forms a delta-like deposit. For coarse bed load, the deposit evolves in the upstream direction; for fine bed load, the deposit evolves in the downstream direction (Armanini and Larcher, 2001; Jordan et al., 2003; Campisano et al., 2014). The mechanical clogging of the barrier causes a hydraulic jump immediately upstream of the barrier. Thus, the formation of the sediment deposit is initiated directly upstream of the barrier and displaces the hydraulic jump in the upstream direction. This results in the successive formation of an elongated sediment deposit that progresses in an upstream direction until it reaches the level of the barrier crest (flood control). Then, a second deposit layer forms on top of the former. This layer-wise deposition continues in a succession of quasi-equilibrium states until the deposition area is completely filled up to the barrier crest (Campisano et al., 2014; Piton and Recking, 2016a).
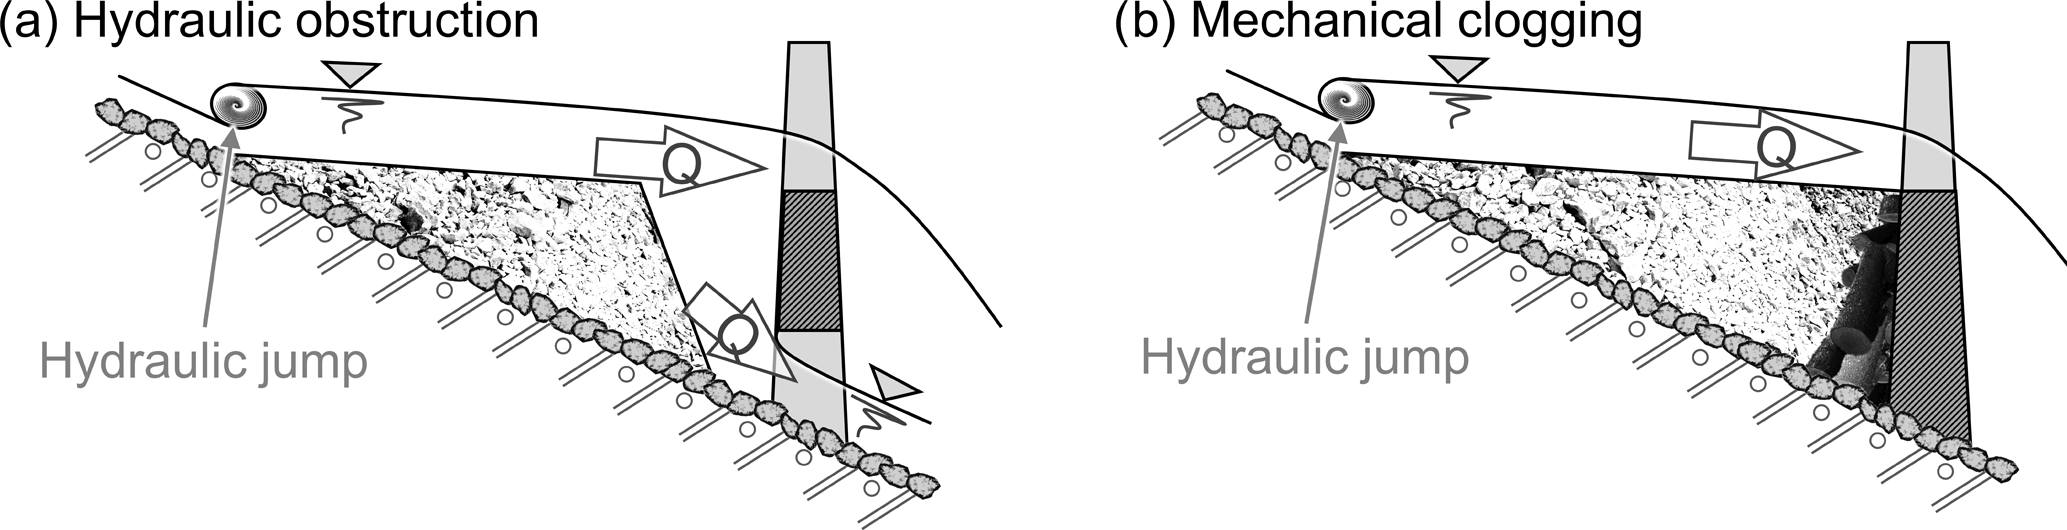
Figure 2Control mechanisms of sediment retention by permeable torrential barriers: (a) hydraulic deposition, where the opening creates backwater, due to the exceedance of its discharge capacity, and (b) mechanical deposition caused by large objects (adapted from Lange and Bezzola, 2006; Piton and Recking, 2016a).
3.1 Experimental set-up
The design of the experimental set-up (Fig. 3) was inspired by 132 characteristic datasets from mountain rivers for respecting typical relationships between flow depth, channel width, grain size and discharge (Schwindt, 2017). Thus, even though any particular prototype can underlay the model, a geometric scale in the range of 1:10 to 1:40 can be supposed.
The experimental set-up consisted of a sediment supply system, with a container (Element 1 in Fig. 3) for sediment storage, and supply rate control by a cylindrical bottom screw, as well as a system of conveyor belts (Element 2 in Fig. 3). The sediment supply mixture consisted of fine and medium gravel, characterised by D16=6.7 mm, Dm=10.4 mm, D84=13.7 mm and Dmax=14.8 mm, in line with the field data. The water was supplied by the laboratory pump system and mixed with the sediment in a 2.5 m long adaptation reach (Element 3 in Fig. 3), which was situated upstream of a 3.0 m long observation reach (Element 4 in Fig. 3). The minimum and maximum pump discharge was 5.5 and 12.5 L s−1, respectively. The barriers (Element 5 in Fig. 3) in terms of a bar screen and mobile PVC elements were introduced in the lower third of the observation reach, approximately 0.9 m upstream of the model outlet. A filter basket (Element 6 in Fig. 3) at the model outlet served for the separation of outflowing sediments and water. The water returned to the laboratory pump circuit.
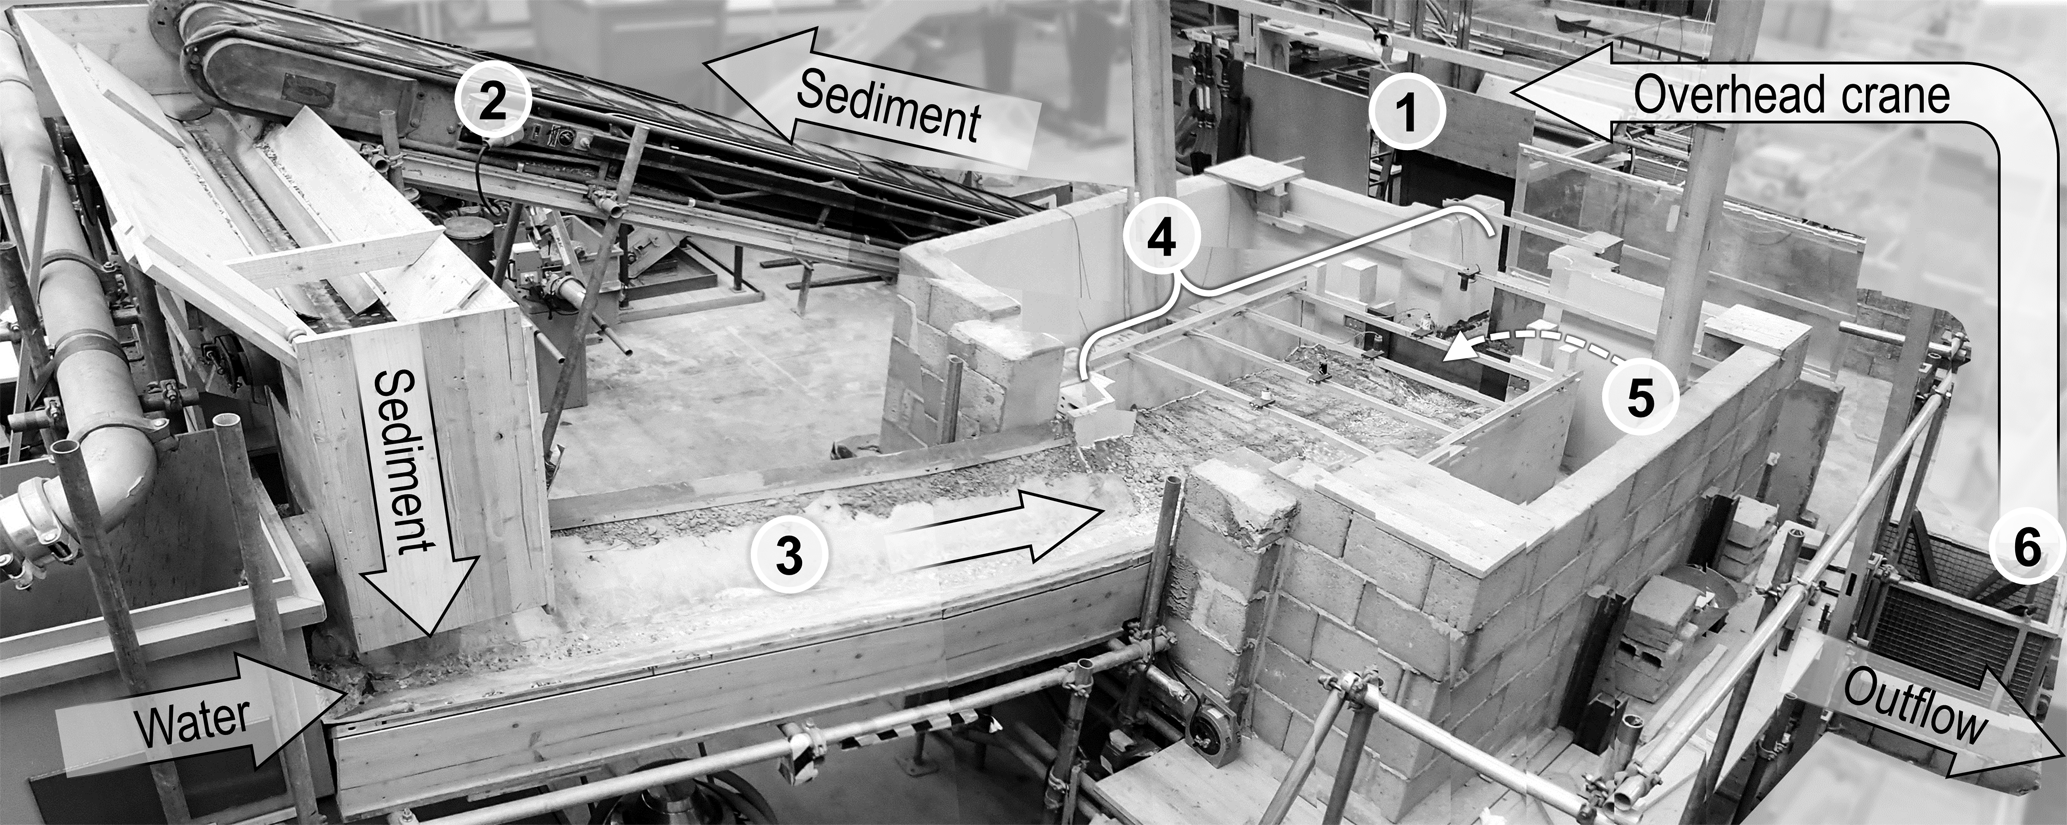
Figure 3The experimental set-up with a sediment supply system that consisted of a sediment container (1) and conveyor belts (2); with indication of the water supply by the laboratory pump system, and the adaptation reach (3) that led the sediment–water mixture to the observation reach (4). The barriers were placed at the downstream end of the observation reach (5). The outflowing sediment and water were separated by a filter basket (6) at the downstream end of the model.
The pump discharge was registered every second by an electromagnetic flow metre (type ABB FXE4000) with a precision of 0.1 %. The wet outflowing sediments (bed load outflow Qb,o) were weighed every minute in an intermediate sieve in the filter basket, outside of the flow, by a scale with a precision of ±2 g (type Kern 440 51N). The total weight of the sediment deposits was measured by an industrial scale (type Dynafor MWXL-5, precision of ±0.01 kg) attached to the filter basket, after the flushing of the sediment deposits, for every test.
The volumes and patterns of the sediment deposits were recorded using a motion-sensing device (Microsoft Kinect V2) at the end of every test. This application has been shown promising, but the results were still affected by uncertainties (Lachat et al., 2015). For this reason, complementary and redundant reference measurements were made using a laser (type Leica DISTO D410, precision of ±1 mm). Thus, a redundant bathymetric record was produced by centimetre-wise measurements along 16 cross sections with an interspace of 0.10 m (according to the grid lines indicated in Fig. 4), which corresponds to approximately 650 point measurements. The accuracy of both measurement techniques was evaluated using the total weight and the apparent packed density of the sediment (gravel with kg m−3 , supplier information). The evolution of the deposit pattern during the hydrograph experiments was observed by a camera (GoPro Hero Silver, 2016) taking top view time-lapse pictures, every 10 s.
3.2 Premises and descriptions of the deposition area with guiding channel
The observation reach included a deposition area with guiding channel and a downstream deposition control barrier, according to the sediment trap concept shown in Fig. 1. The geometry of the deposition area referred to the desirable optimum between sediment retention and flushing: the trapping efficiency of reservoirs (Brown, 1943), as well as the sediment flushing potential, which increases with increasing length and decreasing width of the deposition area (Zollinger, 1983, 1984; Piton and Recking, 2016a). The unwanted flushing of sediment traps represents a high risk at urban downstream reaches and should be avoided (Morris et al., 2008; Sodnik et al., 2015). To ensure a high trapping efficiency, but at the same time limit the risk of unwanted sediment flushing, a rectangular deposition area with a width to length ratio of 3:4 was used for the experiments (Zollinger, 1983). The opening angle of the deposition area was set to 30∘, which is oriented at the opening angle of natural alluvial deposition cones formed by continuous sediment supply (Parker et al., 1998). The barriers applied here resulted from previous experimental analysis (Schwindt et al., 2017a) with a longitudinal channel slope of So=5.5 % which can be typically found in co- or non-alluvial mountain rivers (Rosgen, 1994; Yu et al., 2009; Piton and Recking, 2017).
According to the above-mentioned criteria, the deposition area (Fig. 4a) had a length of 1.60 m, a width of 1.20 m, a longitudinal slope So of 5.5 % and an opening angle of 30∘. For the description of sediment deposits, a model coordinate system was defined with its origin at the location of the barrier. Thus, the positive x-axis points in the upstream direction and x=0 corresponds to the insertion point of the barrier; the positive y-axis points toward the right bank and y=0 corresponds to the flume centre; the positive z-axis points upward and z=0 corresponds to the flume bottom at the barrier.
The bottom of the deposition area consisted of gravel from the supply mixture. For ensuring the same initial conditions for every experimental run, cement grout was poured over the shaped, loose foundation gravel (cf. Fig. 4b and c).
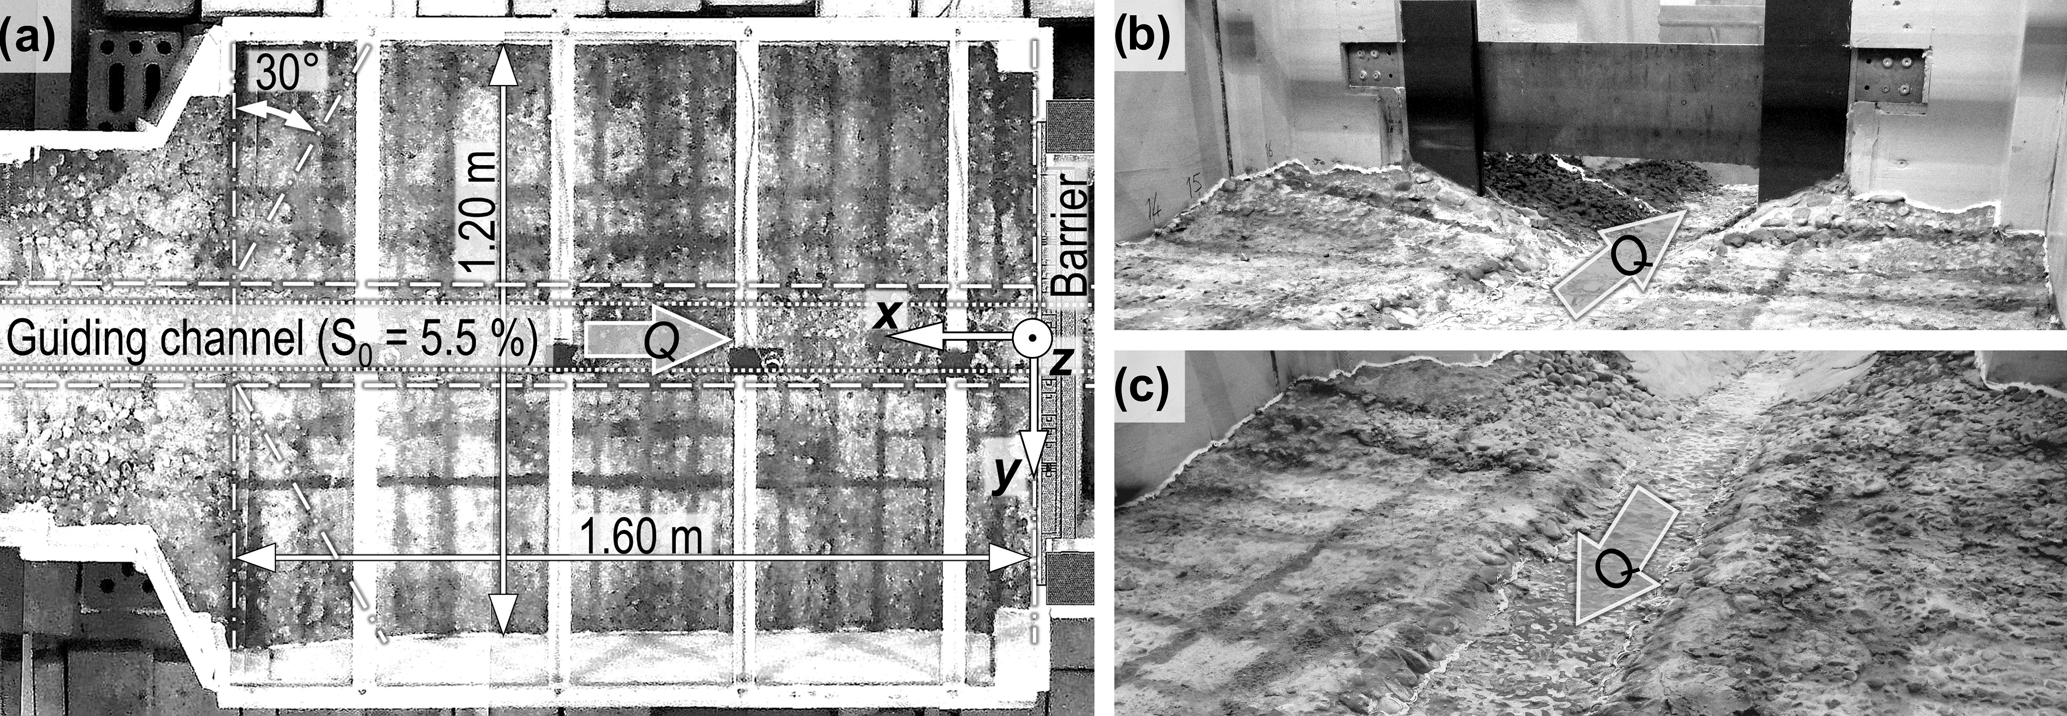
Figure 4Details of the observation reach consisting of the deposition area (reservoir) with guiding channel. The marked grid lines on the bottom were used for qualitative purposes and had an interspace of approximately 0.1 m: (a) top view with an indication of the reservoir length (1.60 m), width (1.20 m), opening angle (30∘) and longitudinal slope (5.5 %), as well as the model coordinate system ( axis) used for the evaluation of sediment deposits; (b) location of barriers, view in the downstream direction; and (c) deposition area (reservoir), view in the upstream direction.
The design criteria for barriers regarding the discharge capacity and the effects on bed load transport have been derived in previous studies from flume observations with constrained, monotone channel morphology (Armanini and Larcher, 2001; Piton and Recking, 2016a, b; Schwindt et al., 2017a). The guiding channel (A in Fig. 4) enables not only the sediment transfer during low flows, but also ensures the desired hydraulic functioning of the barrier, as it represents a morphological fixation of the monotone channel in the deposition area up to the bankfull discharge. In the experiments, the hydraulic design and bankfull discharge of the guiding channel corresponded to “small” discharges, equivalent to the dominant, morphologically effective discharge, referring to pristine downstream reaches in practice. A flood hydrograph with higher discharges than the bankfull discharge of the guiding channel was simulated. Due to the model limitations, the guiding channel had a bankfull discharge of Qbf=5.5 L s−1. In practice, the bankfull discharge should be slightly larger than the effective discharge related to bankfull discharge in order to enhance the eco-morphological flow continuum through the sediment trap.
The guiding channel had a trapezoidal cross section, as shown in Fig. 5, with a bank inclination of m=2.25 (dimensionless) and a bottom channel width of w=0.11 m (Schwindt et al., 2017a, b). Grains larger than the D84 of the sediment supply mixture constituted the roughness. Therefore, the channel roughness resulted from the geometric scale considerations (e.g. ratio between channel width, flow depth and grain size) and corresponded to a Mannings' n of n≈0.02. The roughness was computed in earlier studies using a shooting method (Schwindt et al., 2017a, 2018). According to the Gauckler–Manning–Strickler formula, the bankfull discharge of 5.5 L s−1 corresponds to a normal flow depth of 0.032 m. The bed shape of the guiding channel was also fixed by pouring cement grout into the voids of the loose grains.
3.3 Tested deposition control modes of the barrier
The barrier was introduced at the downstream end of the deposition area (Element 5 in Fig. 3 and Schwindt et al., 2017b). The barrier incorporated a flow constriction for the hydraulic control, and a bar screen for the mechanical control of bed load retention. Three cases of deposition control types were considered:
-
Case 1 – hydraulic deposition control only, where two situations are considered:
-
(Hy-no) – a non-overflowed, infinitely high barrier with constant opening dimensions (Fig. 6a);
-
(Hy-o) – an overflowed barrier with limited height and constant opening height (Fig. 6b);
-
-
Case 2 (Mec) – mechanical deposition control by a bar screen with constant spacing (Fig. 6c); and
-
Case 3 (HyMec) – combined deposition control, i.e. a bar screen upstream of an overflowed hydraulic control barrier with variable opening height (Fig. 6d).
For the hydraulic control only, two types of flow situations were considered (Table 1): case Hy-no, with infinite barrier height, where barrier overflow was not possible and case Hy-o, with overflowed barrier, where the barrier height was limited to 0.11 m. In case Hy-no, the constriction height a was 0.152 m and the constriction width b was 0.076 m. The opening height of 0.152 m corresponded to the technically maximum possible constriction height due to the model limitations; the corresponding width of 0.076 m was required to hydraulically trigger sediment retention when the bankfull discharge of 5.5 L s−1 was exceeded, according to previous studies (Schwindt et al., 2017a). Smaller widths were not considerable enough to ensure flow and sediment continuity in practice.
Table 1Denomination and characterisation of test runs with hydrograph and flushing episodes.
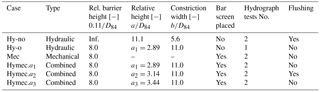
The unwanted flushing of sediment was observed in previous studies when barriers were overflowed (e.g. Schwindt et al., 2017a; Zeller, 1973), as considered by the cases Hy-o, Mec and HyMec with limited barrier height. However, the creation of a sediment deposit that can be flushed requires the initial impounding without barrier overflow. Thus, the barrier height was determined in such a manner that the opening was pressurised for discharges higher than 5.5 L s−1 and so that the barrier would not be overflowed from discharges up to 7.0 L s−1, corresponding to the first incremental increase of the hydrograph. Barrier overflow can be avoided when the cross section averaged energy head is not higher than the barrier (Piton and Recking, 2016a). In the experimental set-up, the head corresponding to a discharge of 7.0 L s−1 was approximately 0.11 m, which was decisive for limiting the barrier height to 0.11 m as well.
The width of the opening in the overflowed hydraulic control barrier (cases Hy-o and HyMec) was 0.15 m, which was slightly larger than the bottom width of the guiding channel. This choice has been made to minimise the effects of the barrier on the flow, when the guiding channel was not covered. An opening height of 0.040 m is required to hydraulically trigger sediment retention for a discharge of 5.5 L s−1 (Schwindt et al., 2017a, b).
For the combined control barrier, larger opening heights were also analysed to study their effect on deposition control by combined barriers. Thus, the opening heights tested in the case HyMec were 0.040, 0.043 and 0.047 m, where the constriction width was kept constant with 0.15 m.
Pure mechanical deposition control (case Mec) was tested by a bar screen with a height of 0.11 m and a bar width, as well as an interspace between the bars corresponding to the D84 of the sediment supply mixture. The clearance between the guiding channel bottom and the lower end of the bars was 1.75⋅D84 to ensure the sediment transfer during small discharges and fail-safe clogging at the same time, when sediment retention was wanted (Schwindt et al., 2017a). Fail-safe clogging refers to the barrier blockage that is not prone to unwanted sediment flushing.
The bar screen had an inclination of 2:1 to favour the passage of wood material over the barrier (Bezzola et al., 2004; Lange and Bezzola, 2006; Piton and Recking, 2016b) but wood was not introduced in the tests.
The combination of hydraulic and mechanical controls has been shown to be promising for the reducing of risks due to individual uncertainties related to unwanted sediment flushing and sediment size, respectively (Schwindt et al., 2016b, 2017a). This combined control type was considered in the experiments (case HyMec) by the superposition of the bar screen in relation to the hydraulic barrier with variable constriction height a and constant width b, according to the test case Hy-o.
3.4 Experimental procedures
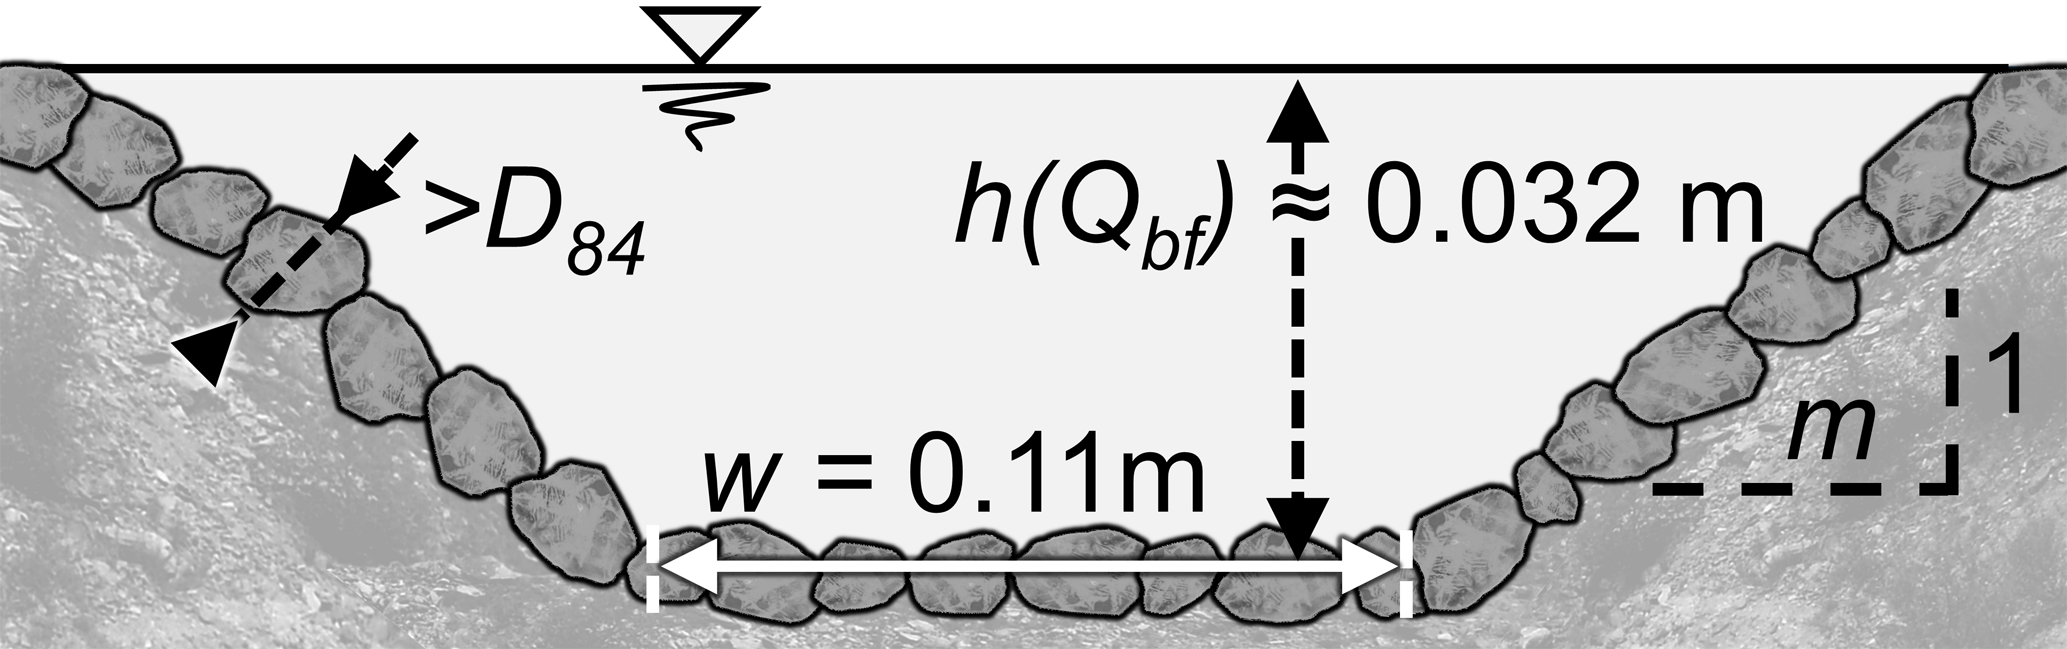
Figure 5The cross section of the trapezoidal guiding channel, lined with fixed grains larger than the D84 of the sediment supply mixture and designed for bank overtopping for discharges higher than 5.5 L s−1.
Each barrier set-up was tested two times (α and β tests) with the same generic hydrograph that was established based on the following criteria:
-
The duration of the falling limb t− (in s) is 1.7 times as long as the rising limb t+ (in s), which is typical for floods of mountain rivers (D'Agostino and Lenzi, 1996; Rickenmann et al., 1998; Armanini and Larcher, 2001; Kaitna et al., 2011; Piton and Recking, 2016a):
-
The initial discharge of 5.5 L s−1 corresponds to the bankfull discharge of the guiding channel and the peak discharge of 12.5 L s−1 is imposed by the model limitations.
-
The ratio between the sediment supply rate (bed load inflow Qb,i) and the pump discharge Q is 0.5 % (weight-specific), as determined in previous studies on the experimental set-up (Schwindt et al., 2017b).
-
The total supply volume VΣ (in m3) is higher than the plain storage volume (0.127 m3) of the deposition area (reservoir) considering a barrier height of 0.11 m.
The plain storage volume in the deposition area corresponded to the horizontal filling of the deposition area with a deposition slope Sdep=0. The above-listed criteria led to a hydrograph with a rising limb duration of s (≈ 19 min) and a falling limb duration of s (≈ 32 min). The water and solid discharge supply were adapted in steps of 4 min. The resulting total volume of the sediment supply on the generic flood hydrograph was VΣ=0.137 m3. The hydrograph with sediment supply is shown in Fig. 7 with the subsequently introduced dimensionless parameters.

Figure 6Tested barrier types: hydraulic deposition control only with constriction height a and width b; (a) case Hy-no without the possibility of structure overflow and (b) case Hy-o, with limited barrier height (0.11 m); mechanical deposition control by (c) a bar screen (case Mec) with a height of 0.11 m; and (d) the combination of hydraulic and mechanical deposition control (case HyMec), with the bar screen superposed to the flow constriction with variable constriction height a and constant width b.
At first sight, the ratio between peak and initial discharge of approximately 2.3 may seem low. However, the initial discharge represents the threshold value for triggering sediment deposition, i.e. a flood discharge that is potentially dangerous for downstream infrastructure. The peak discharge thus represents a flood that is, in terms of magnitude higher by a factor of 2.3 than the target discharge for triggering sediment retention.
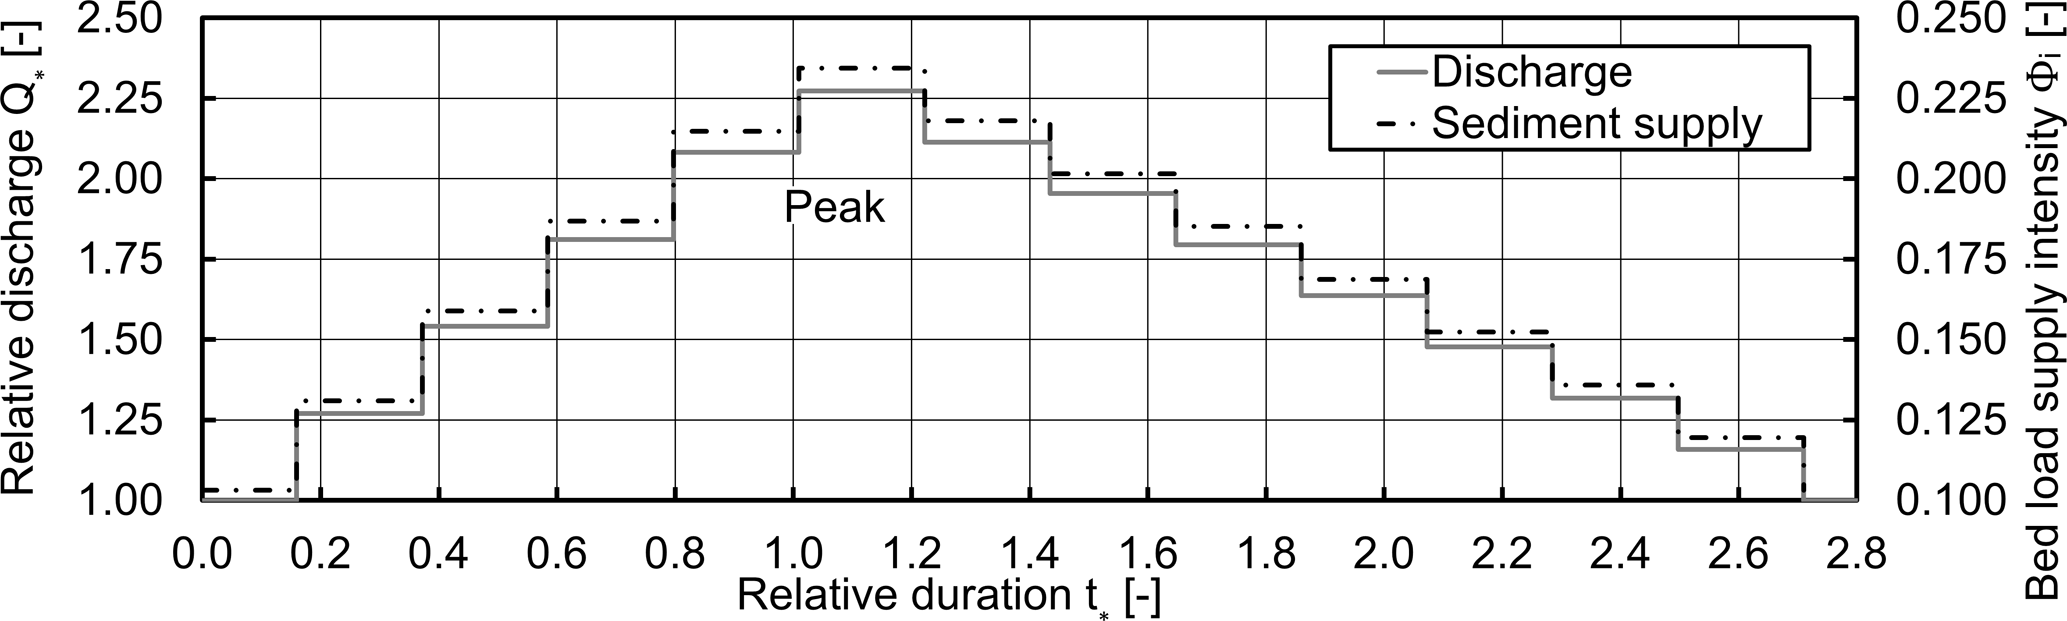
Figure 7The generic hydrograph used for the experiments, based on the dimensionless expressions of relative discharge , bed load supply intensityΦi, and relative time .
Moreover, the possibility of sediment flushing was examined by a trial of discharge variations, i.e. several sudden increases and decreases in the discharge were tested with the goal of attempting the remobilisation of the deposit. In addition, the maximum amount of sediment that could be supplied to the model with respect to technical limitations was supplied at a constant rate. The flushing attempts were only meaningful in cases with hydraulic barriers, as the flushing of clogged mechanical barriers is not possible (Schwindt et al., 2017a). The duration of the flushing depended on the observation of the morphological activity in terms of sediment displacement in the deposition area and the outflowing bed load.
3.5 Parameters and dimensional considerations
This study focuses on the deposition pattern and volume due to the standardised hydrograph, considering the occasional subsequent sediment flushing, and corresponding transfer of bed load. These phenomena may be described by the following set Λ of parameters:
where a and b are the height and width of the hydraulic flow constrictions, respectively; D84 is the representative grain size; g denotes the gravitational acceleration (9.81 m s−2); h is the flow depth; Q is the pump discharge; Qb,i and Qb,o denote the mass sediment supply and outflow rates, respectively; So is the longitudinal slope of the guiding channel (5.5 %); t is the experiment duration; t+ and t− are the duration of the rising and falling limb of the hydrograph, respectively; Vdep is the volume of sediment deposits; w is the channel bottom width; ν is the kinematic viscosity of water (10−6 m2 s−1); ρf and ρs are the water density (1000 kg m−3) and the sediment grain density (2680 kg m−3), respectively; and (1550 kg m−3) is the density of sediment deposits, according to the supplier's data.
With respect to the analysis of bed load transport-related phenomena, the dimensional analysis is based on the independent variables of D84, g and ρf (Einstein, 1950; Yalin, 1977). The discharge Q is considered relative to the bankfull discharge of the guiding channel (Qbf=5.5 L s−1). In addition, the time t is considered relative to the duration of the rising limb of the hydrograph, and the volume of sediment deposits Vdep is considered relative to the cumulative volume of the hydrograph sediment supply (VΣ=0.137 m3). This leads to the following set of relevant dimensionless parameters:
-
, grain related opening height of vertical flow constrictions;
-
, grain related opening width of lateral flow constrictions;
-
, relative discharge;
-
, density ratio;
-
, relative duration;
-
, percentaged relative deposit volume;
-
and Z* correspond to and z∕D84, respectively;
-
], intensity of bed load supply;
-
[], intensity of outflowing bed load.
Flow depth related parameters are not considered, as the precise measurement of the flow depth was not possible through non-intrusive techniques in the shallow flow over the rapidly changing morphology of the sediment deposits, during the hydrograph.
3.6 Summary of test runs
Table 1 lists the characteristic test parameters. The hydrograph was applied two times (α and β tests) for every barrier configuration, except for the overflowed hydraulic barrier (case Hy-o) as unwanted sediment flushing occurred in the first hydrograph test.
4.1 Evolution of bed load transfer through the barrier
The outflowing sediment rates in terms of the bed load transport intensity Φo are shown in Fig. 8 for the cases Hy, Mec and Hy-Mec, as a function of the relative hydrograph duration t* and for the two repetitive runs α and β. In addition, the shape of the deposits at the peak of the hydrograph is shown in the top view pictures. These pictures show the representative α tests, as no major differences between the pattern of the two repetitive tests (α and β) were observed.
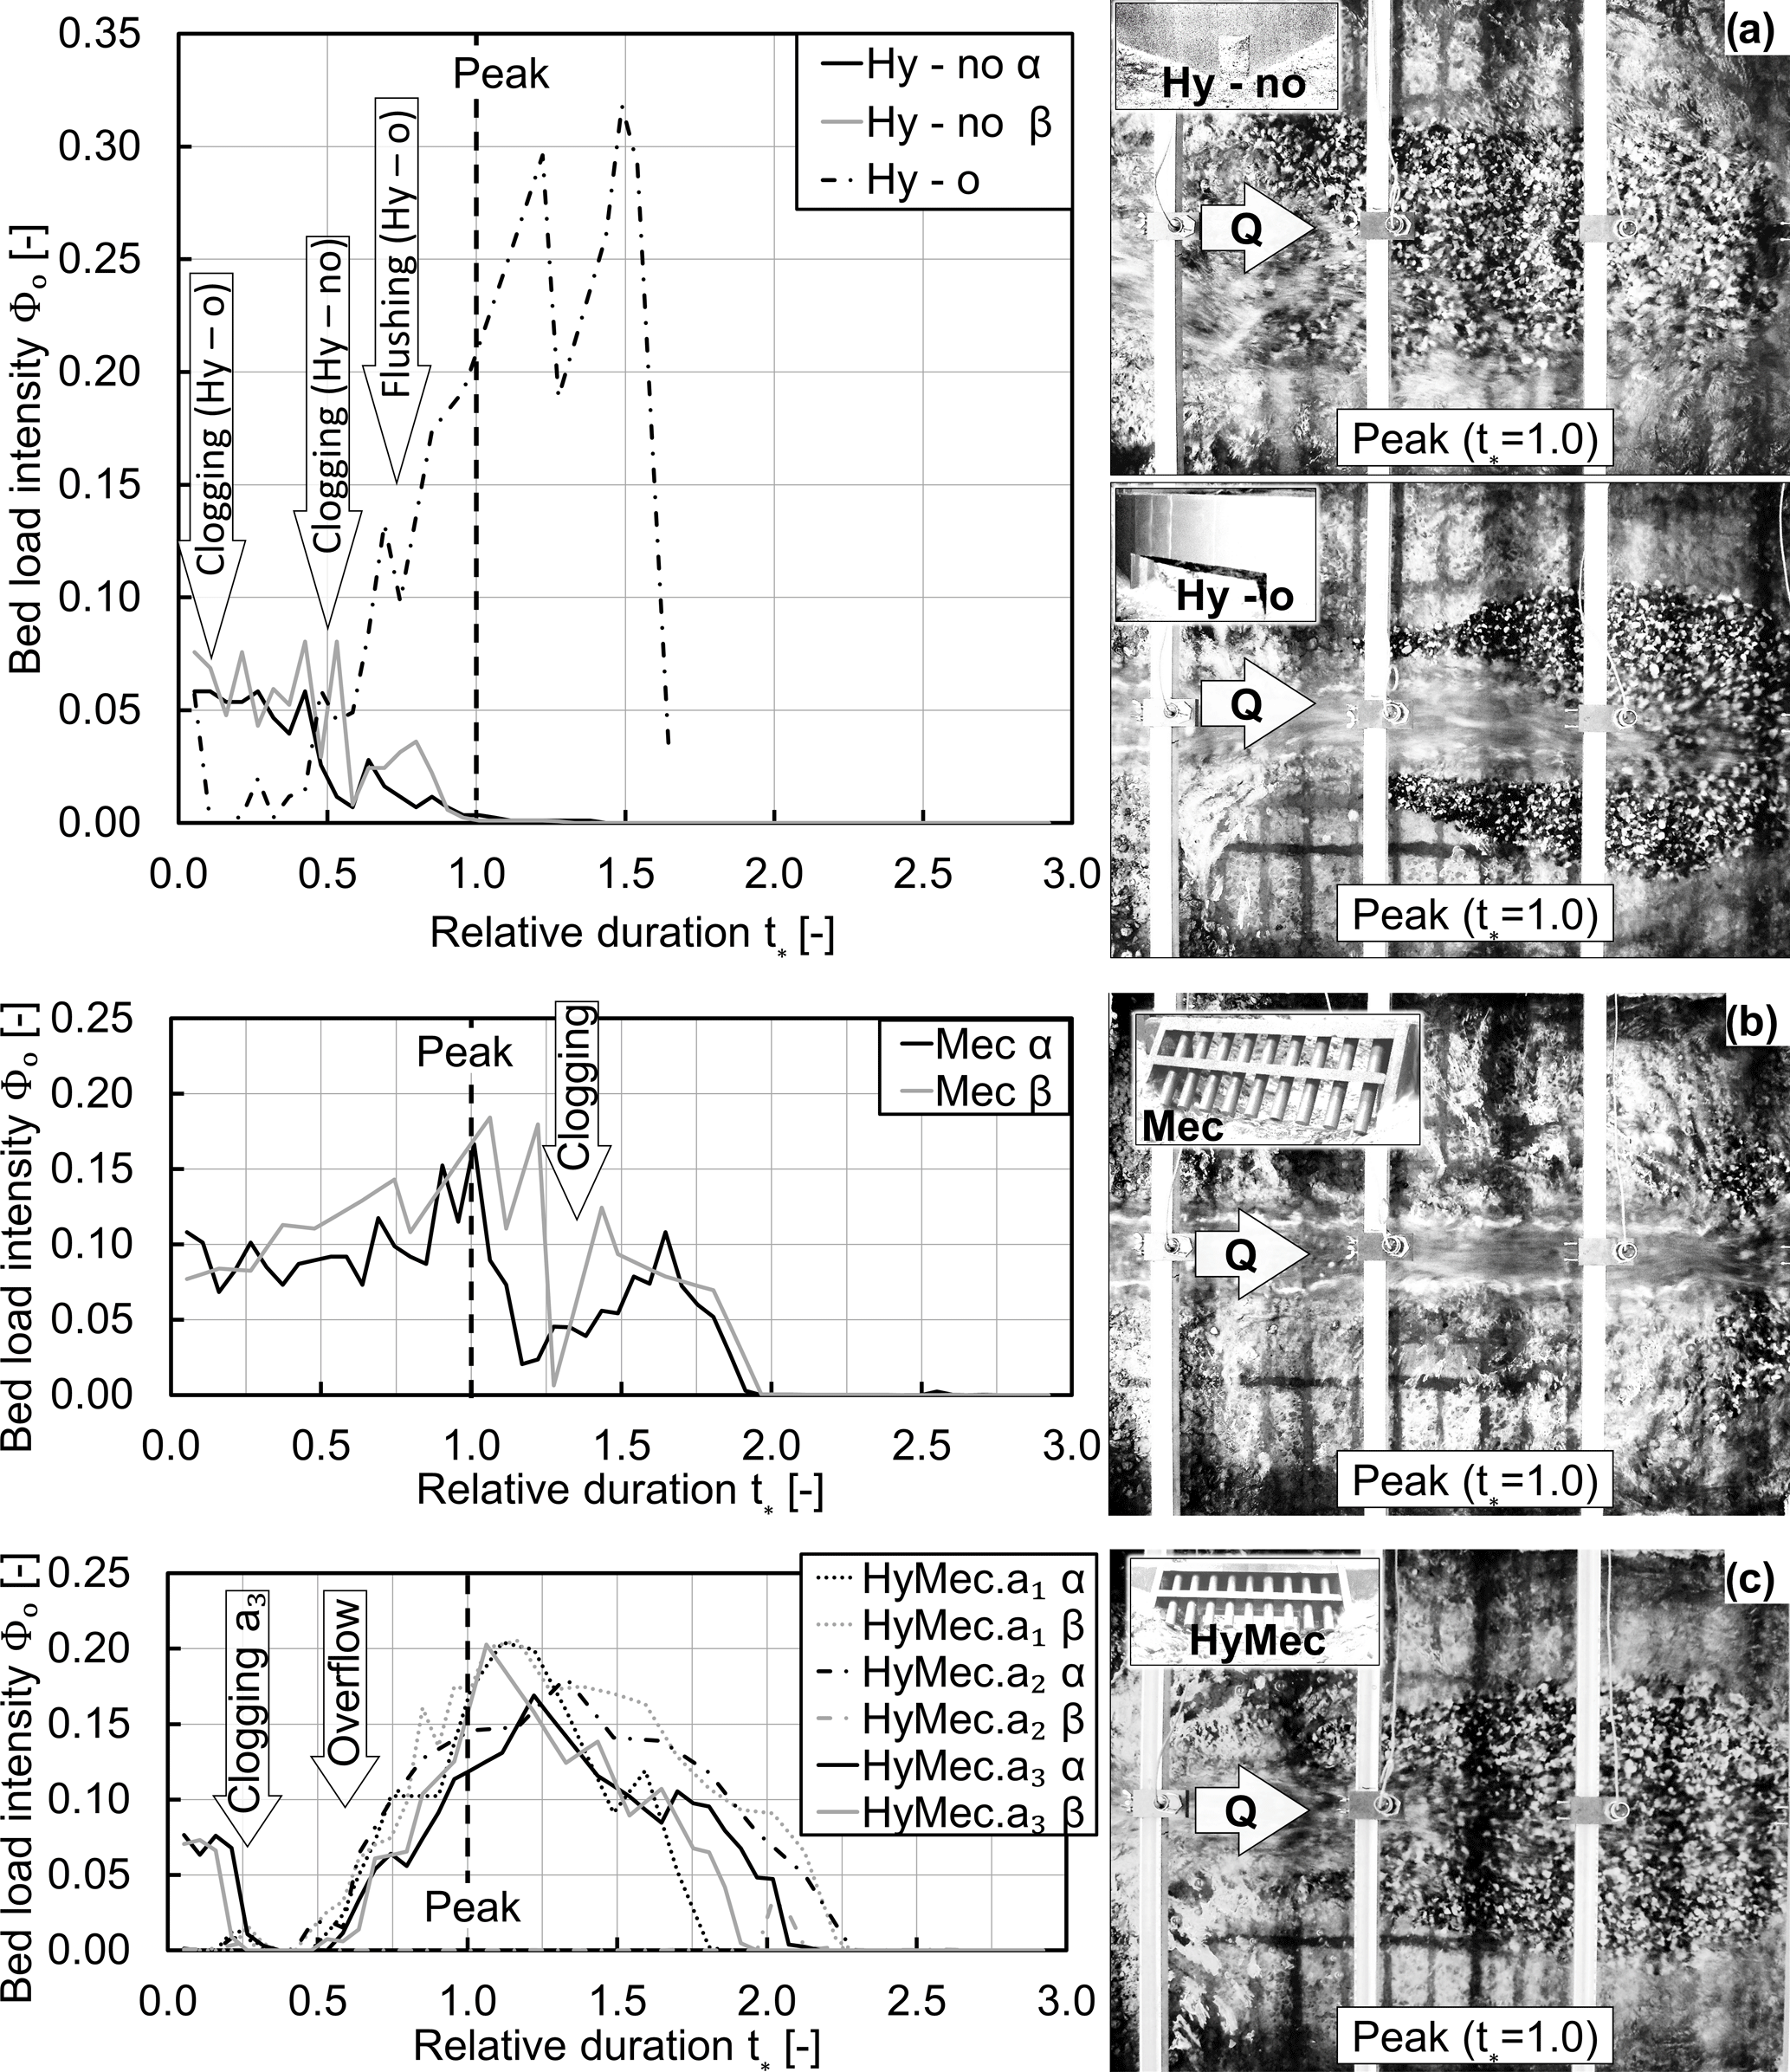
Figure 8The outflowing bed load transport intensity Φo as a of function the relative time t* and for the two repetitive tests α and β. (a) for hydraulic control without barrier overflow (Hy-no) and with barrier overflow (Hy-o); (b) for mechanical control by the bar screen (Mec); and (c) for combined deposition controls (HyMec), i.e. the combination of hydraulic barrier with varying opening heights and upstream superposed bar screen. The top view pictures at the right show the sediment deposits at the flood peak of the α tests.
In case Hy-no (Fig. 8a), the outflowing bed load intensity Φo dropped in both tests (α and β) after a duration of approximately . This drop in Φo corresponds to the hydraulic clogging of the barrier. In parallel, the backwater of the infinitely high barrier increased with increasing discharge (t*< 1) and resulted in a regressive evolution of the sediment deposit in the upstream direction. The corresponding longitudinal evolution of the deposit is reflected in the top view picture of the deposition area (Fig. 8a) at the flood peak. Due to the influence of the deposit, the hydraulic jump could not migrate back in the downstream direction during the falling limb of the hydrograph (t*> 1, Fig. 8a). As a consequence, the sediment flux through the barrier ceased with the flood peak (Φo=0) and the deposit laterally spread toward the banks of the deposition area at the end of the hydrograph.
In case Hy-o, the relative constriction height a* was significantly smaller than previously (2.89 against 11.1 in case Hy-no). Therefore, nearly all of the supplied sediment was retained in the first half of the rising limb (t*< 0.5, Fig. 8a). Accordingly, the outflowing bed load intensity Φo decreased rapidly to zero, but Φo restarted to increase with the second increase of the discharge. The rise in the discharge (cf. Fig. 7) at corresponds to an increase from Q=7 to Q=8.5 L s−1, i.e. the desired threshold value for initiating the barrier overflow. As observed in the top view picture (lower top view picture on Fig. 8a), the sediment flushing started before the flood peak (t*< 1). After the flood peak (), the flushing of nearly all the previously deposited sediment occurred. The observed maximum of Φo=0.32 during the flushing corresponds to approximately 1.4 times the maximum supply rate of Φi=0.23 at the flood peak. A repeated run of this configuration was discarded, due to unwanted sediment flushing observed before the flood peak. In practice, every barrier can be overflowed when the discharge is high enough. However, the comparison of the cases Hy-no and Hy-o shows that barriers with only hydraulic control need to be sufficiently high to avoid such unwanted sediment flushing. Even though reducing the dimensions of the opening in the barrier could decrease the risk of self-flushing, smaller constriction heights or widths were not tested to avoid sediment retention before the bankfull discharge of the guiding channel (5.5 L s−1) was reached.
In case Mec (Fig. 8b), the temporal evolution of the outflowing bed load intensity Φo was similar to the supply intensity Φi (cf. Fig. 7) until the flood peak occurred (). Hence, only marginal sediment deposits close to the barrier can be observed in the top view picture of the deposition area at the flood peak. At a relative flood duration of approximately t*< 1.25, the bar screen was mechanically clogged, and consequently, the outflowing bed load intensity Φo decreased in both tests (α and β) to zero in stages. An elongated deposit in the deposition area was observed at the end of the hydrograph according to descriptions from Campisano et al. (2014) and Piton and Recking (2016a).
In case HyMec (Fig. 8c), the outflowing bed load intensity Φo decreased rapidly to zero for the smaller opening heights a1 and a2. With the largest opening height a3, Φo was similar to the supply intensity Φi in the beginning. The barrier clogged only with the second increment of the discharge and sediment supply at . After the barrier clogging, an elongated deposit developed in layers until it reached the barrier height at for the three considered constriction heights. In consequence, the supplied sediment was transported over the barrier, which is reflected in the evolution of the outflowing bed load intensity Φo, corresponding to the supply intensity Φi (cf. Fig. 7). However, Φo is slightly smaller than Φi, as the deposit enlarged after . This enlarged deposit shape can be observed in the corresponding top view picture of the deposition area (Fig. 8c). The repetitive tests (α and β) resulted in similar outflow rates for the three opening heights.
A major difference in Φo can be observed in the test HyMec.a2 β, where a constant discharge of 5.5 L s−1 with sediment supply was applied prior to the hydrograph, for a duration corresponding to t*, i.e. . This combination of low discharge and sediment supply led to the decelerated clogging of the combined barrier. The consequence was an early evolution of the backwater in an upstream direction, beyond the upper limit of the observation reach resulting in an almost total retention of the sediment supply.
4.2 Volume of sediment deposits in the deposition area
The volumes of the sediment deposits were measured by three redundant tools, namely the laser, the motion-sensing device (Kinect) and the total weight of the deposited sediment measured with the industrial scale. This redundant evaluation was necessary because the scale only gives information about the sediment weight, and the bathymetric data from the motion-sensing device and laser can contain individual measurement errors (Lachat et al., 2015). The motion-sensing device provides a high-resolution bathymetric image of the deposit, but the image required a correction due to distortion and the surface texture. The laser measurements are precise, but the point density is low, which leads to averaging errors in the surface interpolation. For the determination of the deposit volume with both approaches, the bathymetric surface data of the empty deposition area were subtracted from the surface data of the sediment deposits. An example application of the bathymetric recording of the deposit with the motion-sensing device after the test HyMec.a1 α is shown in the Supplement. The bathymetric deposit volume Vdep (Bathymetric) according to both the camera and the laser was then determined using CAD software.
After every hydrograph test, the deposited sediments were flushed (without any barrier) in the filter basket which was weighed with the industrial scale. This weight was divided by the deposit density of 1550 kg m−3 to obtain the according deposit volume Vdep (Scale). The comparison of Vdep (Scale) and Vdep (Bathymetric) was used to evaluate the percentaged error of the bathymetric tools, resulting in an average error of 2.7 % for the motion-sensing device and an average error of 14.8 % for the laser data. The Supplement illustrates the detailed evaluation of the error rates.
The complex application of the centimetre-wise laser measurements was restricted to 16 profiles (approximately 650 points), and therefore, it is less precise than the camera data (in mm, 1.92×10⁶ points). Hence, the motion-sensing device is subsequently used for the analysis of the deposit pattern.
The relative deposit volumes V*, i.e. the ratio of the deposit volumes Vdep and the supply volumes VΣ, are shown in Fig. 9 based on the scale measurements as a function of the test cases. As expected from the results regarding the sediment outflow rates (cf. Fig. 8), the total deposit volume is very small in the case Hy-o, while it is high in the test HyMec.a2 β. The case Hy-no was not evaluated because sediment flushing with additional sediment supply was tested after the hydrograph. However, the graphs of the bed load intensity Φo (Fig. 8a) indicate that V* is close to 100 % in the case Hy-no. The relative deposit volume V* varied in the cases Mec and HyMec between approximately 40 and 55 %, regardless of the presence of the bar screen. In these cases (Mec and HyMec) V* refers to the backwater-driven storage space upstream of the clogged barrier, without the occupation of the entire width of the deposition area. This indicates that the barrier height is essential for the amount of retained sediment, independent of the control type (mechanical and/or hydraulic). However, the moment that the barrier clogs, as a function of t*, is important for the attenuation of sediment peak flows, as the comparison between Fig. 8b and c shows.
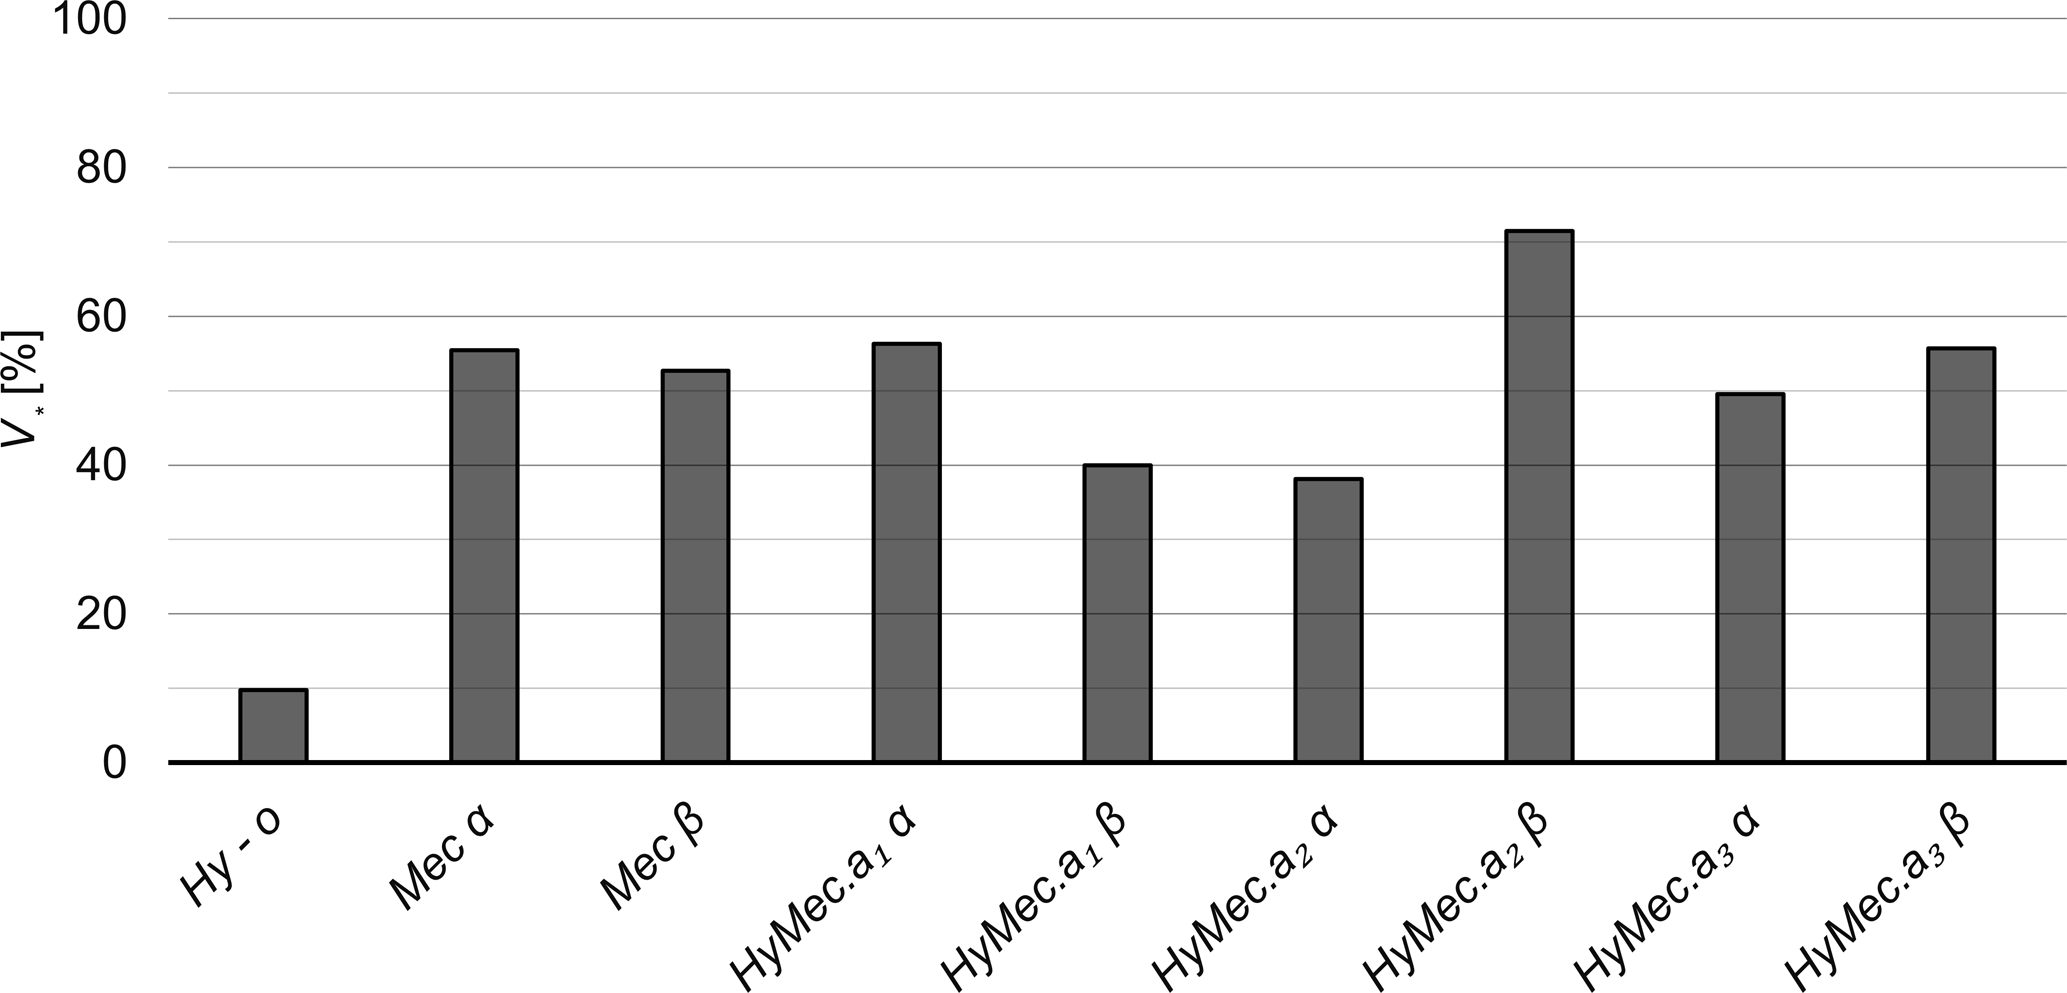
Figure 9The ratio V* (in %) of the deposit volume Vdep and the supply volume VΣ after the repetitive hydrograph tests α and β for the cases of the non-overflowed flow constriction (Hy-no), overflowed bar screen (Mec) and the combination of overflowed bar screen superposed to the flow constriction (HyMec), with varying opening heights .
4.3 Deposition patterns
The final shapes of the sediment deposits were recorded at the end of every hydrograph test. According to the evolution of the sediment outflow (cf. Fig. 8), the deposition patterns of the repetitive α and β tests were almost similar. Therefore, the deposition patterns obtained by the motion-sensing device are compared in Fig. 10 with top view pictures, only for the α tests. Moreover, only one representative plot (test HyMec.a3 α) of the relative deposit height Z* is shown for the three constriction heights applied in the case HyMec, as constriction height variation had no measurable effect on the sediment deposit.

Figure 10Deposition patterns at the end of the hydrograph tests; left column: top view pictures; right column: bathymetric records, (a) in case Hy-no (α test), with non-overflowed hydraulic barrier; (b) in case Mec (α test), with bar screen for mechanical control only; and (c) case HyMec (test a3α), with combined hydraulic barrier and upstream superposed bar screen.
Similar to sediment outflow rates (cf. Fig. 8) and relative deposit volumes (cf. Fig. 9), it can be observed that the deposit was wide and deep in the case Hy-no. The deposition patterns of the cases Mec (mechanical barrier only) and HyMec (combined barrier) differed only marginally.
According to the relative deposit volumes V* (cf. Fig. 9), the volume and deposition pattern differences between the tests HyMec.a1 α and HyMec.a3 β are small. Both tests corresponded to the minimum and maximum tested constriction heights a1 and a3, respectively. In addition, the deposit height was slightly lower in the tests HyMec.a1 β, HyMec.a2 α and HyMec.a3 α. These observations indicate that there is no evident effect of the (relative) constriction height on the deposition pattern within the tested range of a*(min) =2.89 and a*(max) =3.44. Moreover, this observation is in agreement with the sediment outflow rates (cf. Fig. 8c), where the time variation curves of Φo are very close to each other.
The deposition pattern after case Hy-o was not recorded, as there were only small sediment remainders on the overbanks, as shown in Fig. 11.
4.4 Sediment flushing
Figure 12 shows the evolution of the outflowing bed load intensity Φo for flushing in the case Hy-no after the hydrograph tests α and β, as a function of the multiple duration t* of the hydrograph rising limb. Although similar tests were run for the case HyMec.a2 (combined barrier), these results are not shown here because it was impossible to remobilise sediment from the deposit (Φo is a horizontal zero-line).
The maximum possible sediment volume (model limit: 727 kg) was supplied at the beginning, followed by a phase of clear water flow for both flushing attempts (α and β). The flushing of test Hy-no α showed some sheet-wise grain mobilisations from the deposit between and when the discharge was decreased (Fig. 12, Hy-noα). Only minor morphological activity was observed after the discharge decrease. Also a sudden, arbitrary increase in the discharge with subsequent decrease toward the end of the experiment did not remobilise the grains. The flushing of test Hy-noα was stopped after a duration of more than 12 times the duration of the rising limb of the hydrograph, as no further morphological activity was observed.
The flushing of the test Hy-noβ continued for 26 times the duration of the rising limb of the hydrograph, with several trials of discharge variations. Similar to the α test, the maximum possible sediment volume was supplied at the beginning. After every step of discharge decrease, the sheet-wise flushing of sediment from the tip of the deposit was observed. The largest of these flushings reached an outflow intensity Φo corresponding to the supply peak of the hydrograph (Fig. 12, Hy-no β and Fig. 7). These flushings were mainly observed when the discharge conditions in the flow constriction changed from pressurised to free surface flow.
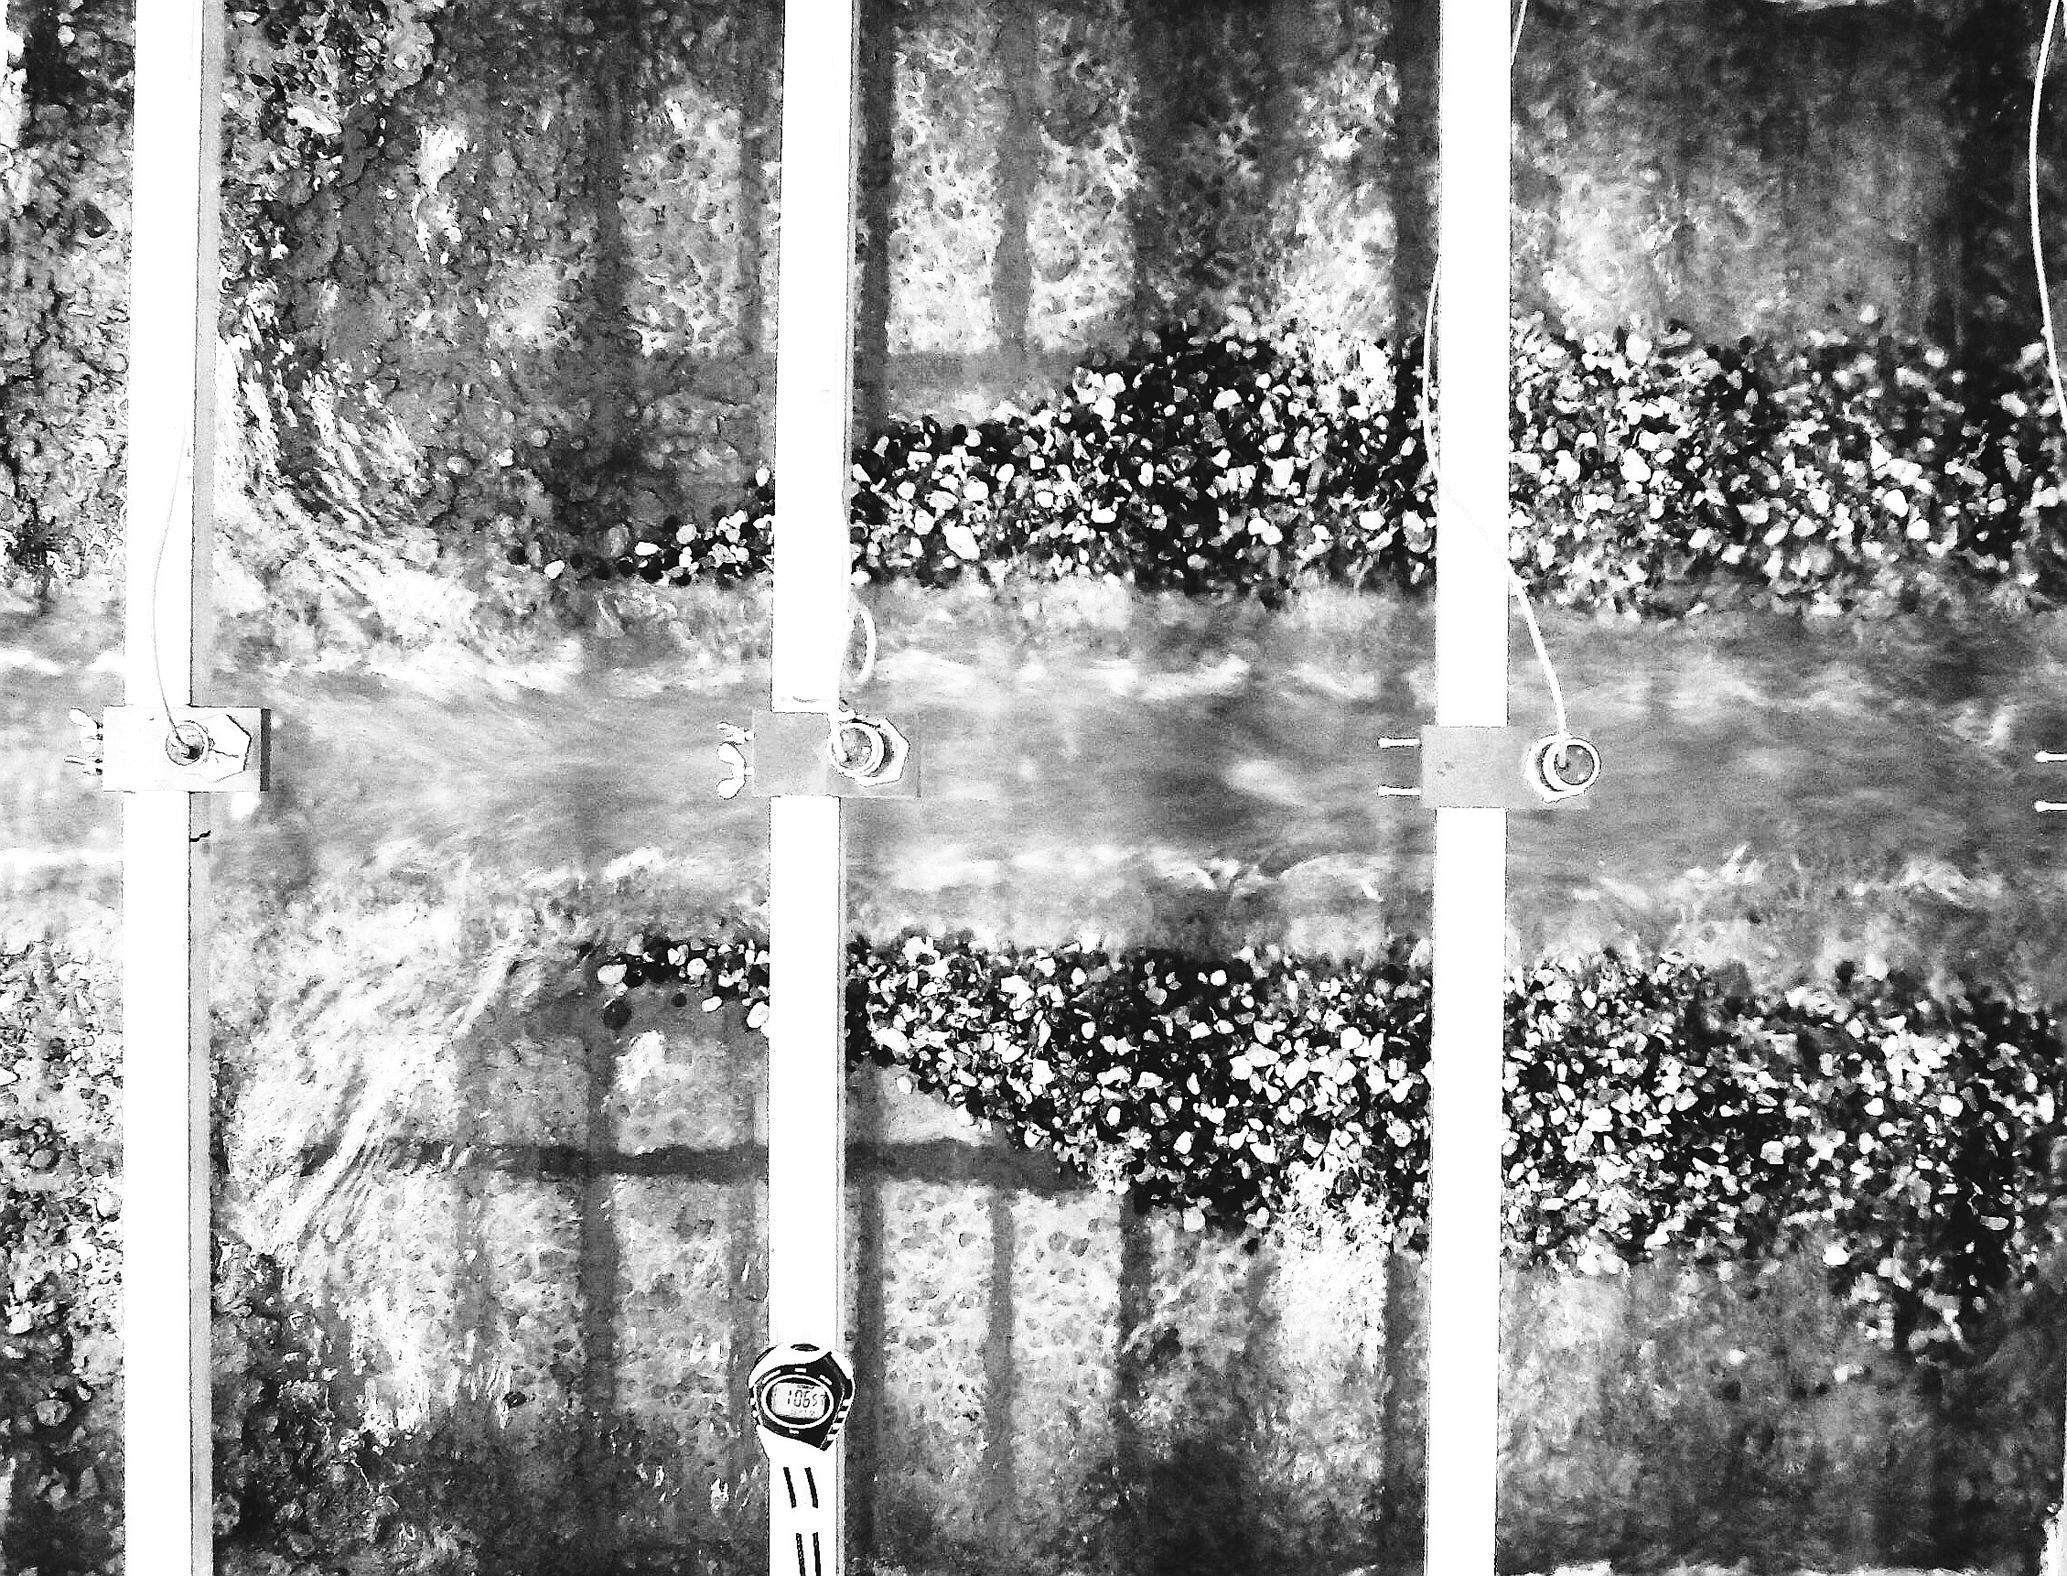
Toward the end of the β test, from to , an attempt was made to induce the flushing of the guiding channel. This was achieved by the experiential, successive removal of the upper layer of the deposit along the axis of guiding channel. The experientially created depression had a depth of approximately 2⋅D84 and a width of approximately 0.1 m, corresponding to the bottom width of the guiding channel. This experiential depression was created in steps, beginning at the tip of the deposit (downstream end), then continuing the excavation in the upstream direction. However, only marginal morphological activity was observed, unless the tail of the deposit (upstream end), i.e. the hydraulic jump, was directly connected with the opening through the depression. Small meanderings were observed at the beginning of the flushing through the depression (Fig. 13a–c). In the following, the depression incised from the upstream towards the downstream direction (Fig. 13d–e), until the guiding channel was completely cleared (Fig. 13f). The relative discharge during the flushing of the guiding channel was , i.e. . A comparison of the maximum sediment outflow intensity Φo with the Smart and Jaeggi (1983) formula applied to the geometry of the guiding channel showed good agreement as already observed in previous studies (Schwindt et al., 2018).
5.1 Sediment deposition
The elongated deposits at the end of the hydrograph tests were typical for the overflowed barrier (cf. Fig. 10b and c), where the deposition control functioned as desired without unwanted flushing (Mec and HyMec). The high, non-overflowed barrier (Hy-no) caused a wider and longer spread of the deposit (cf. Fig. 10a), which is in agreement with the observations from Zollinger (1983). The storage volume upstream of overflowed barriers may increase when the deposition slope Sdep is additionally considered. Sdepcan be estimated as a function of the channel slope So and it is typically in the range of for small floods and for large floods with high sediment concentration (D'Agostino, 2013; Osti and Egashira, 2013; Piton and Recking, 2016a). The deposition slopes observed in the present study can be obtained by the relative deposit height Z* at the longitudinal section at the axis of the guiding channel (). Linear regression curves have been established in Figure 14 to estimate Z* as a function of X* in the empirically determined aggradation zone upstream of the barriers. Thus, the slope of the regression curves corresponds to the deposition slope Sdep in the considered aggradation zones. This evaluation results in Sdep(Hy-no) =6.5 %, Sdep(Mec) =12 % and Sdep(HyMec) =9.5 %. Compared with the bottom slope So of the guiding channel, these values correspond to Sdep(Hy-no) , which is significantly higher than the values corresponding to the above-mentioned literature.
The deposition slope can also be approached using the equilibrium slope, assuming that the sediment supply and erosion are balanced on a reach scale. Zollinger (1983) proposed applying the Smart and Jaeggi (1983) formula with respect to zero-transport conditions (Φo=0). This approach was not possible for these experiments, as the clear water depth was highly variable and not measurable due to the shallow flow over the changing sediment deposits. As an alternative, a relationship for the equilibrium slope was applied, as proposed by (Johnson, 2016) as follows:
Equation (2) was evaluated by using the peak discharge of the hydrograph and the bed load transport intensity over the barrier (HyMec). The width w was substituted by the barrier spill width of 0.234 m and a value of 0.05 was considered for the dimensionless bed shear stress . This results in equilibrium slopes between 12 and 15 % for the HyMec tests. Applying Eq. (2) at the instant when the sediment transport across the barrier ceased, results in very small values of Sdep< 1 %. Thus, Eq. (2) is not appropriate for estimating the deposition slope. In practice, it is safer to assume small values of the deposition slope for estimating the maximum storage upstream of the barrier. Such a safe estimate can be made by the relationship .
The deposit shape, independent of the barrier height and type, is in practice often confined by the terrain morphology. Thus, the deposition area of such confined sediment traps corresponds to the riverbed and its overbanks. Such elongated, natural deposition areas are more exposed to sediment flushing because of the higher concentration of the stream power over the width of the deposition area (Leys, 1976; Zollinger, 1983).
5.2 Sediment flushing
The flushing of the non-overflowed barrier (Hy-no) was not possible without artificial intervention. However, the overflowed hydraulic barrier (Hy-o) is prone to unwanted flushing, as it was observed during the hydrograph. The safety against unwanted flushing through such overflowed permeable barriers may also be increased by reducing the dimensions of the opening, but smaller constriction dimensions are not favourable regarding the eco-morphological river continuity. Thus, the application of permeable barriers with very limited height solely for the hydraulic control of bed load retention is not recommendable for the practice.
The height of the overflowed permeable barrier in the case Hy-o corresponded to the theoretic cross section averaged energy head (clear water flow) in the guiding channel with respect to the target discharge for the initiation of overspill of the barrier. Naturally, these observations show that the maximum possible backwater depth caused by such barriers is a decisive factor for the reduction of the energy slope upstream of the barrier. For this purpose, former studies considered only the dimensions of the opening in the barrier (Schwindt et al., 2018) but not the barrier height. The present study differentiates only between infinite and limited barrier heights, but indicates that future works need to consider systematically the influence of the barrier height on sediment flushing through hydraulic control openings.
Sediment flushing through the mechanically clogged bar screen was impossible, as shown by the attempts after the HyMec.a2 hydrograph tests. The flushing attempts through the non-overflowed hydraulic barrier (Hy-no) have shown that the tip of the deposit repetitively collapses, when the flow conditions in the opening of the barrier pass from pressurised to free surface flow. Such observations were already made in earlier studies (Zeller, 1973).
According to previous studies, the flushing processes of sediment traps is a succession of the discharge-driven reshaping of a network of sub-channels in the deposition area. The continuous reshaping led to a gradual incision of the deposit along the longitudinal axis of the initial riverbed (Zollinger, 1983; Armanini and Larcher, 2001; Busnelli et al., 2001; Piton and Recking, 2016a). This observation was not made in the present study, as apparent grain imbrication caused the armouring of the surface layer of the deposit. The larger relative grain size in this study compared with earlier studies may also be an explanation for the immobility of the deposit observed here. Only a trial of artificial breaking of the armouring layer along the longitudinal axis of the guiding channel enabled sediment flushing (cf. Fig. 13). The subsequent morphological activity caused further incision of the initiated channel, with only minor meandering. Once the guiding channel was cleared, no further lateral or vertical erosion was possible. Thus, the guiding channel directs not only sediment-laden flow through the sediment trap up to small flood discharges for which no sediment retention is required, but it also enables the controlled, desired flushing of previously retained sediment through a hydraulic control barrier. The triggering of such desired sediment flushing requires the prior removal of mechanical logjams. The remaining deposits have to be excavated and may be replenished downstream at suitable locations for improving sediment transport dynamics (Battisacco et al., 2016).
Eventually, sediment flushing is desirable in controlled quantities to reduce the sediment volume that requires its mechanical removal after a flood event. Uncontrolled sediment flushing in large quantities can cause important damages in downstream reaches (Schwindt et al., 2017a). Therefore, sediment transfer through sediment traps is worthwhile as long as floods do not represent a hazard to downstream reaches but sediment flushing is undesirable at higher floods. The concept in this study fulfils both requirements.
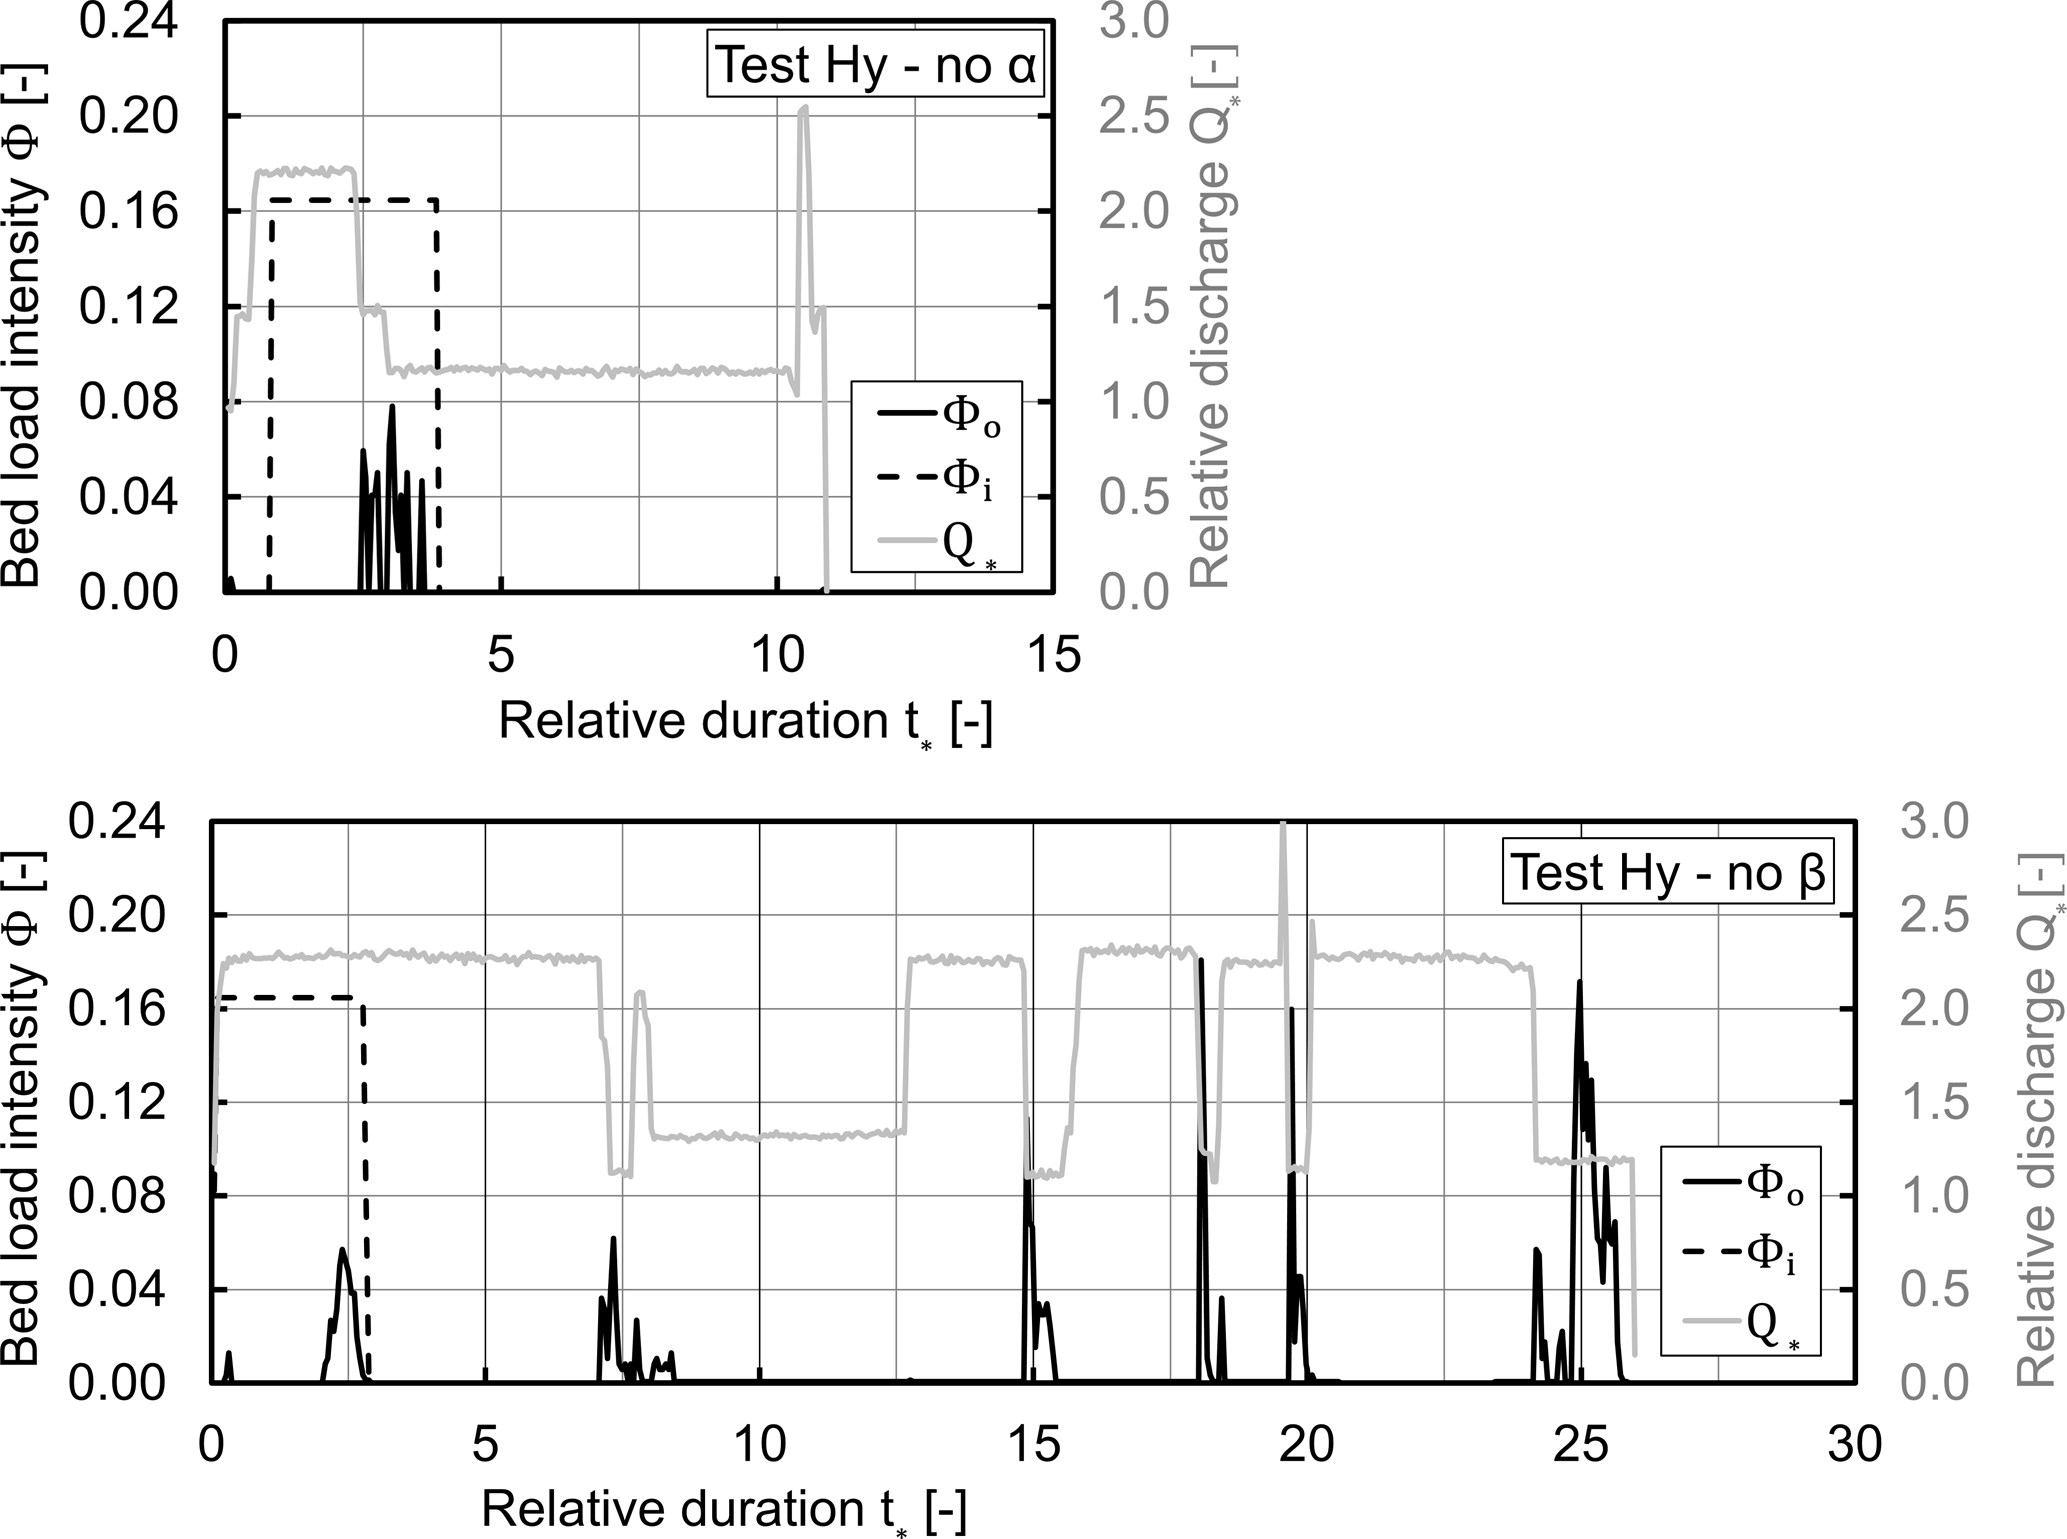
Figure 12Evolution of the outflowing bed load intensity Φo for the sediment flushing attempts after the α and β hydrograph tests with non-overflowed hydraulic barrier (Hy-no), with indication of the relative discharge Q* and bed load supply intensity Φi, as a function of t*.
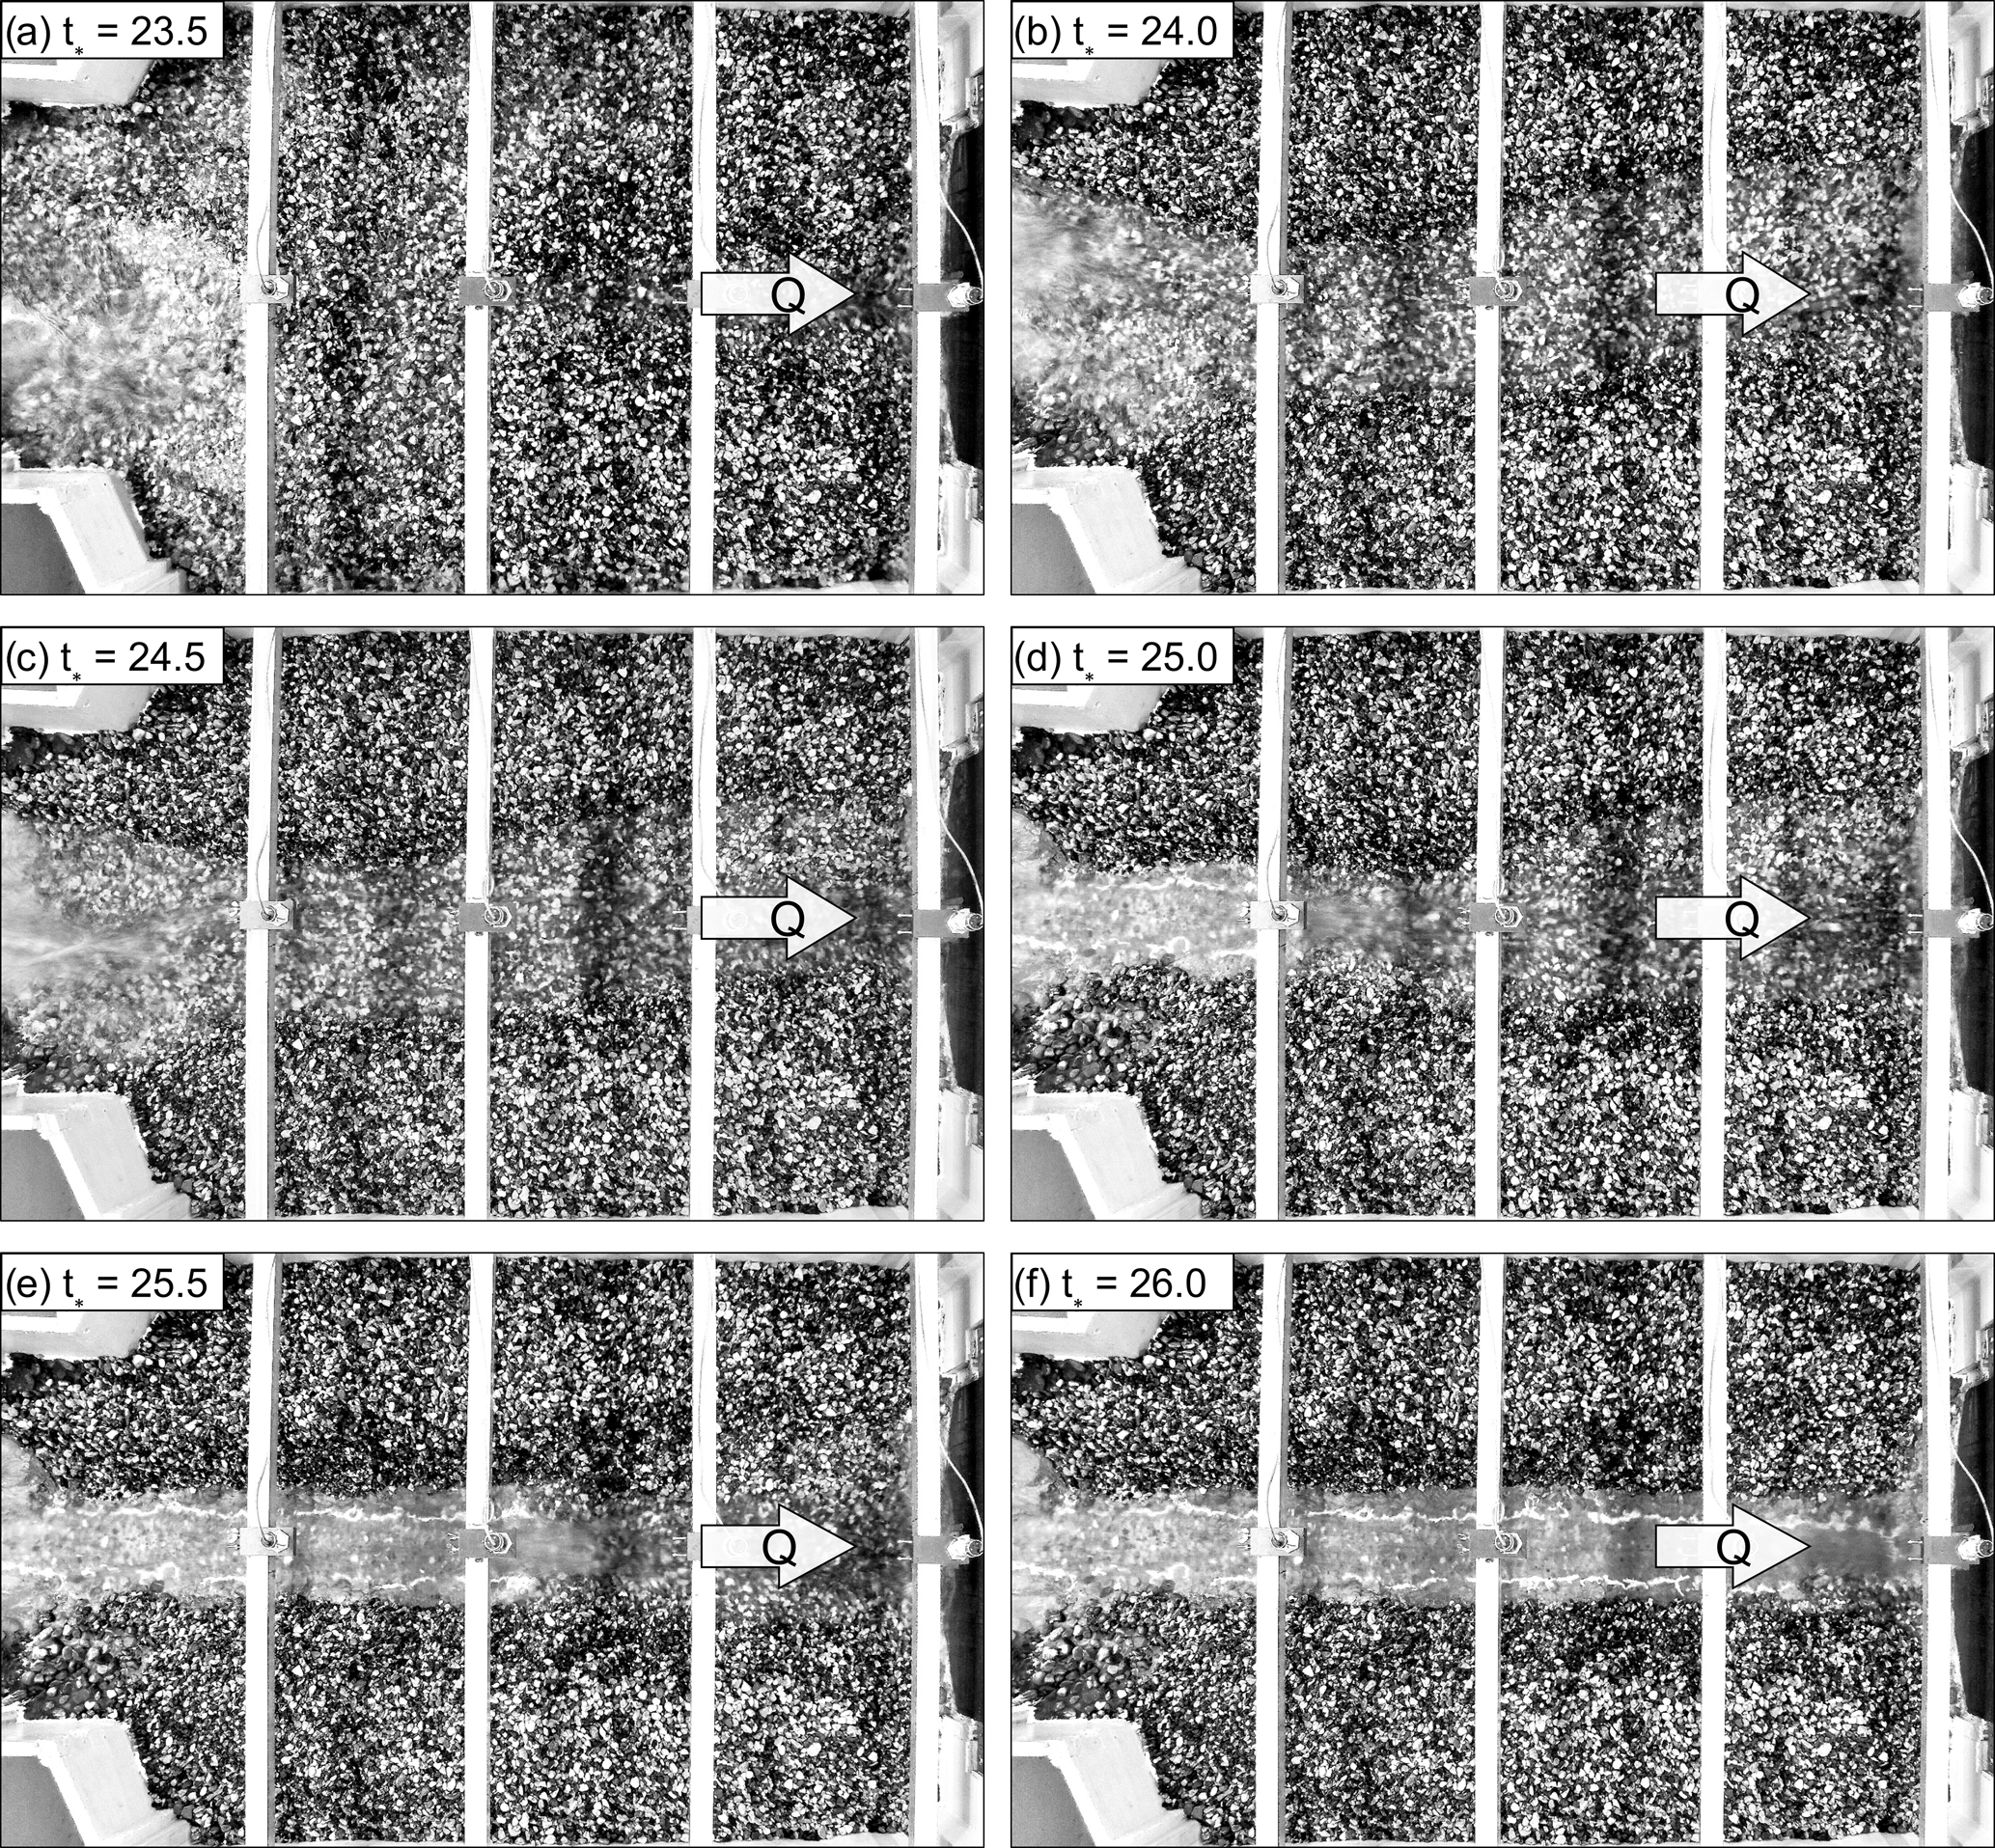
Figure 13Controlled flushing of the guiding channel after the hydrograph test Hy-no β, in time lapses of , starting from , after creating gradually an artificial depression above the guiding channel, until , where the guiding channel was completely cleared.
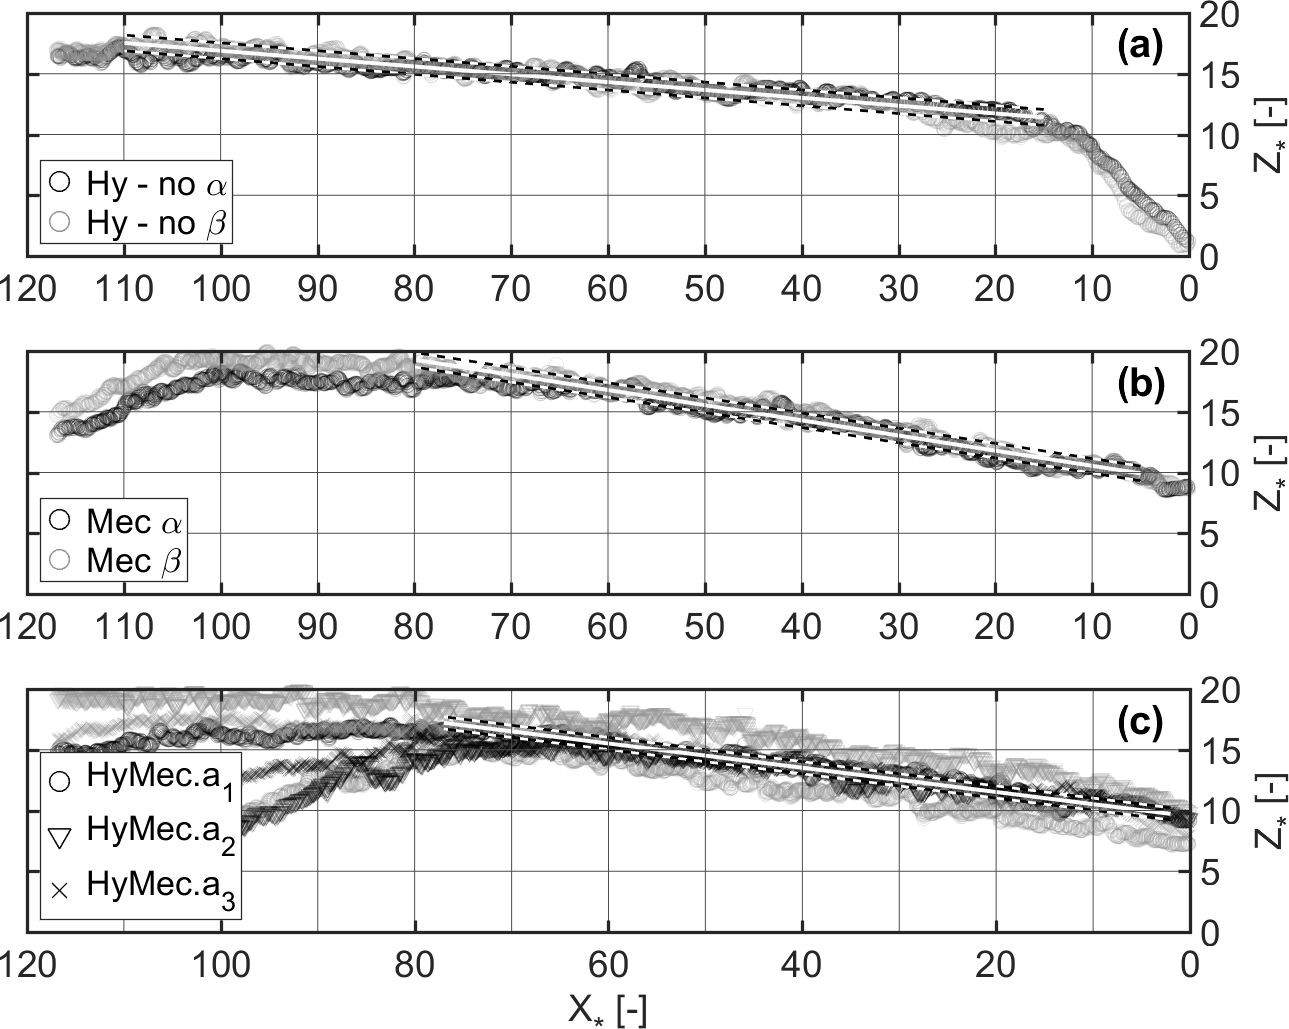
Figure 14Relative deposit height Z* at the longitudinal axis of the guiding channel () after the repetitive α and β hydrograph tests; upstream of (a) the non-overflowed hydraulic barrier (Hy-no); (b) the mechanical barrier only (Mec); and (c) the combined barrier (HyMec) with varying opening heights . The linear regression curves of the aggradation zones are shown (white lines), with indication of the corresponding 68 % confidence intervals (dashed lines).
5.3 Eco-morphological aspects
The guiding channel enables the undisturbed conveyance of sediment-laden (flood) discharge until its bankfull discharge is reached. Therefore, the opening in the hydraulic barrier should not affect the flow before the bankfull discharge of the guiding channel is reached. Previously established formulae for estimating the discharge capacity of the opening in the hydraulic barrier can be used to determine the extent of backwater due to the barrier (Armanini and Larcher, 2001; Armanini et al., 2006; D'Agostino, 2013; Piton and Recking, 2016a; Schwindt et al., 2017b). These formulae consider upstream flow conditions, i.e. the flow conditions in the guiding channel, and can be used to design the opening in a way that it does not cause backwater until the bankfull discharge of the guiding channel is reached. Thus, the opening width should at least correspond to the bottom width of the guiding channel.
The guiding channel should be designed based on the dominant, morphologically effective discharge in view of the dynamic evolution of downstream reaches. The roughness of the laboratory flume was relatively smooth with a skin friction-type, discharge-dependent roughness corresponding to a Manning's n of 0.02. The reproduced situations in the experimental set-up refer to flood situations with high relative submergence and low roughness. The skin friction is higher at lower discharges that are appropriate for fish migration. Therefore, the hydraulic design of the guiding channel should also consider normal, fish-migration specific discharges to provide appropriate conditions for fish migration, in terms of the required flow depth and maximum velocity (Baigún et al., 2012; Tamagni, 2013; DWA, 2014; Gisen et al., 2017). This can be achieved through nature-oriented trapezoidal cross section geometry, with a rough channel bottom constituted by large distributed boulders and a sufficient channel width.
The presence of woody material is important for the natural eco-morphological diversity of downstream reaches (Senter and Pasternack, 2011; Gilvear et al., 2013). However, the retention of large wood material is sometimes necessary when trunks or rootstocks cannot pass downstream bottlenecks at urbanised river reaches (Lassettre and Kondolf, 2012; Mazzorana et al., 2012). Therefore, the trapping of wood is desirable when large and infrequent floods occur (Comiti et al., 2016). Appropriate measures for large wood retention were proposed and discussed by Lange and Bezzola, 2006, Comiti et al., 2012 and Schmocker and Weitbrecht, 2013.
5.4 Application and limits
Piton and Recking (2016a) present a 13-step approach for the design of sediment traps and check dams: Steps 1–3 describe the identification of relevant torrential hazards, the structure location and retention objectives. Steps 4–11 represent an iterative design of the shape, size and bottom slope of the deposition area, combined with an open check dam. Steps 12 and 13 address the design of spillways and scour protection measures. In this framework, this study relates to the iterative design of the deposition area and the open check dam, where the implementation of a guiding channel is additionally recommended (i.e. after step 5 in Piton and Recking, 2016a). The verification of the retention objectives in terms of mechanical clogging and the hydraulic functionality in terms of the discharge capacity and local head losses in the present study is similar to steps 8 and 9 presented in Piton and Recking (2016a). However, the functionality in terms of mechanical clogging and hydraulically induced sediment retention is triggered in this study by two different measures in the shape of a bar screen and an open check dam. Therefore, both elements require differentiated verification of their functionality.
This study relies on the assessment of bed load in threatened downstream reaches using the concept of travelling bed load (Piton and Recking, 2017) to identify the relevant grain size. Moreover, the dominant discharge is above mentioned to evaluate sediment transport. In a natural flow regime, the dominant discharge can be very high in strongly armoured mountain rivers or channels confined by bedrock outcrops (Hassan et al., 2014). In such rivers, it may be preferable to forgo the permeability of sediment traps, as the transport of sediment is related to exceptional floods. In these cases, the installation of barriers combining mechanical and hydraulic controls, as discussed here, is also advantageous to ensure the fail-safe sediment retention. The design of the barrier should refer to the sediment characteristics of the catchment area and the flood discharge which potentially endangers urban downstream reaches.
In the context of this study, the dominant discharge refers to the bankfull discharge of the guiding channel, which is also a function of the admissible maximum bed load transport capacity at downstream bottlenecks (e.g. bridges). In practice, the dominant discharge, the admissible transport capacity and the natural bankfull discharge are three different factors (Crowder and Knapp, 2005; Lenzi et al., 2006). However, for the promotion of morphodynamics, the bankfull discharge of the guiding channel corresponds to the dominant discharge, even though this is not the natural bankfull discharge. Thus, to fit the real needs of land protection with limited impacts on the river ecology in terms of the continuity of sediment transport, permeable sediment traps make sense if they are combined with stream restoration to increase the downstream admissible bed load transport capacity.
The flood duration of the hydrograph approximately corresponds to flood peaks of several hours in nature. Longer flood durations have shown more pronounced sediment retention (higher relative retention volumes) in preliminary experiments.
The small ratio of 2.3 between the peak discharge and the initial discharge of the flood hydrograph seems low. It can be argued that an annual flood is not yet considerable enough to trigger sediment retention. Therefore, the bankfull discharge of the guiding channel should be higher than an annual flood. Thus, regarding the experimental study, an annual flood should be smaller than the initial discharge of the flood hydrograph. The 132 dataset used for this study (Schwindt, 2017) shows an average ratio between 100 years and an annual flood discharge of approximately 2.8. In this context, the applied ratio of 2.3 between initial and peak discharge in the experiments can be considered plausible.
The concept of typical sediment traps, consisting of a widened deposition area with a downstream deposition control barrier (open check dam), is enhanced by a guiding channel and tested with different partially open barrier types.
The guiding channel ensures sediment transport through the deposition area, without any deposition, up to its bankfull discharge. Moreover, the guiding channel serves as the flow control in the deposition area, which is important to ensure the triggering of sediment retention when floods become hazardous. Sediment retention is triggered by an open barrier at the downstream end of the guiding channel once the discharge becomes hazardous. At this point, the bankfull discharge of the guiding channel is exceeded. The sediment retention due to the barrier is differentiated here between hydraulic and mechanical controls, as well as the combination of both.
The experimental study of the guiding channel, combined with the barrier for hydraulic and/or mechanical controls, based on a generic hydrograph with occasional, subsequent flushing shows the following:
-
The guiding channel fulfils its purpose of promoting the river continuity until its bankfull discharge is exceeded.
-
Overflowed barriers with only hydraulic control are susceptible to unwanted sediment flushing (self-cleaning) during floods.
-
Unwanted sediment flushing (self-cleaning) is prevented by combining the hydraulic and mechanical controls of triggering sediment retention.
-
Partial, desired sediment flushing through hydraulic control barriers after a flood can be artificially enabled.
Thus, maintenance works and morphological impacts in downstream reaches because of excessive sediment retention are reduced to a minimum unless important floods occur. The maintenance of sediment traps after important floods still remains indispensable but the frequency and the extent of dredging reduce when a guiding channel conveys the sediment up to small, non-hazardous and frequent floods. The role of wood in the obstruction of open check dams remains a research opportunity for future work.
The experimental data are published in the Appendix of the PhD thesis of Sebastian Schwindt (2017).
| A | Flow cross section (m3) |
| a* | Relative constriction height (–) |
| b | Constriction width (m) |
| b* | Relative constriction width (–) |
| C | Chézy flow resistance coefficient (m1∕2 s−1) |
| Dxy | Grain diameter of which xy % of the mixture are finer (m) |
| g | Gravity acceleration (m s−2) |
| m | Channel bank slope (–) |
| p1∕p2 | Coefficients of linear regression curve (–) |
| Q | Water discharge (m3 s−1) |
| Q* | Discharge relative to bankfull channel capacity (–) |
| Qb,i | Bed load supply rate (kg s−1) |
| Qb,o | Bed load outflow rate (kg s−1) |
| Sdep | Deposition slope (–) |
| So | Bottom slope (–) |
| s | Ratio of grain and water density (–) |
| t+ | Duration of rising hydrograph limb (s) |
| t− | Duration of falling hydrograph limb (s) |
| t* | Duration, relative to the rising hydrograph limb (–) |
| V* | Percentaged deposit volume, relative to hydrograph supply (%) |
| Vdep | Volume of sediment deposits (m3) |
| VΣ | Sediment supply volume during hydrograph (m3) |
| w | Channel bottom width (m) |
| x | Channel axis, pointing in the upstream direction (m) |
| X* | Dimensionless channel axis (–) |
| y | Lateral axis, pointing toward the right bank (m) |
| Y* | Dimensionless lateral axis (–) |
| z | Vertical axis, pointing against gravity acceleration vector (m) |
| Z* | Dimensionless vertical axis (–) |
| Φi | Bed load supply intensity (–) |
| Φo | Outflowing bed load transport intensity (–) |
| ν | Kinematic viscosity (m2 s−1) |
| ρf | Water density (kg m−3) |
| ρs | Grain density (kg m−3) |
| Deposit density (kg m−3) | |
| Shields-parameter (–) | |
The supplement related to this article is available online at: https://doi.org/10.5194/nhess-18-647-2018-supplement.
The authors declare that they have no conflict of interest.
This work is funded by the Swiss Federal Office for the Environment (SFOEN)
under the Sediment and Habitat Dynamics research project. Giorgio Rosatti
and Guillaume Piton contributed to the constructive exchange of ideas.
Further thanks go to Fritz Zollinger, Daniela Nussle and Gian Reto Bezzola
for kindly allowing us to use their illustrations as models our for figures.
In addition, we thank Francesco Comiti and the two anonymous reviewers who
helped to improve our paper with their constructive and valuable comments.
Edited by: Heidi Kreibich
Reviewed by: Francesco Comiti and two anonymous referees
Allan, D. J. and Castillo, M. M.: Stream Ecology, Springer, Dordrecht, the Netherlands, 436 pp., 2007.
Armanini, A. and Larcher, M.: Rational criterion for designing opening of slit-check dam, J. Hydraul. Eng., 127, 94–104, https://doi.org/10.1061/(ASCE)0733-9429(2001)127:2(94), 2001.
Armanini, A., Dalri, C., and Larcher, M.: Slit-Check Dams for Controlling Debris Flow and Mudflow. Presented at the International Symposium Disaster Mitigation of Debris Flows, Slope Failures and Landslides, Universal Academy Press, Inc., 141–148, 2006.
Armanini, A., Dellagiacoma, F., and Ferrari, L.: From the check dam to the development of functional check dams, in: Fluvial Hydraulics of Mountain Regions, Springer-Verlag, 331–344, https://doi.org/10.1007/BFb0011200, 1991.
Baigún, C. R. M., Nestler, J. M., Minotti, P., and Oldani, N.: Fish passage system in an irrigation dam (Pilcomayo River basin): When engineering designs do not match ecohydraulic criteria, Neotrop. Ichthyol., 10, 741–750, https://doi.org/10.1590/S1679-62252012000400007, 2012.
Bain, M. B., Hughes, T. C., and Arend, K. K.: Trends in Methods for Assessing Freshwater Habitats, Fisheries, 24, 16–21, https://doi.org/10.1577/1548-8446(1999)024<0016:TIMFAF>2.0.CO;2, 1999.
Battisacco, E., Franca, M. J., and Schleiss, A. J.: Sediment replenishment: Influence of the geometrical configuration on the morphological evolution of channel-bed, Water Resour. Res., 52, 8879–8894, https://doi.org/10.1002/2016WR019157, 2016.
Bezzola, G. R., Sigg, H., and Lange, D.: Schwemmholzrückhalt in der Schweiz [Driftwood retention in Switzerland], Proceedings of INTERPRAEVENT, International Research Society Interpraevent, 29–40, 2004.
Brandt, S. A.: Classification of geomorphological effects downstream of dams, Catena, 40, 375–401, https://doi.org/10.1016/S0341-8162(00)00093-X, 2000.
Brown, C. B.: Discussion of “Sedimentation in reservoirs” by B. J. Witzig, Proc. Am. Soc. Civ. Eng., 69, 793–815, 1943.
Buffington, J. M. and Montgomery, D. R.: Effects of supply on surface textures of gravel-bed rivers, Water Resour. Res., 35, 3523–3530, https://doi.org/10.1029/1999WR900232, 1999.
Busnelli, M. M., Stelling, G. S., and Larcher, M.: Numerical Morphological Modeling of Open-Check Dams, J. Hydraul. Eng., 127, 105–114, https://doi.org/10.1061/(ASCE)0733-9429(2001)127:2(105), 2001.
Campisano, A., Cutore, P., and Modica, C.: Improving the Evaluation of Slit-Check Dam Trapping Efficiency by Using a 1D Unsteady Flow Numerical Model, J. Hydraul. Eng., 140, 04014024, 1–11, https://doi.org/10.1061/(ASCE)HY.1943-7900.0000868, 2014.
Castillo, C., Pérez, R., and Gómez, J. A.: A conceptual model of check dam hydraulics for gully control: efficiency, optimal spacing and relation with step-pools, Hydrol. Earth Syst. Sci., 18, 1705–1721, https://doi.org/10.5194/hess-18-1705-2014, 2014.
Comiti, F., Mao, L., Wilcox, A., Wohl, E. E., and Lenzi, M. A.: Field-derived relationships for flow velocity and resistance in high-gradient streams, J. Hydrol., 340, 48–62, https://doi.org/10.1016/j.jhydrol.2007.03.021, 2007.
Comiti, F.: How natural are Alpine mountain rivers? Evidence from the Italian Alps, Earth Surf. Proc. Land., 37, 693–707, https://doi.org/10.1002/esp.2267, 2012.
Comiti, F., D'Agostino, V., Moser, M., Lenzi, M. A., Bettella, F., Dell'Agnese, A. E. R., Gius, S., and Mazzorana, B.: Preventing wood-related hazards in mountain basins: from wood load estimation to designing retention structures, Proceedings of INTERPRAEVENT, International Research Society Interpraevent, 651–662, 2012.
Comiti, F., Lucía, A., and Rickenmann, D.: Large wood recruitment and transport during large floods: A review, Geomorphology, 269, 23–39, https://doi.org/10.1016/j.geomorph.2016.06.016, 2016.
Crowder, D. W. and Knapp, V. H.: Effective discharge recurrence intervals of Illinois streams, Geomorphology, 64, 167–184, https://doi.org/10.1016/j.geomorph.2004.06.006, 2005.
D'Agostino, V.: Filtering-retention check dam design in mountain torrents, in: Check Dams, Morphological Adjustments and Erosion Control in Torrential Streams, edited by: Garcia, C. and Lenzi, M. A., Nova Science, 185–210, 2013.
D'Agostino, V. and Lenzi, M. A.: La valutazione del trasporto solido di fondo nel bacino attrezzato del Rio Cordon [The validation of bed-load transport in the Rio Cordon catchment], L'Acqua, 4, 23–40, 1996.
Denic, M. and Geist, J.: Linking Stream Sediment Deposition and Aquatic Habitat Quality in Pearl Mussel Streams: Implications for Conservation, River Res. Appl., 31, 943–952, https://doi.org/10.1002/rra.2794, 2015.
DWA: Merkblatt DWA-M 509, Fischaufstiegsanlagen und fischpassierbare Bauwerke [Technical bulletin for fishways], (Deutsche Vereinigung für Wasserwirtschaft, Abwasser und Abfall e.V.), 2014.
Einstein, H. A.: The Bed-Load Function for Sediment Transport in Open Channel Flows, Tech. Bull, USDA Soil Conserv. Serv., 1026, 71–71, 1950.
Gilvear, D. J., Spray, C. J., and Casas-Mulet, R.: River rehabilitation for the delivery of multiple ecosystem services at the river network scale, Environ. Manage., 126, 30–43, https://doi.org/10.1016/j.jenvman.2013.03.026, 2013.
Gisen, D. C., Weichert, R. B., and Nestler, J. M.: Optimizing attraction flow for upstream fish passage at a hydropower dam employing 3D Detached-Eddy Simulation, Ecol. Eng., 100, 344–353, https://doi.org/10.1016/j.ecoleng.2016.10.065, 2017.
Gomi, T., Sidle, R. C., and Richardson, J. S.: Understanding Processes and Downstream Linkages of Headwater Systems, BioScience, 52, 905–916, https://doi.org/10.1641/0006-3568(2002)052[0905:UPADLO]2.0.CO;2, 2002.
Grant, G. E.: Critical flow constrains flow hydraulics in mobile-bed streams: A new hypothesis, Water Resour. Res., 33, 349–358, https://doi.org/10.1029/96WR03134, 1997.
GoPro Hero: GoPro User Manual, GoPro Hero 4 Silver Edition, 94 pp., 2016.
Hampel, R.: Geschiebeablagerung in Wildbächen dargestellt in Modellversuchen [Bed load deposition in mountain rivers illustrated in physical experiments], Wildbach-Lawinenverbauung, 1, 100 pp., 1968.
Hassan, M., Brayshaw, D., Alila, Y., and Andrews, E.: Effective discharge in small formerly glaciated mountain streams of British Columbia: Limitations and implications, Water Resour. Res., 50, 4440–4458, https://doi.org/10.1002/2013WR014529, 2014.
Hassan, M. A., Church, M., Lisle, T. E., Brardinoni, F., Benda, L., and Grant, G. E.: Sediment transport and channel morphology of small, forested streams, J. Am. Water Resour. Assoc., 41, 853–876, https://doi.org/10.1111/j.1752-1688.2005.tb03774.x, 2005.
Heyman, J., Bohorquez, P., and Ancey, C.: Entrainment, motion, and deposition of coarse particles transported by water over a sloping mobile bed, J. Geophys. Res.-Earth., 121, 1931–1952, https://doi.org/10.1002/2015JF003672, 2016.
Hübl, J., Holzinger, G., and Wehrmann, H.: Entwicklung von Grundlagen zur Dimensionierung kronenoffener Bauwerke für die Geschiebebewirtschaftung in Wildbächen: Klassifikation von Wildbachsperren [Development of design basics for open-gap crested structures for the management of bed load in mountain rivers: Classification of torrenital barriers], WLS Report 50, Band 2, 85 pp., BMLFUW, 2003.
Hübl, J., Holub, M., and Suda, J.: Structural mitigation measures, in: 3rd Probabilistic Workshop: Technical Systems + Natural Hazards, edited by: Bergmeister, K., Rickenmann, D., Strauss, A., Wieshofer, S., Curbach, M., and Proske, D., Universität für Bodenkultur, Department für Bautechnik und Naturgefahren, 115–126, 2005.
Hübl, J., Feisch, M., Chiari, M., and Kaitna, R.: Physikalische Modellversuche zur Optimierung der Geschieberückhaltesperre am Gadriabach (Vinschgau,Südtirol) [Physical model experiments to optimise the open check dam at the Gadriabach (Vinschgau, South Tyrol)], IAN Report 144, Institut für Alpine Naturgefahren, Universität für Bodenkultur – Wien (unveröffentlicht), 2012.
Johnson, J. P. L.: Gravel threshold of motion: a state function of sediment transport disequilibrium?, Earth Surf. Dynam., 4, 685–703, https://doi.org/10.5194/esurf-4-685-2016, 2016.
Jordan, F., Jaeggi, M. N., and Nigg, U.: Modélisation physique d'un piège à graviers, le cas du Baltschiederbach, Wasser Energ. Luft, 9, 283–290, 2003.
Kaitna, R., Chiari, M., Kerschbaumer, M., Kapeller, H., Zlatic-Jugovic, J., Hengl, M., and Huebl, J.: Physical and numerical modelling of a bedload deposition area for an Alpine torrent, Nat. Hazards Earth Syst. Sci., 11, 1589–1597, https://doi.org/10.5194/nhess-11-1589-2011, 2011.
Kaitna, R. and Hübl, J.: Silent witnesses for torrential processes, in: Dating Torrential Processes on Fans and Cones, edited by: Schneuwly-Bollschweiler, M., Stoffel, M., Rudolf-Miklau, F., Springer, Dordrecht, Heidelberg, New York, London, 111–130, 2013.
Kondolf, G. M.: Hungry Water: Effects of Dams and Gravel Mining on River Channels, Environ. Manage., 21, 533–551, 1997.
Kronfellner-Krauss, G.: Neue Bauweisen in der Wildbach- und Lawinenverbauung in internationaler Sicht [New construction methods of torrent and avalanche control from an international point of view], Cent. Für Gesamte Forstwes., 1, 33–57, 1972.
Lachat, E., Macher, H., Mittet, M.-A., Landes, T., and Grussenmeyer, P.: First experiences with Kinect V2 sensor for close range 3D modelling, Int. Arch. Photogramm. Remote Sens. Spat. Inf. Sci. XL-5/W4, 93–100, https://doi.org/10.5194/isprsarchives-XL-5-W4-93-2015, 2015.
Lane, S. N., Bakker, M., Balin, D., Lovis, B., and Regamey, B.: Climate and human forcing of Alpine River flow, in: Proceedings of River Flow 2014, edited by: Schleiss, A. J., De Cesare, G., Franca, M. J., and Pfister, M., Taylor & Francis Group, 7–15, 2014.
Lange, D. and Bezzola, G. R.: Schwemmholz Probleme und Lösungansätze [Driftwood problems and approaches for solutions], edited by: Minor, H.-E., Mitt. Nr. 188 der Versuchsanstalt für Wasserbau, Hydrologie und Glaziologie an der Eidgenössischen Technischen Hochschule Zürich, 2006.
Lassettre, N. S. and Kondolf, G. M.: Large Woody Debris in Urban Stream Channel: Redefining the Problem, River Res. Appl., 28, 1477–1487, https://doi.org/10.1002/rra.1538, 2012.
Lenzi, M. A., Mao, L., and Comiti, F.: Effective discharge for sediment transport in a mountain river: Computational approaches and geomorphic effectiveness, J. Hydrol., 326, 257–276, https://doi.org/10.1016/j.jhydrol.2005.10.031, 2006.
Leys, E.: Die technischen und wirtschaftlichen Grundlagen in der Wildbachverbauung der großdoligen und der kronenoffenen Bauweise [Technical and economical basics of hydraulic constructions in mountain rivers in terms of large openings and open crested architecture], Universität für Bodenkultur, 1976.
Mazzorana, B., Comiti, F., Scherer, C., and Fuchs, S.: Developing consistent scenarios to assess flood hazards in mountain streams, Environ. Manage., 94, 112–124, https://doi.org/10.1016/j.jenvman.2011.06.030, 2012.
Meyer-Peter, E. and Müller, R.: Formulas for Bed-Load transport, IAHSR Append. 2, 2nd meeting, 39–65, 1948.
Milhous, R. T.: Modelling of instream flow needs: the link between sediment and aquatic habitat, Regul. River, 14, 79–94, https://doi.org/10.1002/(SICI)1099-1646(199801/02)14:1<79::AID-RRR478>3.0.CO;2-9, 1998.
Mizuyama, T.: Structural Countermeasures for Debris Flow Disasters, Int. J. Eros. Control Eng., 1, 38–43, 2008.
Morris, G. L., Annandale, G., and Hotchkiss, R.: Reservoir Sedimentation, in: Sedimentation Engineering, edited by: García, M. H., American Society of Civil Engineers, 579–612, https://doi.org/10.1061/9780784408148.ch12, 2008.
Moyle, P. B. and Mount, J. F.: Homogenous rivers, homogenous faunas, P. Natl. Acad. Sci. USA, 104, 5711–5712, https://doi.org/10.1073/pnas.0701457104, 2007.
Osti, R. and Egashira, S.: Sediment transportation from bed-load to debris-flow and its control by check dams in torrential streams, in: Check Dams, Morphological Adjustments and Erosion Control in Torrential Streams, edited by: Garcia, C. and Lenzi, M. A., Nova Science, 151–184, 2013.
Parker, G., Paola, C., Whipple, K. X., and Mohrig, D.: Alluvial Fans formed by channelized fluvial and sheet flow, I: Theory, J. Hydraul. Eng., 124, 985–995, 1998.
Pasternack, G. B. and Wyrick, J. R.: Flood-driven topographic changes in a gravel-cobble river over segment, reach, and morphological unit scales, Earth Surf. Proc. Land., 42, 487–502, https://doi.org/10.1002/esp.4064, 2017.
Piton, G. and Recking, A.: The concept of travelling bedload and its consequences for bedload computation in mountain streams, Earth Surf. Process. Land., 52–52, https://doi.org/10.1002/esp.4105, 2017.
Piton, G. and Recking, A.: Design of Sediment Traps with Open Check Dams. I: Hydraulic and Deposition Processes, J. Hydraul. Eng., 142, 04015045, https://doi.org/10.1061/(ASCE)HY.1943-7900.0001048, 2016a.
Piton, G. and Recking, A.: Design of Sediment Traps with Open Check Dams. II: Woody Debris, J. Hydraul. Eng., 142, 04015046, https://doi.org/10.1061/(ASCE)HY.1943-7900.0001049, 2016b.
Piton, G., Carladous, S., Reckin, A., Tacnet, J. M., Liébault, F., Kuss, D., Quefféléan, Y., and Marco, O.: Why do we build check dams in Alpine streams? An historical perspective from the French experience, Earth Surf. Process. Land., 42, 91–108, https://doi.org/10.1002/esp.3967, 2017.
Recking, A.: Simple method for calculating reach-averaged bed-load transport, J. Hydraul. Eng., 139, 70–75, https://doi.org/10.1061/(ASCE)HY.1943-7900.0000653, 2013.
Recking, A., Piton, G., Vazquez-Tarrio, D., and Parker, G.: Quantifying the morphological print of bedload transport, Earth Surf. Process. Land., 41, 809–822, https://doi.org/10.1002/esp.3869, 2016.
Rickenmann, D. and Recking, A.: Evaluation of flow resistance in gravel-bed rivers through a large field data set, Water Resour. Res., 47, W07538, https://doi.org/10.1029/2010WR009793, 2011.
Rosgen, D. L.: A classification of natural rivers, Catena, 22, 169–199, 1994.
Schmocker, L. and Weitbrecht, V. Driftwood: Risk analysis and engineering measures, J. Hydraul. Eng., 139, 683–695, https://doi.org/10.1061/(ASCE)HY.1943-7900.0000728, 2013.
Schwindt, S.: Hydro-morphological processes through permeable sediment traps at mountain rivers, Communication LCH N ∘71, edited by: Schleiss, A. J., Lausanne, Switzerland, available at: https://infoscience.epfl.ch/record/231182 (last access: 22 February 2018), 2017.
Schwindt, S., Piton, G., De Cesare, G., Recking, A., and Schleiss, A. J.: Study of the effects of a distanced retention basin combined with an open check dam on a physical model, in: Proceedings of INTERPRAEVENT: Hazard and risk mitigation, Extended Abstracts, edited by: Koboltschnig, G., International Research Society Interpraevent, 322–323, 2016.
Schwindt, S., Franca, M. J., De Cesare, G., and Schleiss, A. J.: Analysis of mechanical-hydraulic deposition control measures, Geomorphology, 295, 467–479, https://doi.org/10.1016/j.geomorph.2017.07.020, 2017a.
Schwindt, S., Franca, M. J., and Schleiss, A. J.: Effects of lateral and vertical constrictions on flow in rough steep channels, J. Hydraul. Eng., 1–14, https://doi.org/10.1061/(ASCE)HY.1943-7900.0001389, 2017b.
Schwindt, S., Franca, M. J., and Schleiss, A. J.: The influence of the channel slope of flow contractions in steep channels, J. Hydraul. Res., in press, 2018.
Senter, A. E. and Pasternack, G. B.: Large wood aids spawning Chinook salmon (Oncorhynchus tshawytscha) in marginal habitat on a regulated river in California, River Res. Appl., 27, 550–565, https://doi.org/10.1002/rra.1388, 2011.
Smart, G. M. and Jaeggi, M. N. R.: Sedimenttransport in steilen Gerinnen [Sediment Transport on Steep Slopes], Mitt. Nr. 64 der Versuchsanstalt für Wasserbau, Hydrologie und Glaziologie an der Eidgenössischen Technischen Hochschule Zürich, 1983.
Sodnik, J., Martinčič, M., Mikoš, M., and Kryžanowski, A.: Are Torrent Check-Dams Potential Debris-Flow Sources?, in: Engineering Geology for Society and Territory – Volume 2: Landslide Processes, edited by: Lollino, G., Giordan, D., Crosta, G. B., Corominas, J., Azzam, R., Wasowski, J., and Sciarra, N., Springer International Publishing, 485–488, https://doi.org/10.1007/978-3-319-09057-3_79, 2015.
Sponseller, R. A., Heffernan, J. B., and Fisher, S. G.: On the multiple ecological roles of water in river networks, Ecosphere, 4, 1–14, https://doi.org/10.1890/ES12-00225.1, 2013.
Tamagni, S.: Unstructured block ramps, Mitt. Nr. 223 der Versuchsanstalt für Wasserbau, Hydrologie und Glaziologie der Eidgenössische Technische Hochschule Zürich, 2013.
Uchiogi, T., Shima, J., Tajima, H., and Ishikawa, Y.: Design methods for wood-debris entrapment, Proceedings of INTERPRAEVENT, International Research Society Interpraevent, 279–288, 1996.
Wang, F.: Grundriss der Wildbachverbauung, Verlag von S. Hirzel, 1903.
Watanabe, M., Mizuyama, T., and Uehara, S.: Review of debris flow countermeasure facilities, J. Jpn. Eros. Control Eng. Soc., 115, 40–48, 1980.
Wilcock, P.: Sediment Transport Primer (Estimating Bed-Material Transport in Gravel-bedded Rivers), USDA Forest Service, 2008.
Williams, G. P. and Wolman, M. G.: Downstream Effects of Dams on Alluvial Rivers, in: Geological Survey Professional Papers, U.S. Government, Paper 1286, 1984.
Wolman, M. G. and Leopold, L. B.: River Channel Patterns: Braided, Meandering and Straight, Physiogr. Hydraul. Stud. Rivers Geol. Surv. Prof. Pap. 282–B, 1–85, 1957a.
Wolman, M. G. and Leopold, L. B.: River flood plains some observations on their formation, Physiogr. Hydraul. Stud. Rivers Geol. Surv. Prof. Pap. 282–C, 1–107, 1957b.
Wolman, M. G. and Miller, J. P.: Magnitude and frequency of forces in geomorphic processes, J. Geol., 68, 54–74, 1960.
Yalin, M. S.: Mechanics of sediment transport, Pergamon press Oxford, 1977.
Yu, G., Wang, Z., Zhang, K., Chang, T., and Liu, H.: Effect of incoming sediment on the transport rate of bed load in mountain streams, Int. J. Sediment Res., 24, 260–273, https://doi.org/10.1016/S1001-6279(10)60002-9, 2009.
Zeller, J.: Die Entleerung verlandeter Geschieberückhalteräume, Diskussionsbeitrag [The flushing of up-silted sediment retention basins, discussion], Mitt. Forstl. Bundesversuchsanstalt Wien, 102, 389–397, 1973.
Zimmermann, A.: Flow resistance in steep streams: An experimental study, Water Resour. Res., 46, W09536, https://doi.org/10.1029/2009WR007913, 2010.
Zollinger, F.: Die verschiedenen Funktionen von Geschieberückhaltebauwerken [The different functions of debris retention dams], Proceedings of INTERPRAEVENT, International Research Society Interpraevent, 147–160, 1984.
Zollinger, F.: Die Vorgänge in einem Geschiebeablagerungsplatz: ihre Morphologie und ihre Möglichkeiten einer Steuerung [The processes in sediment traps: their morphology and their possibilities of control], ETH Zürich, 1983.