the Creative Commons Attribution 4.0 License.
the Creative Commons Attribution 4.0 License.
 | 19 Feb 2018
Fire danger rating over Mediterranean Europe based on fire radiative power derived from Meteosat
Miguel M. Pinto
Isabel F. Trigo
Ricardo M. Trigo
K. Feridun Turkman
We present a procedure that allows the operational generation of daily forecasts of fire danger over Mediterranean Europe. The procedure combines historical information about radiative energy released by fire events with daily meteorological forecasts, as provided by the Satellite Application Facility for Land Surface Analysis (LSA SAF) and the European Centre for Medium-Range Weather Forecasts (ECMWF). Fire danger is estimated based on daily probabilities of exceedance of daily energy released by fires occurring at the pixel level. Daily probability considers meteorological factors by means of the Canadian Fire Weather Index (FWI) and is estimated using a daily model based on a generalized Pareto distribution. Five classes of fire danger are then associated with daily probability estimated by the daily model. The model is calibrated using 13 years of data (2004–2016) and validated against the period of January–September 2017. Results obtained show that about 72 % of events releasing daily energy above 10 000 GJ belong to the “extreme” class of fire danger, a considerably high fraction that is more than 1.5 times the values obtained when using the currently operational Fire Danger Forecast module of the European Forest Fire Information System (EFFIS) or the Fire Risk Map (FRM) product disseminated by the LSA SAF. Besides assisting in wildfire management, the procedure is expected to help in decision making on prescribed burning within the framework of agricultural and forest management practices.
- Article
(5977 KB) - Full-text XML
- BibTeX
- EndNote


Wildfires have been identified as the most important threat to forests in Mediterranean Europe (Requardt et al., 2009) that is regularly affected by large and destructive events. These weather-related hazards represent a serious problem to modern societies, with great negative impacts at social, economic and ecological levels and causing significant human casualties (Amraoui et al., 2015). A striking illustration of the magnitude of the problem is provided by the recent tragic episode of 17 June 2017 that took place in central Portugal at Pedrógão Grande-Góis, with an official death toll of 64 people, and by the fire episodes of the last week of July 2017 near Marseille in southeastern France that led to the evacuation of more than 10 000 people in the French Riviera.
According to the last report issued by the European Commission (San-Miguel-Ayanz et al., 2016), during the period 1980–2015 the five southern member states (Portugal, Spain, France, Italy and Greece) were affected by a total of 1 751 067 fires that burned 16 121 036 ha, corresponding to a yearly average of 48 641 fires and a burned area average of 447 807 ha per year. This proneness of Mediterranean Europe to be affected by fire is linked to its climate, which is characterized by rainy and mild winters followed by warm and dry summers (Pyne, 2009). Extreme weather conditions in summer (high temperature, strong wind, low relative humidity and drought) are a key factor in the ignition and spread of large wildfires (Amraoui et al., 2013; Pereira et al., 2013; Ruffault et al., 2016).
The role played by meteorological factors in the occurrence of severe fire episodes is conveniently assessed by means of indices of meteorological fire danger that rate the likelihood of a fire event (Finney, 2005). Early examples include the Nesterov index for use in the former Soviet Union (Nesterov, 1949), the Forest Fire Danger Index (FFDI) for eastern Australia (McArthur, 1967) and the National Fire Danger Rating System for the USA (Deeming et al., 1977). One of the most reliable and globally applied fire rating methodologies is the Canadian Forest Fire Weather Index System (CFFWIS). The system consists of six components that account for the effects of fuel moisture and wind on fire behaviour (Van Wagner, 1974). The first five components are based on empirically derived relationships between meteorological variables and the stress of different components of typical fuels that are present in jack pine forests of Canada (Stocks et al., 1989). The last component, the Fire Weather Index (FWI), results from the combination of the preceding five (Van Wagner 1987). FWI provides a numeric rating of fire intensity and is particularly suitable as a general index of meteorological fire danger, namely for the ecosystems of Mediterranean Europe (Viegas et al., 1999). Currently FWI operates on the basis of the Fire Danger Forecast module of the European Forest Fire Information System (EFFIS), which is one of the components of the emergency management services in the EU Copernicus programme (San-Miguel-Ayanz et al., 2012), as well as of the Fire Risk Map (FRM) product disseminated by the Satellite Application Facility for Land Surface Analysis (LSA SAF), which is part of the EUMETSAT application ground segment (Trigo et al., 2011).
However, FWI was specifically designed for the Canadian forest and therefore should be calibrated to the vegetation cover and meteorological conditions over the Mediterranean region. The calibration process involves defining a set of break points in indices of fire danger that are in turn used to delimit classes of fire danger from low to extreme conditions. Several approaches have been proposed involving different techniques to rate indices of fire danger against fire history over a given period and study area. Examples of such techniques include logistic regression and percentile analysis (Andrews et al., 2003), cluster analysis (Dymond et al., 2005) and threshold setting based on a geometric progression (Van Wagner, 1987) or on values of probability (DaCamara et al., 2014). Fire history traditionally consists of ground observations of fire occurrence (Anderson and Englefield, 2001), fire load (Merrill and Alexander, 1987), suppression difficulty (Kiil et al., 1977) and area burned (San-Miguel-Ayanz et al., 2012). The current availability of remotely sensed data of fire activity using information derived from instruments on board geostationary satellites and polar orbiters has opened new perspectives for calibration procedures that are consistent in space and time, continuously monitorable on a daily basis and easily tuned at the end of the fire season. Information about fire activity consists of location and time of detection of hot spots, which is often accompanied by quality flags and confidence level, and, in certain cases, by the amount of energy released per unit time (fire radiative power, or FRP). Data either are global or cover vast continental areas, and time series usually span more than a decade. Examples of remotely sensed databases of fire activity include the World Along Track Scanning Radiometer (ATSR) World Fire Atlas (Arino and Melinotte, 1995), the MODIS and the VIIRS active-fire products (Giglio et al., 2003) and the LSA SAF Fire Products (Trigo et al., 2011).
The EFFIS product relies on a traditional calibration approach where the lower threshold of the class of highest fire danger is estimated from FWI values associated with burned areas of more than 500 ha, and the subsequent thresholds are defined by a geometric progression (San-Miguel-Ayanz et al., 2012). In the case of the LSA SAF FRM product, calibration is performed by fitting a generalized Pareto (GP) model to the duration of fire episodes derived from hot spot observations from space (DaCamara et al., 2014). When calibrating indices of fire danger over large areas such as the Mediterranean basin, the spatial and temporal consistency of historical records of fire activity derived from remotely sensed information provided by the same sensors present an important advantage over ground-based data, where the time and location of the fire event and the associated burned area are usually obtained by visual inspection and the information recorded depends on policies that vary from country to country as well as on criteria that may change over time (Pereira et al., 2011). Use of data on fire radiative power derived from satellite measurements presents the additional advantage of calibrating the indices of fire danger against a physical quantity that is especially useful in fire management and firefighting (Roberts and Wooster, 2008).
We present a methodology to assess fire danger based on the estimation of the probability of exceedance of predefined thresholds of daily released energy by active fires as derived from satellite observations of fire radiative power. The procedure is applied to Mediterranean Europe and is calibrated with data covering the period 2004–2016. First, estimates of static probability (i.e. not depending on the day of the year) are obtained, for each location, by dividing the recorded number of fires exceeding a given threshold of energy and observed within a cell centred on each pixel by the total number of fires observed within the same cell. Then it is shown that statistical models based on GP distributions adequately fit to the upper tails of the observed distributions of released energy and that these models can be improved by integrating both the estimates of static probability and daily FWI as covariates of the scale parameter of the GP distributions. The rationale is that fires are always dependent on fire weather and that meteorological conditions become more relevant for large fires (Ruffault et al., 2016). Five classes of fire danger are then attributed to each pixel on a daily basis, taking into account both the values of probability of exceedance and the respective deviations from a long-term mean. Performance of the methodology is assessed by comparing, for different ranges of daily released energy by fires, the distributions of observed events among the five classes of danger with the corresponding distributions when using the classes of fire danger from the above-mentioned LSA SAF product and EFFIS module. Finally, the procedure is validated by applying it to the period January–September 2017 and by analysing the two above-mentioned extreme events that took place in Portugal and France in June and July 2017, respectively.
The study area is defined by latitude circles of 35 and 45∘ N and meridians of 10∘ W and 27.5∘ E (Fig. 1), and the study period spans from January 2004 to September 2017. The sub-period from January 2004 to December 2016 is used to calibrate the models, whereas the remaining sub-period from January to September 2017 is retained for validating results against independent data. The two sub-periods will be referred hereafter as calibration and validation periods. Both satellite and meteorological data are gridded in the normalized geostationary projection (NGP) of Meteosat Second Generation (MSG) (EUMETSAT, 1999), with an average pixel size of about 15.7 km2 over the land regions in the study area.
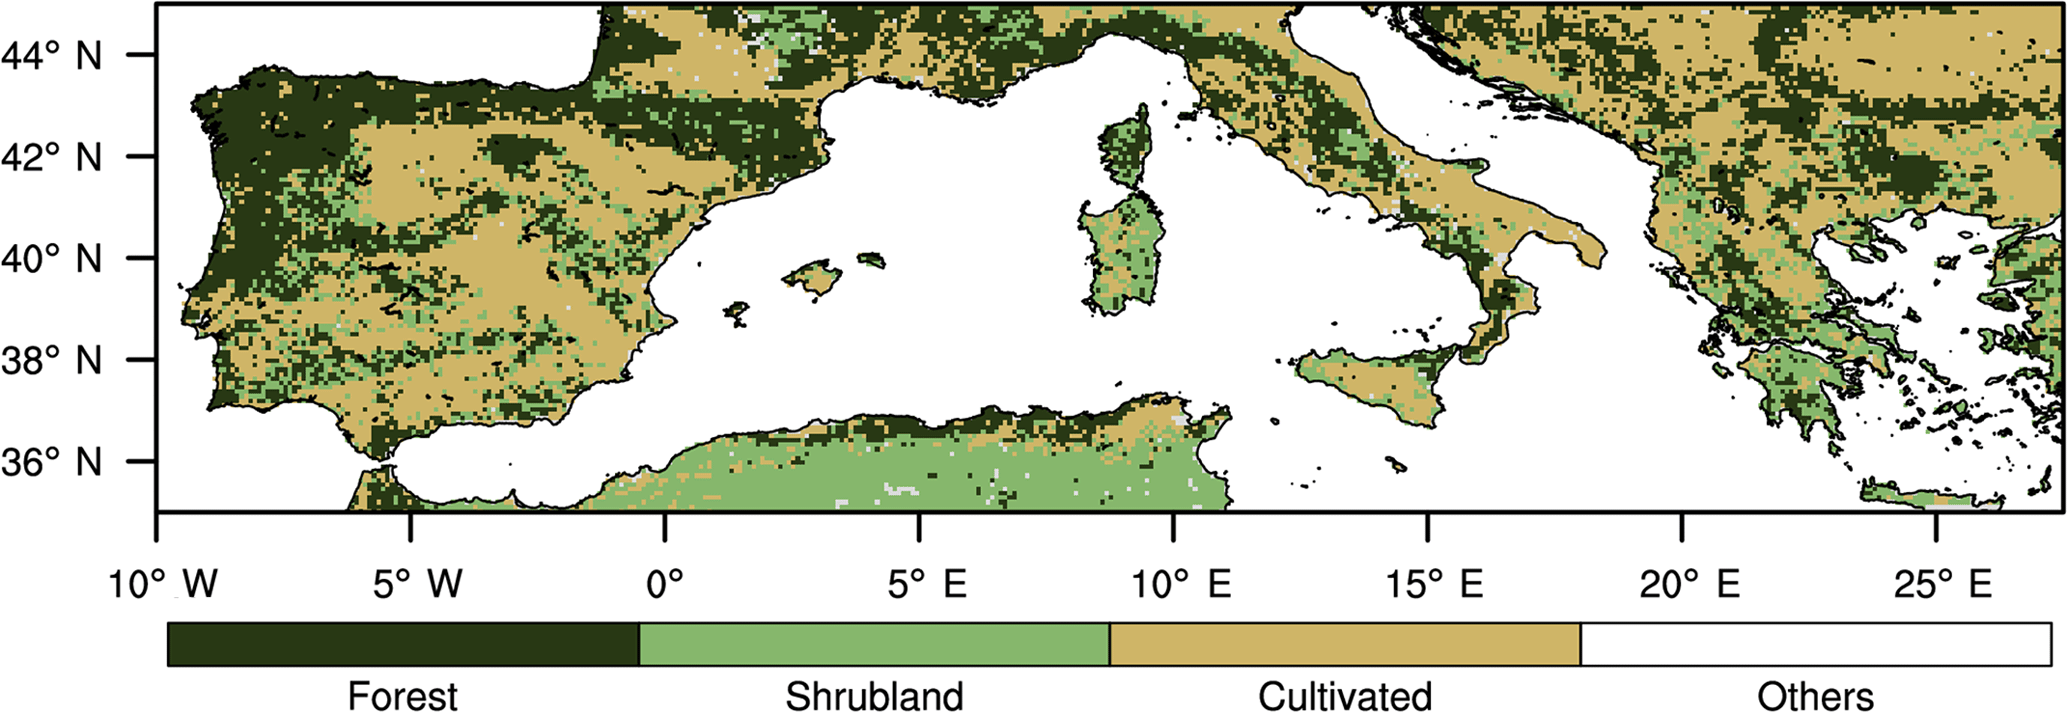
Figure 1Geographical distribution of the types of vegetation cover/land use as derived from the GLC2000 database.
Since fire intensity and behaviour depend on the vegetation type (e.g. Moreira et al., 2011; Fernandes, 2013; DaCamara et al., 2014), the GLC2000 database (Hartley et al., 2006) was used as the source of information about vegetation cover/land use. Originally available at a 1 km resolution, vegetation/land use types were re-projected onto the MSG NGP grid. The 22 types of vegetation/land use were merged into the following three main land cover types: 1 to 10 – forest; 11 to 15 – shrubland; and 16 to 18 – cultivated areas (Fig. 1).
Data of fire radiative power from January 2004 to September 2017 were obtained from the FRP product generated and disseminated by the LSA SAF (Trigo et al., 2011; Wooster et al., 2015). The FRP product consists of estimates of the radiative power emitted by landscape fires and is derived on a pixel-by-pixel basis from the Spinning Enhanced Visible and Infrared Imager (SEVIRI) instrument, which operates on board the Meteosat Second Generation (MSG) series of EUMETSAT geostationary satellites (LSA SAF, 2015). The product is provided for the whole MSG disk (up to 72∘ view zenith angle) every 15 min, and each active-fire location in the study area is represented at the centre of the corresponding SEVIRI pixel. The database provides for each event the geographical coordinates, the date and time, the fire confidence and the fire radiative power (expressed in megawatts). A full description of the product and its validation is available in the online documentation provided at the LSA SAF site (http://lsa-saf.eumetsat.int).
Meteorological data covering the period from January 1979 to December 2016 were obtained from the ERA-Interim reanalysis dataset (Dee et al., 2011) generated by the European Centre for Medium-Range Weather Forecasts (ECMWF). With the aim of recreating the kind of information available when using the developed model in operational mode, data from the validation period (from January to September 2017) consisted of ECMWF's operational 24 h forecasts (Haiden et al., 2016). Both reanalysed and forecasted data fields consist of daily 12:00 UTC fields of 24 h cumulative precipitation (from 12:00 UTC of the previous day to 12:00 UTC of the current day), 2 m air temperature and dew point, and 10 m zonal and meridional wind components. Since the spatial resolution of the reanalysis is about 0.75∘, data were re-projected onto the MSG NPP grid. In the case of 2 m and dew point temperatures, a topographical correction was performed on the data by applying a constant lapse rate of −0.67 ∘C (100 m)−1 to the difference between the surface height of the ECMWF model and that of SEVIRI's nearest pixels, assuming a constant dew point depression. Relative humidity was computed based on values of temperature and dew point temperature at 2 m, according to the Magnus expression (Lawrence, 2005).
3.1 Fire Weather Index
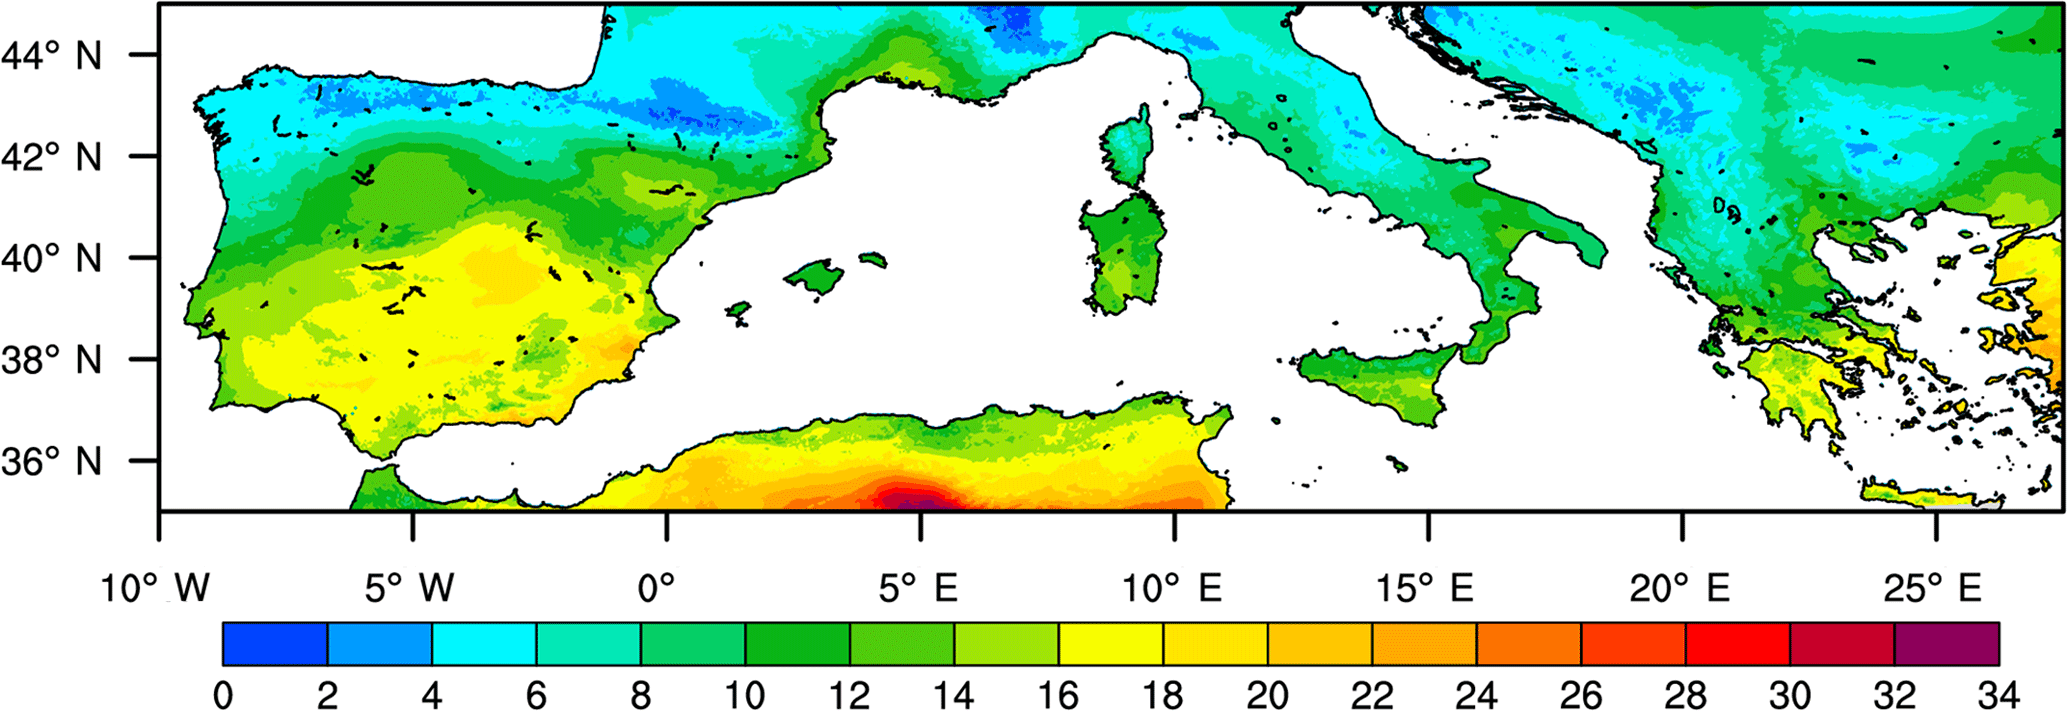
Daily values of FWI covering the period from January 1979 to September 2017 were computed according to the procedure described by Wang et al. (2015). For each pixel, the grand average of FWI for all days of the period 1979–2016, hereby denoted , was also computed. The spatial distribution of (Fig. 2) shows a general tendency to decrease with increasing latitude, which reflects the same behaviour of the surface temperature field. The spatial distribution is also consistent with the land cover (Fig. 1), the forested areas tending to be associated with lower values . Other factors such as topography and proximity to the sea are also relevant, the values of tending to be lower over the mountains and along the coast. For each pixel p of the MSG NPP grid and for each day d of the study period, the anomaly FWI was defined as
where FWIpd is the FWI value for pixel p and day d day, and is the grand average of FWI for that pixel. Use of anomalies instead of values of FWI aims at reducing all the above-mentioned factors that regionally affect FWI over Mediterranean Europe. Given that FWI is defined at 12:00 local standard time (LST), use of anomalies also mitigates the impacts associated with the delay in solar time (1 h every 15∘ towards the east) given that all meteorological fields are defined at 12:00 UTC (DaCamara et al., 2014).
3.2 Daily energy released by fires
Daily energy released by fire at a given pixel was computed by integrating the radiative power recorded by SEVIRI in that pixel throughout the considered day. Since the data are sampled every 15 min, the daily energy, E (in gigajoules), for each pixel p and day d may be estimated as
where index k indicates the sequence of 15 min images for each day, FRPkp is the fire radiative power (in megawatts) in pixel p of image k and the 0.9 factor converts the result into GJ.
3.3 Static probability of exceedance of energy released by fires
Considering the calibration period (2004–2016), the static probability of exceedance of a given threshold E of daily energy released by fires at each pixel p was estimated by counting the total number of daily fire occurrences in pixels with the same land cover type as p (Fig. 1) located inside a cell centred in the considered pixel with initial size δ=0.7∘ in latitude and longitude. The size was then successively enlarged by increments of 0.05∘ until the maximum size of 20∘ was attained or the total number of events reaches 200. When denoting by Sp(δ,E) the total number of daily fires inside a cell of size δ centred at p and with released energy exceeding E, the probability of exceedance x is estimated as
where Sp(δ,0) is the number of all observed daily fire events (i.e. with energy exceeding zero). As suggested by the notation employed, Pp(E|0) may be viewed as a conditional probability, namely the probability that the daily energy released by fires at pixel p is greater than E provided that an ignition has occurred in that pixel. The rationale for this procedure is that the static probability of exceedance is expected to present smooth spatial variability over pixels with the same land cover type, while steep changes are to be expected among the different land cover types.
3.4 Statistical models of exceedance of energy released by fires
Following DaCamara et al. (2014), the statistical distribution of daily released energy, E, is modelled using the “peaks-over-threshold” (POT) approach (Pickands, 1975).
The POT approach uses the GP distribution as a model to assign probabilities to the exceedances of E over a predefined threshold, i.e. to values (with E>Emin), where Emin is a prescribed minimum value (de Zea Bermudez and Kotz, 2010). The GP cumulative distribution function of exceedances ΔE is
where α and σ are the shape and scale parameters. The value of the minimum threshold Emin is obtained by plotting the sample mean of the values exceeding successive thresholds against the respective thresholds, the chosen value being such that the dependence becomes linear for values greater than the chosen one (Coles, 2001). The shape (α) and scale (σ) parameters of the GP distribution are then estimated using the maximum-likelihood method (Grimshaw, 1993).
The obtained model, hereafter referred to as the null model, may be improved by incorporating daily anomalies, FWI*, and static probabilities, P(E|0), as covariates of the scale parameter in the GP distribution using a feedforward artificial neural network. The network is trained using the Levenberg–Marquardt algorithm (Hagan and Menhaj, 1994). Daily probabilities are then given by
where is the trained neural network model using FWI* and P(E|0) as inputs and providing the corresponding scale parameter σ as an output.
Performance of the new alternative model, hereafter referred to as the daily model because of its dependence on daily values of FWI*, is compared against the respective null models by using the standard likelihood ratio test (Neyman and Pearson, 1933), which is based on statistic Λ, defined as
where L and L′are the likelihood functions of the null and the daily models, respectively.
3.5 Fire danger rating classes
Classes of fire danger are defined, based on values of probability of exceedance and of the respective deviations from the expected value. The rationale is that large fires tend to occur in pixels of high probability of exceedance or of large positive deviation from the expected value for a given day of the year and location. For each pixel p and day d, the probability of exceedance G is evaluated using Eq. (5), and the respective anomaly A is computed by subtracting the average of all values of probability of exceedance for that pixel and day of the year over the period 1979–2016. As shown in Fig. 3, five classes of fire danger (conventionally named “low”, “moderate”, “high”, “very high” and “extreme”) are then defined by setting five partitions in the domain G versus A (delimited by dashed lines) by means of four curves (γ0, γ1, γ2, γ3) defined as follows:
where Pn are break points estimated from fire events according to the following criteria: (1) the first break point is set to 0 so that the “low” class of fire danger encompasses all cases where the probability of exceedance is below average (A<0); (2) the four break points are equally spaced; and (3) the classes “very high” and “extreme” should have about the same number of fire events.

Figure 3Partitioning of the domain of probability of exceedance, G, versus the respective anomalies, A, into five classes of fire danger: “low”, “moderate”, “high”, “very high” and “extreme”. The partitions are delimited by curves γ0, γ1, γ2 and γ3.
It may be noted that the adopted approach to calibration differs from other common methods like those based on logistic regression and threshold setting that were mentioned in the Introduction. The present approach, based on a partitioning of the space of probability versus probability anomaly by exponential type functions, was motivated by the distribution of the daily energy released by observed fire events in that space during the study period (Fig. 13).
3.6 Model performance and validation
Assessment of performance of the daily model is based on a systematic comparison of the distributions of events among classes of fire danger for different ranges of energy released by fire with the corresponding distributions when using classes produced by other products, namely those from EFFIS and the LSA SAF. In the case of EFFIS, six classes are defined by means of a set of break points in FWI that are set up using historical records of large fire events of more than 500 ha of burned area (San-Miguel-Ayanz et al., 2012). The six EFFIS classes are here reduced to five by combining the “very low” and the “low” classes. In the case of the LSA SAF product, the definition of the five classes is based on break points in FWI anomalies that are defined based on information of a probabilistic model of exceedances of active-fire duration (DaCamara et al., 2014). Given that classes from the daily model are based on probabilistic information about exceedances of energy released by fires, when comparing against EFFIS and LSA SAF products, the daily model is expected to provide a better discrimination of events among classes from the point of view of energy released, particularly for the most severe classes.
The validation of the daily model is performed for the January–September 2017 (validation) period, by comparing the distributions of daily fire events among classes of fire danger with those obtained for the calibration period (2004–2016). Two severe events that took place during the validation period are also examined, namely the fires at Pedrógão Grande-Góis and near Marseille in southeastern France, which were already mentioned in the Introduction. The study of the Pedrógão Grande-Góis event focuses on the second day of the event (18 June 2017) because no satellite measurements are available on the starting day due to the presence of clouds and thick smoke. The event took place within a context of extremely high temperatures, with values of up to 40 ∘C registered at the nearest station and relative humidity as low as 20 %. Besides killing 64 people, the fire involved more than 1000 fire fighters and destroyed almost 500 buildings, and a continuous patch of more than 42 000 ha burned in one week. In the case of the fire episodes near Marseille, two large fires that started on 24 July 2017 and burned more than 3000 ha are analysed, with the study focusing on the day after the onset because of the recorded high values of released energy during that day. As mentioned in the Introduction, several other episodes occurred in the area during that week, more than 2000 fire fighters were deployed and more than 10 000 people had to be evacuated.
4.1 General features of energy released by fires
Figure 4 shows the monthly median values of daily energy released by fires at each pixel. The distributions represent the whole calibration period (2004–2016) and reveal an absolute maximum of 114 GJ in August and an absolute minimum of 52 GJ in May. All monthly distributions are positively skewed and the annual cycle of interquartile range presents a very similar behaviour to that of the median, with the monthly values of the former presenting an absolute maximum of 309 GJ in August and an absolute minimum of 117 GJ in May. This behaviour is to be expected since fire events with low values of released energy are less conditioned by meteorological factors and are therefore likely to occur throughout the year, whereas fire events releasing high values of energy depend on favourable weather conditions that are more frequent in the summer months. It is also worth noting that monthly values of the median for the validation period (January–September 2017) are larger than the corresponding values for the calibration period in all months, thus stressing the fire-prone year of 2017.
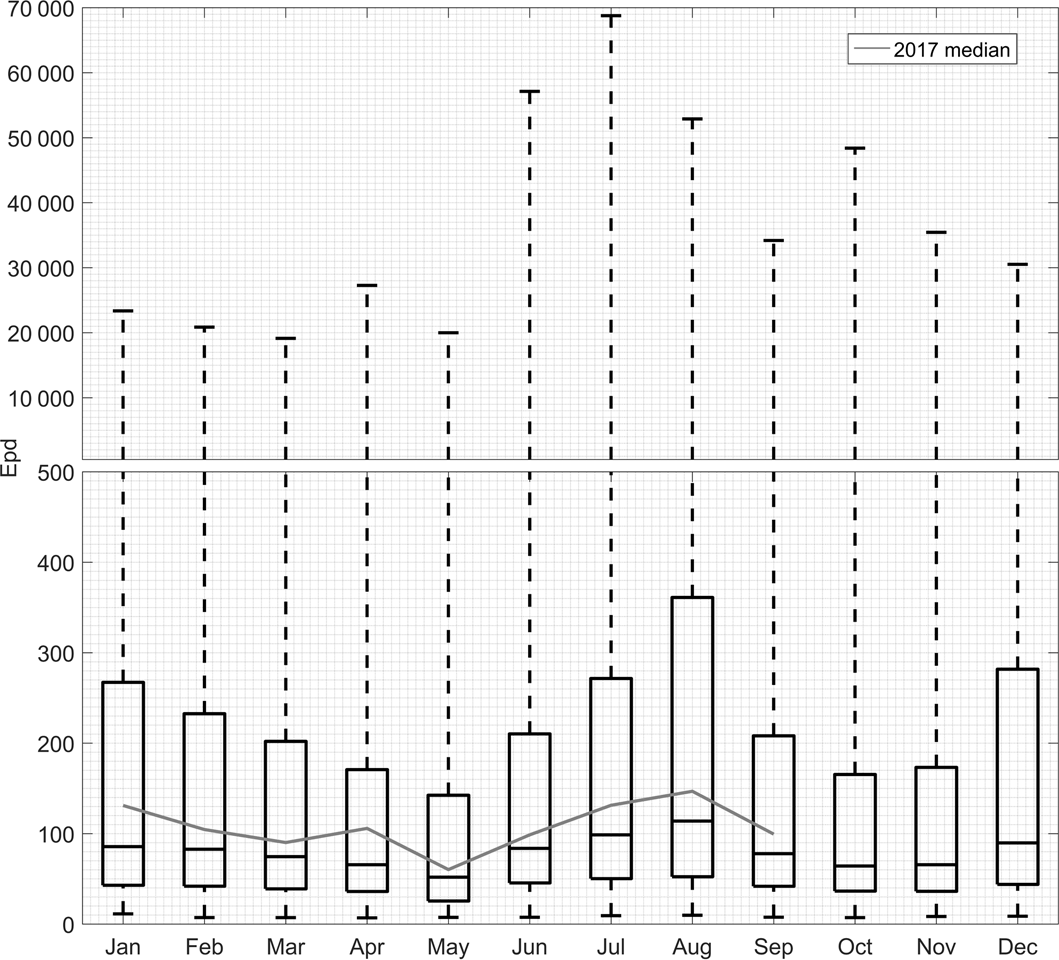
Figure 4Monthly distributions of daily energy (GJ) released per pixel during the calibration period (2004–2016). Monthly values of the median are indicated by the horizontal line inside each box, the first and third quartiles are indicated by the bottom and top sides of the box, respectively, and the maximum and minimum values by the whiskers. The superimposed grey curve shows the values of the monthly medians during the validation period (January–September 2017).
The spatial distribution of energy released by wildfires was analysed by adding up for every pixel in the study area the daily values of released energy recorded during the calibration period (2004–2016). As shown in Fig. 5, a large patch of high values of total released energy may be identified over the northwest of the Iberian Peninsula, with the highest values located in the forested lands of central Portugal. An elongated patch of high values may also be identified along the Mediterranean coast of Africa, with the highest values occurring in the forested areas of Morocco, Algeria and northern Tunisia. A patch of high values is also noticeable in Greece. Other patches, albeit reaching less high values of total released energy, may be identified in central Europe, in Bulgaria and Romania, in southern Italy, and in Sicily and Sardinia.
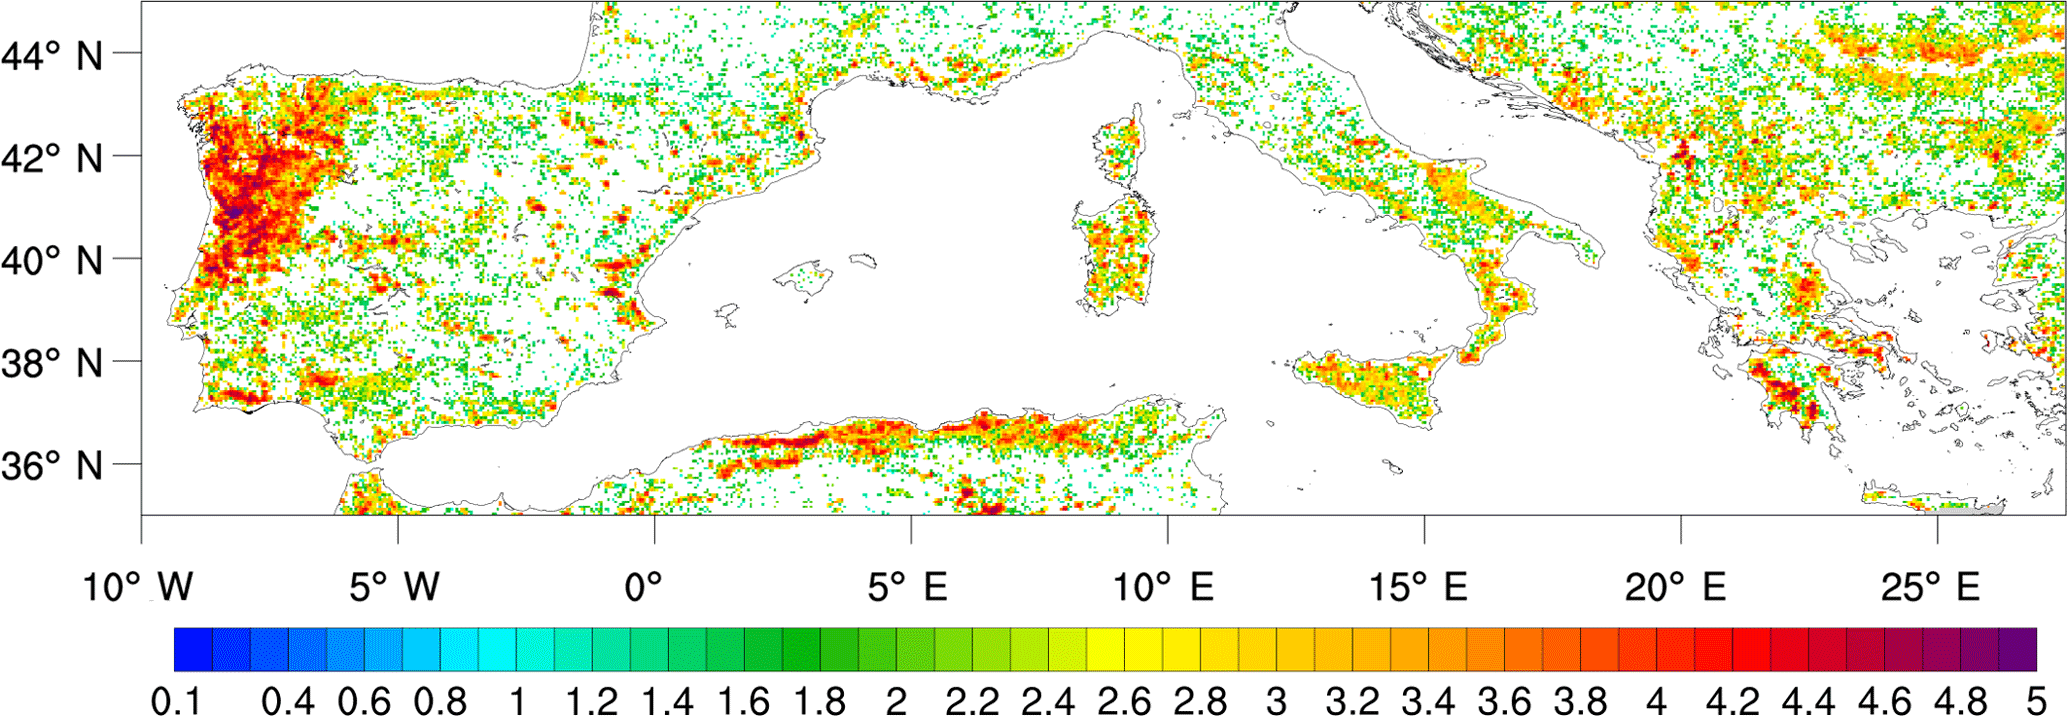
Figure 5Geographical distribution of total energy released by fire recorded during the calibration period (2004–2016). The colour bar indicates the values of the decimal logarithm of the total energy (log10 E, with E in GJ).
The distributions of daily released energy per pixel for the three considered types of vegetation cover/land use (Fig. 6) show that pixels covered by forests have the largest values of both the median and the interquartile range, followed by shrubland and cultivated areas. Differences among the distributions for the three land cover types were assessed by means of the two-sample Kolmogorov–Smirnov test (Massey, 1951); for each pair of the three considered distributions, the null hypothesis that the distributions are identical is rejected with a p value lower than 0.0001. These results are in agreement with the findings by Moreira et al. (2011), Fernandes (2013) and DaCamara et al. (2014) pointing out that within the Mediterranean basin long-lasting and intense fire episodes are more frequent in forests and shrubland than in cultivated areas.

Figure 6As in Fig. 4 but for the distribution of daily energy (GJ) released per pixel stratified by type of vegetation cover/land use.
4.2 Statistical models of exceedance of energy released by fires
Probability of exceedance of daily energy per pixel released by fires was computed over the study area according to the procedure described in Sect. 3.3. Statistical models of exceedance were then built as described in Sect. 3.4, starting by adjusting a GP model to the sample of daily values of energy exceeding a prescribed threshold (null model) and then improving the null model by using static probability and FWI anomaly as covariates of the scale parameter (daily model). In order to reduce false alarms, the computation of daily energy per pixel (which characterizes each fire event) was restricted to days where the maximum value of confidence of FRP was at least 99 %.
4.2.1 Static probability
Values of static probability were computed over the study area for 20 thresholds ranging from 100 up to 2000 GJ with steps of 100 GJ. The geographical distribution of values of probability of exceedance for the threshold of 2000 GJ and the respective distributions by type of vegetation cover/land use are shown in Figs. 7 and 8, respectively. Most spatial discontinuities in the field of P(2000|0) reflect changes in vegetation cover (Fig. 1), but there are some areas, e.g. in northern Africa, that, despite belonging to the same type of vegetation cover/land use, present changes in static probability which are associated with the spatial variability of the energy released by recorded fire events (Fig. 5).
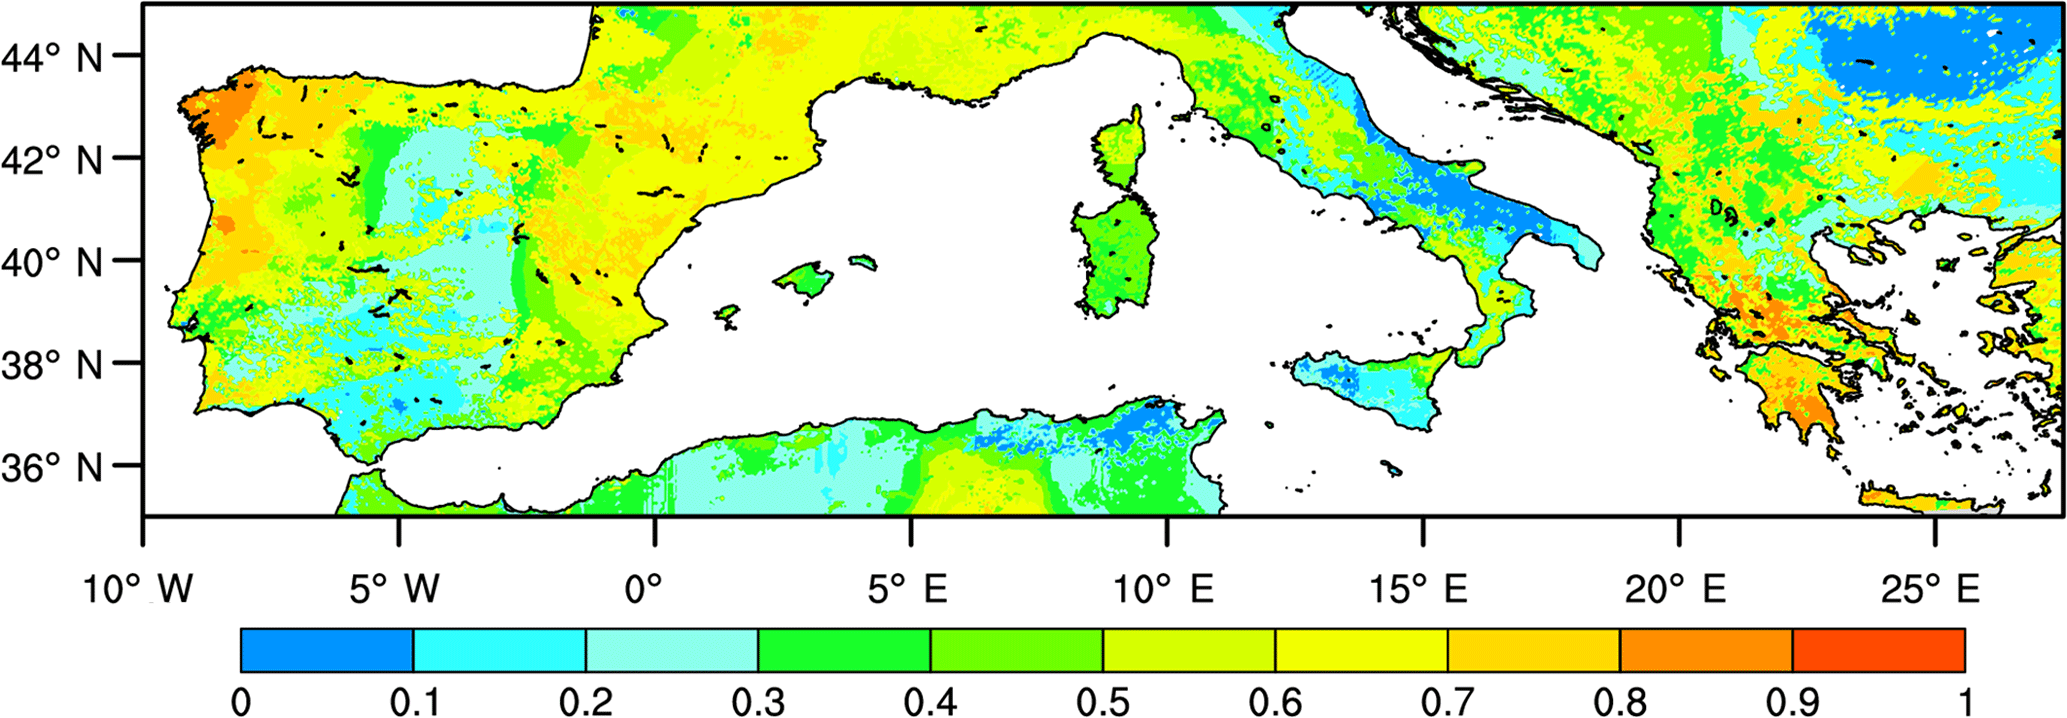
Figure 7Geographical distribution of the static probability of exceedance for the threshold of 2000 GJ.
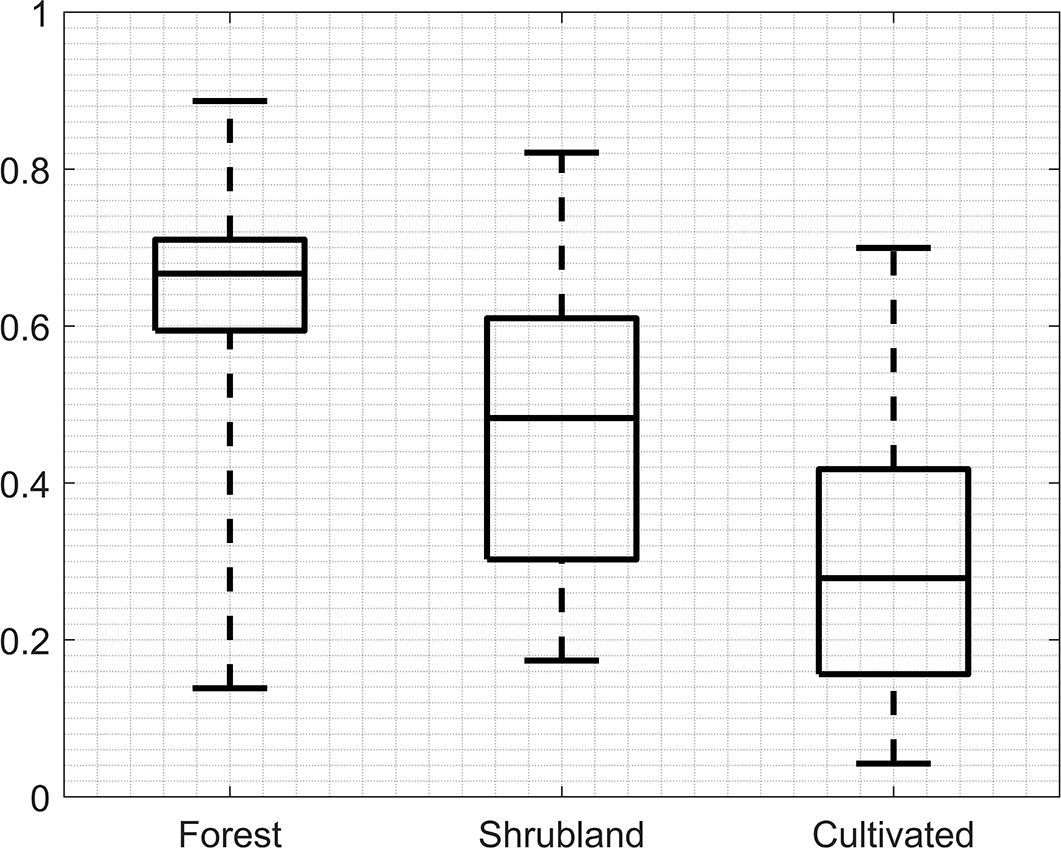
Figure 8As in Fig. 6 but for the distribution of static probability of exceedance of the threshold of 2000 GJ.
Regarding the distribution of P(2000|0) for the three considered types of vegetation cover/land use (Fig. 8), it is seen that, as expected, there is a close agreement between the distributions of static probability of exceedance and that of daily released energy per pixel (Fig. 6). Again, P(2000|0) shows a clear distinction among the three types of vegetation: forests have the highest values of the three quartiles, and cultivated areas have the lowest. As in the case of daily energy released by fires, the two-sample Kolmogorov–Smirnov test corroborates the significance of the results indicating that, for each pair of the three distributions, the null hypothesis that the distributions are identical is rejected with a p value lower than 0.0001.
4.2.2 Null model
As described in Sect. 3.4, the choice of Emin threshold to be used in the GP distributions of daily released energy per pixel was based on the visual inspection of a plot of the sample mean of the values exceeding successive thresholds as a function of the respective threshold. Tested values of thresholds ranged from 0 to 1000 GJ with steps of 100 GJ. The chosen value Emin=200 GJ is such that above that value the dependence of exceeding means on thresholds becomes linear. The size of the sample obtained using this threshold is 14 782, representing 94 % of the original sample of recorded daily values of energy per pixel. Maximum-likelihood estimates of the shape (α) and scale (σ) parameters of the GP distribution exceedances of energy (over 200 GJ) lead to the values of α=0.31 and σ=2470, with corresponding 95 % confidence intervals of [0.29,0.33] and [2403,2540], respectively. The goodness of fit was visually confirmed by plotting sample quantiles against GP quantiles (Fig. 9). For values of exceedance greater than 2×10⁴ GJ a progressive departure from the 1 : 1 line is observed in the quantile–quantile plot; however, these values represent only 1 % of the sample size and are likely due to the saturation of the SEVIRI sensor that occurs at about 1000 MW per pixel (Wooster et al., 2005).
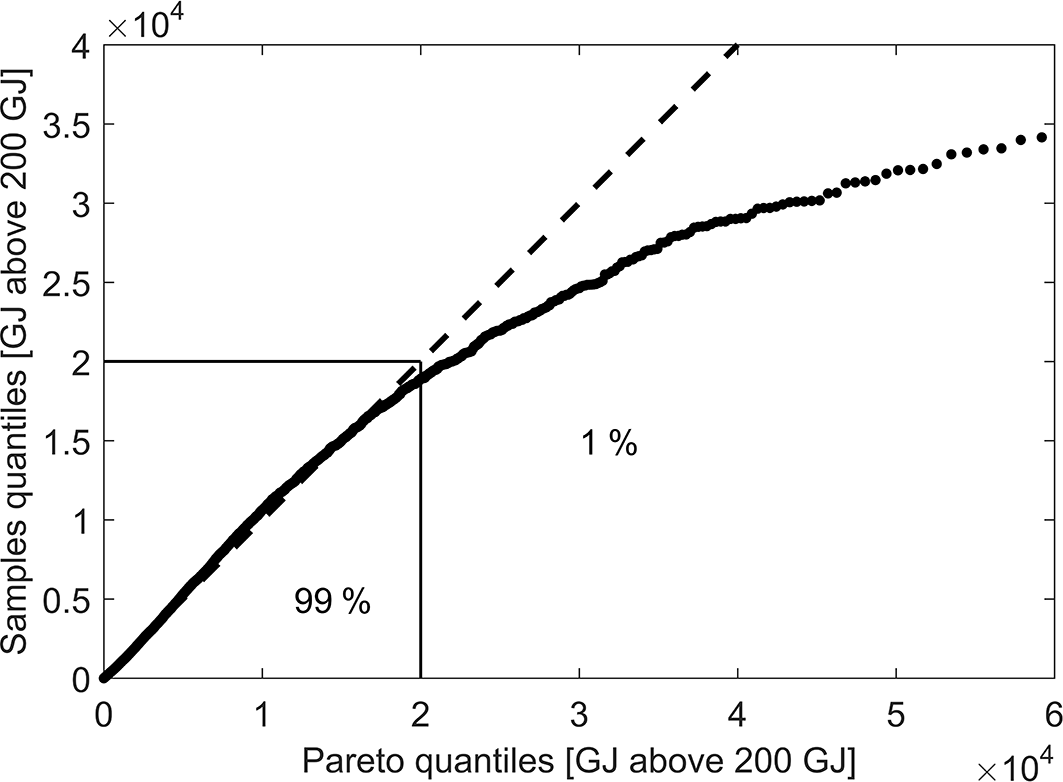
Figure 9Quantile–quantile plot for the fitted GP distribution. The dashed segment represents the 1 : 1 line. The square frame at the bottom left that delimits exceedances below 2×10⁴ GJ contains 99 % of the sample.
4.2.3 Daily model
Occurrence of large fires releasing large amounts of energy is expected to be more frequent in regions with high values of static probability. Large events are also likely to be steered by meteorological conditions favouring the ignition and propagation of fire, i.e. associated with large positive values of FWI anomalies. This is shown in Fig. 10, where the daily energy per pixel released by recorded fire events during 2004–2016 is plotted as a function of FWI* and P(2000|0). As expected, events releasing very high values of energy are mostly preferably associated with high positive values of FWI* and/or P(2000|0).
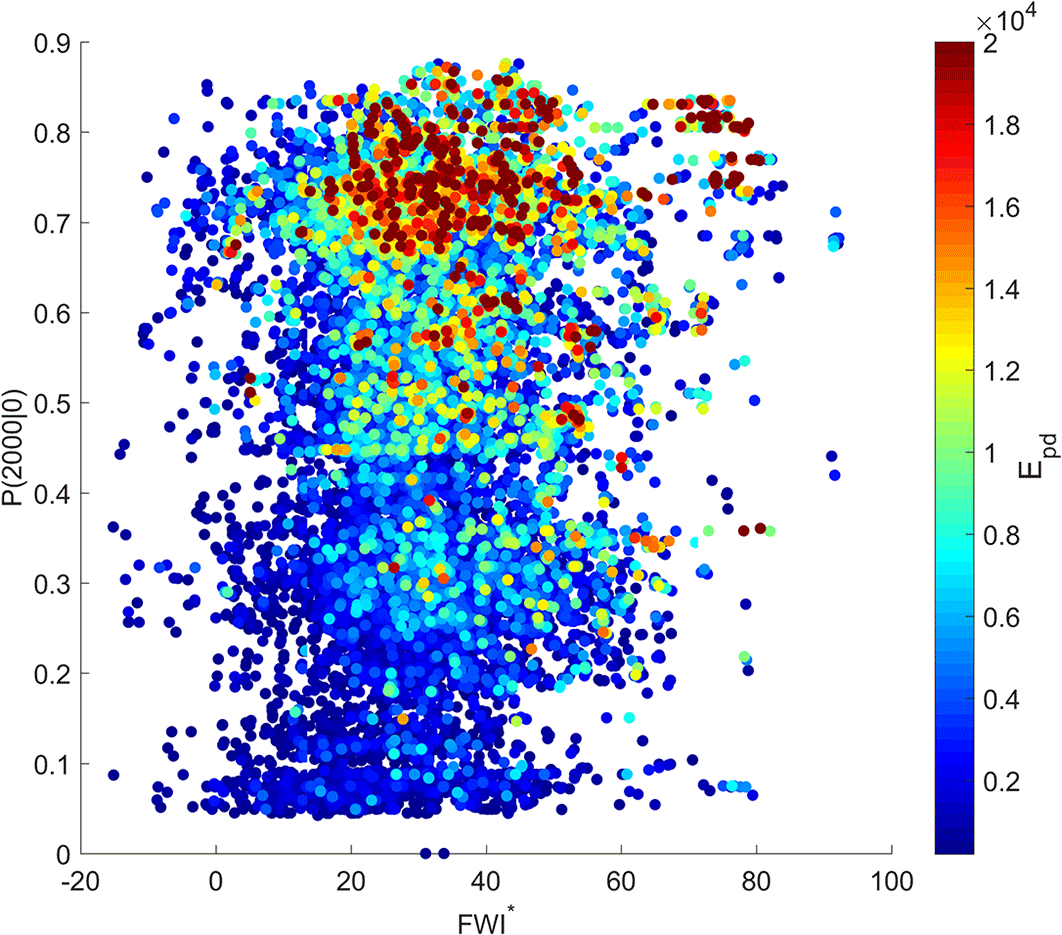
Figure 10Daily energy per pixel released by fires as a function of FWI* and P(2000|0). Circles are coloured according to the released energy (GJ).
These results suggest improving the performance of the null model by incorporating FWI* and P(2000|0) as covariates of the scale (σ) parameter of the GP distribution. Using a procedure similar to the one proposed by DaCamara et al. (2014), the dataset of energy exceedances was stratified into 51×51 cells by scrolling the domain FWI by a sliding window successively defined by values of FWI* and P(2000|0) ranging between corresponding minimum and 50th percentile, 1st and 51st percentiles, and so on up to between the 51st percentile and the maximum with steps of 1 %, leading to a total amount of 2601 cells. Each cell was characterized by the respective mean values of FWI* and P(2000|0) of its sides. GP distributions were then adjusted to each cell, and estimated values of the scale parameter (σ) were assigned to the respective cell. The two following boundary conditions were also defined in the domain, translating the fact that no fires are expected at the lower bounds of both FWI* and P(2000|0): σ≡1 along FWI −15 (the minimum value observed) and along 0.
The behaviour of σ as a function of FWI* and P(2000|0) was then modelled by means of a feedforward artificial neural network with one hidden layer with three neurons and the sigmoid function for activation (Haykin, 2009). The number of neurons was set by subdividing the data into a training set and a test set, and successfully trying different numbers of neurons so that both underfitting and overfitting of the model to the dataset would be avoided. Results are shown in Fig. 11; as expected, σ monotonically increases with covariates FWI* and P(2000|0). It may also be noted that the larger the values of the covariates, the closer σ is to a linear dependence.
A new model (daily model) was then set up by replacing the constant scale parameter of the null model by a spatially and temporally variable one, as determined by covariates FWI* and P(2000|0). The null hypothesis of similar performance of both null and daily models was rejected by the likelihood ratio test given that the obtained p value was lower than 0.0001.
Goodness of fit of the daily model was then visually assessed by comparing probabilities P(2000|200) computed with the daily model using Eq. (5) against empirical probabilities estimated from observations. For this purpose, the dataset of daily values of P(2000|200) over the study area during the calibration period was stratified into intervals of probability by means of a sliding window of probability successively ranging from 0 to 0.2, 0.05 to 0.25 and so on up to 0.8 to 1, with a range of 0.2 and increments of 0.05. At each step, fire events in pixels associated with selected probabilities were counted, namely the numbers N200 and N2000 of fires occurrences with energy release above 200 and 2000 GJ. In order to have sufficiently large samples, retained steps were restricted to those containing more than 200 fire events releasing more than 200 GJ (i.e. N200 > 200). The empirical probability of each step was accordingly computed as the ratio N2000 ∕ N200, and this value was compared to the mid-range of P(2000|200), associated with the sliding window at that step. As shown in Fig. 12, when empirical values of probability are plotted against respective mid-range values of P(2000|200), a good fit is achieved between points and the 1 : 1 line.
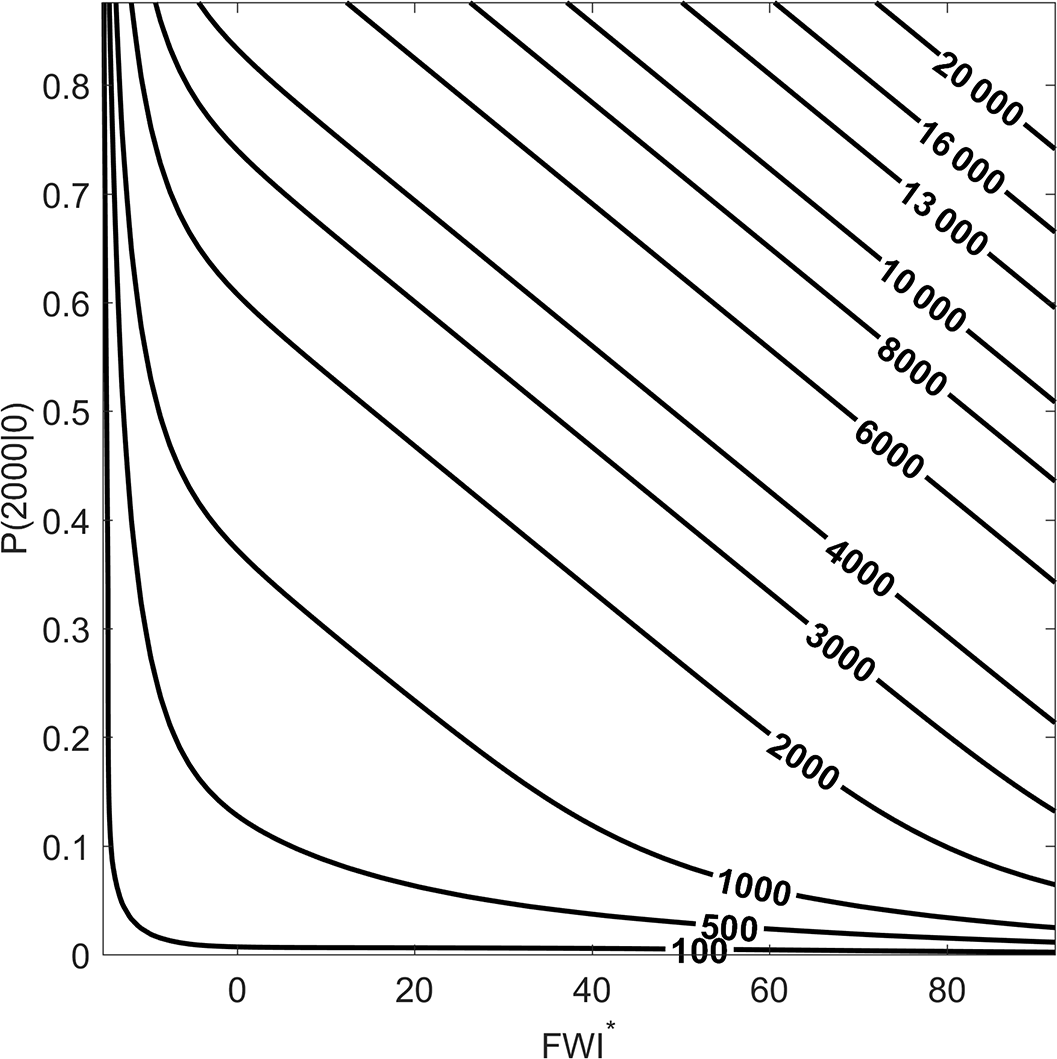
Figure 11Dependence of scale parameter σ of the GP distribution on covariates FWI* and P(2000|0) as modelled by the neural network.
4.3 Classes of fire danger and model performance
Classes of fire danger were defined following the procedure described in Sect. 3.5, i.e. by plotting, for the whole study area during the calibration period, each value of daily energy Epd released on day d at pixel p (Fig. 13). As expected, there is an increase in occurrence of higher values of released energy with increasing probability of exceedance G and anomaly A. The horizontal line γ0 separates the “low” class from the remaining ones. This class contains 1269 events that represent only 8 % of the total amount of 15 752 events. The remaining classes are delimited by curves, (γ1, γ2, γ3) defined by break points . As prescribed in the procedure, break points are equally spaced by steps of 0.103, and the “very high” and “extreme” classes contain about the same number of events, i.e. 5408 and 5443, representing 34 and 35 % of the total amount, respectively.
A better insight into the characteristics of the daily model's five classes of danger may be obtained by stratifying the occurrences into three ranges of energy released by the fire events, namely below 2000 GJ, between 2000 and 10 000 GJ, and above 10 000 GJ. As shown in Table 1 (“daily model” subtable), within the cases of the lowest range (< 2000 GJ), 59 % are distributed between the “high” (26 %) and “very high” (33 %) classes, while the intermediate range (2000–10 000 GJ) presents a steep increase in frequency from “low” to “extreme”. An even steeper increase is observed for the upper range (> 10 000 GJ), for which the “low” and “moderate” classes contain 1 % of the cases and the “extreme” one concentrates 72 % of the events in that layer.
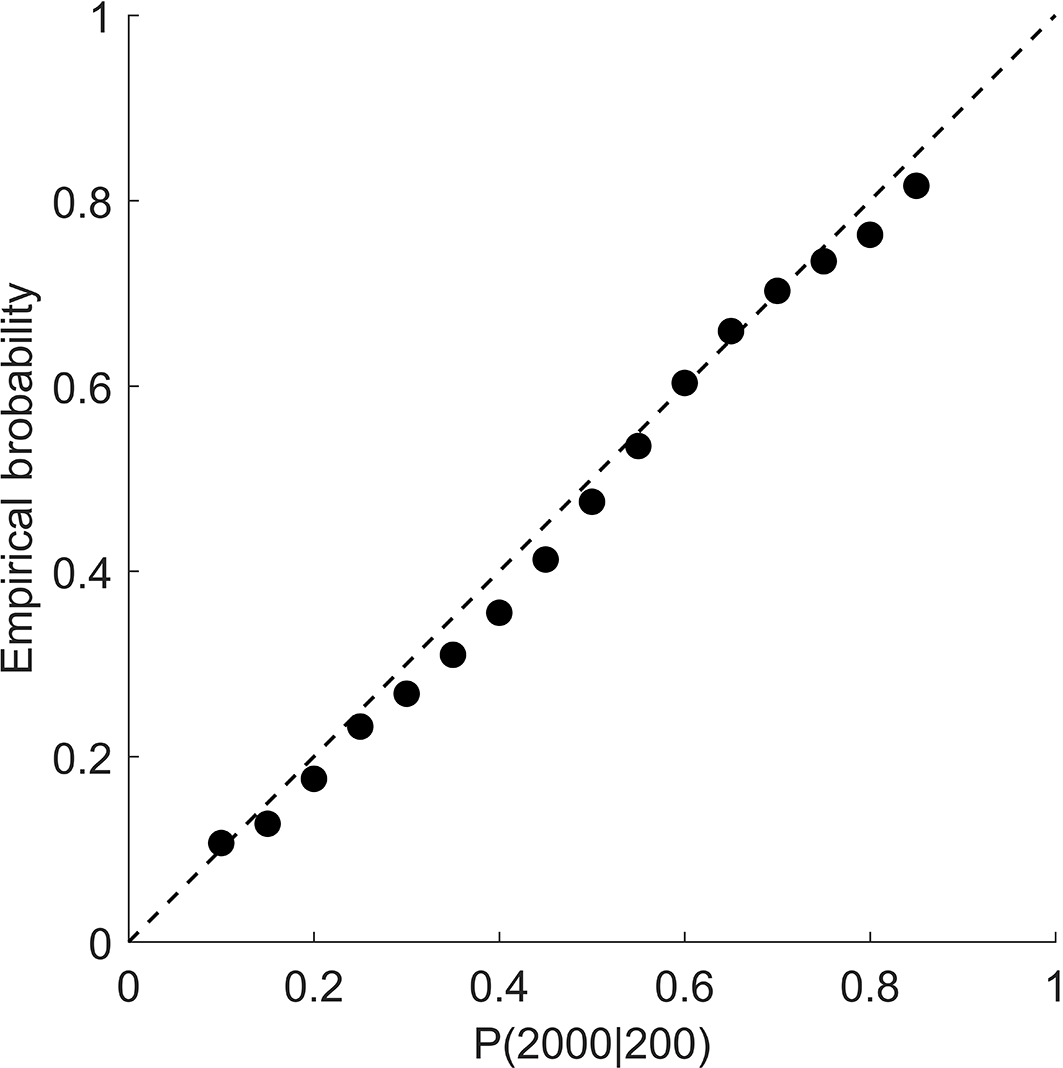
Figure 12Empirical values of probability computed from observations of fire events as a function of P(2000|200) derived from the daily model during the calibration period (2004–2016).
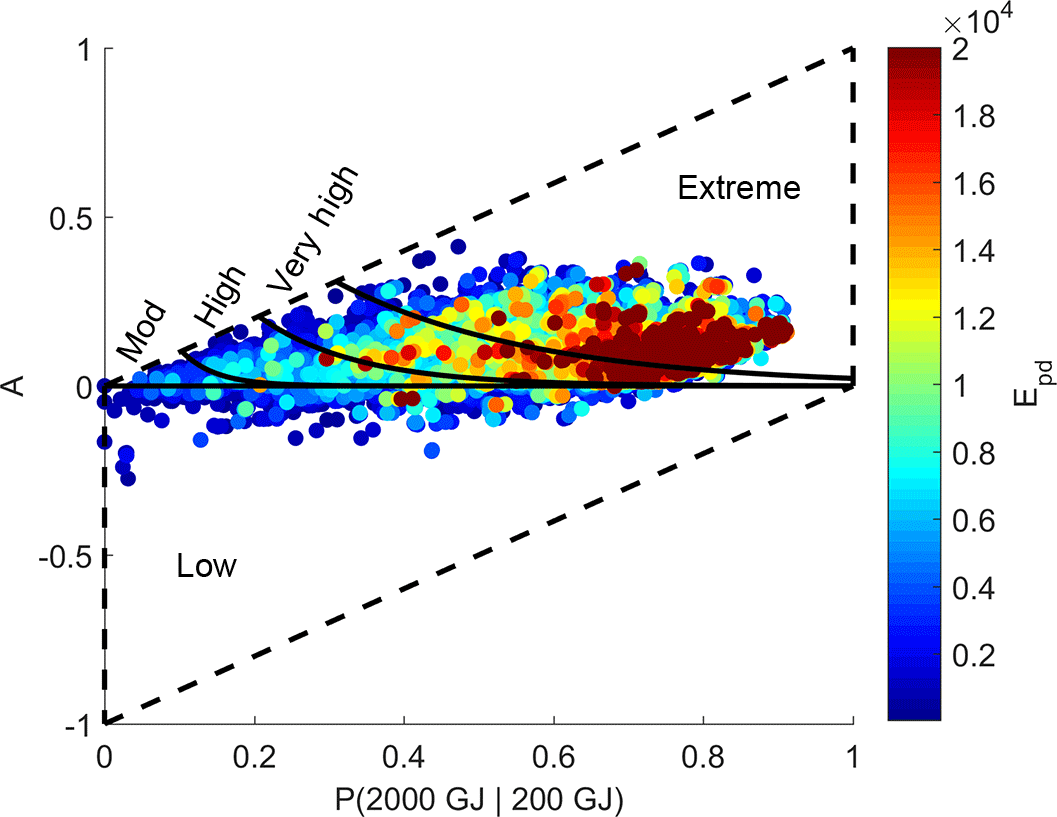
Figure 13As in Fig. 3 but with respect to results for the calibration period (2004–2016) based on values of P(2000|200) and respective anomalies A. Fire events during the period are superimposed, being represented by circles coloured according to the daily released energy (GJ).
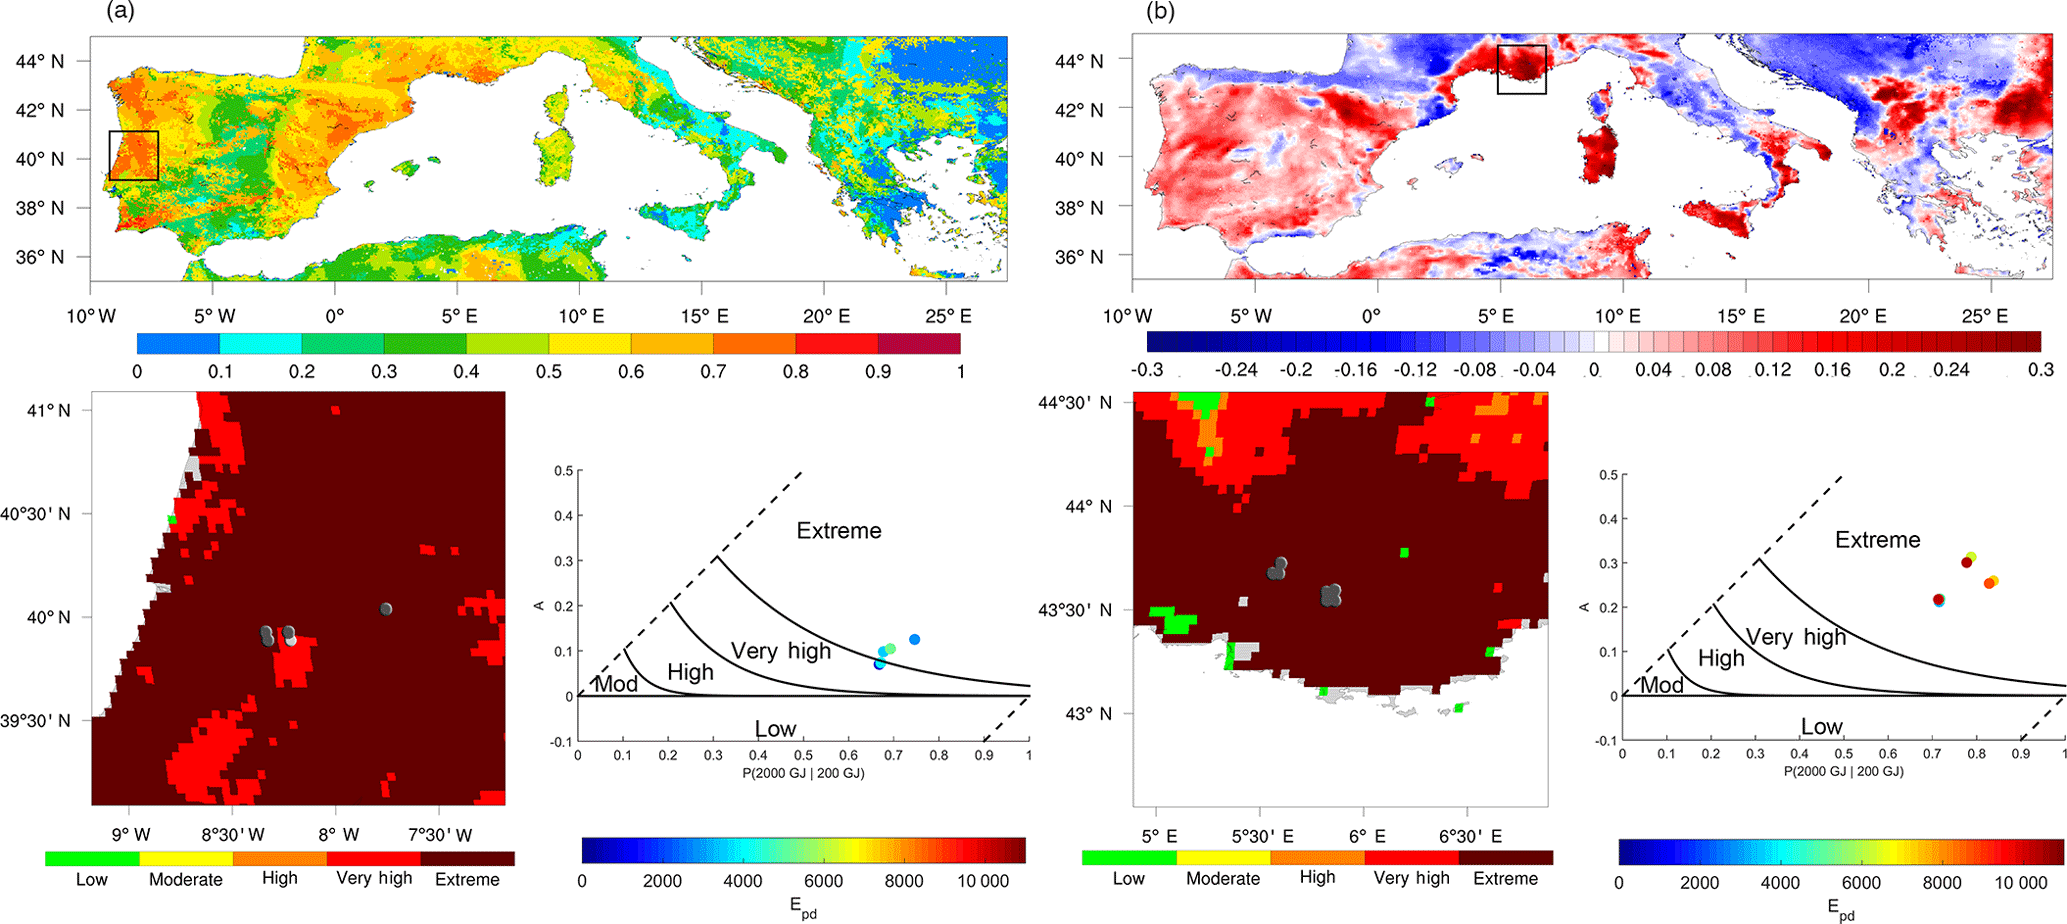
Figure 14Results obtained for the 2017 fire events at Pedrógão Grande-Góis (Portugal) on 18 June (a) and near Marseille (France) on 25 July (b). The geographical distributions over the Mediterranean basin of P(2000|200) for Pedrógão Grande-Góis and of anomaly A for Provence are shown in the upper frames of the respective panels, and the areas of interest are represented by the two corresponding black boxes. Classes of fire danger for the areas of interest are shown in the colour bar of the lower left frames, together with the observed active-fire events (dark grey circles). Locations of fire events (coloured circles) in the space of P(2000|200) versus anomaly A are shown in the lower right frames, the colours indicating the amount of the daily released energy Epd (in GJ).
Table 1Distributions during the calibration period (2004–2016) of fire events among classes of fire danger for three ranges of daily energy released by fires when classes are obtained from the daily model, the LSA SAF product and the EFFIS module. Each cell contains the number of observed events and [in brackets] the corresponding fraction (%) of the total number of events belonging to the same energy layer.
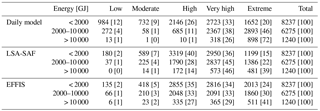
As mentioned in Sect. 3.6, the performance of the daily model is assessed by comparing the distributions of events among the classes of fire danger for the three ranges of energy with those obtained when using the LSA SAF and the EFFIS products (Table 1, “LSA SAF” and “EFFIS” subtables). Differences are particularly notable in the upper energy range (> 10 000 GJ), especially for EFFIS classes where events spread in all classes and the “very high” and “extreme” classes only contain 70 % of the cases, whereas for the daily model and the LSA SAF they contain 98 and 85 %, respectively. However, in the case of LSA SAF classes, the modal class is the “very high” and not the “extreme” as in the daily model. Similar differences, although less prominent, may be observed among the three products in the intermediate energy range (2000–10 000 GJ). The modal classes are the “extreme” for the daily model and the “very high” for the LSA SAF and EFFIS, with the modal frequency being the highest (46 %) for the daily model, followed by the LSA SAF (45 %) and EFFIS, where the frequency (33 %) is quite low and equal to that of the next class below. Finally, the lower energy range (< 2000 GJ) also presents differences among the three products, namely in the frequency of events in the “low” and “moderate” classes, which represent 21 % of the events in the daily model and only 9 and 7 % for the LSA SAF and EFFIS, respectively. The different features of the classes from the three products ultimately translate into different values of probability of a fire event releasing a given amount of energy in the case of a given class danger. For instance, using results presented in Table 1, the conditional probability of having a large release of energy (> 10 000 GJ) given “extreme” danger is 16.5 % and 15.7 % for the daily model and the LSA SAF, respectively, and is only 11.7 % for EFFIS. Similar features are presented by the conditional probability of having a small release of energy (< 2000 GJ) given “low” danger, with values of 77.5 % and 82.9 % for the daily model and the LSA SAF, respectively, and only of 65.2 % for EFFIS.
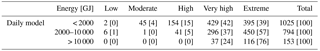
Table 2As in Table 1 but for distributions obtained in the validation period (January–September 2017) of fire events among classes of fire danger as obtained from the daily model.
Differences obtained among the three products point out the better performance of the daily model if the aim is to have information about the probability of occurrence of an event releasing a large amount of energy. This result is not surprising since the daily model was specifically designed for such purpose. Estimates of probability by the LSA SAF product are closer to those by the daily model than the ones by EFFIS because the LSA SAF relies on duration of active fires inside each pixel and day, which is a better proxy of energy released by fires than records of fire events with more than 500 ha of burned area. We nevertheless acknowledge that it is not a straightforward exercise to translate the six danger classes defined by EFFIS into a five-class scheme such as those of the LSA SAF and daily model approaches.
4.4 Model validation
As described in Sect. 3.6, model validation involves applying the daily model to the validation period (January–September 2017) and analysing results obtained for the two severe events of Pedrógão Grande-Góis (Portugal) and Provence (France). It is important to note that, contrasting to the calibration period where meteorological data were obtained from ERA-Interim reanalysis, ECMWF's operational 24 h forecasts are used during the validation period. The overall coherence of reanalysis data makes them especially appropriate to calibrate the daily model, but forecast information has to be used for operational application. Results obtained in the validation period therefore reflect the effects of applying the procedure to an independent dataset as well as those due to using forecast information instead of reanalyses.
As shown in Table 2, during the validation period, the obtained distributions of events among classes of fire danger are similar to those obtained in the calibration (Table 1, “daily model” subtable). The distribution of events for the lowest range (< 2000 GJ) is shifted toward the more severe classes of fire danger, with the modal class being the “very high” one, with 42 % of the events, and the “extreme” class containing 39 % of the cases. The intermediate range (2000–10 000 GJ) is slightly shifted towards the more severe classes of fire danger, with the modal class being “extreme”, with 57 % of the events, and the “very high” class containing 37 % of the cases, a figure very close to the one obtained in the calibration period (38 %); likewise, as gotten in calibration, the highest jump in relative frequency is from the “high” to the “very high” class (5 to 37 %). In the highest range (> 10 000 GJ) no cases are observed in the “low” and “moderate” classes; as found in calibration, the modal class is “extreme”, containing 76 % of the events (72 % in calibration), with the remaining 24 % (26 % in calibration) belonging to the “very high” class.
The percentage of fires for the “very high” and “extreme” classes is shifted toward the more severe classes (38.6 and 48.7 %), a feature that may be attributed to the fact that up to September, according to information at the EFFIS site, the accumulated burned area in 2017 is more than 600 000 ha, more than 2.5 times the 2008–2016 average of about 224 000 ha. This may also explain the virtual absence of episodes in the “Low” class (8 of 1972 total events).
Results obtained for the two 2017 case studies of Pedrógão Grande-Góis (Portugal) and Marseille (France) are summarized in Fig. 14. The figure is subdivided into two main vertical panels, the left one corresponding to Pedrógão Grande-Góis and the right one to Marseille. For each event a map covering the study area is presented on the top, showing the geographical distribution of values of P(2000|200) for Pedrógão-Góis and of anomaly values of P(2000|200) for Marseille. At the bottom of each panel, on the left hand side, there is a map showing the geographical distribution of classes of danger and the location of active fires detected over the region affected by the fire event; finally, on the right hand side, there is a diagram presenting the distribution of active fires detected in the domain G of P(2000|200) versus respective anomalies A. In the case of Pedrógão Grande-Góis, it is worth noting that on 18 June 2017 the area surrounding the fire events is covered by a patch of values of P(2000|200) exceeding 0.7 (top frame) over a background of lower values covering most of the Mediterranean basin. Pixels inside the area of interest (black boxes) are mostly classified as “extreme” danger of fire (lower left frame), and active fires detected (reaching up to 5000 GJ of released energy) are within or very close to the border of the partition classified as “extreme” fire danger in the domain of P(2000|200) versus anomaly A (lower right frame). The fire episodes near Marseille (Fig. 14, right panel) took place within an area conspicuously characterized by values of anomalies A as high as 0.3, which are higher than the surrounding values and much higher that the values observed in the majority of pixels over the Mediterranean basin. As in the case of Pedrógão Grande-Góis, the fire events near Marseille (reaching up to 10 000 GJ of released energy) are located within an area classified as being of “extreme” danger of fire or near the border between the “extreme” and “very high” classes (lower left frame). There is however a difference between the two events that is worth mentioning. In the case of Pedrógão Grande-Góis, pixels where active fires were observed are classified as or near “extreme” fire danger because of the high values of P(2000|200), whereas in the case of Marseille that is mostly because of the high values of anomaly A. These two examples justify the adopted rationale of defining the classes of fire danger in the space P(2000|200) versus anomalies A.
The Mediterranean is one of the regions of the world most affected by large wildfires, and fire prevention is therefore of crucial importance. Fire management requires adequate knowledge about wildfire potential assessment that is usually based on fire danger rating systems providing indices to be used on an operational and tactical basis in decision support systems.
The aim of the present work is to lay the groundwork for the development of an operational product that will be able to provide the user community with daily information on meteorological danger that will allow adopting adequate measures to mitigate fire damage. The proposed product consists of forecasts of fire danger over Mediterranean Europe based on a statistical procedure that combines information about fire history derived from the FRP product of LSA SAF with daily meteorological forecasts provided by ECMWF.
The procedure involves estimating static and daily probabilities of exceedance of daily energy released by fires occurring at the pixel level. Static probability at a given pixel is estimated by the ratio of the number of daily fire occurrences releasing energy above a given threshold to the total number of occurrences inside a cell centred at the point. Daily probability takes into account meteorological factors by means of the Canadian FWI and is estimated using a daily model based on a generalized Pareto distribution with static probability and FWI as covariates of the scale parameter. Five classes of fire danger are then associated with daily probability estimated by the daily model.
During the calibration period (2004–2016), it is shown that about 72 % of events releasing daily energy above 10 000 GJ belong to the “extreme” class of fire danger from the daily model, a figure that is more than 1.5 times the values obtained when using EFFIS (41 %) or the LSA SAF (39 %). It is also shown that the “Low” class from the daily model contains 12 % of events with released daily energy lower than 2000 GJ, whereas this percentage is only 2 % when classes from LSA SAF or EFFIS are used. Classes of fire danger from the daily model are therefore more suitable to discriminate fire events in terms of released energy. When the daily model is applied to the independent dataset of January–September 2017, results are consistent with those obtained in calibration.
The product derived from the proposed daily model mainly differs from LSA SAF and EFFIS products in that the indices of meteorological fire danger are calibrated based on 13 years of information about fire radiative power, with a temporal resolution of 15 min as derived from the SEVIRI instrument on board MSG satellites. Besides providing a solid physical meaning to the approach since energy is a measurable physical property, fire radiative power is also directly related to the amount of fuel burned and smoke production (e.g. Wooster et al., 2005). Fire radiative power is also useful in fire management and firefighting because it can be used as a proxy of fire line intensity (Smith and Wooster, 2005; Johnston et al., 2017).
It is worth noting that the proposed approach is based on FWI, which is defined at the daily level. Classes of fire danger are accordingly computed on a daily basis, and the same happens in the cases of the LSA SAF and the EFFIS products that also depend on FWI. The daily scale of the classes of fire danger may sometimes constitute a shortcoming, namely because local atmospheric conditions of short time duration cannot be captured by FWI. This was indeed the case on the first day of the large 2017 fire event at Pedrógão Grande-Góis, when the unstable atmospheric conditions favoured the formation of thunderstorms and gust fronts that jointly allowed pyrocumulonimbus development and played a crucial role in the extremely fast initial spread of the fire, causing a large number of fatalities. Inaccuracies in the forecasts of precipitation at the local level may constitute another shortcoming given that they may lead to incorrectly low values of FWI. These two limitations may be circumvented, at least partially, by means of intraday high-resolution fire weather forecasts combined with the use of ensemble forecasts that will allow for a better assessment of the uncertainties of fire danger predictions. Both aspects are currently being studied, and results are expected to bring developments of the current method to be operationally implemented in the future.
A prototype of the proposed procedure has been running since April 2017 at Instituto Dom Luiz, Faculty of Sciences, University of Lisbon (http://idlcc.fc.ul.pt/CeaseFire/). Besides assisting in wildfire management, information provided about the statistical distributions of exceedances in fire radiative power, as well as of meteorological parameters and derived indices of fire danger, is expected to represent an added value in decision making on prescribed burning within the framework of agricultural and forest management practices, a very delicate activity since wrong or uninformed decisions may trigger severe events associated with substantial damage.
All data used in this study were obtained from products LSA SAF Fire Radiative Power (LSA-502) and LSA SAF Fire Risk Map (LSA-504), produced and disseminated by EUMETSAT Satellite Application Facility on Land Surface Analysis (LSA SAF). The products are available at http://lsa-saf.eumetsat.int; in accordance with EUMETSAT data policy, the LSA SAF data are granted to every interested user free of charge.
The authors declare that they have no conflict of interest.
This article is part of the special issue “Spatial and temporal patterns of wildfires: models, theory, and reality”. It is a result of the conference EGU 2017, Vienna, Austria, 23–28 April 2017.
This work was developed within the framework of the EUMETSAT Satellite
Application Facility for Land Surface Analysis (LSA SAF) and of FAPESP/FCT
project Brazilian Fire-Land-Atmosphere System (BrFLAS) under grants
FAPESP/1389/2014 and FCT 2015/01389-4. The work of Miguel M. Pinto was
supported by FCT under a grant from BrFLAS. The CeaseFire site is sponsored
by The Navigator Company.
Edited by: Nikos
Koutsias
Reviewed by: Paulo Fernandes and one anonymous
referee
Amraoui, M., Liberato M. L. R., Calado, T. J., DaCamara, C. C., Pinto-Coelho, L., Trigo, R. M., and Gouveia, C. M.: Fire activity over Mediterranean Europe based on information from Meteosat-8, Forest Ecol. Manag., 294, 62–75, https://doi.org/10.1016/j.foreco.2012.08.032, 2013.
Amraoui, M., Pereira, M. G., DaCamara, C. C., and Calado, T. J.: Atmospheric conditions associated with extreme fire activity in the Western Mediterranean region, Sci. Total Environ., 524–525, 32–39, https://doi.org/10.1016/j.scitotenv.2015.04.032, 2015.
Anderson, K. and P. Englefield.: Quantile characteristics of forest fires in Saskatchewan, Proceedings of the 4th Symposium on Fire and Forest Meteorology, Reno, Nevada, USA, 13–15 November 2001.
Andrews, P. L., Loftsgaarden, D. O., and Bradshaw, L. S.: Evaluation of fire danger indexes using logistic regression and percentile analysis, Int. J. Wildland Fire, 12, 213–226, https://doi.org/10.1071/WF02059, 2003.
Arino, O. and Melinotte, J. M.: Fire Index Atlas, Earth Observation Quarterly, 50, 11–16, 1995.
Coles, S.: An Introduction to Statistical Modeling of Extreme Values, 208 pp., Springer, London, 2001.
DaCamara, C. C., Calado, T. J., Ermida, S. L., Trigo, I. F., Amraoui, M., and Turkman, K. F.: Calibration of the Fire Weather Index over Mediterranean Europe based on fire activity retrieved from MSG satellite imagery, Int. J. Wildland Fire, 23, 945–958, https://doi.org/10.1071/WF13157, 2014.
Dee, D. P., Uppala, S. M., Simmons, A. J., Berrisford, P., Poli, P., Kobayashi, S., Andrae, U., Balmaseda, M. A., Balsamo, G., Bauer, P., Bechtold, P., Beljaars, A. C. M., van de Berg, L., Bidlot, J., Bormann, N., Delson, C., Dragani, R., Fuentes, M., Geer, A. J., Haimberger, L., Healy, S. B., Hersbach, H., Hólm, E. V., Isaksen, L., Kallberg, P., Köhler, M., Matricardi, M., McNally, A. P., Monge-Sanz, B. M., Morcrette, J.-J., Park, B.-K., Peubey, C., de Rosnay, P., Tavolato, C., Thépaut, J.-N., and Vitart, F.: The ERA-Interim reanalysis: Configuration and performance of the data assimilation system, Q. J. Roy. Meteor. Soc., 137, 553–597, https://doi.org/10.1002/qj.828, 2011.
Deeming, J. E., Burgan, R. E., and Cohen, J. D.: The National Fire-Danger Rating System – 1978. USDA Forest Service Gen. Technical Report INT-39, Ogden, Utah, USA, 1977.
de Zea Bermudez, P., and Kotz, S.: Parameter estimation of the generalized Pareto distribution – Part II, J. Stat. Plan. Infer., 140, 1374–1388, https://doi.org/10.1016/j.jspi.2008.11.020, 2010.
Dymond, C. C., Field, R. D., Roswintiarti, O., and Guswanto: Using satellite fire detection to calibrate components of the Fire Weather Index System in Malaysia and Indonesia, Environ. Manage., 35, 426–440, https://doi.org/10.1007/s00267-003-0241-9, 2005.
EUMETSAT: LRIT/HRIT Global Specification, EUMETSAT, Coordination group for meteorological satellites, CGMS03, Darmstadt, Germany, 1999.
Fernandes, P. M.: Fire-smart management of forest landscapes in the Mediterranean basin under global change, Landscape Urban Plan., 110, 175–182, https://doi.org/10.1016/J.LANDURBPLAN.2012.10.014, 2013.
Finney, M. A.: The challenge of quantitative risk analysis for wildland fire, Forest Ecol. Manag., 211, 97–108, https://doi.org/10.1016/j.foreco.2005.02.010, 2005.
Giglio, L., Descloitres, J., Justice, C. O., and Kaufman, Y.: An enhanced contextual fire detection algorithm for MODIS, Remote Sens. Environ., 87, 273–282, https://doi.org/10.1016/S0034-4257(03)00184-6, 2003.
Grimshaw, S. D.: Computing Maximum Likelihood Estimates for the Generalized Pareto Distribution, Technometrics, 35, 185–191, https://doi.org/10.2307/1269663, 1993.
Hagan, M. T. and Menhaj, M.: Training feed-forward networks with the Marquardt algorithm, IEEE T. Neural Networ., 5, 989–993, 1994.
Haiden, T., Janousek, M., Bidlot, J., Ferranti, L., Prates, F., Vitart, F., Bauer, P., and Richardson D. S.: Evaluation of ECMWF forecasts, including the 2016 resolution upgrade, Technical Memorandum 792, European Centre for Medium-Range Weather Forecasts, Reading, Berkshire, 55 pp., 2016.
Hartley, A., Pekel, J.-F., Ledwith, M., Champeaux, J.-L., De Badts, E., and Bartalev, S. A.: The Land Cover Map for Europe in the Year 2000, GLC2000 database, European Commission Joint Research Centre, 2006.
Haykin, S.: Neural Networks and Learning Machines, 3rd Edn., Pearson, Ontario, Canada, 2009.
Johnston, J. M., Wooster, M. J., Paugam, R., Wang, X., Lynham, T. J., and Johnston, L. M.: Direct estimation of Byram's fire intensity from infrared remote sensing imagery, Int. J. Wildland Fire, 26, 668–684, https://doi.org/10.1071/WF16178, 2017.
Kiil, A. D., Miyagawa, R. S., and Quintilio, D.: Calibration and performance of the Canadian Fire Weather Index in Alberta, Information Report NOR-X-I73, Canadian Forest Service, Northern Forestry Centre, Edmonton, Alberta, Canada, 45 pp., 1977.
Lawrence, M. G.: The Relationship between Relative Humidity and the Dewpoint Temperature in Moist Air, A simple Conversion and Applications, B. Am. Meteorol. Soc., 86, 225–233, https://doi.org/10.1175/BAMS-86-2-225, 2005.
LSA SAF: Fire Radiative Power, Validation Report, LSA SAF, Lisbon, Portugal, 2015.
Massey, F. J.: The Kolmogorov-Smirnov Test for Goodness of Fit, J. Am. Stat. Assoc., 46, 68–78, 1951.
McArthur, A. G.: Fire Behaviour in Eucalypt Forests. Commonwealth Australia Forest and Timber Bureau Leaflet Number 107, Canberra, Australian Capital Territory, 1967.
Merrill, D. F. and Alexander, M. E.: Glossary of fire management terms, Fourth Edition, Publication No. 26516, Canadian Committee on Forest Fire Management, National Research Council, Ottawa, Ontario, Canada, 91 pp., 1987.
Moreira, F., Viedma, O., Arianoutsou, M., Curt, T., Koutsias, N., Rigolot, E., Barbati, A., Corona, P., Vaz, P., Xanthopoulos, G., Mouillot, F., and Bilgili, E.: Landscape–wildfire interactions in Southern Europe: implications for landscape management, J. Environ. Manage., 92, 2389–2402, https://doi.org/10.1016/J.JENVMAN.2011.06.028, 2011.
Nesterov, V.: Combustibility of the Forest and Methods for its Determination, USSR State Industry Press, Moscow, USSR, 1949.
Neyman, J. and Pearson, E. S.: On the Problem of the Most Efficient Tests of Statistical Hypotheses, Philos. T. R. S.-A, 231, 289–337, https://doi.org/10.1098/rsta.1933.0009, 1933.
Pereira, M. G., Malamud, B. D., Trigo, R. M., and Alves, P. I.: The history and characteristics of the 1980–2005 Portuguese rural fire database, Nat. Hazards Earth Syst. Sci., 11, 3343–3358, https://doi.org/10.5194/nhess-11-3343-2011, 2011.
Pereira, M. G., Calado, T. J., DaCamara, C. C., and Calheiros, T.: Effects of regional climate change on rural fires in Portugal, Climate Res., 57, 187–200, https://doi.org/10.3354/cr01176, 20, 2013.
Pickands, J.: Statistical inference using extreme order statistics, Ann. Stat., 3, 119–131, https://doi.org/10.1214/aos/1176343003, 1975.
Pyne, S. J.: Eternal Flame: An Introduction to the Fire History of the Mediterranean, in: Earth Observations of Wildland Fires in Mediterranean Ecosystems, eidted by: Chuvieco, E., Springer-Verlag, Berlin, Heidelberg, Germany, 11–26, https://doi.org/10.1007/978-3-642-01754-4, 2009.
Requardt, A., Schuck, A., and Köhl, M.: Means of combating forest dieback – EU support for maintaining forest health and vitality, iForest, 2, 38–42, https://doi.org/10.3832/ifor0480-002, 2009.
Roberts, G. J. and Wooster, M. J.: Fire Detection and Fire Characterization Over Africa Using Meteosat SEVIRI, IEEE T. Geosci. Remote, 46, 1200–1218, https://doi.org/10.1109/TGRS.2008.915751, 2008.
Ruffault, J., Moron, V., Trigo, R. M., and Curt, T.: Daily synoptic conditions associated with large fire occurrence in Mediterranean France: evidence for a wind-driven fire regime, Int. J. Climatol., 37, 524–533, https://doi.org/10.1002/joc.4680, 2016.
San-Miguel-Ayanz, J., Schulte, E., Schmuck, G., Camia, A., Strobl, P., Liberta, G., Giovando, C., Boca, R., Sedano, F., Kempeneers, P., McInerney, D., Withmore, C., Oliveira, S. S., Rodrigues, M., Durrant, T., Corti, P., Oehler, F., Vilar, L., and Amatulli, G.: Comprehensive Monitoring of Wildfires in Europe: The European Forest Fire Information System (EFFIS), Approaches to Managing Disaster – Assessing Hazards, Emergencies and Disaster Impacts, edited by: Tiefenbacher, J., InTech, Rijeka, Croatia, 87–108, 2012.
San-Miguel-Ayanz, J., Durrant, T., Boca, R., Libertà, G., Boccacci, F., Di Leo, M., López Pérez, J., and Schulte, E.: Forest Fires in Europe, Middle East and North Africa 2015, EUR 28158 EN, 122 pp., https://doi.org/10.2788/914, 2016.
Smith, A. M. S. and Wooster, M. J.: Remote classification of head and backfire types from MODIS fire radiative power and smoke plume observations, Int. J. Wildland Fire, 14, 249–254, https://doi.org/10.1071/WF05012, 2005.
Stocks, B. J., Lawson, B. D., Alexander, M. E., Van Wagner, C. E., McAlpine, R. S., Lynham, T. J., and Dube, D. E.: The Canadian Forest Fire Danger Rating System: An Overview, For. Chron., 65, 450–457, https://doi.org/10.5558/tfc65450-6, 1989.
Trigo, I. F., DaCamara, C. C., Viterbo, P., Roujean, J-L., Olesen, F., Barroso, C., Camacho-de-Coca, F., Carrer, D., Freitas, S. C., García-Haro, J., Geiger, B., Gellens-Meulenberghs, F., Ghilain, N., Meliá, J., Pessanha, L., Siljamo, N., and Arboleda, A.: The satellite application facility for land surface analysis, Int. J. Remote Sens., 32, 2725–2744, https://doi.org/10.1080/01431161003743199, 2011.
Van Wagner, C. E.: Structure of the Canadian Forest Fire Weather Index, Can. Forestry Serv., Publication 1333, Ottawa, Ontario, http://www.cfs.nrcan.gc.ca/bookstore_pdfs/24864.pdf (last access: 15 February 2018), 49 pp., 1974.
Van Wagner, C. E.: Development and structure of the Canadian Forest Fire Weather Index System, Can. Forestry Serv., Technical Report 35, Ottawa, Ontario, 48 pp., 1987.
Viegas, D. X., Bovio, G., Ferreira, A., Nosenzo, A., and Sol, B.: Comparative study of various methods of fire danger evaluation in southern Europe, Int. J. Wildland Fire, 9, 235–246, https://doi.org/10.1071/WF00015, 1999.
Wang, Y., Anderson, K. R., and Suddaby, R. M.: Updated source code for calculating fire danger indices in the Canadian Forest Fire Weather Index System, Information Report NOR-X-424, Canadian Forest Service, Northern Forestry Centre, Edmonton, Alberta, Canada, 36 pp., 2015.
Wooster, M. J., Roberts, G., Perry, G. L. W., and Kaufman Y. J.: Retrieval of biomass combustion rates and totals from fire radiative power observations: FRP derivation and calibration relationships between biomass consumption and fire radiative energy release, J. Geophys. Res.-Atmos., 110, D24311, https://doi.org/10.1029/2005JD006318, 2005.
Wooster, M. J., Roberts, G., Freeborn, P. H., Xu, W., Govaerts, Y., Beeby, R., He, J., Lattanzio, A., Fisher, D., and Mullen, R.: LSA SAF Meteosat FRP products – Part 1: Algorithms, product contents, and analysis, Atmos. Chem. Phys., 15, 13217–13239, https://doi.org/10.5194/acp-15-13217-2015, 2015.
extremeclass of fire danger. The procedure is expected to assist in wildfire management and in decision making on prescribed burning.